Risk Scenario Generation Based on Importance Measure Analysis


School of Reliability & Systems Engineering, Beihang University, Beijing 100191, China
*
Author to whom correspondence should be addressed.
Sustainability 2018, 10(9), 3207; https://doi.org/10.3390/su10093207
Submission received: 23 June 2018
/
Revised: 3 September 2018
/
Accepted: 5 September 2018
/
Published: 7 September 2018
(This article belongs to the Special Issue Expert Systems: Applications of Business Intelligence in Big Data Environments)
Abstract
:A risk scenario is a combination of risk events that may result in system failure. Risk scenario analysis is an important part of system risk assessment and avoidance. In engineering activity-based systems, important risk scenarios are related to important events. Critical activities, meanwhile, mean risk events that may result in system failure. This article proposes these definitions of risk event and risk scenario based on the characteristics of risk in engineering activity-based systems. Under the proposed definitions, a risk scenario framework generated based on importance measure analysis is given, in which critical activities analysis, risk event identification, and risk scenario generation are the three main parts. Important risk events are identified according to activities’ uncertain importance measure and important risk scenarios are generated on the basis of a system’s critical activities analysis. In the risk scenario generation process based on importance analysis, the importance degrees of network activities are ranked to identify the subject of risk events, so that risk scenarios can be combined and generated by risk events and the importance of scenarios is analyzed. Critical activities are analyzed by Taguchi tolerance design, mathematical analysis, and Monte Carlo simulation methods. Then the degrees of uncertain importance measure of activities are solved by the three methods and these results are compared. The comparison results in the example show that the proposed method of uncertain importance measure is very effective for distinguishing the importance level of activities in systems. The calculation and simulation results also verify that the risk events composed of critical activities can generate risk scenarios.
1. Introduction
Risk analysis and assessment are an important part of risk management, which plays an important role in production, supply chain, energy use, and other fields related to social sustainability and economics [1,2,3]. When assessing system risks, one of the primary tasks is to identify the possible risk scenarios. The identification and generation of risk scenarios in system risk assessment are not only important steps but the basis of risk avoidance as well [4,5]. System risk analyzers and managers can determine the circumstances that will cause risk consequences, and figure out how to avoid risk scenarios.
A scenario has different meanings and uses in different fields. For example, a scenario is typically used for system requirements acquisition, system design, and evaluation or testing in the field of computers and industrial design, described as predictable interactions between different types of users (roles) and systems, including objectives, expectations, motivations, actions, and response information [6,7]. In the field of reliability and risk assessment, a risk scenario is described as the combinations of events that could lead to product failure (fault) in order to analyze the failure (fault or accident) mode and probability of products (or systems) [8]. One view is that a scenario is the set of events that occurs in a certain order [9]; another view is that a scenario refers to a group of stochastic events or some specific combination of events [10]. In the field of project management and risk analysis, a risk scenario is considered as an idea or description of every possible future plan or situation, resulting from rigorous reasoning [11,12]. Although the understanding of scenarios varies between different fields, there is indeed a common feature among all definitions in set theory terms—that is, the scenario is composed of many system trajectories. Those system trajectories, which have some common features, are combined into a same scenario precisely because of these features. The scenario is surely the common description of those system trajectories [8,13,14].
Advance analysis based on the definition of risk scenarios is of great importance in the reliability and risk assessment field as well as in project management and risk analysis, where it is used for risk scenario generation, occurrence probability, and importance degree assessment. In the field of reliability and risk assessment, there are a lot of PRA (Probabilistic Risk Assessment) methods to help with identifying system risk scenarios [15,16], such as MLD (Master Logic Diagram), FMEA (Failure Modes and Effects Analysis), HAZOP (Hazard and Operations Analysis), ET (Event Tree), ESD (Event Sequence Diagram), FT (Fault Tree), AFD (Anticipatory Failure Determination), and so on, which can be unified into a framework called “TSS (Theory of Scenario Structuring)” [13]. In the field of project management and risk analysis, the SA (Scenario Analysis) method has been attracting more and more attention as an important risk identification method [17]. The SA method is presented to conceive a variety of possible future plans according to detailed and rigorous future reasoning on the basis of various key assumptions on economic, industrial, and technological evolution [18]. The greatest advantage is that decision-makers can predict future tendencies and avoid a common mistake: under- or overestimating the coming change and its impacts. Some industries have gradually adopted scenario-based analysis methods on risk prediction; for instance, Shell, the first industry to apply the SA method to great success, has a number of large projects underway at present [19].
In the field of reliability and risk assessment, although there are already many ways to identify and generate scenarios and these methods have been widely used (for example, in some PRA methods quantitative probability assessment is built on the basis of system risk scenarios, problems such as depending on personnel quality and heavy identifying works exist in risk scenario identification. Therefore, a growing number of studies on risk scenario generation and simulation have appeared in recent years [8,20], particularly those based on the IM (Importance Measure) method to identify important risk scenarios. As one of the important aspects on PRA, IM analysis, filtering out less important risk scenarios and then allowing risk analysts to assess the risk scenarios that can cause serious consequences, has significant guiding value for improving and optimizing system design, maintenance development, test strategy, etc. In order to determine the importance of risk scenarios, a variety of importance indexes measuring system components have come into being in recent studies. The most commonly used indexes are Birnbaum measure, FCI (Failure Critical Index), the Fussell‒Vesely measure, RAW (Risk Achievement Worth), RRW (Risk Reduction Worth), etc. [10]. In addition, there are derivatives of a parameter in system risk, such as the likelihood ratio gradient [21]. Moreover, research on the UIM (Uncertain Importance Measure) method of parameters combined with the PRA method in reliability models [22,23,24,25] is a priority in the field of reliability and safety analysis. Meanwhile, other UIM indexes are researched from different prospectives in reliability engineering, such as time-independent, cost-based, etc. [26,27,28,29,30].
Similarly, many qualitative methods are proposed for system risk identification in the field of project management and risk analysis, such as Check List, Specialists Method, Flow Chart, Analogy Comparison, experiential learning, etc. In addition, the SA method is used more and more widely, but how to identify the most important risks that will have a significant impact on systems, especially important risk scenario identification, has also been a focus for researchers. Generally, events that are produced by critical activities in system networks are critical risk events. To find the critical risk events, many importance measure indexes are proposed to measure critical activities in recent studies, for example the index PCI (Path Criticality Index) and ACI (Activity Criticality Index) for computing critical path and critical activities probability [31], the index SI (Significance Index) for computing the significance of each activity and activities’ critical measurement [32,33], and so on. Furthermore, in terms of engineering system risk analysis and sensitivity analysis, the number of studies on activities’ uncertain importance measure have increased for measuring the importance of critical activities and inspecting the impact on whole-system parameter uncertainty [31,34,35,36].
Engineering projects have a failure or fault mode—that is, if the project quality does not meet the user’s requirements, the project schedule is seriously overdue and the project cost is over budget [37,38]. Similarly, as an essential part of the whole system, activities of different importance have different influence on the whole project’s system risk. Meanwhile, for maintenance and logistic systems in the reliability and risk assessment field, the schedule and cost also need to be taken into account when assessing the importance of activities in the system [39,40]. From this perspective, importance measurement of activities and importance evaluation of parts in the reliability field are as important when analyzing system risk. Dividing risk categories effectively, identifying those risks and mutual relations, and finding critical risks are the main tasks in engineering system risk management, and provide a scientific basis for focusing on the disposal of risks. Risk scenarios are significant for the management and control of engineering system risk. Therefore, identifying and generating important risk scenarios in advance has become a scenario-based critical risk analysis problem.
This article belongs to two crossover fields: the project management field and the reliability and system risk assessment field. Based on the second view of risk scenarios [8,10], it is considered a combination of events that could lead to system failure, which usually includes time, cost, and quality dimensions. This article is mainly about identifying risk events from a system’s critical activities and combining the important events to generate risk scenarios by computing the importance measure of risk events. With reference to the UMI index in the field of reliability and risk assessment [29,39], we proposed a set of important measurement indexes to identify and generate risk scenarios. Meanwhile, three critical activities analysis methods, Taguchi tolerance design, mathematical analysis and Monte Carlo simulation methods, are applied to GERT (Graphical Evaluation and Review Technique) networks, used to model activity-based systems such as engineering project systems or maintenance and logistic systems [40], to determine activities’ uncertain importance measure by focusing on mathematical analysis and Monte Carlo simulation. A specific case is proposed to compare the three methods’ advantages and disadvantages for any guide of system risk scenario analysis and risk assessment. The results show that the importance measure analysis approach can be used to generate risk scenarios and assess system risk.
2. Risk Scenarios Generation
2.1. Definition of a Risk Scenario
In system risk analysis, possible causes of risk are often identified and assessed, and those risk events that may lead to system failure constitute risk scenarios. Usually the basic unit to describe a project system is an activity. The definitions of a risk event and a risk scenario are as follows.
Definition 1.
Risk Event. A risk event is an event that may cause system failure, described as the completion of a system activity in schedule, cost or quality. This can be expressed as:
A risk event includes several attributes: event subject , event type , and event content . is the subject of the risk event, namely the system activity, is the type of risk event; according to system risk classification, a risk event in an engineering system can be a schedule risk (time), a cost risk (cost), or a quality risk (quality) [38]. is the content of the risk event; the specific circumstances of stochastic risk events are the content of the event. For example, risk event means that the completion time of activity is over the threshold .
Definition 2.
Risk Scenario. A risk scenario is a series of stochastic risk events that may cause system failure. This can be expressed as:
where represents a stochastic event related to risk. Since the stochastic events in the whole system are often uncountable, we pay more attention to those stochastic events that have happened. Hence, in this article, events that have not happened are no longer included in scenario sets—that is, if appears in set , it means that has already happened in , while if does not appear in set , it means that does not happen. According to Equation (2), all non-empty subsets of are risk scenarios of n-risk events.
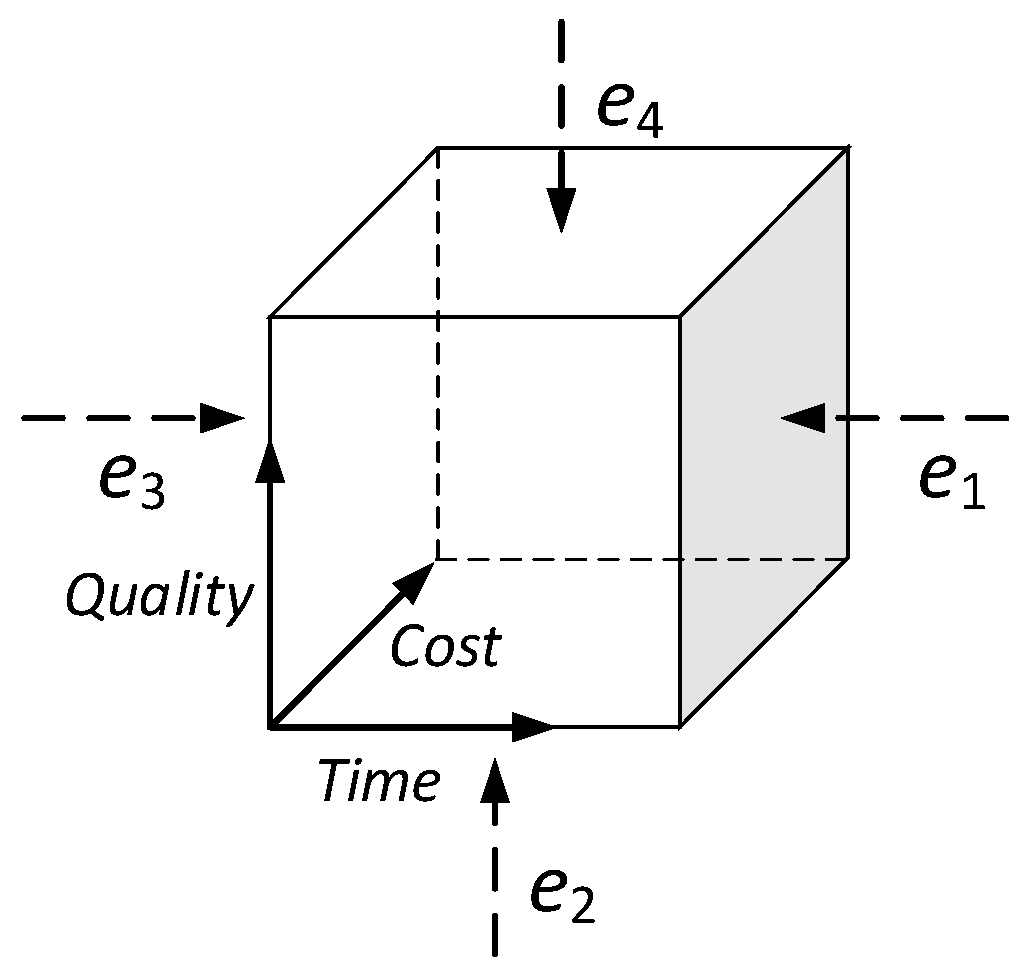
In this paper, we consider a risk scenario as a group of stochastic events or some specific combination of events [8,10]. To better explain the inherent relationship of risk event , risk scenario , and system failure, the notion of a “Scenario Box” is proposed as shown in Figure 1. A scenario box represents the stochastic risk events involved in a scenario and the consequences of the risk events. A risk scenario box consists of three dimensions, quality, time, and cost, and all stochastic risk events included in the scenario are around the scenario box. Under the combination of these stochastic risk events (i.e., under the effect of scenario ), when the risk of the whole system is enough beyond the defined threshold range of the scenario box, whether in time, cost, or quality, it is considered a system failure. This concept is considered the criterion to decide if the system fails in Monte Carlo simulation process of risk scenario in the following.
2.2. Risk Scenario Importance Measure
As a sensitivity analysis, IM (Importance Measure) is used to measure the importance of the reliability and risk of a component on the whole system [23]. The significance of a risk scenario is that its occurrence may cause system failure, so the identification of important risk scenarios is the top priority in system risk analysis. From the definition of risk scenario in this article, important risk scenarios and critical risk events are closely related. At the same time, risk events have event subject, which is activity, so critical activities mean that important risk events may happen. Therefore, in order to analyze system risk based on risk scenarios, important risk scenarios need to be identified and critical activities need to be found from important risk events. This article proposes definitions and formulas for activities’ uncertain importance measure, events’ importance measure and scenario importance measure, which are needed in risk scenario generation. Analysis and simulation of risk scenarios are based on these definitions.
(1) UIM (Uncertain Importance Measure) of Activity
Critical activities, which are necessary to meet system requirements, have a significant impact on the system’s total duration. In a stochastic network, we can start from critical activity analysis and then measure the importance of activities to identify critical activities and important risk events. There are two ways to assess activity importance: computing the activity criticality index and analyzing the uncertain importance measure. The former is used to identify an activity’s expected time, which will heavily influence the expected system completion time, while the latter can be used to identify activities that are worth more attention in terms of reducing the fluctuation of the uncertainty (namely variability) in the system completion time, T.
UIM (Uncertain Importance Measure) is generally used for sensitivity analysis of a model, in order to find the input parameters that have the greatest impact on the uncertainty of the whole model output [22]. In terms of system activities, we can measure the uncertain importance to identify those activities that have the greatest impact on the uncertainty of a system’s overall parameters (i.e., time, cost, or quality) from the uncertainty of the parameters (i.e., time, cost or quality) of a single activity [29]. Generally, those activities that have high uncertain importance are often critical in a system. Uncertain importance measure of activity, the basis of the entire risk scenario analysis, will be discussed in Section 3 to identify risk events and to give importance measure results of the risk scenario; finally, a risk scenario will be generated.
(2) ECI (Event Critical Index) of Event
In the system, when an activity has been identified as critical, it means that correlative stochastic risk events are critical risk events that make up the risk scenarios we are interested in. A risk event includes three attributes: event subject, event type, and event content (Equation 1). A risk event that makes critical activity its event subject should be identified first. In addition, determining whether an activity is critical from the time, cost, and quality dimensions is feasible. Thus, if an activity is determined to be critical in the time dimension, the type of risk event that should successfully identify the activity as the event subject is time. Likewise, if an activity is determined to be critical in the quality dimension, the type of risk event that should successfully identify the activity as the event subject cannot be time or cost.
Unlike other important measurement indexes proposed from the time or cost perspective [27,29], the importance of events in risk scenarios should be considered in three dimensions—cost, time, and quality. In order to measure the importance of events, an ECI (Event Critical Index) is proposed against the importance degree of system failure by risk events in this paper. The definition is as follows.
Definition 3.
Event Critical Index. An event critical index is the ratio of the number of system failures to the occurrences of risk events, which can be expressed as follows:
(3) SCI (Scenario Critical Index) of Scenario
In order to determine the risk scenario, risk events and their importance need to be determined. According to the results, risk event sets that have the greatest effect on system failure are generated. Therefore, the generation of risk scenarios and the importance ranking can provide a foundation for follow-up risk assessment. Risk scenarios reflect the uncertainty of a system and the importance need to be analyzed when the probability of occurrence is assessed.
For measuring scenario importance, an SCI (Scenario Critical Index) is proposed to measure the importance degree on system failure by risk scenarios. The definition is as follows.
Definition 4.
Scenario Critical Index. A scenario critical index means the ratio of the number of system failures to the occurrences of risk scenarios, which can be expressed as follows:
2.3. Framework of Risk Scenario Generation
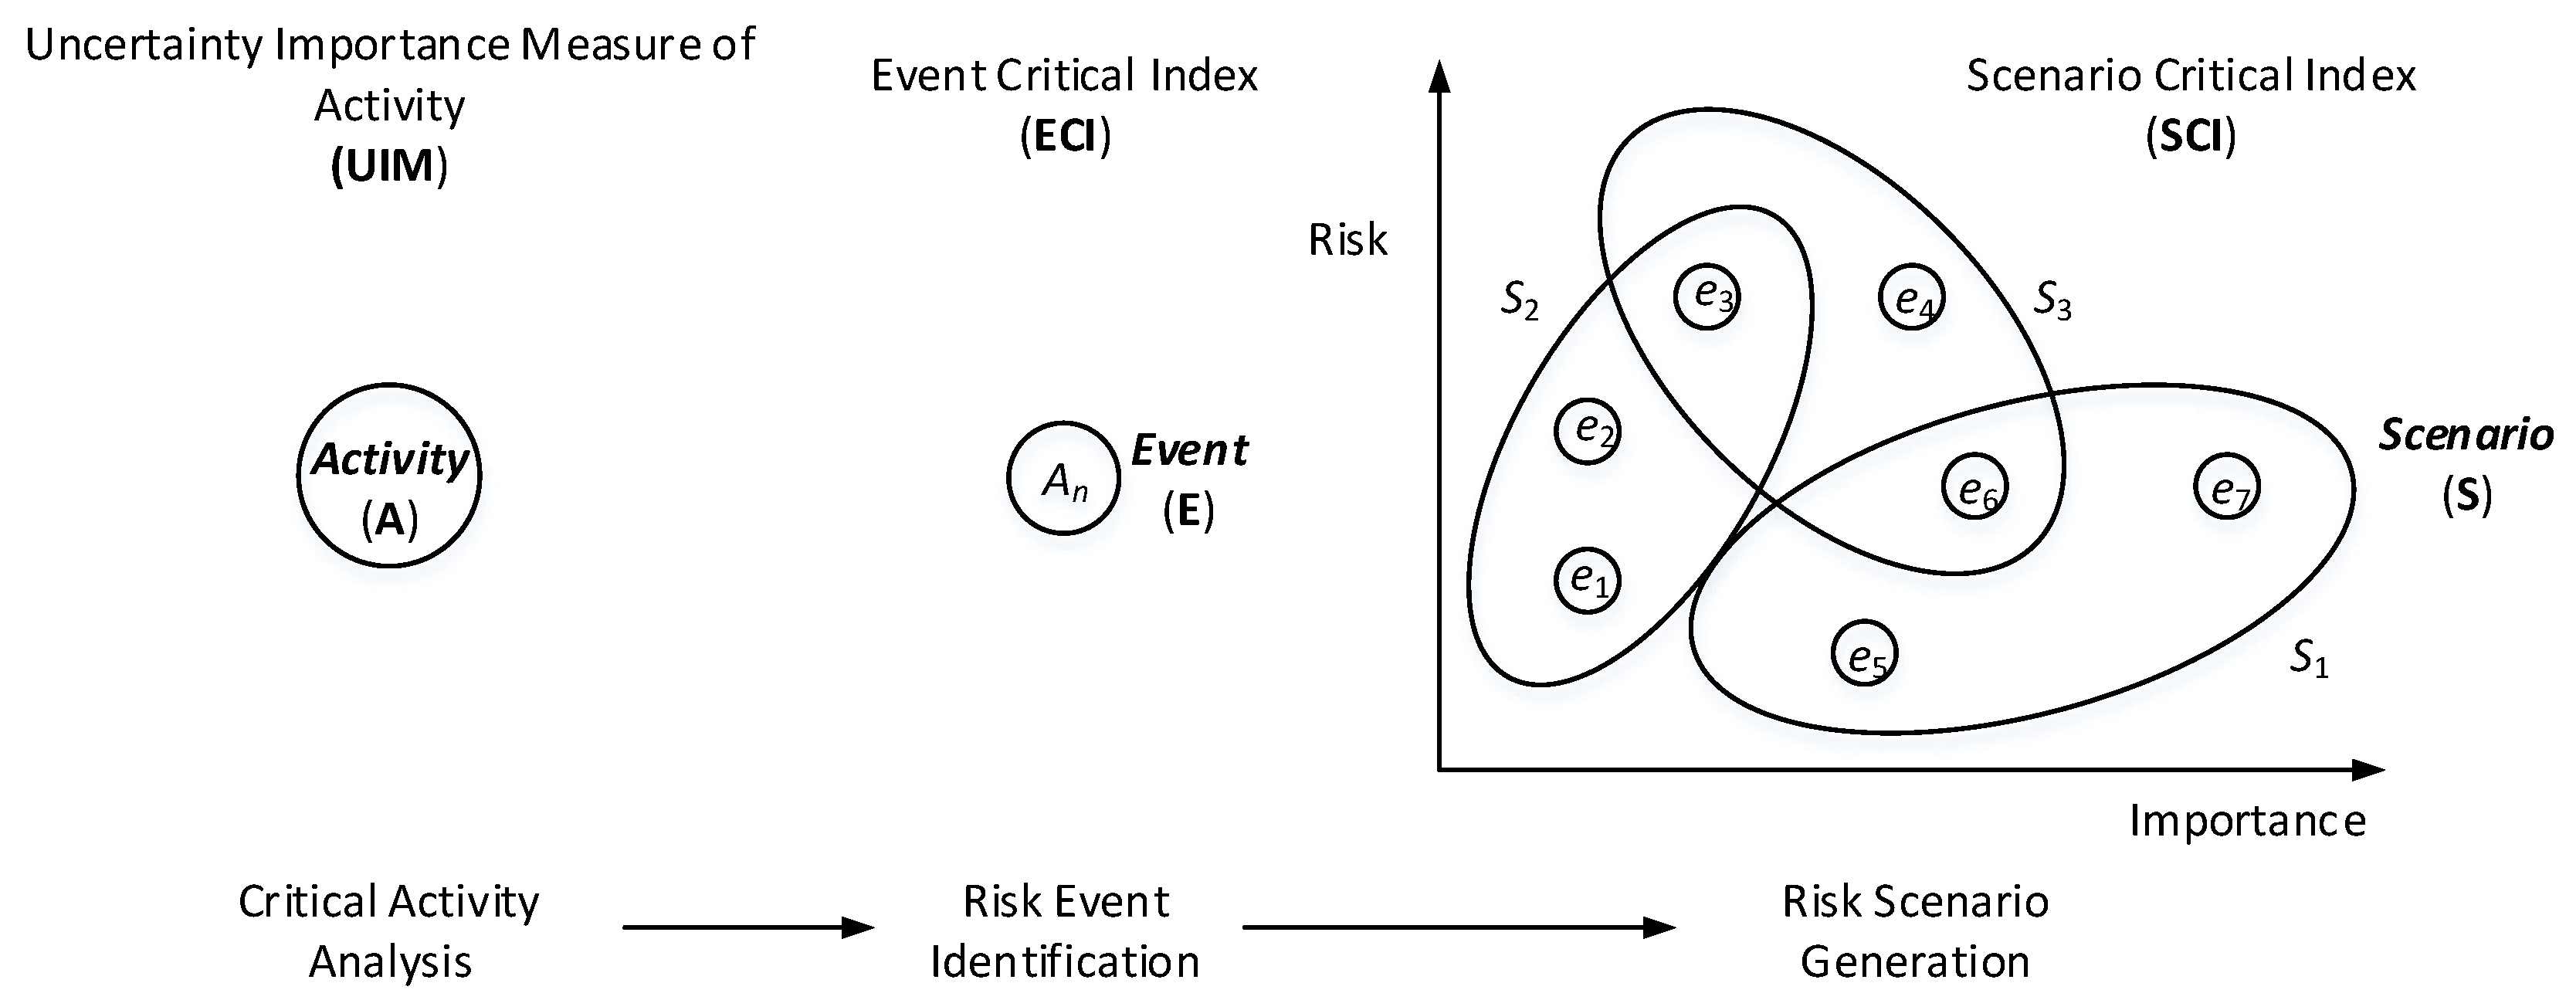
The importance of critical activities needs to be analyzed and risk events need to be identified before the importance analysis of risk scenarios can take place. Risk event identification is a critical step; its results not only help us determine which events constitute risk scenarios, but also show the sorting results of risk events that have the greatest impact on system failure. The prerequisite of risk event identification is to identify system-critical activities according to the results of an activity importance measure analysis; events associated with critical activities are typically important risk events. After successfully identifying the events that have the highest impact on system failure, we need to analyze the importance of risk scenarios. The results form the basis of risk assessment and avoidance through ranking the importance of risk scenarios that may cause system failure. Based on the risk scenario analysis ideas above, a framework of risk scenario generation is proposed based on importance measure (Figure 2), in which the three basic steps of risk scenario generation are critical activity analysis, risk events identification and importance measure, and risk scenario importance analysis and generation.
The process of generating and analyzing system risk scenarios includes critical activity analysis, risk event identification, risk scenario generation, and other steps in this article. Critical activity analysis is the cornerstone of scenario generation method and can be carried out through simulation or mathematical analysis; when all risk events of interest are identified, the correlative scenarios can be obtained through risk events combination. In a system, some activities have a significant impact on the total duration and are an important part of on-time system completion; these are called critical activities. Managers tend to be more concerned about activities that can decide the entire system process or even the success or failure of the system. Therefore, it is important for managers to determine which activities are critical. Currently, there are two ways to assess activity importance: computing activity criticality index and analyzing uncertain importance measure. The former is used to identify an activity’s expected time, which will significantly influence the expected system completion time; the latter can be used to identify activities that are worth more attention in terms of reducing the fluctuation of the uncertainty (variability) in the system completion time. This article begins with a critical activity uncertain importance measure index and gives a study of risk scenario generation based on critical activity analysis.
3. Risk Scenario Generation Based on UIM of Critical Activity
3.1. The UIM Index of Critical Activity
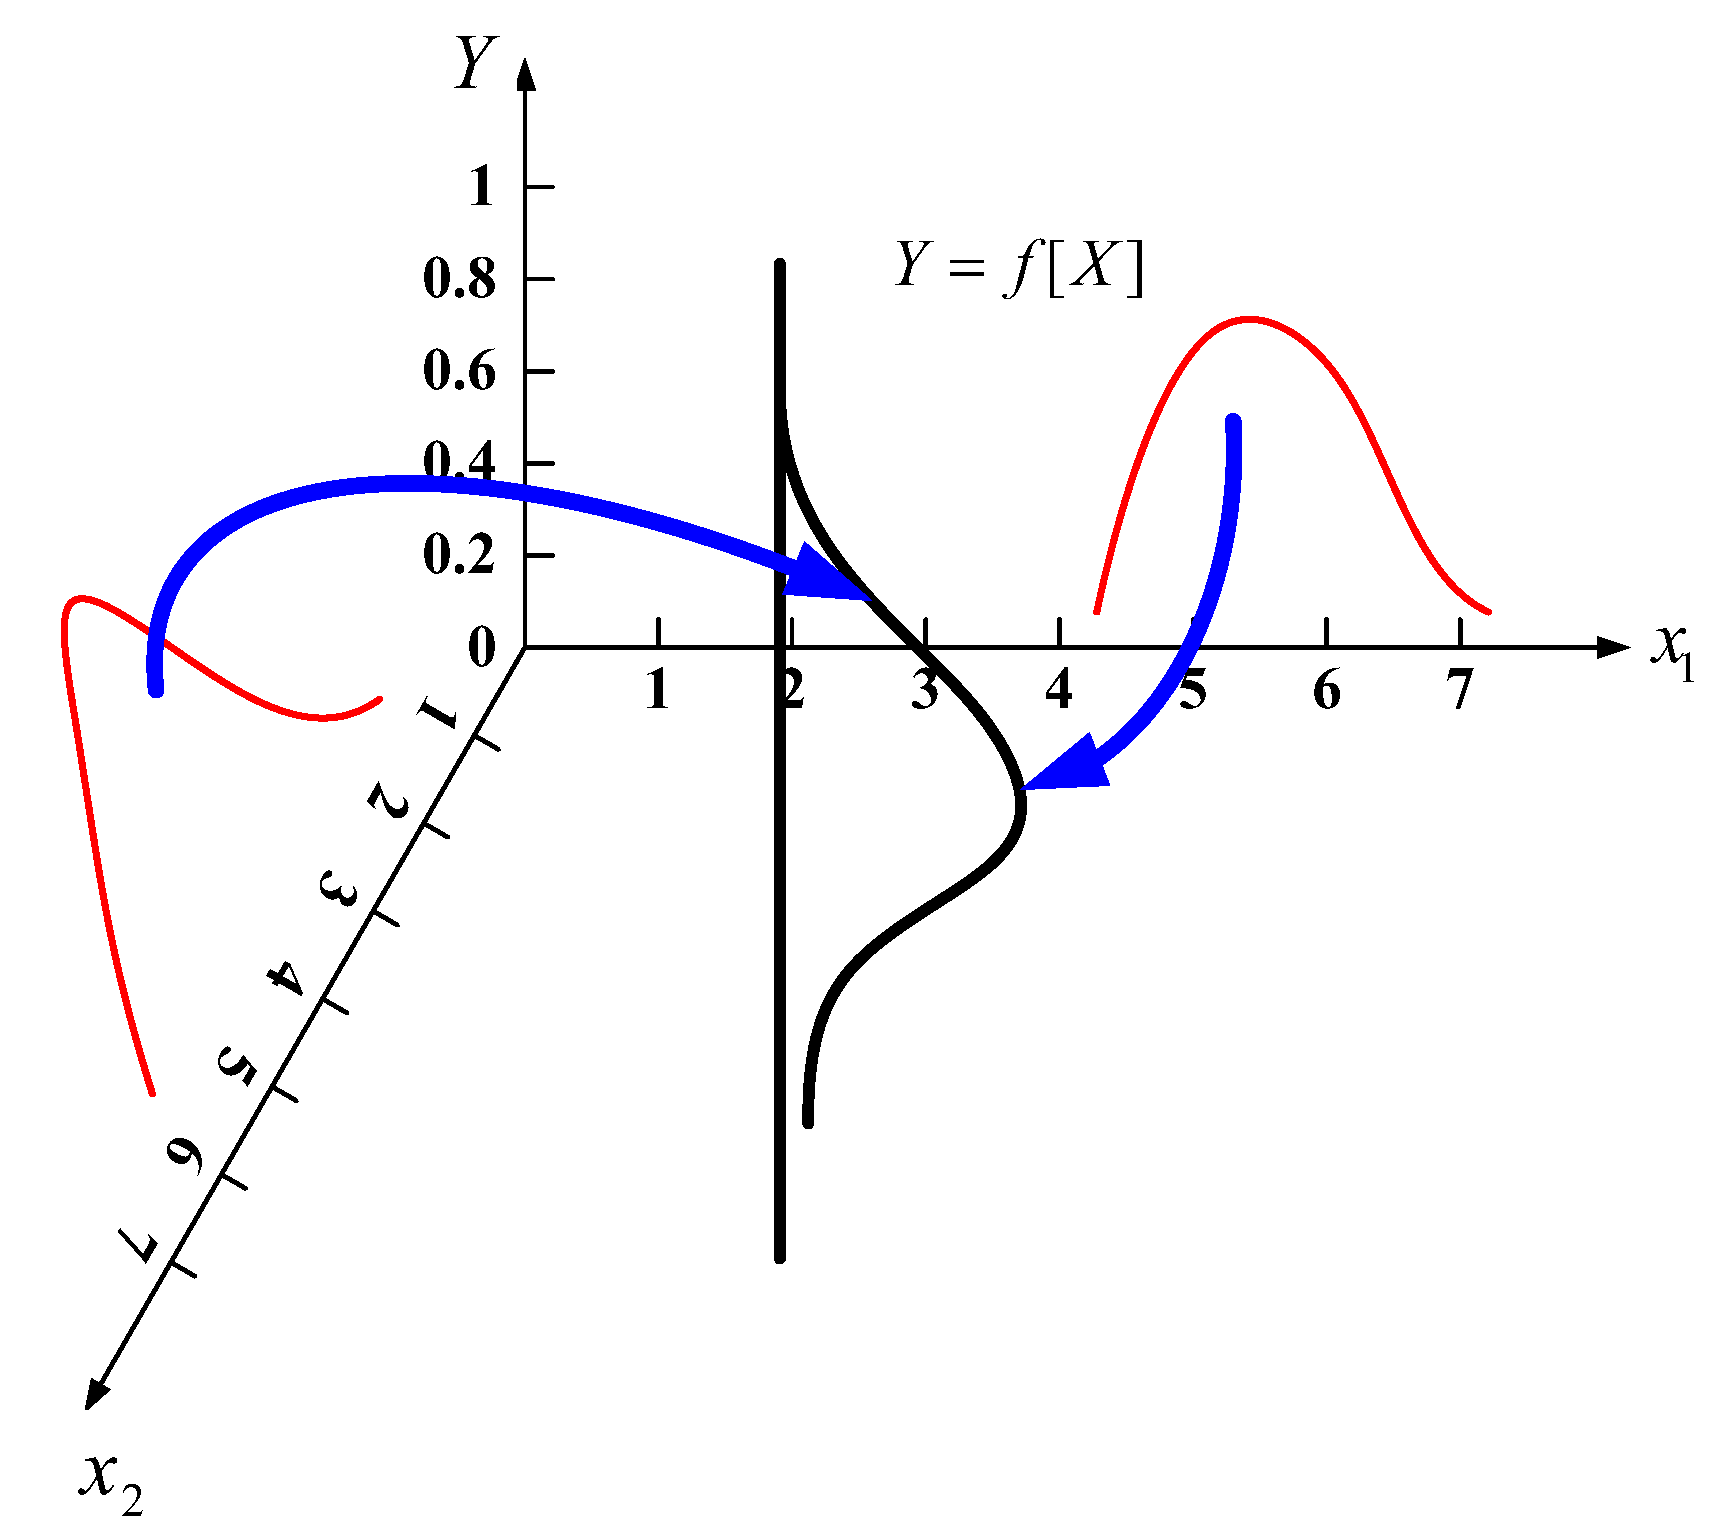
As a general uncertainty analysis method, sensitivity analysis (SA) provides ideas for analyzing logistic support process uncertainty. Uncertainty analysis aims to figure out the influence of input variables on the final output uncertainty of the model throughout sensitivity analysis. The assessment and presentation of the influence of uncertainty have been widely recognized as important parts of analysis for complex systems [41]. At the simplest level, such an uncertainty analysis process can be viewed as the study of functions in the form of
where Y is the dependent output, whose uncertainty is influenced by fluctuation of its independent inputs; function f represents the common model or models of Y under study; and X = [x1, x2, …] are k-independent inputs. Figure 3 shows that the goal of the uncertainty analysis is to determine the influence of input (X) uncertainty on the entire output (Y) distribution.
Y = f[X] = f[x1, x2, …],
In an activity-based system, the uncertainty of overall system parameters (i.e., time, cost, or quality) caused by the uncertainty of parameters (i.e., time, cost or quality) of a single activity is called the “uncertain importance measure.” A critical activity is a predominant influence on the entire system, and is mainly divided into two types [31,39]: (1) Variance‒Variance, the variance of entire system parameters (i.e., whole time or whole cost) as influenced by the variance of activity parameters (i.e., time or cost); (2) Mean‒Variance, the variance of entire-system parameters (i.e., whole time or whole cost) as influenced by the change in activity parameters’ (i.e., time or cost) means. This article belongs to the Variance‒Variance type, studying the influence of the variance of activity parameters on the variance of the system parameters.
In CPM (Critical Path Method) and PERT (Program Evaluation and Review Technique) diagram, the analysis method of critical path and critical activity has been common and mature [42]. Common criticality indexes include PCI (Path Critical Index), ACI (Activity Critical Index), SI (Significance Index), CRI (Criticality Index), etc. [24,35]. When analyzing critical activities in a GERT network, we can start with the UIM of mean and variance of activities, while variance uncertainty is the emphasis of study in this article. As system parameters include time, cost, and quality, uncertain importance includes time-uncertain importance, cost-uncertain importance and quality-uncertain importance. In order to facilitate research, this article only researches time-uncertain importance, namely activity duration uncertain importance. This article chooses the definition of PERT network activity critical index of Cho & Yum [34] as a reference, giving the meaning of UIM of activity, that is, UIM is the uncertainty of total system duration caused by the uncertainty of duration of a single activity, which measures the degree of influence on the entire system by activity duration as a valid indicator. UIM is defined in this article as follows.
Definition 5.
UIM (Uncertain Importance Measure). The UIM of activities means the degree of the network activity time fluctuation compared to the total system time , which can be expressed as follows:
Uncertainty in the above formula means the variation of activity time and , while Importance measure means the influence on the degree of total time variation by the degree of a single activity’s time variation. For computing UIM of system activities, critical activity analysis is proposed with Taguchi tolerance design, mathematical analysis, and Monte Carlo simulation methods. These three methods have their own advantages, disadvantages, and applicability.
3.2. UIM Calculation of Critical Activity
3.2.1. Taguchi Tolerance Design Based on PERT
Taguchi tolerance design methods can be used in UIM computing processes [8,34]. PERT networks are classified into two types: Type A with one longer path (the critical path) than the others, and Type B without such a path. The difference between the two types is whether the activities on the dominantly longer path (namely critical path) have linear effects on T. Let and be the mean and the variance of activity , respectively. If is assumed to have a linear effect on the variability of , it may have two test levels, and , respectively, for the low and high levels. If is assumed to have a curvature effect on the variability of , then three test levels, and , are included for the low, center, and high levels, respectively. To get the UIM results of network activities, Taguchi tolerance design usually proceeds as follows.
Stage 1: make all activities a set of and determine two test levels of each activity in . Assign each of the activities to the chosen suitable Taguchi orthogonal array (OA) column according to the level. Calculate the system completion time using CPM (Critical Path Method) at each run of the selected design and perform ANOVA on the system completion times. Calculate the contribution ratio (the variation of attributable to the main effect of activity ) , which is taken as an estimate of .
Stage 2: let be the set of activities remaining after screening out those whose were negligible in magnitude (<1%, say) in Stage 1. Determine three test levels of each activity in , which is partitioned into two sets according to in Stage 1, and select or construct an appropriate three-level OA. Then repeat the steps of Stage 1 and calculate and (the variation of attributable to t the interaction effect of activity and ), respectively. Estimates of and are given by and , respectively.
The drawback of tolerance design in the UIM method is that this method only holds for general PERT networks. For complex stochastic networks, such as GERT networks, the complexity of computation is very high. Since the standardized GERT work has analytical results, this article attempts to focus on mathematical analysis to replace Taguchi tolerance design for solving activity UIM indexes in general stochastic networks.
3.2.2. Mathematical Computation Based on GERT
Based on the above definition, UIM aims to measure the activity time fluctuation so that will change. Variation is proposed in this article to measure the activity time fluctuation and the change of . Therefore, the UIM index of an activity can be redefined as follows:
where and are the activity and the system total time. According to Equation (7), we can get the computing definition of UIM as follows:
where and are the variation value of variance of caused by the time fluctuation (variance changes) of a specific activity . Based on the above definition, UIM results can be obtained under an analyzable standard GERT network. Several important steps are usually involved, as follows.
Step 1. Analyze the type of GERT network and compute the transfer function expression;
Step 2. According to the calculation of different network structures, compute the corresponding -order moments about the origin (the one-order moments about the origin is the expectation value) when the variances of in a GERT network are 0 and a given value, and get , , and , where and are the different when the variances of are 0 and a given value;
Step 3. Compute the corresponding variances of when the variances of are 0 and a given value according to Step 2, and get the values as follows:
Step 4. Compute the variation of , namely the variance , according to Step 3 and get the values as follows:
Step 5. Compute the variation of , namely the total variance of GERT network , similar to in Steps 2 and 3, and get the values as follows:
Step 6. Put the results of and into Equation (8) and compute the UIM results of .
The mathematical method certainly has more general applicability than the Taguchi tolerance design, but it is essential that stochastic networks be converted into a standard GERT network model, which is the worst drawback. In addition, the Mason formula and moment generating function are computed in an analytical algorithm, which is a cumbersome step. To solve these problems, the Monte Carlo simulation method is used to analyze the critical activities in GERT networks.
3.2.3. Simulation Method Based on Monte Carlo
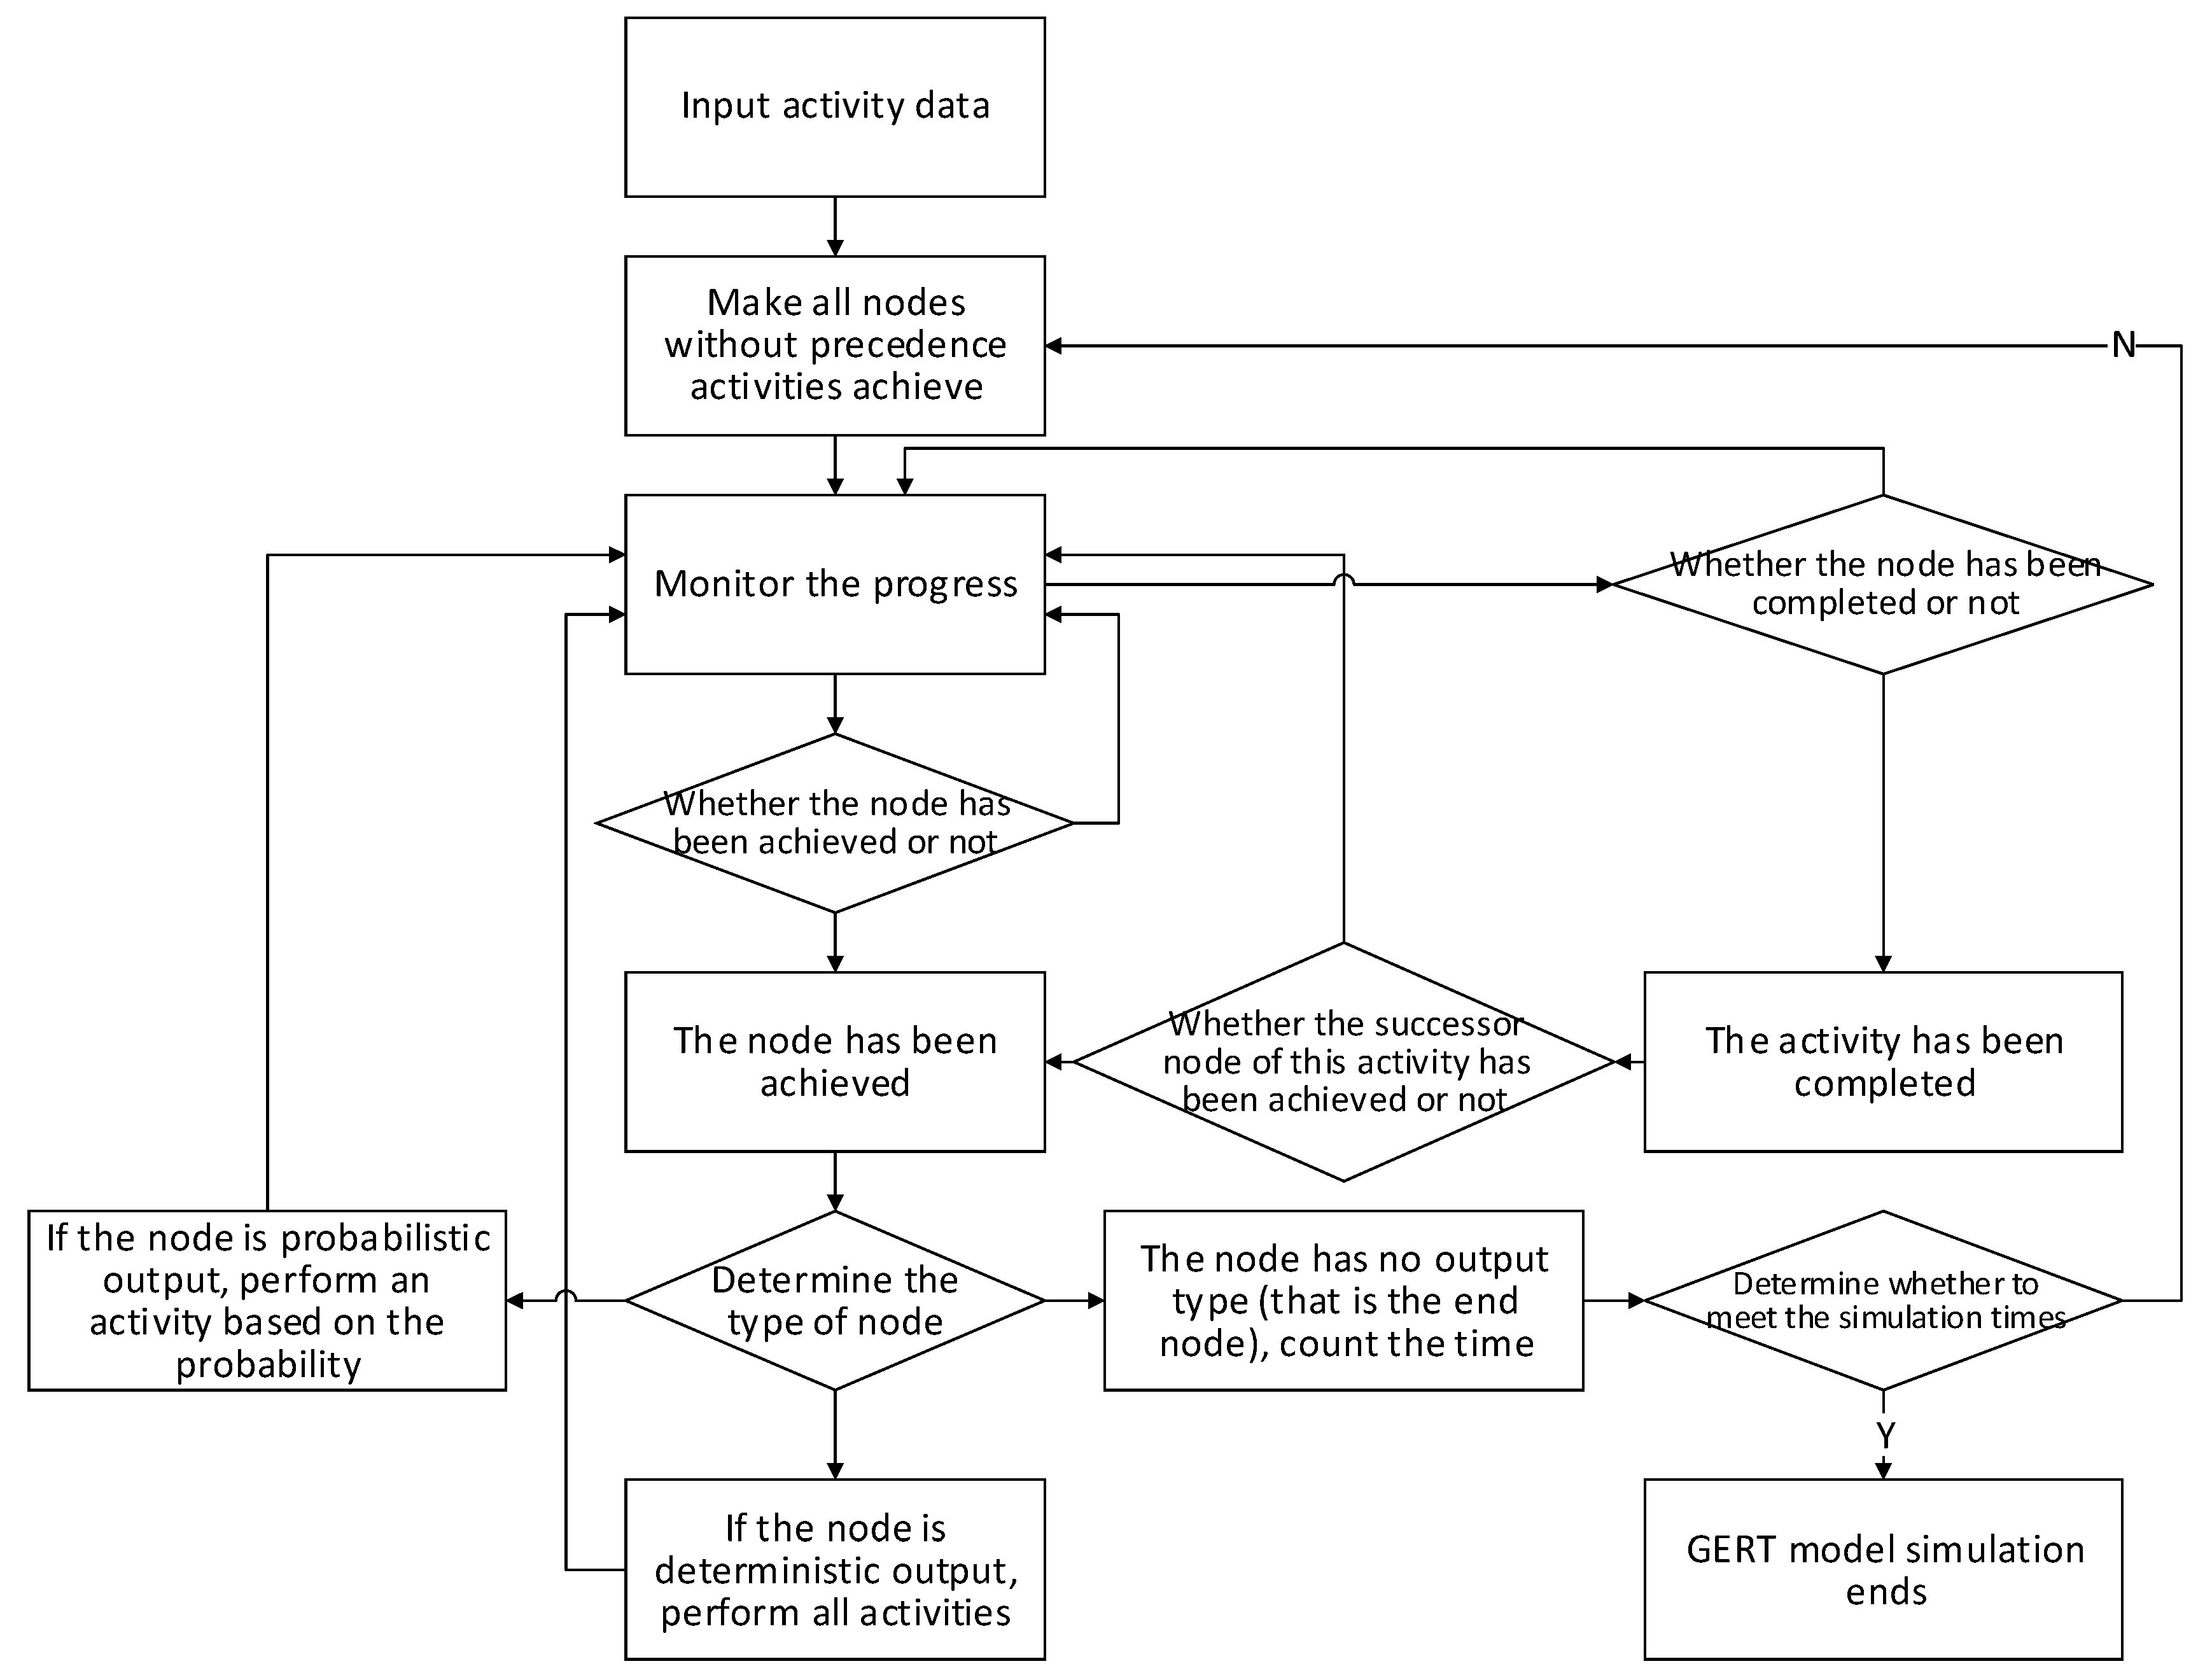
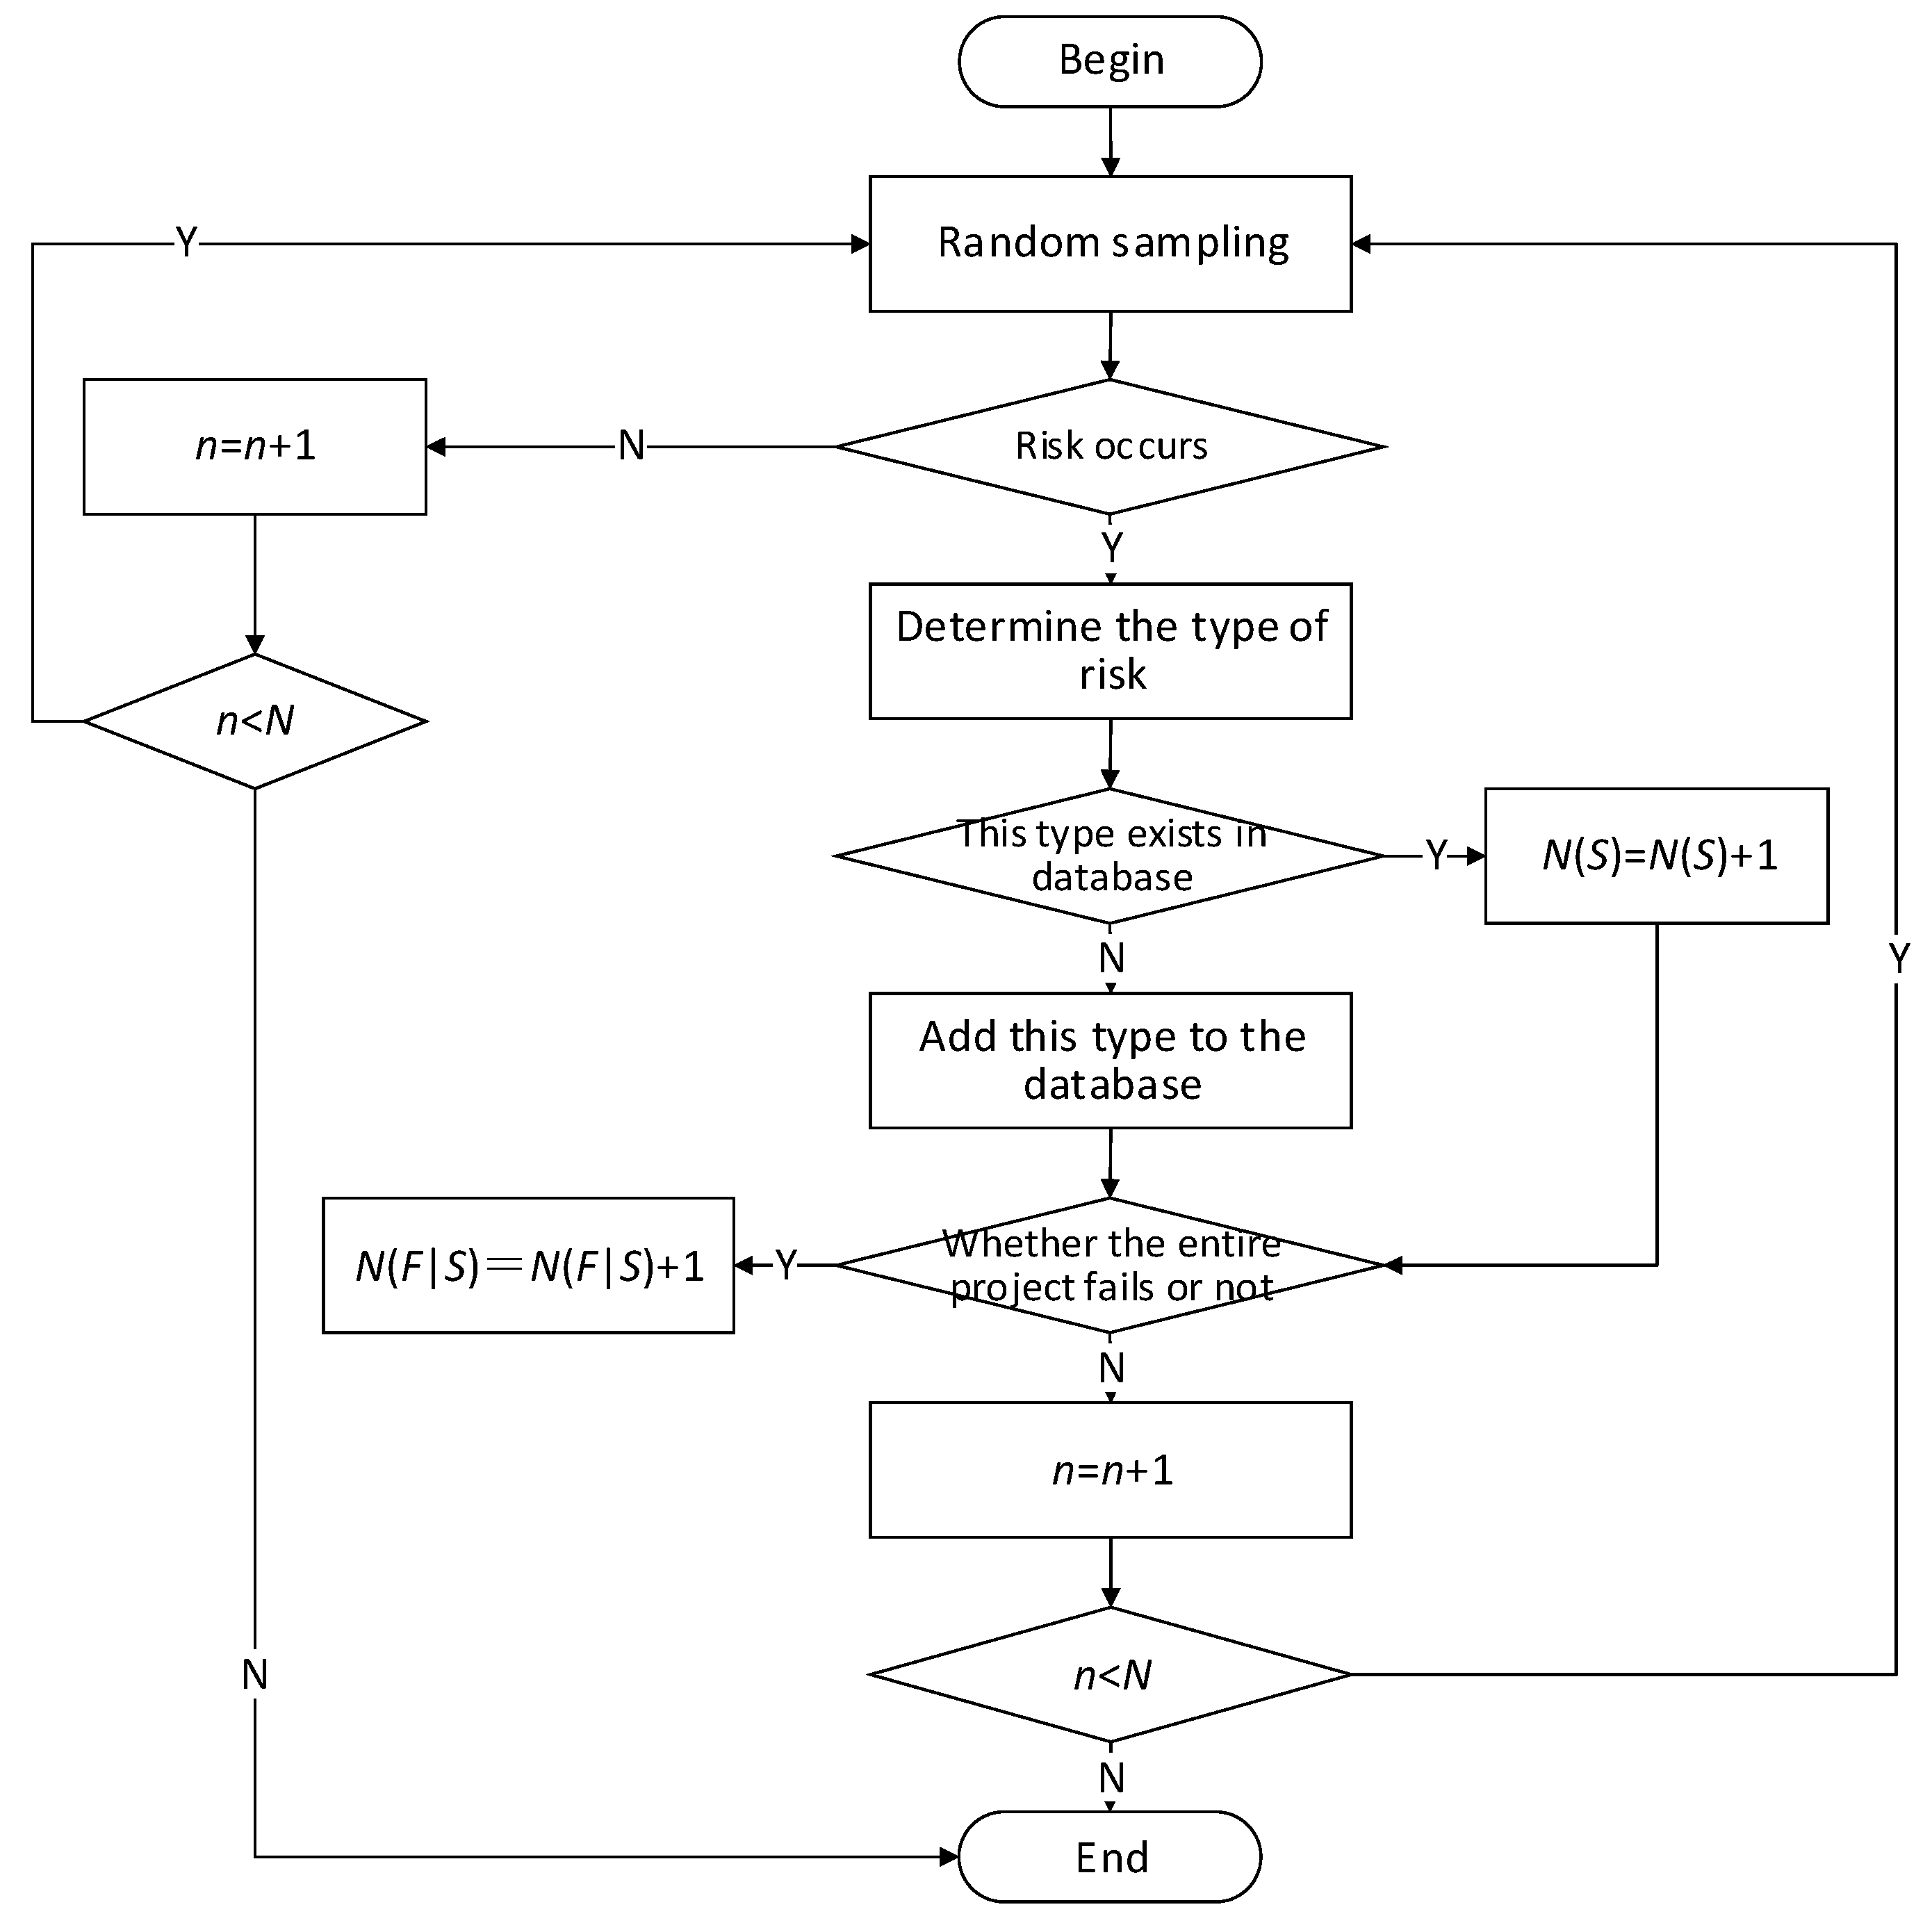
The simulation framework of a system GERT network is shown as Figure 4. Current completion (including the achievement of nodes, activities completion, etc.) needs to be monitored as the program is undergoing continuous simulation. Information on activities (activity time, probability, precedence nodes and successor nodes, etc.) can be batch-imported to generate the corresponding GERT models.
Figure 5 shows the whole simulation process. It includes three main parts in Monte Carlo simulation analysis of system risk scenarios.
- (1)
- Random sample. Using the known parameter distributions (time distribution, cost distribution, etc.) for direct sampling. Generally, the parameter distributions involved are normal triangular distributions, so all sampling is done at once in this article, with sampling results to compute the relevant parameters of the entire system.
- (2)
- Determine the rate of risk scenarios and system failure according to the criteria. When judging whether a risk scenario has happened or not, risk events must be assessed first; whether the system fails or not depends on parameter sampling in Step 1: whether the system fails or not can be determined after the end of each sampling.
- (3)
- Importance measure analysis according to the statistical data of risk scenarios. This article focuses on two types of data, the occurring numbers () or occurring probability () of risk scenarios, and the failure numbers () or failure probability () of system when some specific scenarios happened.
In the second part, the description of risk events and the judgment criteria of system failure need be given based on specific situations of different systems, as the criteria of different systems vary widely. Collection of this information is important when system risk assessment is in progress. The flow of Monte Carlo simulation program of system risk scenarios is shown in the next figure.
3.3. Generation Steps of Risk Scenarios
In order to find the UIM values of all system activities, risk scenarios can be generated. Concrete steps are as follows:
Step 1. Rank the UIM values of activities, and got the results: , where means the ranking numbers of UIM values;
Step 2. Analyze the system activities that have high UIM values; those that have a significant impact on the variance of system time will be chosen, such as activities as , while low-impact activities are ignored;
Step 3. Make activities with high UIM values the subject of risk events. Rank the importance of risk events and identify risk scenarios;
Step 4. Combine the events in certain rules, and get important risk scenario set , where all non-empty subsets can be considered risk scenarios.
The risk scenario generation method according to system critical activities in this article is simple and straightforward. According to the ranking results of activity importance, we can understand intuitively which activities have the greatest effect on the whole system and eliminate the low-impact activities to greatly increase the efficiency; moreover, if the identified events are a total of , the number of scenarios may reach in theory. Once the level of cannot be reduced, will be a very large number. Therefore, some rules can be adopted to downsize scenarios in the stochastic combination of risk scenarios. For instance, one way is to add in the preference of decision-makers to filter out the risk scenarios; another is to classify the importance of activities and risk events into type A, type B, or type C. Ranking the importance of risk events first would be an effective way to judge the importance of risk scenarios, since important scenarios always include important events.
When risk events are independent of each other, the more important events there are in one scenario, the larger probability it will be a more important scenario. There are two plans to rank risk events: one is ranking with ECI results but requires additional Monte Carlo simulation; the other is ranking the preliminary events according to the results of critical activities ranking. The latter not only takes advantage of the information on critical activities, but saves time and resources as well. Therefore, this article directly ranks the UIM values.
4. Examples
4.1. Overview
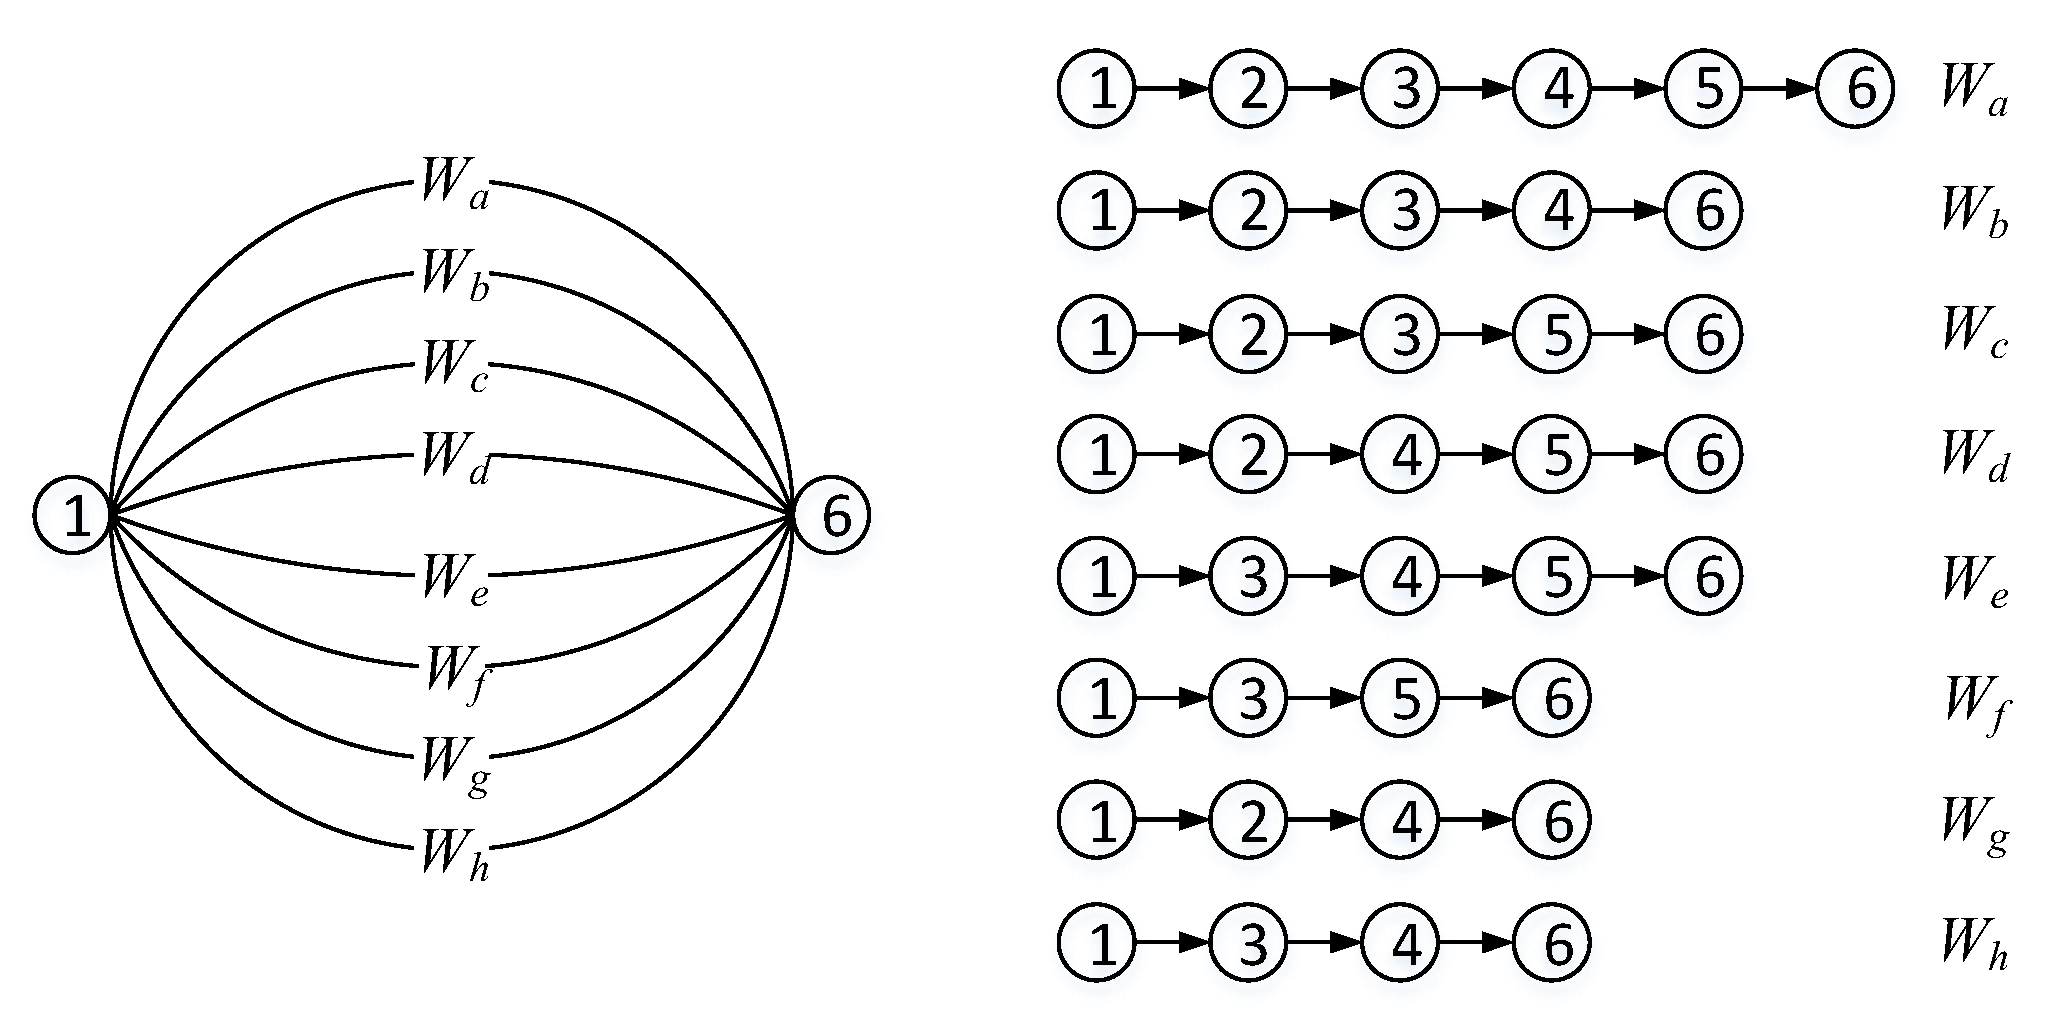
A specific example in this article is shown to analyze the critical activities and generate risk scenarios. By ranking the UIM values of the critical activities of the system in the example, the critical activities and events are identified and risk scenarios are generated based on importance measure analysis, so as to illustrate the logical rationality of UIM indexes proposed in this article and verify the risk scenarios generated method based on importance measure analysis. Such activity-based systems are usually embodied in maintenance and logistic systems or engineering project systems, which are usually composed of specific activities [24,34,39]. A PERT network with six nodes and nine activities is shown in Figure 6, which is abstracted from an engineering project system. The durations of activities 1, 2, 4, 5, 6, 8, and 9 obey normal distribution with a mean of 3 and a variance of 1 (months), while the other two activities obey normal distribution with a mean of 6 and a variance of 2 (months).
4.2. Analysis of Critical Activity
First, transform the PERT model to a standard GERT network (Figure 7). Then compute the probability of every path in a standard GERT network (in Table 1) so that the transfer function of the entire GERT network can be obtained, as shown in Equation (13).
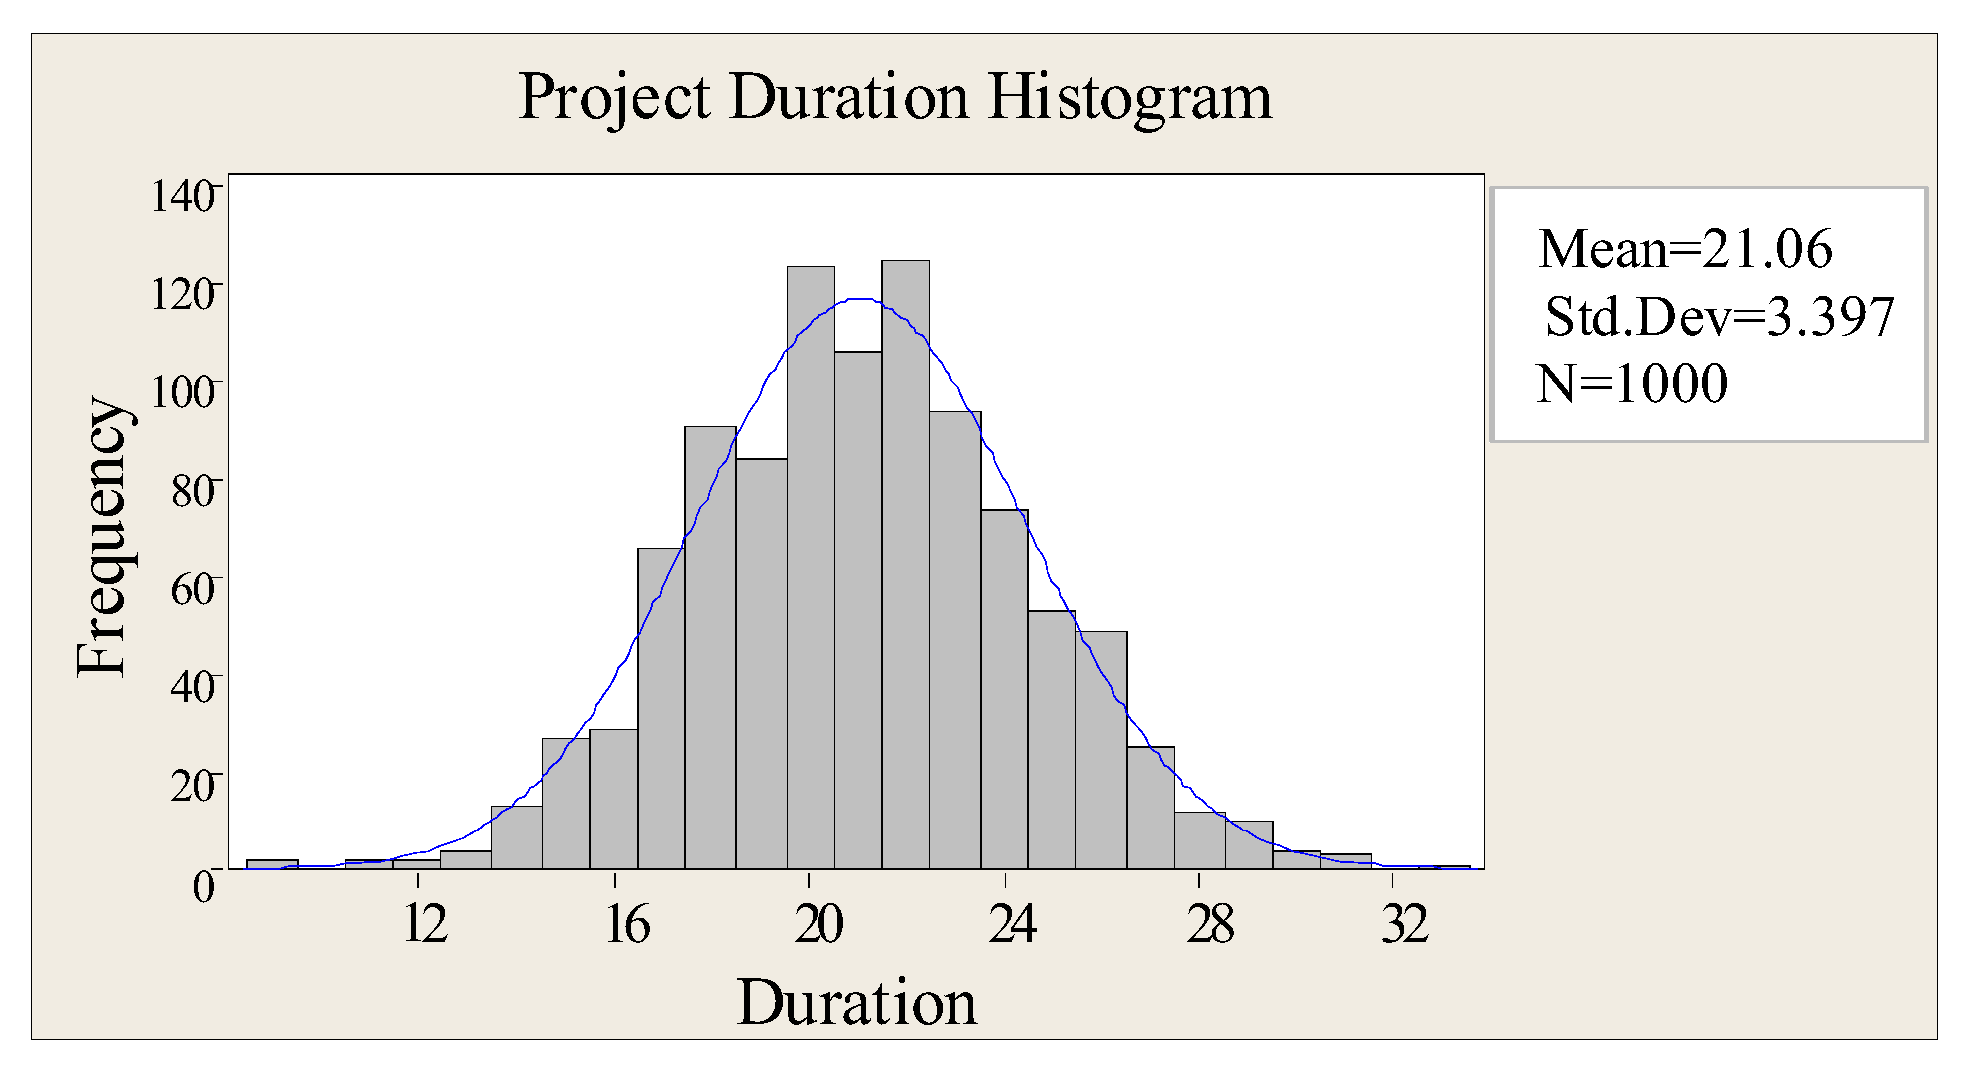
As stated above, the UIM values of each activity could be computed and compared with the tolerance design results. Meanwhile, this article uses simulation to analyze the case. Using a pre-established GERT network model based on Monte Carlo simulation, this article calculates the mean and variance of the total system time under normal circumstances (i.e., the activity duration parameter is not changed), and the distribution of the total system time can be obtained as shown in Figure 8. The mean of the total time is 21.06 and the variance is 11.54.
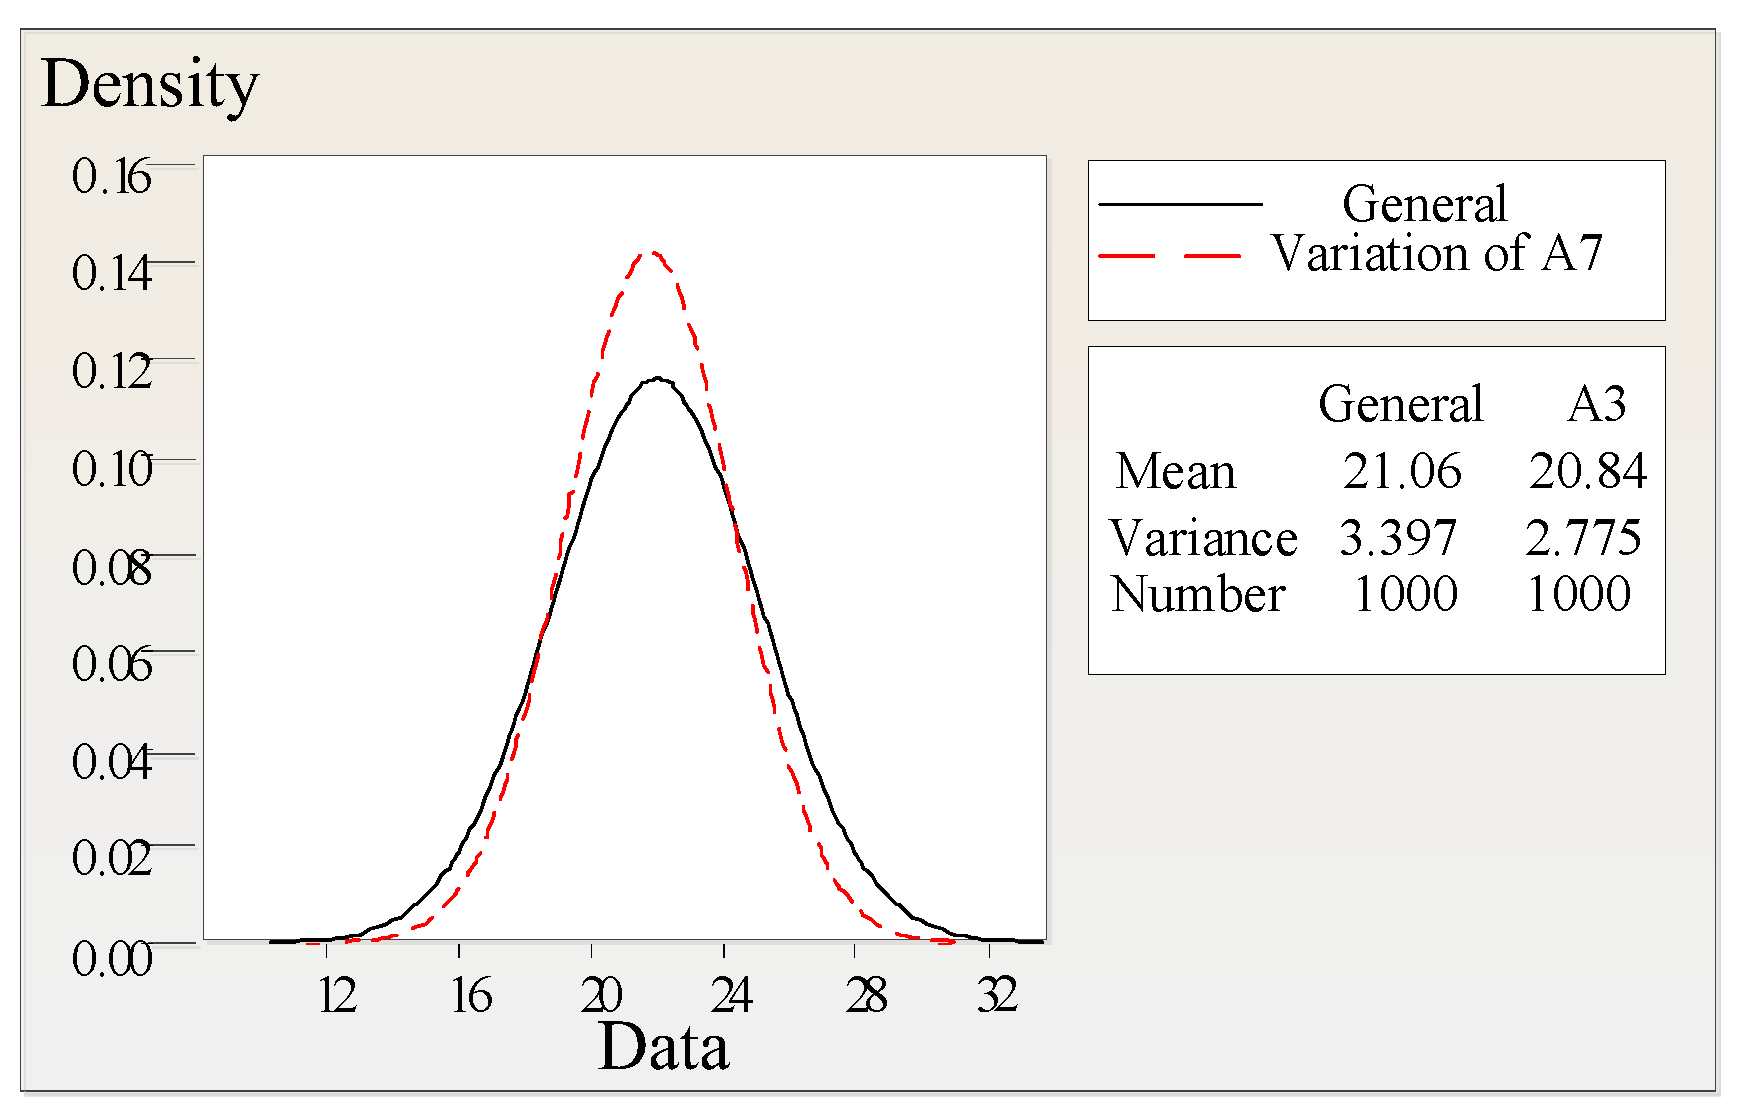
Next, the effect on the system time of one activity’s variance fluctuation can be compared and the mean and variance of system total time can be simulated after the variances of each activity changed. The variance change of and affecting the total time is shown in Figure 9 and Figure 10. Obviously, the variance in and does not change the mean of total time much, but the variance grows significantly larger. In order to better compare the variance importance of all activities, this article computes the effect on the variance of system total time of the variance of each activity: UIM index. After statistical analysis, the results are as shown in Table 2.
From Table 2, it is known that the influence of the variances of the nine activities on the mean of the total time is not significant. The variances of and have the greatest impact on the variance of system total time, reaching 67.25% and 49.87%, respectively, with , , and following behind. Only 9.49% of the impact is from , while , , and can be neglected.
A comparison of UIM indexes and results from the three methods is given in Table 3, in which Monte Carlo simulation obtains the most detailed analysis results. The importance values calculated by some activities are very close in mathematical analysis methods and Taguchi tolerance design, so activities are only divided into three types: The most important activities are and , with , , and following behind, along with , , , and . In Taguchi tolerance design, , , , and have almost no importance at all (a UIM value of zero), while in mathematical analysis, although the UIM values of , , , and are not zero; this method does not make a further division of the activities of the three different importance measures. Monte Carlo simulation results show that is more important than (only from the perspective of UIM values comparison), while is more important than and .
From the results of UIM index, the mathematical method is also the preferred method to assess the criticality of project activities, and with respect to the Taguchi tolerance design method, the mathematical method is not only applicable to PERT networks but more suitable for any stochastic networks that can be converted to standard GERT networks. Thus, compared with Taguchi tolerance design, the mathematical method is more common and easy to transplant. However, after comparing it with the simulation method, Monte Carlo simulation calculates the results more accurately. One reason is the specialty of the case: mathematical analysis makes further calculations after transforming the PERT networks into standard GERT networks. The process involves path probability problems that cannot be solved; the probabilities of paths are obtained by simulation, so it is not a strictly mathematical process. The other reason is that the simulation method is a stochastic sampling method; because of its limited number of simulations, the data convergence is not strong, and this will create differences in the UIM values.
4.3. Identification of Risk Events
According to the ranking results of UIM achieved by Monte Carlo simulation, , , , , and are chosen as activities of interest. The mean of the system is 21.06 and the variance is 11.54. Table 4 shows the failure criterion of this system case, with only the consideration of risk on time dimension; the failure criterion does not take cost and quality into account. Based on the results of critical activity analysis, , , , , and are the subject body of risk event and the type of event is time, as shown in Table 5.
In order to ensure the seriousness of risk events and their ECI values, the Monte Carlo simulation method is used to obtain the ECI indexes and rank the importance of each set of events, as shown in Table 6. Among them, and have the highest ECI values of about 27.3% (error between 27.2% and 27.3% is ignored); their events activities, and , have the highest UIM values. Meanwhile, the UIM values of , , and are about 12% smaller than and ; the ECI values of involved events , , and are also smaller than and and they are close numerically (the difference can be ignored).
From Table 6 the conclusion can be drawn that if an activity is determined as a critical activity in the time dimension (or in the cost or quality dimension), the importance measure of risk events (which makes this activity the subject and time the event type) is relatively high, as well as the UIM values of this activity. In other words, when we identify risk events through critical activity analysis, it is not necessary to simulate and compute ECI indexes with Monte Carlo simulation for judging the importance of risk events, because the ranks of risk events and critical activities relate to each other closely (the more critical the activities are, the higher importance the involved risk events have).
4.4. Generation of Risk Scenarios
After critical activity analysis of GERT network, important risk events can be identified from the UIM of project activities. Based on different combinations of rules, risk scenarios are generated to have a greater impact on the entire system failure risk. Since the systems in this article are small and the quantities of identified events are not high, this article takes a stochastic combined approach to generate a combination of risk scenarios, as shown in Table 7. In practical applications, other methods can be used to add risk preference to generate the corresponding risk scenarios.
From Table 7, the SCI generated by stochastic combinations of risk events is related to its ECI. Table 7 shows SCI values of 26 risk scenarios and the sum of their ECI values, which are analyzed after Monte Carlo simulation (which does not contain the scenarios combined by a single event). This shows that when the sums of ECI are more than 60%, there is a more than 50% probability that would the project system will fail. The higher sum of ECI indicates that according to the risk scenarios SCI is higher. For example, risk scenario is combined with risk events , which are subjected to activities . That means that if activities of the project fail, the whole-project system failure probability is 92.2%. So, when project managers are assessing project risk, the risk scenario is critical. In particular, if activities of the project all fail, corresponding to events , respectively, scenario will occur, and the probability of occurrence of project failure caused by it is 100%. Basically, risk scenarios that contain more critical risk events (namely, higher ECI values of events) or more risk events will have higher SCI indexes.
Based on the above analysis, we can conclude that risk scenarios combined with critical risk events (which refers to the higher ECI index here) are also critical risk scenarios. Therefore, after the “critical activity analysis‒risk event identification‒risk scenario generation” process of risk scenario generation, risk scenarios can be ranked in importance. The ranking results will let project managers know which risk scenarios to focus on.
5. Conclusions
Risk assessment is an important issue affecting the sustainability of economics and management. In this article, we propose a set of importance measurement indexes for activity, event, and risk scenarios in activity-based systems. Then we analyze the importance of critical activities by three different methods. Through computing the UIM indexes of activities, a ranking is obtained so that risk scenarios can be generated for project engineering. Finally, we analyze the SCI and ECI indexes of different risk scenarios and get the critical risk scenarios combinations generated by critical risk events.
After simulation and analysis, we conclude that the three critical activity analysis methods have their advantages and disadvantages. In the Taguchi tolerance design method, the steps are variable and the formulas are complex, so this method is mainly applicable to simple PERT networks with fewer factors (activities). In the mathematical analysis method GERT networks need to be standardized; for a simple standard GERT stochastic network this method is undoubtedly the most effective, but if the activity-based system is really complex, the GERT networks may not be transformed into standard networks directly. Monte Carlo simulation is a common method that, with the help of a computer program, can greatly reduce the human workload and improve the accuracy of the analysis results.
In brief, from the simulation results of the example system in this paper, it is proven that the proposed risk scenario generation method based on importance measurement analysis is effective compared with other methods. It includes three importance measurement indexes (for activity, event, and scenario respectively) during risk scenario simulation processes. Due to the constraints of the generation framework of risk scenarios, the method is much more suitable for activity-based systems, such as maintenance and logistics systems or engineering project systems. When implementing the present method to analyze system risk, a time-related system model should be built before the activity, event, and scenario analysis to describe the system risks. Sometimes it is difficult to abstract various types of systems to a time-related model. Meanwhile, the current importance measurement indexes, UIM, ECI, and SCI, all work on just one dimension of system failure (time, cost, or quality), which indicated by the variance of system parameters. In future work, the covariance could be considered to represent a multi-parameter importance measurement.
Author Contributions
X.P. supervised the finding of this work. L.H. developed the theory. Z.X. wrote the manuscript with input from all authors. S.Z. conceived of the presented idea. Y.L. planned and carried out the simulations. Y.W. performed the computation. All authors discussed the results and contributed to the final manuscript.
Funding
This research was funded by the National Natural Science Foundation of China grant number 71171008 and 71571004, the National Key Research and Development Program of China, and the Special Scientific Research Project for Civil Aircraft of the Ministry of Industry and Information Technology of China.
Conflicts of Interest
The authors declare no conflicts of interest.
References
- Anderson, D.R.; Anderson, K.E. Sustainability risk management. Risk Manag. Insur. Rev. 2009, 12, 25–38. [Google Scholar] [CrossRef]
- Miguel, A.; Contreras, J. Risk-constrained optimal bidding strategy for pairing of wind and demand response resources. IEEE Trans. Smart Grid 2017, 8, 200–208. [Google Scholar]
- Aven, T.; Zio, E. (Eds.) Knowledge in Risk Assessment and Management; John Wiley & Sons: Hoboken, NJ, USA, 2018. [Google Scholar]
- Goerlandt, F.; Khakzad, N.; Reniers, G. Validity and validation of safety-related quantitative risk analysis: A review. Saf. Sci. 2017, 99, 127–139. [Google Scholar] [CrossRef]
- Huan, Z.; Taal, A.; Koulouzis, S.; Wang, J.; Hu, Y.; Suciu, G.; Poenaru, V.; de Laat, C.; Zhao, Z. Dynamic Real-Time Infrastructure Planning and Deployment for Disaster Early Warning Systems. In Proceedings of the International Conference on Computational Science, Melbourne, VIC, Australia, 2–5 July 2018; Springer: Cham, Switzerland, 2018; pp. 644–654. [Google Scholar]
- Weidenhaupt, K.; Pohl, K.; Jarke, M.; Haumer, P. Scenarios in system development: Current practice. IEEE Softw. 1998, 15, 34–45. [Google Scholar] [CrossRef]
- Greenyer, J.; Gritzner, D.; Gutjahr, T.; König, F.; Glade, N.; Marron, A.; Katz, G. ScenarioTools—A tool suite for the scenario-based modeling and analysis of reactive systems. Sci. Comput. Program. 2017, 149, 15–27. [Google Scholar] [CrossRef]
- Li, J.H.; Kang, R.; Mosleh, A.; Pan, X. Simulation-based automatic generation of risk scenarios. J. Syst. Eng. Electron. 2011, 22, 437–444. [Google Scholar] [CrossRef] [Green Version]
- Epstein, S.; Rauzy, A. Can we trust PRA? Reliab. Eng. Syst. Saf. 2005, 88, 195–205. [Google Scholar] [CrossRef]
- Dutuit, Y.; Rauzy, A. Efficient Algorithms to Assess Component and Gate Importance in Fault Tree Analysis. Reliab. Eng. Syst. Saf. 2001, 72, 213–222. [Google Scholar] [CrossRef]
- Jarke, M.X.; Bui, T.; Carrol, J.M. Scenario management: An interdisciplinary approach. Requir. Eng. 1998, 3, 155–173. [Google Scholar] [CrossRef]
- Ökmen, Ö.; Öztaş, A. Scenario based evaluation of a cost risk model through sensitivity analysis. Eng. Construct. Arch. Manag. 2015, 22, 403–423. [Google Scholar] [CrossRef]
- Kaplan, S.; Haimes, Y.Y.; Garrick, B.J. Fitting hierarchical holographic modeling into the theory of scenario structuring and a resulting refinement to the quantitative definition of risk. Risk Anal. 2001, 21, 807–819. [Google Scholar] [CrossRef] [PubMed]
- Aven, T. Risk assessment and risk management: Review of recent advances on their foundation. Eur. J. Oper. Res. 2016, 253, 1–13. [Google Scholar] [CrossRef]
- Mercurio, D.; Podofillini, L.; Zio, E.; Dang, V.N. Identification and classification of dynamic event tree scenarios via possibilistic clustering: Application to a steam generator tube rupture event. Accid. Anal. Prev. 2009, 41, 1180–1191. [Google Scholar] [CrossRef] [PubMed]
- Zio, E. Integrated deterministic and probabilistic safety assessment: Concepts, challenges, research directions. Nuclear Eng. Des. 2014, 280, 413–419. [Google Scholar] [CrossRef]
- Tourki, Y.; Keisler, J.; Linkov, I. Scenario analysis: A review of methods and applications for engineering and environmental systems. Environ. Syst. Decis. 2013, 33, 3–20. [Google Scholar] [CrossRef]
- Duinker, P.N.; Greig, L.A. Scenario analysis in environmental impact assessment: Improving explorations of the future. Environ. Impact Assess. Rev. 2007, 27, 206–219. [Google Scholar] [CrossRef]
- Van der Heijden, K. Scenarios: The Art of Strategic Conversation; Wiley: Hoboken, NJ, USA, 2005. [Google Scholar]
- Podofillini, L.; Zio, E.; Mercurio, D.; Dang, V.N. Dynamic safety assessment: Scenario identification via a possibilistic clustering approach. Reliab. Eng. Syst. Saf. 2010, 95, 534–549. [Google Scholar] [CrossRef]
- Li, J.H.; Mosleh, A.; Kang, R. Likelihood ratio gradient estimation for dynamic reliability applications. Reliab. Eng. Syst. Saf. 2011, 96, 1667–1679. [Google Scholar] [CrossRef]
- Borgonovo, E. A new uncertainty importance measure. Reliab. Eng. Syst. Saf. 2007, 92, 771–784. [Google Scholar] [CrossRef]
- Borgonovo, E.; Plischke, E. Sensitivity analysis: A review of recent advances. Eur. J. Oper. Res. 2016, 248, 869–887. [Google Scholar] [CrossRef]
- Saltelli, A. Sensitivity analysis for importance assessment. Risk Anal. 2002, 22, 579–590. [Google Scholar] [CrossRef] [PubMed]
- Liu, Q.; Homma, T. A new computational method of a moment-independent uncertainty importance measure. Reliab. Eng. Syst. Saf. 2009, 94, 1205–1211. [Google Scholar] [CrossRef]
- Zhang, L.; Lu, Z.; Cheng, L.; Fan, C. A new method for evaluating Borgonovo moment-independent importance measure with its application in an aircraft structure. Reliab. Eng. Syst. Saf. 2014, 132, 163–175. [Google Scholar] [CrossRef]
- Borgonovo, E.; Aliee, H.; Glaß, M.; Teich, J. A new time-independent reliability importance measure. Eur. J. Oper. Res. 2016, 254, 427–442. [Google Scholar] [CrossRef]
- Konstantinos, K.; Kapetanaki, A.; Levi, V. Optimal demand response scheduling with real-time thermal ratings of overhead lines for improved network reliability. IEEE Trans. Smart Grid 2017, 8, 2813–2825. [Google Scholar]
- Dui, H.; Si, S.; Yam, R.C. A cost-based integrated importance measure of system components for preventive maintenance. Reliab. Eng. Syst. Saf. 2017, 168, 98–104. [Google Scholar] [CrossRef]
- Shi, Y.; Lu, Z.; Zhou, Y. Global sensitivity analysis for fuzzy inputs based on the decomposition of fuzzy output entropy. Eng. Optim. 2018, 50, 1078–1096. [Google Scholar] [CrossRef]
- Elmaghraby, S.E.; Fathi, Y.; Taner, M.R. On the Sensitivity of Project Variability to Activity Mean Schedule. Int. J. Prod. Econ. 1999, 62, 219–232. [Google Scholar] [CrossRef]
- Williams, T.M. Criticality in stochastic networks. Oper. Res. 1992, 43, 353–357. [Google Scholar] [CrossRef]
- Vanhoucke, M. On the dynamic use of project performance and schedule risk information during projecttracking. Omega 2011, 39, 416–426. [Google Scholar] [CrossRef]
- Cho, J.G.; Yum, B.J. An uncertainty importance measure of activities in PERT networks. Int. J. Prod. Res. 1997, 35, 2737–2757. [Google Scholar] [CrossRef]
- Elmaghraby, S.E. Invited Review On criticality and sensitivity in activity networks. Eur. J. Oper. Res. 2000, 127, 220–238. [Google Scholar] [CrossRef]
- Lin, Y.M.; Pan, X. Study on Risk Scenarios of Project Failure Based on Monte-Carlo Simulation. In Proceedings of the IEEE 18th International Conference on Industrial Engineering and Engineering Management, Changchun, China, 3–5 September 2011; pp. 1291–1295. [Google Scholar]
- Oisen, R.P. Can project management be defined? Proj. Manag. Q. 1971, 2, 12–14. [Google Scholar]
- Bahill, T.; Smith, E.D. An Industry Standard Risk Analysis Technique. Eng. Manag. J. 2009, 21, 16–29. [Google Scholar] [CrossRef] [Green Version]
- Wu, Y.; Pan, X.; Kang, R.; He, C.; Gong, L. Multi-parameters uncertainty analysis of logistic support process based on GERT. J. Syst. Eng. Electron. 2014, 25, 1011–1019. [Google Scholar] [CrossRef]
- Smith, D.J. Reliability, Maintainability and Risk: Practical Methods for Engineers; Butterworth-Heinemann: Oxford, UK, 2017. [Google Scholar]
- Helton, J.C.; Davis, F.J. Latin hypercube sampling and the propagation of uncertainty in analyses of complex systems. Reliab. Eng. Syst. Saf. 2003, 81, 23–69. [Google Scholar] [CrossRef] [Green Version]
- Hazır, Ö. A review of analytical models, approaches and decision support tools in project monitoring and control. Int. J. Proj. Manag. 2015, 33, 808–815. [Google Scholar] [CrossRef]
Figure 1.
Scenario box schematic.

Figure 2.
Framework generation of risk scenarios.

Figure 3.
Assessing the influence of the input distribution on the output distribution.

Figure 4.
GERT network simulation framework.

Figure 5.
System risk scenarios simulation flow based on GERT networks.

Figure 6.
A PERT model of a project system.

Figure 7.
The standard GERT network with nodes information in each path.

Figure 8.
Distribution of the total time under normal circumstances.

Figure 9.
Effect of ’s variance on the total time.

Figure 10.
Effect of ’s variance on the total time.


Table 1.
Probability of each path.
| Path | Probability | Path | Probability |
|---|---|---|---|
Table 2.
Contrast of impact on system total time of the variance of each activity.
| Activity Name | Variance of Activity Time Is 0 | Variance of Activity Time Is Specific Value | ||
|---|---|---|---|---|
| Mean | Variance | Change of Mean | Change of Variance | |
| 21.165 | 9.94 | −0.50% | 16.10% | |
| 21.024 | 11.53 | 0.17% | 0.09% | |
| 21.18 | 6.90 | −0.57% | 67.25% | |
| 21.09 | 10.54 | −0.14% | 9.49% | |
| 21.21 | 10.10 | −0.71% | 14.26% | |
| 21.11 | 11.54 | −0.24% | 0.00% | |
| 20.84 | 7.70 | 1.06% | 49.87% | |
| 20.67 | 11.31 | 1.89% | 2.03% | |
| 21.08 | 9.96 | −0.09% | 15.86% | |
Table 3.
Activities UIM results comparison of three methods.
| Activity | Monte Carlo Simulation | Mathematical Analysis | Taguchi Tolerance Design | |||
|---|---|---|---|---|---|---|
| UIM Values (%) | Rank of UIM | UIM Values (%) | Rank of UIM | UIM Values (%) | Rank of UIM | |
| 1 | 13.86 | 3 | 13.5382 | 2 | 14.29 | 2 |
| 2 | 0.09 | 7 | 0.0749 | 3 | 0 | 3 |
| 3 | 40.21 | 1 | 26.9273 | 1 | 28.57 | 1 |
| 4 | 8.67 | 5 | 0.0749 | 3 | 0 | 3 |
| 5 | 12.48 | 4 | 13.464 | 2 | 14.29 | 2 |
| 6 | 0.00 | 7 | 0.0749 | 3 | 0 | 3 |
| 7 | 33.28 | 2 | 26.9273 | 1 | 28.57 | 1 |
| 8 | 1.99 | 6 | 0.0749 | 3 | 0 | 3 |
| 9 | 13.69 | 3 | 13.5382 | 2 | 14.29 | 2 |
Table 4.
Failure criterion of the system.
| Criterion Type | Expectation | Failure Determination |
|---|---|---|
| time | 21 | T > 25.2 |
Table 5.
Identification results of risk events based on critical activity analysis.
| Risk Events | Subject | Type | Content |
|---|---|---|---|
| time | t > 7.2 | ||
| time | t > 7.2 | ||
| time | t > 4.2 | ||
| time | t > 4.2 | ||
| time | t > 4.2 |
Table 6.
ECI index statistics of risk events.
| Risk Events | Subject | ECI (%) | UIM of Subject (%) |
|---|---|---|---|
| 27.3 | 32.23 | ||
| 27.2 | 32.23 | ||
| 15.6 | 12.07 | ||
| 17.9 | 12.03 | ||
| 17.1 | 12.07 |
Table 7.
Importance analysis of risk scenarios combinations generated by risk events.
| Risk Scenario S | SCI (%) | Sum (ECI) | Risk Scenario S | SCI (%) | Sum (ECI) |
|---|---|---|---|---|---|
| 100 | 105.1 | 58.6 | 60 | ||
| 91.8 | 89.5 | 57.2 | 59.9 | ||
| 92.2 | 88 | 58.2 | 54.5 | ||
| 92.2 | 87.2 | 60.6 | 50.6 | ||
| 73.2 | 77.9 | 35.4 | 45.2 | ||
| 75.2 | 77.8 | 31.6 | 45.1 | ||
| 79.2 | 72.4 | 36 | 44.4 | ||
| 77.2 | 71.6 | 37.4 | 44.3 | ||
| 75.8 | 70.1 | 42 | 42.8 | ||
| 53.6 | 62.3 | 37.2 | 42.9 | ||
| 55.4 | 62.2 | 32.2 | 35 | ||
| 54.8 | 60.8 | 34.4 | 33.5 | ||
| 55.6 | 60.7 | 37.6 | 32.7 |
© 2018 by the authors. Licensee MDPI, Basel, Switzerland. This article is an open access article distributed under the terms and conditions of the Creative Commons Attribution (CC BY) license (http://creativecommons.org/licenses/by/4.0/).
Share and Cite
MDPI and ACS Style
Pan, X.; Hu, L.; Xin, Z.; Zhou, S.; Lin, Y.; Wu, Y. Risk Scenario Generation Based on Importance Measure Analysis. Sustainability 2018, 10, 3207. https://doi.org/10.3390/su10093207
AMA Style
Pan X, Hu L, Xin Z, Zhou S, Lin Y, Wu Y. Risk Scenario Generation Based on Importance Measure Analysis. Sustainability. 2018; 10(9):3207. https://doi.org/10.3390/su10093207
Chicago/Turabian StylePan, Xing, Lunhu Hu, Ziling Xin, Shenghan Zhou, Yanmei Lin, and Yong Wu. 2018. "Risk Scenario Generation Based on Importance Measure Analysis" Sustainability 10, no. 9: 3207. https://doi.org/10.3390/su10093207
Note that from the first issue of 2016, this journal uses article numbers instead of page numbers. See further details here.