Multi-Criteria Life Cycle Approach to Develop Weighting of Sustainability Indicators for Pavement


Department of Civil Engineering, National Cheng Kung University, Tainan City 701, Taiwan
*
Author to whom correspondence should be addressed.
Sustainability 2018, 10(7), 2325; https://doi.org/10.3390/su10072325
Submission received: 26 April 2018
/
Revised: 29 June 2018
/
Accepted: 2 July 2018
/
Published: 5 July 2018
(This article belongs to the Special Issue Sustainability in Transportation and the Built Environment)
Abstract
:In the past decade, sustainable practices have been adopted in transportation infrastructure projects to reduce adverse environmental effects. To evaluate the sustainability levels of engineering projects holistically, rating systems have been developed to assess and reward points based on various sustainable best practices (indicators). This study aimed to establish a systematic methodology to weight indicators related to materials and resources most commonly used by various transportation infrastructure rating systems based on their contributions to sustainability. A multi-criteria approach for assessing the indicators based on three criteria, indicator performance, environment, and cost, was designed. The criteria were then used to evaluate the indicators and assessed points based on their contributions toward sustainability. Results revealed that state-of-the-art engineering practices could differentiate weighting of points from the typical linear point increase that is traditionally used. In addition, a maximum cap is crucial to ensure that some indicators do not end up being weighted disproportionately.
1. Introduction
The transportation infrastructure system is crucial for a country because it supports the flow of goods and connects the social fabric of cities. To build up such network, road infrastructure projects consume immense amounts of energy and resources every year and have been responsible for emitting considerable amounts of greenhouse gases into the environment. The study by the United States Environmental Protection Agency (USEPA) estimated that in 2015 the transportation sector accounts for 27% of all emissions in the USA [1]. The roadway transportation accounts for 90-95% of the transport sector’s GHG emissions in the world and, in Asia the road construction represented 37% of manmade GHG emissions in 2005 [2]. Therefore, many developed countries are attempting to implement initiatives or policies that identify sustainability as a metric and quantify performance [3,4]. The initiatives also consider the engineering sector and its impact on sustainability. Sustainable design can be applied to engineering projects thereby allowing infrastructure systems to maintain economic, environmental, and social sustainability.
Over the past two decades, in the building sector, the design of sustainable buildings has progressed substantially with the help of rating system tools such as Leadership in Energy and Environmental Design (LEED) in the US and EEWH Green Building Evaluation System in Taiwan to assess sustainability performance [5,6]. Meanwhile, some infrastructure sustainability rating systems have gradually emerged in the past decade such as Greenroads, Invest, Envision, I-Last, GreenLITES, and CEEQUAL [7,8,9,10,11,12]. Those sustainability rating systems feature a list of best practices in the form of indicators with a common evaluation metric. The evaluation metric could be ecology-based, equity-based, life cycle costing (LCC)-based, life cycle assessment (LCA)-based, noise-based, and urban heat island effect-based, etc. [7]. Though, some of these evaluation metrics are not easily quantifiable. Among those, LCC-based and LCA-based weighting presented the most definable approach with direct, quantifiable results. For example, in the Greenroads Rating System, LCA was used as weighting to evaluate the environmental impact of the indicators [7]. Typical findings from road infrastructure LCA studies show that construction activities have the lowest impact on sustainability and therefore those related indicators in the Greenroads scheme were given one point [7,13,14].
Numerous studies have reported LCA and LCC of road infrastructure [15,16,17,18]. LCA has been used to quantify the environmental impact due to road construction, operation, maintenance, and rehabilitation activities [19,20,21,22,23,24,25]. Harvey et al. have presented a state-of-the-art pavement life-cycle assessment framework on the overall approach, methodology, system boundaries of pavement LCA [26]. On the other hand, LCC is commonly used to quantify the long-term economic impact of various infrastructure design, construction, rehabilitation, maintenance, and operation alternatives [27,28]. The FHWA has outlined the framework and developed software tools of the LCC analysis for pavements application [8,29]. Furthermore, LCC was used along with LCA to evaluate cost-effectiveness for selecting highway pavement designs [30]. Gschösser and Wallbaum also presented a similar study for concrete, composite, and asphalt pavements [31]. LCA and LCC together can determine the cost of a project regarding its environmental impacts that are the excellent tool to assess the sustainability level of the indicators in an infrastructure sustainability rating system. The remaining issue is that LCA and LCC have different units and cannot simply add to each other.
The problem of combining attributes with different properties arises when performing multi-criteria assessments. Several solutions have been proposed in the literature, with Giutozzi et al. using a method of rescaling each criterion from different assessments as a unitless ratio between zero and one and then summing each rescaled criterion with a criterion weight to determine the best alternative for evaluating a variety of pavement maintenance strategies over 50 years [32]. Once a multi-attribute evaluation has been proposed, the weighting among its various criteria based on the preferences must be established. Comparing the preferences is essential because different solutions are perceived as optimal by different stakeholders. Smith and Tighe used the analytical hierarchy process (AHP) as a tool to determine user preferences for pavement rehabilitation activities [33]. Stakeholders were surveyed about their preferences regarding road maintenance and their related criteria. These preferences were evaluated using AHP to assess what was considered most significant by stakeholders and other alternatives.
In the most sustainable transportation rating system, the weighting is usually expressed as scores or points and gives value to the indicator. The point values for all indicators are assigned differently in each rating system. Weightings established by rating systems may typically refer to other rating systems, literary sources, or expert questionnaires and surveys. Little studies have focused on how these indicators are weighted against the common metric. For instance, in the Greenroads rating system, weightings of the indicators related to “Materials and Resources” were based on the extensive literature review of pavement LCA studies [7]. However, most studies focusing on pavement LCA are project-specific, and the conclusions cannot be generalized outside the defined scope of the LCA, resulting in a disparity in their findings. In order to support the on-going research to develop the sustainable transportation infrastructure management system (STIMS), which is a sustainable infrastructure rating tool, for the Construction Planning Agency Ministry of Interior of Taiwan, it is necessary to establish a rational way to determine the weightings of the indicators in the rating system to reflect better designed and higher impact. This study aims to investigate how to distribute weightings or scores within and among indicators. A multi-criteria assessment was established for the indicator associated with material and resource by identifying and ranking their impacts regarding performance, environment, and economy. Scenarios tailored for each indicator were created to determine their effects using a life-cycle perspective for weighting.
2. Research Methodology
The top four indicators related to materials and resources in roadway engineering that were most prevalent in the rating systems (namely recycled materials, reuse of materials, local materials, long life design) were selected for further study, as shown in Table 1 [7,8,9,10,11,12]. A 1-km typical urban road project located in Taiwan was used as a scenario and its impact based on various conditions that fulfilled the indicator requirements was determined. The environmental impact was evaluated using LCA, which calculates impact based on the impact assessment category of the global warming potential (GWP). The economic impact was measured through LCC analysis based on project costs. The performance was measured by determining the magnitudes that indicators require to achieve their objectives. These three impact values were normalized and then used to establish two tiers of weighting. The normalized values were used to establish a relative weight between each indicator and its own scenario conditions and an overall weight for weighting all indicators with respect to each other. The overall weight determines the total number of points that can be given to an indicator, whereas a relative weight establishes how many points can be divided among the total points assigned by the overall weight.
2.1. Life-Cycle Assessment
LCA is a framework that uses a quantitative approach to evaluate the environmental impact that was for the impact studies. The LCA framework has become a flexible tool that can be used for comparing products and their alternatives, as well as identifying improvements that can be made to products. As a tool, it can generate a comprehensive list of relevant items, including emissions, waste, energy, water, and natural resource usage. The life cycle approach ensures that any changes made to improve a certain aspect does not create long-term negative impacts. Thus, LCA allows a holistic strategy for identifying strategies to reduce environmental impact. The foundations of the LCA framework have been recognized by the ISO 14040 series. The fundamental concepts outline the principles, framework, requirements, and guidelines [34,35].
Material and resource related indicators were applied to evaluate the life-cycle environmental impacts associated with a typical 1-km-long urban road characterized based on various project conditions. These impacts were quantified using process-based LCA. The process-based LCA is modeled such that each product is made up of a series of unit processes. Each unit process has inputs and outputs that have environmental effects and can be related to each other. The interrelationship that forms these processes that make up a product can be formulated using matrix algebra to sum up all the environmental effects [36].
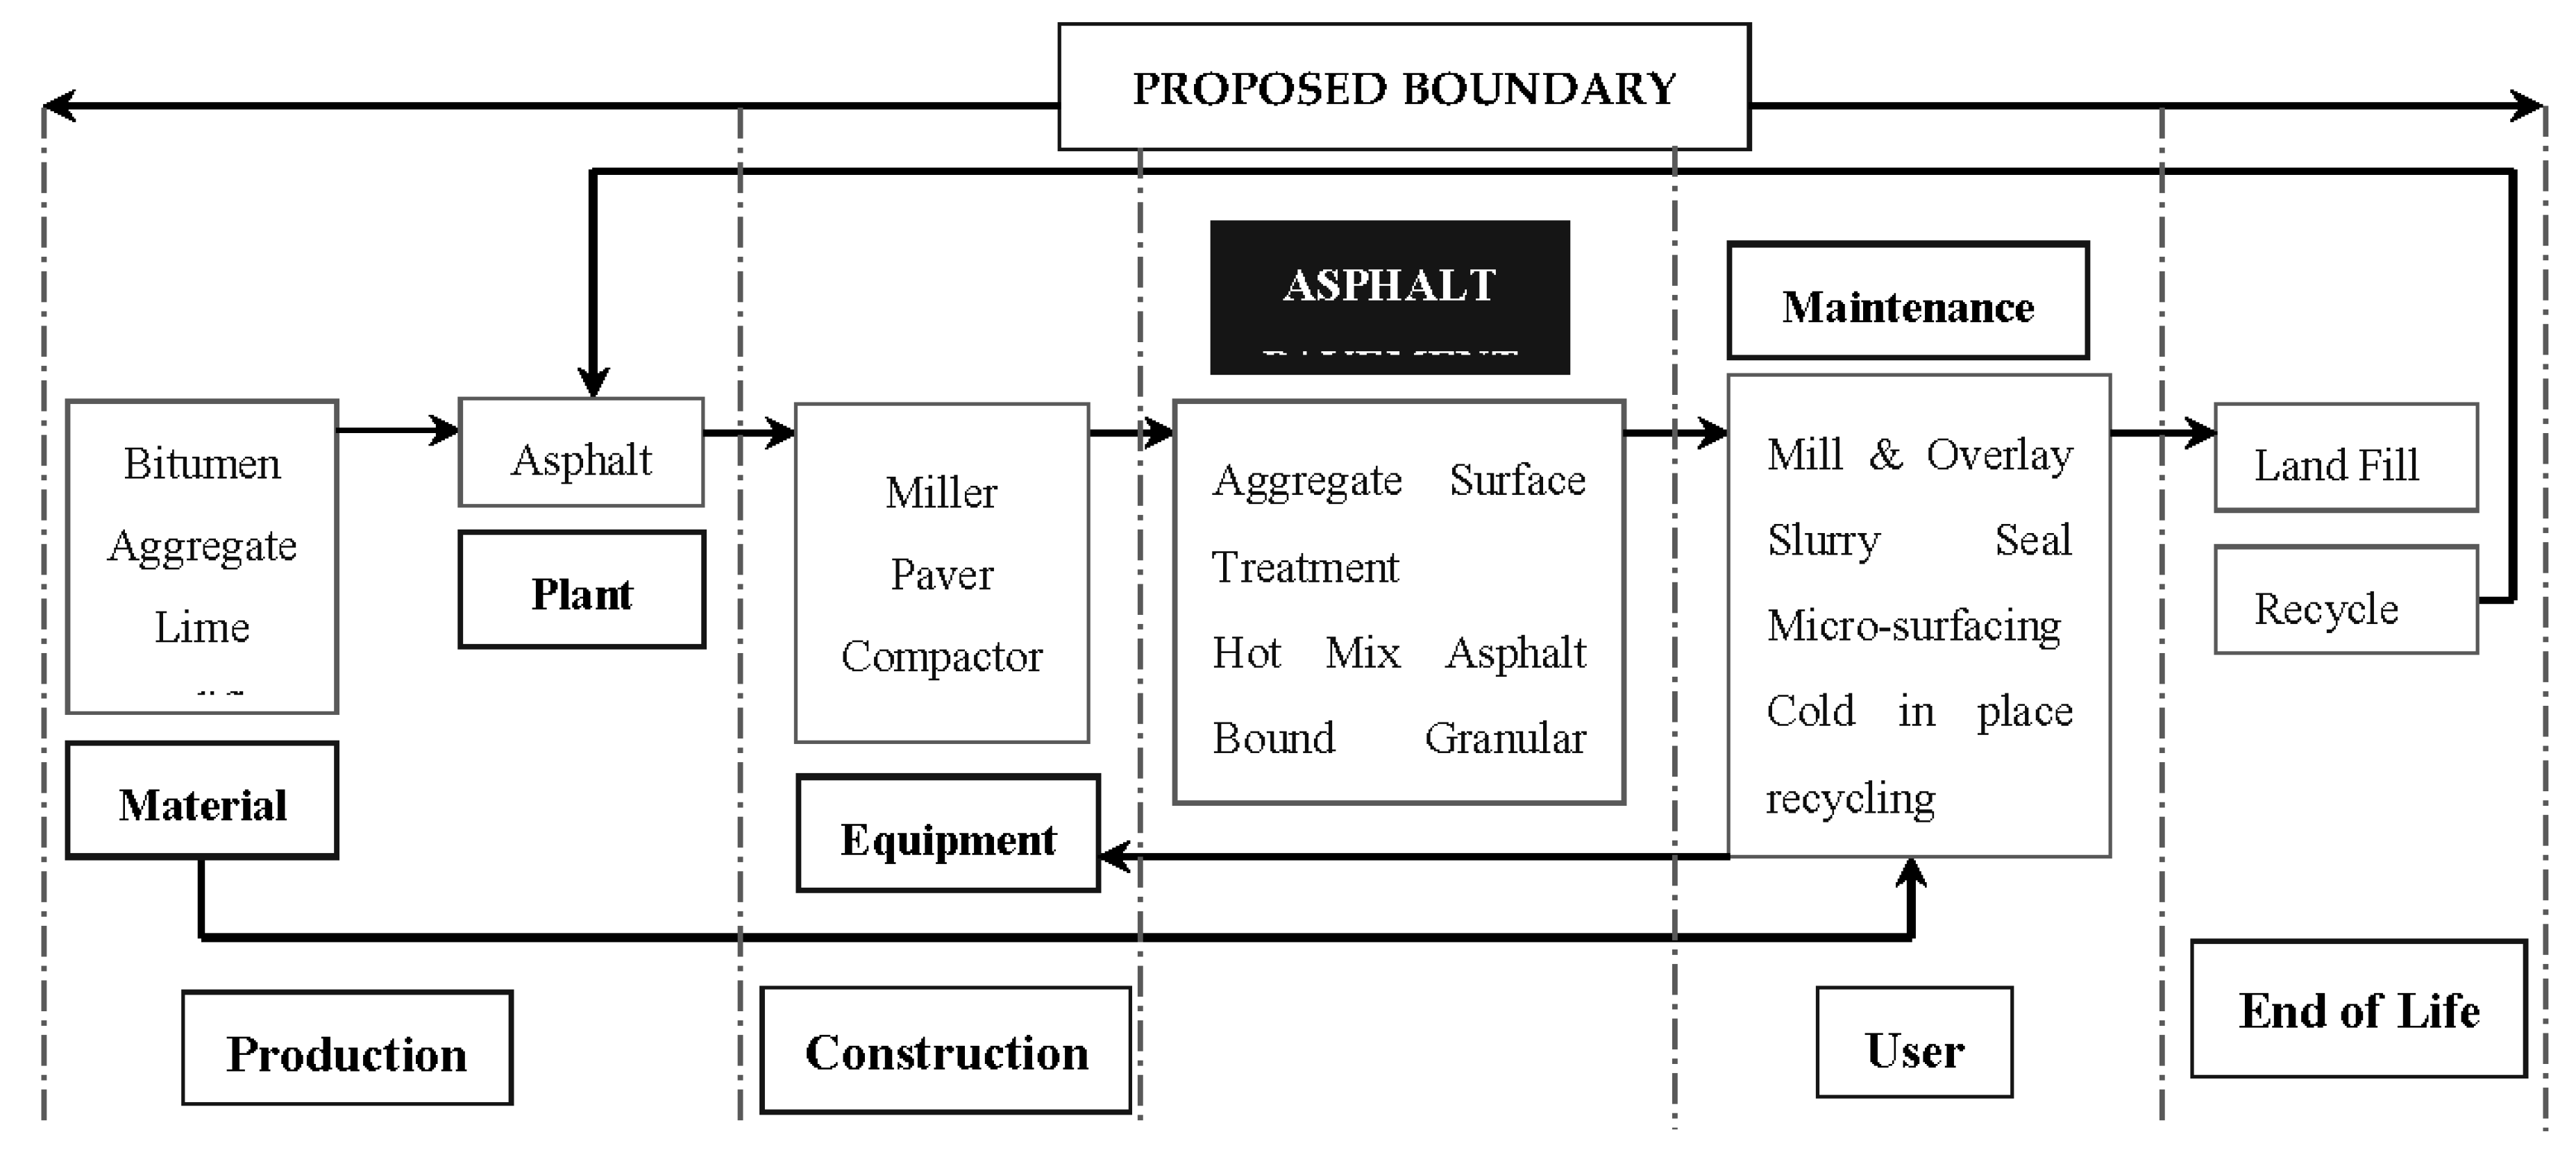
The process map shown in Figure 1 presents the boundaries and scopes of the various processes that make up the project divided into life-cycle stages. The figure presents an aggregated display of all the processes deemed for all the indicators studied. Some processes may only pertain to certain indicators. For example, the local material indicator only considers transportation impacts due to initial construction per its scope. From a life cycle perspective, a different boundary is established for each indicator. Each indicator varies between processes, and, by extension, each indicator most varies where its impact occurs in the life cycle stages. In addition, in some cases, some processes at certain life-cycle stages may be considered equally impactful for different scenarios and are therefore not calculated. For example, different projects may use different percentages of reclaimed asphalt pavement (RAP) in pavement design, but they are all assumed to apply the same construction methods. Since the asphalt mixture contains RAP requires to fulfill same construction and performance specification thus work efficiency (energy consumption) of the construction equipment are considered to be equal; differences do not need to be considered as they would negate each other when compared.
One severe disadvantage of process-based LCA is the exhaustive data required for every product. In this study, LCA was accomplished by incorporating data from various sources. For emissions due to raw materials, these data sources came from two commercially available LCA software databases namely GaBi (Ganzheitliche Bilanz) and SimaPro Life Cycle Assessment Softwares, which offer cradle to gate emission information for various raw construction materials. The databases provided many options for impact assessment. For this study, the assessment method specified in the Tools for Reduction and Assessment of Chemicals and Other Environmental Impacts (TRACI) by USEPA was used. A unified impact assessment method must be chosen because of the complexity of impact category indicator environmental mechanisms. ISO requires the use of impact category indicators based on science-based environmental mechanisms [34,35]. However, different impact assessment methods tend to result in different impact categorization factors, and there is currently no consensus regarding this subject.
2.2. Life-Cycle Cost Analysis
Unlike LCA, LCCA has been extensively used in pavements with an established procedure. The goal of using LCCA is to evaluate economic impacts of the various products. LCCA on its own can be used to compare alternative designs and evaluate the required payback periods for proposed designs. Whereas LCA quantifies the environmental effects, LCCA provides the economic effects. In conjunction with LCA, LCCA can determine the required costs associated with environmental alternatives.
The LCA framework has only been established on a general level by ISO 14040, while the LCCA framework for pavements has been specifically established by the Federal Highway Administration (FHWA). The software was developed based on best practice methods adopted by the FHWA. These practices were implemented to successfully streamline protocols and provide adequate results. The LCCA process involves establishing design alternatives, determining activity timing, and estimating associated costs at the agency and user level. LCCA in Pavement Design and FHWA LCCA Primer contain the bases of the agency and user costs as well as the LCCA framework [8,29]. The agency costs involve initial construction, periodic maintenance, and rehabilitation activities. User costs include the vehicle operation costs, the traffic delay costs, and the accident costs. Incorporating the traffic delay costs associated with construction and maintenance activities or vehicle operation cost savings due to improved pavement conditions into LCCA analysis remains a challenging issue that is full of uncertainties [37]. Also, uncertainties exist between agency activities and accident rate or vehicle operating cost [32]. The primary issue is that even greater uncertainties exist when the LCA of user cost activities was evaluated. Because the FHWA framework for LCCA was established in the early 2000s prior to the establishment of LCA, no environmental inputs or outputs were considered in its framework. Therefore, to translate user cost related activities into LCA analysis requires a considerable amount of additional data and assumptions, which was out of the scope of this study. The LCCA in this study is used in conjunction with LCA to compare the alternatives. If the service lives and analysis periods are equal for both tools, then the differential costs calculated by LCCA can be used given the two use the same life cycle perspective. Therefore, in order to coincide the analysis boundary between LCA and LCCA analysis, the user costs activities were excluded in this study.
The LCCA period was set to 50 years in this study. Various maintenance activities were estimated over the analysis period. Because the costs of maintenance activities were spent at different times, they could not be simply added up. The costs were therefore discounted to a common point in time. Several economic methods exist for converting future costs into present values. The FHWA LCCA framework for pavement uses the net present value (NPV) and equivalent uniform annual cost (EUAC), which were both used in this study.
The EUAC converts all project costs into a uniform recurring annual cost over the analysis period. The NPV discounts all costs assumed to occur at the beginning of an analysis period. Although both EUAC and NPV are similar in that they use a real discount rate to convert future costs into a common timeframe, they provide different views of the same aspect. For both EUAC and NPV, a discount rate of 4% was used, and costs of various materials were provided by local experts in the industry [29].
Lastly, a salvage value to estimate the residual value of the pavement at the end of the analysis period was used. Currently, no general consensus exists on how to estimate infrastructure salvage values because infrastructure projects are never terminated at the end of an analysis period [38]. One approach utilizes estimating the cost of demolition and value of the recycled project wastes. The disadvantage of this approach is sometimes the value of recycled waste is used for another project resulting in double counting of the benefits of the recycled materials. In this study, the relative value of the remaining serviceability was considered with respect to the cost of the last performed maintenance activity.
2.3. Indicator Performance
The performance was the third criteria used to assess the indicators. Performance uniquely identifies the magnitudes required by the indicators to achieve their objective. Even though it may seem arbitrary, in this study, the indicator performance was calculated based on the extent that each indicator achieves its objective and was presented as follows.
A. Performance of the recycled material indicator
The baseline scenario (business as usual) of the recycled materials indicator is defined as 0% recycled materials used which is the common practice in the road construction in Taiwan, and the indicator performance is defined as one minus the weight percentage of the recycled materials used in the project as shown in Equation (1). Three scenarios consisting of 20%, 40%, and 60% recycled materials used were analyzed in this study based on the weightings in Greenroads [7].
where: is the total weight of recycled materials (i); . is the total weight of all materials (j) used in a project.
B. Performance of the reused material indicator
Similarly, the baseline scenario of the reused materials indicator is defined as no existing materials or structures are used in the new construction project. The indicator performance is identified as one minus the volume proportion of the existing pavement structures or other structural materials to be used again in the new pavement construction as shown in Equation (2). Three scenarios consisting of 50%, 70%, and 90% reused materials were analyzed in this study.
where: is the total volume of reused materials (i); . is the total volume of all existing pavement structures or other structural materials (j) used in a pavement section.
C. Performance of the local material indicator
For the local material indicator, the baseline worst case scenario refers to that materials are transported from a long distance to the construction site. In this study, the national average goods transport distance of 92 km was used as a baseline scenario. The value was extracted from the “commodity flow survey” performed by the Ministry of Transportation and Communication (MOTC) in Taiwan [39]. Three levels of material weighted percentage of 60%, 75% and 95% and three levels of materials transport distance of 40km, 60km and 100km were analyzed. The indicator performance was calculated based on the combination of the transport distance and percent weight of the material as shown in Equation (3).
where: d1 is the distance required by the indicator (40 km, 60 km, 100 km); % (60%, 75% 95%) is the percentage of materials required to be transported within d1; d2 is the country weighted average distance (92 km).
D. Performance of the long-life design indicator
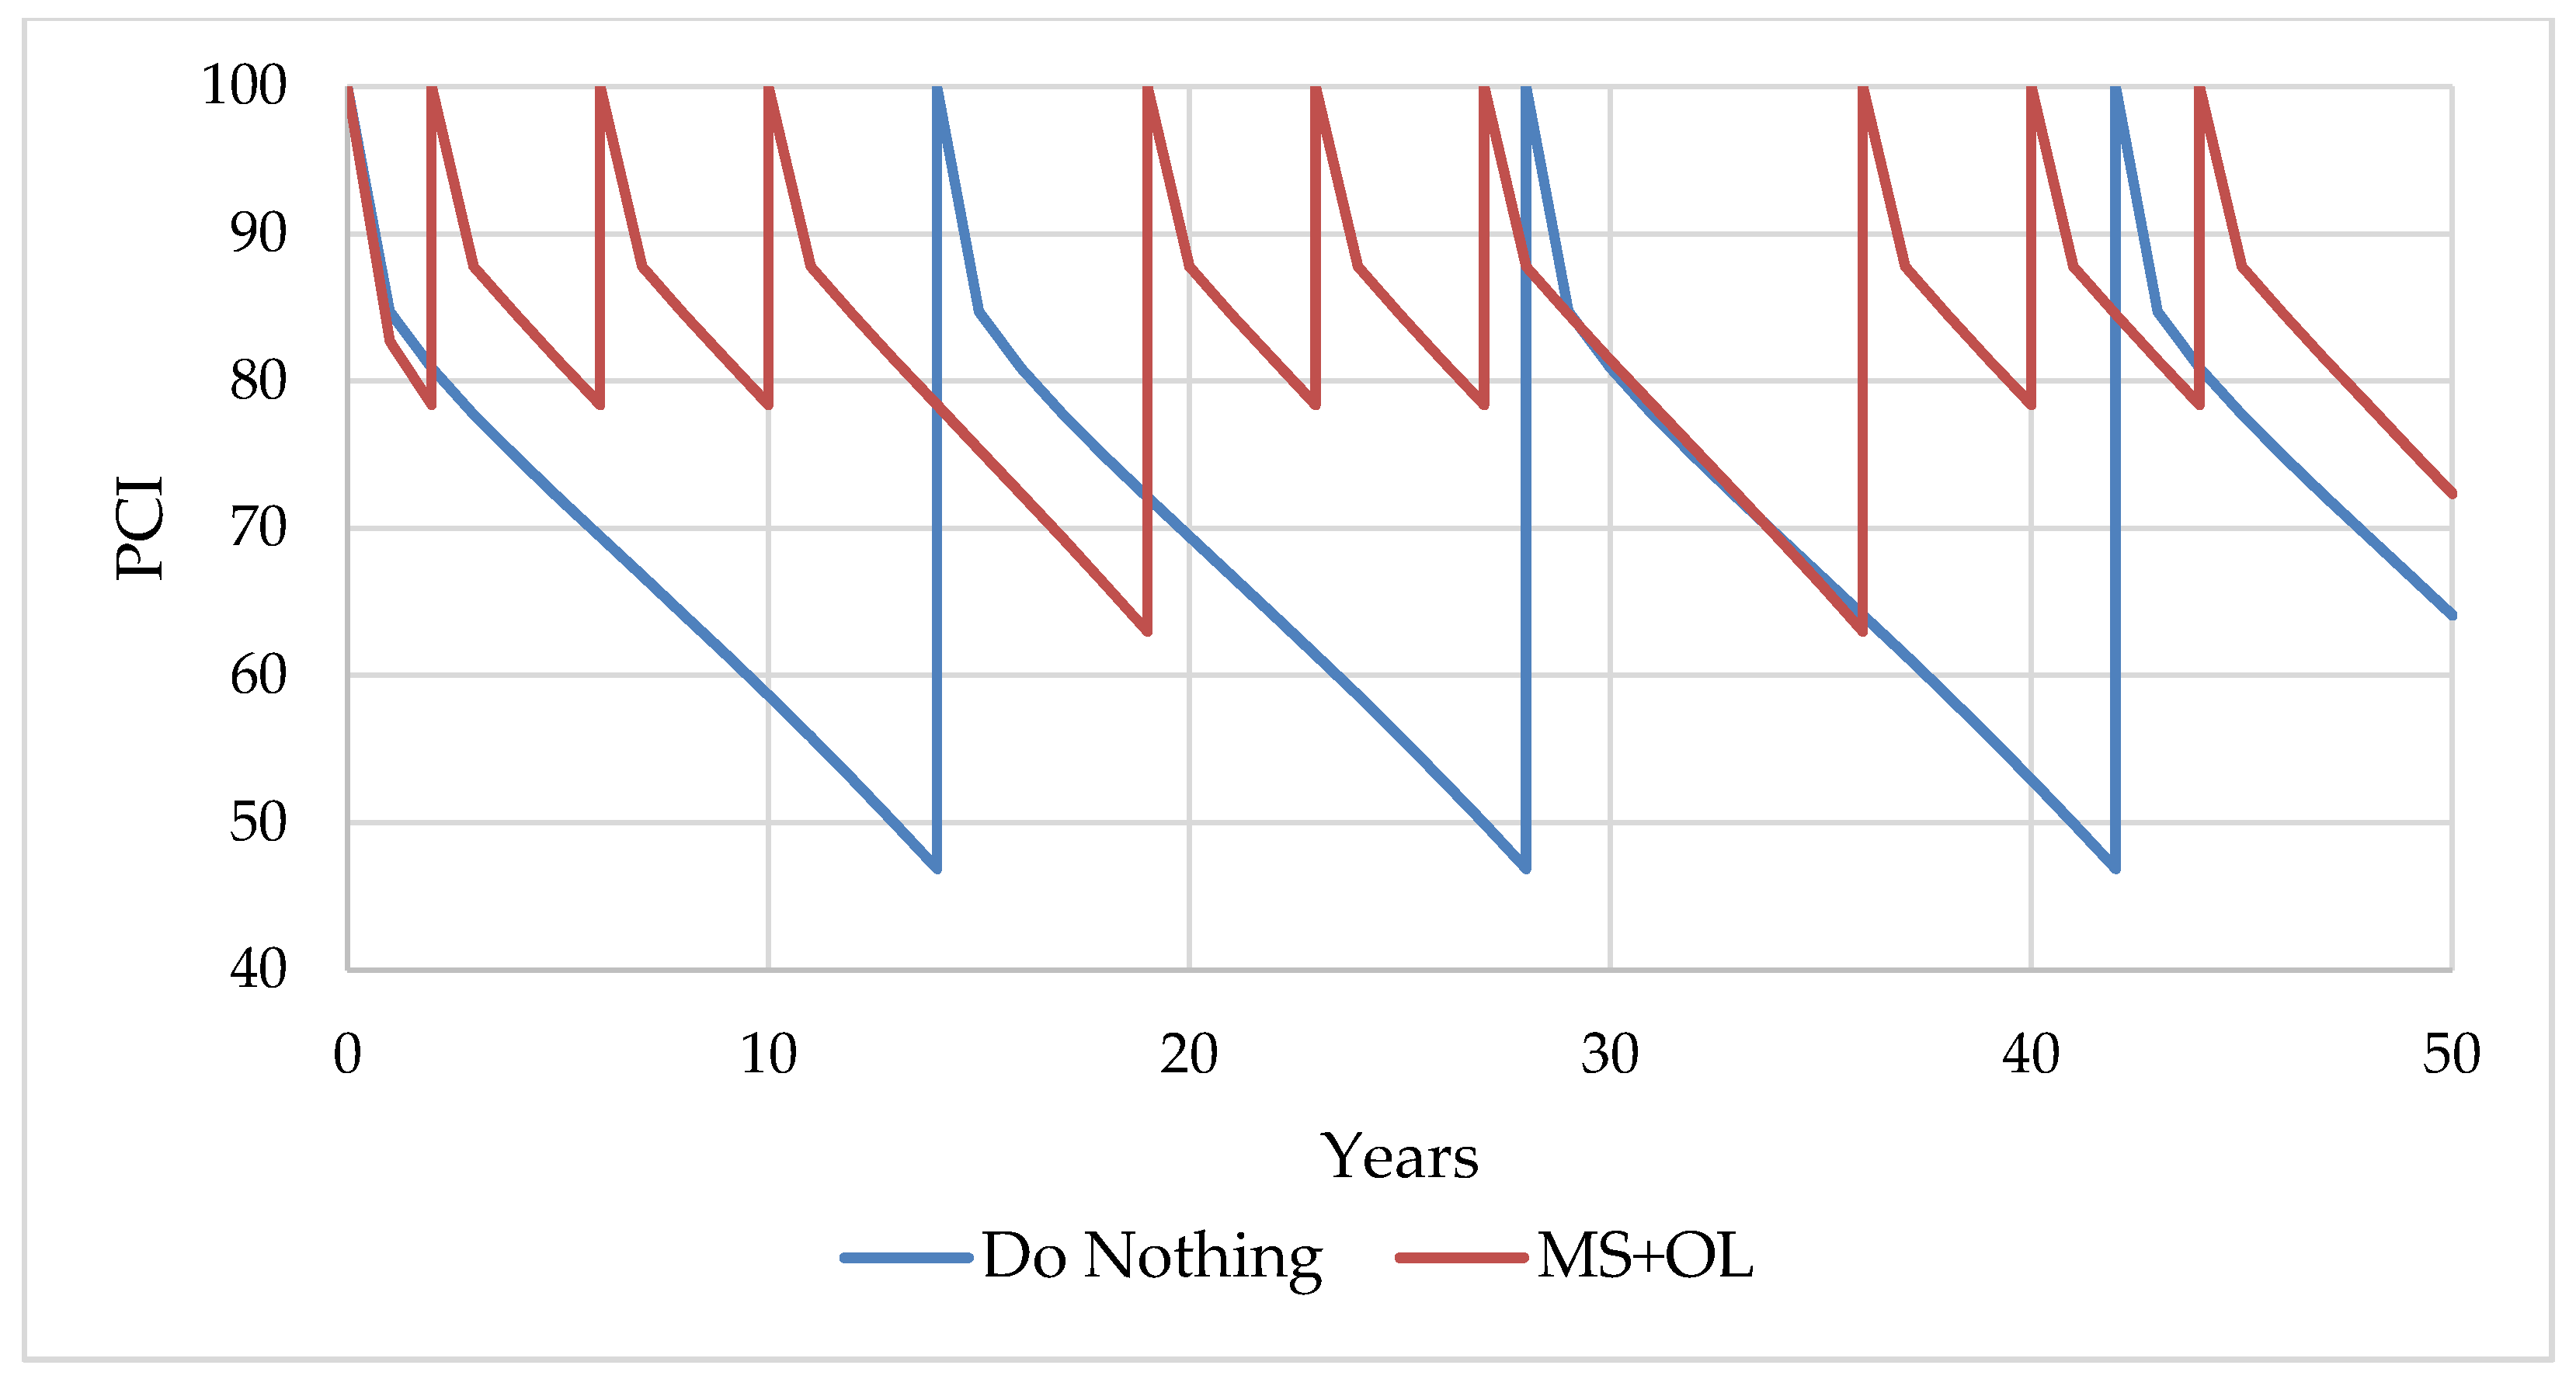
Performance of the long-life design indicator was measured using the area under the curve of a pavement condition index (PCI) vs. pavement life graph. In addition to the initial design of the pavement structure to meet the long-life requirement, five future maintenance strategies were also considered over the 50 years’ analysis period. The baseline scenario was designated as “Do Nothing” which means the future maintenance and rehabilitation (M&R) activities would be triggered when the pavement PCI reached 50. Other scenario includes “overlay (OL) only”, “slurry seal (SS) + overlay (OL)”, “micro-surfacing (MS) + overlay (OL)”, “slurry seal (SS) + cold in-place recycling (CIR)”, and “micro-surfacing (MS) + cold in-place recycling (CIR)” [40,41]. Table 2 summarizes the various scenarios for the long-life pavement design indicators and their associated M&R treatment trigger criteria. The asphalt pavement performance model (PCI vs. time) developed by Metropolitan Transportation Commission (MTC) of San Francisco Bay Area was used in the study [42]. The effectiveness (PCI improvement) of aforementioned M&R treatments were summarized from previous studies [43,44]. Figure 2 illustrates the pavement performance curve for “Do Nothing” and “micro-surfacing + overlay” scenario. Thus, the areas under the pavement performance curve can be calculated as indicator performance for various scenarios.
2.4. Normalization of Impacts
Each of the three criteria (environment, economy, and performance) was applied to assess the impact values with different units and quantities. Therefore, a rescaling method was used to modify the impact values so that they fell between 0 and 1. Using this method, a direct comparison between the different quantity values can be assessed for the three criteria. Because of different representations of what is considered beneficial or detrimental between the criteria, a brief explanation for each criterion is described in Equation (4):
Environment Criteria: The environment criteria were based on the impact assessment categories of GWP. The baseline case scenarios were the most polluting; therefore, when scaled against themselves, they resulted in a maximum value of 1. All other scenarios scaled in proportion to the baseline case resulted in lower values.
Economy Criteria: The economic criteria were based on the cost associated with performing the associated scenario and baseline activities. Baseline case scenarios were found to be most expensive, and all scenarios were therefore scaled in proportion to them.
Performance Criteria: The performance criteria measure the degree that the indicator has achieved. For the recycled, reused and local material indicators, the difference in the degree of achievement was used in order to maintain the same scaling where a maximum value of 1 was considered most detrimental across all criteria. The long-life indicator utilized the area under the pavement condition curve to identify its performance. The baseline case yielded the lowest area under the curve which reflects the M&R strategy yielded the lowest service level of the pavement. Instead, M&R strategy yielded high pavement service level over time has the greatest area under the pavement condition curve. The difference between maximum performance and the baseline was used for scaling. This difference would align with the prior criteria where high rescaled values were considered highly detrimental.
2.5. Weighting of Indicators
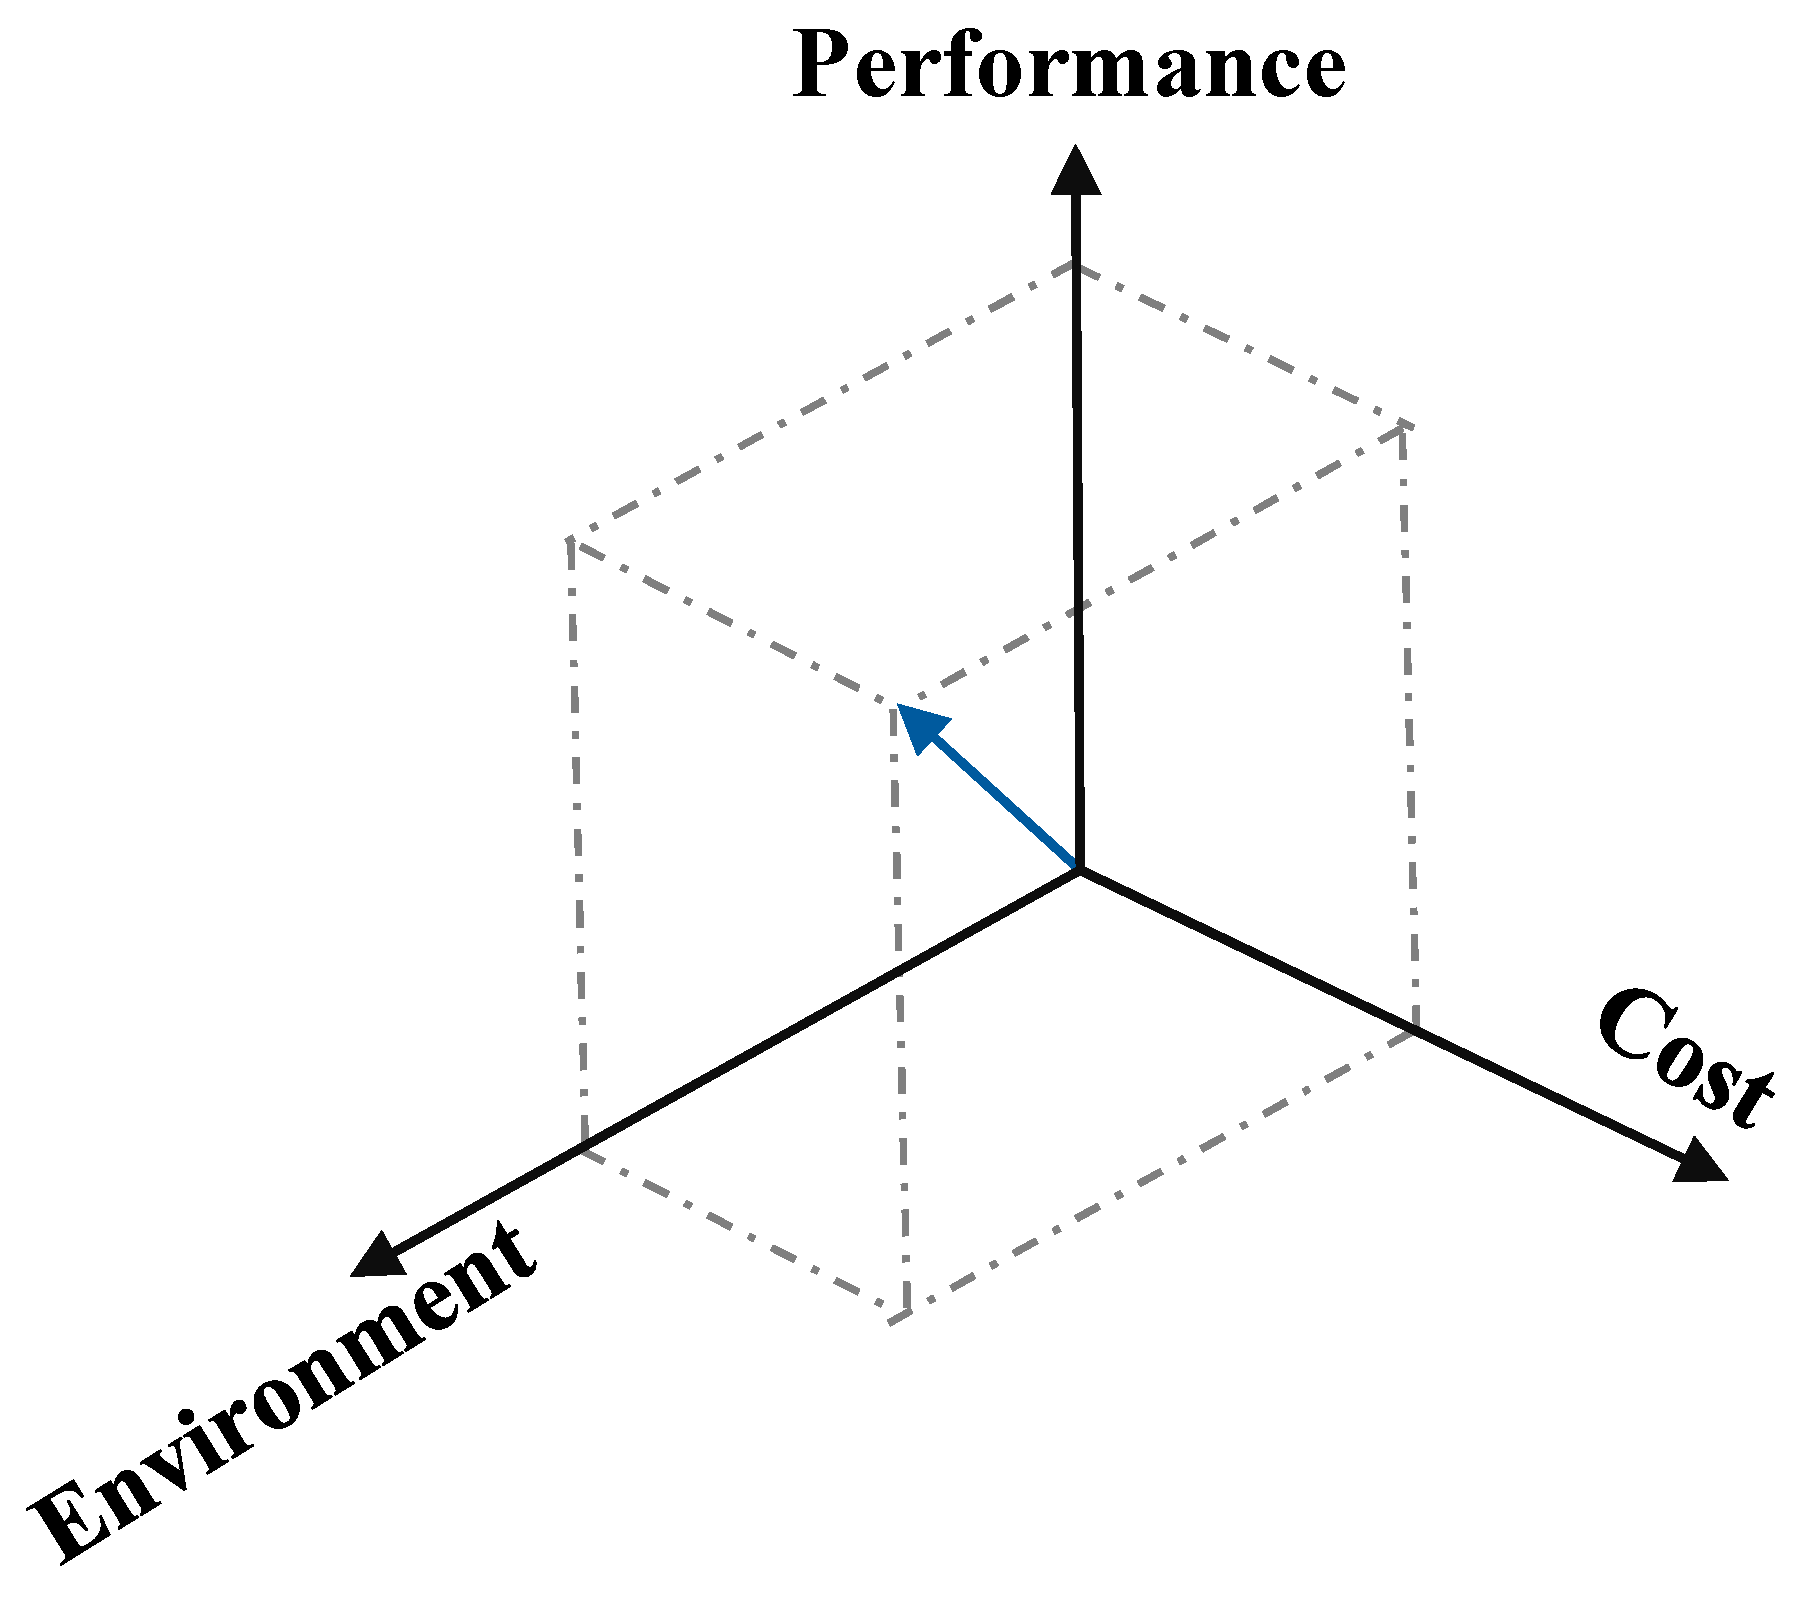
The three criteria can be visualized by assuming a three-axis plot of performance, cost, and environment (global warming potential) (Figure 3). The scalar vector as the arrow shown in Figure 3 was then used to quantify a value that would combine all three criteria so further weighting of the indicators could be established.
Weighting for indicators was established with the vector scalar on two levels. The first level establishes weighting for the indicator itself and its various scenarios—relative weight. Relative weight determines how many points each indicator tier (20%, 40%, 60% recycled material) can earn. The relative weight was obtained by using the scalar derived from the vector of every scenario and rescaling all scalars with reference to the most beneficial scenario. Assuming that an indicator was allocated a certain amount of points, determined by the next level of weighting, the highest achieving scenario would by default gain the maximum points. The other scenarios would receive a fraction of those points due to their lower contributions to sustainability.
The second level of weighting was established for all indicators relative to each other to determine the total points each indicator could obtain—overall weight. This weighting was based on comparing the difference in cost and environmental impact among each indicator’s various scenarios and their baseline case—their environmental and cost savings. These savings were normalized and a vector scalar was again used to combine their results. The vector scalars were then used to calculate the overall weight as defined by Equation (5).
where: n is a number of possible points that was assigned to the indicators including recycled material, reuse of materials, local materials, and long life design indicator.
3. Results and Discussion
The results of the four indicators were assessed by using the same base case project scenario of a 1-km-long urban road with varying conditions depending on the indicator. The relative weighting of each indicator was first presented, followed by the overall weight, which compares all indicators against each other and assigns the maximum amount of points each indicator can have.
3.1. Indicator Normalization and Weighting
Points are typically awarded for contributions to sustainability, and these are tied to the different scenario conditions. Table 3 presents the raw impact values in terms of performance, costs, and environment for the recycled material indicator. Environmental impact was calculated for one commonly known impact assessments (i.e., GWP). The scenarios analyzed were cases of 0%, 20%, 40%, and 60% recycled materials (where the 0% case was a baseline). At 40% recycled project material, the maximum state of practice for RAP and fly ash in cement fines have already been achieved. Therefore, for a project to achieve a higher tier, the only option left would be to use recycled aggregate. However, because recycled aggregate has low benefits to the environmental impact and cost, the marginal cost and environment benefits for a change from 40% recycled material to 60% recycled material are much lower than those for a marginal change from 20% recycled material to 40% recycled material. The performance criteria reflect that regardless of which recycled material is more beneficial than another, the use of a relatively high percentage of recycled material is still a benefit in many regards. This can be seen in Table 3 with the linear increase in the impact values as the percentage of recycled materials are increased linearly. Despite the inherent varying benefits between various recycled materials which the other two criteria reveal, higher recycled material usage provides two main benefits: reducing the use of non-replenishable virgin resources and diversion to waste streams. These recycled materials are typically industrial by-products that are destined for the landfill.
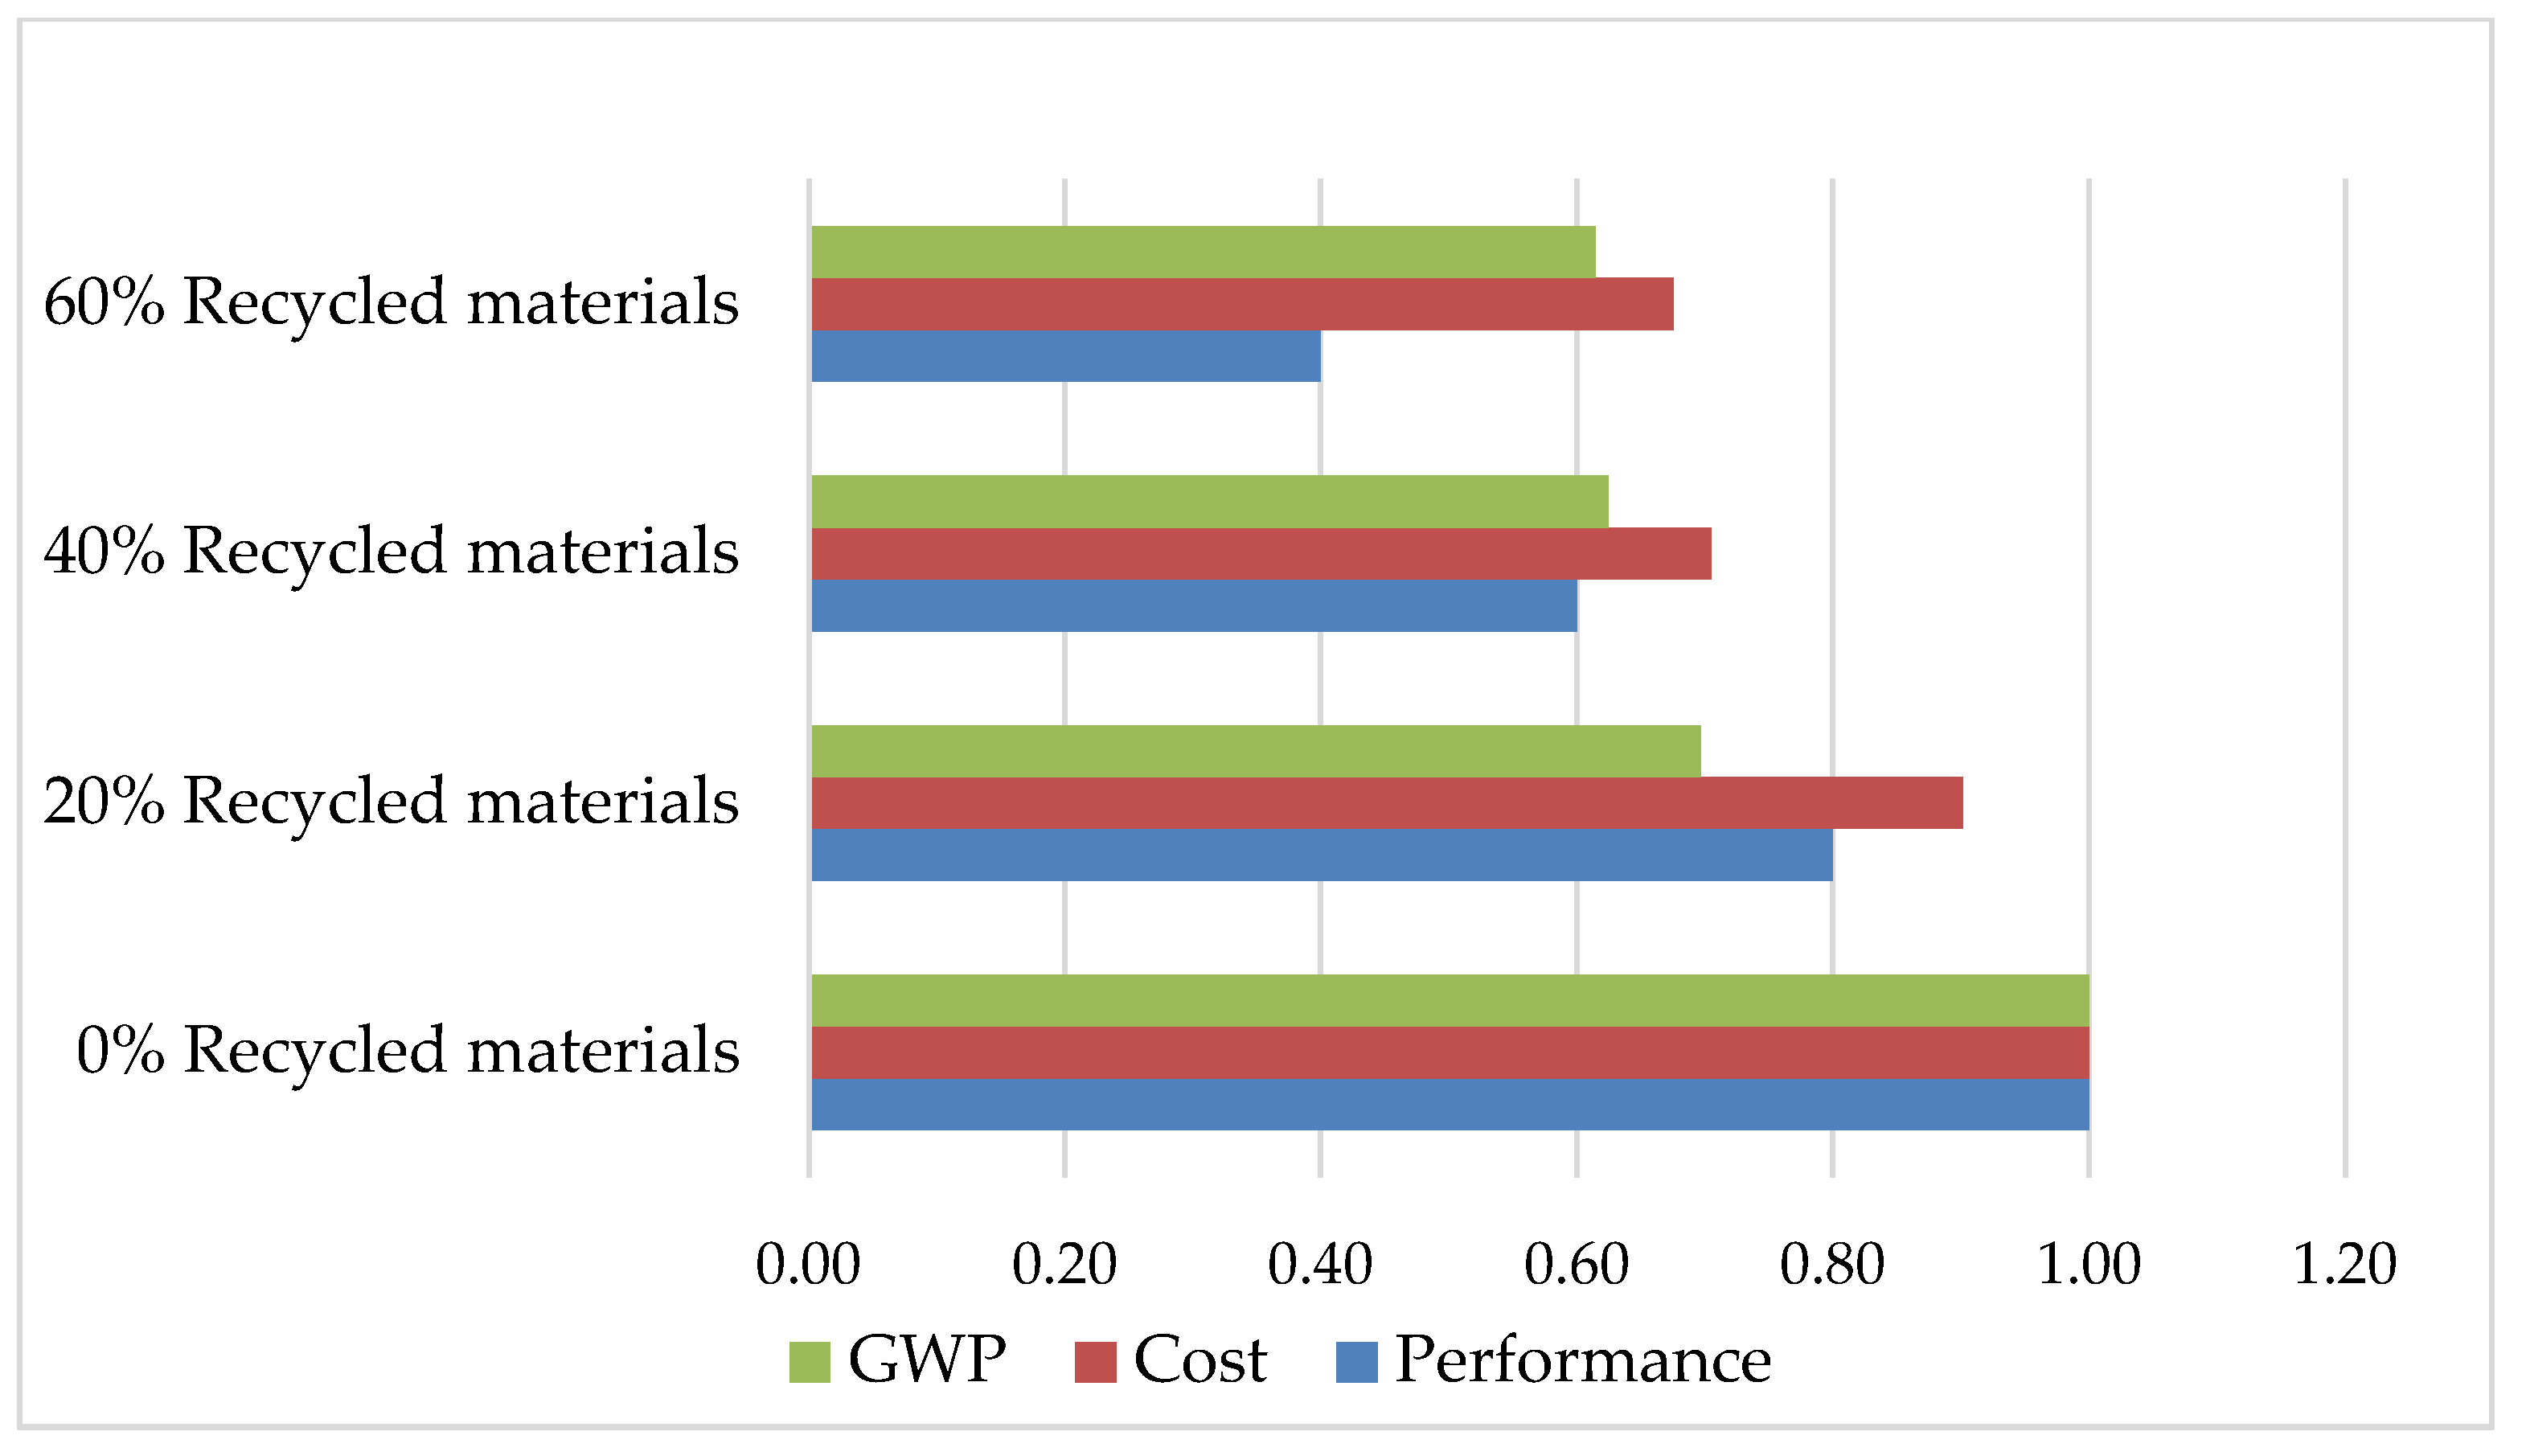
Table 4 rescales the values found in Table 3. Recycled Material Indicator Impacts Values, and these results are shown in Figure 4. From this rescaled table, the final results from relative weight show that compared to the baseline worst case scenario, using just an additional 20% recycled material provides the most sustainable benefit. Otherwise, the two scenario conditions of using 40% and 60% recycled material provide lesser benefits. Assuming a linear weight, the rescaled impact values should fall close to the performance value.
Following the recycled indicator, the other two indicators were also assessed based on their relative weight for various scenarios (Table 5, Table 6, Table 7 and Table 8). The only exception was the long life design indicator (Table 9 and Table 10). No relative weight was established because the long-life design indicator is achieved by fulfilling the design structure of the pavement to long life design specifications. This differs from the other three indicators, which had varying degree of fulfilment conditions. However, the benefits of this indicator can vary, and this was shown by conducting a life cycle assessment with an analysis period beyond this indicator’s scope. A combination of different minor and major rehabilitation methods was used to compare it to a corresponding do-nothing scenario.
3.2. Overall Weighting
In the previous sections, the impact values of each indicator are assessed and weighted relative to themselves. In this section, all the indicators are compared relative to each other. In order to establish such a comparison, the difference of each indicator’s impact was calculated between the baseline scenarios versus its other scenarios. For example, the recycled material indicator’s baseline scenario was compared with the 20%, 40%, and 60% recycled scenarios. The difference between the impact values for different scenario conditions represents the value of sustainability. Therefore, a higher difference indicates a greater reduction in the environmental impact and cost. Because the indicator performance is used to identify the benefit of the indicator extent and measures different representations; therefore, it could not be included in this comparison.
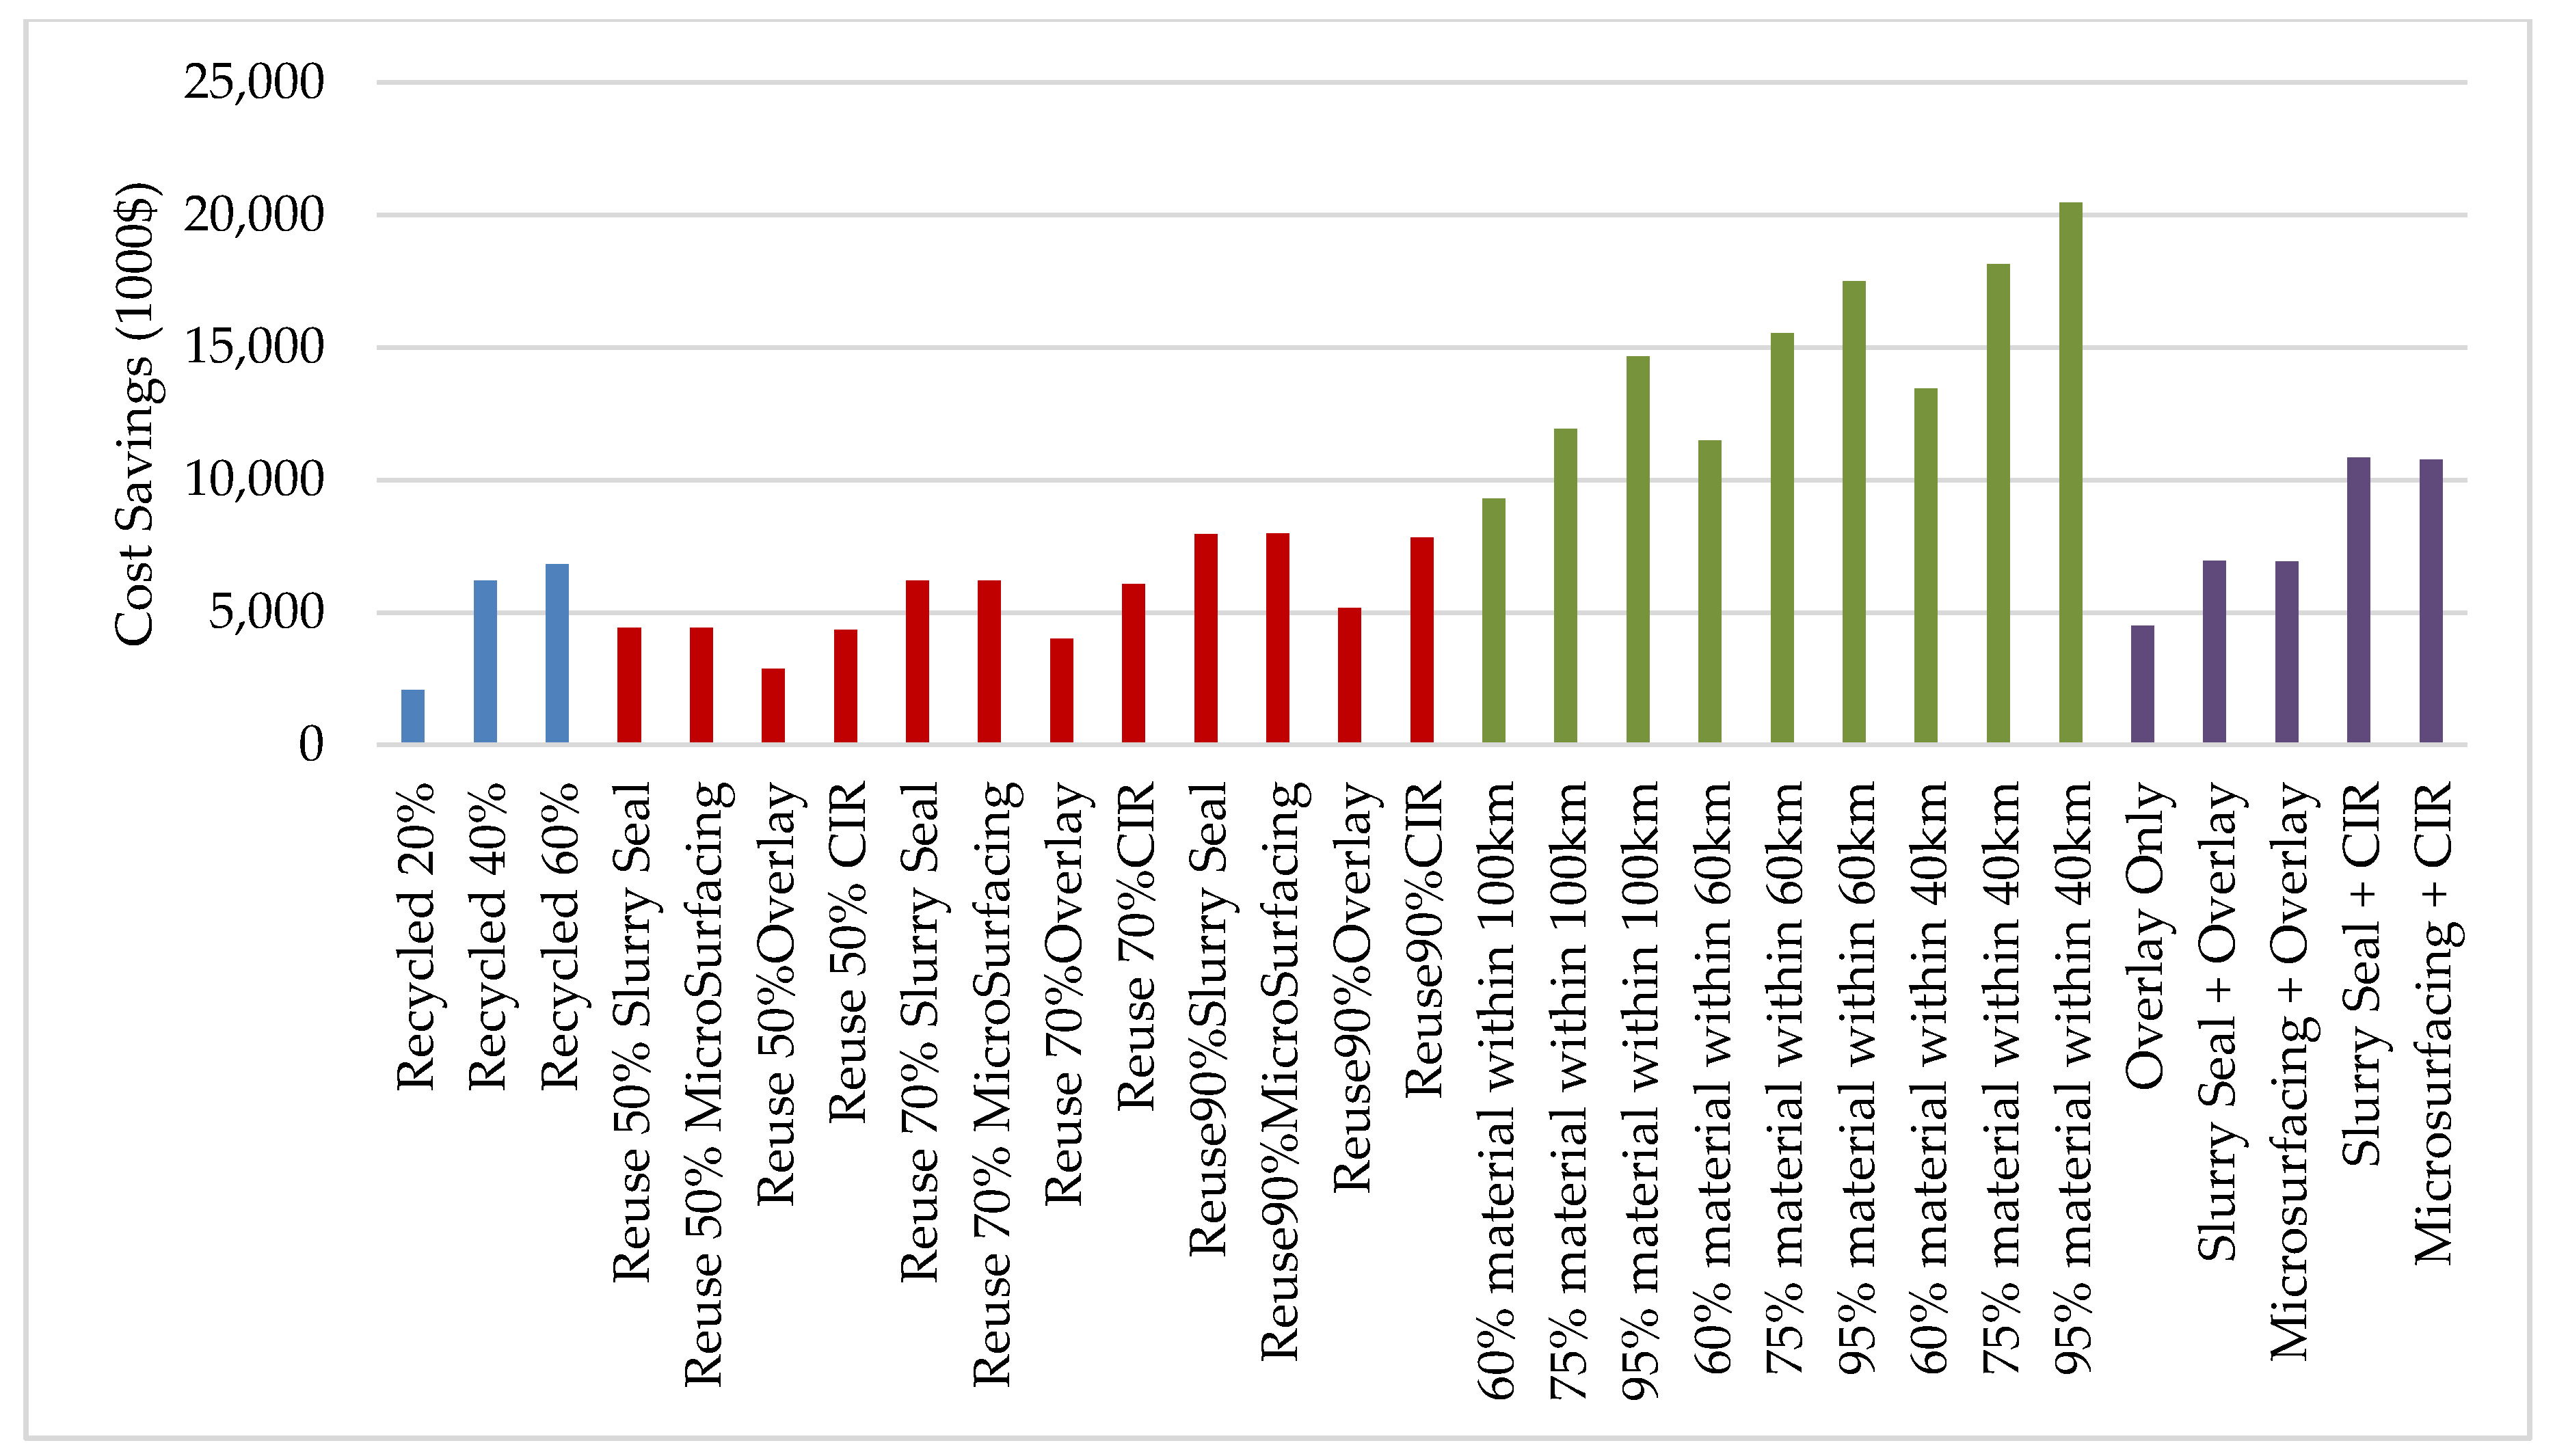
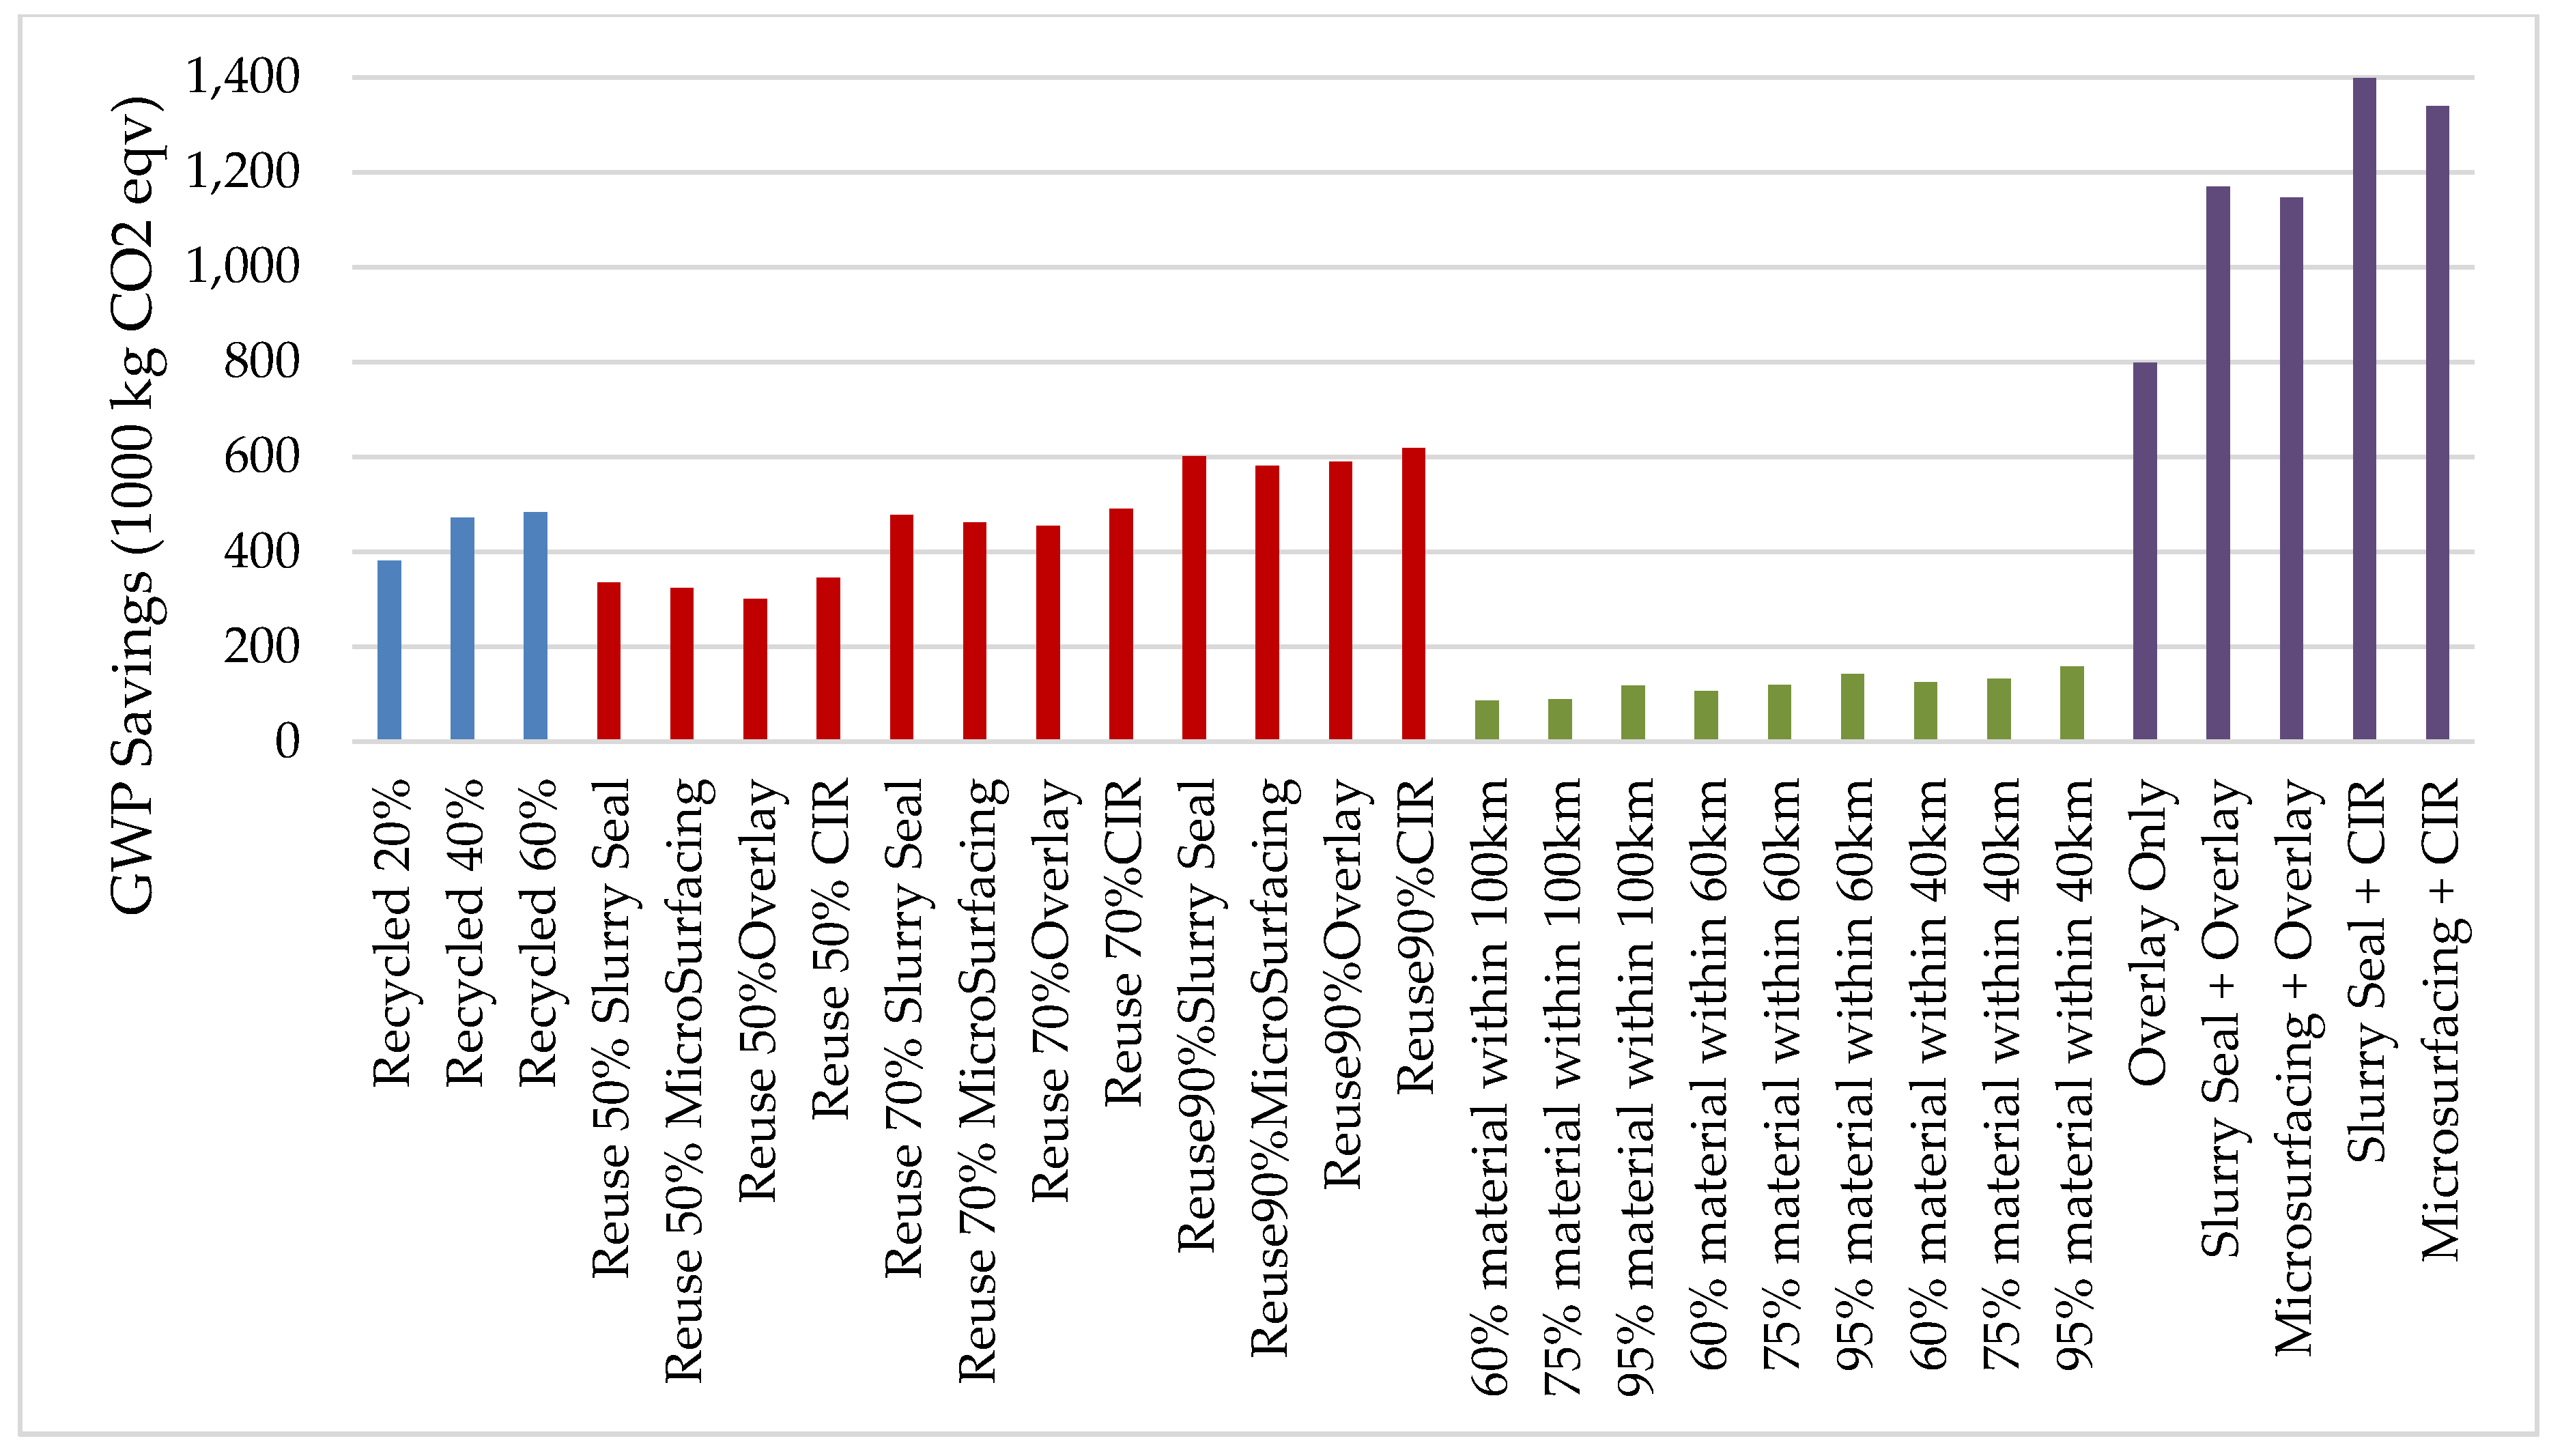
Figure 5 presents a graph of the possible cost savings in achieving the various indicator scenario conditions. The local material indicators present the highest cost savings could be made by reducing transport distances. Figure 6 shows the environmental impact reductions of GWP for the various scenario conditions. Although significant cost savings could be made by using local material indicator, it had much lower environmental impact benefits. The other indicators exhibited much higher environmental benefits compared to the local material.
Naturally, long-life design indicators offered the highest environmental impact savings because they considered a potential scenario over 50 years while other indicators did not. A fair comparison would be to aggregate the impacts of using recycled materials for all activities over 50 years. However, this study intended to weigh the indicator’s impact based on its intent and scope. Although a rating system attempts to holistically assess a project by incorporating practices that can influence future activities and reduce impacts such as long life design, several indicators focus only on the design and construction stage. Quantifying their benefits over a longer period is beyond the indicator’s boundary of impact, and the weightings of the indicator would therefore not be accurate from a rating system’s perspective.
The final weighting that considers all four indicators is shown in Table 11 where the cost and environmental impact of GWP savings were used to determine the overall weight. If 20 points were assigned to these indicators, based on the impact results from this study, the points given for achieving each indicator could be obtained from the overall weight percentages. The highest points assigned to the long-life design indicator consider that the road undergoes a maintenance plan and is carefully monitored over its lifetime. PMS programs with intensive research and data collection are required for this to be achieved. At present, this type of practice is not exercised, and the benefit of the indicator is very unlikely to follow the results. Furthermore, a rating system as discussed previously only focuses on design and construction and does not design indicators to enforce the events that occur during the maintenance and end of life cycles. Nevertheless, the weighting uses the basis of highest benefit possible for every indicator. Although such practices may not be established yet, their purpose is to encourage these practices to go beyond the applicable regulatory minimum. Furthermore, whereas typical rating systems only consider cradle-to-gate indicators, an ideal rating system should attempt to include all life cycle stages where possible holistically. Thus, even a requirement such as submittal of proof that an approved design process such as Asphalt Institute (AI), or the Mechanistic-Empirical Pavement Design Guide (MEPDG) method was used would prove beneficial over the current practice in Taiwan.
Table 12 shows that the weighting of all indicators from Table 11 was used as the maximum possible points granted for each indicator. The various relative weights calculated in the earlier sections were then used to divide the points within the indicator scenario conditions. Maximum points were granted to the highest achievement and then adjusted accordingly based on the indicator’s own relative weight. The number of points was assigned ensuring that the minimum number of points assigned for any indicator would be at least rounded up to one (reuse 50% pavement by area).
Typically, rating systems have a global maximum point cap for their indicators. This safeguards an indicator from being over pursued attaining points as well as ensuring that other indicators may not be valued so low that they cannot contribute in a meaningful way to the project. The inherent variability that comes from indicators and projecting their benefits also relies on assumptions in some cases, and this would limit any flaws or incomplete data used for assessing them. Finally, the problem of weighting for all types of indicator categories is difficult to evaluate under a common metric, and a maximum point cap also limits the impact of indicator categories being favored when they are all important but intrinsically difficult to quantify together.
In this case, a cap on the long life indicator would prevent variability if a proper maintenance procedure is followed after the long-life design that cannot be verified by the rating system. The cap would distribute more points among the other indicators and provide a larger point spread for the local material indicator which was shown to have the bulk of its scenarios being awarded the same amount of points due to rounding. Table 13 presents maximum points possible for each indicator and how these points are distributed among the different indicator’s requirement. As a result of the higher total points assigned to local materials, the various scenario conditions are able to contribute better point wise.
4. Conclusions
This study aims to provide a quantifiable framework approach that can weigh an indicator’s benefits for sustainability by assessing multiple criteria to support the development of the STIM rating system for roadway sector in Taiwan. At present, a sustainable infrastructure rating system may weigh all its indicators equally, but most systems have different weightings for various indicators. The weighting of indicators is not commonly revealed, and many rating systems may borrow from more established systems, conduct expert surveys, and or use published sources as references. Thus, a methodology was introduced using scenarios tailored to indicators and assessed with multiple impact criteria: performance, economic (LCC), and environment (LCA).
Four indicators as the recycled, reused, local materials and long-life design were assessed for use in the study. A typical 1-km-long urban road project was established as a scenario with varying conditions that simulated the project achieving the indicators and their impacts in the form of performance, cost, and environment. The different impacts were rescaled and normalized, which allowed for weighting of the indicators. The final points prior to a point cap given to recycled materials and its respective tiers of 20%, 40%, and 60% recycled materials were 2, 2, and 3, respectively. The final points given to reuse of materials and its respective tiers were 1, 2, and 4. The final points given to local materials ranged from 2 to 3 for its various tiers. Long-life design was given 9 points with no tiers. A point cap was then implemented for all the indicators: recycled materials, reuse of materials, local materials, and long life design, which reduced the maximum points for each indicator to 4, 5, 4, and 5 respectively.
The point spread shows indicators that granted higher points for greater achievements did not always scale linearly. Current rating systems typically award a linear or slightly higher increase in points at the higher tiers of achievement. In this case, reuse of materials and local materials exhibited a linear increase. However, recycled materials exhibited decreased benefits for fulfilling their indicators completely. In this case, the current engineering state-of-the-art practices significantly influenced the impacts between different tiers of achievement for an indicator and its weighting. Using this weight yields both positive and negative outcomes depending on the perspective. Moreover, it highlights one of the disadvantages in rating systems that points can undermine different or alternative designs due to indicators and their weighting. Using a weighting scheme from this study that awards numerous points for the lower tiers would benefit the project owner because it would be easy to score a high number of points. If a linear scale were used, it would encourage users to reach higher scores rather than to be satisfied with attaining most of the points using typical practices; this encouragement would benefit sustainability as a whole. The argument of whether a rating system should be strictly weighted for its effects to benefit the state of practice of the project or sustainability at large is another problem that should be addressed.
Author Contributions
S.H.Y. advised the work on this paper and revised it. J.Y.H.L. and N.H.T. designed, analyzed the data and wrote the paper.
Funding
This research received no external funding
Acknowledgments
The authors gratefully acknowledge the financial support of the Construction and Planning Agency Ministry of the Interior of Taiwan, R.O.C. through its grants CPAMI 105-5500-0201-0000-0020.
Conflicts of Interest
The authors declare no conflict of interest.
References
- Hockstad, L.; Ghanta, V.; Froman, S.; Desai, M.; Weitz, M.; Hight, C.; Schmelt, R.; Wirth, T.; Jenkins, J. Inventory of U.S. Greenhouse Gas Emissions and Sinks: 1990–2012; U.S. Environmental Protection Agency: Washington, DC, USA, 2014. Available online: https://www.epa.gov/sites/production/files/2015-12/documents/us-ghg-inventory-2014-main-text.pdf (accessed on 10 May 2018).
- Deng, F. Greenhouse Gas Emissions Mitigation in Road Construction and Rehabilitation: A Toolkit for Developing Countries, 2011. Available online: http://documents.worldbank.org/curated/en/660861468234281955/pdf/696590ESW0P1010UBLIC00GHG0Web0final.pdf (accessed on 20 June 2018).
- Zito, P.; Salvo, G. Toward an urban transport sustainability index: An European comparison. Eur. Transp. Res. Rev. 2011, 3, 179–195. [Google Scholar] [CrossRef]
- Bongardt, D.; Schmid, D.; Huizenga, C.; Litman, T. Sustainable Transport Evaluation: Developing Practical Tools for Evaluation in the Context of the CSD Process, 2011. Available online: http://www.un.org/esa/dsd/resources/res_pdfs/csd-19/Background Paper 10-transport.pdf (accessed on 20 June 2018).
- USGBC. The LEED Green Building Program: Spurring Growth in Sustainable Building, Design and Construction in the U.S. and Across the Globe, 2013. Available online: https://www.usgbc.org/articles/leed-facts (accessed on 20 June 2018).
- Huang, K.T.; Huang, W.P.; Lin, T.P.; Hwang, R.L. Implementation of green building specification credits for better thermal conditions in naturally ventilated school buildings. Build Environ. 2015, 86, 141–150. [Google Scholar] [CrossRef]
- Muench, S.T.; Anderson, J.L.; Hatfield, J.P.; Koester, J.R.; Söderlund, M.; Lampert, S.; Hoffman, C.; Joned, N.; Vichitthavong, D.; et al. Greenroads Manual v1.5; University of Washington: Seattle, WA, USA, 2011; Available online: https://www.greenroads.org/files/236.pdf (accessed on 10 May 2018).
- Federal Highway Administration (FHWA). Life-Cycle Cost Analysis Primer, 2002. Available online: https://www.fhwa.dot.gov/asset/lcca/010621.pdf (accessed on 10 May 2018).
- Institute for sustainable Infrastructure (ISI). The Envision Rating System, 2017. Available online: sustainableinfrastructure.org (accessed on 10 May 2018).
- Illinois Department of Transportation (IDOT). I-LAST Project Environmental Sustainability Rating System Scorecard, 2010. Available online: https://www.illinoistollway.com/documents/20184/96209/I- LAST+Scorecard.pdf/0a62be5e-68e5-4f61-855f-641e785d9da9?version=1.0 (accessed on 10 May 2018).
- New York State Department of Transportation (NYSDOT). GREENLITES Rating System, 2009. Available online: https://www.dot.ny.gov/programs/greenlites/.../GREENLITES_Scorecard_2.0.1.xls (accessed on 10 May 2018).
- CEEQUAL Ltd. Assessment Manual for Projects in the UK & Ireland, 2010. Available online: http://www.ceequal.com/scheme-descriptions/ (accessed on 10 May 2018).
- Babashamsi, P.; Yusoff, N.I.M.; Ceylan, H.; Nor, N.G.M.; Jenatabadi, H.S. Sustainable development factors in pavement life-cycle: highway/airport review. Sustainability 2016, 8, 248. [Google Scholar] [CrossRef]
- Huang, Y.; Bird, R.; Heidrich, O. Development of a life cycle assessment tool for construction and maintenance of asphalt pavements. J. Clean Prod. 2009, 17, 283–296. [Google Scholar] [CrossRef]
- Santero, N.J.; Masanet, E.; Horvath, A. Resources, Conservation and Recycling Life-cycle assessment of pavements. Part I: Critical review. Resour. Conserv. Recycl. 2011, 55, 801–809. [Google Scholar] [CrossRef]
- Azarijafari, H.; Yahia, A.; Amor, M.B. Life cycle assessment of pavements: Reviewing research challenges and opportunities. J. Clean Prod. 2016, 112, 2187–2197. [Google Scholar] [CrossRef]
- Yu, B.; Lu, Q.; Xu, J. An improved pavement maintenance optimization methodology: Integrating LCA and LCCA. Transp. Res. Part. A 2013, 55, 1–11. [Google Scholar] [CrossRef]
- Babashamsi, P.; Yusoff, N.I.M.; Ceylan, H.; Nor, N.G.; Jenatabadi, H.S. Evaluation of pavement life cycle cost analysis: Review and analysis. Int J Pavement Res Technol 2016, 9, 241–254. [Google Scholar] [CrossRef]
- Athena Institute. A Life Cycle Perspective on Concrete and Asphalt Roadways: Embodied Primary Energy and Global Warming Potential; Cement Association of Canada: Ottawa, ON, Canada, 2006; Available online: http://s3.amazonaws.com/zanran_storage/www.athenasmi.ca/ContentPages/859479425.pdf (accessed on 10 May 2018).
- Blankendaal, T.; Schuur, P.; Voordijk, H. Reducing the environmental impact of concrete and asphalt: A scenario approach. J. Clean. Prod. 2014, 66, 27–36. [Google Scholar] [CrossRef]
- Chiu, C.T.; Hsu, T.H.; Yang, W.F. Life cycle assessment on using recycled materials for rehabilitating asphalt pavements. Resour. Conserv. Recycl. 2008, 52, 545–556. [Google Scholar] [CrossRef]
- Weiland, C.; Muench, S. Life-Cycle Assessment of Reconstruction Options for Interstate Highway Pavement in Seattle, Washington. Transp. Res. Rec. J. Transp. Res. Board 2010, 2170, 18–27. [Google Scholar] [CrossRef]
- Federal Highway Administration (FHWA). Life Cycle Assessment (FHWA-HIF-15-001). 2014. Available online: https://www.fhwa.dot.gov/pavement/sustainability/hif15001.pdf (accessed on 10 May 2018).
- Turk, J.; Mladenović, A.; Knez, F.; Bras, V.; Šajna, A.; Čopar, A.; Slanc, K. Tar-containing reclaimed asphalt—Environmental and cost assessments for two treatment scenarios. J. Clean. Prod. 2014, 81, 201–210. [Google Scholar] [CrossRef]
- Moretti, L.; Mandrone, V.; Andrea, A.D.; Caro, S. Comparative “from cradle to gate” life cycle assessments of Hot Mix Asphalt (HMA) materials. Sustainsbility 2017, 9, 400. [Google Scholar] [CrossRef]
- Harvey, J.T.; Meijer, J.; Ozer, H.; Al-Qadi, I.L.; Saboori, A.; Kendall, A. Pavement Life Cycle Assessment Framwork [Internet]. Applied Pavement Technology; 2016. Available online: www.fhwa.dot.gov/pavement/sustainability/hif16014.pdf (accessed on 10 May 2018).
- Setunge, S.; Kumar, A.; Nezamian, A.; De Silva, S.; Lokuge, W.; Carse, A.; Spathonis, J.; Chandler, L.; Gilbert, D.; Johnson, B.; et al. Whole of Life Cycle Cost Analysis in Bridge Rehabilitation. 2002. Available online: www.construction-innovation.info (accessed on 10 May 2018).
- Zhang, Y.; Novick, D.A.; Hadavi, A.; Krizek, R.J. Whole Life Cycle Cost for Chicago-Type Bascule Bridges. Cost Eng. 2008, 50, 28–35. Available online: https://trid.trb.org/view/894281 (accessed on 10 May 2018).
- Walls, J., III; Smith, M.R. Life-Cycle Cost Analysis in Pavement Design; Federal Highway Administration: Washington, DC, USA, 1998. Available online: https://www.fhwa.dot.gov/infrastructure/asstmgmt/013017.pdf (accessed on 10 May 2018).
- Liu, R.; Smartz, B.W.; Descheneaux, B. LCCA and environmental LCA for highway pavement selection in Colorado. Int. J. Sustain. Eng. 2015, 8, 102–110. [Google Scholar] [CrossRef]
- Gschösser, F. Life Cycle Assessment of Representative Swiss Road Pavements for National Roads with an Accompanying Life Cycle Cost Analysis. Environ. Sci. Technol. 2013, 47, 8453–8461. [Google Scholar] [CrossRef] [PubMed]
- Giustozzi, F.; Crispino, M.; Flintsch, G. Multi-attribute life cycle assessment of preventive maintenance treatments on road pavements for achieving environmental sustainability. Int. J. Life Cycle Assess. 2012, 17, 409–419. [Google Scholar] [CrossRef]
- Smith, J.T.; Tighe, S.L. Analytic Hierarchy Process as a Tool for Infrastructure Management. J. Transp. Res. Board 2006, 1974, 3–9. [Google Scholar] [CrossRef]
- International Organization for Standardization (ISO). ISO 14040: 2006(E)–Environmental Management—Life Cycle Assessment—Principles and Framework, Geneva, Switzerland, 2006. Available online: https://www.iso.org/standard/37456.html (accessed on 10 May 2018).
- International Organization for Standardization (ISO). ISO 14044: Environmental management–Life cycle assessment–Requirements and guidelines, Geneva, Switzerland, 2006. Available online: https://www.iso.org/standard/38498.html (accessed on 10 May 2018).
- Heijungs, R.; Suh, S. The Computational Structure of Life Cycle Assessment, 1st ed.; Kluwer Academic Publishers: Dordrecht, The Netherlands, 2002; ISBN 978-94-015-9900-9. [Google Scholar]
- Papagiannakis, A.T.; Delwar, M. Incorporating User Costs into Pavement Management Decisions. In Proceedings of the 5th International Conference on Managing Pavements, Seattle, WA, USA, 11–14 August 2001. [Google Scholar]
- Ozbay, K.; Jawad, D.; Parker, N.; Hussain, S. Guidelines for Life Cycle Cost Analysis; The State University of New Jersey: New Brunswick, NJ, USA, 2003; Available online: https://cait.rutgers.edu/files/FHWA-NJ-2003-012.pdf (accessed on 10 May 2018).
- Ministry of Transportation and Communication (MOTC). Commondity Flow Survay. 2014. Available online: www.motc.gov.tw (accessed on 10 May 2018).
- American Association of State Highway and Transportation Officials (AASHTO). Guide for Design of Pavement Structure_AASHTO 1993. Available online: https://habib00ugm.files.wordpress.com/2010/05/aashto1993.pdf (accessed on 20 June 2018).
- Rahn, P.; Biehler, A.D.; Braceras, C. Mechanistic - Empirical Pavement Design Guide_A Manual of Practice. American Association of State Highway and Transportation Officials, 2008. Available online: https://fenix.tecnico.ulisboa.pt/downloadFile/563568428712666/AASHTO08.pdf (accessed on 20 June 2018).
- Wu, Z.; Groeger, J.L.; Simpson, A.L.; Hicks, R.G. Performance Evaluation of Various Rehabilitation and Preservation Treatments; U.S. Department of Transportation: Washington, DC, USA, 2010. Available online: https://www.fhwa.dot.gov/pavement/preservation/pubs/perfeval/perfeval.pdf (accessed on 10 May 2018).
- Labi, S.; Sinha, K.C. Measures of short-term effectiveness of highway pavement maintenance. J. Transp. Eng. 2003, 129, 673–683. [Google Scholar] [CrossRef]
- Metropolitan Transportation Commission & ERES Consultants Inc. Pavement Condition Index Distress Identification Manual for Asphatl and Surface Treatment Pavement; Metropolitan Transportation Commission & ERES Consultants Inc.: Oakland, CA, USA, 1986; Available online: http://hawaiiasphalt.org/wp/wp-content/uploads/PCI-Distress-ID-Manual.pdf (accessed on 10 May 2018).
Figure 1.
The aggregated process map of Hot Mix Asphalt (HMA) pavement life cycle.

Figure 2.
The pavement performance curves for “Do Nothing” and “micro-surfacing + overlay” scenario for over 50 years analysis period.
Figure 2.
The pavement performance curves for “Do Nothing” and “micro-surfacing + overlay” scenario for over 50 years analysis period.

Figure 3.
The multi-criteria visualization of the normalized impacts.

Figure 4.
The recycled material indicator rescaled impact value visual.

Figure 5.
The cost savings between various scenario conditions.

Figure 6.
The GWP reduction between various scenario conditions.


Table 1.
The summary of indicators used in different sustainable rating systems.
| Material Type Indicator Themes | CEEQUAL | Envision | GreenLITES | Greenroads | I-Last | INVEST | Total |
|---|---|---|---|---|---|---|---|
| Recycled Materials | √ | √ | √ | √ | √ | √ | 6 |
| Reuse of Materials | √ | √ | √ | √ | √ | √ | 6 |
| Local Materials | √ | √ | √ | √ | √ | 5 | |
| Hazard Material Minimization | √ | √ | √ | 3 | |||
| Responsible Sourcing | √ | √ | √ | 3 | |||
| Long Life Design | √ | √ | √ | √ | √ | 5 | |
| Earth Balance | √ | √ | √ | √ | √ | √ | 6 |
| Deconstruction | √ | √ | 2 | ||||
| Reduce Net Embodied Energy | √ | √ | √ | 3 | |||
| Divert Waste | √ | √ | 2 |
Table 2.
The long life design scenario and M&R trigger conditions.
| Scenario | Do Nothing | OL only | SS + OL | MS + OL | SS + CIR | MS + CIR |
|---|---|---|---|---|---|---|
| Treatment Trigger Condition | Perform major rehab when PCI reach 50 | Perform OL (PCI = 65) | Perform SS twice (PCI = 80); Perform OL (PCI = 65) | Perform MS twice (PCI = 80); Perform OL (PCI = 65) | Perform MS twice (PCI = 80); Perform OL (PCI = 65) | Perform SS twice (PCI = 80); Perform CIR (PCI = 65) |
Table 3.
The recycled material indicator impacts values.
| Scenario Condition Detail | Actual Value | ||
|---|---|---|---|
| Performance | Cost | Environment | |
| (1000$) | GWP (kg CO2-eqv) | ||
| Baseline: 0% Recycled Materials | 1 | 20,984 | 1,257,413 |
| 20% Recycled Materials | 0.8 | 18,247 | 875,841 |
| 40% Recycled Materials | 0.6 | 13,552 | 784,973 |
| 60% Recycled Materials | 0.4 | 12,137 | 773,037 |
Table 4.
The recycled material indicator rescaled impact values.
| Scenario Condition Detail | Rescaled | Vector Scalar | Relative Weight | ||
|---|---|---|---|---|---|
| Performance | Cost | Environment (GWP) | |||
| Baseline: 0% Recycled Materials | 1 | 1 | 1 | 1.73 | |
| 20% Recycled Materials | 0.80 | 0.90 | 0.70 | 1.39 | 0.71 |
| 40% Recycled Materials | 0.60 | 0.79 | 0.62 | 1.12 | 0.89 |
| 60% Recycled Materials | 0.40 | 0.70 | 0.61 | 1 | 1 |
Table 5.
The reuse of material indicator impacts values.
| Scenario Condition Detail | Actual Value | ||
|---|---|---|---|
| Performance | Cost | Environment | |
| (1000$) | GWP (kg CO2-eqv) | ||
| Baseline: 0% Reuse | 1 | 8859 | 739,210 |
| 50% Existing Material Reused | |||
| Slurry Seal | 0.5 | 4435 | 403,160 |
| Microsurfacing | 0.5 | 4430 | 415,047 |
| Overlay | 0.5 | 5991 | 437,723 |
| CIR | 0.5 | 4511 | 393,873 |
| 70% Existing Material Reused | |||
| Slurry Seal | 0.2 | 2666 | 261,014 |
| Microsurfacing | 0.2 | 2658 | 277,655 |
| Overlay | 0.2 | 4843 | 284,290 |
| CIR | 0.2 | 2772 | 248,012 |
| 90% Existing Material Reused | |||
| Slurry Seal | 0.1 | 896 | 137,027 |
| Microsurfacing | 0.1 | 887 | 158,424 |
| Overlay | 0.1 | 3696 | 149,016 |
| CIR | 0.1 | 1033 | 120,311 |
Table 6.
The reuse of material indicator rescaled impact values.
| Scenario Condition Detail | Rescaled | Vector Scalar | Relative Weight | ||
|---|---|---|---|---|---|
| Performance | Cost | Environment (GWP) | |||
| Baseline: 0% Reuse | 1 | 1 | 1 | 1.73 | |
| 50% Existing Material Reused | |||||
| Slurry Seal | 0.5 | 0.50 | 0.55 | 0.89 | 0.29 |
| Microsurfacing | 0.5 | 0.50 | 0.56 | 0.90 | |
| Overlay | 0.5 | 0.68 | 0.59 | 1.03 | |
| CIR | 0.5 | 0.51 | 0.53 | 0.89 | |
| 70% Existing Material Reused | |||||
| Slurry Seal | 0.2 | 0.30 | 0.35 | 0.51 | 0.50 |
| Microsurfacing | 0.2 | 0.30 | 0.38 | 0.52 | |
| Overlay | 0.2 | 0.55 | 0.38 | 0.70 | |
| CIR | 0.2 | 0.31 | 0.34 | 0.50 | |
| 90% Existing Material Reused | |||||
| Slurry Seal | 0.1 | 0.10 | 0.19 | 0.23 | 1 |
| Microsurfacing | 0.1 | 0.10 | 0.21 | 0.26 | |
| Overlay | 0.1 | 0.42 | 0.20 | 0.47 | |
| CIR | 0.1 | 0.12 | 0.16 | 0.22 | |
Table 7.
The local material indicator impact value.
| Scenario Condition Detail | Actual Value | ||
|---|---|---|---|
| Performance | Cost | Environment | |
| (1000$) | GWP (kg CO2-eqv) | ||
| 100% material within average | 92 | 31,345 | 242,056 |
| 60% material within 100 km | 71 | 22,045 | 154,571 |
| 75% material within 100 km | 66 | 19,412 | 151,893 |
| 95% material within 100 km | 59 | 16,690 | 123,169 |
| 60% material within 60 km | 62 | 19,860 | 135,057 |
| 75% material within 60 km | 55 | 15,791 | 122,028 |
| 95% material within 60 km | 45 | 13,854 | 99,496 |
| 60% material within 40 km | 56 | 17,898 | 116,903 |
| 75% material within 40 km | 47 | 13,190 | 109,412 |
| 95% material within 40 km | 35 | 10,866 | 83,185 |
Table 8.
The local material indicator rescaled impact value.
| Scenario Condition Detail | Rescaled | Vector Scalar | Relative Weight | ||
|---|---|---|---|---|---|
| Performance | Cost | Environment (GWP) | |||
| 100% material within average | 1 | 1 | 1 | 1.73 | |
| 60% material within 100 km | 0.77 | 0.70 | 0.64 | 1.22 | 0.48 |
| 75% material within 100 km | 0.72 | 0.62 | 0.63 | 1.14 | 0.55 |
| 95% material within 100 km | 0.64 | 0.53 | 0.51 | 0.98 | 0.64 |
| 60% material within 600 km | 0.68 | 0.63 | 0.56 | 1.08 | 0.57 |
| 75% material within 60 km | 0.60 | 0.50 | 0.50 | 0.93 | 0.67 |
| 95% material within 60 km | 0.49 | 0.44 | 0.41 | 0.78 | 0.80 |
| 60% material within 40 km | 0.61 | 0.57 | 0.48 | 0.97 | 0.64 |
| 75% material within 40 km | 0.51 | 0.42 | 0.45 | 0.80 | 0.77 |
| 95% material within 40 km | 0.38 | 0.35 | 0.34 | 0.62 | 1 |
Table 9.
The long life design indicator impact values.
| Scenario Condition Detail | Actual Value | ||
|---|---|---|---|
| Performance | Cost | Environment | |
| (1000$) | GWP (kg CO2-eqv) | ||
| Do Nothing | 1563 | 1358 | 2,956,841 |
| Overlay Only | 1173.4 | 1149 | 2,158,604 |
| Slurry Seal + Overlay | 842.5 | 1035 | 1,787,515 |
| Microsurfacing + Overlay | 842.5 | 1036 | 1,809,902 |
| Slurry Seal + CIR | 842.5 | 853 | 1,558,834 |
| Microsurfacing + CIR | 842.5 | 857 | 1,617,943 |
Table 10.
The long life design indicator rescaled impact values.
| Scenario Condition Detail | Rescaled | Vector Scalar | ||
|---|---|---|---|---|
| Performance | Cost | Environment (GWP) | ||
| Do Nothing | 1 | 1 | 1 | 1.73 |
| Overlay Only | 0.75 | 0.85 | 0.73 | 1.35 |
| Slurry Seal + Overlay | 0.54 | 0.76 | 0.60 | 1.11 |
| Microsurfacing + Overlay | 0.54 | 0.76 | 0.61 | 1.12 |
| Slurry Seal + CIR | 0.54 | 0.63 | 0.53 | 0.98 |
| Microsurfacing + CIR | 0.54 | 0.63 | 0.55 | 0.99 |
Table 11.
The weighting of indicators against each other.
| Indicator | Scenario Condition | Vector Scalar | Overall Weight ** | Points Possible *** |
|---|---|---|---|---|
| Recycled Material | 20% Recycled Materials | 0.40 | 17% | 3 |
| 40% Recycled Materials | 0.52 | |||
| 60% Recycled Materials | 0.53 | |||
| Reuse of Materials | Reuse 50% Pavement by Area | 0.35 | 21% | 4 |
| Reuse 70% Pavement by Area | 0.50 | |||
| Reuse 90% Pavement by Area | 0.63 | |||
| Local Materials | 60% material within 100 km | 0.26 | 17% | 3 |
| 75% material within 100 km | 0.31 | |||
| 95% material within 100 km | 0.38 | |||
| 60% material within 60 km | 0.31 | |||
| 75% material within 60 km | 0.40 | |||
| 95% material within 60 km | 0.46 | |||
| 60% material within 40 km | 0.37 | |||
| 75% material within 40 km | 0.46 | |||
| 95% material within 40 km | 0.53 | |||
| Long Life Design | Overlay Only | 0.92 | 45% | 9 |
| Slurry Seal + Overlay | 1.31 | |||
| Microsurfacing + Overlay | 1.30 | |||
| Slurry Seal + CIR | 1.42 | |||
| Microsurfacing + CIR | 1.36 |
** Based on each indicator’s best case scenario; *** Assuming 20 points were assigned for this indicator set.
Table 12.
The final weighting of individual indicators and their conditions.
| Compared Among Four Indicators | Compared Within Indicator Itself | ||||
|---|---|---|---|---|---|
| Indicator | Overall Weight | Possible Points | Scenario Condition | Relative Weight | Possible Points |
| Recycled Material | 17% | 3 | 20% Recycled Materials | 71% | 2 |
| 40% Recycled Materials | 89% | 2 | |||
| 60% Recycled Materials | 100% | 3 | |||
| Reuse of Materials | 21% | 4 | Reuse 50% Pavement by Area | 29% | 1 |
| Reuse 70% Pavement by Area | 50% | 2 | |||
| Reuse 90% Pavement by Area | 100% | 4 | |||
| Local Materials | 17% | 3 | 60%-95% material within 100 km | 24–35% | 2 |
| 60%-95% material within 60 km | 36–52% | 2 | |||
| 60% material within 40 km | 59% | 2 | |||
| 75% material within 40 km | 74% | 2 | |||
| 95% material within 40 km | 100% | 3 | |||
| Long Life Design | 45% | 9 | Slurry Seal + Overlay | 100% | 9 |
| Microsurfacing + Overlay | |||||
| Slurry Seal + CIR | |||||
| Microsurfacing + CIR | |||||
Table 13.
The final weighting of individual indicators and their conditions with point cap.
| Compared Among Four Indicators | Compared Within Indicator itself | ||||
|---|---|---|---|---|---|
| Indicator | Overall Weight | Possible Points | Scenario Condition | Relative Weight | Possible Points |
| Recycled Material | 22% | 4 | 20% Recycled Materials | 71% | 3 |
| 40% Recycled Materials | 89% | 3 | |||
| 60% Recycled Materials | 100% | 4 | |||
| Reuse of Materials | 28% | 5 | Reuse 50% Pavement by Area | 29% | 1 |
| Reuse 70% Pavement by Area | 50% | 3 | |||
| Reuse 90% Pavement by Area | 100% | 5 | |||
| Local Materials | 22% | 4 | 60%-95% material within 100 km | 24–35% | 1 |
| 60%-95% material within 60 km | 36–52% | 2 | |||
| 60% material within 40 km | 59% | 2 | |||
| 75% material within 40 km | 74% | 3 | |||
| 95% material within 40 km | 100% | 4 | |||
| Long Life Design | 28% | 5 | Slurry Seal + Overlay | 100% | 5 |
| Microsurfacing + Overlay | |||||
| Slurry Seal + CIR | |||||
| Microsurfacing + CIR | |||||
© 2018 by the authors. Licensee MDPI, Basel, Switzerland. This article is an open access article distributed under the terms and conditions of the Creative Commons Attribution (CC BY) license (http://creativecommons.org/licenses/by/4.0/).
Share and Cite
MDPI and ACS Style
Yang, S.-H.; Liu, J.Y.H.; Tran, N.H. Multi-Criteria Life Cycle Approach to Develop Weighting of Sustainability Indicators for Pavement. Sustainability 2018, 10, 2325. https://doi.org/10.3390/su10072325
AMA Style
Yang S-H, Liu JYH, Tran NH. Multi-Criteria Life Cycle Approach to Develop Weighting of Sustainability Indicators for Pavement. Sustainability. 2018; 10(7):2325. https://doi.org/10.3390/su10072325
Chicago/Turabian StyleYang, Shih-Hsien, Jack Yen Hung Liu, and Nam Hoai Tran. 2018. "Multi-Criteria Life Cycle Approach to Develop Weighting of Sustainability Indicators for Pavement" Sustainability 10, no. 7: 2325. https://doi.org/10.3390/su10072325
Note that from the first issue of 2016, this journal uses article numbers instead of page numbers. See further details here.