Does Multidimensional Service Quality Generate Sustainable Use Intention for Facebook?


Department of International Trade, College of Commerce, Chonbuk National University, Jeonju 54896, Korea
*
Author to whom correspondence should be addressed.
Sustainability 2018, 10(7), 2283; https://doi.org/10.3390/su10072283
Submission received: 4 June 2018
/
Revised: 28 June 2018
/
Accepted: 29 June 2018
/
Published: 2 July 2018
(This article belongs to the Section Economic and Business Aspects of Sustainability)
Abstract
:While social networking services (SNS) have led to major economic and social transformations worldwide, it is becoming increasingly important to understand what constitutes the sustainable use of SNS. The current study focuses on Facebook and examines the impact of multidimensional and hierarchical service quality on sustainable use intention. Structural equation modeling is used to analyze the data that has been collected through online surveys. The results show that all four dimensions of service quality (outcome quality, environment quality, interaction quality, and social quality) have significant positive effects on satisfaction. Satisfaction is found to be a reasonable predictor of sustainable use intention and word-of-mouth (WOM) communication, and the influence of WOM on sustainable use intention is also confirmed. Among all the dimensions, outcome quality and interaction quality influence WOM most strongly. The findings from this study bridge a literature gap in the context of SNS by demonstrating how SNS managers can improve service quality, leading to increases in satisfaction, WOM, and sustainable use intention.
1. Introduction
Social networking remains one of the most widely used online networking activities worldwide, and has major impacts on online interactions and online marketing. Social network users benefit from improved network quality, which increases the ability to unite people and maintain connections. Recent researches have shown that social networking services (SNS) can be useful for businesses in terms of sales, product research, marketing campaigns, and human resources; the adoption of a social networking site offers user benefits, such as simplified collaboration with friends, convenient human communication, improved productivity, and multichannel retail development [1,2].
This study focuses on the most popular social network, Facebook, which provides users with text messaging, video, and voice communication, and has become an important platform for instant messaging (IM). In addition, users can share, like, and comment on other users’ posts. People can communicate with the virtual world, which seems to be a face-to-face communication with the presence of IM [3]. Founded in February 2004, Facebook was originally designed for Harvard University students only, but was opened to the general public in September 2006. As of January 2018, the total number of active users was 2.2 billion, which held top market shares in terms of both reach and scale [4].
Many factors have driven scholars to explore not only the reasons behind the continuous use of SNS, but also the impact of service quality on usage intention [5,6,7]. Some of these factors include the importance of SNS to individuals and organizations, its widespread use, the volatility of the mobile social networking market, and the fierce competition between service providers. Continuous use intention is a concept explaining a consumer’s plan to continue use of a particular product or service [8]. The actual behavior of consumers depends on their permanent use of the product or service, which in turn determines the success of the product or service [5]. A study by Boehmer and Lacy [9] argue that a 24% increase in sales was achieved by companies that used SNS, as compared to those that did not. Therefore, understanding the components that influence customers’ sustainable use intention is important and provides companies with an opportunity to enhance their services. Sustainable use can be defined as the use of things in a way that does not lead to a long-run decline, thereby preserving the potential to meet the needs and desires of present and future generations. Sustainable use is a crucial variable in the relationship between user image formation and maintenance of the network in SNS, and it confirms the attitudes and decisions made by network users [10]. SNS is a service area characterized by the sustainable use of the social network environment and its functionalities [11]. From the view of the principle of maintenance, we consider the sustainable use intention to be similar to continuous use intention in our study.
Service quality refers to customers’ overall judgment of and opinion toward a service provider’s performance, and thus strongly affects customer satisfaction [5,12]. In practice, the measurement of service quality is very complex; therefore, Brady and Cronin [13] presented a multidimensional service quality model consisting of three key components: outcome quality, interaction quality, and environment quality. These have become important measures of service quality in various areas of the service sector. Numerous studies have been conducted to test this service quality theory in different contexts, including SNS [7], mobile value-added services [5], web-based libraries [14], and the motel service industry [15].
Previous studies of the Internet and mobile services have revealed that service quality, satisfaction, and word-of-mouth (WOM) have direct or indirect influences on continuous usage intention [5,7,12,16]. Satisfaction is the customer’s overall evaluation of whether or not a service meets the customer’s perceived expectations; thus, satisfaction is heavily influenced by service quality [5]. WOM consists of the positive or negative referrals made by the consumer regarding a product or service; thus WOM influences usage intention [17,18]. Prior studies have identified the relationships among service quality, satisfaction, and usage intention for IM services using three dimensions of service quality [5,7]. However, the four-dimensional model of service quality (i.e., outcome, interaction, environment, and social quality) has not yet been formally analyzed. Indeed, social quality can be a key determinant of overall service quality, and can have major impacts on SNS usage intention [7,17].
The aim of this study is to examine the impact of service quality dimensions on the satisfaction and WOM of Facebook users, and to investigate users’ sustainable use intention through the lens of satisfaction and WOM. We employed a hierarchical, four-dimensional model of service quality, including interaction quality, environment quality, outcome quality, and social quality. This exploratory study may provide further insight into the IM service area through the use of a four-dimensional framework. Moreover, to the best of our knowledge, no prior research has included the dimension of social quality or WOM to assess the sustainable use intention of Facebook users.
The rest of this paper is organized as follows. The next section presents the theoretical background. The following section elucidates the research methodology of the study. Empirical results and discussions are presented in Section 4 and Section 5, respectively. The final section concludes the paper with precious implications, limitations and future research guidelines.
2. Theoretical Background
2.1. Service Quality
The components of service quality have been extensively investigated in recent decades. Gronroos [19] argued that service quality is a complex concept that contains two different dimensions, technical quality and functional quality. Technical quality refers to which the customer receives from the service experience, and functional quality refers to the way in which the service is delivered. The Gronroos [19] scale has been criticized for its lack of an appropriate direction in improving service quality and validity, and Parasuraman et al. [20] conceptualized an alternative five-dimensional service quality model that includes reliability, assurance, tangibility, responsiveness, and empathy. Based on these five dimensions, they developed a 22-item instrument called SERVQUAL, which has been widely used and frequently cited in various service organizations, and considerable criticisms have also been raised questioning its reliability and validity [21,22,23]. Buttle [22] criticizes the disadvantages of SERVQUAL on two aspects. First, SERVQUAL focuses on the delivery process, but does not focus on the outcome of the service and the service environment when a service is rendered. Second, its dimensions are not universal and they may change across different industries. Coulthard [24] also criticizes SERVQUAL for its conceptual, methodological, and interpretative issues, and suggests that new approaches are needed to measure service quality.
As subsequent marketing studies have identified limitations of the SERVQUAL method, which in turn have led to the development of alternative instruments of analysis [21,23]. A three-dimensional service quality model was proposed by Rust and Oliver [25], comprising the service delivery, the service environment, and the service product. Dabholkar et al. [26] proposed a multilevel model of service quality comprising five primary dimensions (reliability, physical aspects, personal interactions, policy, and problem solving) and six secondary dimensions (appearance, promises, convenience, “doing it right”, inspiring confidence, and being courteous and helpful). In order to improve the SERVQUAL model, Cronin and Taylor [23] developed the SERVPERF model, which states that using performance scores alone can generate better reliability and validity than using different scores [27]. The SERVPERF model has been widely used in the retail banking industry [28], the healthcare industry [29], and the hairdressing industry [30].
Notably, an integrated hierarchical and multidimensional model was developed by Brady and Cronin [13]. They argued that service quality is an aggregate measure consisting of three major components: interaction quality, environment quality, and outcome quality. Each dimension in turn has three sub-dimensions that define the basis of service quality perceptions. This model has two distinct approaches that have been adopted from Rust and Oliver [25] and Dabholkar et al. [26], respectively. The Brady and Cronin [13] model has been verified and has gained attention in the service marketing literature. Additionally, it has been widely used to measure service quality in different industries, including the mobile telecom industry [5,12].
Recently, Lien et al. [7] employed the Brady and Cronin’s [13] hierarchical and multidimensional model to examine the impact of service quality on the satisfaction of WeChat users, and to evaluate the impact of satisfaction and stickiness on usage intentions in China. Other studies by Lu et al. [12] and Zhao et al. [5] have examined service quality in the context of mobile service using the Brady and Cronin [13] model. Given the importance of reliability and validity provided by these earlier studies, the current study adopts the Brady and Cronin [13] model to measure the service quality of Facebook.
The present study adopts the multidimensional service quality scale used by Lien et al. [7], due to the similarity of the research domain. In addition, the current study incorporates a new service quality dimension, social quality, which increases users’ continuous usage intention of SNS [30,31]. Social factors that influence the continuous intention of SNS use include perceived critical mass and social norms [32]. Friends on social media can provide substantial support to those who are experiencing low self-esteem and low life satisfaction [33]. Social interaction ties have an influence on customer value creation and stickiness toward SNS [34]. Social interaction quality refers to the communication of and interactions regarding opinions, feelings, and ideas between customers, companies, and others stakeholders [35]. The current study defines the dimension of social quality as the quality of social interaction ties. Interaction quality refers to the quality of a customer’s intention toward the mobile service provider during the service delivery [7,12]. Outcome quality is the consumer’s fulfillment of desires, which produces feelings about the experience [5,7]. Environment quality considers the basic elements of a service, including interface design, equipment quality, and service delivery extents [12].
2.2. Hypotheses
Interaction quality captures the buyer–seller interaction of the service delivery process. Interaction is important in order to develop the relationship between a buyer and a seller, which reflects the quality of a customer’s interaction with the seller throughout the service delivery process [12]. The interaction service quality dimension has significant positive influence on consumer satisfaction [5]. Surprisingly, Lien et al. [7] found that interaction quality had a negligible impact on customer satisfaction in their WeChat service study. They argued that customer satisfaction is highly dependent on environment quality, and suggested that the perfection of interface design and steady mobile telecommunication connectivity improve consumers’ perceived environment quality, thus improving their satisfaction level. Another study by Lu et al. [12] noted that environment quality of mobile services replicates the basic requirements (e.g., service delivery contexts, interface design, equipment quality) of using such services. Without an appropriate and effective environment, it would be difficult for clients to achieve their goals. In this regard, system reliability, navigation, and visual design connection qualities are considered to be important value-added service quality dimensions that influence customer satisfaction and value [36].
The outcome of a service is what customers receive from the service. It is believed that customer satisfaction with mobile services is mostly predicted by outcome quality [7]. Outcome quality includes punctuality of service delivery, tangible evidence, and intangible valence [12]. It is directly related to the user’s fulfillment of desires, which produces feelings about the experience. However, customers give more attention to outcome quality when cumulative satisfaction is assessed [5]. Social interaction quality refers to the communication of and interactions regarding opinions, feelings, and ideas among customers, companies, and others stakeholders [35]. A substantial number of studies have shown a causal relationship between social quality and customer value creation. As argued from the perspective of the social capital theory, social interaction is the prime factor in determining continuous use intention among Facebook users [37]. Additionally, social interaction ties have a strong, positive effect on hedonic and social value creation, which affects the stickiness of mobile services [34].
An increasing number of consumers use Web 2.0 tools, such as social networking sites, online blogs, and consumer review sites, to share their opinions and exchange product information; this is termed “e-WOM” [38]. One study based on healthcare services argued that service quality directly affects consumers’ WOM communication [39]. In addition, Gounaris et al. [40] demonstrated how electronic service quality influences WOM communication of e-consumers, and suggested that e-service quality positively impacts e-consumer satisfaction, WOM communication, and use intentions. When customers are loyal to a given e-service provider, they are willing to communicate positive information about the service and the provider [41]. Thus, this study asserts the following hypotheses:
Hypothesis 1a (H1a).
Interaction quality has significant positive influence on users’ satisfaction with Facebook.
Hypothesis 1b (H1b).
Environment quality has significant positive influence on users’ satisfaction with Facebook.
Hypothesis 1c (H1c).
Social quality has significant positive influence on users’ satisfaction with Facebook.
Hypothesis 1d (H1d).
Outcome quality has significant positive influence on users’ satisfaction with Facebook.
Hypothesis 2a (H2a).
Interaction quality has significant positive influence on users’ WOM communication regarding Facebook.
Hypothesis 2b (H2b).
Environment quality has significant positive influence on users’ WOM communication regarding Facebook.
Hypothesis 2c (H2c).
Social quality has significant positive influence on users’ WOM communication regarding Facebook.
Hypothesis 2d (H2d).
Outcome quality has significant positive influence on users’ WOM communication regarding Facebook.
Customer satisfaction plays a significant role in service marketing, as it is a prominent predictor of subsequent behavior of customers. Satisfaction refers to the comparison between perceived performance and expectations (e.g., expectancy disconfirmation theory). In the study of SNS mobile service quality, customer satisfaction was identified to exert a positive influence on the continuous usage intention of WeChat mobile service users [7]. Higher customer satisfaction (both transaction-specific and cumulative satisfaction) formulates and preserves more sustainable and long-term relationships between customers and service providers [5]. Satisfied customers tend to maintain their intention of use and are likely to have positive WOM communication as well [17,18]. Satisfied customers are more likely to be motivated to share their experiences using WOM with other Web 2.0 users [42,43]. These results suggest that customer satisfaction has a positive relationship with both sustainable use intention and WOM. Thus, this study proposes the following hypotheses:
Hypothesis 3a (H3a).
User satisfaction has a significant positive influence on sustainable use intention.
Hypothesis 3b (H3b).
User satisfaction has a significant positive influence on WOM communication regarding Facebook.
Parasuraman et al. [44] argued that service quality and satisfaction are the most important factors in discussing WOM as a specific type of behavioral intentions. They argued that if customer perception of service quality is high, consumers will recommend the service to others, which may also indicate the sustainable use intention of the consumer. The SNS has become the universal e-WOM channel, through which brand-related information and influence usage intention, decision-making, and attitudes toward services are shared [18]. Additionally, it has been suggested that e-WOM has a significant positive influence on the continuous usage intention of Web 2.0 users [17]. In a study of WOM in the context of movies, it was found that WOM communication holds significant explanatory power for both collective and weekly box office income [16]. Considering the importance of WOM communication and its subsequent impact, it is reasonable to predict that Facebook users’ WOM communication significantly influences their sustainable use intentions. Hence, the following hypothesis is proposed:
Hypothesis 4 (H4).
WOM communication has significant positive influence on sustainable use intention of Facebook.
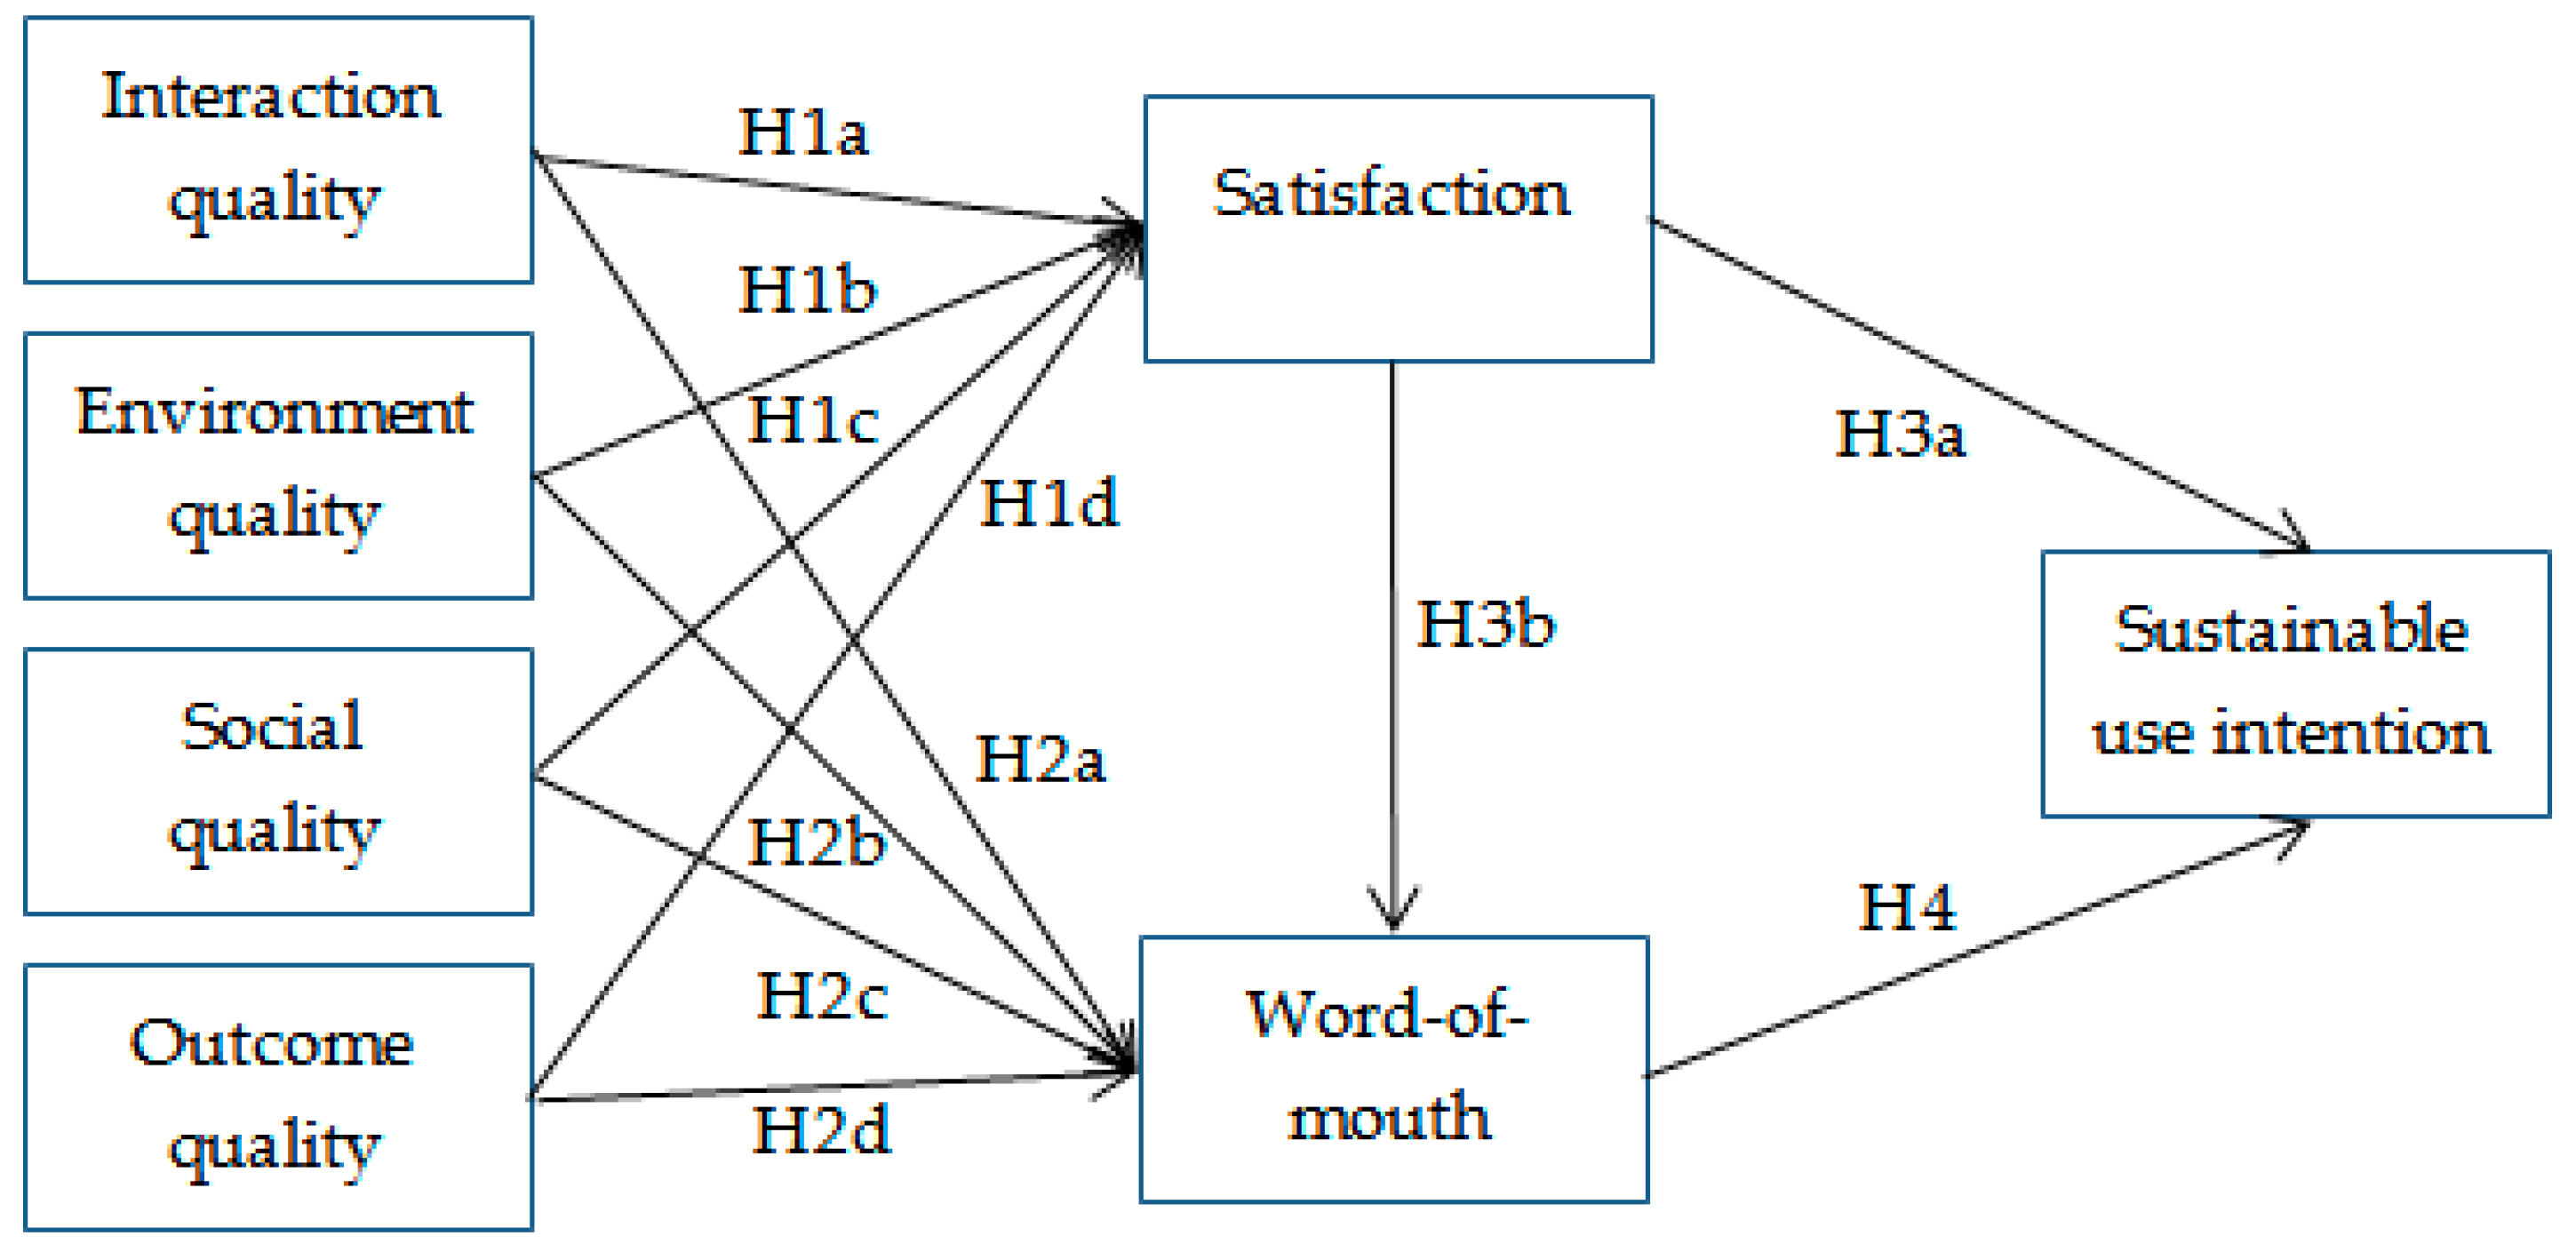
Figure 1 shows the sustainable use intention of SNS as a result of direct and indirect relationships with service quality, satisfaction, and WOM. Service quality, for its part, is presented as a multidimensional concept, consisting of the service’s interaction quality, environment quality, social quality, and outcome quality. The rationale for this conceptual model is derived from the theories and findings of previous SNS research [5,7,12,36]. The constructs considered in this study and the justification for linkages between individual concepts, as well as further details regarding the theories, on which they rely, were discussed in this section.
3. Research Methodology
3.1. Instrument Development
The survey questionnaire comprised seven constructs, outcome quality, environment quality, social quality, interaction quality, WOM, satisfaction, and sustainable use intention, as well as demographic information for each respondent. This study derived the measurements of all constructs from previous studies with some modifications to fit the constructs in this market context. The measures of outcome quality, environment quality, and interaction quality were adopted and modified from Lu et al. [12] and Lien et al. [7]. Additionally, social quality was modified from Zhang et al. [45]. User satisfaction and sustainable use intention were adopted and modified from Zhang et al. [45]. The construct of WOM was adopted from Hennig et al. [43] and Chen et al. [17]. Table 1 shows a detailed review of measurement items.
This study used a self-administered structure questionnaire to collect data. Questionnaire items were examined by educational and professional researchers. To measure the consistency, order, and relevancy of the questionnaire design, a pilot study was conducted with 25 respondents. Based on the modifications and changes, the final items of the questionnaire were set to 35 questions (5 items for each construct). In order to obtain the model fit, two items were removed from the social quality construct and one item was removed from the rest of the constructs. Thus, a total of 27 items were considered for the final analysis. The questionnaire was developed on a five-point Likert scale ranging from strongly agree (1) to strongly disagree (5).
3.2. Data Collection
The online survey method with random sampling was used to conduct the formal survey in November 2017 in Bangladesh. In this study, we applied an online survey method using Google Docs. Lien et al. [7] used an online data collection method to examine service quality, satisfaction, stickiness, and usage intention in a study with a sample size of 310 WeChat users. Similarly, Zhang et al. [45] used an online data collection method for their study on WeChat consisting of 240 valid respondents. The questionnaire link was distributed on the authors Facebook wall, sent to different Facebook groups and individual inboxes as well. The participants were directed to the online questionnaire by clicking on link. The purpose of the study and instructions were given on the first page of the online questionnaire. In addition, it was acknowledged that all information provided would be kept confidential. The respondents were confined to Facebook users with at least one year of experience as the goal is to explore the relationship between multidimensional service quality and sustainable use intention. Initially, 351 complete responses were received, but after data cleaning (missing data, outliers, and normality test) was successfully performed, 307 valid responses remained for subsequent analysis. All responses were analyzed through SPSS and Amos version 24 (IBM, Armonk, NY, USA).
Table 2 shows a detailed review of the demographic profile of respondents. We conducted frequency analysis for the general characteristics of the respondents. There were slightly more males than females; 56.4% of participants are male and 43.6% are female, and 42% are between the ages of 22 and 25 years. Overall, 45% of the respondents answered that they spend more than one hour per day on Facebook, and 88.3% of them have been connected to Facebook for more than three years.
3.3. Evaluation of Common Method Bias
In order to ensure the validity of the study, we tested common method variance (CMV) because the collected data were perceptual and from a single source at the same time. Problems with CMV could lead to either over- or under-estimation of the antecedents among regressive and explanatory variables. This study carried out the Harman’s single-factor test for the assessment of CMV problems. CMV issues can arise if all indicators fall under a single construct, or if the first construct explains the majority of the variance in the data. However, the test results confirmed that the first factor explained 37.7% of the variance, and several factors showed eigenvalues greater than one, representing the elimination of any CMV problems from the data [46].
4. Empirical Results
This study employed structural equation modeling (SEM) for data analysis and hypothesis testing. In particular, the Amos-24 data analysis tool was used to perform the test because it facilitates a real-time assessment of both the measurement model and the structural model. Specifically, this technique significantly helps to verify reliability and validity of the measurement model, and helps to explain the theoretical relationships among constructs within the structural model. In addition, it measures some model fit indices, which confirm its strength.
4.1. Measurement Model Assessment
Convergent validity is performed to test whether the considered elements in a construct are theoretically related. Confirmatory factor analysis (CFI) and average variance extracted (AVE) are the two most important measures of convergent validity. As shown in Table 3, all measurement items strongly reflected their convergent validity. Results demonstrated that the standardized factor loadings are greater than or equal to 0.70 (with few exceptions), which represents the recommended critical value [47]. Additionally, AVE values ranged from 0.502 to 0.602, which fall very close to the recommended critical value of 0.50 [48]. Construct reliability evaluates the degree, to which operationalization correctly measures the targeted variables. This reliability can be measured by composite reliability (CR) and Cronbach’s alpha. The values of CR ranged from 0.751 to 0.859, which are higher than the benchmark value of 0.70. Cronbanch’s alpha values ranged from 0.74 to 0.84, which support the critical value of 0.70. These results supported the reliability of the measurement model [48].
Table 4 presents discriminant validity and model fit statistics. Discriminant validity explains that the measurement model is not a reflection of other variables that should not be related. Discriminant validity was examined by comparing the square root of AVE with the correlation values among the constructs. Results showed that the square roots of AVE for all constructs in the diagonal row are larger than the correlations between the constructs. Therefore, it can be affirmed that the measurement model has good discriminant validity. Furthermore, multicollinearity among the independent variables was assessed through the variance inflation factor (VIF); values ranged from 1.32 to 2.23, all of which are well below the acceptable level of 10.0 [48]. Tolerance values ranged from 0.44 to 0.75, further strengthening the model.
Upon satisfaction of validity and reliability of the individual constructs and the measurement model, the study proceeded to validate fitness of the overall measurement model. Complete standardized solutions produced by AMOS-24 representing all 27 items were loaded highly on their corresponding constructs. To estimate the overall fit of the measurement model, the following analyses were included: the ratio of chi-square to degrees of freedom (CMIN/df), the CFI, the goodness-of-fit index (GFI), the adjusted GFI, the normalized fit index (NFI), the Tucker-Lewis index (TLI), the incremental fit index (IFI), and the root mean square error of approximation (RMSEA). All of these assessments satisfied their respective value standards, indicating a good fit for the model as a whole [48,49,50].
4.2. Structural Model Assessment
Table 5 shows the hypothesized paths, parameter standardized β values, standardized errors, p values, and acceptance or rejection of the hypotheses. The quality of association among constructs was assessed by inspecting their respective standardized path coefficients (β values) and significance values (p values). The results supported nine of 11 hypotheses. Satisfaction is significantly predicted by interaction quality (β = 0.133, p < 0.001), environment quality (β = 0.288, p < 0.001), social quality (β = 0.095, p < 0.001), and outcome quality (β = 0.274, p < 0.001), indicating support for Hypotheses H1a, H1b, H1c, and H1d. Interaction quality (β = 0.172, p < 0.001) and outcome quality (β = 0.201, p < 0.001) were found to have significant positive effects on WOM for Facebook users, supporting H2a and H2d. However, environment quality and social quality do not have significant effects on WOM, thus leading to the rejection of H2b and H2c. Satisfaction has significant positive impacts on use intention (β = 0.536, p < 0.001) and WOM (β = 0.473, p < 0.001), which supports H3a and H3b, respectively. Finally, the influence of WOM (β = 0.255, p < 0.001) on use intention was statistically significant, supporting H4. These results showed that the sustainable use intention of Facebook users is most affected by their satisfaction with the service (the total effect = 0.657). The structural model explained 40% of the variance in satisfaction, 55% of the variance in WOM, and 54% of the variance in the sustainable use intention of Facebook. The overall model fit indices reflected the good fit of the structural model (CFI = 0.972, GFI = 0.973, AGFI = 0.812, NFI = 0.968, and IFI = 0.972).
5. Discussion
The immense popularity of social media around the world warrants increased attention to the psychological mechanisms and motivations behind sustainable use. Building on a recognized tradition of applying the multidimensional service quality framework to understand social media behavior, the current study takes a unique and comprehensive approach to investigating how service quality dimensions generate sustainable use intention of Facebook. The results showed that service quality dimensions, such as interaction, outcome, and environment quality, significantly impact the satisfaction of Facebook users, which is consistent with previous studies [5,12,36] among others. The interaction quality of the service is the way users perceive Facebook’s friends and its authority in the interaction period. Interaction quality is one of the most important dimensions of service quality to satisfy the user, since it is inseparable and intangible. There is a wide scope of helping each other by showing a friendly approach, a willingness to solve problems, sharing realistic guidelines according to need, and so on. Outcome quality represents what the user actually gets from the service. In order to satisfy users, the SNS should provide the right information quickly, deliver users with timely feedback and offer personalized advertising based on the messages they have shared. In addition, to maintain attractive environment quality and enforce novelty, SNS designers can improve interfaces and update them frequently with useful tools, expressions, or icons.
The newly incorporated social quality dimension shows a significant relationship with user satisfaction. This finding is consistent with Wang and Chen [31], and Chan et al. [32], who found that social quality could improve the continuous usage intention of SNS users. Social factors, in general, lead to individual behavior. In the context of SNS, social presence, social interaction ties, and social norms are reliably predictive to user satisfaction. Maintaining social relationships and social support is the important motivators for using SNS. Furthermore, interaction and outcome quality significantly predict WOM, which corroborate the results of earlier studies [38,40]. This revealed that favorable perceptions of service quality lead to a self-marketing campaign through WOM. Whenever users experience friendly interaction and realistic feedback, they tend to say a few words about the services.
Our results demonstrated the greater impact of user satisfaction on sustainable use intention and WOM, as supported by previous studies by Lien et al. [7], Chan et al. [32], and Hennig et al. [43], who argued that satisfaction strongly influences users’ continuous usage intention and WOM. This study also validated the influence of WOM on usage intention, which supports the results of Chen et al. [17]. When users perceive a higher level of satisfaction, they generate an intention to sustainable use and participate voluntarily in the gossip towards the service. Since Facebook comprises communication media, multimedia, online entertainment, blogs, and even electronic business opportunities, the sustainable use intention becomes a burning issue. Hence, these results revealed that user satisfaction and WOM communication play a vital role in maintaining sustainable use intention. In addition, these mechanisms are also a strong consequence of service quality dimensions.
However, two Hypotheses H2b and H2c were rejected in this study, allowing for future considerations. The environment and social dimensions of service quality have no significant impact on WOM. It is possible that Facebook users may not consider these two dimensions to be primary motivating factors for WOM communication; in other words, users might consider interaction and outcome quality to be their motivating factors for WOM. Another potential explanation could be that individuals are unaware or skeptical of these dimensions. In addition, Facebook users may be sensitive about an egoistic quality that plays an important, yet unwanted, role in determining WOM.
6. Conclusions
This study investigated the sustainable use intention of Facebook users through the lens of multidimensional and hierarchical service quality theory. The results of the study have supported the research model as having good explanatory power in predicting sustainable use intention of Facebook users. The current study has provided a better understanding of the service quality dimensions that are most influential to Facebook customers’ satisfaction and WOM, which ultimately affect their sustainable use intention. Particularly, all dimensions of service quality, i.e., interaction, environment, social, and outcome service quality, are positively and significantly related to user satisfaction, whereas interaction and outcome quality are significantly related to WOM communication. In addition, the impact of user satisfaction on sustainable use intention and WOM is significantly positive, and WOM also has a significant positive impact on sustainable use intention.
This study will contribute extensively to the literature surrounding SNS research by validating the influence of hierarchical service quality dimensions on satisfaction and WOM, and assessing the impact of Facebook users’ satisfaction and WOM on their sustainable use intent. Based on these findings, the study offers several points that further develop the theory. First, prior studies have applied multidimensional service quality theory to various SNS in the context of developed countries [7,12,43]. The current study confirms the generalizability and predictive power of this theory in the context of emerging economies as well. Second, this study has incorporated the social quality dimension into the model, and confirms both its direct impact on satisfaction and its indirect impact on intended use. These results open a new avenue for future research. Third, the results confirm that outcome and environment quality are the best predictors of Facebook users’ satisfaction, and that interaction and social quality have only mild effects on satisfaction. The study also confirms that satisfaction and WOM are valuable predictors of sustainable use intention. These findings provide deeper insights into understanding perceived service quality and the factors that affect it, as well as the ways in which these factors influence use intention of Facebook.
Sustainable use intention has been increasingly important in the context of intense competition among SNS providers; thus, this study provides a number of business implications that may aid in producing valuable SNS users in the long term. First, this study showed that outcome and environment quality should be prioritized in order to increase Facebook users’ satisfaction. Therefore, Facebook managers should be careful to monitor the information shared on Facebook pages, and remain aware of users’ experiences with network externalities and useful features. Second, managers should strengthen interaction and social quality in order to increase user satisfaction. SNS managers should be aware of critical issues arising from users’ experiences, as these are the predominant predictors of sustainable use intention. SNS developers can provide features, such as a “friend finder” to alert users to newly added friends. This type of approach improves relationship quality and supports WOM, which immediately contribute to sustainable use intentions. Third, in highlighting the importance of satisfaction and WOM, SNS managers should continually integrate and improve useful features and various value added activities to better enable users to reach each other; to enhance social interactions, satisfaction, and trust; and to further increase users’ intention. Finally, the results of the study showed a mechanism that builds the intended use of SNS users, and thus practitioners or managers may apply this mechanism to achieve a loyal user base.
Despite the significant theoretical and managerial implications, this study has some limitations that present opportunities for further research. First, as we measured satisfaction based only on various dimensions of service quality, other factors, such as trust or subjective norms, have not been examined in this context. Second, this study incorporated the social quality dimension into the research model and validated it by cross-sectional data analysis. Since social quality has not previously been investigated in this manner, more studies on Facebook or other SNSs should be investigated to confirm the results of the present study. Moreover, the generalization of the results is dubious because of its sample restricted with single county users, and a more diverse and balanced sample should, therefore, be used in future studies to broaden the understanding of the relationship between service quality dimensions and sustainable use intention.
Therefore, we suggest that future researchers examine the theoretical research model provided in this study by focusing on representatives of other potential factors that are not considered in this study. The construct of social quality should be studied more carefully by future research to determine its direct and indirect impact on user satisfaction, WOM and sustainable use intention. In addition, future trials might benefit from using cross-national samples to examine the more generalized results. There might also be room for a more integrated model that includes other SNS contexts to give more clear and complete insights into the relationship between service quality dimensions and sustainable use intention.
Author Contributions
M.A.H. wrote the paper and designed the survey. M.K. suggested research ideas and contributed to the writing and revision of the paper.
Conflicts of Interest
The authors declare no conflicts of interest.
References
- Jang, Y.T.; Chang, S.E.; Chen, P.A. Exploring social networking sites for facilitating multi-channel retailing. Multimed. Tools Appl. 2015, 74, 159–178. [Google Scholar] [CrossRef]
- Chang, S.E.; Liu, A.Y.; Shen, W.C. User trust in social networking services: A comparison of Facebook and LinkedIn. Comput. Hum. Behav. 2017, 69, 207–217. [Google Scholar] [CrossRef]
- Wang, W.; Hsieh, J.P.A.; Song, B. Understanding user satisfaction with instant messaging: An empirical study. Int. J. Hum. Comput. Int. 2012, 28, 153–162. [Google Scholar] [CrossRef]
- Statista. Number of Monthly Active Facebook Users Worldwide. 2018. Available online: https://www.statista.com/statistics/272014/global-social-networks-ranked-by-number-of-users/ (accessed on 3 February 2018).
- Zhao, L.; Lu, Y.; Zhang, L.; Chau, P.Y.K. Assessing the effects of service quality and justice on customer satisfaction and the continuance intention of mobile value-added services: An empirical test of a multidimensional model. Decis. Support Syst. 2012, 52, 645–656. [Google Scholar] [CrossRef]
- Nikou, S.; Bouwman, H. Ubiquitous use of mobile social network services. Telemat. Inform. 2014, 31, 422–433. [Google Scholar] [CrossRef]
- Lien, C.H.; Cao, Y.; Zhou, X. Service quality, satisfaction, stickiness and usage intentions: An exploratory evaluation in the context of WeChat services. Comput. Hum. Behav. 2017, 68, 403–410. [Google Scholar] [CrossRef]
- Kowatsch, T.; Maass, W. In-store consumer behavior: How mobile recommendation agents influence usage intentions, product purchases, and store preferences. Comput. Hum. Behav. 2010, 26, 697–704. [Google Scholar] [CrossRef] [Green Version]
- Boehmer, J.; Lacy, S. Sport news on facebook: The relationship between interactivity and readers’ browsing behavior. Int. J. Sport Commun. 2014, 7, 1–15. [Google Scholar] [CrossRef]
- Lee, I.S.; Lee, E.S. The relationships among Needs for Self-expression, SNS’s Social Function and Continued Use Intention of SNS Users. Korea Logist. Rev. 2017, 27, 147–161. [Google Scholar] [CrossRef]
- Lee, S.Y.; Jeong, E.S. An Exploratory Study on Social Network Services in the Context of Web 2.0 Period. Manag. Inf. Syst. Rev. 2010, 29, 143–167. [Google Scholar]
- Lu, Y.; Zhang, L.; Wang, B. A multidimensional and hierarchical model of mobile service quality. Electron. Commer. Res. Appl. 2009, 8, 228–240. [Google Scholar] [CrossRef]
- Brady, M.K.; Cronin, J. Some new thoughts on conceptualizing perceived service quality: A hierarchical approach. J. Mark. 2001, 65, 34–49. [Google Scholar] [CrossRef]
- Haruna, B.; Kiran, K.; Tahira, M. Modeling web-based library service quality and user loyalty in the context of a developing country. Electron. Libr. 2017, 35, 507–519. [Google Scholar] [CrossRef]
- Clemes, M.D.; Gan, C.; Ren, M. Synthesizing the effects of service quality, value, and customer satisfaction on behavioral intentions in the motel industry: An empirical analysis. J. Hosp. Tour. Res. 2011, 35, 530–568. [Google Scholar] [CrossRef]
- Liu, Y. Word of Mouth for Movies: Its Dynamics and Impact on Box Office Revenue. J. Mark. 2006, 70, 74–89. [Google Scholar] [CrossRef]
- Chen, S.C.; Yen, D.C.; Hwang, M.I. Factors influencing the continuance intention to the usage of Web 2.0: An empirical study. Comput. Hum. Behav. 2012, 28, 933–941. [Google Scholar] [CrossRef]
- Wang, T.; Yeh, R.K.-J.; Chen, C.; Tsydypov, Z. What drives electronic word-of-mouth on social networking sites? Perspective of social capital and self-determination. Telemat. Informat. 2016, 33, 1034–1047. [Google Scholar] [CrossRef]
- Gronroos, C.A. Service quality model and its marketing implications. Eur. J. Mark. 1984, 18, 36–44. [Google Scholar] [CrossRef]
- Parasuraman, A.; Zeithaml, V.A.; Berry, L.L. SERVQUAL: A multiple-item scale for measuring consumer perceptions of service quality. J. Retail. 1988, 64, 12–40. [Google Scholar]
- Dyke, T.P.V.; Kappelman, L.A.; Prybutok, V.R. Measuring information systems service quality: Concerns on the use of the SERVQUAL questionnaire. MIS Q. 1997, 21, 195–208. [Google Scholar] [CrossRef]
- Buttle, F. Review, Critique, Research Agenda. Eur. J. Mark. 1996, 30, 8–32. [Google Scholar] [CrossRef]
- Cronin, J.J.; Taylor, S.A. Measuring service quality: A reexamination and extension. J. Mark. 1992, 56, 55–68. [Google Scholar] [CrossRef]
- Coulthard, L.J.M. Measuring Service Quality: A Review and Critique of Research Using SERVQUAL. Int. J. Mark. Res. 2004, 46, 479–497. [Google Scholar] [CrossRef]
- Rust, R.; Oliver, R.L. Service Quality: Insights and Managerial Implications from the Frontier; Sage Publications: Thousand Oaks, CA, USA, 1994. [Google Scholar]
- Dabholkar, P.A.; Thorpe, D.I.; Rentz, J.O. A measure of service quality for retail stores: Scale development and validation. J. Acad. Mark. Sci. 1996, 24, 3–16. [Google Scholar] [CrossRef]
- Caro, L.M.; Garcia, J.A.M. Developing a multidimensional and hierarchical service quality model for the travel agency industry. Tour. Manag. 2008, 29, 706–720. [Google Scholar] [CrossRef]
- Olorunniwo, F.; Hsu, M.K. A typology analysis of service quality, customer satisfaction and customer behavioral intentions in mass services. Manag. Serv. Qual. 2006, 16, 106–123. [Google Scholar] [CrossRef]
- Kim, S.M.; Oh, J.Y. Employee emotional response toward healthcare organization’s service recovery efforts and its influences on service recovery performance. Serv. Bus. 2012, 6, 297–321. [Google Scholar] [CrossRef]
- Chen, Z.; Zhu, J.; Zhou, M. How does a servant leader fuel the service fire? A multilevel model of servant leadership, individual selfidentity, group competition climate, and customer service performance. J. Appl. Psychol. 2015, 100, 511–521. [Google Scholar] [CrossRef] [PubMed]
- Wang, E.S.; Chen, L.S. Forming relationship commitments to online communities: The role of social motivations. Comput. Hum. Behav. 2012, 28, 570–575. [Google Scholar] [CrossRef]
- Chan, T.K.H.; Cheung, C.M.K.; Shi, N.; Lee, M.K.O.; Lee, Z.W.Y. An Empirical Examination of Continuance Intention of Social Networking Sites. Pac. Asia J. Assoc. Inform. Syst. 2016, 8, 69–90. [Google Scholar]
- Ellison, N.B.; Steinfield, C.; Lampe, C. The Benefits of Facebook “Friends”: Social Capital and College Students’ Use of Online Knowledge Sharing Among Tourists via Social Media Social Network Sites. J. Comput. Med. Commun. 2007, 12, 1143–1168. [Google Scholar] [CrossRef]
- Zhang, M.; Guo, L.; Hu, M.; Liu, W. Influence of customer engagement with company social networks on stickiness: Mediating effect of customer value creation. Int. J. Inf. Manag. 2017, 37, 229–240. [Google Scholar] [CrossRef]
- Vivek, S.D. A Scale of Consumer Engagement. Ph.D. Thesis, The University of Alabama, Tuscaloosa, AL, USA, 2009. [Google Scholar]
- Kuo, Y.F.; Wu, C.M.; Deng, W.J. The relationships among service quality, customer satisfaction, and post-purchase intention in mobile value-added services. Comput. Hum. Behav. 2009, 25, 887–896. [Google Scholar] [CrossRef]
- Lin, K.Y.; Lu, H.P. Intention of Continue Using Facebook Fan Pages from the Perspective of Social Capital Theory. Cyberpsychol. Behav. Soc. Netw. 2011, 14, 565–571. [Google Scholar] [CrossRef] [PubMed]
- Gupta, P.; Harris, J. How e-WOM recommendations influence product consideration and quality of choice: A motivation to process information perspective. J. Bus. Res. 2005, 63, 1041–1049. [Google Scholar] [CrossRef]
- Chaniotakis, I.E.; Lymperopoulos, C. Service quality effect on satisfaction and word of mouth in the health care industry. Manag. Serv. Qual. 2009, 19, 229–242. [Google Scholar] [CrossRef]
- Gounaris, S.; Dimitriadis, S.; Stathakapolos, V. An examination of the effects of service quality and satisfaction on consumers’ behavioral intentions in e-shoping. J. Serv. Mark. 2010, 24, 142–156. [Google Scholar] [CrossRef]
- Srinivasan, S.S.; Anderson, R.; Ponnavolu, K. Customer loyalty in e-commerce: An explanation of its antecedents and consequences. J. Retail. 2002, 78, 41–50. [Google Scholar] [CrossRef]
- Gelb, B.D.; Sundaram, S. Adapting to word of mouse. Bus. Horiz. 2002, 45, 21–25. [Google Scholar] [CrossRef]
- Hennig, T.T.; Gwinner, K.P.; Walsh, G.; Gremler, D.D. Electronic word-of-mouth via consumer-opinion platforms: What motivates consumers to articulate themselves on the Internet. J. Int. Mark. 2004, 18, 38–52. [Google Scholar] [CrossRef]
- Parasuraman, A.; Zeitham, V.A.; Berry, L.L. Perceived service quality as a customer-based performance measure: An empirical examination of organizational barriers using an extended service quality model. Hum. Resour. Manag. 1991, 30, 335–364. [Google Scholar] [CrossRef]
- Zhang, C.B.; Li, Y.N.; Wu, B.; Li, D.J. How WeChat can retain users: Roles of network externalities, social interaction ties, and perceived values in building continuance intention. J. Comput. Hum. Behav. 2017, 69, 284–293. [Google Scholar] [CrossRef]
- Podsakoff, P.M.; MacKenzie, S.B.; Lee, J.Y.; Podsakoff, N.P. Common method biases in behavioral research: A critical review of the literature and recommended remedies. J. Appl. Psychol. 2003, 88, 879–903. [Google Scholar] [CrossRef] [PubMed]
- Carmines, E.G.; Zeller, R.A. Reliability and Validity Assessment (17); Sage Publications: Beverly Hills, CA, USA, 1979. [Google Scholar]
- Hair, J.F.; Black, W.C.; Babin, B.J.; Anderson, R.E.; Tatham, R.L. Multivariate Data Analysis, 7th ed.; Pearson Education Inc.: New York, NY, USA, 2010. [Google Scholar]
- Doll, J.W.; Xia, W.; Torkzadeh, G. A confirmatory factor analysis of the end-user computing satisfaction instrument. MIS Q. 1994, 18, 453–461. [Google Scholar] [CrossRef]
- Browne, M.W.; Cudeck, R. Alternative ways of assessing model fit. In Testing Structural Equation Models; Bollen, K.A., Long, J.S., Eds.; Sage: Newbury Park, CA, USA, 1993; pp. 136–162. [Google Scholar]
Figure 1.
The conceptual research model.


Table 1.
Constructs and Items.
| Constructs | Items | |
|---|---|---|
| Outcome quality Lien et al. [7], Lu et al. [12] | OQ1 | I can save considerable time and effort with Facebook communication. |
| OQ2 | Facebook delivers information very quickly. | |
| OQ3 | Facebook provides important information. | |
| OQ4 | Facebook tries to give me a good experience. | |
| Environment quality Lien et al. [7], Lu et al. [12] | EQ1 | Facebook display is easy to use. |
| EQ3 | Facebook provides useful ‘emotional expression’ icons. | |
| EQ4 | Facebook provides useful supporting tools (e.g., photo and message sharing). | |
| EQ5 | I would say Facebook’s interface design is creative. | |
| Social quality Zhang et al. [45] | SQ1 | Facebook brings my friends and family together. |
| SQ2 | Facebook helps to strengthen my network with other people. | |
| SQ4 | Facebook is helpful for maintaining social relationships. | |
| Interaction quality Lien et al. [7], Lu et al. [12] | IQ2 | Facebook authorities are very friendly. |
| IQ3 | Facebook authorities are willing to solve my problems. | |
| IQ4 | Facebook is able to answer my questions thoroughly. | |
| IQ5 | Overall, Facebook interaction/chatting quality is good. | |
| Word-of-mouth Chen et al. [17], Henning et al. [43] | WOM2 | I have many good things to say about Facebook services. |
| WOM3 | I would say positive things about Facebook. | |
| WOM4 | I recommend use of Facebook among peers and relatives. | |
| WOM5 | I am ready to tell other people that I use Facebook. | |
| Satisfaction Zhang et al. [45] | SAT1 | I feel satisfied using Facebook. |
| SAT2 | I feel pleasant using Facebook. | |
| SAT3 | I feel enjoyment using Facebook. | |
| SAT4 | Facebook has met my expectations. | |
| Sustainable use intention Zhang et al. [45] | INT1 | I will use Facebook in the future. |
| INT3 | I would use Facebook more than any other networks. | |
| INT4 | I would visit Facebook as often as I can. | |
| INT5 | I usually open Facebook when I am online. | |
Source: review of literature.
Table 2.
Demographic profile of respondents.
| Characteristics (N = 307) | Frequency | Percentage |
|---|---|---|
| Gender | ||
| Male | 173 | 56.4 |
| Female | 134 | 43.6 |
| Age group (years) | ||
| Under 18 | 01 | 0.30 |
| 18–21 | 43 | 14.0 |
| 22–25 | 131 | 42.0 |
| 26–30 | 62 | 20.0 |
| Over 30 | 70 | 22.8 |
| Facebook usage per day | ||
| Less than 20 min | 18 | 5.80 |
| 20–40 min | 56 | 18.3 |
| 40–60 min | 92 | 30.0 |
| More than 60 min | 141 | 45.9 |
| Facebook experience (years) | ||
| 1–2 years | 16 | 5.21 |
| 2–3 years | 20 | 6.50 |
| More than 3 years | 271 | 88.3 |
| Occupation | ||
| Government employee | 47 | 15.3 |
| Private employee | 91 | 29.6 |
| Business | 22 | 7.20 |
| Student | 139 | 42.0 |
| Other | 18 | 5.90 |
Source: survey data.
Table 3.
Standardized estimates, and reliability statistics.
| Measurement Construct | Item | Standardized Factor Loadings | p | Average Variance Extracted (AVE) | Composite Reliability (CR) | Cronbach’s Alpha (α) |
|---|---|---|---|---|---|---|
| Outcome quality | 0.55 | 0.83 | 0.82 | |||
| (GFI = 0.969, CFI = 0.963, NFI = 0.959) | OQ1 | 0.657 | *** | |||
| OQ2 | 0.779 | *** | ||||
| OQ3 | 0.797 | *** | ||||
| OQ4 | 0.725 | |||||
| Environment quality | 0.50 | 0.80 | 0.79 | |||
| (GFI = 0.994, CFI = 0.993, NFI = 0.990) | EQ1 | 0.746 | *** | |||
| EQ3 | 0.750 | *** | ||||
| EQ4 | 0.696 | *** | ||||
| EQ5 | 0.638 | |||||
| Social quality | 0.51 | 0.75 | 0.74 | |||
| (GFI = 1.00, CFI = 1.00, NFI = 1.00) | SQ1 | 0.727 | *** | |||
| SQ2 | 0.794 | *** | ||||
| SQ4 | 0.598 | |||||
| Interaction quality | 0.52 | 0.81 | 0.80 | |||
| (GFI = 0.992, CFI = 0.992, NFI = 0.987) | IQ2 | 0.701 | *** | |||
| IQ3 | 0.811 | *** | ||||
| IQ4 | 0.761 | *** | ||||
| IQ5 | 0.602 | |||||
| Word-of-mouth | 0.53 | 0.82 | 0.80 | |||
| (GFI = 0.978, CFI = 0.973, NFI = 0.968) | WOM2 | 0.763 | *** | |||
| WOM3 | 0.765 | *** | ||||
| WOM4 | 0.757 | *** | ||||
| WOM5 | 0.605 | |||||
| Satisfaction | 0.60 | 0.86 | 0.84 | |||
| (GFI = 0.995, CFI = 0.998, NFI = 0.994) | SAT1 | 0.824 | *** | |||
| SAT2 | 0.876 | *** | ||||
| SAT3 | 0.730 | *** | ||||
| SAT4 | 0.657 | |||||
| Sustainable use intention | 0.52 | 0.81 | 0.81 | |||
| (GFI = 0.983, CFI = 0.980, NFI = 0.976) | INT1 | 0.770 | *** | |||
| INT3 | 0.667 | *** | ||||
| INT4 | 0.640 | *** | ||||
| INT5 | 0.787 | |||||
Note: *** p < 0.001. Source: SEM-Amos output and reliability analysis.
Table 4.
Discriminant validity and model fit indices.
| Mean | Std. Deviation | 1 | 2 | 3 | 4 | 5 | 6 | 7 | VIF | Tolerance | ||||
|---|---|---|---|---|---|---|---|---|---|---|---|---|---|---|
| 1. Outcome quality | 3.85 | 0.78 | 0.75 | 2.23 | 0.44 | |||||||||
| 2. Environment quality | 3.89 | 0.76 | 0.69 | 0.71 | 1.95 | 0.51 | ||||||||
| 3. Social quality | 4.09 | 0.73 | 0.58 | 0.55 | 0.72 | 1.37 | 0.73 | |||||||
| 4. Interaction quality | 3.33 | 0.77 | 0.48 | 0.32 | 0.36 | 0.72 | 1.32 | 0.75 | ||||||
| 5. Word-of-mouth | 3.62 | 0.74 | 0.69 | 0.60 | 0.48 | 0.50 | 0.73 | 2.20 | 0.45 | |||||
| 6. Satisfaction | 3.71 | 0.75 | 0.63 | 0.65 | 0.48 | 0.38 | 0.68 | 0.78 | 2.14 | 0.46 | ||||
| 7. Sustainable use | 3.85 | 0.76 | 0.65 | 0.70 | 0.52 | 0.40 | 0.68 | 0.66 | 0.72 | |||||
| Indices | Model Fit Obtained Value | Recommended Value | References | |||||||||||
| CMIN/df | 1.965 | <3 | Hair et al. [48] | |||||||||||
| CFI | 0.928 | ≥0.90 | Hair et al. [48] | |||||||||||
| GFI | 0.876 | ≥0.80 | Doll et al. [49] | |||||||||||
| AGFI | 0.844 | ≥0.80 | Doll et al. [49] | |||||||||||
| NFI | 0.864 | ≥0.90 | Hair et al. [48] | |||||||||||
| TLI | 0.916 | ≥0.90 | Hair et al. [48] | |||||||||||
| IFI | 0.929 | ≥0.90 | Hair et al. [48] | |||||||||||
| RMSEA | 0.056 | ≤0.08 | Browne and Cudeck [50] | |||||||||||
Note: bold diagonal numbers are the square roots of AVE. Source: SEM-Amos and SPSS output.
Table 5.
Summary of results.
| Hypothesized Paths | Estimate | S.E. | p | Hypothesis | ||
|---|---|---|---|---|---|---|
| Interaction quality | ---> | Satisfaction | 0.133 | 0.048 | ** | H1a-Accepted |
| Environment quality | ---> | Satisfaction | 0.288 | 0.058 | *** | H1b-Accepted |
| Social quality | ---> | Satisfaction | 0.095 | 0.053 | ** | H1c-Accepted |
| Outcome quality | ---> | Satisfaction | 0.274 | 0.061 | *** | H1d-Accepted |
| Interaction quality | ---> | WOM | 0.172 | 0.042 | *** | H2a-Accepted |
| Environment quality | ---> | WOM | 0.038 | 0.052 | 0.483 | H2b-Rejected |
| Social quality | ---> | WOM | 0.033 | 0.045 | 0.465 | H2c-Rejected |
| Outcome quality | ---> | WOM | 0.201 | 0.054 | *** | H2d-Accepted |
| Satisfaction | ---> | Sustainable use | 0.536 | 0.054 | *** | H3a-Accepted |
| Satisfaction | ---> | WOM | 0.473 | 0.049 | *** | H3b-Accepted |
| WOM | ---> | Sustainable use | 0.255 | 0.055 | *** | H4-Accepted |
| Customer satisfaction 40% WOM communication 55% Sustainable use intention 54% Model fit indices: CFI = 0.972, GFI = 0.973, AGFI = 0.812, NFI = 0.968, and IFI = 0.972 | ||||||
Note: *** p < 0.001, ** p < 0.05. Source: SEM-Amos output.
© 2018 by the authors. Licensee MDPI, Basel, Switzerland. This article is an open access article distributed under the terms and conditions of the Creative Commons Attribution (CC BY) license (http://creativecommons.org/licenses/by/4.0/).
Share and Cite
MDPI and ACS Style
Hossain, M.A.; Kim, M. Does Multidimensional Service Quality Generate Sustainable Use Intention for Facebook? Sustainability 2018, 10, 2283. https://doi.org/10.3390/su10072283
AMA Style
Hossain MA, Kim M. Does Multidimensional Service Quality Generate Sustainable Use Intention for Facebook? Sustainability. 2018; 10(7):2283. https://doi.org/10.3390/su10072283
Chicago/Turabian StyleHossain, Md. Alamgir, and Minho Kim. 2018. "Does Multidimensional Service Quality Generate Sustainable Use Intention for Facebook?" Sustainability 10, no. 7: 2283. https://doi.org/10.3390/su10072283
Note that from the first issue of 2016, this journal uses article numbers instead of page numbers. See further details here.