Article

Mapping Ecosystem Service Bundles to Detect Distinct Types of Multifunctionality within the Diverse Landscape of the Yangtze River Basin, China

1
State Key Laboratory of Urban and Regional Ecology, Research Center for Eco-Environmental Sciences, Chinese Academy of Sciences, Beijing 100085, China
2
University of Chinese Academy of Sciences, Beijing 100049, China
3
School of Economics and Finance, Xi’an Jiaotong University, Xi’an 710061, China
4
College of Surveying and Land Information Engineering, Henan Polytechnic University, Jiaozuo 454000, China
*
Author to whom correspondence should be addressed.
Sustainability 2018, 10(3), 857; https://doi.org/10.3390/su10030857
Submission received: 1 February 2018 / Revised: 12 March 2018 / Accepted: 14 March 2018 / Published: 18 March 2018

Abstract

:
The tradeoffs and synergies of ecosystem services are widely discussed and recognized. However, explicit information for understanding and managing the complex relationships of multiple ecosystem services at regional scales is still lacking, which often leads to the degradation of important ecosystem services due to one ecosystem service being enhanced over another. We assessed the biodiversity and the production of nine ESs (ecosystem services) across 779 counties in the Yangtze River Basin, the largest basin in China. Then, we mapped the distribution of ES for each county and used correlations and “partitioning around medoids” clustering analysis to assess the existence of ES bundles. We found five distinct types of bundles of ecosystem services spatially agglomerated in the landscape, which could be mainly explained by land use, slope and altitude gradients. Our results also show landscape-scale tradeoffs between provisioning and almost all regulating services (and biodiversity), and synergies among almost all regulating services (and biodiversity). Mapping ecosystem service bundles can identify areas in a landscape where ecosystem management has produced exceptionally desirable or undesirable sets of ecosystem services, and can also provide explicit, tailored information on landscape planning for ecosystem service conservation and the design of payment policies for ecosystem services within diverse landscapes at watershed scales.

1. Introduction

Ecosystem services are defined as the benefits that people obtain from ecosystems [1,2], including the goods and services that ecosystems provide to society [3]. Mapping the spatial patterns of ecosystem services and biodiversity could help to identify regions for which conservation is beneficial to both biodiversity and ecosystem services [4], and help understand how the distributions of different services compare and where trade-offs and synergies among ecosystem services might occur [5]. Trade-offs of ecosystem services occur when one service increases at the cost of reducing the provision of another service [6], whereas synergies arise when multiple ecosystem services are enhanced simultaneously [7]. The relationships among multiple ecosystem services and the mechanisms behind these relationships will improve the ability to sustainably manage ecosystems to provide multiple ecosystem services [8].
The tradeoffs and synergies of ecosystem services are widely discussed and recognized. Generally, tradeoffs exist between provision services and (1) regulating services and (2) biodiversity, and synergies exist among regulating services (e.g., soil retention, water retention, carbon sequestration) [9,10,11,12,13,14]. At regional scales, the complex relationships of multiple ecosystem services present diverse types and different patterns due to diverse landscapes [7,15,16,17,18]. However, explicit information for understanding and managing the complex relationships of multiple ecosystem services at regional scales is still lacking, which often leads to the degradation of important ecosystem services due to one ecosystem service being preferably enhanced over another [17]. Especially in a large basin, where the natural conditions and socio-economic impacts are extremely complicated, understanding the ecosystem service aggregation pattern and drivers, and the important ecosystem service sets for different conservation objectives, can help to provide tailored watershed management information across the upper and lower basin reaches. Ecosystem service bundles can be used to identify the cluster pattern of multiple ecosystem services and analyze the interactions among ecosystem services [7,15,17].
The Yangtze River Basin, the largest watershed in China, includes almost all geological, topographical, and climatic conditions, vegetation and soil types found in China. It is one of the most densely populated and agriculturally productive areas in the country. The Yangtze River Basin is a microcosm of China’s ecology in terms of both its resources and its problems, and plays an important role in assuring healthy and intact ecosystems in China [19]. In our study, based on the concept and method of ecosystem service bundles [15,20,21], we used the Yangtze River Basin as a test case for a large-scale watershed. We selected biodiversity and the production of nine ESs (ecosystem services), including the regulating and provisioning services in the category of Millennium Ecosystem Assessment [3], to assess the spatial characteristics of the individual ecosystem services, trade-offs and synergies among multiple services, the distribution of ecosystem bundles and the driving forces across the whole area of the Yangtze River Basin. The objectives of the study were as follows: (1) investigate the distinct spatial patterns of multiple ecosystem services and biodiversity, and their relationships; (2) reveal how multiple ecosystem services consistently coexist together or differ from upper to lower reaches and spatially form different ecosystem service bundles across the whole Yangtze River Basin area; and (3) give implications for watershed ecosystem service management. This case study can improve the understanding of the complex interactions of multiple ecosystem services in a large watershed, and provide a reference for watershed ecosystem management globally.

2. Materials and Methods
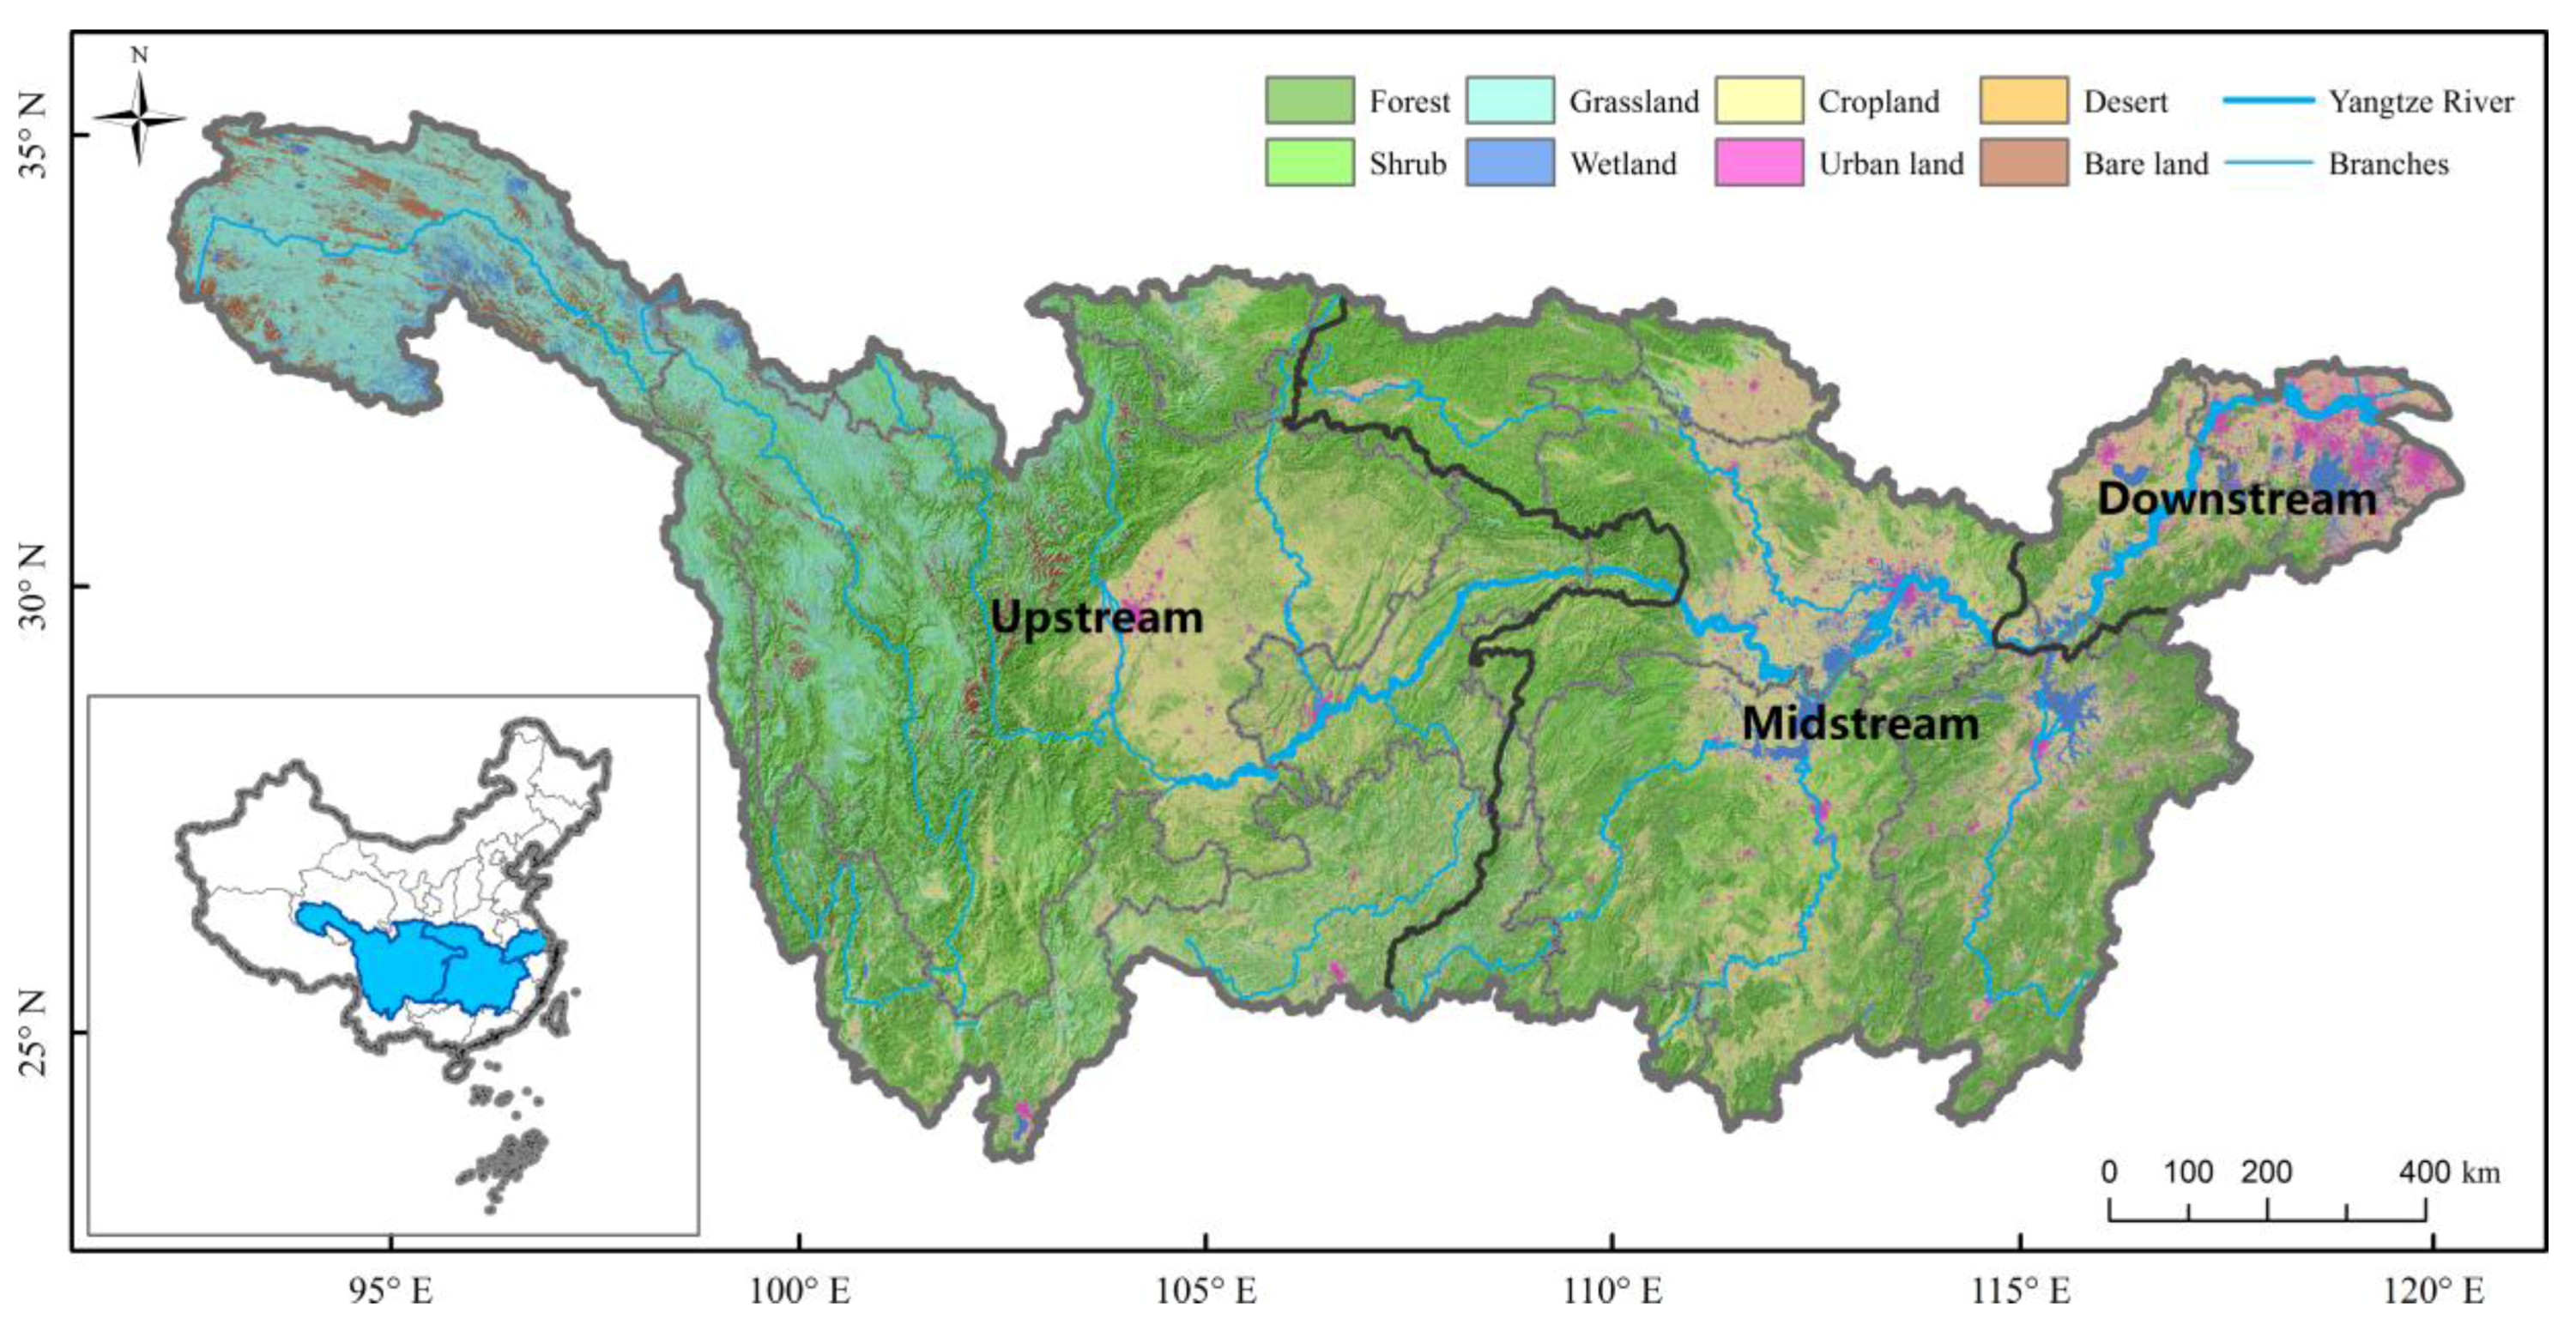
2.1. Study Area

The Yangtze River Basin, the largest watershed in China, covers approximately 1.8 × 10⁶ km², accounting for 18.8% of China’s land area (Figure 1). The natural conditions differ significantly across the source regions, the upper reaches, and the middle and the lower reaches with various landforms (such as plateaus, mountains, hills and plains) in which the highest elevation exceeds 7 km. The Yangtze River Basin is a key area of ecological conservation in China. As a globally crucial region for biodiversity conservation, the Yangtze River Basin contains a huge number of rare and indigenous species: more than 14,000 higher plants, 280 mammals, 762 birds, 145 amphibians, and 166 reptiles [22]. In particular, the upper reaches of the Yangtze River are one of the global biodiversity “hotspots” [23], but the ecosystems are sensitive and vulnerable [24]. In addition, the Yangtze River Basin is one of the most densely populated and agriculturally productive areas in China, where the cultivated land accounts for 25% of the total cultivated land area in China, and the agricultural production accounts for 40% of the total value of the country’s agricultural outputs.

2.2. Mapping of Ecosystem Services

The Yangtze River Basin is not only the largest basin in China, but also one of the most important grain production bases, as well as the hotspot of biodiversity conservation in China. According to the basin’s regional importance and ecological problems, we evaluated the ecosystem services important for human well-being in the Yangtze River Basin, including regulating services (water retention, soil retention, flood mitigation, carbon sequestration, water purification and sandstorm prevention), provision services (crop production, edible oil production and meat production), and biodiversity. Table 1 shows these ecosystem services and the data sources for the parameters.
Ecosystem service data were processed by the method of minimum–maximum normalization to eliminate the influence of dimension. The ecosystem services were mapped using ArcGIS 10.3.1 software (ESRI, Inc., Redlands, CA, USA) [27] to compare their spatial patterns.

2.2.1. Regulating Services

The detailed calculation methods of water retention, soil retention, carbon sequestration and sandstorm prevention refer to the reference [28]. For each county, we calculated the capacity of water retention, soil retention, carbon sequestration, sandstorm prevention and flood mitigation per unit area as the indicators of the services.
● Water retention service
Water retention refers to the water retained in ecosystems. We assessed the water retention service using the following equation [28] revised from the InVEST model [29].
T Q = i = 1 j ( P i R i E T i ) · A i
where T Q is total water retention, P i is precipitation, R i is storm runoff, E T i is evapotranspiration, A i is the area of the ecosystem as defined by land cover, i refers to the ecosystem type i, and j is the number of ecosystem types in the study area.
● Soil retention service
Soil retention refers to the soil retained by the ecosystems, which was calculated using the Universal Soil Loss Equation [30] and the InVEST model. The equation can be expressed as:
S C = R × K × L S × ( 1 C )
where S C represents the soil retention capacity, R is the rainfall erosivity factor, K is the soil erodibility factor, L S is the topographic factor, and C is the vegetation cover factor.
● Carbon sequestration service
Carbon sequestration refers to carbon sequestered by terrestrial ecosystems, a process that can reduce the current rate of increase of atmospheric CO2. The biomass carbon storage of different types of ecosystem ( B C S i n ) was obtained using the following equations:
B C S i n = j = 1 n B C D i j m × A R i × 10 6
B C D i j m = B i j m × C C i
where B C D i j m is the biomass carbon density of ecosystem i in pixel j in year m. A R i is the area of each pixel, B i j m is the biomass density of ecosystem i in pixel j in year m, and C C i is the carbon content in the biomass of ecosystem i, which is 0.5 for forest and wetland, and 0.45 for grassland [31,32].
● Sandstorm prevention service
Sandstorm prevention refers to the sand retained in an ecosystem. We used the Revised Wind Erosion Equation model [33] to estimate the sandstorm prevention service.
● Flood mitigation service
The flood mitigation service is closely related to storm rainfall (>50 mm), the surface runoff and the ecosystem type. It was calculated using the following equation:
F Q = i = 1 j ( P r i R r i ) × A i
where F Q is the flood mitigation capacity (m3), P r i is the storm rainfall (mm), R r i is storm runoff (mm), and A i is the area of ecosystem i. The surface runoff resulting from torrential rain can be calculated using a regression function of storm rainfall. We analyzed information about storm rainfall and surface runoff for each ecosystem type from approximately 310 published sources and determined the regression functions of rainfall and runoff.
● Water purification service
Water purification was obtained using the Nutrient Delivery Ratio module in the InVEST model [29]. First, the annual water yield was calculated using the water yield module [34], then nutrient output was calculated according to the annual water yield, terrain data, spatial pattern of ecosystem types and nutrient output coefficients [34]. The water purification capacity in each county was represented by the absorption area of a unit mass of nutrients, calculated using the following equation:
W P = A c / N e x p o r t
where A c is the area of the county (m2), and N e x p o r t represents the total amount of nutrients (kg) output from the ecosystems in the county.

2.2.2. Provision Services

We chose the total yield of major grain crops (rice, wheat and corn) in the Yangtze River Basin to indicate the crop production service. Edible oil crops represented the major cash crop in the Yangtze River Basin and were also included as a kind of provision service (edible oil production service). As the main source of protein, meat production was identified as meat production service. For each county, we used the yields of crop, edible oil and meat per unit area as the indicators of crop production service, edible oil production service and meat production service, respectively.

2.2.3. Biodiversity Conservation

We selected threatened species listed in the International Union for Conservation of Nature (IUCN) Red List or China’s Red List as indicator species [26], including categories of critically endangered (CR), endangered (EN), and vulnerable (VU) species. First, we obtained the distribution information for plants, mammals, amphibians, reptiles and birds mainly from the Scientific Database of China Plant Species, IUCN, and BirdLife International. Then, we refined the potential habitat based on specific distribution areas, elevation range, and vegetation. The detailed mapping process of biodiversity refers to the reference [26]. For each county, we calculated the mean value of the number of species as the indicator of biodiversity.

2.3. Data Analysis

The spatial clustering of all ecosystem services was determined using Moran’s I test [35] with queen contiguity. A correlation analysis on each pair of the ecosystem services was performed using R statistical software [36] by the Pearson parametric correlation test.
To avoid interference of the outliers in the data of a large number of counties in the Yangtze River Basin, the partitioning around medoids (PAM) clustering method [37] was used. We applied the PAM module in the R statistical software to cluster biodiversity and the nine ecosystem services of 779 counties. Compared with the hierarchical clustering method, the PAM method can address a larger amount of data. In addition, PAM assigns a cluster center using a representative observation value instead of the mean value; therefore, it is more robust and insensitive to outliers compared with the k-means clustering method. The clustering results corresponded to the ecosystem service bundles. We spatialized the ecosystem service bundles using the ArcGIS software. We counted the geographic and socio-economic variables of each ecosystem service bundle to analyze their characteristics. Then, we performed a principal component analysis (PCA) using IBM SPSS software (Version 22, IBM Corp., Armonk, NY, USA) to identify the gradients along which the ecosystem service bundles changed. In the PCA, the driver variables selected are proportion of cropland, proportion of forest land, proportion of wetland, proportion of urban land, altitude, slope, population density, GDP (gross domestic product) and the distance to big cities. The response variables are the quantities of the nine ecosystem services and biodiversity. We also applied RDA (redundancy analysis) using CANOCO 4.5 (Biometris-Plant Research International, Wageningen, The Netherlands) to identify the relationships between major driver variables and ecosystem services.

3. Results

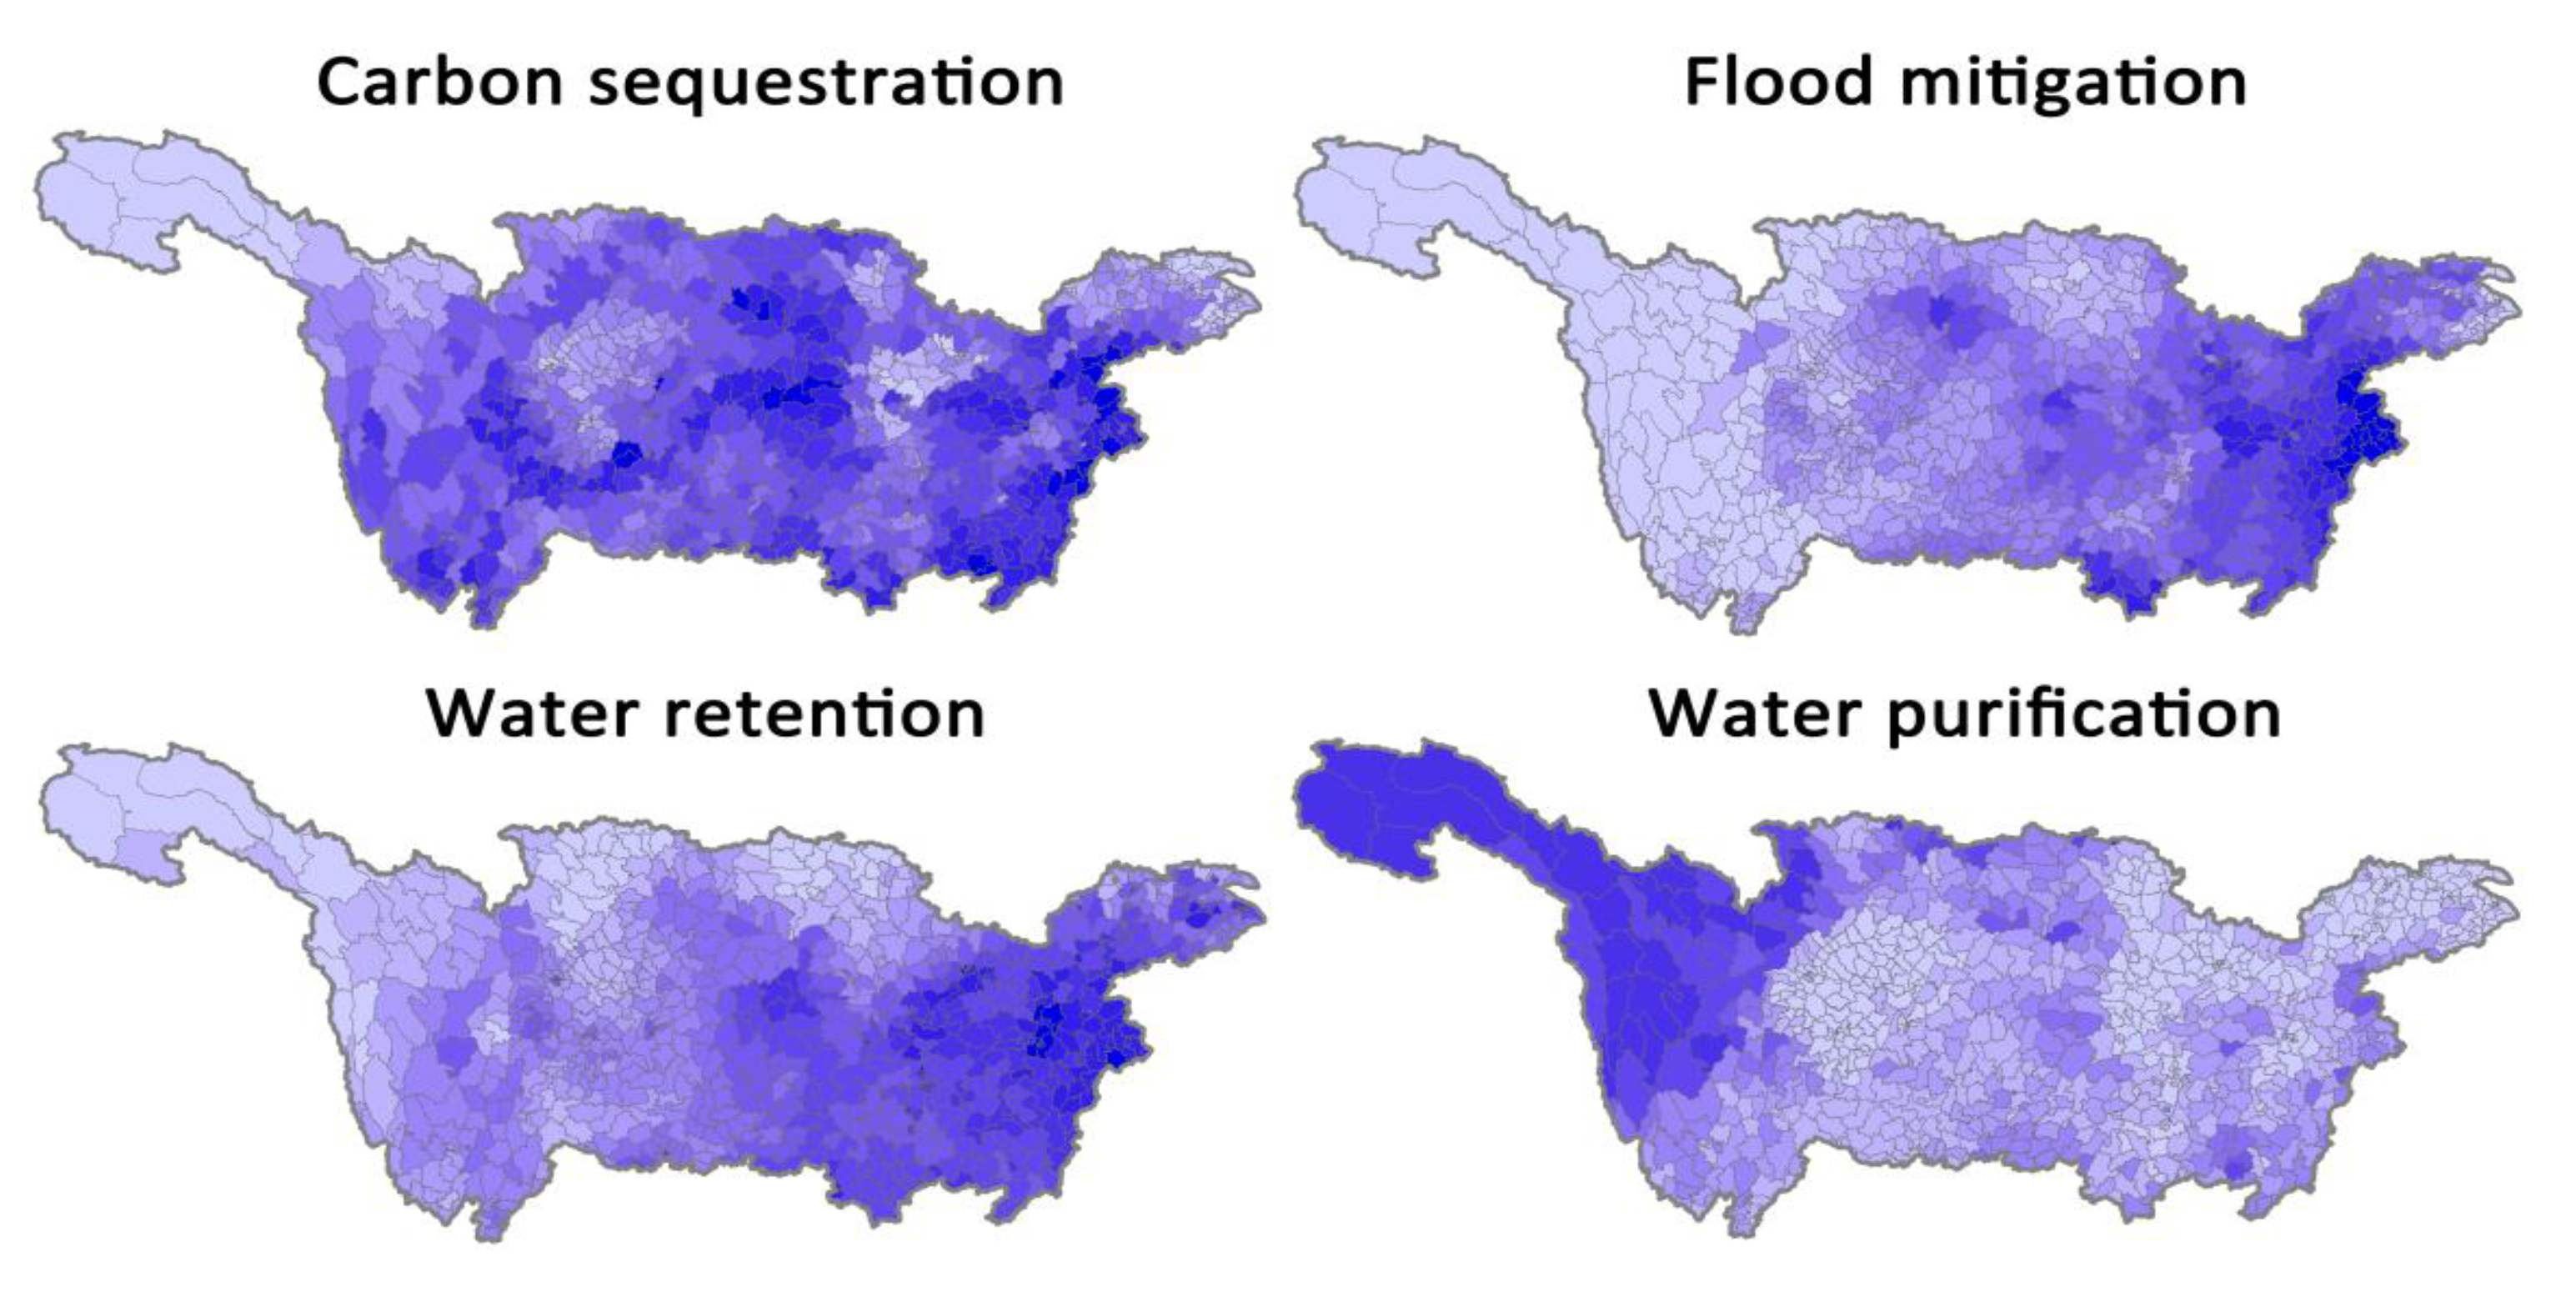
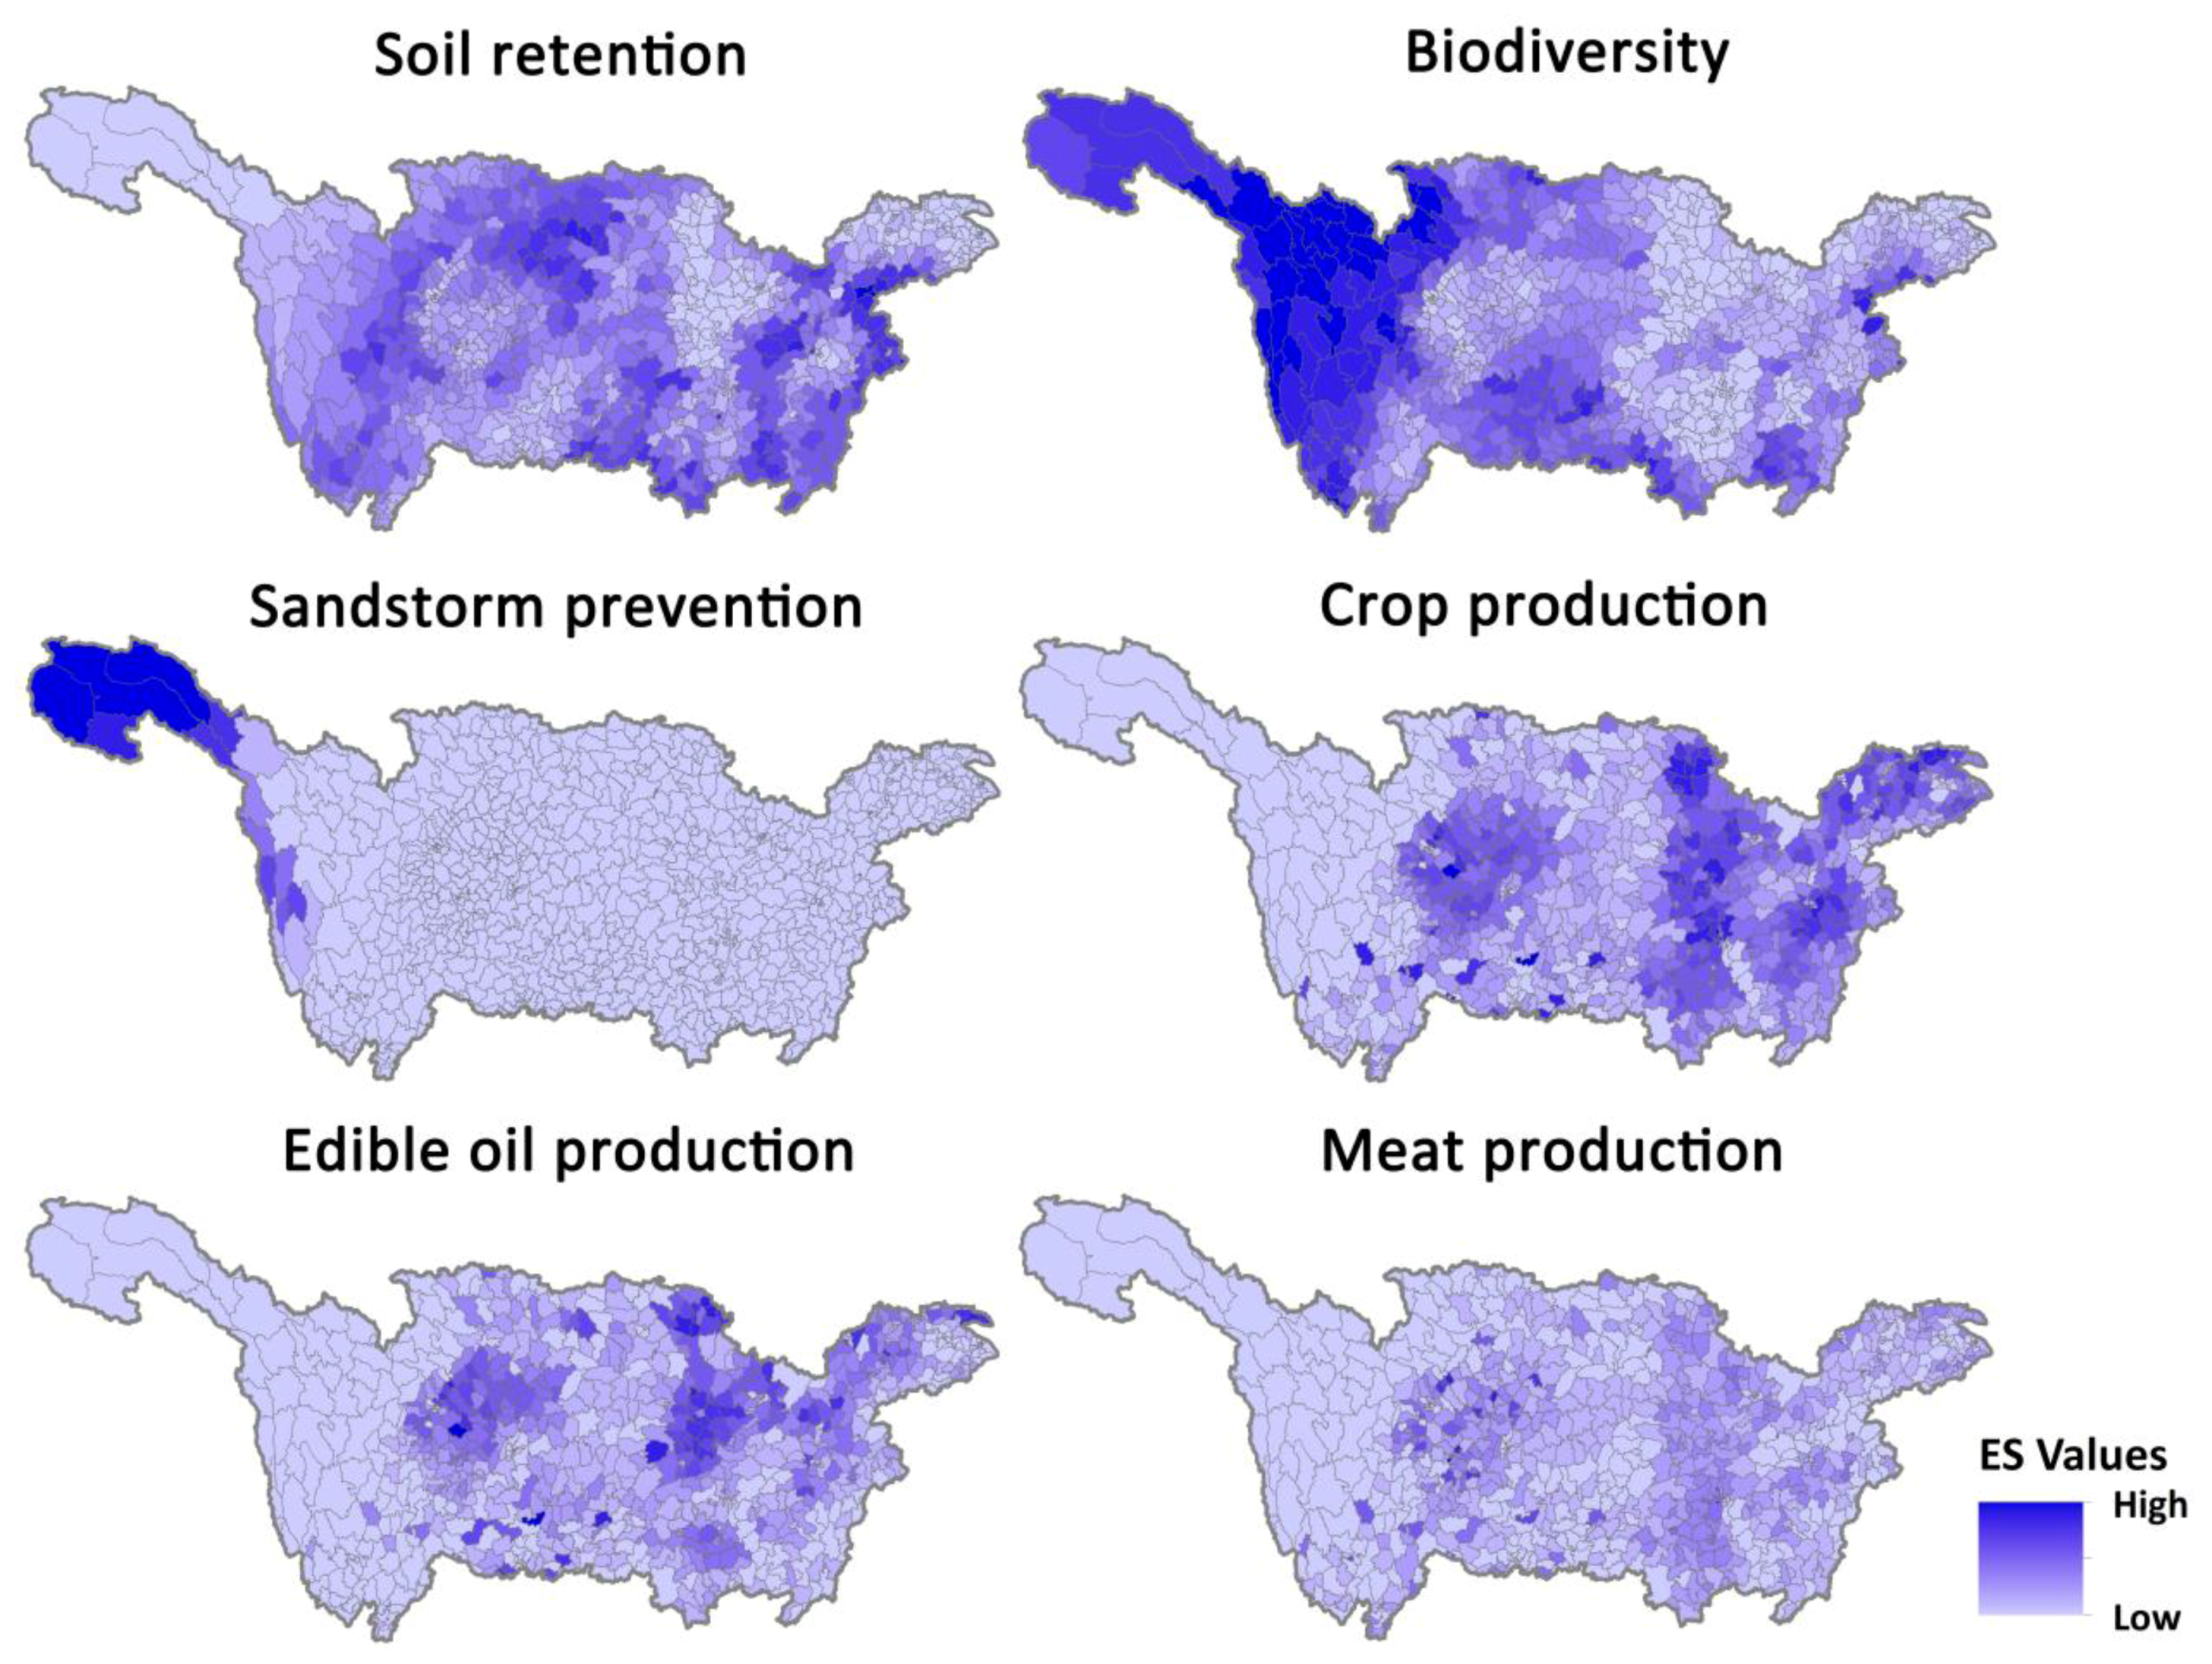
3.1. Spatial Patterns of Ecosystem Services

At the county level, the ecosystem services and biodiversity were spatially aggregated across the study area (p < 0.01) rather than randomly distributed. There were similarities among the spatial patterns of different services, such as flood mitigation and water retention, water purification and biodiversity, crop production and edible oil production, but their individual patterns were distinct. The clumped distribution of ecosystem services was determined by the geographical and climatic factors and the concentration of human activities. For example, high water retention and flood mitigation services tended to be distributed in areas that had higher precipitation and vegetation cover. High biodiversity was mainly distributed in the Hengduan mountain area of the upper reaches of the basin. The sandstorm prevention service was concentrated in the source regions of the Yangtze River Basin. Higher values of provision services were aggregated within the flat areas of the basin, such as Sichuan basin, the famous agricultural product supply region (Figure 2).

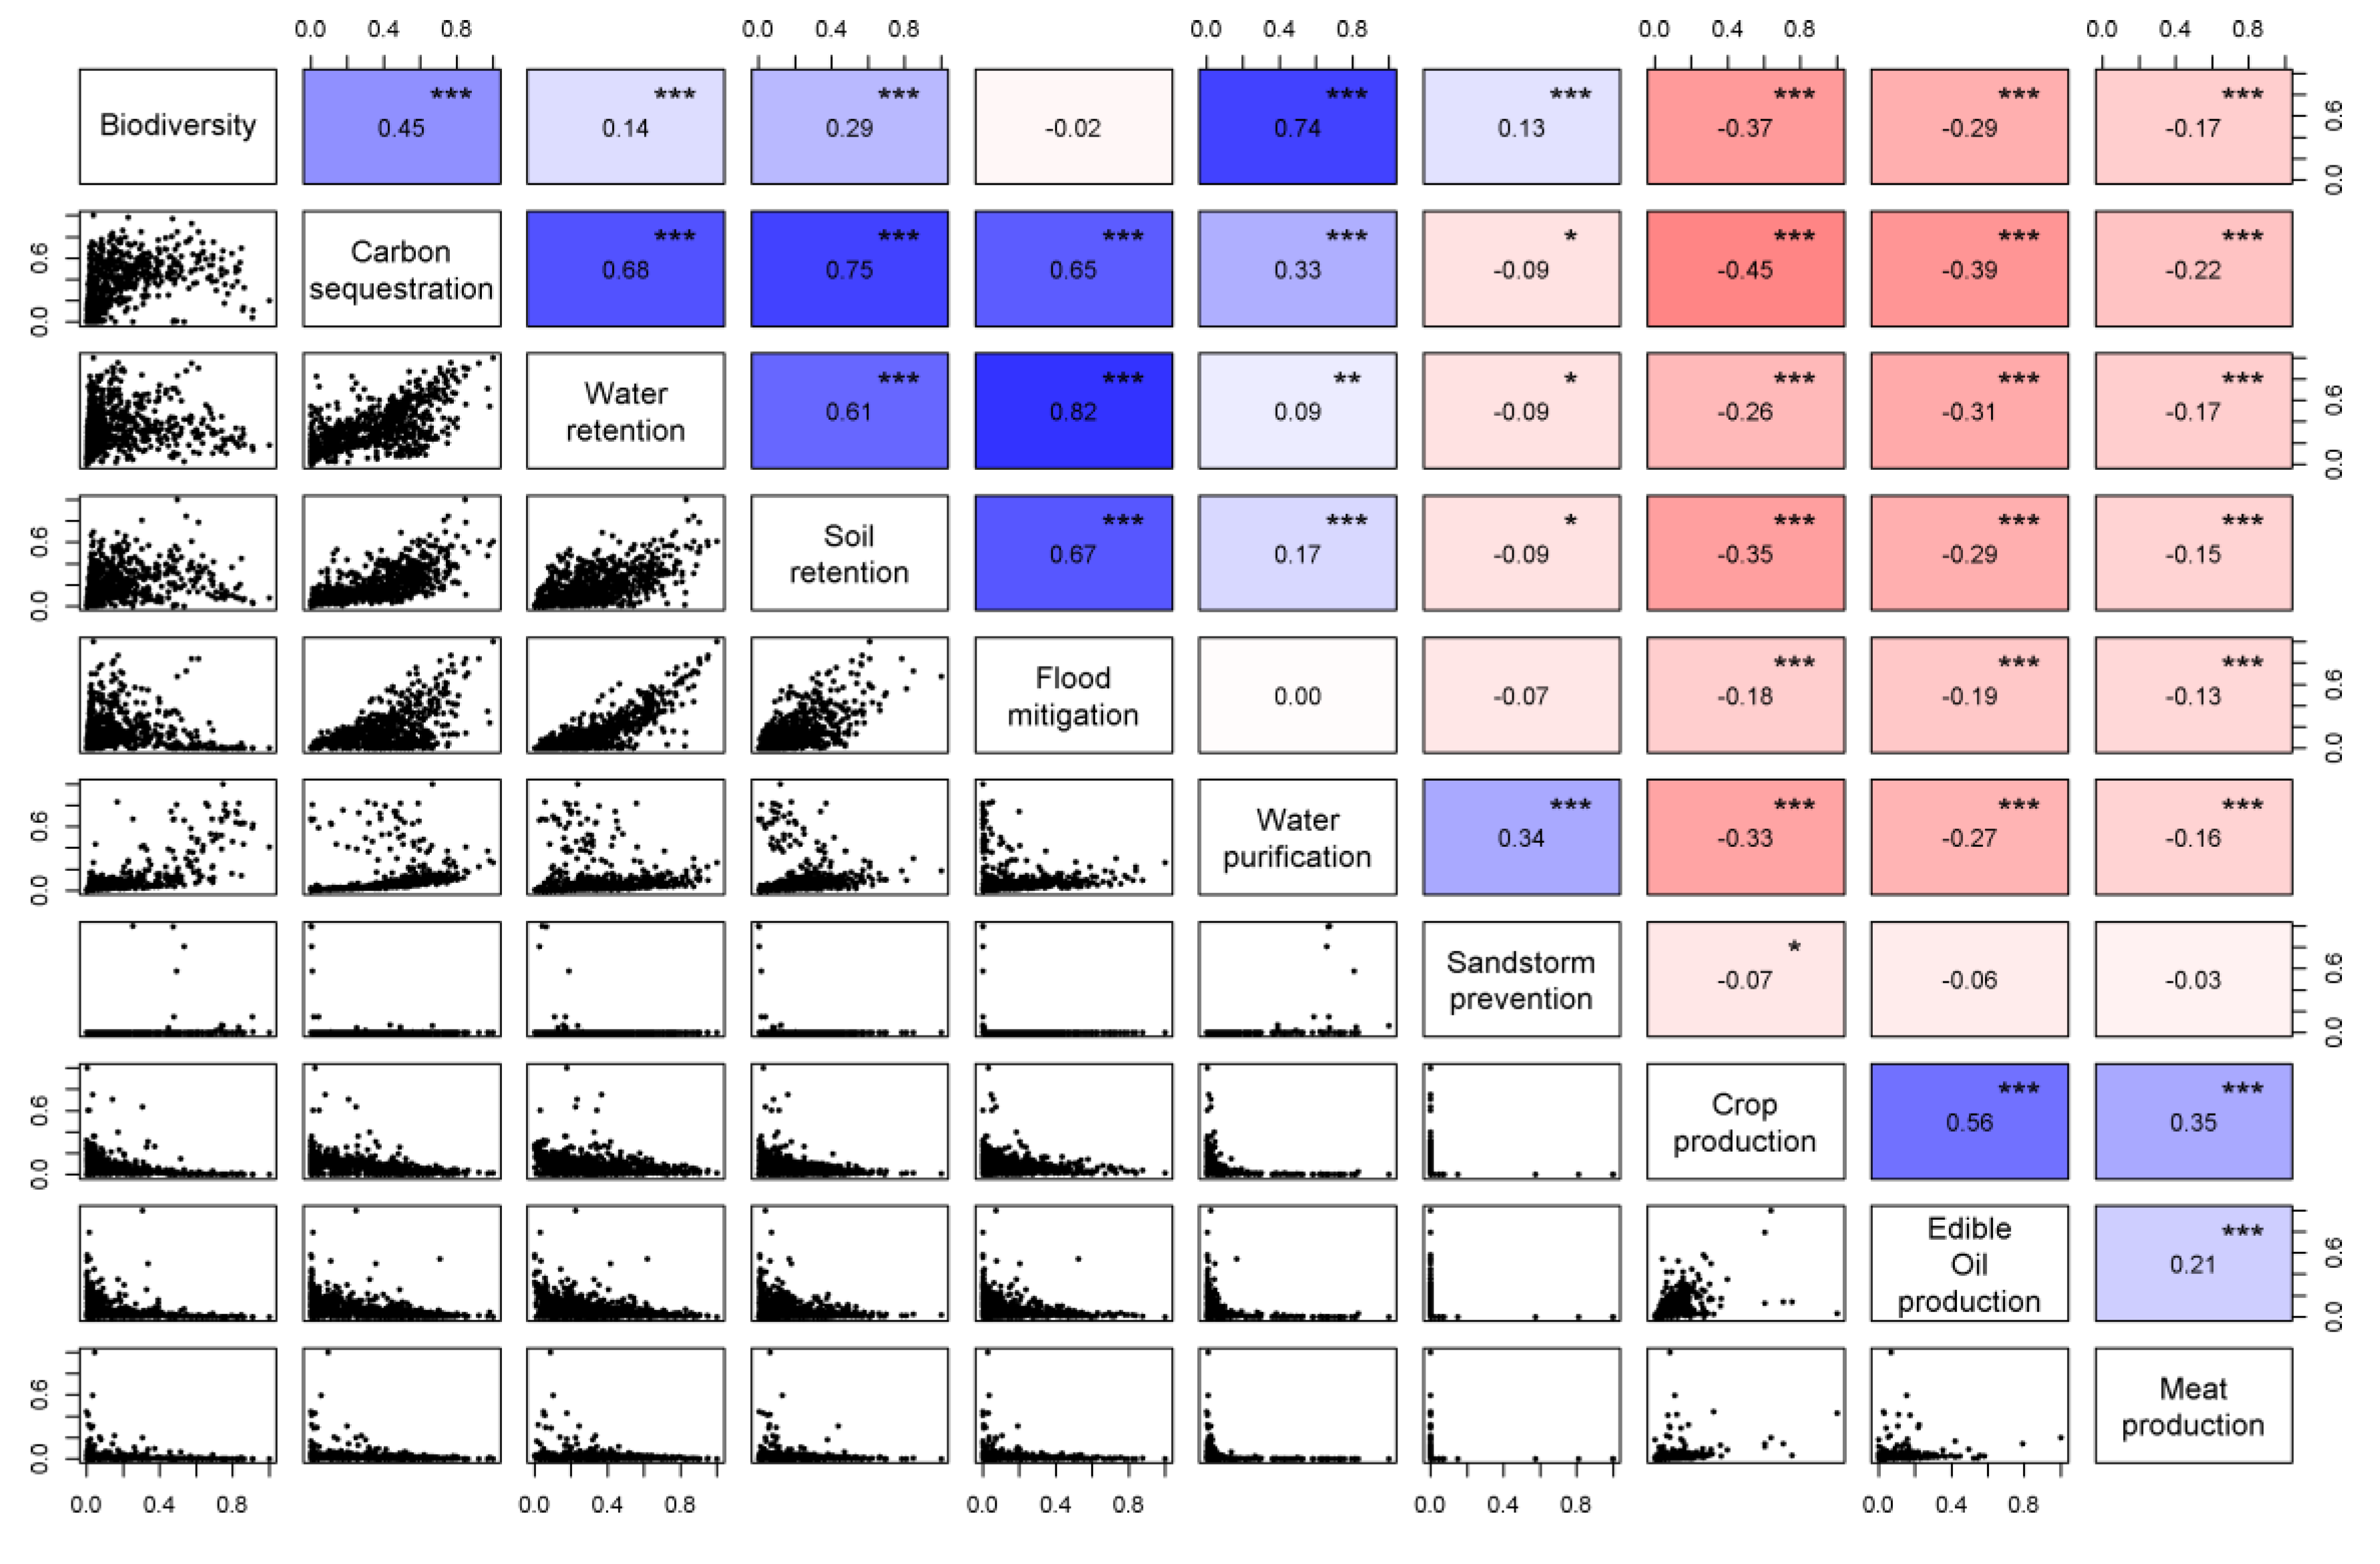
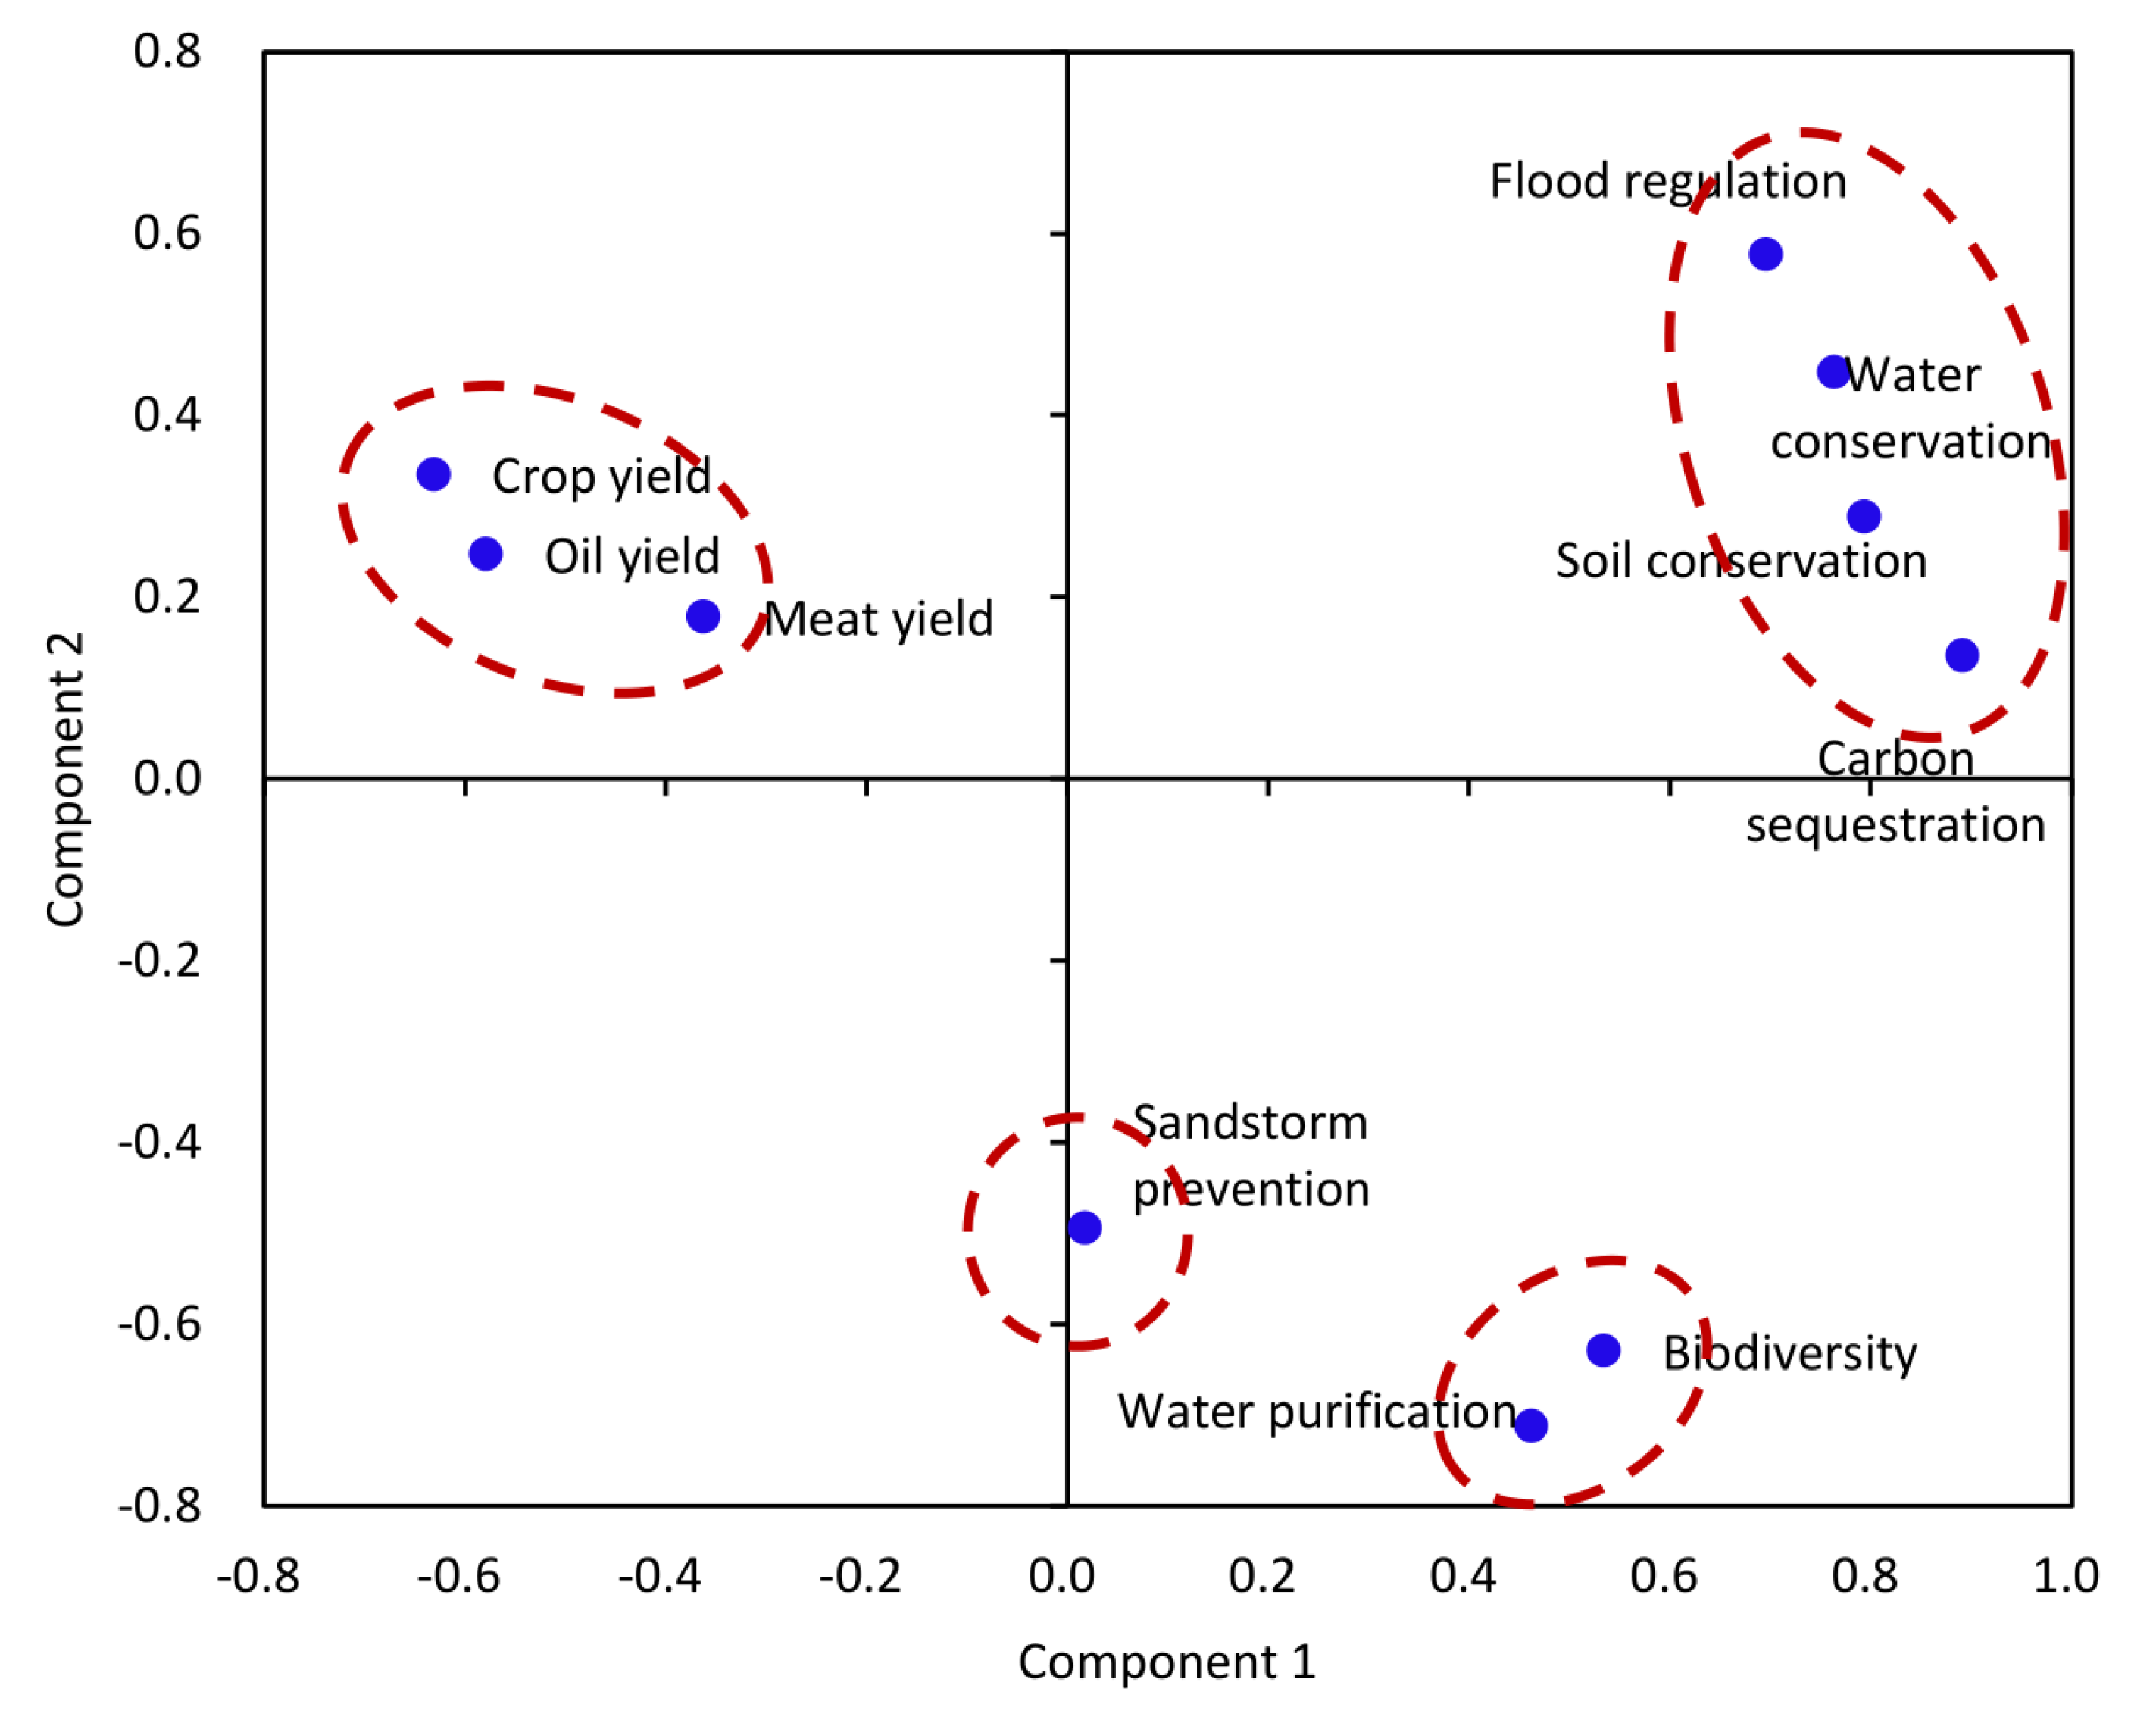
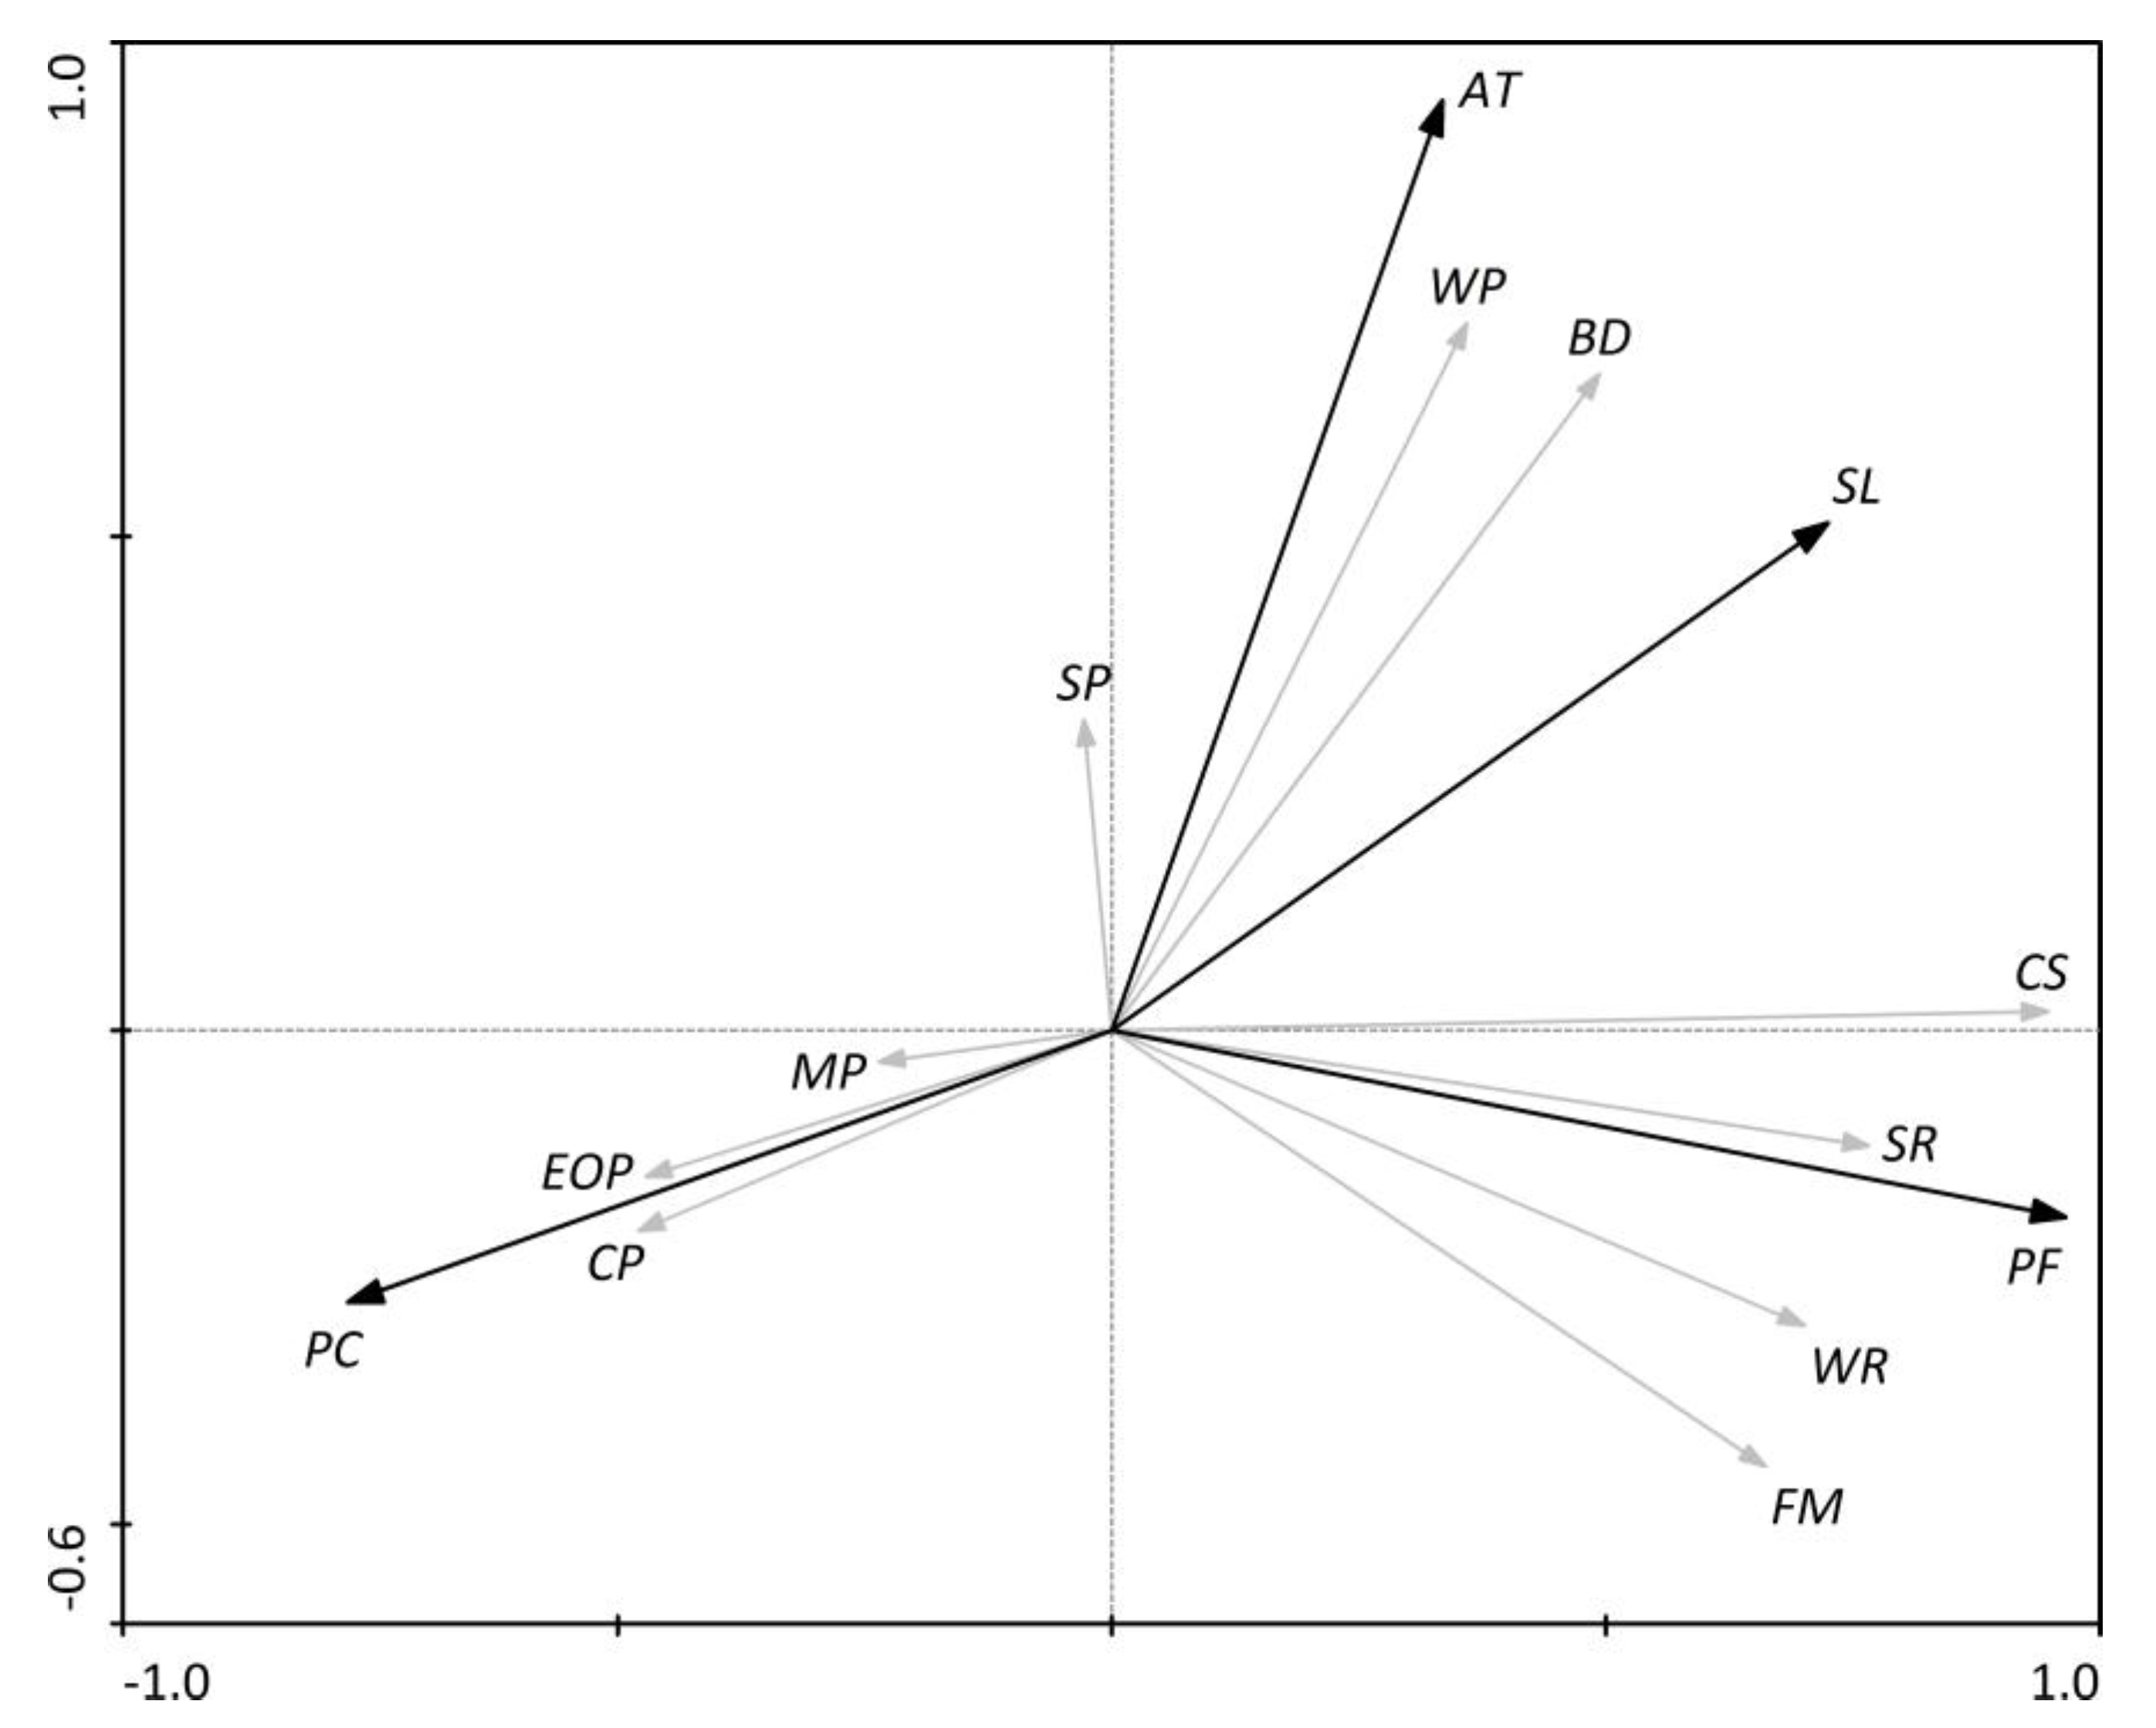
3.2. Trade-Offs and Synergies among Ecosystem Services

Most of the ecosystem services were significantly correlated with each other. Of the 45 possible pairs of ecosystem services, 40 pairs were significantly correlated (Figure 3).
Most of the significant negative correlations existed between provision services and other services. Among them, crop production was found to have the highest number of significant negative correlations with other services, but the negative correlations between meat production and other services were relatively weak. The correlation between edible oil production and sandstorm prevention, and the correlation between meat production and sandstorm prevention, were not significant. Besides, sandstorm prevention was negatively correlated with carbon sequestration, water retention and soil retention (Figure 3).
There were significant synergies between regulation services and biodiversity, and significant synergies among the regulating services, as well as among the provision services. Among them, carbon sequestration, water retention, soil retention and flood mitigation were relatively highly positively correlated. Among the provision services, the correlation between crop production and edible oil production was the highest, but meat production was weakly correlated with them (Figure 3).

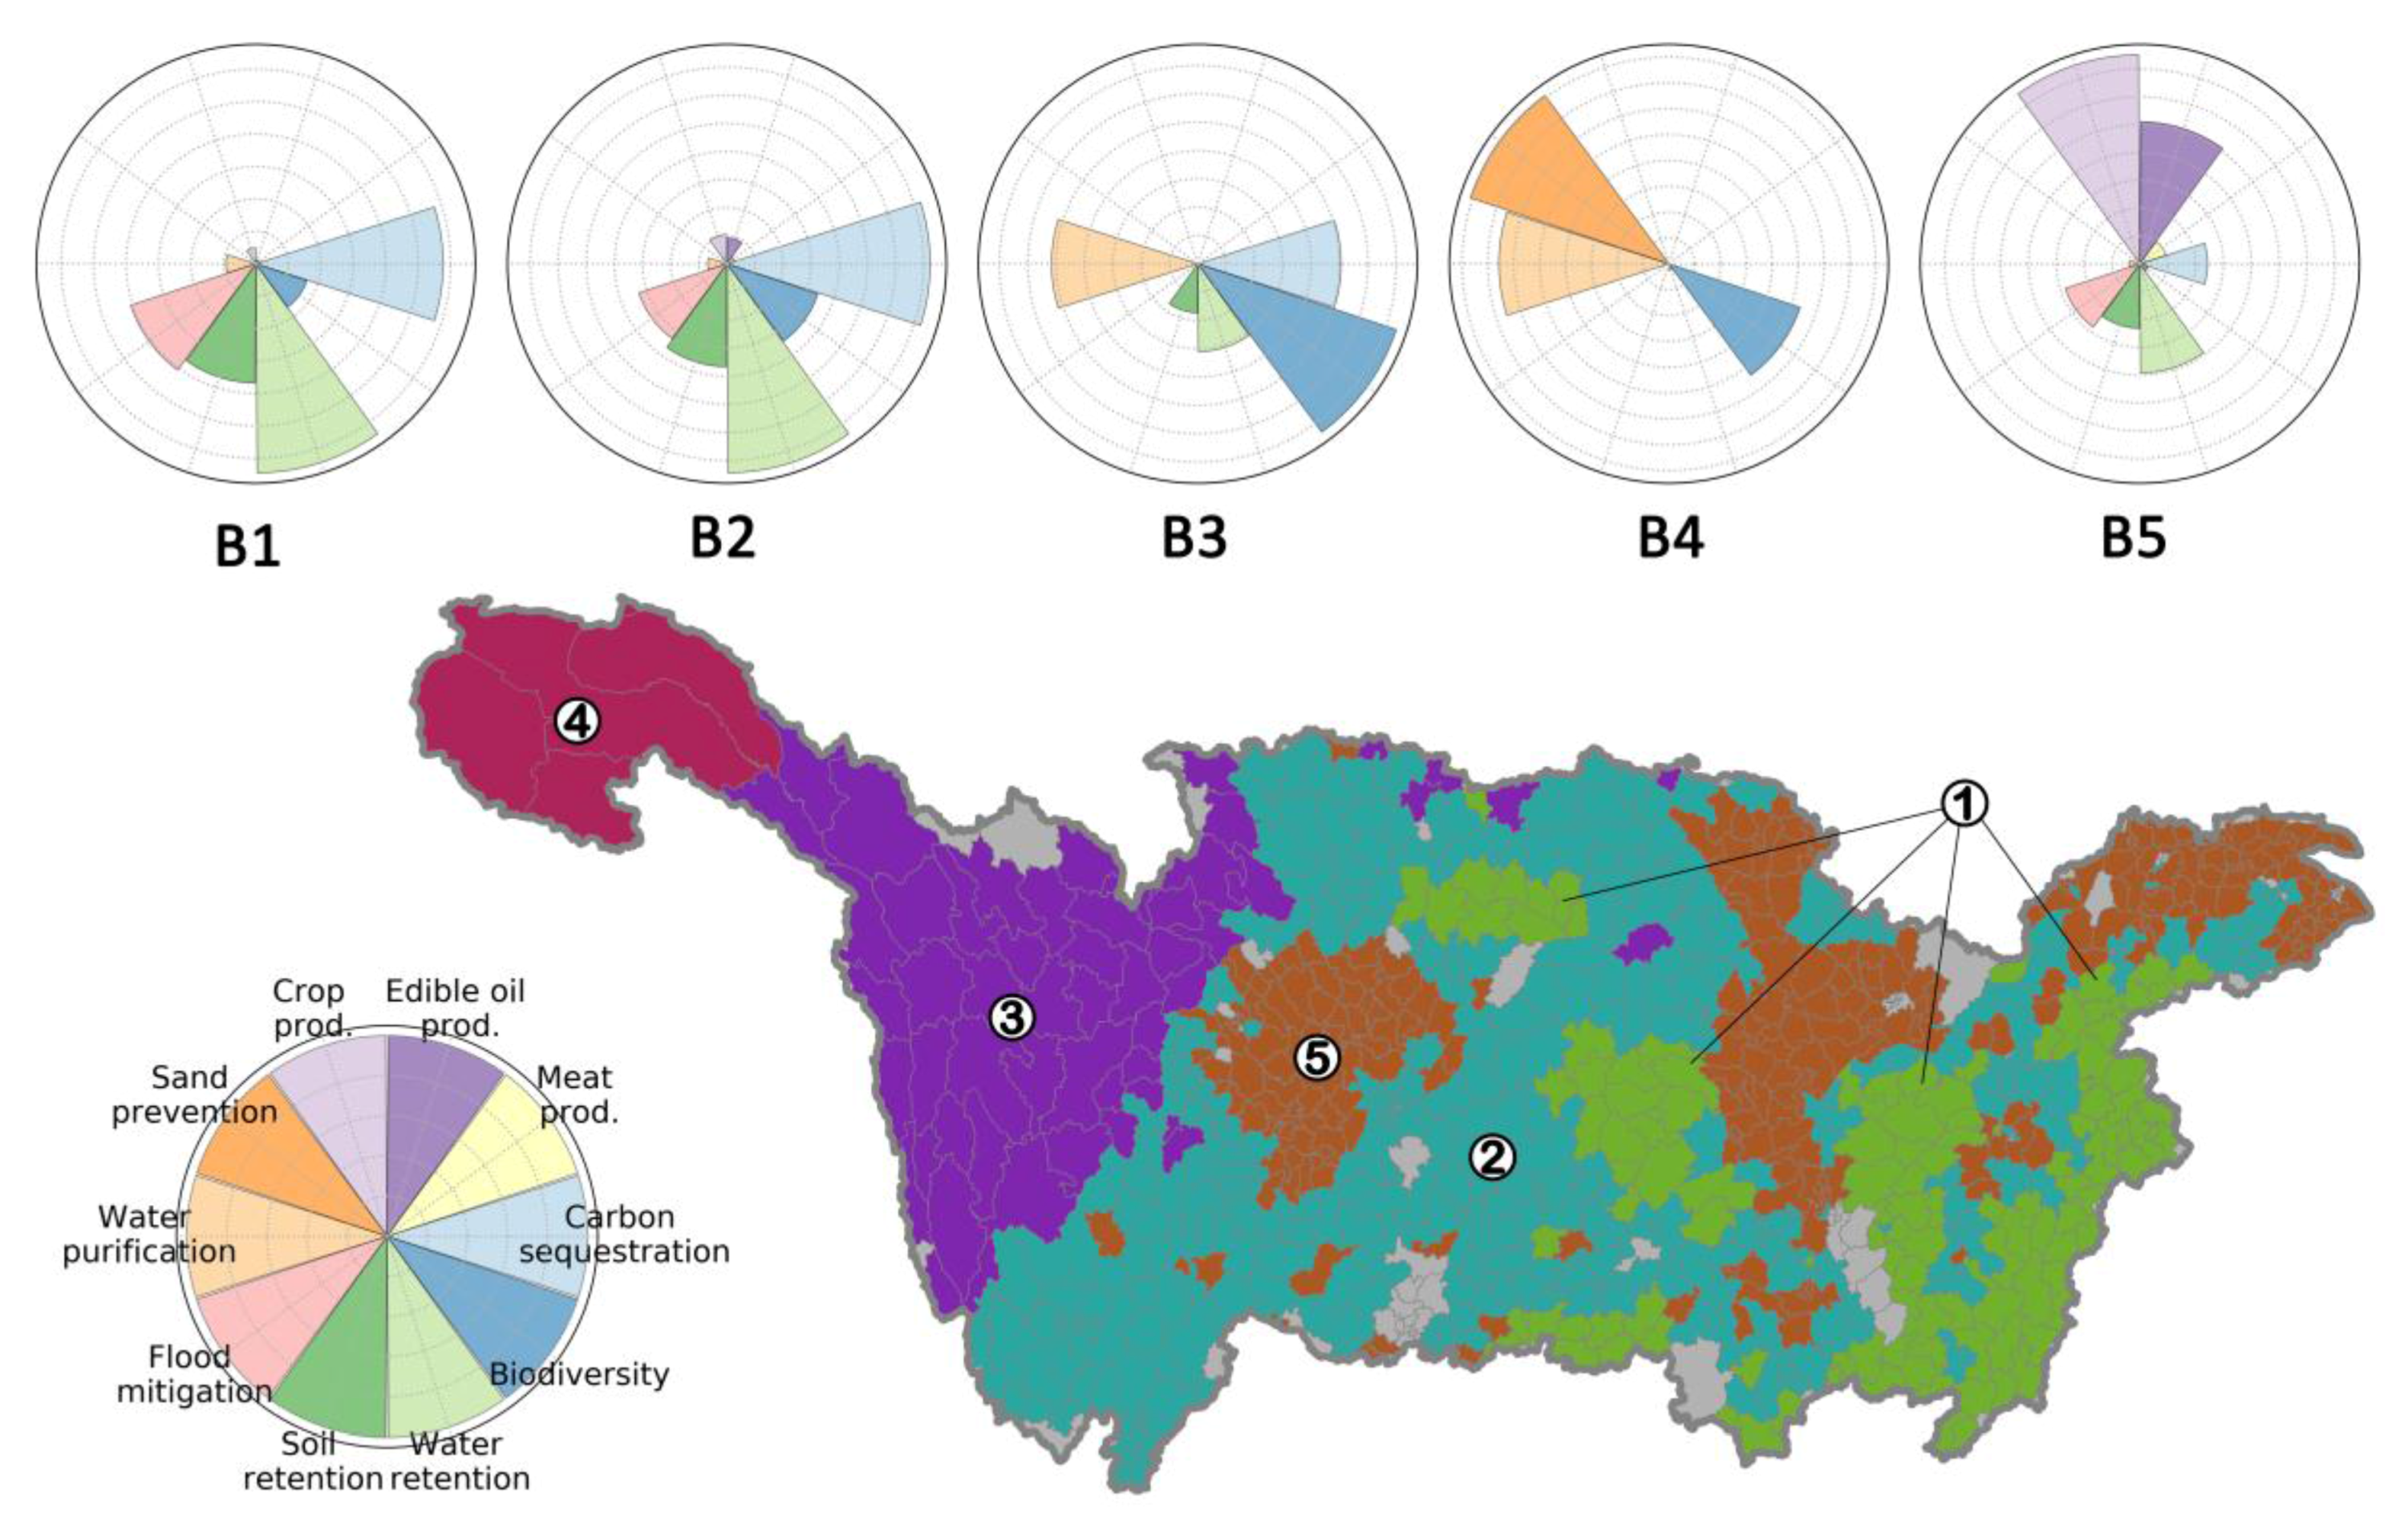
3.3. Ecosystem Service Bundles

The 779 counties in the Yangtze River Basin were placed in five groups across the basin based on the cluster analysis of ecosystem services they provided (Figure 4). Each group consists of counties with a bundle of ecosystem services that are more alike within the bundle than between bundles. The corresponding area of each bundle is shown in Figure 4. The five ecosystem service bundles were spatially clustered in the landscape (Figure 4, p < 0.01).
According to the ecosystem services provision and the socioeconomic activities occurring in the grouped areas, the five ecosystem service bundles could be named as the “highest regulating service bundle type”, “second-highest regulating service bundle type”, “high biodiversity bundle type”, “sandstorm prevention bundle type” and “food provision bundle type”.
(1) The highest regulating service bundle (B1), which had the largest proportion of forest cover, highest water retention service, flood mitigation service, carbon sequestration service and soil retention service, was distributed mainly in the important ecological functional regions in the midstream of the Yangtze River Basin (Figure 4). The mean slope of counties in this bundle is high, and the counties are far from the major cities. Meanwhile, the area proportions of wetland, cropland and urban land, the population density and the gross domestic product (GDP) are low (Table 2).
(2) The second-highest regulating service bundle (B2), which had high forest cover, high carbon sequestration service and water retention service, relatively high soil retention service, flood mitigation service and biodiversity, and low production of crops and edible oil, was distributed mainly in the upper reaches of the Yangtze River Basin. The mean slope of counties in this bundle is as high as that in the counties comprising bundle B1. The counties in B2 are also located far from major cities, but are closer to these cities than are the counties in bundle B1. Meanwhile, the area proportions of wetland, cropland and urban land, the population density and GDP are low, but higher than in B1 counties (Table 2).
(3) The high biodiversity bundle (B3), which had the richest biodiversity, the highest water purification service, relatively high carbon sequestration service and water retention service, was distributed mainly in the Hengduan mountains in the upper reaches of the basin. The mean slope of counties in this bundle is the highest, and the counties are extremely far away from major cities. Meanwhile, the area proportion of wetland is the lowest, and the area proportions of cropland and urban land, the population density and GDP are extremely low (Table 2). Most of the counties in B3 are very poor and comprised of sparsely populated mountain areas.
(4) The sandstorm prevention bundle (B4), which had the highest sandstorm prevention service, high water purification service and biodiversity, but poor levels of other regulating services and provision services, was distributed in the source regions of the Yangtze River. The mean slope is low in these counties, and the counties are located the farthest away from the major cities. Meanwhile, the area proportions of grassland and wetland are both the highest, and the area proportions of cropland and urban land, and the population density are the lowest (Table 2).
(5) The food provisioning bundle (B5), which had the highest provision services, low regulating services, and poor of biodiversity, was distributed mainly in the important agricultural regions in the Yangtze River Basin. The counties in this bundle are the richest, and almost entirely distributed on the flat area. These counties had the highest GDP, population density, area proportions of cropland and urban land, a high proportion of wetland area, and the lowest mean slope, and are the nearest to the major cities (Table 2).
Though the regulating services and biodiversity were significantly positively correlated, they did not always coexist in the ecosystem service bundles. For example, the soil retention service, water retention service, flood mitigation service and carbon sequestration service were bundled together in B1, B2, and B5, but the situation was different for B3 and B4.
The results of PCA (Figure 5) and RDA (Figure 6) indicated that the geographical and socio-economic variables were correlated with the spatial patterns of ecosystem services. The result of RDA showed the major driving factors that could explain the spatial patterns of ecosystem services (proportion of forest land, proportion of cropland, slope and altitude explained 46.6%, 31.1%, 30.5% and 19.5% of the total variance, respectively) (Figure 6). The result of a PCA analysis indicated that the gradient of geographical factors and socio-economic factors could explain the spatial patterns of the ecosystem services and the ecosystem service bundles (Figure 5). In Figure 5, the horizontal axis and the vertical axis represent the first principal component and the second principal component, respectively. As the first principal component was significantly highly correlated with the proportion of forest land (r = 0.85, p < 0.001), the proportion of cropland (r = −0.77, p < 0.001) and the mean slope (r = 0.69, p < 0.001), it corresponded to the change of land use and slope. This change was from the high proportion of cropland to the high proportion of forest land, and from flat area to the mountainous area. The first principal component explained 38.6% of the variance. The second principal component was significantly highly correlated with the mean altitude (r = −0.73, p < 0.001), and it represented the altitude gradient (from high altitude to low altitude), which explained 19.9% of the variance.
In addition, the ecosystem services shown in Figure 5 could be divided into four groups, and each ecosystem service bundle we obtained corresponded to a group of ecosystem services whose values were higher than those of other bundles. Group 1 (characterized by flood mitigation, water retention, soil retention and carbon sequestration) corresponded to the two high regulating service bundles. Group 2 (characterized by biodiversity and water purification) corresponded to the high biodiversity bundle. Group 3 (characterized by sandstorm prevention) corresponded to the sandstorm prevention bundle. Group 4 (characterized by production of crops, edible oil and meat) corresponded to the food provision bundle.

4. Discussion

Analysis of ecosystem service bundles can help improve the management of multifunctional ecosystems [15]. A deeper understanding of how services are bundled together and the key interactions between them can help managers take advantage of synergies among services and minimize the risk of unnecessary ecological trade-offs [8]. In our study, at a large watershed scale, the key regulating services and biodiversity vital to the conservation of the Yangtze River Basin, as well as the major provision services, were analyzed in terms of their spatial patterns, trade-offs and synergies. We identified the distinct spatial patterns of ecosystem services. We also determined how multiple ecosystem services coexist together and differ from the upper to lower basin reaches, and how they spatially form different ecosystem service bundles through complex social–ecological interactions across the whole area of the Yangtze River Basin. Our findings could have implications for multifunctional ecosystems management in watersheds around the world.

4.1. Trade-Offs and Synergies among Ecosystem Services

The understanding of the complex relationships (trade-offs or synergies) among multiple ecosystem services is the foundation of rational ecosystem-based management [8,15]. We found that synergies exist between biodiversity and regulating services, as other studies showed [9,10,38]. However, the flood mitigation service, for which high values mainly distributed in the areas with high annual precipitation in the middle-lower reaches of the basin, was not correlated significantly with biodiversity, for which high values mainly concentrated in the Hengduan mountains in the upper reaches with complex terrain and climate [23]. The lack of correlation is somewhat surprising given that flood mitigation and biodiversity are both closely related to the proportion and quality of natural ecosystems. Most of the regulating services had significant trade-offs with provision services, as previous studies showed [7,15,16]. However, we found that the sandstorm prevention service, which was aggregated within the plateau area in the source regions of the Yangtze River Basin, was not significantly correlated with productions of oil and meat, which were concentrated in the plain area. Meanwhile, our results showed similar synergies among regulating services, as other studies revealed [9,15], but the sandstorm prevention service was not significantly correlated with other regulating services. These relationships are determined by the spatial clustering patterns of the individual services at the watershed landscape scale, which is important for protecting specific services in a particular area, and helps decrease the ecological risks at the watershed scale.

4.2. Ecosystem Service Bundles and Implications for Management

Policies should be implemented that target bundles of services, instead of individual services or empirical combinations of ecosystem services, taking advantage of different types of social–ecological interactions [10]. We found five distinct ecosystem service bundles across the whole area of the Yangtze River Basin, and they are likely produced by different sets of social–ecological interactions. Previous studies showed that natural and socio-economic gradients influenced the spatial variance in the ecosystem services [7,15]. In the Yangtze River Basin, we found land use, slope and altitude gradients could explain the spatial patterns of ecosystem services and the formation of ecosystem service bundles. Provision services were concentrated in the flat areas with dense cropland, wetland, and the largest population density, a finding similar to that of previous studies [7,15,16]. Most of the regulating services and high levels of biodiversity in our study tended to be distributed in the mountain areas with high forest coverage, except for the sandstorm prevention service, which was located only in the grassland area of the plateau. Meanwhile, high biodiversity levels tended to be located in high-altitude, sparsely populated areas compared to regulating services. Differences in terrain and socio-economic factors determine that high biodiversity and high regulating services do not coexist consistently. The enhancement of regulating services cannot always improve biodiversity, and the enhancement of one regulating service cannot always improve other regulating services in the Yangtze River Basin.
Mapping ecosystem service bundles can identify areas in a landscape where ecosystem management has produced exceptionally desirable or undesirable sets of ecosystem services, and helps identify interventions that can have desired effects on multiple ecosystem services simultaneously [10]. The agriculture bundle type and forest bundle type are the most common types of aggregated ES revealed by previous studies [7,15,16,39]; these represent high provision services and high regulating services, respectively. We obtained two high regulating service bundles: the highest regulating service bundle (mainly distributed in the middle-lower reaches) and the second-highest regulating service bundle (mainly distributed in the upper reaches). In particular, carbon sequestration, water retention, soil retention and flood mitigation, which are highly positively correlated with each other and can bring direct benefits to human welfare (such as water supply, flood avoidance, prevention of soil erosion and air quality regulation), consistently coexist in these bundles. This coexistence indicates that the desirable composition of regulating services is similar in these bundles, and that the enhancement of regulating services also may achieve the objective of improving multiple ecosystem services simultaneously in these bundles. In our study, both the highest and the second-highest regulating service bundles were distributed mostly in the mountain areas, and areas where the bundles were located had the same mean value of slope. However, the provision services were higher in the latter bundle, which was located closer to major cities and presented more trade-offs between regulating services and provision services. For example, sloping cropland caused the problem of soil erosion in the mountain area. To avoid losing the erosion regulating service, arable land used to grow crops on steep slopes should be converted into forest [40], and sustainable soil management should be further enhanced [41]. Besides, depending on management practices, agriculture may cause other problems, such as sedimentation of waterways, greenhouse gas emissions, and pesticide contamination of water and soil resources [2]. To mitigate the trade-offs between provision services and other services, appropriate agricultural management practices (such as ecological agriculture [42]) should be improved to realize the benefits of ecosystem services and reduce the undesirable side-effects from agricultural production [2]. In addition, although the proportions of cropland and urban land were the highest in the food provisioning bundle, these counties had high proportions of wetlands (8.8%) and forest lands (11.6%). The wetland and forest could provide the opportunities to increase regulating services within the food provisioning bundle (e.g., returning farmland to lake, ecotourism) in order to achieve better landscape sustainability and reduce the trade-offs between ecosystem services. Changes in such trade-offs may create significant opportunities for ecosystem management [8] to achieve the sustainable provision of diverse ecosystem services.
Ecosystem service bundles can also provide explicit, tailored information on landscape planning for ecosystem service conservation and design of payment policies for ecosystem services within diverse landscapes at the watershed scale. The biodiversity bundle and the sandstorm prevention bundle that we found in the upper reaches of the Yangtze River Basin are critical to the people in the lower reaches because of their unique ecological functions. As an ecological shelter zone, the natural landscape in the upper Yangtze River (e.g., grassland and forest) must be conserved because it is very important for the sustainable development of ecosystems in the whole basin [43]. In addition, the ecosystems in the upper reaches are sensitive and vulnerable to climate change and to human activities [44]. Therefore, the ecosystem service management of the counties comprising these bundles should focus on conserving their unique and important ecological functions. For the high regulating service bundles in the mountain areas, the focus should be on conservation of the diverse regulating services. Meanwhile, with the acceleration of urbanization in the Yangtze River Basin [45], conservation of the dominant ecological functions should be fully considered in the planning of urban land use within these bundles. Besides, the differentiation revealed in our study of the composition of multiple ecosystem services from the upper to lower reaches in the Yangtze River Basin helps clarify that the providers of important ecosystem services in the upper reaches convey benefits to urban areas in the lower reaches by facilitating a better socio-economic situation [46]. This realization provides useful information for the design of payment policies for ecosystem services between the upper and lower reaches of a watershed, promoting synergistic development of various ecosystem services at an entire watershed scale [47].
Our study analyzed the spatial patterns, the relationships of multiple ecosystem services, and the ecosystem service bundles in the Yangtze River Basin, the largest watershed in China. The study focused on the major regulating services, provision services and biodiversity in the Yangtze River Basin. Because of data limitations, we did not consider the cultural services and other provision services (such as aquatic products); these aspects need to be further studied and compared with the results of the present study. At the macro level, the study revealed the general spatial patterns of multiple ecosystem services, their interactions and the drivers in the Yangtze River Basin. Further research could be conducted on the subsystems of the ecosystem service bundles that we generated to investigate the more complex relationships among multiple ecosystem services at a finer scale than a river basin. Furthermore, the temporal scale could be further considered to analyze the dynamic changes of the multiple ecosystem services and their interactions, as well as the consequent dynamic changes of the ecosystem service bundles.

Acknowledgments

This work was supported by the National Key Research and Development Program of China (No. 2016YFC0503401) and the Science and Technology Service Network Initiative of Chinese Academy of Sciences (KFJ-STS-ZDTP-022/013).

Author Contributions

Hua Zheng and Lingqiao Kong conceived and designed the research; Lingqiao Kong analyzed the data and wrote the paper; Hua Zheng, Yi Xiao and Zhiyun Ouyang revised the paper; Yi Xiao, Zhiyun Ouyan, Cong Li, Lingqiao Kong, Jingjing Zhang and Binbin Huang contributed materials; All authors read and approved the paper.

Conflicts of Interest

The authors declare no conflict of interest.

References

  1. Daily, G.C. Nature’s Services: Societal Dependence on Natural Ecosystems; Island Press: Washington, DC, USA, 1997. [Google Scholar]
  2. Power, A.G. Ecosystem services and agriculture: Tradeoffs and synergies. Philos. Trans. R. Soc. Biol. Sci. 2010, 365, 29592–29971. [Google Scholar] [CrossRef] [PubMed]
  3. Millennium Ecosystem Assessment (MEA). Ecosystems and Human Well-Being: Synthesis; Millennium Ecosystem Assessment: Washington, DC, USA, 2005. [Google Scholar]
  4. Naidoo, R.; Balmford, A.; Costanza, R.; Fisher, B.; Green, R.E.; Lehner, B.; Malcolm, T.R.; Ricketts, T.H. Global mapping of ecosystem services and conservation priorities. Proc. Natl. Acad. Sci. USA 2008, 105, 9495–9500. [Google Scholar] [CrossRef] [PubMed]
  5. Gimona, A.; Dan, V.D.H. Mapping hotspots of multiple landscape functions: A case study on farmland afforestation in Scotland. Landsc. Ecol. 2007, 22, 1255–1264. [Google Scholar] [CrossRef]
  6. Rodríguez, J.P.; Beard, T.D., Jr.; Bennett, E.M.; Cumming, G.S.; Cork, S.J.; Agard, J.; Dobson, A.P.; Peterson, G.D. Trade-offs across Space, Time, and Ecosystem Services. Ecol. Soc. 2006, 11, 709–723. [Google Scholar]
  7. Yang, G.; Ge, Y.; Xue, H.; Yang, W.; Shi, Y.; Peng, C.; Du, Y.; Fan, X.; Ren, Y.; Chang, J. Using ecosystem service bundles to detect trade-offs and synergies across urban–rural complexes. Landsc. Urban Plan. 2015, 136, 110–121. [Google Scholar] [CrossRef]
  8. Bennett, E.M.; Peterson, G.D.; Gordon, L.J. Understanding relationships among multiple ecosystem services. Ecol. Lett. 2009, 12, 1394–1404. [Google Scholar] [CrossRef] [PubMed]
  9. Bai, Y.; Zhuang, C.; Ouyang, Z.; Zheng, H.; Jiang, B. Spatial characteristics between biodiversity and ecosystem services in a human-dominated watershed. Ecol. Complex. 2011, 8, 177–183. [Google Scholar] [CrossRef]
  10. Nelson, E.; Mendoza, G.; Regetz, J.; Polasky, S.; Tallis, H.; Cameron, D.; Chan, K.M.; Daily, G.C.; Goldstein, J.; Kareiva, P.M.; et al. Modeling multiple ecosystem services, biodiversity conservation, commodity production, and tradeoffs at landscape scales. Front. Ecol. Environ. 2009, 7, 4–11. [Google Scholar] [CrossRef]
  11. Renard, D.; Rhemtulla, J.M.; Bennett, E.M. Historical dynamics in ecosystem service bundles. Proc. Natl. Acad. Sci. USA 2015, 112, 13411–13416. [Google Scholar] [CrossRef] [PubMed]
  12. Xu, E.; Zhang, H.; Yang, Y.; Zhang, Y. Integrating a spatially explicit tradeoff analysis for sustainable land use optimal allocation. Sustainability 2014, 6, 8909–8930. [Google Scholar] [CrossRef]
  13. Vlek, P.L.G.; Khamzina, A.; Azadi, H.; Bhaduri, A.; Bharati, L.; Braimoh, A.; Martius, C.; Sunderland, T.C.H.; Taheri, F. Trade-Offs in Multi-Purpose Land Use under Land Degradation. Sustainability 2017, 9, 2196. [Google Scholar] [CrossRef]
  14. Maes, J.; Paracchini, M.L.; Zulian, G.; Dunbar, M.B.; Alkemade, R. Synergies and trade-offs between ecosystem service supply, biodiversity, and habitat conservation status in Europe. Biol. Conserv. 2012, 155, 1–12. [Google Scholar] [CrossRef]
  15. Raudsepp-Hearne, C.; Peterson, G.D.; Bennett, E.M. Ecosystem service bundles for analyzing tradeoffs in diverse landscapes. Proc. Natl. Acad. Sci. USA 2010, 107, 5242–5247. [Google Scholar] [CrossRef] [PubMed]
  16. Turner, K.G.; Odgaard, M.V.; Bøcher, P.K.; Dalgaard, T.; Svenning, J. Bundling ecosystem services in Denmark: Trade-offs and synergies in a cultural landscape. Landsc. Urban Plan. 2014, 125, 89–104. [Google Scholar] [CrossRef]
  17. Queiroz, C.; Meacham, M.; Richter, K.; Norström, A.V.; Andersson, E.; Norberg, J.; Peterson, G. Mapping bundles of ecosystem services reveals distinct types of multifunctionality within a Swedish landscape. Ambio 2015, 44, 89–101. [Google Scholar] [CrossRef] [PubMed]
  18. Martín-López, B.; Iniesta-Arandia, I.; García-Llorente, M.; Palomo, I.; Casado-Arzuaga, I.; Amo, D.G.D.; Gómez-Baggethun, E.; Oteros-Rozas, E.; Palacios-Agundez, I.; Willaarts, B.; et al. Uncovering ecosystem service bundles through social preferences. PLoS ONE 2012. [Google Scholar] [CrossRef] [PubMed]
  19. Fu, B.; Wang, Y.K.; Xu, P.; Yan, K. Mapping the flood mitigation services of ecosystems—A case study in the Upper Yangtze River Basin. Ecol. Eng. 2013, 52, 238–246. [Google Scholar] [CrossRef]
  20. Carpenter, S.R.; Mooney, H.A.; Agard, J.; Capistrano, D.; DeFries, R.S.; Díaz, S.; Dietz, T.; Duraiappah, A.K.; Oteng-Yeboah, A.; Pereira, H.M.; et al. Science for managing ecosystem services: Beyond the Millennium Ecosystem Assessment. Proc. Natl. Acad. Sci. USA 2009, 106, 1305–1312. [Google Scholar] [CrossRef] [PubMed]
  21. Kareiva, P.; Watts, S.; McDonald, R.; Boucher, T. Domesticated Nature: Shaping Landscapes and Ecosystems for Human Welfare. Science 2007, 316, 1866–1869. [Google Scholar] [CrossRef] [PubMed]
  22. Zhang, L.; Xu, W.; Ouyang, Z.; Zhu, C. Determination of priority nature conservation areas and human disturbances in the Yangtze River Basin, China. J. Nat. Conserv. 2014, 22, 326–336. [Google Scholar] [CrossRef]
  23. Zhu, W.; Fan, J.; Wang, Y.; Shen, X.; Tian, B.; Wei, Z. Assessment of biodiversity conservation importance in the upper reaches of the Yangtze River: By taking county area as the basic assessment unit. Acta Ecol. Sin. 2009, 29, 2603–2611. [Google Scholar]
  24. Long, H.; Heilig, G.K.; Wang, J.; Li, X.; Luo, M.; Wu, X.; Zhang, M. Land use and soil erosion in the upper reaches of the Yangtze River: Some socio-economic considerations on China’s Grain-for-Green Programme. Land Degrad. Dev. 2006, 17, 589–603. [Google Scholar] [CrossRef]
  25. WestDC. Available online: http://westdc.westgis.ac.cn/ (accessed on 26 January 2018).
  26. Xu, W.; Xiao, Y.; Zhang, J.; Yang, W.; Zhang, L.; Hull, V.; Wang, Z.; Zheng, H.; Liu, J.; Polasky, S.; et al. Strengthening protected areas for biodiversity and ecosystem services in China. Proc. Natl. Acad. Sci. USA 2017, 114, 1601–1606. [Google Scholar] [CrossRef] [PubMed]
  27. Esri. Available online: http://www.esri.com/arcgis/about-arcgis (accessed on 26 January 2018).
  28. Ouyang, Z.; Zheng, H.; Xiao, Y.; Polasky, S.; Liu, J.; Xu, W.; Wang, Q.; Zhang, L.; Xiao, Y.; Rao, E.; et al. Improvements in ecosystem services from investments in natural capital. Science 2016, 352, 1455–1459. [Google Scholar] [CrossRef] [PubMed]
  29. Kareiva, P.; Tallis, H.; Ricketts, T.H.; Daily, G.C.; Polasky, S. Natural Capital: Theory and Practice of Mapping Ecosystem Services; Oxford University Press: New York, NY, USA, 2011. [Google Scholar]
  30. Wischmeier, W.H.; Smith, D.D. Predicting Rainfall Erosion Losses: A Guide to Conservation Planning; U.S. Department of Agriculture: Washington, DC, USA, 1978.
  31. Chen, P.; Wang, X.; Wang, L. Carbon Budget and Its Sink Promotion of Terrestrial Ecosystem in China; Science Press: Beijing, China, 2008. [Google Scholar]
  32. Fang, J.; Yang, Y.; Ma, W.; Anwar, M.; Shen, H. Ecosystem carbon stocks and their changes in China’s grasslands. Sci. China Life Sci. 2010, 53, 757–765. [Google Scholar] [CrossRef] [PubMed]
  33. Fryrear, D.; Chen, W.; Lester, C. Revised wind erosion equation. Ann. Arid Zone 2001, 40, 265–279. [Google Scholar]
  34. InVEST User Guide. Available online: http://data.naturalcapitalproject.org/nightly-build/invest-users-guide/html/ (accessed on 26 January 2018).
  35. Moran, P.A. Notes on continuous stochastic phenomena. Biometrika 1950, 37, 17–23. [Google Scholar] [CrossRef] [PubMed]
  36. The R Project for Statistical Computing. Available online: https://www.r-project.org/ (accessed on 26 January 2018).
  37. Kaufman, L.; Rousseeuw, P.J. Finding Groups in Data: An Introduction to Cluster Analysis; John Wiley & Sons: Hoboken, NJ, USA, 2009. [Google Scholar]
  38. Balvanera, P.; Pfisterer, A.B.; Buchmann, N.; He, J.; Nakashizuka, T.; Raffaelli, D.; Schmid, B. Quantifying the evidence for biodiversity effects on ecosystem functioning and services. Ecol. Lett. 2006, 9, 1146–1156. [Google Scholar] [CrossRef] [PubMed] [Green Version]
  39. Dick, J.; Andrews, C.; Beaumont, D.A.; Benham, S.; Brooks, D.R.; Corbett, S.; Lloyd, D.; McMillan, S.; Monteith, D.T.; Pilgrim, E.S.; et al. A comparison of ecosystem services delivered by 11 long-term monitoring sites in the UK environmental change network. Environmetrics 2011, 22, 639–648. [Google Scholar] [CrossRef]
  40. Liu, J.; Li, S.; Ouyang, Z.; Tam, C.; Chen, X. Ecological and socioeconomic effects of China’s policies for ecosystem services. Proc. Natl. Acad. Sci. USA 2008, 105, 9477–9482. [Google Scholar] [CrossRef] [PubMed]
  41. Harden, C.P. Soil Erosion and Sustainable Mountain Development. Mt. Res. Dev. 2001, 34, 77–83. [Google Scholar] [CrossRef]
  42. Wang, H.; Qin, L.; Huang, L.; Zhang, L. Ecological Agriculture in China: Principles and Applications. Adv. Agron. 2007, 94, 181–208. [Google Scholar]
  43. Pan, K.; Wu, N.; Pan, K.; Chen, Q. A discussion on the issues of the re-construction of ecological shelter zone on the upper reaches of the Yangtze River. Acta Ecol. Sin. 2004, 24, 617–629. [Google Scholar]
  44. Zhang, J.; Sun, J.; Ma, B.; Du, W. Assessing the ecological vulnerability of the upper reaches of the Minjiang River. PLoS ONE 2017, 12. [Google Scholar] [CrossRef] [PubMed]
  45. Wu, X.; Shen, Z.; Liu, R.; Gong, Y. Effect of land use change on ecosystem services value of the upper reaches of the Yangtze River. Trans. Chin. Soc. Agric. Eng. 2009. [Google Scholar] [CrossRef]
  46. Kosoy, N.; Martinez-Tuna, M.; Muradian, R.; Martinez-Alier, J. Payments for environmental services in watersheds: Insights from a comparative study of three cases in Central America. Ecol. Econ. 2007, 61, 446–455. [Google Scholar] [CrossRef]
  47. Landell-Mills, N. Developing markets for forest environmental services: An opportunity for promoting equity while securing efficiency? Philos. Trans. R. Soc. Lond. Math. Phys. Eng. Sci. 2002, 360, 1817–1825. [Google Scholar] [CrossRef] [PubMed]
Figure 1. The Yangtze River Basin.
Sustainability 10 00857 g001
Figure 2. Spatial distribution of the values obtained for individual ecosystem services (ESs) across the 779 counties in the Yangtze River Basin. Darker shades of blue represent higher production of a service.
Sustainability 10 00857 g002aSustainability 10 00857 g002b
Figure 3. Matrix of Pearson correlations between different ecosystem services (* p < 0.05; ** p < 0.01; *** p < 0.001). Blue and red colors indicate positive and negative correlations, respectively. The deeper the color, the higher the correlation.
Sustainability 10 00857 g003
Figure 4. Bundles of ecosystem services (ES) identified using partitioning around medoid clustering for the study area. The five ES bundles (along the top of the figure) are represented by rosette diagrams. The diagrams are dimensionless, as they are based on normalized data for each service, and a larger petal length indicates the higher production of a particular service. The counties included in each bundle are highlighted in different colors on the map.
Sustainability 10 00857 g004
Figure 5. Loading diagram of principal component analysis. The ecosystem services and biodiversity are divided into four groups and each ecosystem service bundle identified in the cluster analysis corresponded to a group of ecosystem services. The compositions of each group represent the ecosystem services that are higher in the corresponding bundle than in other bundles.
Sustainability 10 00857 g005
Figure 6. Redundancy analysis (RDA) results showing the relationships between driver variables and response variables. Driver variables include the following: (1) PC (proportion of cropland); (2) PF (proportion of forest land); (3) SL (slope); (4) AT (altitude). Response variables include the following: (1) BD (biodiversity); (2) SR (soil retention); (3) WR (water retention); (4) FM (flood mitigation); (5) WP (water purification); (6) SP (sandstorm prevention); (7) CS (carbon sequestration); (8) CP (crop production); (9) EOP (edible oil production); (10) MP (meat production). The cosine of the angle between arrows approximates the correlation coefficient between variables and the length of arrows represents the extent to which the variable is explained.
Sustainability 10 00857 g006
Table 1. Data sources for ecosystem service evaluation.
Ecosystem ServicesUnitData Source
Regulating services
Soil retentiont/km2Classification map of ecosystems in 2015;
Vegetation coverage;
Digital elevation model (DEM) (from U.S. Geological Survey);
Soil properties (from WestDC [25]);
Rainfall erosivity (from Beijing Normal University)
Water retentiont/km2Classification map of ecosystems in 2015;
Precipitation (from China Meteorological Administration);
Evapotranspiration (from Institute of Geographic Sciences and Natural Resources Research, CSA)
Flood mitigation
Water purificationm2/kgClassification map of ecosystems in 2015;
Precipitation;
Soil depth (from Harmonized World Soil Database);
Soil properties;
DEM
Carbon sequestrationgC/m2Classification map of ecosystems in 2015;
Ecosystem biomass
Sandstorm preventiont/km2Classification map of ecosystems in 2015;
Vegetation coverage;
Soil properties;
DEM;
Precipitation;
Temperature (from China Meteorological Administration);
Wind speed (from Institute of Geographic Sciences and Natural Resources Research, CSA);
Solar radiation (from WestDC: [25])
Biodiversity conservationspeciesDistribution information for plants, mammals, amphibians, reptiles and birds [26]
Provision services
Crop productiont/km2County-level agriculture data (from the Agricultural Information Institute of the Chinese Academy of Agricultural Sciences)
Edible oil production
Meat production
Data from the classification map of ecosystems in 2015, vegetation coverage and ecosystem biomass were from the national ecological environment survey and evaluation database. t = metric tons.
Table 2. Natural and socio-economic variables in the different ecosystem service bundles (B1–B5).
Natural and Socio-Economic VariablesB1B2B3B4B5
Quantity of counties126324534272
Mean slope (degree)13.213.124.06.63.6
Mean forest land rate (%)63.339.034.80.011.6
Mean grassland rate (%)2.65.431.471.51.0
Mean wetland rate (%)2.04.11.210.08.8
Mean cropland rate (%)16.428.92.70.055.9
Mean urban land rate (%)3.36.40.20.018.7
Mean population density (person/km2)1965103531579
Mean GDP (108 yuan)103.2186.424.577.2476.5
Mean distance to big cities (km)204.4178.0312.9535.6113.0

