
Does Standardisation Ensure a Reliable Assessment of the Performance of Construction Products?


Group of Testing Laboratories, Instytut Techniki Budowlanej, Filtrowa 1, 00-611 Warsaw, Poland
Standards 2022, 2(3), 260-275; https://doi.org/10.3390/standards2030019
Submission received: 7 June 2022
/
Revised: 20 June 2022
/
Accepted: 21 June 2022
/
Published: 24 June 2022
(This article belongs to the Special Issue Standards and Assessment of Construction Products)
Abstract
:The implementation of a standard should be preceded by research work aimed at developing the test method, particularly in validation experiments. Is it actually so? Numerous experiences of producers and labs and an increasing number of scientific works prove the opposite. It turns out that some standard methods are very poorly suited to assessing the performance of construction products. This is related both to the specificity of the methods and the tested products. This article presents some product assessment problems and the risk of using test methods that have not been fully validated. The risk seems relatively low if laboratories account for their own uncertainty. However, in some cases, additional components that both laboratories and product manufacturers might fail to consider can significantly increase the risk. This indicates the need for continuous work in the reference area.
1. Introduction
The need for standardisation, meant as harmonisation of rules and developing and issuing standards from authorised institutions, can be noticed in nearly all areas of human activity. It applies most to standardising operating procedures, including but not limited to test methods [1,2,3]. The idea is to ensure comparable results of operations carried out by different entities.
Introducing harmonised assessment of construction products in the European market based on the Construction Products Regulation (CPR) [4] serves the same purpose. The system shall ensure that building structures as a whole, and their components, fulfil user safety and health requirements. A system of basic construction work requirements and the resulting essential characteristics was created to set uniform rules. Harmonised standards applying to construction products are supposed to guarantee standardised assessment. They establish the levels and classes of performance depending on the product application and indicate specific standardised test methods that should be used for product assessment. The system appears orderly and cohesive. Nonetheless, risk related to the applied test method occurs at the level of laboratory tests used for performance assessment. The risk is revealed in divergent test results from different laboratories for the same products. The differences tend to be so significant that they result in different product classifications and imply different application ranges of the products.
At a glance, the source of the problem can be attributed to:
- Incorrectly performed testing procedure in a lab, including too-high result uncertainty;
- Drawbacks of the production process, which does not ensure the product’s constancy of performance.
Based on experiences [5,6,7,8], it can be concluded that the actual sources are different (except for apparent laboratory errors or production failures). The applied test methods constituting the system’s base contribute significantly to the different product assessment results. In some cases, the whole system seems to be founded on a slightly wobbly base (Figure 1).
The role of the uncertainty of results in decision making is evident, and it applies to all decisions based on input data obtained with various methods [9]. Accredited laboratories partaking in construction product assessments as a third party have to estimate the measurement uncertainty and include it in assessments of compliance with the criteria [10,11,12,13]. The client and the laboratory have to agree on the rule-based on measurement uncertainty for the assessment. The risk of an incorrect decision, related to the uncertainty of test results, is described in many publications on chemistry, metrology, biology and medicine, e.g., [14,15,16,17,18]. Some papers were also published on the risk related to the uncertainty in construction product assessment [5,6,19,20,21]. The worrying signals concerning the divergent test and assessment results are worthy of further deliberation and adequate work. A lack of dependability of the test results can adversely affect construction product manufacturers and users. This paper presents some aspects affecting the reliability of results. The author mainly focuses on the influence of dark uncertainty defined by Thompson and Ellison [22].
2. Assessment of Compliance with Criteria, Including the Uncertainty
2.1. Essential Rules of Assessing the Results’ Compliance with the Criteria
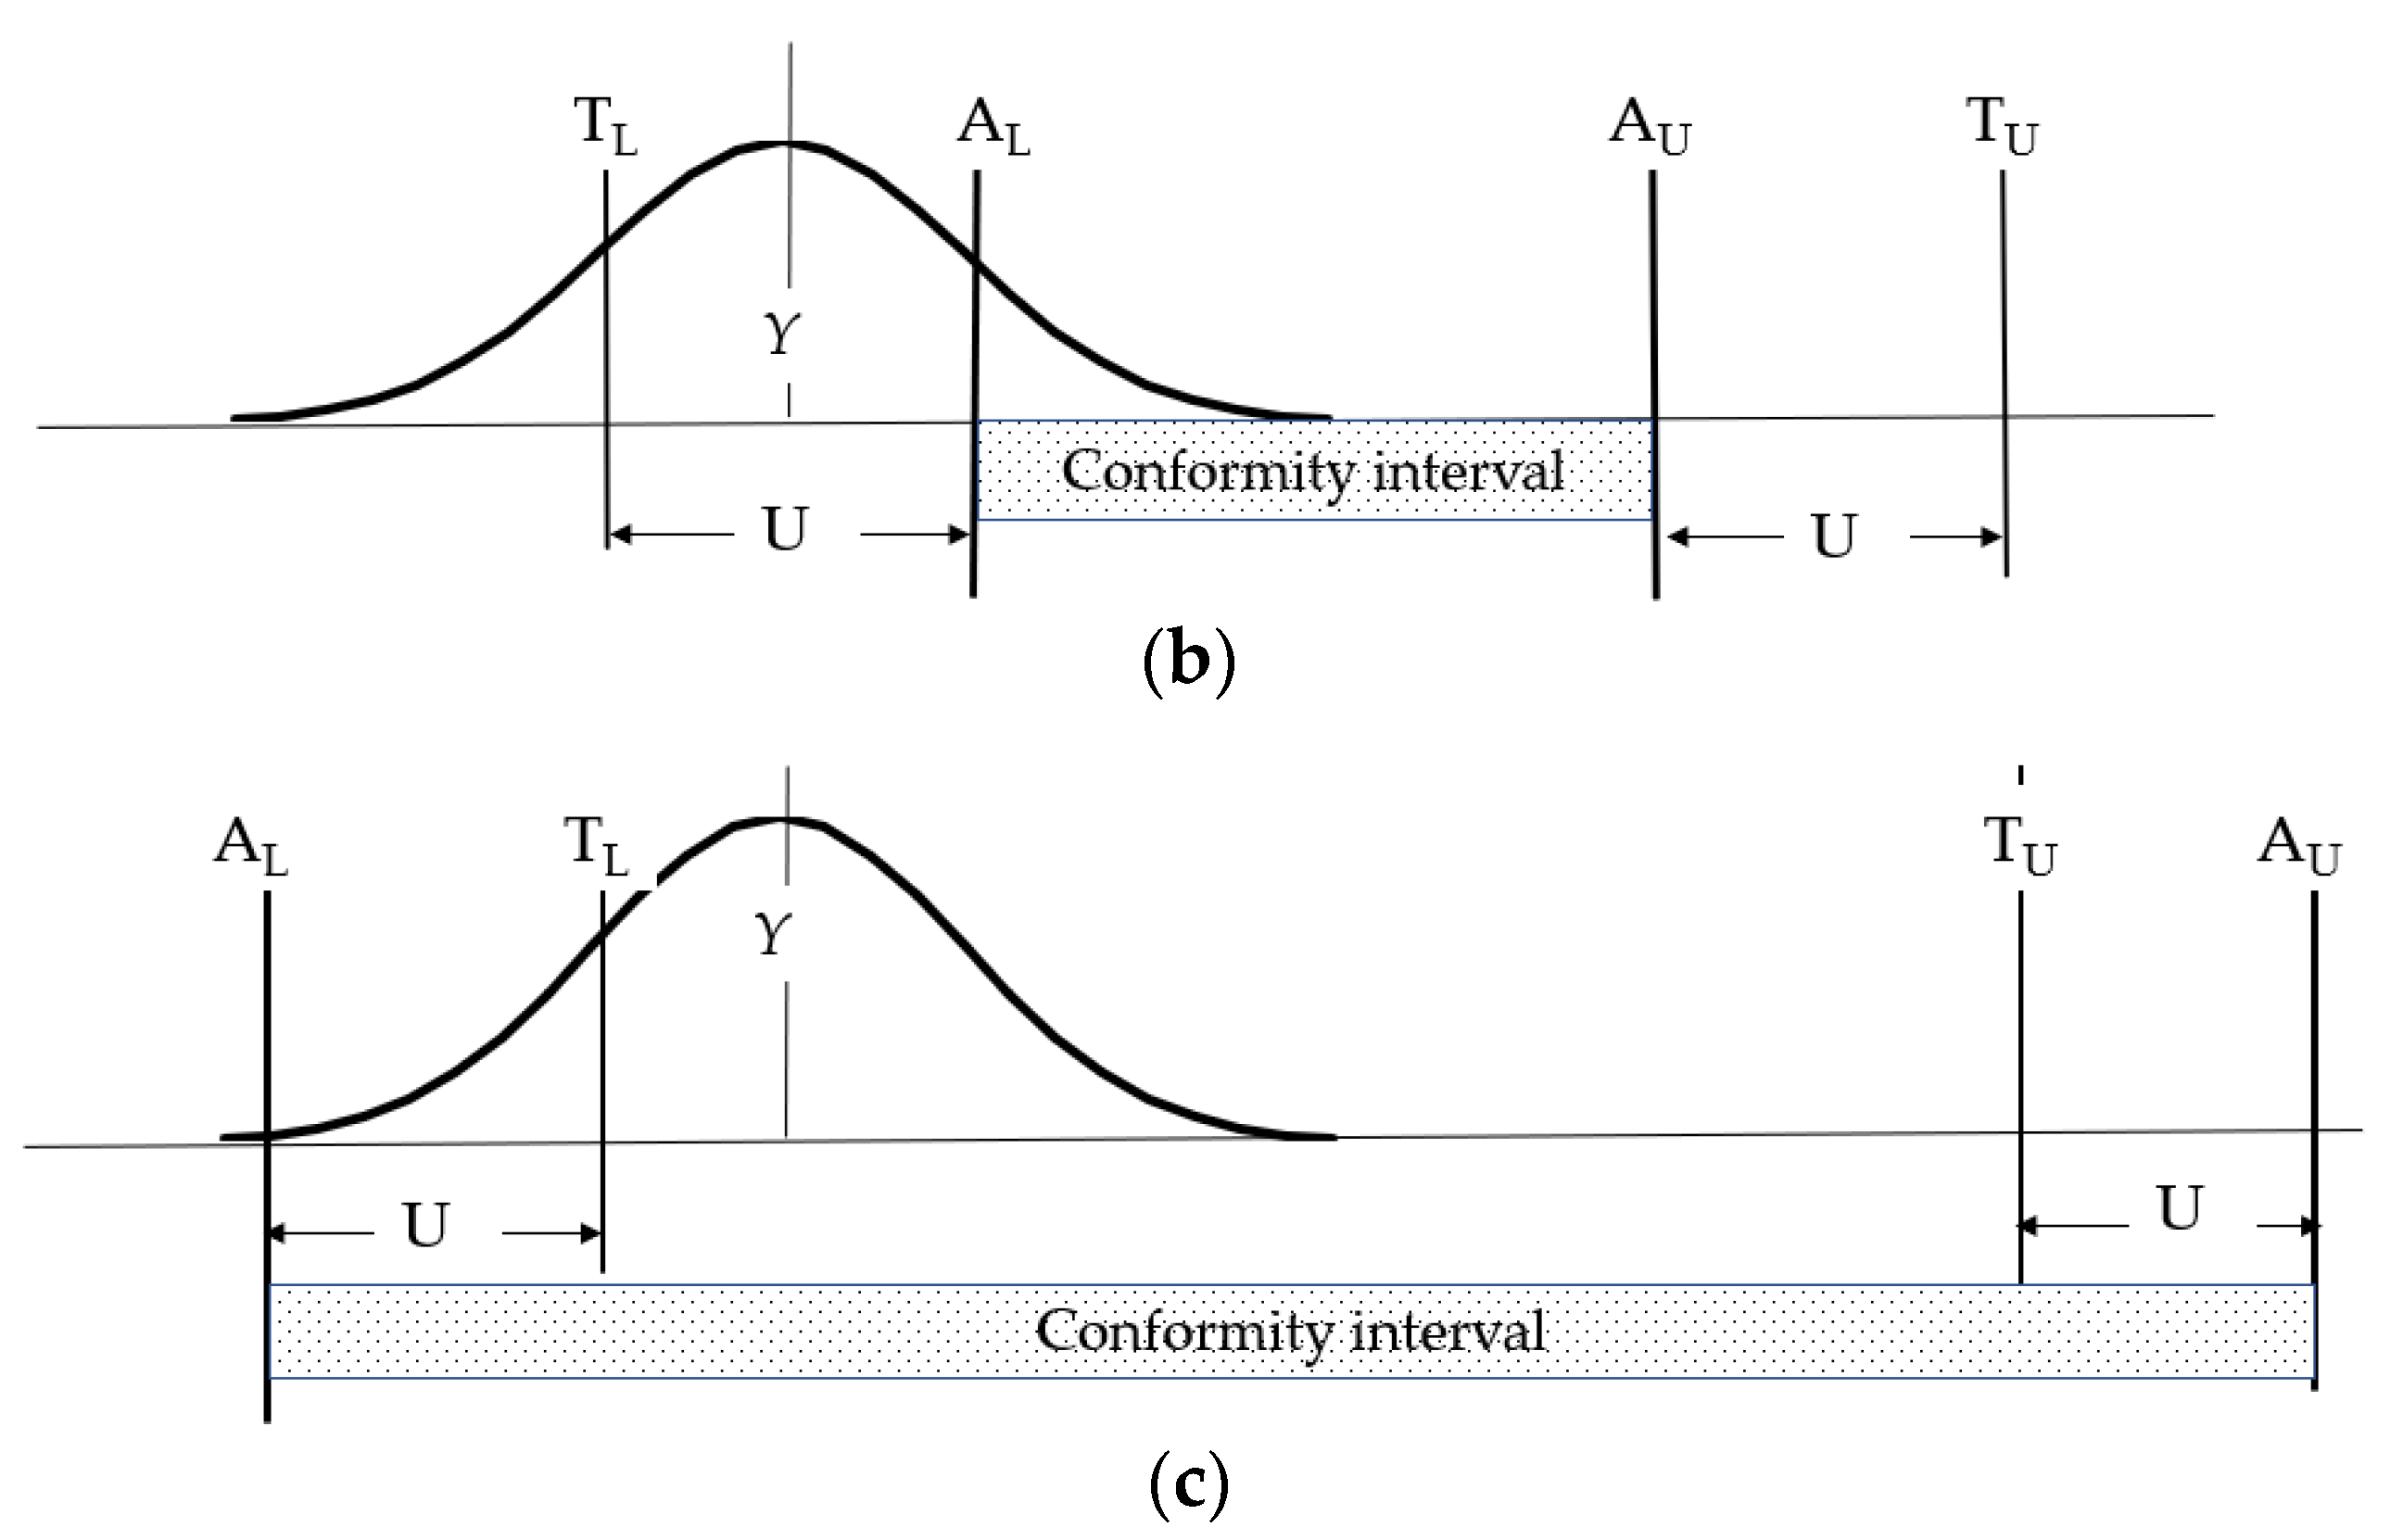
Figure 2 shows the three most common rules for assessing compliance with the criteria: simple acceptance, guarded acceptance and guarded rejection [12]. The assessment of the results’ compliance with most construction products’ criteria is based on the simple acceptance rule (rule of shared risk). Further analysis shows that this rule application is the only reasonable solution for most construction product test methods.
The probability density functions (PDF) can take various shapes. For simplicity, they are shown as Gaussian curves in the diagrams.
Conformity assessment when the simple acceptance rule is used involves comparing the Y test result (see Figure 2a) directly with the tolerance limits (TL, TU—lower and upper tolerance limit, respectively)
The guarded acceptance rule establishes a guard band w and the AL and AU acceptance limits. The common assumption is that w = U, where U expanded uncertainty for 95% coverage probability. Then:
The same Y result that was considered compliant with the criteria when the simple acceptance rule was applied can be rejected due to the guarded acceptance rule (Figure 2b).
Guarded rejection extends the acceptance limits according to the equation:
Therefore, the result was also considered to be in compliance.
When guarded acceptance or guarded rejection is used in the form shown in Equations (1) and (2), one has to know the expanded uncertainty.
For simple acceptance, the knowledge does not appear necessary. Still, when the rule is applied, the following condition is assumed to be fulfilled:
where Cm—measurement capability index
For a reliable assessment of the construction product performance, one must know the risk related to the decision on compliance with the criteria. Estimating the probability of a wrong decision is based on the knowledge of the probability density function (PDF), shown in Figure 2, and symbolically as a Gaussian curve. However, the knowledge of probability distribution is not trivial, even for measurements [11,23].
All the rules mentioned above apply to measurements and their uncertainty. Many divergent approaches to uncertainty and compliance assessments result from the fact that all requirements for testing laboratories apply to measurement uncertainty. The ILAC G 17 document [24] includes a specifying term: measurement uncertainty in testing. Nonetheless, in most construction product assessments, the risk is related to the uncertainty of the test result rather than the measurement uncertainty.
2.2. Measurement vs. Test
The withdrawn EA-4/16 document [25] concisely presented the core difference between measurement and test. Primarily, it differentiated the result between a measurand for the measurement and a characteristic for the test.
Measurand is a physical value that has a “real value” regardless of the measurement method, and the measurement method determines only the result uncertainty. Typical measurand examples include linear dimensions, weight, substance concentration, temperature, etc.
In the case of test methods, the result is determined by the method, and there is no well-determined “real value” which can be obtained with another test method. Construction product tests are dominated by test methods (e.g., reaction to fire, fire resistance, impact strength, climate resistance, absorbability, adhesion, etc.). Even if the result is expressed numerically based on the system of quantities (system based on seven base quantities: length, mass, time, electric current, thermodynamic temperature, amount of substance, and luminous intensity [26]), it depends on the test method. The sample’s mass is a measurement with a measurand well defined by a mass standard. Still, a change in the weight after immersing the sample in water depends on the factor that should be described sufficiently well in the test method, such as water temperature, immersion time, etc.
The literature [27,28,29] uses the term “method-defined measurand”, which seems similar to the concept of a test result. ISO 17034 [30] calls such a measurand an “operationally defined measurand”, which is defined as a “measurand that is defined by reference to a documented and widely accepted measurement procedure to which only results obtained by the same procedure can be compared”. Brown and Andres [29] emphasise that the difference between a method-defined measurand and a measurand is not explicit. Still, the method used dominates the spread of results for a method-defined measurand.
Considering the above, measurement uncertainty seems a minor component of the actual test result uncertainty.
The test methods used in the assessment of construction products can be divided into three groups:
- Strictly measurement methods;
- Test methods involving measurements, resulting in method-defined results;
- Test methods rendering qualitative results.
There are doubts concerning estimating the uncertainty in both measurement methods and test methods. In the case of methods with qualitative results, it is difficult to speak of uncertainty in the test result. Practically, it is only possible to assess the uncertainty of the measurements performed as part of the test.
2.3. Uncertainty Related to Selecting a Representative Sample
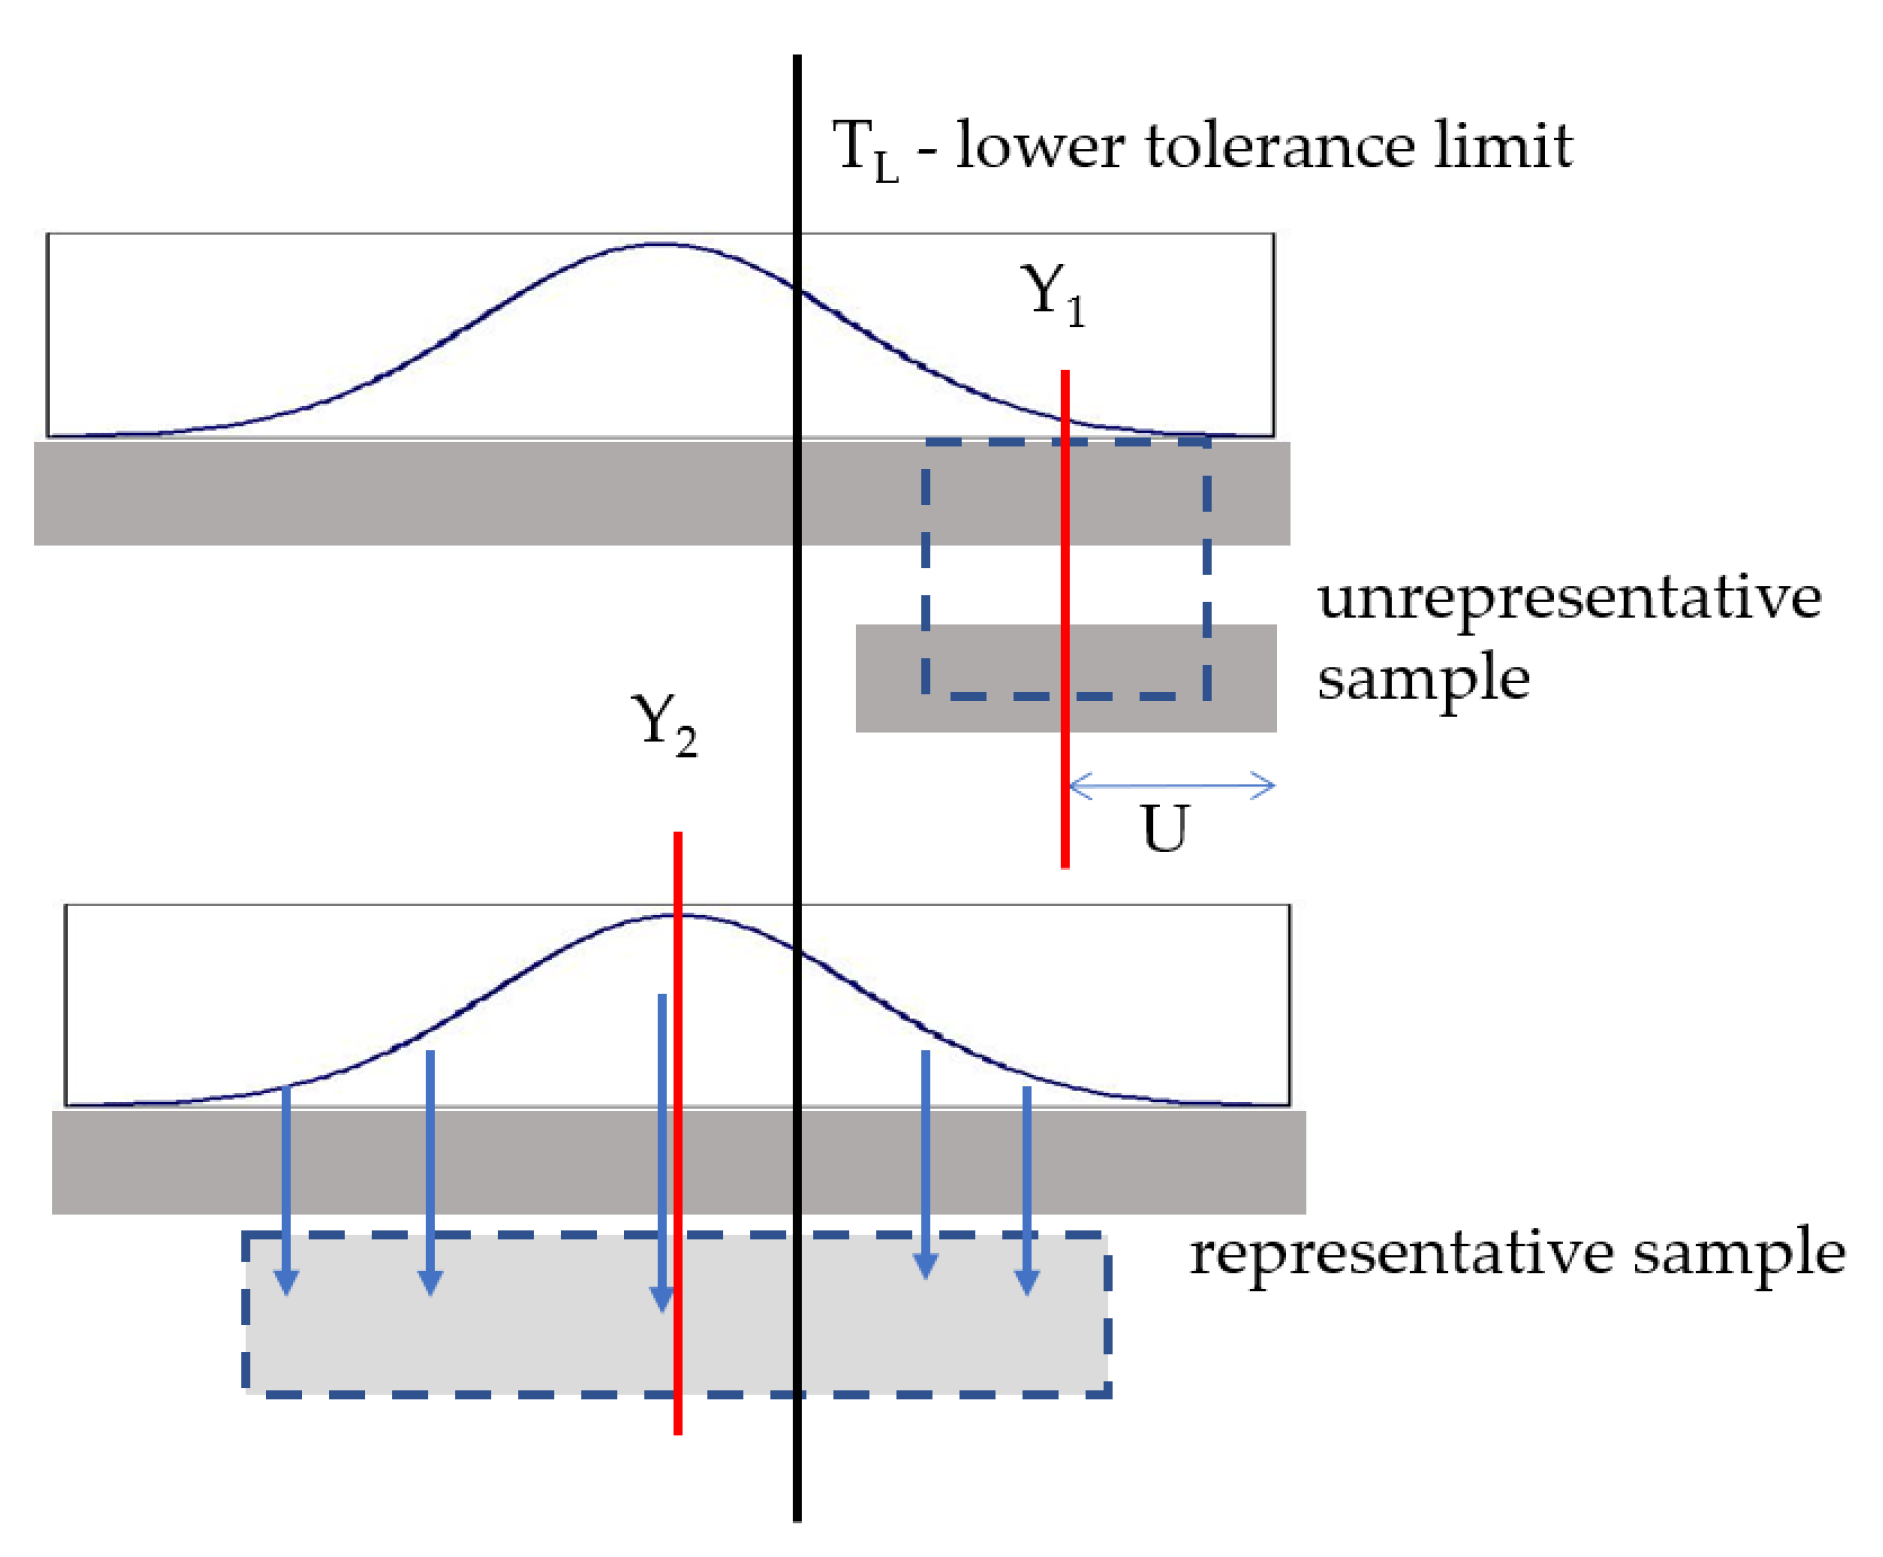
Assessment of the test result’s compliance with the criterion is the laboratory’s simplest task, which refers only to a single test sample. In order to assess a population of products without testing every single item, a sample representative for the population must be selected (Figure 3).
In the AVCP (Assessment and Verification of Constancy of Performance) system 3, a laboratory assesses the performance of construction products based on a sample collected by the manufacturer [4]. Technically, collecting the sample via the manufacturer is the most reasonable, as the manufacturer knows the production variability limits best. Under a specific production process, they manage the factory production control system and collect samples according to a pre-set schedule based on the knowledge of the product and its manufacturing process. A notified laboratory which evaluates the performance knows only the test results for the submitted sample. Naturally, such performance assessment leads to a situation in which the manufacturer decides what to include in the declaration of the constancy of performance.
The uncertainty aspects of sampling are mentioned, e.g., by ISO/IEC GUIDE 98-6 [31] and the scientific literature, e.g., [32,33,34]. Estimating the uncertainty resulting from sampling is based on an established sampling plan. If a laboratory does not collect samples, it does not know the uncertainty component.
Another aspect of a lack of information on the sampling uncertainty is that sampling uncertainty can be determined only when referred to the tested value. Still, in many harmonised standards, e.g., [35], the manufacturer can confirm the constancy of performance with indirect methods, and the constancy of performance as such is not tested under the factory production control. Indirect methods ensure constancy of production, but they do not provide information about changing the performance due to sampling. That is why the manufacturer may not be aware of the sampling uncertainty concerning a specific performance aspect.
3. Measurement Uncertainty and Dark Uncertainty Related to Tests
3.1. Measurement Uncertainty in Testing
The measurement uncertainty estimation methods are broadly described in the documents applicable to accredited laboratories and the scientific literature.
Simple measurements let testing laboratories learn about the measurement standard uncertainty on the basis of data originating from equipment calibration (uB). Still, there are doubts about the approach to the dispersion of results even in such cases.
A measurement equation can be as follows [11]:
where:
- X—measurement result;
- μ—expected value;
- A—aleatory component, related to random effects in repeatability conditions;
- B—type B component.
Hence, the X standard uncertainty, ux, is described with the following equation:
The uA component is typically a standard deviation obtained in n repeated measurements. Since a testing laboratory usually makes a limited number of measurements, which always apply to different test objects, it seems most reasonable to conduct the initial measurements on single, uniform material and use the obtained standard deviation as uA in Equation (5). This way, constant uncertainty is obtained for measurements conducted on different test objects.
For simple measurements, e.g., linear dimensions, it can be of little significance, but becomes more vital in tests consisting of several measurements, as described in Section 3.2.
In order to obtain the expanded uncertainty U(X), coverage probability p has to be determined, which is defined as the “probability that the set of true quantity values of a measurand is contained within a specified coverage interval” [26].
where k—coverage factor ensuring specific coverage probability p.
The coverage probability of 95% is usually applied for measurement uncertainty estimations. There are no explicit guidelines for determining the relationship between coverage factor k and coverage probability p [11,23]. The knowledge of probability distribution poses the biggest problem. In the case of simple Equation (5), it is evident that putting two functions together, even if they are normal distribution functions, does not necessarily lead to normal distribution. The value k = 2 most commonly used for p = 95%, concerning normal distribution, is not the correct solution in many cases.
Testing laboratories use different approaches to coverage factor determination, which leads to significant discrepancies in uncertainty estimations, as demonstrated, e.g., in the paper authored by Szewczak and Piekarczuk [36].
3.2. Test results Uncertainty
3.2.1. “Known” Uncertainty
If a test includes many measurements, the test result can be expressed with the following equation:
where:
- Y—test result;
- xi—measurands.
Every measurand can be expressed with Equation (4) and its approximate standard uncertainty with Equation (5).
Combined standard uncertainty
A test is usually not based only on measurements. The test methods used for construction product testing are often based on a sequence of measurements and non-measurement stages, e.g., a stage of exposure to factors such as temperature, humidity, pressure, chemicals, electromagnetic impact, fire, UV radiation, etc.
It may not be possible to estimate standard uncertainty according to the rule presented in Equations (4), (5), (7) and (8), as individual factors contributing to the uncertainty cannot be linked to the test result with the model equations.
A typical procedure in such cases is to add to Equation (8), a component related to the dispersed test end result Y. The component is the same as the aleatory component A in measurement Equation (4). Then, the uncertainty is estimated based on the following equation:
where is a random uncertainty component of result Y, whose value is typically the standard deviation from the obtained results.
Laboratories testing the construction products’ performance have little knowledge about the actual possible dispersion of the results caused by the testing procedure due to the following reasons:
- Different products submitted by clients are tested in such laboratories;
- The standard number of repetitions in construction product tests is low (usually 3–5), and in some cases, the test is performed only once. It is caused by the cost of samples and the test and the fact that the sample is destroyed in most tests.
That is why, in the best-case scenario, a laboratory has data concerning random dispersion of the results in the form of a collection of standard deviation values {sr1, sr2, … srM} estimated based on a small number of repetitions, each applying to a different product.
Assuming by an estimate that in the laboratory, the component applying to random effects related to the test performance is constant and equals , the standard deviation srj of the j material tests can be divided into two components:
where is the standard deviation related to non-uniform samples of the tested product j. It is different for each product and, consequently, for each test.
The component of uncertainty can be approached in two ways:
- Including the value in the result uncertainty. The uncertainty will be different for each test;
- Including the estimated previously based on historical data when estimating the uncertainty (e.g., uniform material used in the test).
Most of the standardised test methods do not specify the procedures, and that is why the differences in the estimated uncertainties can be significant. Examples are summarised in Table 1.
Using in Equation (9), where is a standard deviation obtained historically, at a high number of repetitions and with samples as homogeneous as possible, will enable estimation of result uncertainty assigned to laboratory operations and will not refer to the product characteristics.
Using in Equation (9), where is a standard deviation from current results, contains a product-dependent component and is calculated based on a low number of repetitions.
Since there are no specific provisions, each laboratory quotes uncertainty estimated differently.
Still, the issue of the coverage factor, presented in Section 3.1, remains valid, as it is the source of more divergence. Noticing the divergences, one wonders how reliable the uncertainties quoted by laboratories are.
3.2.2. Dark Uncertainty
Thompson and Ellison [22] deliberated on dark uncertainty that “would appear as an unexpectedly large dispersion of values”. The dispersion is inadequately high against the measurement uncertainty values estimated according to the so-called GUM (Guide to the Expression of Uncertainty in Measurement, JCGM 100 [11]). The analysis is applied to chemical tests, but it is more evident for different types of construction product test methods.
In product sample tests commissioned to independent laboratories by the market surveillance authorities, the manufacturers observe that the results differ—often significantly—from those obtained under factory production control. A similar effect is observed by accredited laboratories participating in proficiency tests (PT) or interlaboratory tests (ILC). Even if the organisers consider laboratories results correct, the dispersion of results is still evident, which can sometimes be several times higher than the dispersion of results in each laboratory.
An intuitive conclusion can be that it is caused by “driving forces that produce changes” [9]. Some of the forces can be identified on a testing laboratory level. Imposing adequate additional limitations in the testing model (e.g., narrowing the test temperature tolerance limits against the limits suggested by the standard) can reduce the dispersion of the results.
Nonetheless, it is an action on a single laboratory level which does not change the general situation, i.e., the differences in the results between laboratories. It can be attributed to the fact that:
- Arrangements made by one laboratory are not valid for other laboratories;
- Driving forces in one laboratory do not necessarily affect the differences in the results obtained by other laboratories, or their share is limited.
If the differences between laboratories are assumed to be caused by a hidden uncertainty component uH, Equation (9) takes the following form:
The uH value is related to the interlaboratory component, expressed with interlaboratory standard deviation (), and related to the repeatability () and reproducibility () standard deviations with the following formula [40]:
Hence:
Estimating the share of dark uncertainty under some analytical studies, Thompson and Ellison analysed collections of test results, considering the u/sR parameter, where u is the standard uncertainty estimated according to the GUM, and sR is the value of reproducibility standard deviation obtained in interlaboratory tests. Depending on the ILC program and type of test, the value of the u/sR median ranged from 0.55 to 0.75. It suggested that the measurement uncertainty can be significantly underestimated.
In construction product testing, uncertainty estimation, according to the GUM rules, is significantly less reliable (see Section 3.2.1), and typically the current dispersion of results has the largest share. It is expressed with standard deviation in repeatability conditions, sr, which is usually much higher than the uncertainty component uB resulting from equipment calibration. In order to evaluate the dark uncertainty scale, the data presented in the ILC Reports were analysed in this study. The data originate from tests carried out by PT/ILC accredited organisers and data from inter- and intra-laboratory experiments performed by the Instytut Techniki Budowlanej. The sr/sR ratio was analysed, where sR is the reproducibility standard deviation.
Table 2 summarises the results for some test methods. The sr, sL and sR values were calculated by the author of the article on the basis of laboratory test results reported by the ILC Organizers. If the reports included sufficient data, sr, sL and sR values were calculated according to ISO 5725-2 [40], but no tests were used in relation to outliers. The organiser’s unsatisfactory results, based on the organiser’s criteria, were rejected.
If the ILC Reports missed the data necessary for sr estimation (repetitions in individual laboratories), the sR was estimated in a simplified way based on the formula [41]:
where:
ymax, ymin—maximum and minimum results obtained under the ILC using the selected test method.
This method of estimation shall be considered simplified. The obtained value offers a general view of the possible dispersion of results between laboratories.
By analysing the results shown in Table 2, the following regularities can be traced:
- In all cases sr/sR < 1. It means underestimated uncertainty if the laboratory assumes a random component for its estimation
- There is a significant sR rising trend when the scope of actions performed under the testing procedure is extended. Tests according to EN 826:2013 provide a good example: sR deviation for compressive strength is relatively low (ca. 2%), while the sR for compression modulus of elasticity is exceptionally high (ca. 63% or ca. 38% after eliminating the lowest and the highest score).
Adhesion test results for different materials and test methods also show significant standard deviations of reproducibility. The ILC for tests according to EN 12004-2:2017 organised for over thirty laboratories by Ceprocim S.A. and for three laboratories by the Building Research Institute revealed similar sR values of initial adhesion (ca. 26% and 22%, respectively). However, for the tensile adhesion strength after water immersion, the sR ≈ 60%.

Table 2.
Analysis of ILC Reports data. The values of interlaboratory standard deviation (), repeatability () and reproducibility () standard deviations are expressed as percentage of the general mean for the reference ILC. P/n—number of laboratories/number of results for laboratory.
Table 2.
Analysis of ILC Reports data. The values of interlaboratory standard deviation (), repeatability () and reproducibility () standard deviations are expressed as percentage of the general mean for the reference ILC. P/n—number of laboratories/number of results for laboratory.
| Test Method | sr % | sR % | sL % | P/n | sr/sR | ILC Report |
|---|---|---|---|---|---|---|
| ISO 12567-2:2005 [42] Thermal transmittance of roof windows Um, | ITB data: 0.27 (2 tests) 0.15 (2 tests) | 5.7 6.2 | No data | 6/1 | [43] | |
| EN 196-1:2016 [44] Compressive strength after 2 days | 2.4 | 6.3 | 5.8 | 18/6 | 0.38 | [45] |
| Compressive strength after 28 days | 1.8 | 9.7 | 9.5 | 0.19 | ||
| EN 826:2013 [46] | [47] | |||||
| Compressive strength | 0.4 | 1.9 | 1.8 | 7/2 | 0.21 | |
| Strain | 4.3 | 13.6 | 13.0 | 6/2 | 0.32 | |
| Compression modulus of elasticity 1 | 1.5 | 62.7 | 62.6 | 7/2 | 0.02 | |
| Compression modulus of elasticity (after eliminating the lowest and the highest score) 2 | 1.7 | 38.8 | 38.7 | 5/2 | 0.04 | |
| EN 12004-2:2017 [48] Initial adhesion strength, | No data | 25.7 | No data | 31/1 | [49] | |
| Tensile adhesion strength after water immersion | No data | 59.6 | No data | 32/1 | ||
| EN 12004-2:2017 [48] Initial adhesion strength | 10.5 | 22.1 | 19.5 | 3/10 | 0.48 | [50] |
| EN 1015-12:2016 [51] Determination of adhesive strength of hardened rendering and plastering mortars on substrates | 13.3 | 20.5 | 15.6 | 3/5 | 0.65 | [52] |
| EN 13823:2020 [53], Reaction to fire tests | [54] | |||||
| SMOGRA | 13.3 | 26.5 | 23.0 | 14/3 | 0.50 | |
| TSP 600 | 9.7 | 24.6 | 22.6 | 13/3 | 0.39 | |
| FIGRA02 | 14.8 | 27.0 | 22.6 | 13/3 | 0.55 | |
| THR600 | 10.8 | 35.5 | 33.8 | 14/3 | 0.30 |
1,2 There were huge differences between the laboratories and anomalies in the data set, such as outliers. Therefore, the organiser of the ILC presented only the test results in the report, without evaluation and without estimated precision. Values of sr and sR have been estimated by the author of the article for illustrative purposes. In 1, it applies to all of the results. In 2, due to the very large dispersion of the results and the impossibility of using the Grubbs test, the author rejected the max and min result.
Considering that the expanded uncertainty for the coverage probability p ≈ 95% will probably be twice as high as sR, very high uncertainties are obtained, exceeding 100% of the measured value in two cases shown in the table. This can inspire reflection on whether test methods rendering so dispersed results are fit for evaluating compliance with the criteria. Simultaneously, a dilemma occurs regarding whether high uncertainties should be quoted, or perhaps laboratories should still quote uncertainties estimated as described in Section 3.2.1.
4. Validation of Test Methods
The ILC emphasised significant problems with test methods. Reproducibility standard deviation reveals most of the possible variabilities within limits imposed by the given test method. Under the ILC, laboratories do their best to have their results positively evaluated, and so they strictly follow the recommendations of the standard describing the method. Repeatability standard deviations are small compared to interlaboratory dispersions, and it is a testimony to the imperfections of the test methods.
Methods shall be improved to reduce the differences between the laboratory results. The two possible ways to improve the existing methods include:
- Specifying the details of recommendations on the test procedure so that they are explicit and interpreted in the same way by all laboratories;
- Narrowing the tolerance limits of the driving forces affecting the results.
It is common knowledge (also mentioned in the ISO 17025 requirements) that every test method should be validated before its introduction into practice. This means confirming the method’s validity for the intended use. If too significant dispersion of results is revealed in the validation experiment, it may turn out that the method is inadequate and should not be used for product assessment. For instance, it does not fulfil the condition described in Equation (3).
Many standards, including but not limited to EN 826 and EN 196-1, contain validation data on the method’s accuracy, which means information about repeatability standard deviation and reproducibility standard deviation. The data are not always complete because, as shown in Table 1, the variability of the results can also depend on the tested material or product. Some standards, e.g., [55], take it into account. However, they are rare cases in the current pool of standardised test methods used to assess construction product characteristics.
It is a common conviction that standardised methods are validated. Nonetheless, the validation experiments were very limited or not executed in many cases. This is suggested by inadequately high sR values discovered during ILC and a lack of information about the method’s accuracy in the standards.
5. Discussion
The problems with test methods and assessment of construction products, presented in general in the paper, can be analysed in more detail for each test method and the related assessment criteria. This article aims to indicate that the assessment of construction products, in many cases, may take place in the conditions of uncertain or unknown uncertainty of the results and consequently unknown assessment risk.
A laboratory is obliged to indicate measurement uncertainty, which can be limited to quoting the uncertainty of each measurand occurring throughout the test. Such uncertainties are estimated based on calibration certificates and intra-laboratory dispersion of measurement results. Therefore, when estimating the uncertainty of results in tests on the product exposure at temperature T and in time t, the uncertainty can be quoted as data referring only to the following measurands: temperature T = X1 ± U1 °C, and time t = X2 ± U2 min. For instance, if a weight change is a measure of resistance to exposure, information can be added that weight was measured with the uncertainty U3 The uncertainties do not refer to the test’s final result, which is a weight change following the exposure to temperature T in time t.
Although a weight change can be described with a model equation containing single weight measurements, the temperature and time can be hardly included. A laboratory fulfilling its obligation to indicate the uncertainty of measurements performed as part of the tests cannot quote the test result uncertainty. It is also impossible to indicate the test result uncertainty for a qualitative result (expressed in the nominal scale).
On the other hand, the laboratory shall consider the (measurement) uncertainty when assessing compliance with the requirements. In light of the discussed issues, except for the cases when uncertainty cannot be estimated, one can ask which uncertainty should be taken into consideration. If only the measurement uncertainty is considered, the assessment risk estimated based on it obviously will not be reliable. If expanded test uncertainty is accounted for, covering all components affecting the variability of the results, reasonable estimation of such uncertainty is practically impossible because a laboratory does not have exhaustive information (Figure 4). When a laboratory does not collect samples or develop test methods, estimating the “total” uncertainty is not required.
In many tests, e.g., resistance to fire, windows’ air permeability or resistance to wind load, and treatment efficiency for site-assembled domestic wastewater treatment plants, the “total” uncertainty is affected by several factors related to the mounting method of the samples, testing equipment installation and activation, many measurements performed during the test and operators’ subjective assessment, et al. These components are not related to the test result by any model equation. Interlaboratory tests are organised rarely, for a small number of laboratories, or not executed at all. That is why there is no information about the possible variability of results. Estimating the uncertainty referring to the test results is practically impossible in such cases.
The standards pertaining to some test methods, e.g., in the area of resistance to fire, openly declare no possibility of estimating the uncertainty of results at the current knowledge level. The decisions about compliance are then taken with no knowledge of the uncertainty and risk, based on simple acceptance. The advantage of such a situation is that all stakeholders involved in compliance assessment proceed in the same way.
In other cases, the knowledge of the method’s precision and uncertainty, even if available, is not used for uncertainty assessment. It results from high values of reproducibility standard deviation and a lack of uniform rules of uncertainty estimation. In some domains, the rules are described in standards. For instance, after many years of using standards which describe sound insulation testing methods, a standard was developed describing uncertainty assessment for test results, estimating the uncertainty based on interlaboratory tests and describing the application of uncertainties [56] in building acoustic. Still, for most test methods, no such information is available.
In such cases, applying the guarded acceptance or guarded rejection rule when making a decision about compliance is unreasonable if the guard band width w is to be based on uncertainty (Section 2.1, Equations (1) and (2)). The only alternative would be to impose the w value, but it would have to be based on reasonable premises, and it will not be a sensible solution when the possible variability of the results is unknown. Therefore, the simple acceptance rule has to be followed.
The relationship between misassessment risk and uncertainty, assuming a normal distribution, is based on the following parameter (for the lower tolerance limit TL):
where: y—test result, u—standard uncertainty, assigned to the result.
The probability that the result fulfils the requirements: pc = Φ(z). Table 3 shows the examples of the probability of misassessing for different relations between (y − TL) and u. The pc = Φ(z) values were indicated, assuming a normal distribution.
It is evident that the probability of misassessment at the same difference (y − TL) depends on u value, which-as shown-is non-reliable or impossible to estimate.
6. Conclusions
The results of construction product tests are of method-defined measurand nature in most cases. Depending on the level of uncertainty knowledge, they can be divided as follows:
- Methods for which the result-assigned uncertainty cannot be estimated at the current knowledge status;
- Methods for which laboratories estimate the uncertainty, but it is typically much lower than the dispersion of results obtained in ILC. It indicates the existence of dark uncertainty, which is not taken into account when estimating the uncertainty. The uncertainty component is closely related to the test method and should be determined by the authors of the test methods as part of the validation;
- Methods for which uncertainty or their estimation method are given in the standards;
- Measurement methods for which the uncertainty estimated by the laboratory is reliable.
The knowledge of the “total” uncertainty is critical for a reliable assessment of the performance of construction products. It applies to manufacturers, testing laboratories and surveillance authorities. Testing methods of high uncertainty should not be used to assess the products’ performance. The currently applicable standards describing some testing methods do not contain information about uncertainty or its recommended estimation method. Using non-uniform methods of uncertainty estimation under the given test method and having no knowledge about the method’s uncertainty, laboratories quote uncertainty according to their best knowledge. Despite the above, the uncertainty values are not reliable, as revealed, e.g., by ILC.
The resulting confusion applies to manufacturers, laboratories and surveillance authorities.
The test methods based on which construction products are launched should be revised and improved. If not accurate enough (too high uncertainty), they should be adjusted or withdrawn. The uncertainty estimation method or uncertainty values should be quoted in the standard to avoid discrepancies between laboratories.
Funding
This research was funded by the Ministry of Education and Science as part of the project LN-002/2022.
Institutional Review Board Statement
Not applicable.
Informed Consent Statement
Not applicable.
Data Availability Statement
Acknowledgments
Special thanks to Jacek Ratajczyk for practical information on how some evaluation processes work.
Conflicts of Interest
The author declares no conflict of interest.
References
- Deng, Y.; Dewil, R.; Appels, L.; Zhang, H.; Li, S.; Baeyens, J. The Need to Accurately Define and Measure the Properties of Particles. Standards 2021, 1, 19–38. [Google Scholar] [CrossRef]
- Bleszynski, M.; Clark, E.; Bleszynski, M.; Clark, E. Current Ice Adhesion Testing Methods and the Need for a Standard: A Concise Review. Standards 2021, 1, 117–133. [Google Scholar] [CrossRef]
- Sant’Anna, A.P. Standards for the Weighting of Criteria and the Measurement of Interaction. Standards 2021, 1, 105–116. [Google Scholar] [CrossRef]
- Regulation (EU). No. 305/2011 of the European Parliament and of the Council. Available online: https://eur-lex.europa.eu/https://eur-lex.europa.eu/legal-content/EN/ALL/?uri=CELEX:32011R0305 (accessed on 23 June 2022).
- Szewczak, E.; Winkler-Skalna, A.; Czarnecki, L. Sustainable Test Methods for Construction Materials and Elements. Materials 2020, 13, 606. [Google Scholar] [CrossRef] [Green Version]
- Stancu, C.; Michalak, J. Interlaboratory Comparison as a Source of Information for the Product Evaluation Process. Case Study of Ceramic Tiles Adhesives. Materials 2022, 15, 253. [Google Scholar] [CrossRef] [PubMed]
- Michalak, J. Standards and Assessment of Construction Products: Case Study of Ceramic Tile Adhesives. Standards 2022, 2, 184–193. [Google Scholar] [CrossRef]
- Sudoł, E.; Szewczak, E.; Małek, M. Comparative Analysis of Slip Resistance Test Methods for Granite Floors. Materials 2021, 14, 1108. [Google Scholar] [CrossRef]
- Walker, W.E.; Harremoës, P.; Rotmans, J.; van der Sluijs, J.P.; van Asselt, M.B.A.; Janssen, P.; Krayer von Krauss, M.P. Defining Uncertainty: A Conceptual Basis for Uncertainty Management in Model-Based Decision Support. Integr. Assess. 2003, 4, 5–17. [Google Scholar] [CrossRef] [Green Version]
- ISO/IEC 17025:2017; General Requirements for the Competence of Testing and Calibration Laboratories. International Organization for Standardization (ISO): Geneva, Switzerland, 2017.
- JCGM 100:2008 Evaluation of Measurement Data—Guide to the Expression of Uncertainty in Measurement; Joint Committee for Guides in Metrology (JCGM). 2008. Available online: https://www.bipm.org/en/committees/jc/jcgm/publications (accessed on 23 May 2022).
- JCGM 106:2012 Evaluation of Measurement Data—The Role of Measurement Uncertainty in Conformity Assessment. Joint Committee for Guides in Metrology (JCGM). 2012. Available online: https://www.bipm.org/en/committees/jc/jcgm/publications (accessed on 23 May 2022).
- ILAC-G8:09/2019, Guidelines on Decision Rules and Statements of Conformity. 2019. Available online: https://ilac.org/publications-and-resources/ilac-guidance-series/ (accessed on 13 April 2022).
- Desimoni, E.; Brunetti, B. Uncertainty of Measurement and Conformity Assessment: A Review. Anal. Bioanal. Chem. 2011, 400, 1729–1741. [Google Scholar] [CrossRef]
- Giles, M.B.; Goda, T. Decision-Making under Uncertainty: Using MLMC for Efficient Estimation of EVPPI. Stat. Comput. 2019, 29, 739–751. [Google Scholar] [CrossRef] [Green Version]
- Pendrill, L.R. Using Measurement Uncertainty in Decision-Making and Conformity Assessment. Metrologia 2014, 51, S206–S218. [Google Scholar] [CrossRef] [Green Version]
- Forbes, A.B. Measurement Uncertainty and Optimized Conformance Assessment. Measurement 2006, 39, 808–814. [Google Scholar] [CrossRef]
- Bergmans, B.; Idczak, F.; Maetz, P.; Nicolas, J.; Petitjean, S. Setting up a Decision Rule from Estimated Uncertainty: Emission Limit Value for PCDD and PCDF Incineration Plants in Wallonia, Belgium. Accredit. Qual. Assur. 2008, 13, 639–644. [Google Scholar] [CrossRef]
- Schabowicz, K. Testing of Materials and Elements in Civil Engineering. Materials 2021, 14, 3412. [Google Scholar] [CrossRef] [PubMed]
- Kulesza, M.; Łukasik, M.; Michałowski, B.; Michalak, J. Risk Related to the Assessment and Verification of the Constancy of Performance of Construction Products. Analysis of the Results of the Tests of Cementitious Adhesives for Ceramic Tiles Commissioned by Polish Construction Supervision Authorities in 2016. Cem. Wapno Bet. 2020, 6, 444–456. [Google Scholar] [CrossRef]
- Hinrichs, W. The Impact of Measurement Uncertainty on the Producer’s and User’s Risks, on Classification and Conformity Assessment: An Example Based on Tests on Some Construction Products. Accredit. Qual. Assur. 2010, 15, 289–296. [Google Scholar] [CrossRef]
- Thompson, M.; Ellison, S.L.R. Dark Uncertainty. Accredit. Qual. Assur. 2011, 16, 483–487. [Google Scholar] [CrossRef]
- JCGM 101:2008 Evaluation of Measurement Data—Supplement 1 to the “Guide to the Expression of Uncertainty in Measurement”—Propagation of Distributions Using a Monte Carlo Method; Joint Committee for Guides in Metrology (JCGM). 2008. Available online: https://www.bipm.org/en/committees/jc/jcgm/publications (accessed on 23 May 2022).
- ILAC-G17:01/2021 Guidelines for Measurement Uncertainty in Testing. 2021. Available online: https://ilac.org/publications-and-resources/ilac-guidance-series/ (accessed on 13 April 2022).
- EA-4/16 G: 2003 EA Guidelines on the Expression of Uncertainty in Quantitative Testing. Available online: https://european-accreditation.org/wp-content/uploads/2018/10/ea-4-16-g-rev00-december-2003-rev.pdf (accessed on 23 June 2022).
- JCGM 200:2012, VIM 3 International Vocabulary of Metrology–Basic and General Concepts and Associated Terms (VIM), Third Ed., 2008 Version with Minor Corrections. Joint Committee for Guides in Metrology (JCGM). 2012. Available online: https://www.bipm.org/en/committees/jc/jcgm/publications (accessed on 23 May 2022).
- Andres, H. Report from the CCQM Task Group on Method-Defined Measurands. 2019. Available online: https://www.bipm.org/en/search?p_p_id=search_portlet&p_p_lifecycle=1&p_p_state=normal&p_p_mode=view&_search_portlet_javax.portlet.action=search&_search_portlet_source=BIPM (accessed on 28 May 2022).
- Simonet, B.M.; Lendl, B.; Valcárcel, M. Method-Defined Parameters: Measurands Sometimes Forgotten. TrAC Trends Anal. Chem. 2006, 25, 520–527. [Google Scholar] [CrossRef]
- Brown, R.J.C.; Andres, H. How Should Metrology Bodies Treat Method-Defined Measurands? Accredit. Qual. Assur. 2020, 25, 161–166. [Google Scholar] [CrossRef]
- ISO 17034:2016; General Requirements for the Competence of Reference Material Producers. International Organization for Standardization (ISO): Geneva, Switzerland, 2016.
- ISO/IEC Guide 98-6:2021; Uncertainty of Measurement-Part 6: Developing and Using Measurement Models. International Organization for Standardization (ISO): Geneva, Switzerland, 2021.
- Gy, P.M. Introduction to the Theory of Sampling I. Heterogeneity of a Population of Uncorrelated Units. TrAC Trends Anal. Chem. 1995, 14, 67–76. [Google Scholar] [CrossRef]
- Ramsey, M.H.; Ellison, S.L.R. (Eds.) Measurement Uncertainty Arising from Sampling: A Guide to Methods and Approaches. Eurachem (2007)Eurachem/EUROLAB/CITAC/Nordtest/AMC. 2007. Available online: https://www.eurachem.org/images/stories/Guides/pdf/UfS_2007.pdf (accessed on 14 March 2022).
- Heydorn, K.; Esbensen, K. Sampling and Metrology. Accredit. Qual. Assur. 2004, 9, 391–396. [Google Scholar] [CrossRef]
- EN 14351-1:2006+A2:2016; Windows and Doors–Product Standard, Performance Characteristics–Part 1: Windows and External Pedestrian Doorsets. The European Committee for Standardization: Brussels, Belgium, 2016.
- Szewczak, E.; Piekarczuk, A. Performance Evaluation of the Construction Products as a Research Challenge. Small Error—Big Difference in Assessment? Bull. Polish Acad. Sci. Tech. Sci. 2016, 64, 675–686. [Google Scholar] [CrossRef] [Green Version]
- EN 12667:2001; Thermal Performance of Building Materials and Products—Determination of Thermal Resistance by Means of Guarded Hot Plate and Heat Flow Meter Methods—Products of High and Medium Thermal Resistance. The European Committee for Standardization: Brussels, Belgium, 2001.
- ISO 8339:2005; Building Construction—Sealants—Determination of Tensile Properties (Extension to Break). International Organization for Standardization (ISO): Geneva, Switzerland, 2017.
- ISO 16535:2019; Thermal insulating products for building applications—Determination of long-term water absorption by immersion. International Organization for Standardization (ISO): Geneva, Switzerland, 2019.
- ISO 5725-2:1994; Accuracy (Trueness and Precision) of Measurement Methods and Results—Part 2: Basic Method for the Determination of Repeatability and Reproducibility of a Standard Measurement Method. International Organization for Standardization (ISO): Geneva, Switzerland, 1994.
- ISO 5725-6:1994; Accuracy (Trueness and Precision) of Measurement Methods and Results—Part 6: Use in Practice of Accuracy Values. International Organization for Standardization (ISO): Geneva, Switzerland, 1994.
- ISO 12567-2:2005; Thermal Performance of Windows and Doors—Determination of Thermal Transmittance by Hot Box Method–Part 2: Roof Windows and Other Projecting Windows. International Organization for Standardization (ISO): Geneva, Switzerland, 2015.
- Interlaboratory Comparison Report No. 21-001167, Thermal Transmittance of Roof Windows Um according to ISO 12567-2:2005; ift gemeinnützige Forschungs- und Entwicklungsgesellschaft mbH: Rosenheim, Germany, 2021.
- EN 196-1:2016; Methods of Testing Cement—Part 1: Determination of Strength. The European Committee for Standardization: Brussels, Belgium, 2016.
- REPORT on the Results of the Programme PIO CEM/Fm No 02/18; Institute for Testing Materials: Belgrade, Romania, 2018.
- EN 826:2013; Thermal Insulating Products for Building Applications–Determination of Compression Behaviour. The European Committee for Standardization: Brussels, Belgium, 2013.
- DRRR-Proficiency Testing RVEP 210919 Compression Behavior EN 826; Deutsches Referenzbüro für Ringversuche und Referenzmaterialien GmbH: Kempten, Germany, 2021.
- EN 12004-2:2017; Adhesives for Ceramic Tiles—Part 2: Test Methods. The European Committee for Standardization: Brussels, Belgium, 2017.
- General Report 2017–2018, Interlaboratory Test on Adhesives for Ceramic Tiles, 9th ed.; Ceprocim S.A.: Bucharest, Romania, 2018.
- ILC Report No 114/2019 Initial Adhesion Strength, EN 12004-2:2017; Instytut Techniki Budowlanej: Warsaw, Poland, 2019.
- EN 1015-12:2016; Methods of Test for Mortar for Masonry—Part 12: Determination of Adhesive Strength of Hardened Rendering and Plastering Mortars on Substrates. The European Committee for Standardization: Brussels, Belgium, 2016.
- ILC Report No 68/2018 Adhesive Strength PN-EN 1015-12; Instytut Techniki Budowlanej: Warsaw, Poland, 2018.
- EN 13823:2020+A1:2022; Reaction to Fire Tests for Building Products–Building Products Excluding Floorings Exposed to the Thermal Attack by a Single Burning Item. The European Committee for Standardization: Brussels, Belgium, 2022.
- Report Round Robin Test DIN EN 13823-SBI-2021; Armacell GmbH: Münster, Germany, 2021.
- ISO 188:2011; Rubber, Vulcanised or Thermoplastic—Accelerated Ageing and Heat Resistance Tests. International Standarization Organization: Geneva, Switzerland, 2011.
- ISO 12999-1:2014; Acoustics—Determination and Application of Measurement Uncertainties in Building Acoustics—Part 1: Sound Insulation. International Organization for Standardization (ISO): Geneva, Switzerland, 2014.
Figure 1.
The base of the construction product assessment system, i.e., standardised test methods, can sometimes seem unstable.
Figure 1.
The base of the construction product assessment system, i.e., standardised test methods, can sometimes seem unstable.

Figure 2.
Diagram showing the difference between simple acceptance, guarded acceptance and guarded rejection. The symbols are explained in the text. (a) Simple acceptance rule diagram. Y1 is considered compliant with the Y ≥ TL criterion. p1—the probability that the test result does not comply with the requirement. p2—the probability that the test result is compliant (b) Guarded acceptance diagram. A new criterion for guarded acceptance: Y ≥ AL. When this rule is applied, Y1 is considered non-compliant. (c) Guarded rejection diagram. The criterion for guarded acceptance: Y ≥ AL.


Figure 3.
Illustrative diagram showing a non-representative sample’s impact on the population assessment. Y1—non-representative sample’s test result, U—uncertainty estimated by the laboratory. Y1 > TL and Y1 − U > TL means the product will be classified as compliant regardless of whether the simple or guarded acceptance rule is applied. Y2—actual result applying to the whole population. Most of the population does not comply with the requirement.

Figure 4.
Illustrative drawing showing dispersed knowledge about the test result uncertainty. Ulab—uncertainty estimated based on laboratory knowledge, including knowledge of repeatability standard deviation. Usampling—sampling uncertainty can be estimated based on the manufacturer’s knowledge. Umethod—test method uncertainty (dark uncertainty), which can be estimated based on a validation experiment preceding the test method implementation.

Table 1.
Table summarising standard deviations obtained in the current results of tests performed with different methods in the same laboratory. Each value-sr and RSD-was obtained for different construction product test results.
Table 1.
Table summarising standard deviations obtained in the current results of tests performed with different methods in the same laboratory. Each value-sr and RSD-was obtained for different construction product test results.
| Test | Material/Product j | sr, Repeatability Standard Deviation 1 | RSD, Relative Standard Deviation% |
|---|---|---|---|
| Thermal conductivity of insulation materials λ, W/m⋅K, EN 12667:2001 [37] | 1 | 0.0035 | 10.1 |
| 2 | 0.0006 | 1.4 | |
| 3 | 0.0026 | 8.2 | |
| 4 | 0.0024 | 7.2 | |
| 5 | 0.0035 | 9.8 | |
| Tensile properties of the sealants–secant modulus at the 60% elongation N/mm2 ISO 8339: 2005 [38] | 6 | 0.283 | 18.6 |
| 7 | 0.009 | 2.3 | |
| 8 | 0.202 | 11.5 | |
| 9 | 0.009 | 10.5 | |
| 10 | 0.026 | 6.4 | |
| Long-term water absorption through immersion % ISO 16535:2019 [39] | 11 | 0.06 | 9.12 |
| 12 | 0.06 | 3.46 | |
| 13 | 0.10 | 7.69 | |
| 14 | 0.36 | 18.03 |
1 Units given in the “test” column.
Table 3.
Probability values of misassessment, depending on the relationship between (y − TL) and u.
| (y − TL)/u | pf—Probability of Wrong Decision |
|---|---|
| 3 | 0.001 |
| 2 | 0.023 |
| 1 | 0.159 |
| 0.5 | 0.309 |
| 0.2 | 0.579 |
Publisher’s Note: MDPI stays neutral with regard to jurisdictional claims in published maps and institutional affiliations. |
© 2022 by the author. Licensee MDPI, Basel, Switzerland. This article is an open access article distributed under the terms and conditions of the Creative Commons Attribution (CC BY) license (https://creativecommons.org/licenses/by/4.0/).
Share and Cite
MDPI and ACS Style
Szewczak, E. Does Standardisation Ensure a Reliable Assessment of the Performance of Construction Products? Standards 2022, 2, 260-275. https://doi.org/10.3390/standards2030019
AMA Style
Szewczak E. Does Standardisation Ensure a Reliable Assessment of the Performance of Construction Products? Standards. 2022; 2(3):260-275. https://doi.org/10.3390/standards2030019
Chicago/Turabian StyleSzewczak, Ewa. 2022. "Does Standardisation Ensure a Reliable Assessment of the Performance of Construction Products?" Standards 2, no. 3: 260-275. https://doi.org/10.3390/standards2030019