
The Sedimentary Context of Open-Air Archaeology: A Case Study in the Western Cape’s Doring River Valley, South Africa


1
School of Earth, Atmospheric and Life Sciences, University of Wollongong, Wollongong, NSW 2522, Australia
2
Department of Archaeology, University of Cape Town, Beattie Building, 3rd Floor, University Avenue, Upper Campus, Rondebosch 7701, South Africa
3
Archaeology, College of Humanities, Arts and Social Sciences, Flinders University, Adelaide, SA 5001, Australia
*
Author to whom correspondence should be addressed.
Soil Syst. 2023, 7(1), 25; https://doi.org/10.3390/soilsystems7010025
Submission received: 30 December 2022
/
Revised: 9 February 2023
/
Accepted: 6 March 2023
/
Published: 10 March 2023
(This article belongs to the Special Issue Soils in Archaeological Research)
Abstract
:Despite the wealth of Late Pleistocene archaeology that exists across southern Africa’s open landscape, it is routinely neglected in favour of rock shelter (re)excavation, biasing interpretation of human–environment interaction. This is compounded by the scarcity of open-air studies that use geoarchaeological methods to investigate the history and processes involved in their formation. The open-air archaeology of the Doring River Valley is an example of this, despite nearly a decade of dedicated study and publication. Consequently, there remains a limited and untested understanding of the valley’s formation history. This paper rectifies this by providing a sedimentary context for the surface archaeology exposed across one of the Doring River Valley’s artefact-baring localities, Uitspankraal 7 (UPK7). Characterisation, particle size, mineralogical, morphometric, and geophysical analysis of UPK7′s sand mantle resulted in the identification of four artefact-bearing sedimentary units, the aeolian and pedogenic processes involved in their formation, and their proposed order of deposition. This provides a stratigraphic, taphonomic, and environmental context against which chronometric dating and an analysis of the taphonomic, spatio-temporal, and technological composition of UPK7′s surface archaeology can be compared. This work is the first vital step towards understanding the depositional and behavioural history of a landscape, irrespective of context type.
1. Introduction
The wealth of Late Pleistocene archaeological evidence that exists across southern Africa’s open landscape is routinely neglected in favour of rock shelter (re)excavation. This omission ignores over half a century of interdisciplinary development in chronometric dating, palaeoecological and geospatial methods, and growing interest in landscape archaeology and regional scale reconstructions of human–environment interaction that make investigation of open sites valid and urgently needed. Consequently, an over-reliance on rock shelter contexts introduces geographic, environmental, behavioural, and chronological biases for our interpretation of Late Pleistocene human behavioural change and our knowledge of human–environment interaction at the regional and inter-regional scale. Rock shelters are prioritised for their potential to yield datable, well-preserved organic material, and finely stratified deposits. However, they are confined to specific geological and topographic conditions. This geographically limits regional models to specific locations across southern Africa (i.e., the coastal and montane zones) with the exclusion of large parts of the subcontinent’s interior [1,2]. Moreover, no one rock shelter provides a continuous and easily matched chrono-stratigraphy for inter-site comparison or inter-regional reconstruction.
The minor role that open-air archaeology continues to play in studies of Late Pleistocene human behavioural evolution results from the perceived (lack of) integrity of open-air archaeology, which is often found in a state of exposure rather than burial. This is compounded by a legacy of methodological developments in rock shelter excavation and the view that rock shelters can produce a higher yield of information for the resources invested in data recovery [3]. Despite their rarity, open-air buried sites are also prioritised for the stratigraphic control they afford [4]. In contrast, surface archaeology is viewed as (a) temporally compromised due to the ongoing addition and loss of archaeological material and/or (b) spatially compromised due to repeated cultural and natural transformations in object distribution. This perception often leads open-air archaeology to be considered ‘palimpsestic’ (i.e., [5]), despite the reality that all assemblages, irrespective of their context (buried, surface, open, closed), are time-averaged aggregates of accumulated activity conditioned by their geomorphic histories [6]. Furthermore, almost all inferences about behavioural systems are necessarily made from palimpsests [7,8]; understanding site formation and taphonomy is a requisite for all archaeological aggregates, not only those from open-air sites.
The prevailing, heavy reliance on cave/rock shelter evidence is apparent in the proportion of dated context types that contribute to regional and inter-regional chrono-stratigraphic syntheses in southern Africa [9], an issue not unique to the subcontinent nor Late Pleistocene research generally (e.g., [10]). For example, cave/rock shelters contribute to more than half the dated sites included in the South African and Lesotho Stone Age (SALSA) sequence for all Stone Age periods ([11]: pp. 128–140, Appendix A) (Figure 1), with the MSA displaying the greatest bias between rock shelter and open-air contexts—only four open-air localities were listed for this period.
One of the main reasons for this bias is the difficulty in associating open-air artefacts with chronometric ages in surface contexts, which is compounded by the limited number of studies committed to investigating this association. Moreover, dependence on rock shelters for typo-technological and chronological control constrains the way open-air archaeology is viewed and studied. For example, if artefacts found in open-air settings are similar to those from rock shelters, then they can be incorporated into the culture historic system. However, if open-air assemblages fail to resemble those from rock shelters—even if they are part of a single system of technological organization—then it becomes difficult to incorporate them into the current behavioural narrative [12,13,14]. Consequently, open-air archaeology will either conform to rock shelter assemblages and their behavioural narratives or be underrepresented in inter-regional and continental histories [4,12,15,16,17]. Thus, for those who endeavour to study southern Africa’s Late Pleistocene open-air archaeology, temporal control and the issue of preservation remain central challenges.
Despite these issues, studies that have investigated southern Africa’s abundant open-air archaeology have demonstrated the potential of the open system to enhance narratives built from Late Pleistocene and early Holocene rock shelter evidence [5,17,18]. Surprisingly few of these studies, however (i.e., [17,19,20,21,22]), have used geoarchaeological methods to investigate the depositional history of a landscape and the spatio-temporal organisation of its open-air archaeology. In contrast, the process of implementing geoarchaeological methods in southern Africa’s rock shelters has enriched MSA research and played a fundamental role in developing our current knowledge of human behavioural evolution (e.g., [23,24,25,26,27]). This demonstrates the importance of formation to contextualise artefacts in time and space [28].
The objective of this paper is to provide a sedimentary context for the surface archaeology exposed across the landform of Uitspankraal 7 (UPK7), one of at least 16 artefact-bearing ‘sediment stacks’ located in the Doring River Valley of South Africa. The Doring River and its surrounding tributaries preserve a wealth of archaeology found in both rock shelters and open-air contexts. The latter manifests as semi-continuous distributions of archaeological material on the slopes and ridge crests, and more discontinuous distributions along the valley floor [3,13,29,30,31]. Despite being the subject of more than a decade of study, the open-air archaeology of the Doring River Valley is yet to undergo detailed geoarchaeological analysis, resulting in a limited and untested understanding of the study area’s formation history. By investigating the sedimentary system involved in the formation of UPK7, this paper aims to identify the main sedimentary units (i.e., their composition, relationship, and order of deposition) and processes involved in their formation. This will provide a sedimentary context for the chronometric analysis of UPK7′s depositional history and the spatio-temporal, technological, and taphonomic composition of the locality’s surface archaeology. It will also provide a point of comparison for future geoarchaeological investigations.
2. Background
The Doring River valley is a semi-arid landscape that runs along the western fringe of South Africa’s Western Cape, in the rain shadow of the Cederberg Mountains (Figure 2). The Western Cape region is one of the most thoroughly studied regions in southern Africa, with a long history of landscape-orientated research for both the Late Pleistocene and Holocene [32,33,34], e.g., [35,36,37,38,39,40,41,42,43,44].
In the last decade, the Doring River catchment has been the subject of intensive open-air and rock shelter investigations both independent of and as part of the Doring River Archaeology Project ([DRAP]; [3,13,15,23,29,31,45,46,47,48,49,50,51,52,53,54,55,56,57,58]). At least 16 sediment stacks yielding concentrations of surface archaeology were identified and recorded by the DRAP within the Doring River Valley [30]. The archaeology of these localities includes material from the Earlier, Middle, and Later Stone Ages (ESA, MSA, and LSA, respectively), Neolithic, and early European colonial phases. Of these, Uitspankraal 7 (UPK7) was selected for this study (Figure 2A,B).
Sediment stacks have been described as large areas of hard bare earth and vegetated sand, with the former exposing rich surface scatters [13,30,45,47,49]. They appear geomorphologically distinct from the surrounding colluviated hillslope and modern terrace sands, which encouraged early valley surveys to target these areas using a combination of field walking and Google Earth exploration. Consequently, there is also a deficit in survey data for the surrounding, less archaeologically visible, landscape.
UPK7 is located within the bounds of Uitspankraal farm, at the south-eastern end of the study area and 0.5 km downriver from the Biedouw–Doring River confluence (Figure 2A). This locality is on the northern side of the Doring River and is only accessible by boat during the winter months (May to August) when the river is in full flood. During the dry summer and early autumn months (November to March), the river dries out exposing a channel bed dominated by alluvium and alternating with sandstone bedrock, riffles, and water holes. UPK7 occurs at the southern toe of a long colluvial hillslope, bounded on its western and eastern sides by two tributaries (Figure 2A). The surface scatters on UPK7 are composed of worked and unworked stone and pottery, with diagnostic forms associated with the ESA, MSA, LSA, and Neolithic, with a greater number of artefacts associated with the MSA [59].
The closest sediment stack to UPK7 is UPK9. UPK9 is located ~250 m east of UPK7′s eastern tributary. UPK9 also yields surface archaeology, associated with the ESA, MSA, and LSA, but is dominated by the LSA [30,31]. Historic artefacts, features, and landscape modifications were also observed across and proximate to this locality (i.e., a saddle badge dated to 1851, glass, ceramics, fencing wire, stone buildings, historic hearths, a dirt road that runs from the river to a northern plateau on its eastern side, trackways, powerlines, and runoff trenches to divert surface water off the road) [30,31]. Unlike UPK9, UPK7 appears devoid of stone structures or other historic modifications (e.g., roads, stone hearths, buildings, and drainage) which suggests it was subjected to less historic activity. Its separation from UPK9 by its eastern tributary (ET) was most likely a contributing factor, although this would not have acted as much of a deterrent to grazing animals and stock.
During an experimental study of surface artefact movement at UPK7, Phillips et al. [49] observed relatively rapid artefact attrition levels, which emphasise how unlikely it is for surface scatters to preserve in this semi-arid landscape. However, the abundant existence of surface archaeology found throughout the Doring River catchment suggests that processes acting as preservers of these remains require further investigation. Moreover, geospatial analysis of UPK7′s surface archaeology reveals that they have a statistically non-random, patterned distribution across the entire locality when assessed as a single population (Figure 3) [59]. A non-random, clustered point pattern was also found when analysed with assemblage component (i.e., material type, artefact type, size, and shape, lithic class and implement type, and between inferred temporal units (i.e., archaeological epoch and Industry)) [59], supporting published inferences of Industry-level clustering [30,45,47].
Without consideration of the sedimentary system, patterned artefact distributions are often taken at face value and interpreted as direct indications of the duration and/or intensity of place use over time [60]. However, this assumes that artefact accumulation occurred without removal and/or was unaffected by post-depositional modification [60]. The following sections provide the first stage of investigation into artefact preservation and spatial patterning within the more complex system of sedimentary, environmental, and behavioural processes, beginning with the analysis of UPK7′s sedimentary system and an assessment of the main processes involved in the locality’s formation.
3. Materials and Methods
One of the main challenges faced during this study was finding a way to identify and characterise the sedimentary units of UPK7 without promoting further erosion. At such an early stage in the DRAP, trenching was not an option as it would promote a level of disturbance to the site that would drastically undermine our future ability to study its archaeology. Auguring was used; however, it proved problematic due to the highly indurated composition of many of the locality’s deposits. Limited resources also prevented us from obtaining mechanised coring equipment to assist with penetrating its substrate. To reduce the risk of wholesale contextual disturbance to this area’s surface archaeology, stratigraphic information was obtained from existing surface exposures lacking artefacts, section cuts into rills and tributary exposures, and a geophysical survey. Thus, the resulting formation models were developed from surface and near-surface observations combined with subsurface geophysical data.
3.1. Sediment Sampling, Characterisation and Survey
A series of sedimentary units were identified, surveyed, sampled, and characterised over six field seasons from 2014–2017 (Table 1). Their characterisation was conducted with reference to a Wentworth scale and the use of a hand lens following the standards outlined in Jahn et al. [61], Coe [62], and Schoeneberger et al. [63]. Sample locations, the spatial extent of a sedimentary unit, and UPK7′s surface topography were surveyed with a total station and checked against aeroplane and drone-derived aerial and orthomosaic imagery, described in detail in the following sections. The mapped location of each sediment sample is viewable in [59] Appendix 4, Figure A4.0.1. Together with their topography, the defining characteristics of a sedimentary unit were used to distinguish between sedimentary and pedogenic processes involved in the formation and/or post-depositional development of each unit.
3.1.1. Sample Collection and In-Field Characterisation
Sediment samples were collected from across UPK7 for in-field characterisation and post-field analysis (i.e., grain size and X-ray diffraction (XRD) analysis). Samples were taken from the subsurface of exposed deposits as part of opportunistic and random sample square surveys, from geological section cuts, and along a transect that ran the length of the locality from the colluvium in the north to the river channel in the south (Figure 2B). The location (x, y, and z) of each sediment sample was recorded with a Nikon C-Series total station (Nikon-Trimble Co., Tokyo, Japan) and allocated a field sample ID that was stored and linked with their associated sedimentary unit and laboratory data in the Geographic Information System (GIS) ArcGIS Pro (ESRI, v10.4).
Assessing surface and subsurface relationships between deposits involved cleaning back exposed surfaces with a trowel and/or geological pick (depending on the degree of sediment consolidation), recording the location of possible unconformities, and describing macro-level differences between sedimentary units. This was made by eye and with the use of a hand lens (10× magnification), classifying the average texture, colour, composition, and consistency of a deposit with reference to a Wentworth scale and Munsell Colour Chart (dry sediments only). Sediments were tested for the presence of carbonate material using HCl (37% strength). Surface roughness and morphology as well as any features of erosion, vegetation, and human or animal modification were also recorded and photographed as these variables can inhibit and/or promote artefact visibility and movement.
To determine the depth and transition between unconsolidated and consolidated deposit horizons, a section was cut into vegetated sandy sediment that had been partly exposed by a rill on the southern slope of UPK7. The exposed section was cleaned back with a spade and trowel by cutting into the eastern face of the rill. When it became too deep to excavate, a sand auger was used, reaching a total depth of 3.7 m. A series of sediment samples were collected and mapped every 300–500 mm below surface level and any transitions and their locations below the surface were recorded.
In areas devoid of surface archaeology, small section cuts (approx. 300 to 350 mm deep) were made across the consolidated sediment, often on the edge of a rill, to provide sediment samples. Sections were excavated with a spade, chisel, and geological pick, and the base and top of the cut as well as the sample location were recorded using a total station. Sediment samples and surface condition were also collected and recorded during a random sample square (rSSQ) survey, which is a survey method developed to provide a randomised data collection record of the attributes, technological characteristics, and quantity of UPK7′s surface archaeology and non-flaked stone, as well as the surface condition, features, and sedimentological and lithological characteristics.
Within each rSSQ, care was taken to extract samples without disturbing overlying archaeology. This involved finding an exposed surface proximate to, yet devoid of, overlying artefacts. The sample surface and square context were photographed, and the surface characteristics were described (i.e., clast size and distribution, presence, or absence of duricrust, vegetation, rills, and biological activity). In addition to photographic reference, any surface features forming the surface of the rSSQ were noted (e.g., vegetation, rills, clast density, and size range). A spade/trowel was used to clean back and cut into the surface sediment before collecting ~100 g of sediment in a Ziplock bag. Each sample bag was allocated a unique ID, and their sample location was recorded with a total station that was used to link the location of the sample with the rSSQ, its sediment and surface description, sediment sample, and archaeological content in a geodatabase.
3.1.2. Particle Size: Granulometric Analysis
In addition to in-field characterisation of UPK7′s sedimentology and lithology, particle size and X-ray Diffraction (XRD) analyses were carried out to understand the sediment source and depositional environment of each sedimentary unit. The sediment samples were subjected to laser particle-size analysis at UOW using a Malvern Mastersizer 2000 (Malvern Panalytical Ltd., Malvern, UK). To disaggregate and prepare samples for laser counting, they were dry sieved, removing organic material, disaggregating any consolidated components, and removing any clast inclusions measuring above 2 mm in diameter. Prior to measuring the sizes, the samples were dispersed in water and subjected to 2 min of ultrasonic treatment to disaggregate the fine fractions. These samples were not pre-treated for calcium carbonate removal, which may affect readings of the clay-sized component of a sample. Results from laser counting were plotted on a grain-sized curve, and representative curves from each deposit were plotted in a single graph to compare size and sorting.
3.1.3. Minerology: X-ray Diffraction (XRD) Analysis
XRD analysis of sediment samples was carried out to determine the mineralogy of each sedimentary unit and to trace the potential source of sediment across the study area. Additional samples were collected from the dried riverbed and tributary deposits that bound both localities to test whether they share a common mineralogical signature to the sandy deposits that drape the locality. Bulk samples were homogenised in a Tema crusher and XRD analysis was conducted at UOW using a Philips X-ray diffractometer and Siroquant software (version 4), applying the Rietveld-based approach [64].
3.1.4. Mapping the Spatial Extent of a Sedimentary Unit
The spatial relationship between deposits and their potential depositional hierarchy was estimated using mapping with a total station of the transition, or ‘juncture’, between two sedimentary units with reference to the sedimentological and lithological characteristics of each (surface texture, particle size and roundness, sorting, consistency, and presence of carbonates). A juncture was determined using a detectable change or discontinuity in the sedimentological/lithological characteristic between two or more geological bodies that were in direct contact. With the additional reference of plane and drone collected aerials as well as orthomosaic imagery, the exposed spatial extent of each sedimentary unit was defined in ArcGIS Pro. Orthomosaic imagery was produced in Agisoft PhotoScan (v1.4; Agisoft 2018) from footage collected with an unmanned aerial vehicle (UAV), as described in Section Section 3.2.
A Real Time Kinematic Differential Global Positioning System (RTK DGPS) was used to record and correct the position of ten ground control points and sixteen semi-permanent survey marks, composed of a single rebar or galvanized nail set into concrete, which were set out across UPK7 and used for a total station survey and UAV data processing. RTK DGPS coordinates were recorded in degrees, minutes, and seconds and projected using the WGS84 UTM 34S coordinate system, with elevations converted using the SA2010 geoid model [65]. The RTK rover datasets were corrected in Trimble Geomatics Office Version 1.63 using a base station which logged its xyz location for more than seven hours [3]. The logged spatial data were post-processed using a Precise Point Positioning service, the Canadian Spatial Reference System Precise Point Positioning (CSRS-PPP) service (Natural Resources Canada 2020).
Sediment samples, together with deposit exposure, extent and topography were also recorded along a north–east to south–west transect to produce a surface profile of UPK7 (Figure 2B: ‘surface profile line’). The spatial extents of each sedimentary unit were reassessed, critiqued, and updated as additional surface surveys and subsurface sampling was carried out and analysed. The final stage of data collection and analysis involved allocating each deposit a ‘stratigraphic unit’ name (i.e., Unconsolidated Sand (UCS)) to denote a hypothesised order of deposition and to give each deposit a descriptive reference code.
3.2. Surface Morphometry
Geomorphic conditions play a critical role in the operation and impact of erosional and depositional processes on locality formation and artefact preservation. Thus, UPK7′s geomorphology is crucial for interlinking the locality’s depositional history with its archaeology. While the topography of a landform changes in response to environmental and anthropogenic processes at multiple scales, these processes also operate in response to the form of the landform itself [66]. Thus, its morphology is “…not only the consequence of past processes but is also a factor that affects the course of present erosion, and hence [its] future morphology…” [67]. A digital terrain model (DTM) was constructed to characterise the main features of UPK7′s hillslope morphology, hydrology, and vegetation cover, proving essential for investigating the relationship between the spatial patterning of surface archaeology and erosional processes such as runoff. Additional detail on UAV and DTM data collection, processing, and analysis can be found in the freely available, online Appendix 3 of [59]. A summary of this is provided below.
3.2.1. Data Collection
A DTM of UPK7 was produced from UAV-imagery collected at an average altitude of ~40 m above ground in 2019 using a DJI Mavic Pro UAV (DJV, Shenzhen, China) equipped with a standard 12-megapixel camera (FC220 model, focal length 4.7 mm) with a resolution of 4000 × 3000, a pixel size of 1.56 µm2, a pitch of between −90° and +30°, and yaw and roll at 0° and 90° horizontally and vertically (www.dji.com/mavic/info; accessed 1 March 2019) [3]. Image capture occurred over a single flight session, totalling 191 images, that was performed during optimal conditions (i.e., minimal cloud cover, high sun angle, and low winds). Prior to the flyover, ten Ground Control Points (GCPs) were set out across UPK7′s survey area. Their locations were visually enhanced using bright yellow crosses. Each GCP was surveyed and corrected using an RTK DGPS, as described above. The accuracy of the georeferenced model was assessed based on the individual GCP and total Root Mean Square Error (RMSE). GCPs that showed RMSEs substantially higher than other GCPs and increased the total RMSE were excluded to increase the accuracy of the georeferenced dataset ([59]; Appendix 3).
Figure 4 presents the orthomosaic output, showing survey extent and lighting conditions. UPK7′s tributaries form the eastern and western bounds of the footage with the main exposure captured in its entirety. The colluvium in the north is truncated, while the south extent of the model stops short of the modern river terrace, capturing an outcropping bolder-rich paleo-terrace.
3.2.2. Terrain Modelling and Classification
A three-stage workflow was used to produce a DTM from the 2019 UAV survey of UPK7: Stage 1. Image processing, Stage 2. Vegetation filtering, and Stage 3. DTM creation (Figure 5). This process draws from the previous efforts and guidance of Dietrich [68], Chambers [69], and Anders et al. [70], as well as the user manual for Agisoft PhotoScan (version 1.4) and the LAStools readme files and community forum (https://groups.google.com/g/lastools, accessed on 1 July 2019).
Stage 1 involved processing UAV imagery using structure from motion (SfM) photogrammetry in Agisoft PhotoScan (v1.4; Agisoft 2018) to produce a georeferenced dense point cloud for digital elevation modelling (see [59] Appendix 3.1). This followed the basic protocol outlined by Dietrich [68] using additional parameter details and process specifications (i.e., equipment specifications and recommended tie point values for dense point cloud processing) [69,70]. Image processing for dense point cloud extraction involved seven steps: photo preparation, geotagging, photo alignment, georeferencing, alignment optimisation, ground control point error-checking, and dense point cloud creation (Figure 5)—the details of which are outlined in Phillips ([59] Appendix 3A).
Stage 2 involved filtering vegetation from the digital surface model (DSM, [59]: Appendix 3.2). The presence, density, and varying heights of vegetation above the land surface can distort terrain heights in a digital terrain model (DTM), decreasing the computational accuracy in runoff and erosion analyses across a land surface. The combination of riparian and succulent Karoo vegetation within the Doring River valley presents a scenario where land surface coverage can vary from tree to shrub to rocky and barren surfaces. To account for this variability and to standardise the processing methods used for modelling the different sediment stacks across the Doring River valley, the TIN densification algorithm was selected for producing a digital surface model of UPK7 (outlined in Phillips [59]: Appendix 3.2).
Prior to producing a bare-earth digital elevation model (DEM) or ‘DTM’, the bare-earth, vegetation, and rilling features were classified, providing a record of the extent and distribution of features that are indicative of the dominant depositional and erosional processes at this locality (i.e., wind and rain). After filtering and interpolating the 2019 dense point cloud in LAStools (version 191018; [71]), the final production of UPK7′s DTM was carried out in Esri’s ArcGIS Pro 2.4.2, along with an assessment of each parameter for inclusion in the final DTM (outlined in Phillips [59]: Appendix 3.2). The final DTM (Figure 4B) and its geomorphological outputs (i.e., slope, hydrology, and erosion potential) are used throughout the results. The surface model was also hydrologically conditioned to produce a depression-less digital elevation model (DEM, Figure 4C)—unrestricted by small internally draining imperfections. This enables assessment of the flow of water across its surface and the potential impact this can have on the location and movement of surface artefacts. Vegetation distribution and height values were also obtained from canopy height data by subtracting the DTM from the DSM using the Raster Calculator in ArcGIS Pro (Figure 4D). The hydrologically corrected 2019 DTM was also used to calculate the slope angle for all consolidated surface exposures (Figure 6).
3.3. Geophysical Survey
A geophysical survey was carried out at UPK7 in 2017 to investigate the relationship between its surface and subsurface deposits, their spatial extent, and morphology. Electrical resistivity tomography (ERT) was used to attain a subsurface reading of the locality’s lithology and bedrock, to determine their morphology, their horizontal and vertical extent (~1 m resolution to ~15 m depth penetration), and their potential influence on the geomorphological arrangement of the locality’s exposed deposits. Two ERT lines were laid out crossing over at a high point on the western side of the survey locality (Figure 2B). Each ERT line was formed from multiple overlapping cable layouts, which were combined during processing into a single line. Data were collected using a ZZ Flash-Res Universal with 64 electrodes and an electrode spacing of 1 m utilising the Wenner, ZZ, and Dipole–Dipole Arrays at 120 V for 1 s. Electrodes were watered using saline water before acquisition, and contact resistance was measured to ensure high data quality. Line 1 was set up along a NE–SW bearing running from survey mark DRPLP16 to DRPLP14/19 (Figure 2B). Line 2 extends from east to west, running perpendicular and cutting through Line 1, along exposure 1 and down to the western tributary (Figure 2B). A static GPS survey of the first and last ERT peg on each layout was undertaken using a CHC X90-Opus GPS with positions recorded for at least one hour, which were post-processed using the AUSPOS service. During resistivity measurement, cable lines were walked, and the context of each peg was recorded by noting the sedimentary unit. Sediment descriptions and surface types recorded during this earlier survey helped to contextualise the position of the resistivity cable with the underlying surface deposits. Photographs of exposed deposit types were taken along each transect.
4. Results
The following section presents the results and analysis of UPK7′s sedimentology and surface condition. This provides a depositional context for the investigation of the surface archaeological assemblage and the relative age, composition, spatial patterning, and condition of the UPK7 sediment stack.
4.1. Geomorphological Features and Unit Characterisation
The main geomorphological features together with the lithological and sedimentological units (Table 1) that contribute to the landform of UPK7 and that were identified during the fieldwork and remote survey are outlined in the following subsections. Table 2 and Table 3 define the dominant characteristics of each identified lithological unit at UPK7, including any incipient soil B-horizons. Matrix colour lists the dominant dry lithochromic colour of a unit’s matrix in the form of Munsell® notations (Table 2). The range in mean particle size, sorting, rounding, and consistency are provided for each unit to characterise their texture class (Table 3). The dominant sedimentary structures are also given for each unit (Table 2). Where possible, the basal and upper contact for each unit is given. In some cases, more than one unit of contact was observed and is listed accordingly (Table 2). The basal and upper contact fields are clear indicators of the disconformities that exist throughout UPK7′s stratigraphic profile, with missing units suggesting differential erosion across the site. The thickness of individual units was estimated from the results of the electrical resistivity survey and/or naturally exposed sections in gullies and tributaries. Thus, the unit thickness should be taken as an estimated, minimum value.
4.2. Hillslope Overview
UPK7 is located on a medium-gradient interfluve on the northern bank of the Doring River, downstream of the Biedouw–Doring River confluence (Figure 2). Its landform of sandy, vegetated sediment rises ~20 m above a channel floor of alluvium and outcropping mudrock and sandstone of the Bokkeveld bedrock (Ceres Subgroup). It gradually increases in elevation from the modern river terrace in the southwest (196 m asl) to a dune crest in the northeast (216 m asl; Figure 7 and Figure 8). Diffusive weathering as a result of sheet wash, mass movement, and slope creep from the plateau’s interbedded rock sequence has produced a rectilinear hillslope of outcropping mudrock and sandstone bedrock, covered with colluvium and shallow-rooting succulent (Tankwa Karoo) vegetation. Cutting into either side of the hillslope are two ephemeral tributaries, the western and eastern tributaries (Figure 7 and Figure 8). These have scoured down through bedrock, introduced coarse, matrix-supported material to the valley floor, and partly exposed a palaeoterrace in the process (Figure 7 and Figure 8). The hillslope is also pocked with heuweltjies (Figure 2a)—large circular sediment mounds, or remnants of mounds, that are visually distinct from the surrounding colluvium [3,73,74,75]. The hillslope is defined by a foundation of bedrock and colluvium in the north and palaeoterrace in the southwest (see Figure 8). The palaeoterrace is covered with a mantle (or ‘stack’) of loose sand and consolidated sediment that yields archaeology [13] (Figure 3). The modern channel features (i.e., riffle boulders, alluvium) and associated terrace—about 5 m above the channel floor—form UPK7′s modern riparian margin (Figure 7 and Figure 8).
Anthropological features—historic or otherwise—were not observed on the sediment stack or on the length of its hillslope. However, an unusual erosional feature that rises above the sediment stack’s consolidated substrate is covered and encircled with medium to large sandstone river cobbles (Figure 9). This topographic anomaly could be indicative of a destabilised structure that capped and protected the underlying substrate while the surrounding sediment deflated. Another possibility is that it is a remnant coppice dune, which could also protect overlying and proximate archaeological material as the surrounding surface deflated, giving the appearance of a concentrated area of activity. There are also circular stone ruins to the immediate east of the eastern tributary (Figure 10). Their presence may indicate that the surrounding area was used and modified for farming and grazing purposes. However, their function, age, and frequency of use remains open to debate [76].
4.3. Bedrock
The Ceres Subgroup (Bokkeveld Group [485–330 Ma], Cape Supergroup) forms the dominant lithostratigraphy in the study area and is observed beneath UPK7′s sand mantle and paleochannel deposits (Table 1, Table 2 and Table 3). The Ceres Subgroup is made up of three sandstone and three shale units. Sandstone forms the northern cliff of the river channel northwest of UPK7 and outcrops in the bed of the western tributary and again in the upper eastern fringe of UPK7′s colluvial hillslope. From this point, it disappears beneath dune sand before reappearing at the base of the eastern tributary (Figure 7; Table 1, Table 2 and Table 3). Accordingly, UPK7′s exposed bedrock comprises well-sorted quartz sandstone that alternates in structure from massive to thinly bedded and ranges in colour from reddish to light grey (Table 2).
4.4. Tributaries
The bounding tributaries on the eastern and western sides of UPK7 are episodically active. The steep angle of descent and the highly compacted state of sandstone cobbles and bedrock slabs observed in each tributary indicate intermittent, high-energy flows (Figure 11). Leeside dune sand was observed avalanching down into each channel from the west. However, the exposed bedrock observed at the base of both tributaries indicates active removal of these sands during rainfall events.
Compared to the eastern tributary, the western tributary cuts a steeper, more direct passage from the top of the northern plateau to the river below. It is shorter (~0.7 km) than the eastern tributary (~3.8 km), with outcropping bedrock exposed midway down the hillslope, creating a resistant surface before arcing west towards its outlet, away from the main sediment stack of UPK7 (Figure 11A). Fed by seven minor channels, the eastern tributary has a larger catchment than the western tributary and takes a meandering route from the top of the plateau to its outlet in the Doring River channel (Figure 2A). Together with debris flows from the hillslope, the load of these tributaries has contributed sediment and colluvium to UPK7, while also assisting in down-cutting bedrock as they joined the Doring River channel. This is suggested by the presence of alluvium, river cobble, and cobble-sized slabs of bedrock exposed in several places along the eastern and western sides of both tributaries (i.e., Figure 11), which indicated the presence of a palaeoterrace and a possible alluvial fan that underlies the sediment stack of UPK7.
4.5. Palaeoterrace
A bench of coarse water-worn sandstone gravels crop out from beneath the sand mantle in the northwest, forming the eastern bank and outlet of UPK7′s western tributary (Figure 11A,B). It was also observed cropping out from the western side of the eastern tributary, below the sand mantle and above bedrock (Table 1). Its profile in Figure 11B (inset) grades from clast- to matrix-supported. From the base of the hammer upwards, the deposit is clast-supported and is composed of imbricated water-worn sandstone gravels and pebbles that are angular to subrounded. Their clast size, orientation, and imbrication are indicative of a high-energy fluvial system. The finer detritus between clasts is indicative of the intermittent nature of these flows (Figure 11).
This bench represents the exposed surface of a gravel-dominated attached bar that runs parallel to the modern terrace and is indicative of high energy transport that can only be achieved in flowing channels, distinguishing the palaeoterrace from the colluvial hillslope to the north. It possibly formed from the combined accretion of alluvium from the tributaries and the southwest downcutting and migration of the Doring River. Based on the difference in elevation observed from outcropping river boulders, the maximum thickness of the exposed palaeoterrace is ~5 m (Figure 7 and Figure 8).
4.6. Sand Mantle
UPK7′s mantle of sandy sediment drapes across the palaeoterrace and hillslope, rising from the modern terrace in the southwest towards the northeast (Figure 8), with its highest point (‘B’ in Figure 7) located where the ridges of two dunes intersect. The ridge of the ‘northern’ dune extends from the southeast to the northwest—separating the colluvium in the north (the leeward side) from consolidated sediment, modern terrace, and river channel in the south (Figure 7). The second, ‘eastern’ dune delineates the eastern side of the sediment stack. It extends from north to south, with its slip face (leeward side) feeding into the eastern tributary and its windward side contributing to the stoss slope of the ‘northern dune’ and the colluvium in the north (Figure 7). Highly consolidated sediment appears to be recently exposed on all slopes by wind and water erosion that has deflated and stripped away overlying unconsolidated sand and vegetation (Figure 7). A possible heuweltjie is exposed as a flat bench in the middle of a southeastern exposure of consolidated sediment providing a more resistant surface to these erosional processes compared to its surrounding (Figure 12).
Water erosion is indicated by the network of rills and gullies that have incised the middle to lower zones of the windward slopes (e.g., Figure 12). Rills begin in the upper hillslope zones of the sand mantle’s consolidated sediment, with nick points developing into wide, shallow channels across this zone. As the network of rills travels down each hillslope, they have narrowed and deepened, becoming ‘moderately developed’ channels (Strahler 2–3 in Figure 6 and Figure 7). In the lower zones of the south-facing exposure, rills have developed into gullies (Strahler 4), forming a single deeply incised channel that feeds runoff from the surrounding surface to the base of the sediment stack and tributaries (Strahler 5 and 6; Figure 6 and Figure 7).
Water erosion has also cut into the northern side of the sediment stack, possibly from hillslope runoff as well as an overflowing eastern tributary. This has removed consolidated and loose sand from the northern dune’s slip face and the western side of the eastern dune’s windward slope. It has also scoured and separated an island of residual consolidated sediment from the main stack (Figure 13). This residual mound of sediment overlies and is now surrounded on all except its south side with colluvium (Figure 7, Exposure 6).
To help delineate between hillslopes of consolidated sediment with different aspects or that are separated with unconsolidated sand/colluvium (i.e., the north-facing hillslopes), they were given an area ID and termed ‘Exposure’ (see Table 4 and Figure 7). The south-facing hillslope was subdivided into three parts due to its extensive surface area: Exposure 1a–c, from west to east. Exposure 2 is the same area as ‘Area of Analysis’ 3 (AoA 3) in [45].
4.6.1. Lower Red without (LR) and with CaCO3 (LRcc)
The oldest consolidated sedimentary unit at UPK7 is a yellowish brown, indurated sandy loam to loamy sand (Table 1 and Table 2). It appears highly weathered and underlies the Upper Yellow (UY), Indurated Sand (IS), and Unconsolidated Sand (UCS) units. Despite its dominant Munsell colour (10 YR 5/6; Table 2), this unit appeared redder than its overlying units when observed in the field. As a result of this distinction, it was labelled the ‘Lower Red’ (LR) unit. The LR unit also occurs with and without calcium carbonate (cc), in the form of small calcrete nodules or carbonate infilling of desiccation cracks. Its sedimentary structure varies from structureless (massive) to being composed of blocky-angular and subangular aggregates (Table 2).
Together, the exposed surface of the LR and LRcc measures a total of 3942 m2. It is exposed as a residual mound of sediment in Exposure 6, above the colluvium in the north (Figure 7 and Figure 13). The LR unit was also observed as an exposed surface at the mid-zone of UPK7′s southern slope where erosion and transportation are likely to be at their most intense (i.e., the transport slope). Its exposed extent on the southern slope extends from the northwest to southeast, across the main Exposures 1b,c (Figure 7). The LR occurs at the top of the slope, from underneath overlying UY sediment, while the LRcc appears at lower elevations, farther down the slope, before being covered with the IS (Figure 7 and Figure 8). On the north side of the sediment stack, from the top of Exposure 3′s hillslope to the colluvium at its footslope, the sedimentary profile transitions from the UCS and UY to the LR (Figure 7). To the west, the steep residual mound of Exposure 6 shows the LR capped with UY sediment (Figure 13). The LR is exposed between the top and mid-section of the slope, with a deposit of cumulic soil on the footslope overlying the surrounding colluvium (Figure 13).
Samples and Surface Description
A total of 14 LR and LRcc surface and sediment descriptions were made from rSSQ. Three capture LR, while eleven record the surface composition of LRcc—four of which are possible heuweltjies. Recurring observations note a rough, uneven surface of yellowish-brown sediment (10 YR 5/6), with frequent rilling that becomes more defined, narrower, and deeper downslope (Table 1 and Figure 7). At higher elevations, the surface of LR is highly consolidated, moderately rough, and void of vegetation, with sparsely distributed calcrete nodules appearing downslope at lower elevations. The presence of calcium carbonate within LR occurs in the lower sections of this unit. This is indicated in surface Exposure 1b, where the deposit appears to grade downwards from LR into LRcc. Calcium carbonate is rare in the local geology and usually only occurs in low quantities from a secondary source such as rainfall or channel alluvium, and in this case, it is transported as fine lithic grains through aeolian processes. Therefore, the calcium carbonates observed in LR either derive from a secondary source, forming through repeated cycles of calcite precipitation in LR over a very long time or are from a concentrating agent (i.e., termites or roots, e.g., heuweltjies; [77]).
UPK7′s surface becomes highly weathered, transitioning from nodules to veins of calcrete that fill desiccation cracks, apparent across the top and middle of the southern hillslopes (Exposure 1a–c; Table 1). Calcrete nodules appear to overlie the LR sediment above veined LRcc—similar to UY—ranging in size and form (50 to <5 mm, angular with low sphericity to sub-rounded with high sphericity; Table 3). Surface artefacts vary from dense to sparse in coverage, which could indicate variation in artefact accumulation as a result of occupation duration and the distribution and scale of artefact discard or hillslope erosion. The latter is suggested by the channelling of artefacts into UPK7′s network of rills across the mid-slope of Exposures 1b (Figure 14).
A total of seven sections exposed the LR and LRcc in profile, from which eight sediment samples were collected for particle size and XRD analysis (Table 3). Four samples were collected near and from below-surface archaeology. Additional samples were collected from the side of the gully or ‘donga’ wall of Exposure 1b and three samples were taken from the LR unit of the residual mound of Exposure 6, isolated above the northern colluvium. Calcium carbonate (CaCO3) occurs as nodulated calcareous inclusions or as moderately to well-defined calcrete veins. The presence of CaCO3 suggests the secondary formation of calcite in the LR as a possible outcome of the frequent wetting and drying of overlying sediments.
Field observations suggest LR has a higher silt and clay content than the overlying Upper Yellow unit (UY) and is more cohesive, holding its form when wet (Table 3). Lower Red sediments are also more porous where it directly overlays colluvium, suggesting possible bioturbation. Bioturbation (i.e., termite frass) and salt precipitates were observed at the base of the eastern wall of one LR section.
In sandier portions of LR, grains are less cohesive and therefore more likely to disaggregate. As a result, the form of the hill of sediment in Exposure 6 and the apparent juncture between its upper and lower deposits (Figure 13) possibly resulted from the displacement of residual upslope material, settling at the footslope before fanning out over the colluvium, as suggested by its highly rilled form. To understand the relationship between the original upper deposits (sampled from an upslope section cut: see sample locations for 91153 and 91155 shown in Figure 13) and the surrounding colluvium, excavation into this deposit from the colluvial base is still needed. As it stands, the sediment sampled from the lower half of Exposure 6 (see sample location 91157 in Figure 13) appears to overlie and post-date the surrounding colluvium.
Grain Size and Mineralogy
The grain size modes of the LR and LRcc are relatively bimodal compared to overlying unconsolidated and indurated sediment, with minimal variation between samples, showing a primary peak of 158–187 μm and a secondary peak of 14–23 μm (see Figure 15d). The only minor outlier is sample 91,057, with a lower primary peak of 145 μm and a secondary peak of 10 μm reflecting its lower sand (57%), and higher combined silt (37%) and clay (7%) content compared to the other samples. The samples collected from the IS and UY have more in common with the LR grain size modes than they do with IS samples collected from Section Cut 1 (see Figure 15c).
Quartz is the dominant mineral in all LR and Exposure 6 sediments (72.5–86%). Chlorite and iron minerals are also present throughout the LR and LRcc sediment, with minor traces of goethite present in all samples (0.5–1.2%) followed by traces of siderite (0.1–0.6%). As with LRcc, iron and clay minerals typically found in highly weathered soils (i.e., goethite, hematite, kaolinite, and illite) occur in each sample. The detrital clay illite forms the dominant clay mineral in the LR sediments, while kaolinite occurs in the top and base sediments of Exposure 6. Hematite is absent from the LRcc samples, which suggests slightly different weathering conditions/processes involved in the formation of these sediment bodies. Chlorite also consistently contributes to the LR mineralogy, ranging from 0.9 to 1.3% for most samples.
The LRcc samples are composed of a similar—albeit slightly smaller—amount of quartz (69–82%) than the LR samples. The LRcc has less K-feldspar (0.9–2.4%) and more Na-feldspar (12.6–17.4%) than the LR sediment, with albite contributing >10% of the LRcc mineral content. All LRcc samples contain detrital clays, with illite (1.7–3.5%) as the dominant mineral and minor traces of kaolinite. Calcite (up to 3.5%) is present in the LRcc samples as nodules or veins.
4.6.2. Upper Yellow (UY)
The UY unit is the least exposed and possibly the most eroded of the consolidated deposits at UPK7. It occurs as ‘patches’ of small exposures at the top of slopes before transitioning down into older sediments such as LR and LRcc. It also occurs in isolation, as the low gradient Exposure 2 (‘AoA 3′ in [45]), which is surrounded by overlying dune sand (UCS; Figure 16). Together, these differentially distributed patches of UY sediment cover a total of ~632 m2, less than 10% of the extent of IS (Figure 7).
Samples and Surface Description
Upper Yellow was randomly sampled across two exposures. An Early LSA artefact cluster occurs within Exposure 2 (see [45]). Recurring surface observations include the sparse presence of small, hard calcrete nodules of calcified roots (rhizoliths), on a 10 to 20 mm thick surface crust that overlies a highly indurated subsurface (Table 3). This sediment is firm upon finger compression, followed by its breakdown into fine sandy loam that can leave the skin yellowish brown (10 YR 5/6; Table 2). In addition to its siltier consistency, fine pores are present throughout its crust (Table 2). Vegetation is rarely observed directly in this unit. When it is observed, it occurs as a mound of vegetation, pedestaled above UY, in UCS and SCS sediment (e.g., Figure 16). Knick points and very shallow rilling occur on UY at the top of the windward slopes of Exposures 1b, c and 3 (Figure 7). This suggests that sheet-wash erosion is progressively exposing and eroding back the top of the windward slopes. Beneath its crusted surface, UY is a highly indurated, fine yellowish brown (10YR 5/6), sandy loam to loam sediment that proved difficult to excavate with a spade and trowel (Table 2 and Table 3).
Grain Size and Mineralogy
Two subsurface samples were collected from UY sediment for particle size and XRD analysis. The grain size distributions of the UY were compared to the IS to determine if there is a compositional difference between the two sedimentary units (Figure 15c). Both units are predominantly fine sand. However, the UY samples have a higher silt content, showing a more pronounced secondary peak at ~14 μm, representing 23–27% of silt.
The mineral composition of UY is similar in both samples and to the IS units from Section Cut 1. Quartz dominates (70–80%), followed by feldspar (15–25%), and less than 6% is composed of clay minerals, iron oxides, and iron carbonate as well as the sheet silicate, chlorite (1.2–1.3%).
4.6.3. Indurated Sand (IS)
IS is the uppermost and most extensive consolidated sedimentary unit observed beneath the UCS (Table 1), with a visible surface approximating 7200 m2 (Figure 7). This unit is observed overlying the gravel bench of the palaeoterrace in the northwest. From here, it extends upslope across most of Exposure 1a and the southern extent of Exposures 1b and 1c (Figure 7).
Samples and Surface Description
All surface observations describe IS as a hard, smooth, indurated sandy surface that is crusted, heavily rilled, and sparsely vegetated (Table 1). This unit is often found partially covered with SCS and UCS (Table 2). Surface clasts mostly consist of non-flaked gravel-sized material, including the recurring presence of small quartz clasts. A thin crust of varying thickness (~10–20 mm) forms the uppermost layer of exposed IS. When broken, small pores are observed throughout (Table 2), indicating moderate cohesion and rapid drying of wet sediment. This was also observed for UY, LR, LRcc, and Colluvium surface sediment. Pores form during the wetting and rapid drying of accumulated fine wind-blown particles, which are often observed as part of aridisols in semi-arid and arid environments [78]. Sediment cohesivity and the rapid drying and crustal formation of a deposit’s surface were found to increase artefact adherence to an exposed surface, providing temporary artefact stability and has possibly led to the imbrication or pedestaling of smaller clasts, observed in UY, LR, and LRcc, that would otherwise fall within the size threshold for clasts most susceptible to movement (i.e., <20 mm).
Twelve subsurface sediment samples were collected from locations that were interpreted as IS based on deposit characteristics and stratigraphic position. Eight of these were collected from the profile of Section Cut 1 and its associated auger hole (Figure 17). Section Cut 1 was excavated to a depth of 1.7 m below the surface (bls) into the eastern wall of the deeply incised gully that runs south from Exposure 1b (Figure 7).
The sedimentary unit exposed in Section 9 (or ‘OSL cut 9’ in Figure 18A) of Exposure 1b’s southern gully complex is highly indurated with fine roots dispersed throughout its matrix (Figure 7 and Figure 18). Here, the IS unit overlies a surface of rubified, desiccated and calcium carbonate-rich LRcc sediment, with their compositional and structural differences supporting the stratigraphically younger depositional position for IS relative to LRcc. Section cut 9 indicates that any sediment that may have overlain LRcc in this area was removed prior to IS deposition. While IS sediment exposed in Section 9 lacks clear indications of bedding, small calcrete nodules (~60 mm in diameter) are distributed throughout the section (Figure 18A), as well as haphazardly orientated and loosely distributed stone artefacts, suggesting high energy reworking of older pedogenic and archaeological material >20 mm in maximum dimension from upslope (Figure 18).
In contrast, Section 3 (‘OSL cut 3’ in Figure 19) reveals the transition from a weathered, highly indurated surface layer that lacks obvious bedding, to finely laminated sand, ~20–30 cm below the surface (Figure 19). The surface condition above this cut is smooth, exposed, and largely void of clasts >20 mm in diameter, and the IS unit is overlain with vegetated UCS and SCS (Figure 19). The finely laminated bedding of sand in Section 3 (Figure 19B) suggests that low-energy slope wash was involved in the deposition of the lower sediments, while the overlying deposit lacks structure, suggesting weathering and bioturbation of input from aeolian processes.
Grain Size and Mineralogy
Indurated Sand samples from Section Cut 1 (Figure 17) and Section 3 (Figure 19) are negatively skewed with mean particle diameters that range from 87 to 181 μm and grain size primary modes that peak between 146 and 308 μm (Figure 15c). Sand dominates each sample (72–90%). However, the Section 3 sample (OSL tube no. 90020) contains a higher silt component (19%) than in all Section Cut 1 samples (6–13%). There are consistently fewer sand-sized particles in IS sediment (51–90%) than in the unconsolidated sediments (90–100%; cf. Figure 15b,c).
Quartz is the dominant mineral (67.5–81.3%). Albite (9–26%) forms the largest component of the additional minerals in the IS. In most cases, there is more albite in the IS samples (8.9–26.4%) than there is in the UCS and SCS units (0.7–11.4%). Moreover, the input of clay and iron minerals derived from highly weathered material (i.e., illite, chlorite, haematite, and goethite) is evident throughout each IS sample. This is most pronounced in Section 9 (Figure 18) and the three lowest samples collected from 2.7 to 3.5 m bls of Section Cut 1. Samples collected below 2.2 m in Section Cut 1 also show an increase in K-feldspar (2.9–6.5%).
The presence of chlorite in most IS samples indicates semi-arid to arid conditions where annual precipitation is too low to induce mineral leaching. If the fine lithic grains contributing to the additional mineral content of the IS derive from the deflation of river alluvium, then fluctuation in mineral frequencies between IS samples may indicate oscillating wind strengths from the river source over time. Although, minor calcite (0–0.2%) occurs in Section Cut 1 above 2.7 m bls but increases in the lower strata suggesting pedogenesis, typical of a B horizon. The presence of hematite and absence of chlorite in the lowest sample of Section Cut 1 (Figure 17) suggests increased weathering caused by repeated transitions between wet and dry conditions. However, the presence of haematite and chlorite in the sample from 1.7 m bls suggests that while oscillating wet–dry conditions were actively weathering these sediments, the amount of precipitation was potentially lower, allowing the preservation of chlorite in shallower units such as these.
Discerning the difference between the IS and UY in the field depends on a clear understanding of their stratigraphic and topographic context, making it difficult to differentiate between these two units in isolated instances without particle size measurements, a vertical perspective, or chronometric data. Despite this, the IS and UY appear to differ in macro-composition, colour, and particle size, as well as in the presence of secondary features such as rhizoliths in the UY (Table 2 and Table 3).
The lamination evident in the IS unit in Section 3 (Figure 19) and the haphazard reworking of sediment, calcrete nodules, and artefacts in Section 9 (Figure 18) suggests the deposition of slope-washed sediments from upslope. The UY, on the other hand, is consistently located at high elevations or at the head of a slope and has more silt than the IS. Silt content may indicate lower wind strengths during the UY accumulation or reflect their greater distance from the river channel compared to the IS samples. Difficulty in distinguishing between these two deposits—beyond the subtle difference in colour, texture, and occasional bedding structure—suggests that the deposits have the same source. Once again, the sedimentary unit exposed in Section 9 has the highest silt content (Figure 15c) as well as feldspar and clay mineralogy suggesting that it derives from the erosion of older sediment than the IS, possibly occurring as a reworked unit of an older calcrete and loamy sand deposit such as the UY and/or LR.
4.6.4. Unconsolidated (UCSs) and Semi-Consolidated Sands (SCSs)
The unconsolidated sandy deposit that extends across the toe of UPK7′s hillslope (Table 1) is the uppermost deposit identified at this locality and thus interpreted as the youngest. It is also the most recent example of a source-bordering dune and sand sheet at UPK7 (Table 1, Figure 7), with unconsolidated sand migrating towards the northeast and east from the seasonally exposed channel sands of the Doring River. This is evident in the direction of the cross-bedding observed on the leeside of the eastern dune, which forms its steepest slip face feeding into the eastern tributary from the west.
Samples and Surface Description
The unconsolidated sandy deposits of UPK7 were subdivided into unconsolidated and semi-consolidated sand (UCS and SCS, respectively). SCS is associated with frequent vegetation growth, root presence, fine laminations of windblown sand, and, like UCS, varies in thickness across UPK7 (Table 1). Artefacts are rare but occasionally observed protruding out of this deposit, e.g., midway down a mound of pedestalled vegetation. UCS is composed of very poorly to moderately sorted, medium-grained sand found overlying all of UPK7′s sedimentary units (Table 1, Table 2 and Table 3). It appears vegetated due to the presence of underlying SCS where enough water retention and stability occur for root growth. Artefacts observed within this unit occur only when UCS is thinly distributed over harder, underlying sediment.
Samples of river sediment, terrace alluvium, and UCS were collected along a surface profile (Figure 7) for grain size and XRD analysis. Additional UCS and SCS samples were collected from the widespread surface and vegetated dune.
Grain Size and Mineralogy
The unconsolidated sediment samples are dominated by sand-sized grains (90–100%), with silt and clay each forming <6% of all UCS samples (Figure 15b). Alluvium sampled from the river channel and modern terrace (the thalweg) has some of the largest average particle diameters (374–559 μm; Table 3). Modern terrace and aeolian sediment samples have smaller mean grain sizes than river alluvium, ranging between 203 and 417 μm (Figure 15b, Table 3). In accordance with source-bordering dune formation, they share a similar size mode, with their primary peaks ranging between 236 and 396 μm, decreasing as distance from the river channel source increases. Deviation from the mean grain size also decreases with distance from the alluvial source.
UCS samples show the most variability in average grain size between samples (Figure 15b). This may reflect sample location and the local input of sand sized aggregates from the erosion of older sedimentary units composed of more clay or weathering of silica-rich sandstone. For example, surface sediment on the southern slope of UPK7 is composed entirely of sand (100%) and has one of the highest quartz frequencies (96%) at UPK7 (Figure 15b), suggestive of the recent reworking of sandy sediment, possibly from the saltation or suspension of terrace sands during strong winds.
While all unconsolidated and semi-consolidated sand samples show a dominance of quartz (80–96%), they vary in the types and proportions of additional minerals. River and terrace alluvium have mineral compositions that reflect their catchment of highly weathered products, including minerals derived from the long-term physical and chemical weathering of feldspars and iron oxides in the wider landscape, with feldspars being the principle additional mineral (4.9%). Iron minerals are present at higher quantities in river sediment (1.2%) compared to terrace alluvium (0.7%), while clay minerals are more prominent in the modern terrace sample (2.6%) than in the river channel alluvium (0.8%). This is consistent with the modern terrace being less mobile, retaining more detrital grains than the seasonally flowing river. River channel and modern terrace sediments also contain carbonate minerals, calcite, or dolomite (both 0.3%). The geology of the Doring River catchment is not calcareous, which suggests that the introduction of carbonates into the channel bed possibly derives from alternative sources such as precipitation and/or the degradation of organic matter from the surrounding hillslopes [77]. Moreover, the presence of the feldspar minerals in the river sediment may come from the weathering of diamictite clasts and Karoo dolerites in the wider catchment. The increase in feldspar content with distance from the river source may indicate preferential transport of the more platy feldspar grains, which have a slightly larger surface area to volume compared to quartz.
UCS and SCS vary in mineral composition across UPK7. After quartz, these samples are dominated by albite (2.7–11.4%) which is more common than labradorite (0–5.3%). These values exceed the plagioclase contents in the river and terrace alluvium, which also contain more orthoclase and microcline. Clay mineral content is mainly contained in lithic grains. The closest UCS sample to the river channel has the smallest amount of albite (2.7%) and detrital clay (1.2%) as well as minor traces of iron carbonate and oxides. The small contribution of additional minerals to the surface sand of the southern slope—together with its well-sorted almost unimodal grain size—suggests aeolian reworking from an existing sand deposit.
Summary
Subtle differences between samples can be attributed to the minor input of finer sediments from local sources, possibly through the breakdown of very fine lithic grains, the introduction of pedogenic material from sheetwash erosion of older deposits, and/or increased distance from the river channel. Kaolinite in these samples possibly represents weathered feldspar, while the presence of goethite may represent weathered dolerite. Despite the apparent variability in the proportion of additional minerals within and between the unconsolidated and semi-consolidated sand units, the modes and shape of UCS and SCS size distributions are similar to the alluvium samples (Figure 15a,b), with a moderate decrease in average grain size as the distance from river increases. UCS and SCS also show an increase in silt content closer to exposures of consolidated deposits, together with the immediate presence of vegetation, reflecting highly localised influences on their mineralogical variability.
The mineralogy and semi-consolidated state of some dune sands suggest older ages for SCS units, while active UCS were deposited as recently as the last century and are still actively moving under the present conditions (as seen by the rapid burial of permanent survey markers). These findings suggest that aeolian deposition is an active process in the formation of unconsolidated and semi-consolidated sands at UPK7. It is possible that this has been the main process of deposition in the study area since the Late Pleistocene, with changes in meteorological conditions influencing the stability of these units and their associated archaeology throughout this time.
4.6.5. Main Trends in Particle Size and Mineralogy
Several trends are apparent in the particle size distributions between each sedimentary unit. Firstly, the silt content increases and the sand content decreases down through the stratigraphic sequence, from youngest to oldest deposit (Figure 20a). This is reflected in the decrease in mean and first modal grain size going down through the sequence (Figure 20b; Table 3) and is evident in the change in sorting from moderately sorted to poorly and very poorly sorted (Figure 20c; Table 3). The increase in silt lower in the sequence may reflect weathering and the partial breakdown and comminution of lithic grains and feldspar, characteristic of palaeosols. In this case, this could be a function of the breakdown of lithic grains or the result of finer dust which has been progressively washed down through the profiles of porous, unconsolidated sand during repeated long-term cycles of wetting and drying. The contrast in sorting is particularly evident when compared to the modern river sand (stratigraphic levels 1 and 2; Figure 20c).
An alternative possible explanation for the change in particle size through the sequence is that grain size has increased with time as conditions have become drier and wind strength has increased. For instance, the size of mode 1 grains of the older units is moderately well sorted and mainly range from 150 to 200 microns with no coarse tail—well within the size range readily moved by aeolian activity. However, modal size increases to 400 microns (medium sand size) in the semi- and unconsolidated sands suggesting possibly higher average wind velocities.
Trends in mineralogy are not as clear within and between sedimentary units. In accordance with the trend in weathering, there is a slight increase in clay mineral content with depth. However, the feldspar content shows a poorly defined increase with depth, while the quartz content decreases (Figure 20d). Feldspar is predominantly much finer than quartz and is progressively washed down through the sequence, increasing the silt content as it accumulates in lower layers.
4.7. ERT Subsurface Stratigraphy
Subsurface evidence was obtained from geophysical surveys along two transects (labelled Line 1 and Line 2, see Figure 7) using electrical resistivity tomography (ERT). ERT was used to determine where bedrock and palaeoterrace extend beneath the exposed deposits of UPK7 and to identify the location, depth, and extent of subsurface contact between these basal units and the sedimentary units forming the sand mantle. The sand mantle does not appear to have been deposited in horizontal layers. Rather, the layers seem to broadly follow the modern topography as a draped stratigraphy. Based on the ERT results, the documented units have a combined thickness of 10 m to bedrock with an additional 4 m of bedrock or alluvial fan detected beneath these units (Figure 21). The stratigraphy shown in the ERT profiles suggests that “bedrock” influences the surface geomorphology of UPK7 (Figure 7). This unit manifests as a distinct bench-like anomaly of moderate resistivity (~100 to 300 ohm.m) at the base of the subsurface profile of Line 1 (Figure 21) and as irregular areas of moderate to high resistivity at the base of Line 2′s profile (Figure 21). The latter possibly represents the combined input of tributary and hillslope debris. The morphological irregularity and steep dip (~40°) of this geological unit suggests that it is unconsolidated sediment of an alluvial fan or debris flow.
The Indurated Sand is well distinguished in the ERT, with its high resistivity (268–1129 ohm.m) possibly reflecting the dominance of sand-sized particles and quartz compared to the more water-retentive sandy loam and loamy sands of the Lower Red deposit (Figure 21—Line 2). Line 2′s profile also shows a marked difference between the resistivity of the Unconsolidated Sand dunes and their surrounding substrate (Figure 21). The Upper Yellow in Line 2 appears to have a similar moderate level of resistivity compared to Indurated Sand. However, the Indurated Sand appears thicker, suggesting that the Upper Yellow unit is truncated. The Upper Yellow can be distinguished from the Lower Red in some cases. However, these units have relatively similar resistivity values, typical of geological units that are composed of similar source material and have formed through similar processes. Their lower resistivity compared to the Indurated Sand possibly reflects greater water retention, higher silt content, and/or pedogenesis.
4.8. The Dominant Processes Involved in the Formation of UPK7′s Sedimentary Units
It is proposed here that the units forming the sand mantle (i.e., LRcc, LR, UY, IS, SCS, and UCS), which overlie the palaeoterrace and hillslope, developed as source-bordering dune and sand-sheet deposits, with the older units (LRcc, LR and UY) showing evidence for subsequent pedogenesis.
4.8.1. Aeolian Dune Formation
The orientation and morphology of UPK7′s unconsolidated sands and the overall topography of the sediment stack suggest that aeolian sand is transported and deposited across the toe of the hillslope from the Doring River. While source-bordering dunes lack a formal definition, they can be described as dunes that form proximal to and on the leeside of their source [79]. The formation of source-bordering dunes requires ‘a regular source of sand from a seasonally flowing sand-bed channel’ [80]. This is available during the dry season when the channel bed of the Doring River has stopped flowing, exposing stretches of alternating riffles (boulders and bedrock) and thick alluvial sand deposits. High winds redistribute sediment from the river channel upslope to the surrounding hillslopes during the dry season. Dominant wind directions in the valley are westerlies and south–south-westerlies during the dry summer season (November to March) and north–north-easterlies during the wet season in winter (i.e., March to October). Westerly winds tend to persist all year; however, they occur more often and at higher velocities during the dry season.
Source-bordering dunes also depend on the topographic position relative to their source (Figure 7). Hillslopes close to the Doring River channel that are dominated by colluvium and heuweltjie formations (e.g., Appleboskraal) and/or are only minimally covered with unconsolidated sand (e.g., UPK9) are often located where riffles and water holes dominate the dry channel bed and/or when they are blocked from windblown sand due to their surrounding topography. Where channel sand is exposed to the dominant wind, the sand can be blown well above river level. Figure 22 shows fine sand being transported eastward by dry season westerly winds from the fluvial sand bed of the dry Doring River channel up onto UPK7, forming sand dunes on the western side of the Western and Eastern Tributaries (Figure 22).
Where channel sediment is available, proximate, and unconstrained by topographic features, deposition tends to occur transverse to the dominant wind direction and downwind from the river source [80]. In accordance with this, the northwest to the southeast bearing of UPK7′s northern dune and the north to the south bearing of the eastern cross-bedded leeside dune are oriented transverse to the dominant summer wind regime of westerlies and south-westerlies (Figure 7). Sedimentary units located close to their source are also typically composed of coarser sand-sized material (63–500 µm), indicative of short transport distances involving saltation and surface creep that occur close to the ground’s surface [80]. That the sandy consolidated and unconsolidated sediment mantling the palaeoterrace and southern toe of the hillslope shows an inverse relationship between particle size and distance from the river channel suggests that the Doring River’s channel bed is the dominant sediment source for sand mantle accumulation. This scenario is also supported by a decrease in mineralogical similarities as the distance from the river channel increases. Considering the dominant wind direction, the most recent source of alluvium for UPK7 is located west and downriver from UPK7. During the dry season, the thinning of vegetation cover, exposure of dry-channel river alluvium, and the drying of sedimentary units across the landscape provide optimal conditions for the transport of fine sand onto UPK7. Conversely, when summer thunderstorms occur, they can cause catchment-wide flooding and extend the duration of or reintroduce flowing water in the Doring River. This can increase erosion caused by surface runoff. However, spring growth will reduce the impact of erosion with the additional supply of moisture and encourage the sediment stabilisation and soil formation of buried deposits.
4.8.2. Palaeosol Formation
Incipient palaeosols are only present in the UY and LR units at UPK7, while the IS, SCS, and USC are probably too young to have had sufficient time for the soil to form in this semiarid region. This is reflected in the increase in silt content downwards through the sedimentary units as a result of the increased time for weathering and breakdown of lithic grains and feldspar—a characteristic feature in palaeosols.
Soil development in the sandy loam of the UY unit is weak with the iron oxides released during weathering only occurring as goethite, giving the characteristic yellowish-brown colour of the unit. The few discrete small, hard, rounded calcrete nodules in this unit may represent eroded material from the underlying LR unit. The main indication of soil formation in the UY is the presence of small, calcified root traces (rhizoliths) on a surface crust, an incipient soil B-horizon that overlies a moderately indurated substrate, dominated by clay rather than carbonate cement. It should be noted that B-horizons do not necessarily indicate an erosional break, particularly in dry regions where they can occur well below the sediment surface.
The indurated sandy loam of the LR unit does not contain any clearly defined soil horizons but its slightly reddish colour (proto-terra rossa) reflects the combined presence of goethite, hematite, and kaolinite that are typically found in highly weathered soils in well-drained regions. The LR unit is moderately to strongly indurated and lacks sedimentary structures suggesting some movement in the material within the soil. In contrast, areas where LRcc occurs on the surface show a moderately developed B-horizon with numerous small hard calcrete nodules occurring over a vertical interval of about 0.1 m. In addition, calcium carbonate cement fills subvertical cracks within the soil horizon, and dispersed carbonate cement is also present in the indurated sediment. The mineralogy and structure of the LRcc are the same as that in the LR with just the addition of carbonate cement in LRcc. The formation of this soil probably occurred several metres beneath the depositional surface of the LR/LRcc unit. The presence of a carbonate-rich B-horizon and associated secondary minerals suggest a probable seasonal wet–dry climate during the formation of this soil.
4.9. The Potential Impact of UPK7′s Formation on Artefact Visibility and Movement
Identifying the dominant processes involved in the formation of each deposit is not only essential for determining the potential age of sediment exposure, but it also helps to determine the environmental and sedimentary conditions that promote or inhibit the post-depositional preservation and exposure of UPK7′s archaeology. The formation and degradation of UPK7′s sedimentary units result from the interaction between wind and rainfall. The deposition of sediment by wind is the inferred deposit-building process—its rate and amount are controlled by surface roughness (i.e., vegetation cover; see Figure 4D and Figure 6), sediment source availability, and wind strength and direction [80]. The accumulation of sediment helps to bury and preserve discarded artefacts and consequently inhibits their visibility. Moreover, irregularities in unconsolidated and semi-consolidated sand occur in areas where vegetation mounds or possible coppice dunes have formed. Not only do these features further indicate the simultaneous processes of sand accumulation, water retention, and vegetation growth, but they also signal conditions of deflation of the surrounding sediment by wind and rainfall over time. Moreover, shifts in topography and associated variation in the rates of saturation between vegetation mounds, thick UCS, and crusted surfaces can channel runoff and increase deflation between mounds [81,82,83].
4.9.1. Deposition and Erosion
The dynamic between wind and rainfall on UPK7′s slopes presents a complex history of sediment accumulation, deflation, and overland flow. The main processes contributing to the formation of UPK7′s sediment stack are aeolian sand accumulation and hillslope erosion. However, erosion is now outpacing deposition. Physical weathering appears to outweigh chemical weathering, with low levels of mineral leaching evident in the consolidated sediments. The rate of erosion at UPK7 is unknown, and it is unclear how much sediment and archaeological material has been removed as a result. Pedestalled stone structures are found throughout the valley, often in association with areas of erosion and highly exposed archaeological surfaces (i.e., Figure 23). Their use over time likely intensified erosion within their immediate vicinity. Stone foundations cap underlying sediments, resulting in their characteristic pedestalling and erosion of the remaining outer structure and underlying deposit (e.g., Figure 23A). Deflation ranges from ~0.4 m at Lungkaal (see Figure 23B) to 1.6 m at UPK9. The height of pedestalled stone at UPK7 is no more than 100 mm above a given surface. The conventional radiocarbon age obtained for the pedestalled stone hearth at Lungkaal (D-AMS 027125) is 135 ± 22 uncal BP (standard error to 1σ) [59]. This sample indicates that sometime within the last 300 years, ~400 mm of deflation occurred. Given the potential amount of sediment that has eroded from these localities—even in the last few centuries—it is surprising that surface artefacts persist on exposed surfaces such as UPK7. Their presence, density, and inferred age raise questions as to what mechanisms are enabling their preservation and to what degree has surface runoff impacted their organisation and technological composition.
The LRcc and LR appear more resistant to both water and wind erosion compared to the Upper Yellow and Indurated Sand. However, this might have more to do with the duration of exposure in each deposit rather than the compositional differences between units. The sand mantle shows a clear relationship between the thinning or absence of vegetation and the location and extent of consolidated sediments that are crusted, rilled, and have moderate to steep slopes (e.g., Figure 6 and Figure 9; [44,48,82,84]). Erosion is at its slowest in the topmost upper hillslope zone—often marked by a residual body of sediment. Just below this area, the middle zone is most prone to erosion and the greatest degree of particle transport. The footslope or lower hillslope zone represents the cumulic zone where transported particles are deposited. While aeolian deposition and surface sand movement are likely to be more gradual forces of deposition and deflation in the study area, rainfall erosion—in the form of sheet wash and debris flows—has the potential to rapidly and effectively entrain both coarse and fine particles in a downslope direction [49].
The hillslope position is an important predictor of sediment erosion. Hillslope positions were divided into three zones: upper, middle, and lower (Table 5). The upper zone accounts for the top 20% of a hillslope’s elevation range, the lower zone accounts for the lower 40% of a hillslope’s range, and the middle zone accounts for the middle 40% of a hillslope’s range—between the upper and lower zones. Based on the basic principles of dune formation and hillslope erosion, middle hillslope zones are most susceptible to sediment entrainment. Relocation of sediment during wind erosion would catalyse movement of sand toward the leeside of the dune crest, increasing sediment build-up and elevation at the crest of the dune before avalanching down the slip-face to either build-up or exit into the tributary below. Rainfall runoff and rain splash erosion on the southern slope can relocate sediment downslope. On long, low gradient slopes, relocation might be more localised, with sediment lagging into a cumulic zone at the base of the slope. However, increased aridity, and flash flooding have formed deeply cut rills that can channel fine and coarse particles from the exposed slope direct to the river and adjacent terraces.
4.9.2. Wind, Sand, and Vegetation
The formation and morphology of UPK7′s unconsolidated deposits in relation to the surface condition and spatial arrangement of the exposed consolidated surfaces provides insight into the history of, and ongoing susceptibility to, deposition and erosion at this locality. Wind alters the location, spread, and form of deposited sand across a surface and has the propensity to accumulate in well-vegetated areas. Unconsolidated and semi-consolidated sands form a variable surface topography, with multiple dune crests observed across the locality resulting from dominant winds shifting during the dry season between south-westerlies and westerlies. The slip face of the eastern crest is expected to receive the greatest build-up of sand and have the lowest levels of artefact visibility caused by substrate burial. The north side of the northern crest forms another slip face and trough zone. Its slope dips steeply into the colluvium hillslope, which is largely devoid of unconsolidated or semi-consolidated sand. This indicates that the southward, downslope direction of overland and debris flows from the colluvium hillslope actively cuts into the back of the slip face and trough zone of the northern crest, removing sediment in a southwest direction, eventually evacuating into the western tributary (Figure 24).
The southern slope is the windward, stoss face of the northern dune crest. Its slope is more gradual, reducing the velocity of overland flow and impact of sheet wash erosion on the southern side compared to the northern side of the crest (Figure 24). However, there are several less pronounced dune crests visibly separating Exposure 1a–c (Figure 7). Their leesides are all located east of their crests, similar to the crest of the eastern dune. Because of their more gradual slope angle and stoss position, Exposures 1a–c are more likely to be vulnerable to erosion than the slip face sides of UPK7, in the north and east, which possibly promoted the relatively large areas of exposure on the south compared to the north and east sides of UPK7′s crests. However, the presence of vegetation cover and the shallow nick points of rill channels at the top of the south side of Exposures 1a–c (e.g., Figure 24) suggests that erosion in the upper and mid-zones of their slope’s is fairly recent.
4.9.3. Rainfall and Rill Development
Rainfall is one of the main erosional agents occurring in the study area. At UPK7, the impact of slope wash on slope morphology and sediment exposure is marked. The upper, middle, and lower slopes of exposed sediment are cut through by a network of rills (see Figure 6 and Figure 24) indicating extensive rainfall and slope wash erosion. High rates of artefact dispersal have been shown to increase close to channels [85]. For this reason, it is expected that artefact size-sorting and abundance will change relative to their proximity to rills and rill catchment size as a result of slope angle and rill depth. The hierarchical order of surface flows across UPK7 was assigned using the Strahler method. Moderate to deeply incised rills have Strahler classes of 4 to 5, while shallow and fine rills feeding into these from upslope are classed from 2 to 3 (Figure 6). Rilled, steeply sloping areas on Exposure 1b are concentrated below 210 m asl (Figure 6) and below 208 m asl on the eastern and western side of Exposure 1c’s hillslope.
Slope angle is highest (>15°) in the well-rilled areas of Exposure 1a–c—particularly below 210 m asl on Exposure 1b—and on the exposed slopes northwest of Exposure 1 (i.e., Exposures 3–6; see Figure 6). Object rolling occurs on slopes with angles >32° [86], while artefacts below this angle require an increasing amount of additional catalysing force to induce entrainment (i.e., debris and overland flow; [86,87]). Hillslopes with consolidated sediment are mostly low to moderately steep in gradient, with a median slope angle for all exposures of ~10.3°. Slope angles greater than 15° are often related to rilling and, to a lesser degree, vegetation. It is assumed here that slope angles >15° that are proximate to rills will increase runoff velocity during periods of rainfall, and so the probability that heavier/larger artefacts will move with lighter/smaller artefacts is expected to increase in these contexts. In contrast, slope angles >15° that are associated with vegetation are expected to act as movement inhibitors [88]. To a lesser degree, steep hillslope angles are also apparent on both Exposure 1a,c in association with vegetation mounds (Figure 6).
4.9.4. Trampling
A fourth factor that can increase the impact of rainfall and wind erosion is surface trampling by stock farming. While trampling can compress and consolidate sediment, it can also break up surface crusts, destabilising the surface of the sediment body thereby making it more prone to wind and water entrainment [84,89]. Within the last 300 years, grazing has increased erosion rates across the Doring River valley (see below). This is most apparent where historic stone buildings are found, as well as areas close to the more permanent water supply.
The absence of stone structures or anthropogenic modification of UPK7 suggests lower levels of historic activity in this area compared to other localities (i.e., UPK7). However, the northern side of the river channel was used for grazing until the 2016 purchase of UPK7 and UPK9 by the Pretorius family. It is also possible that domesticated ungulates were grazed by pastoralists in the valley from the earlier Late Holocene until European contact. Therefore, trampling could still have had an impact on the stability and preservation of UPK7′s sedimentary units and the archaeology discarded on them.
5. Discussion
5.1. Formation and Stratigraphic Sequence
The foundation of UPK7′s sediment stack formed through bedrock-constrained hillslope erosion and point-bar terrace development from the southward migration of the Doring River. Over this foundation source-bordering sand dune accumulated through aeolian transport of seasonally available channel alluvium. This sand mantle continues to form under seasonal wet–dry conditions, largely from the dry-season erosion of channel alluvium by south-westerly winds. The sand mantle’s overall morphology is roughly contiguous with the topography of the underlying palaeoterrace and hillslope. However, surface topography is also influenced by the direction and strength of the wind relative to the location and proximity of channel alluvium to the hillslope. The position of the most recent dune ridges indicates pivoting wind directions from westerlies to southwesterlies.
UPK7′s sand mantle represents the formation of at least four distinct sediment units, starting first with the aeolian accumulation of deflated channel alluvium, followed by stabilisation and consolidation, with pedogenesis evident in the oldest unit, Lower Red. Lower Red accumulated prior to the deposition of Upper Yellow. The presence of calcium carbonates within the Lower Red unit indicates long-term secondary processes of evaporation within the unit during strong seasonal conditions of repeated rapid drying of wet sediment. During the subsequent accumulation of sands that form the Upper Yellow unit, at least one slope wash event resulted in the removal of mid-slope sediment. Only specific areas of the sand mantle are protected topographically from erosion and exposure (i.e., the leeside of the eastern dune ridge). Although not observed directly overlying the Upper Yellow unit, the Indurated Sand likely post-dates its formation. The Indurated Sand is sandier, with less indication of paedogenesis than the Upper Yellow. It is also observed contacting all sedimentary units except Upper Yellow. The absence of consolidated sediment post-dating Indurated Sand suggests that overlying deposits never stabilised and/or were deflated. The Unconsolidated and Semi-Consolidated Sand units are the most recent units to have formed at UPK7 with the Semi-Consolidated Sand units underlying and therefore pre-dating the Unconsolidated Sand unit. These sedimentary units are considered analogous to the initial formation of the older, now consolidated, sediment units—actively accumulating and shifting across the hillslope, while providing periodic coverage for underlying deposits. Chronometric dating of each deposit will be published in a separate paper and will help to clarify their depositional age, how they formed, and how they changed through time.
5.2. Erosional Processes
The main erosional processes identified at UPK7 are wind and rainfall. Wind erosion slowly deflates surface sediment from the windward-facing hillslope, exposing and catalysing the vertical displacement of artefacts, while moving sand either to the leeside of the northern and eastern dune ridges or from the sediment stack altogether. Rainfall-driven hillslope erosion destabilises and entrains sediment and artefacts through rain splash, sheet wash, and slope wash. Rainfall has had the most impact on the southern hillslopes and northern hillslopes. Surface crusts and slope angle catalyse rill development from ~9°, and gully development from 15°. Rills and gullies are densest from the middle hillslope zone downwards. Lower Red is exposed in the middle hillslope zone where processes of weathering and transportation are active closest to rills. Upper Yellow sediment is exposed on both the fringe and at the top of the sand mantle, where sediment is actively eroding. This is exposing Upper Yellow beneath residual sand and above lagged artefacts and sediment. Slope angles are >15 in the fringe zone and below 9° at the very top of the sand mantle. The Indurated Sand unit is a combination of lagged sediment and aeolian sand. It is located on the lower hillslope zones where it is thick, deeply incised by rills and gullies, and has a slope angle >9°. This deposit forms a surface where sheet wash and wind deflation dominate over most of its surface with slope wash entrainment occurring close to deeply incised rills and gullies.
The depositional and erosional processes of wind and rain coupled with an artefact’s topographic setting (i.e., slope angle and hillslope position) are expected to control archaeological visibility and movement. The topography of UPK7′s sediment stack is largely the product of aeolian sand accumulation onto the cobble and bedrock hillslope in conjunction with rainfall and wind erosion. The growth and density of vegetation are highest where Unconsolidated Sand and Semi-Consolidated Sand occur, covering all but the central and northernmost hillslope of UPK7. These conditions likely inhibit artefact visibility by covering a substantial portion of the archaeological record of UPK7. The position of the two dune crests suggests that the dominant wind directions are from southwest to northeast and south to north. There are two potentially dominant windward sides of the locality that are thus prone to active movement of Unconsolidated Sand across its surface. These are the south- and west-facing slopes (Exposures 1a–c and 3). The absence of the Unconsolidated Sand and Indurated Sand on the northernmost hillslopes (Exposures 4–6) suggests that the sediment in these areas was and continues to be removed in this part of the study area.
Substantial deflation in sediment post-dating the accumulation of Indurated Sand appears to have taken place, culminating in the recent exposure of all three consolidated substrate units. This is evident in the removal of overlying sediment, and the exposure of an extensive archaeological record. This raises the question: how much has human activity in the area perpetuated and accelerated both the sediment load available for deposition and the destabilisation and erosion of deposits in the study area? To what degree has this activity played an antagonistic role in a system already dominated by erosional processes within an increasingly tumultuous climate?
5.3. Localised Histories
The local formation processes and depositional histories of an open-air context are fundamental starting points for determining how the condition, age, and spatial distribution of surface archaeology are both influenced and constrained by its sedimentary system. Although the DRAP’s use of the term sediment stack is intended as a generalisation, its valley-wide application to all archaeology-bearing landforms in the study area gives the impression that these landforms share similar formation histories. However, this study demonstrates the importance of local-scale conditions in the formation of UPK7 (i.e., the surrounding topography and position relative to river channel morphology and channel bed composition).
The formation contained in a sediment stack is sensitive to local conditions and depends on a range of historical contingencies (i.e., river morphology, sediment supply, topography, and land use practises and intensity during the Late Holocene), as well as catchment and regional conditions relating to climate and geology. Thus, there should not be an expectation that the catchall ‘sediment stack’ used to refer to archaeologically visible localities in the Doring River valley are the same or preserve equivalent formation histories. For this reason, a geoarchaeological assessment of the formation dynamics of each sediment body is recommended. Ideally, this would be carried out as part of a larger project dedicated to soil stratigraphic characterisation and analysis of alluvial, aeolian, and colluvial units at the regional, basin-wide scale. This will help to capture aspects of the landscape’s history of formation not otherwise captured with UPK7 and to establish the stratigraphic relationship of all depositional units and soil events in the study area. If possible, all units should be dated, not just the consolidated deposits related to a sand mantle. Future research should also be directed at investigating the spatio-temporal distribution and formation context of artefacts beyond the exclusive sediment-stack-based focus that predominates to this day. The inclusion of low-visibility areas will provide a broader perspective on the environmental and behavioural patterns observed at high-visibility localities such as UPK7.
6. Conclusions
The interaction between humans and their environment continues to influence the formation, preservation, and interpretation of UPK7′s archaeology. By deliberately ignoring open-air archaeology, we run the risk of losing behavioural information and thus biasing spatial and chronological models of hunter–gatherer occupation duration and behavioural variability across an environmentally dynamic landscape. We also run the risk of inadvertently excluding environmental archives for the Late Pleistocene and Holocene that are otherwise poorly preserved in interior and open-air settings. This paper is the first step in rectifying this, by providing a sedimentological, geomorphic, and stratigraphic context for the Late Pleistocene and Holocene surface archaeology exposed across UPK7.
Through this investigation, the main depositional and erosional processes involved in the formation of UPK7′s sand mantle were identified, and its depositional sequence was reconstructed. This sequence begins with the south-western migration of the main Doring River channel and hillslope erosion from both the eastern tributary and western tributary, which likely contributed to the continued incision of bedrock and the fanning out of debris from UPK7′s northern hillslope. This produced a palaeoterrace—now located ~5 m above the modern terrace—upon which a mantle of sand has accumulated, stabilised, and destabilised. Four sedimentary units, each in a different state of consolidation, form the sand mantle, with the Lower Red and associated calcium carbonate concretions representing the oldest unit, followed by the Upper Yellow unit, Indurated Sands, and finally the Semi-Consolidated and Unconsolidated Sand units.
It is proposed that the main process involved in the formation of this sand mantle is the aeolian transportation of sediment from the seasonally dry channel bed of the Doring River, with soil-forming processes occurring during periods of seasonal wet–dry climates—particularly in the formation of the older sedimentary units. Due to their compositional and geomorphic differences, each sedimentary unit varies in surface condition and, thus, in how they respond to and resist erosion from wind and precipitation. This in turn influences their history and duration of exposure and burial. Together these factors influence the depositional age, visibility, spatial distribution, and association of UPK7′s surface archaeology, which determines the kinds and temporal scale of behavioural inferences we can make from them.
This study provides a contextual baseline against which chronometric ages of each sedimentary unit can be compared to determine the chronology of UPK7′s artefact-bearing deposits and to test its proposed stratigraphic sequence. The (post-)depositional processes and composition of each sedimentary unit can also assist in and be tested during the analysis of sediment samples for chronometric dating (e.g., sediment bioturbation and its influence on the dispersion of single grain OSL results). The composition, stratigraphic sequence, and processes involved in the formation of UPK7 give stratigraphic and taphonomic context to the spatial patterning, visibility, and preservation of the locality’s surface archaeology and, ultimately, insight into the Doring River Valley’s history of human–environment interaction.
This paper also contributes to the resurgence in southern Africa’s open-air research that has taken place over the last decade. However, of greater significance is its contribution to the rare number of geoarchaeologically driven open-air projects carried out in the interior and subcontinent generally. The fact that the number of dedicated open-air geoarchaeological studies of southern Africa’s open-air surface archaeology can be counted on one hand is a cause for serious concern. Added to this is the fact that rock shelters are restricted to geologically conducive environments and few yield continuous chronostratigraphic sequences. This emphasises the need to continue to expand the geoarchaeological sample while also highlighting the need for a close working relationship between projects. This is particularly crucial if reconstructing human–environment interactions at a landscape and regional scale during southern Africa’s Late Pleistocene is to become a fruitful undertaking.
Author Contributions
Conceptualization, N.P. and B.G.J.; methodology, N.P.; formal analysis, N.P., B.G.J., and I.M. (ERT analysis); investigation, N.P.; resources, N.P. and A.M.; data curation, N.P.; writing—original draft preparation, N.P.; writing—review and editing, N.P., B.G.J., I.M., and A.M.; supervision, B.G.J. and A.M.; project administration, N.P.; funding acquisition, N.P., I.M., and A.M. All authors have read and agreed to the published version of the manuscript.
Funding
During the data collection phase of this project, Natasha Phillips was the recipient of a 2014 University Postgraduate Award, Alex Mackay was the recipient of an Australian Research Council’s Discovery Early Career Award grant, project number DE130100068, and Ian Moffat was the recipient of an Australian Research Council Discovery Early Career Award, project number DE160100703.
Institutional Review Board Statement
Not applicable.
Informed Consent Statement
Not applicable.
Data Availability Statement
All supporting information that relates to the reported results can be found in Phillips [59] and its associated appendices, which are freely available at https://ro.uow.edu.au/theses1/1375.
Acknowledgments
The authors would like to thank the Department of Archaeology at the University of Cape Town for providing access to field equipment and storage space; Matt Shaw and Chris Ames for collection and correction of RTK data in 2019 as well as the 2019 drone imagery for UPK7. A special thank you goes to the Pretorius family and Lilly Hough for their welcoming hospitality and land access in and around Uitspankraal. The authors would also like to thank several anonymous reviewers for their helpful comments and markups.
Conflicts of Interest
The authors declare no conflict of interest. The funders had no role in the design of the study; in the collection, analyses, or interpretation of data; in the writing of the manuscript; or in the decision to publish the results.
References
- Wilkins, J. Homo sapiens origins and evolution in the Kalahari Basin, southern Africa. Evol. Anthropol. Issues News Rev. 2021, 30, 327–344. [Google Scholar] [CrossRef] [PubMed]
- Val, A.; Collins, B. From Veld to Coast: Towards an Understanding of the Diverse Landscapes’ Uses by Past Foragers in Southern Africa. J. Paleolit. Archaeol. 2022, 5, 1–11. [Google Scholar] [CrossRef] [PubMed]
- Ames, C.J.H.; Chambers, S.; Shaw, M.; Phillips, N.; Jones, B.G.; Mackay, A. Evaluating erosional impacts on open-air archaeological sites along the Doring River, South Africa: Methods and implications for research prioritization. Archaeol. Anthropol. Sci. 2020, 12, 103. [Google Scholar] [CrossRef]
- Kuman, K. Florisbad and =/Gi: The Contribution of Open-Air Sites to Study of the Middle Stone Age in Southern Africa. Ph.D. Thesis, University of Pennsylvania, Philadelphia, PA, USA, 1989. [Google Scholar]
- Sampson, C.G. The Middle Stone Age Industries of the Orange River Scheme Area; National Museum: Bloemfontein, South Africa, 1968. [Google Scholar]
- Rezek, Z.; Holdaway, S.J.; Olszewski, D.I.; Lin, S.C.; Douglass, M.; McPherron, S.; Iovita, R.; Braun, D.R.; Sandgathe, D. Aggregates, Formational Emergence, and the Focus on Practice in Stone Artifact Archaeology. J. Archaeol. Method Theory 2020, 27, 887–928. [Google Scholar] [CrossRef]
- Binford, L.R. Behavioral archaeology and the “Pompeii premise”. J. Anthropol. Res. 1981, 37, 195–208. [Google Scholar] [CrossRef]
- Bailey, G.N. Time perspectivism: Origins and consequences. In Time in Archaeology: Time Perspectivism Revisted; Holdaway, S., Wandsnider, L., Eds.; The University of Utah Press: Salt Lake City, UT, USA, 2008. [Google Scholar]
- Parkington, J.E. A view from the South: Southern Africa before, during and after the Last Glacial Maximum. In The World at 18,000 BP; Gamble, C., Soffer, O., Eds.; Unwin Hyman: London, UK, 1990; pp. 214–228. [Google Scholar]
- Ulm, S. ‘Complexity’and the Australian continental narrative: Themes in the archaeology of Holocene Australia. Quat. Int. 2013, 285, 182–192. [Google Scholar] [CrossRef]
- Lombard, M.; Wadley, L.; Deacon, J.; Wurz, S.; Parsons, I.; Mohapi, M.; Swart, J.; Mitchell, P. South African and Lesotho Stone Age sequence updated. S. Afr. Archaeol. Bull. 2012, 67, 123–144. [Google Scholar]
- Hallinan, E.; Parkington, J.E. Stone Age landscape use in the Olifants River Valley, Clanwilliam, Western Cape, South Africa. Azania. Archaeol. Res. Afr. 2017, 52, 324–372. [Google Scholar] [CrossRef]
- Mackay, A.; Sumner, A.; Jacobs, Z.; Marwick, B.; Bluff, K.; Shaw, M. Putslaagte 1 (PL1), the Doring River, and the later Middle Stone Age in southern Africa’s Winter Rainfall Zone. Quat. Int. 2014, 350, 43–58. [Google Scholar] [CrossRef]
- Sampson, C.G.; Moore, V.; Bousman, C.B.; Stafford, B.; Giordano, A.; Willis, M. A GIS analysis of the Zeekoe Valley Stone Age archaeological record in South Africa. J. Afr. Archaeol. 2015, 13, 167–185. [Google Scholar] [CrossRef]
- Mackay, A. Three arcs: Observations on the archaeology of the Elands Bay and northern Cederberg landscapes. S. Afr. Humanit. 2016, 29, 1–15. [Google Scholar]
- Parkington, J.E.; Mellars, P.A. The Emergence of Modern Humans. Sci. Am. 1990, 263, 98–105. [Google Scholar]
- Oestmo, S.; Schoville, B.J.; Wilkins, J.; Curtis, W. Marean. A Middle Stone Age Paleoscape near the Pinnacle Point caves, Vleesbaai, South Africa. Quat. Int. 2014, 350, 147–168. [Google Scholar] [CrossRef]
- Sampson, C.G.; Bousman, B. Variations in the size of archaeological surface sites attributed to the Seacow River Bushmen. S. Afr. J. Sci. 1985, 81, 321–323. [Google Scholar]
- Fuchs, M.; Kandel, A.; Conard, N.; Walker, S.; Felix-Henningsen, P. Geoarchaeological and chronostratigraphical investigations of open-air sites in the Geelbek Dunes, South Africa. Geoarchaeology Int. J. 2008, 23, 425–449. [Google Scholar] [CrossRef]
- Toffolo, M.B.; Brink, J.S.; van Huyssteen, C.; Berna, F. A microstratigraphic reevaluation of the Florisbad spring site, Free State Province, South Africa: Formation processes and paleoenvironment. Geoarchaeology 2017, 32, 456–478. [Google Scholar] [CrossRef]
- van Aardt, A.C.; Bousman, C.B.; Brink, J.S.; Brook, G.A.; Jacobs, Z.; du Preez, P.J.; Rossouw, L.; Scott, L. First chronological, palaeoenvironmental, and archaeological data from the Baden-Baden fossil spring complex in the western Free State, South Africa. In Changing Climates, Ecosystems and Environments within Arid Southern Africa and Adjoining Regions; Runge, J., Ed.; CRC Pree, Taylor & Francis Group: London, UK, 2015; p. 117. [Google Scholar]
- Hatswell, O.; Moffat, I.; Ames, C.J.H.; Shaw, M.; Saktura, R.; Phillips, N.; McNeil, J.-L.; Jones, B.G.; Mackay, A. Understanding the archaeology and depositional history of Klein Hoek 1, South Africa using geophysical geoarchaeology. Archaeological Prospection, in Review.
- Mackay, A.; Cartwright, C.R.; Heinrich, S.; Low, M.A.; Stahlschmidt, M.C.; Steele, T.E. Excavations at Klipfonteinrand Reveal Local and Regional Patterns of Adaptation and Interaction Through MIS 2 in Southern Africa. J. Paleolit. Archaeol. 2019, 3, 362–397. [Google Scholar] [CrossRef]
- Ames, C.J.H.; Gliganic, L.A.; Cordova, C.; Boyd, K.; Jones, B.G.; Maher, L.; Collins, B. Chronostratigraphy, site formation, and palaeoenvironmental context of Late Pleistocene and Holocene occupations at Grassridge Rock Shelter (Eastern Cape, South Africa). Open Quat. 2020, 6, 1–19. [Google Scholar] [CrossRef]
- Goldberg, P.; Miller, C.E.; Schiegl, S.; Ligouis, B.; Berna, F.; Conard, N.J.; Wadley, L. Bedding, hearths, and site maintenance in the Middle Stone age of Sibudu cave, KwaZulu-Natal, South Africa. Archaeol. Anthropol. Sci. 2009, 1, 95–122. [Google Scholar] [CrossRef]
- Williams, M. Formation Processes and Context of Complex Stratigraphic Features at the MSA Archaeological Sites of Pinnacle Point Site 5–6 and Mertenhof during MIS 3 in Southern Africa. Master’s Thesis, Centre for Archaeological Science (CAS), School of Earth, Atmospheric, and Life Sciences (SEALS), University of Wollongong, Wollongong, NSW, Australia, 2017. [Google Scholar]
- Miller, C.E.; Goldberg, P.; Berna, F. Geoarchaeological investigations at Diepkloof Rock Shelter, Western Cape, South Africa. J. Archaeol. Sci. 2013, 40, 3432–3452. [Google Scholar] [CrossRef]
- Shahack-Gross, R. Archaeological formation theory and geoarchaeology: State-of-the-art in 2016. J. Archaeol. Sci. 2017, 79, 36–43. [Google Scholar] [CrossRef]
- Low, M.A.; Mackay, A. The Organisation of Late Pleistocene Robberg Blade Technology in the Doring River Catchment, South Africa. J. Afr. Archaeol. 2018, 16, 168–192. [Google Scholar] [CrossRef]
- Shaw, M.; Ames, C.J.; Phillips, N.; Chambers, S.; Dosseto, A.; Douglas, M.; Goble, R.; Jacobs, Z.; Jones, B.; Lin, S.C.-H.; et al. The Doring River Archaeology Project: Approaching the Evolution of Human Land Use Patterns in the Western Cape, South Africa. PaleoAnthropology 2019, 400, 422. [Google Scholar]
- Watson, S.; Low, M.; Phillips, N.; O’Driscoll, C.; Shaw, M.; Ames, C.; Jacobs, Z.; Mackay, A. Robberg Material Procurement and Transport in the Doring River Catchment: Evidence from the Open-Air Locality of Uitspankraal 9, Western Cape, South Africa. J. Afr. Archaeol. 2020, 18, 209–228. [Google Scholar] [CrossRef]
- Jerardino, A. Large Shell Middens and Hunter-Gatherer Resource Intensification Along the West Coast of South Africa: The Elands Bay Case Study. J. Isl. Coast. Archaeol. 2012, 7, 76–101. [Google Scholar] [CrossRef]
- Kandel, A.W.; Conard, N. Settlement patterns during the Earlier and Middle Stone Age around Langebaan Lagoon, Western Cape (South Africa). Quat. Int. 2012, 270, 15–29. [Google Scholar] [CrossRef]
- Wiltshire, N. Spatial Analysis of Archaeological Sites in the Western Cape Using an Integrated Digital Archive. Master’s Thesis, University of Cape Town, Cape Town, South Africa, 2011. [Google Scholar]
- Hallinan, E. Stone Age Landscape Use in the Olifants River Valley, Western Cape. Master’s Thesis, Department of Archaeology, University of Cape Town, Cape Town, South Africa, 2013. [Google Scholar]
- Klein, R.G.; Avery, G.; Cruz-Uribe, K.; Halkett, D.; Parkington, J.E.; Steele, T.; Volman, T.P.; Yates, R. The Ysterfontein 1 Middle Stone Age site, South Africa, and early human exploitation of coastal resources. Proc. Natl. Acad. Sci. USA 2004, 101, 5708–5715. [Google Scholar] [CrossRef]
- Parkington, J.E. Palaeovegetation at the Last Glacial Maximum in the Western Cape, South Africa: Wood charcoal and pollen evidence from Elands Bay Cave. S. Afr. J. Sci. 2000, 96, 543–546. [Google Scholar]
- Parkington, J.E. Follow the San: An Analysis of Seasonality in the Prehistory of the South Western Cape. Ph.D. Thesis, University of Cambridge, Cambridge, UK, 1976. [Google Scholar]
- Parkington, J.E.; Nilssen, P.; Reeler, C.; Henshilwood, C. Making sense of space at Dunefield Midden campsite, Western Cape, South Africa. S. Afr. Field Archaeol. 1992, 1, 63–70. [Google Scholar]
- Sealy, J.C.; Merwe, N.J.v.d.; Hobson, K.A.; Horton, D.R.; Lewis, R.B.; Parkington, J.; Robertshaw, P.; Schwarcz, H.P. Isotope Assessment and the Seasonal-Mobility Hypothesis in the Southwestern Cape of South Africa [and Comments and Replies]. Curr. Anthropol. 1986, 27, 135–150. [Google Scholar] [CrossRef]
- Parkington, J.E.; Yates, R.; Manhire, A.; Halkett, D. The social impact of pastoralism in the southwestern Cape. J. Anthropol. Archaeol. 1986, 5, 313–329. [Google Scholar] [CrossRef]
- Manhire, A.H.; Parkington, J.E.; Mazel, A.D.; TM, O.C.M. Cattle, sheep and horses: A review of domestic animals in the rock art of southern Africa. Goodwin Ser. 1986, 5, 22–30. [Google Scholar] [CrossRef]
- Manhire, A.H. A report on the excavations at Faraoskop Rock Shelter in the Graafwater district of the south-western Cape. S. Afr. Field Archaeol. 1993, 2, 3–23. [Google Scholar]
- Manhire, A.H. Later Stone Age Settlement Patterns in the Sandveld of the South-Western Cape Province, South Africa; British Archaeological Reports Limited: Oxford, UK, 1987; Volume 351. [Google Scholar]
- Low, M.A.; Mackay, A.; Phillips, N. Understanding Early Later Stone Age technology at a landscape-scale: Evidence from the open-air locality Uitspankraal 7 (UPK7) in the Western Cape, South Africa. Azania Archaeol. Res. Afr. 2017, 52, 373–406. [Google Scholar] [CrossRef]
- Hallinan, E.; Shaw, M. A new Middle Stone Age industry in the Tankwa Karoo, Northern Cape Province, South Africa. Antiquity 2015, 89, f1–f6. [Google Scholar]
- Will, M.; Mackay, A.; Phillips, N. Implications of Nubian-Like Core Reduction Systems in Southern Africa for the Identification of Early Modern Human Dispersals. PLoS ONE 2015, 10, e0131824. [Google Scholar] [CrossRef]
- Bleed, P.; Douglass, M.; Sumner, A.; Behrendt, M.; Mackay, A. Photogrammetrical Assessment of Procedural Patterns and Sequential Structure in “Handaxe” Manufacture: A Case Study along the Doring River of South Africa. Lithic Technol. 2017, 42, 3–12. [Google Scholar] [CrossRef]
- Phillips, N.; Pargeter, J.; Low, M.; Mackay, A. Open-air preservation of miniaturised lithics: Experimental research in the Cederberg Mountains, southern Africa. Archaeol. Anthropol. Sci. 2019, 11, 5851–5877. [Google Scholar] [CrossRef]
- O’Driscoll, C.A.; Mackay, A. On the Operation of Retouch in Southern Africa’s Early Middle Stone Age. J. Paleolit. Archaeol. 2020, 3, 1149–1179. [Google Scholar] [CrossRef]
- Lin, S.C.; Douglass, M.J.; Mackay, A. Interpreting MIS3 artefact transport patterns in southern Africa using cortex ratios: An example from the Putslaagte valley, Western Cape. S. Afr. Archaeol. Bull. 2016, 71, 173. [Google Scholar]
- Low, M.A.; Mackay, A. The late Pleistocene microlithic at Putslaagte 8 rockshelter in the Western Cape, South Africa. S. Afr. Archaeol. Bull. 2016, 71, 146. [Google Scholar]
- Mackay, A. Potentially stylistic differences between backed artefacts from two nearby sites occupied ~60,000 years before present in South Africa. J. Anthropol. Archaeol. 2011, 30, 235–245. [Google Scholar] [CrossRef]
- Mackay, A. Report on Excavations at Klipfonteinrand 2011/12, V2; Australian National University: Canberra, Australia, 2012. [Google Scholar]
- Mackay, A.; Jacobs, Z.; Steele, T.E. Pleistocene archaeology and chronology of Putslaagte 8 (PL8) rockshelter, Western Cape, South Africa. J. Afr. Archaeol. 2015, 13, 71–98. [Google Scholar] [CrossRef]
- Will, M.; Mackay, A. What factors govern the procurement and use of silcrete during the Stone Age of South Africa? J. Archaeol. Sci. Rep. 2017, 15, 630–645. [Google Scholar] [CrossRef]
- Shaw, M. A Lithic Analysis of the Open-Air Site of Putslaagte 1: Variation in the Late Middle Stone Age Artefacts in an Open Site. Bachelor’s Thesis, Department of Archaeology, University of Cape Town, Cape Town, South Africa, 2013. [Google Scholar]
- Shaw, M. A Landscape Approach to the Surface Archaeology of the Bos River, Tankwa Karoo, Northern Cape; University of Cape Town: Cape Town, South Africa, 2017. [Google Scholar]
- Phillips, N. Out in the Open: A Geoarchaeological Approach to Open-Air Surface Archaeology in the Semi-Arid Interior of South Africa’s Western Cape. Ph.D. Thesis, Centre for Archaeological Science (CAS), School of Earth, Atmospheric, and Life Sciences (SEALS), University of Wollongong, Wollongong, NSW, Australia, 2021. Available online: https://ro.uow.edu.au/theses1/1375 (accessed on 12 December 2022).
- Davies, B.; Holdaway, S.J. Windows on the Past? Perspectives on Accumulation, Formation, and Significance from an Australian Holocene Lithic Landscape. Mitt. Ges. Urgesch. 2017, 26, 125. [Google Scholar]
- Jahn, R.; Blume, H.; Asio, V.; Spaargaren, O.; Schad, P. Guidelines for Soil Description; FAO: Rome, Italy, 2006. [Google Scholar]
- Coe, A.L. Geological Field Techniques; Blackwell Publishing Ltd.: Milton Keynes, UK, 2011. [Google Scholar]
- Schoeneberger, P.J.; Wysocki, D.A.; Benham, E.C. Field Book for Describing and Sampling Soils, Version 3.0; Natural Resources Conservation Service, National Soil Survey Center: Lincoln, NE, USA, 2012. [Google Scholar]
- Taylor, J. Computer programs for standardless quantitative analysis of minerals using the full powder diffraction profile. Powder Diffr. 1991, 6, 2–9. [Google Scholar] [CrossRef]
- Chandler, G.; Merry, C. The South African geoid 2010: SAGEOID10. Position IT 2010, 29–33. [Google Scholar]
- Shreve, R. Movement of water in glaciers. J. Glaciol. 1972, 11, 205–214. [Google Scholar] [CrossRef]
- Lane, S.N.; Richards, K.S. Linking river channel form and process: Time, space and causality revisited. Earth Surf. Process. Landf. J. Br. Geomorphol. Group 1997, 22, 249–260. [Google Scholar] [CrossRef]
- Dietrich, J. Agisoft Photoscan Crash Course (updated for version 1.1.6), in Advanced Geographic Research: Studying Environmental Geography with Fun Remote Sensing Tools. 24 June 2015. Available online: https://adv-geo-research.blogspot.com/2015/06/photoscan-crash-course-v1-1.html (accessed on 15 June 2019).
- Chambers, S.J.-R. Modelling Erosional Sensitivities of Archaeological Sites Using DEM’s from Low Altitude UAV Imagery. Bachelor’s Thesis, School of Earth and Environmental Sciences, University of Wollongong, Wollongong, NSW, Australia, 2019. [Google Scholar]
- Anders, N.; Valente, J.; Masselink, R.; Keesstra, S. Comparing Filtering Techniques for Removing Vegetation from UAV-Based Photogrammetric Point Clouds. Drones 2019, 3, 61. [Google Scholar] [CrossRef]
- Isenburg, M. LAStools—Efficient LiDAR Processing Software (Version 191018). rapidlasso GmbH: Gilching, Germany, 2019. [Google Scholar]
- Folk, R.L.; Ward, W.C. Brazos River bar [Texas]; a study in the significance of grain size parameters. J. Sediment. Res. 1957, 27, 3–26. [Google Scholar] [CrossRef]
- Cramer, M.D.; von Holdt, J.; Khomo, L.; Midgley, J.J. Evidence for aeolian origins of heuweltjies from buried gravel layers. S. Afr. J. Sci. 2016, 112, 1–10. [Google Scholar] [CrossRef] [PubMed]
- Midgley, J.; Harris, C.; Harington, A.; Potts, A. Geochemical perspective on origins and consequences of heuweltjie formation in the southwestern Cape, South Africa. S. Afr. J. Geol. 2012, 115, 577–588. [Google Scholar] [CrossRef]
- Potts, A.J.; Midgley, J.J.; Harris, C. Stable isotope and 14C study of biogenic calcrete in a termite mound, Western Cape, South Africa, and its palaeoenvironmental significance. Quat. Res. 2009, 72, 258–264. [Google Scholar] [CrossRef]
- Sadr, K. The Origins and Spread of Dry Laid, Stone-Walled Architecture in Pre-colonial Southern Africa. J. S. Afr. Stud. 2012, 38, 257–263. [Google Scholar] [CrossRef]
- McAuliffe, J.R.; Hoffman, M.T.; McFadden, L.D.; Bell, W.; Jack, S.; King, M.P.; Nixon, V. Landscape patterning created by the southern harvester termite, Microhodotermes viator: Spatial dispersion of colonies and alteration of soils. J. Arid Environ. 2019, 162, 26–34. [Google Scholar] [CrossRef]
- Bierman, P.R.; Montgomery, D.; Massey, C. Key concepts in geomorphology; a future-looking community-based textbook that builds on our past. Abstr. Programs-Geol. Soc. Am. 2013, 45, 577. [Google Scholar]
- May, J.-H. Source-Bordering Dune, in Encyclopedia of Planetary Landforms; Springer New York: New York, NY, USA, 2014; pp. 1–4. [Google Scholar]
- Bullard, J.E.; McTainsh, G.H. Aeolian-fluvial interactions in dryland environments: Examples, concepts and Australia case study. Prog. Phys. Geogr. 2003, 27, 471–501. [Google Scholar] [CrossRef]
- Dougill, A.J.; Thomas, A.D. Nebkha dunes in the Molopo Basin, South Africa and Botswana: Formation controls and their validity as indicators of soil degradation. J. Arid Environ. 2002, 50, 413–428. [Google Scholar] [CrossRef]
- Ravi, S.; Breshears, D.D.; Huxman, T.E.; D’Odorico, P. Land degradation in drylands: Interactions among hydrologic–aeolian erosion and vegetation dynamics. Geomorphology 2010, 116, 236–245. [Google Scholar] [CrossRef]
- Langford, R.P. Nabkha (coppice dune) fields of south-central New Mexico, U.S.A. J. Arid Environ. 2000, 46, 25–41. [Google Scholar] [CrossRef]
- Marzen, M.; Iserloh, T.; Fister, W.; Seeger, M.; Rodrigo-Comino, J.; Ries, J.B. On-site water and wind erosion experiments reveal relative impact on total soil erosion. Geosciences 2019, 9, 478. [Google Scholar] [CrossRef]
- Schick, K.D. Modeling the formation of Early Stone Age artifact concentrations. J. Hum. Evol. 1987, 16, 789–807. [Google Scholar] [CrossRef]
- Ozán, I.L. Gravity and the formation of the archaeological record: Main concepts and methodological tools. Geoarchaeology 2017, 32, 646–661. [Google Scholar] [CrossRef]
- Lenoble, A.; Bertran, P. Fabric of Palaeolithic levels: Methods and implications for site formation processes. J. Archaeol. Sci. 2004, 31, 457–469. [Google Scholar] [CrossRef]
- Behm, J.A. An Examination of the Effects of Slope Wash on Primary Deposits of Chipping Debris: A Reply to Baumler. Lithic Technol. 1985, 14, 126–129. [Google Scholar] [CrossRef]
- Ries, J.; Andres, K.; Wirtz, S.; Tumbrink, J.; Wilms, T.; Peter, K.; Burczyk, M.; Butzen, V.; Seeger, M. Sheep and goat erosion–experimental geomorphology as an approach for the quantification of underestimated processes. Z. Geomorphol. 2014, 58, 023–045. [Google Scholar] [CrossRef]
Figure 1.
Percentage and number of chronometrically dated cave/rock shelters and open-air contexts included in the SALSA sequence for each Stone Age. A site–type category could not be allocated to six localities (all of which are dated to the LSA) and were excluded from this graph. Data sourced from [11]: pp. 128–140, Appendix A.

Figure 2.
A nested map series of the Doring River Catchment (top left) and Valley (bottom left) showing the location of rock shelter and open-air archaeological sites in relation to south Africa (top left map inset), an aerial view of the location of UPK7 at the Doring–Biedouw River confluence alongside its most proximate sediment stacks (A), and an aerial of UPK7, its survey units, sampling locations, published OSL ages, survey marks, and western (WT) and eastern (ET) tributaries (B).

Figure 3.
Map of the spatial distribution of individual artefact point locations recorded across the sediment stack of UPK7, within the randomized non-geometric survey area (RNG; 2019; orange dash), and in relation to the 2015–2017 random sample square units (rSSQ; black squares), targeted survey areas (20214–2015; black dash), the location of each sedimentary unit, and designated exposure zone.

Figure 4.
Map series showing (A) the 2019 orthomosaic, (B) final DTM, (C) hill shade, and (D) vegetation crown height outputs.
Figure 4.
Map series showing (A) the 2019 orthomosaic, (B) final DTM, (C) hill shade, and (D) vegetation crown height outputs.

Figure 5.
Three stage workflow involved in DTM creation for UPK7. Abbreviations: GCP = ground control point.
Figure 5.
Three stage workflow involved in DTM creation for UPK7. Abbreviations: GCP = ground control point.

Figure 6.
Topographic map of UPK7 showing crown height raster (based on filtered canopy cover from the 2019 DSM) and manually traced vegetation as well as slope angles (0–8°, 9–15°, >15°) within each exposure calculated using the hydrologically corrected 2019 DTM. These features are depicted against 1 m interval topographic contours. Rills pertain to Strahler classes 2 to 5 and are only shown within exposures to reduce surface noise and isolate out shallow, moderate, and well-developed rills within each area. The area outlined with a rectangle (black dash) marks the location of the photograph shown in Figure 24.

Figure 7.
The horizontal extent of exposed sedimentary units across UPK7 showing the location and unit number of each rSSQ (blue squares), exposure numbers, elevation, hydrological features, the location of the circular stone features to the southeast of the Eastern Tributary, the location and orientation of ERT lines 1 and 2 (black dashed lines), and the surface profile line from A to D (blue dashed line) depicted in profile in Figure 8 (below). The orange dashed line indicates the extent of the DRAP 2019 (RNG) archaeological survey. The central rectangular inset labelled ‘i’ marks the location of aerial photo shown in Figure 9 (i). For sediment sample locations see [59] Appendix 4, Figure A4.0.1.

Figure 8.
The vertical depiction of the surface profile line (shown in Figure 7 (above) as a blue dashed line) facing downriver (northwest) shows the topography and horizontal extent of exposed sedimentary units observed across UPK7, between A and D. The surface profile (b) also shows proximate sediment sample locations, and their associated sample ID/OSL laboratory IDs, collected along or close to the transect, and the location of consolidated sediment exposures, 1b and 3. Note transect orientation shifts from a north–south bearing to a north–east to south–west bearing between B and D (see Figure 7 above).

Figure 9.
Photographs of an eroding sediment mound in the south-western slope (Exposure 1a) of UPK7 (see Figure 7, inset ‘i’), depicting two views: aerial view ((i), north is at top of frame) and ground view ((ii), facing east).
Figure 9.
Photographs of an eroding sediment mound in the south-western slope (Exposure 1a) of UPK7 (see Figure 7, inset ‘i’), depicting two views: aerial view ((i), north is at top of frame) and ground view ((ii), facing east).

Figure 10.
Circular stone ruins to the immediate east of the eastern tributary and at UPK9 (red notebook for scale: ~190 mm in length); see Figure 7 ‘circular stone features’ for the area in which they are located. These are possible deflated remnants of historic herder huts or small kraal, called ‘lammerhok’, used in the nineteenth and early twentieth century before the widespread use of fencing and the Fencing Act 1883.

Figure 11.
Photos of the exposed western bank of the eastern tributary showing the Palaeoterrace (A) and a close-up of its profile (B), exposed above bedrock and below the vegetated sands of the sediment stack. Photo (A) taken in the eastern tributary looking northwest, west of the circular stone structures shown in Figure 7.

Figure 12.
A possible heuweltjie is exposed on the consolidated sediment.

Figure 13.
Northeast-facing photograph of Exposure 6, a residual island of consolidated sediment separated from the main sand mantle and surrounded on all but its south side with colluvium (see Figure 5). Note the heuweltjie in the background (dashed line). Aurore Val (height: 1.65 m) stands to the left of three OSL sample locations (see [59] Appendix 4.1.4 for details).

Figure 14.
Aerial photo from 2016 UAV survey footage of Exposure 1b’s middle zone, showing channelling of artefacts into a network of shallow to deeply incised rills.
Figure 14.
Aerial photo from 2016 UAV survey footage of Exposure 1b’s middle zone, showing channelling of artefacts into a network of shallow to deeply incised rills.

Figure 15.
Grain size distributions for alluvium (a), semi- and unconsolidated sand samples (b), upper yellow and indurated sand (c), and lower red sediment samples (d) collected at or adjacent to UPK7. Within each unit sediment samples are listed by their unique identifier, section cut number, and/or OSL laboratory UOW number (if applicable). For sediment sample locations see [59] Appendix 4, Figure A4.0.1.

Figure 16.
Photo showing the consolidated surface of Exposure 2 sparsely covered by vegetation, densely covered by artefacts, and surrounded by the slip face of UCS. Facing: (A) southeast, (B) northwest with OSL Cut 10 in the foreground, (C) north with the eastern tributary cutting across the midground with OSL Cut 10 in the foreground.

Figure 17.
Profile photo of Section Cut 1, showing visible sampling locations and their sediment sample IDs. Eight samples were collected from 0.1 to 3.5 m below the surface (bls) in 0.5 m intervals. The auger was used to sample from the surface pictured in the foreground.
Figure 17.
Profile photo of Section Cut 1, showing visible sampling locations and their sediment sample IDs. Eight samples were collected from 0.1 to 3.5 m below the surface (bls) in 0.5 m intervals. The auger was used to sample from the surface pictured in the foreground.

Figure 18.
Profile (A) and top-down (B) view of the sampling Section 9 (or ‘OSL cut 9′) located in exposure 1b, and sampled for sediment and OSL dating 0.26 m below the exposed surface (bls) of Exposure 1b’s southern gully.
Figure 18.
Profile (A) and top-down (B) view of the sampling Section 9 (or ‘OSL cut 9′) located in exposure 1b, and sampled for sediment and OSL dating 0.26 m below the exposed surface (bls) of Exposure 1b’s southern gully.

Figure 19.
Profile photo of Section cut 3 and the location of sediment sample no. 90020 and OSL sample UOW-1802 (A), sampled 0.25 m below the exposed surface of Exposure 1b’s southern gully. Photo (B) shows a close-up of the finely laminated sediment sampled with tube no. 90020.
Figure 19.
Profile photo of Section cut 3 and the location of sediment sample no. 90020 and OSL sample UOW-1802 (A), sampled 0.25 m below the exposed surface of Exposure 1b’s southern gully. Photo (B) shows a close-up of the finely laminated sediment sampled with tube no. 90020.

Figure 20.
Four scatter plots showing (a) the percentages of sand (blue circles) and silt (green squares), (b) the mean (blue circles) and mode 1 (green squares) grain size (µm), (c) sorting (phi), and (d) the percentage of quartz (blue circles), feldspar (green squares), and clay (green triangles) minerals plotted as a function of stratigraphic level. The stratigraphic levels pertain to the youngest to the oldest stratigraphic unit (i.e., Alluvium, UCS, SCS, IS, UY, LR-LRcc, and colluvium; see Table 1).

Figure 21.
Stratigraphic results of two ERT profiles, Lines 1 and 2. See Figure 7 for the location and orientation of each ERT line across UPK7. The surface topography is based on the 2019 DTM.
Figure 21.
Stratigraphic results of two ERT profiles, Lines 1 and 2. See Figure 7 for the location and orientation of each ERT line across UPK7. The surface topography is based on the 2019 DTM.

Figure 22.
Aeolian activity in the Doring River valley: (A) View northwest from UPK9 depicting high westerly winds entraining sand from the channel and surrounding hillslope across UPK1 towards UPK7. The unconsolidated sand on the east side of UPK7 forms the first ridge. (B) Colluvium at UPK7 is separated by the Western Tributary from the unconsolidated sand dune farther west. It demonstrates the strength of the wind in this valley and the importance of topographic position, source availability, and timing of the source’s exposure relative to the dominant wind regime.

Figure 23.
Photograph (facing southwest) of a historic stone hearth at UPK9 built on the Indurated Orange Sand (~27 ka; [31]) that has eroded down to expose an underlying colluvium (A), and the pedestalled foundations of a historic stone hearth at Lungkaal (facing west; NP for scale; (B)).
Figure 23.
Photograph (facing southwest) of a historic stone hearth at UPK9 built on the Indurated Orange Sand (~27 ka; [31]) that has eroded down to expose an underlying colluvium (A), and the pedestalled foundations of a historic stone hearth at Lungkaal (facing west; NP for scale; (B)).

Figure 24.
Zones of erosion and deposition on the northern side of UPK7 where rills mainly drain into the Western Tributary. See Figure 6 for reference location (black dashed box).
Figure 24.
Zones of erosion and deposition on the northern side of UPK7 where rills mainly drain into the Western Tributary. See Figure 6 for reference location (black dashed box).


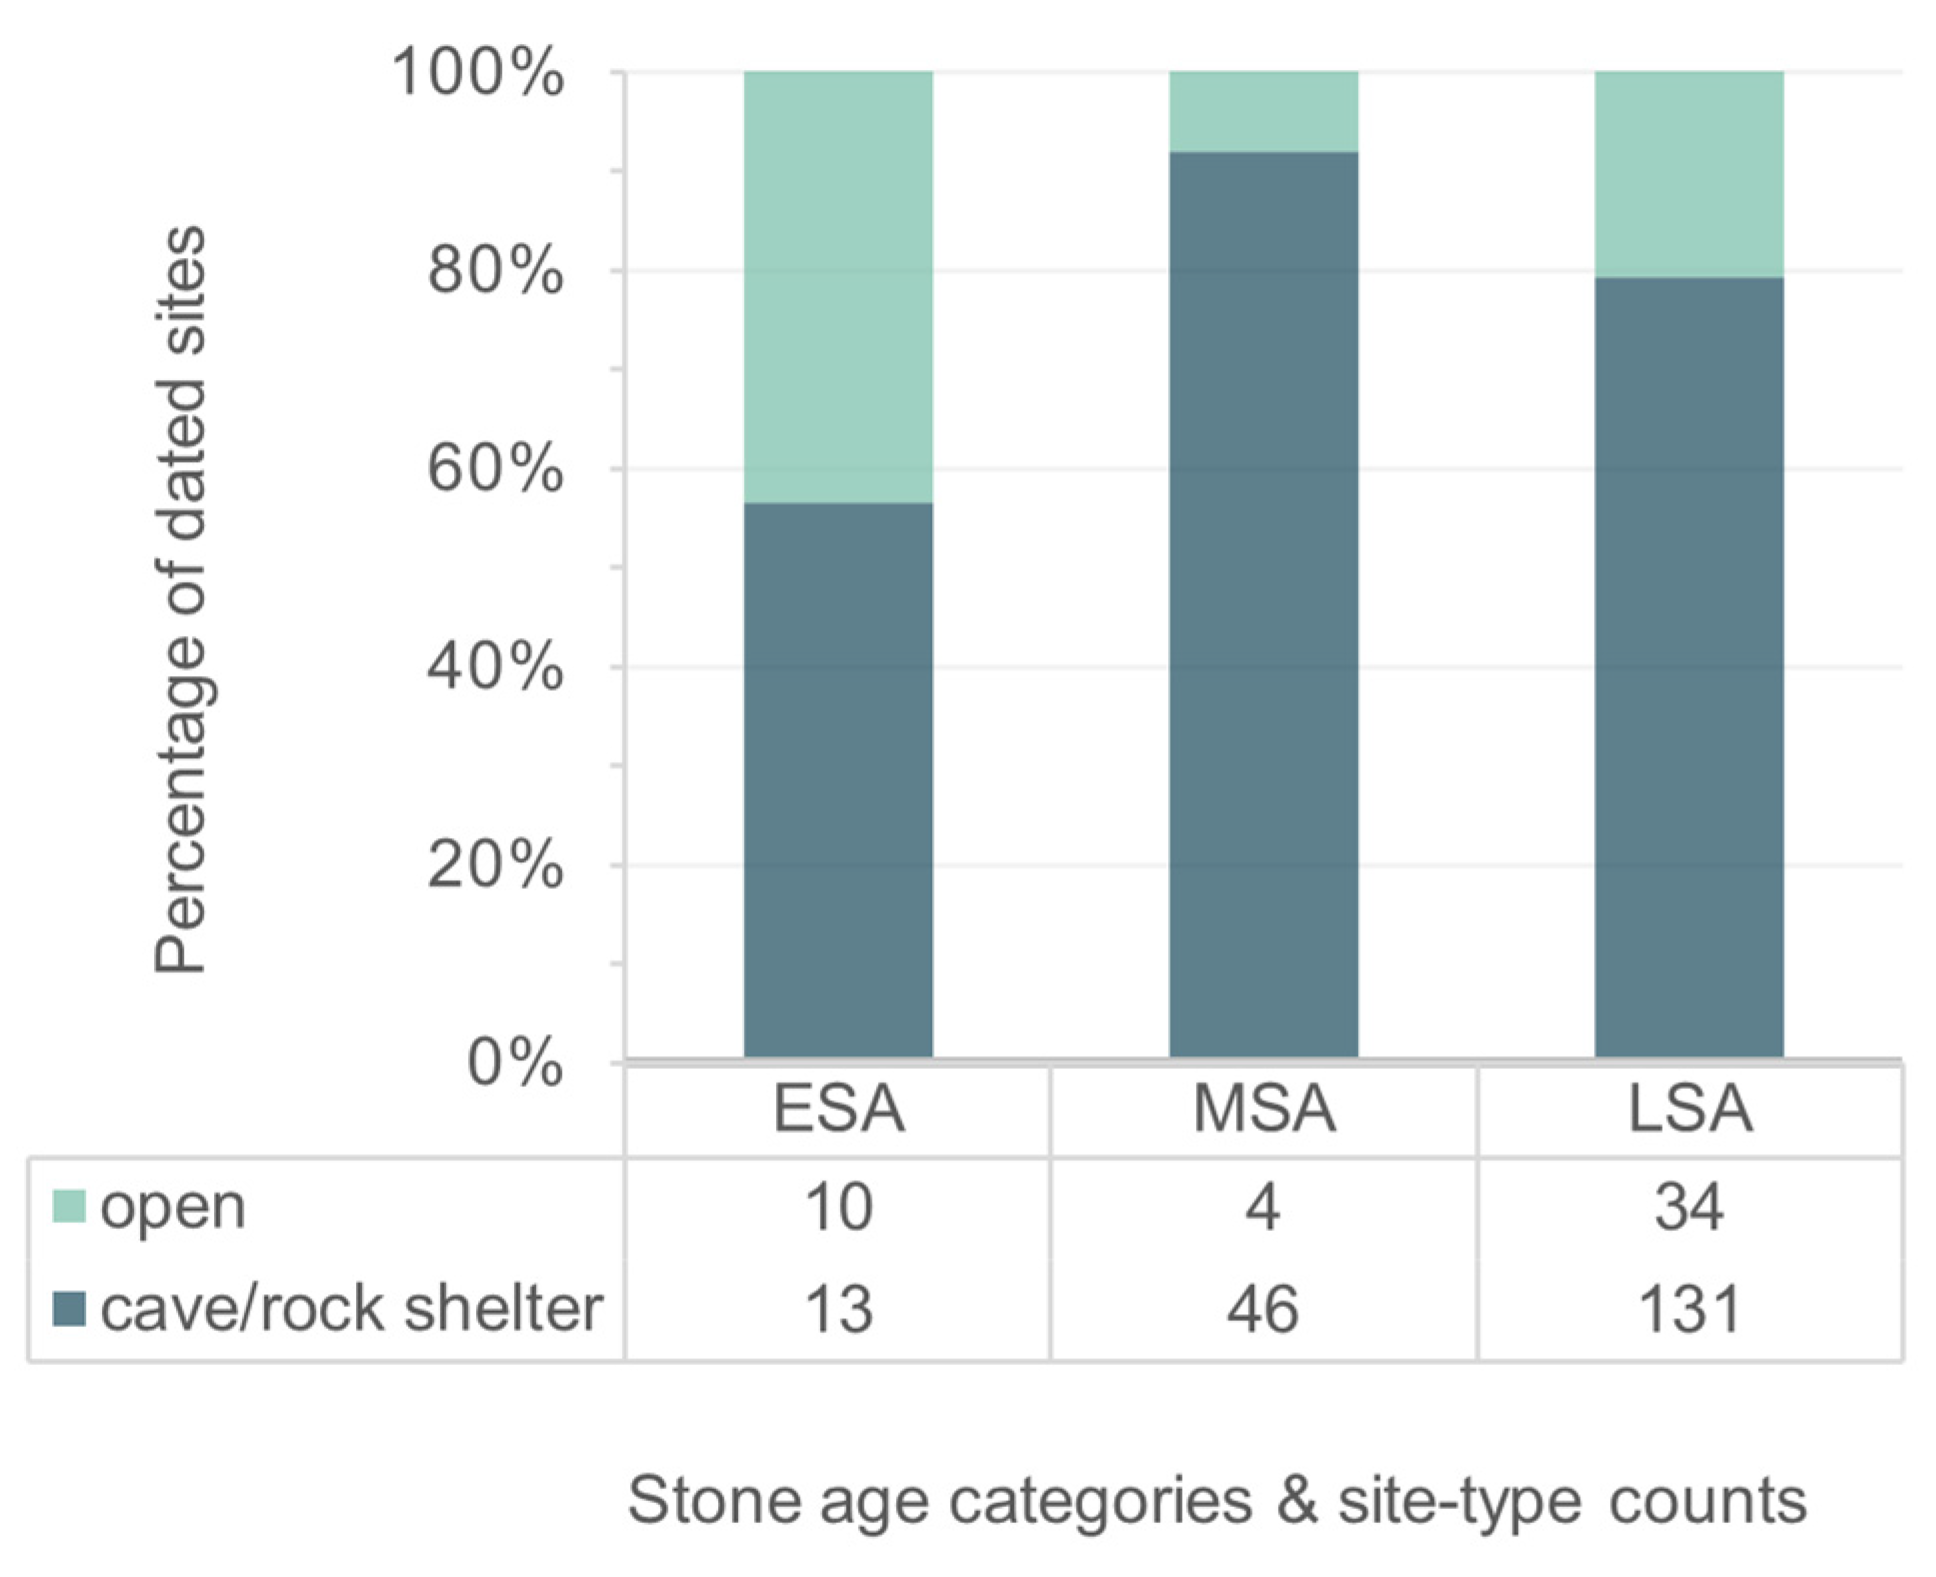
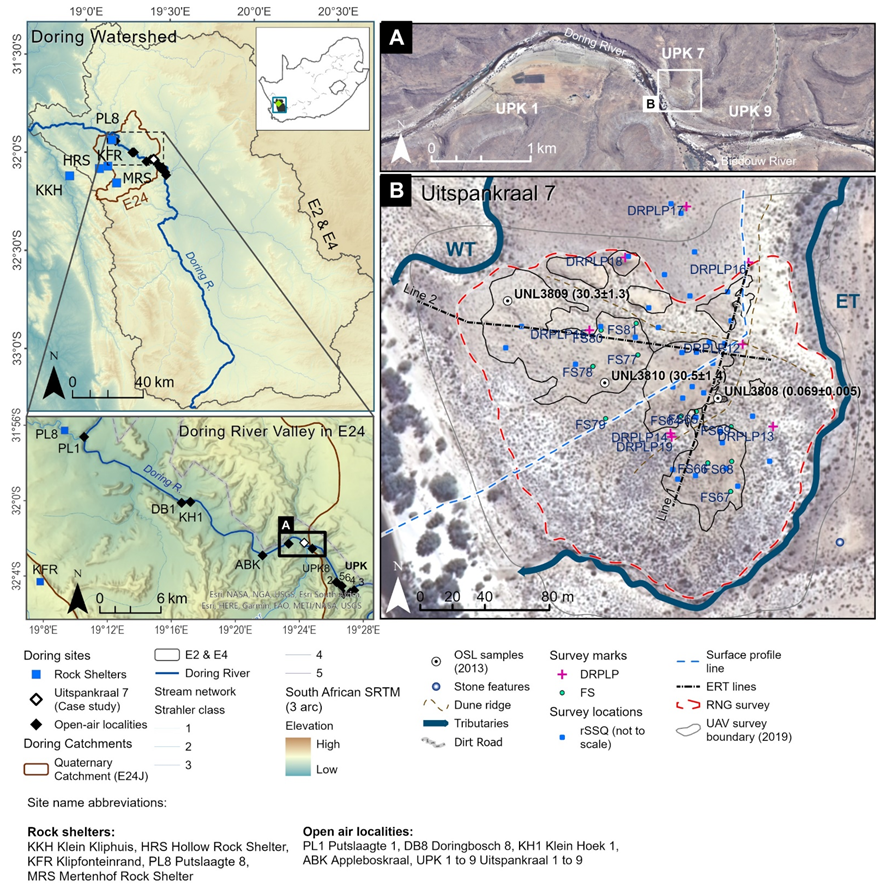
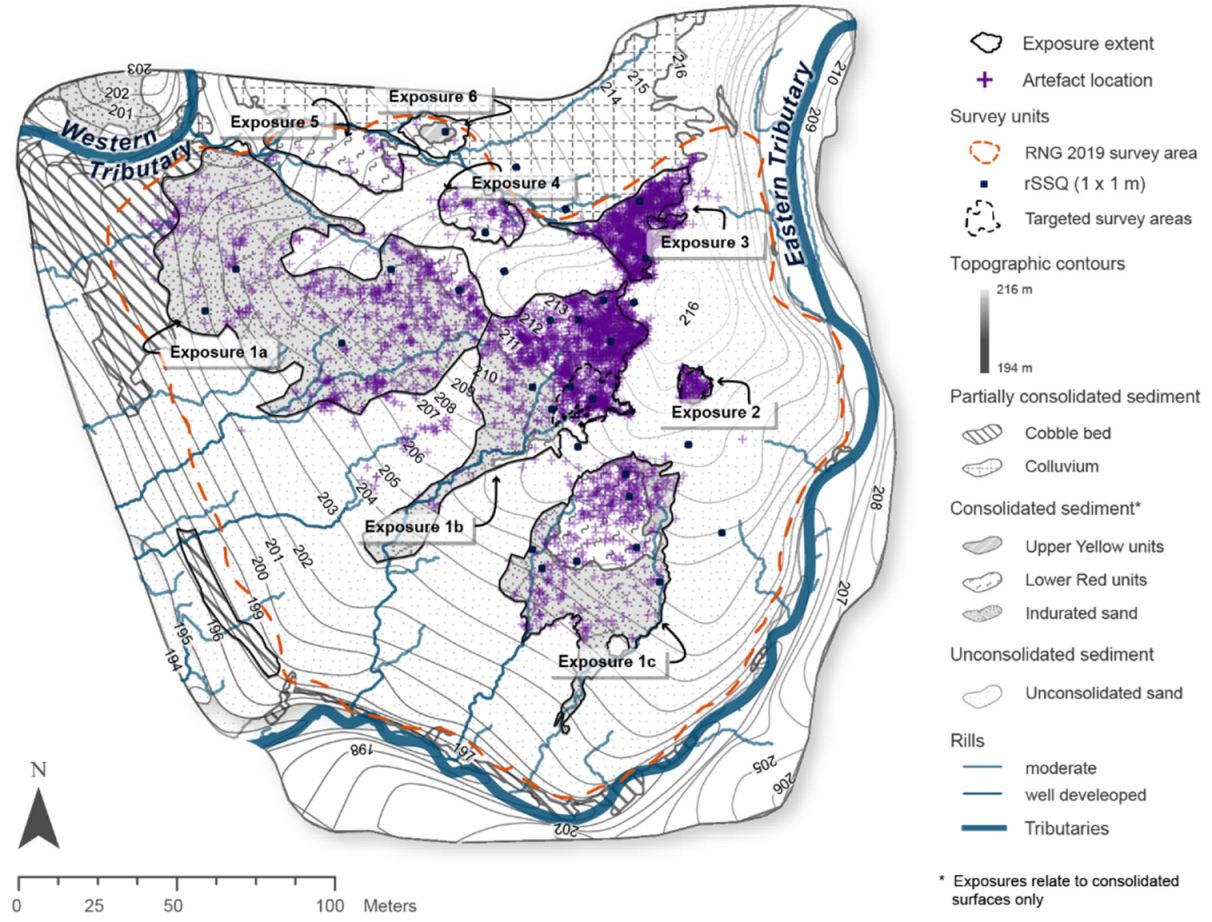
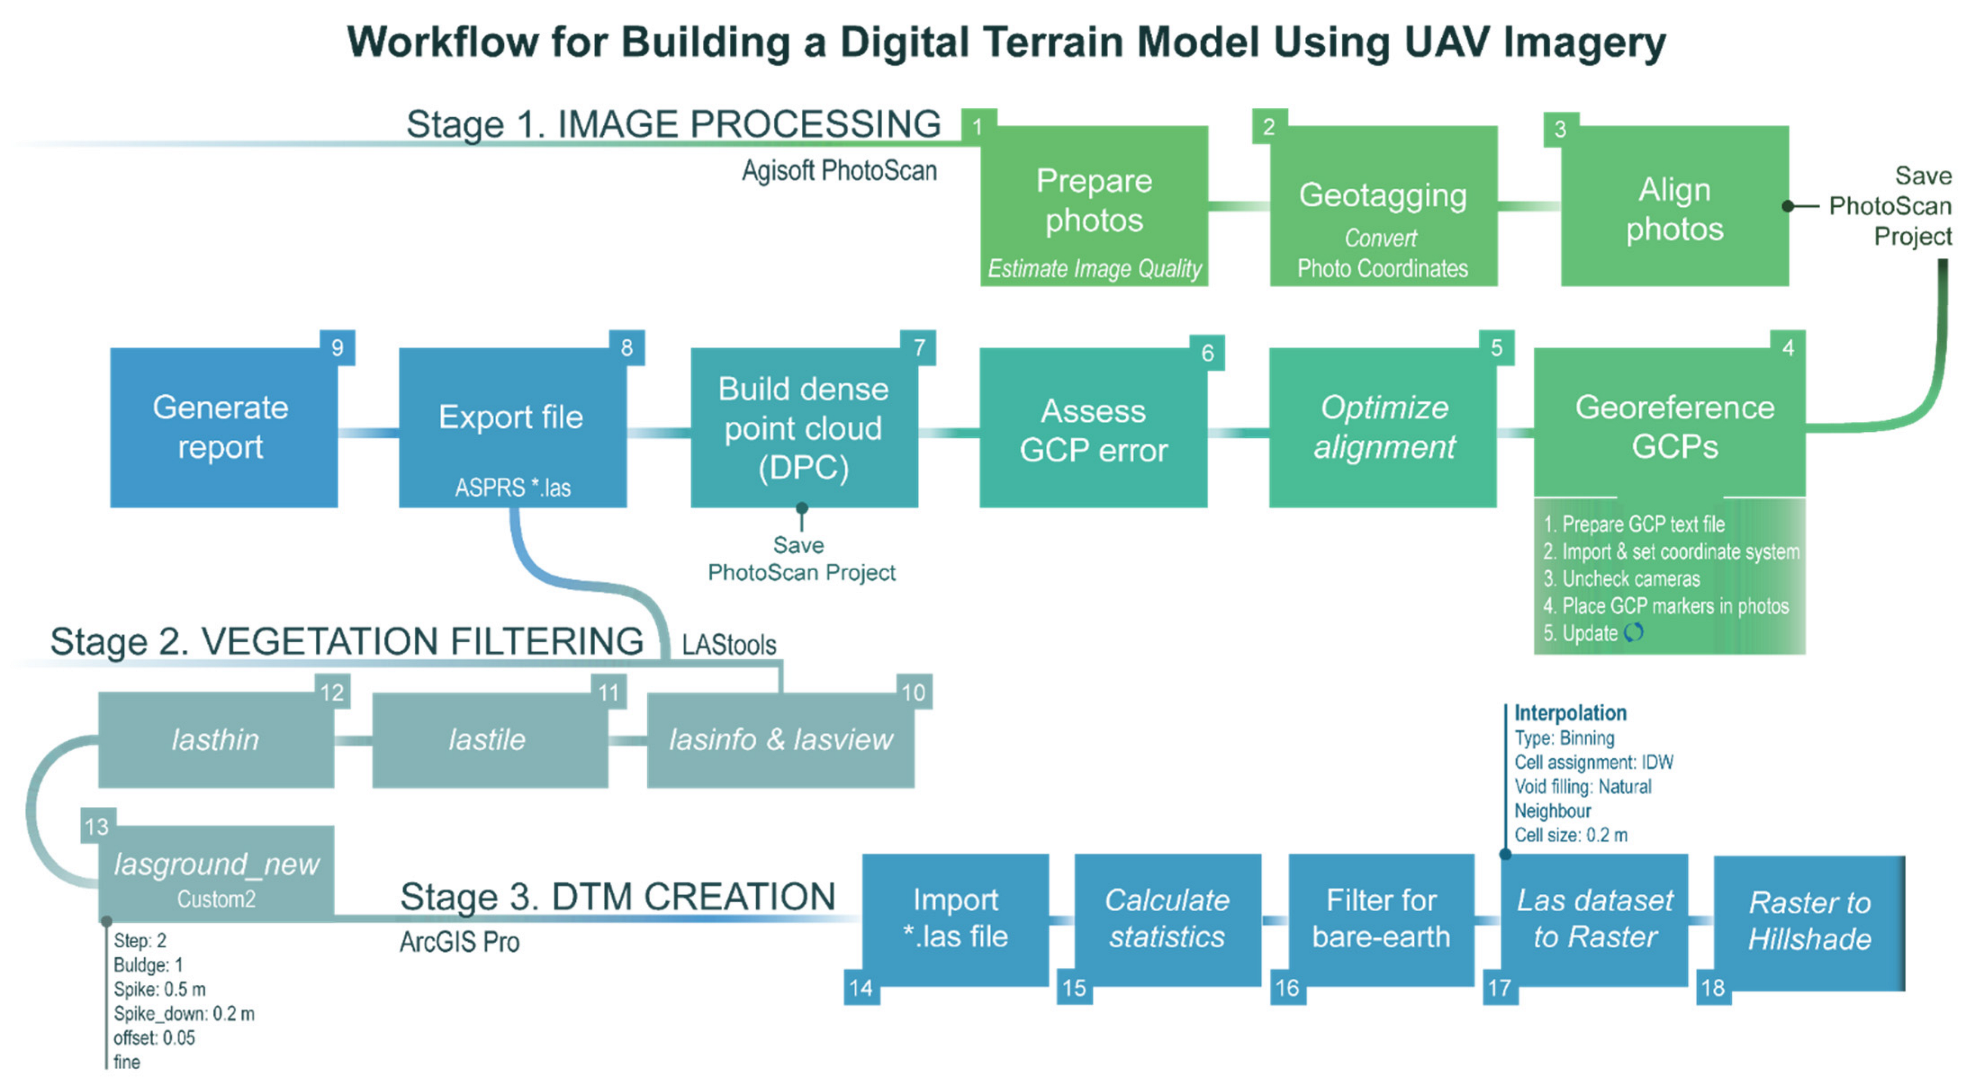
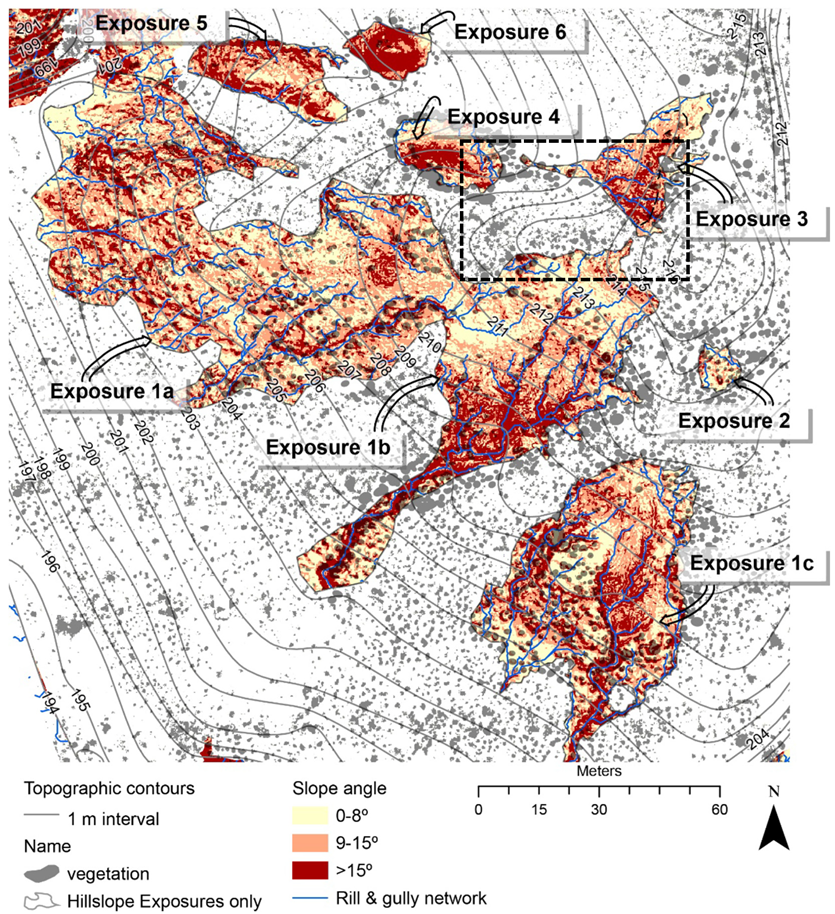
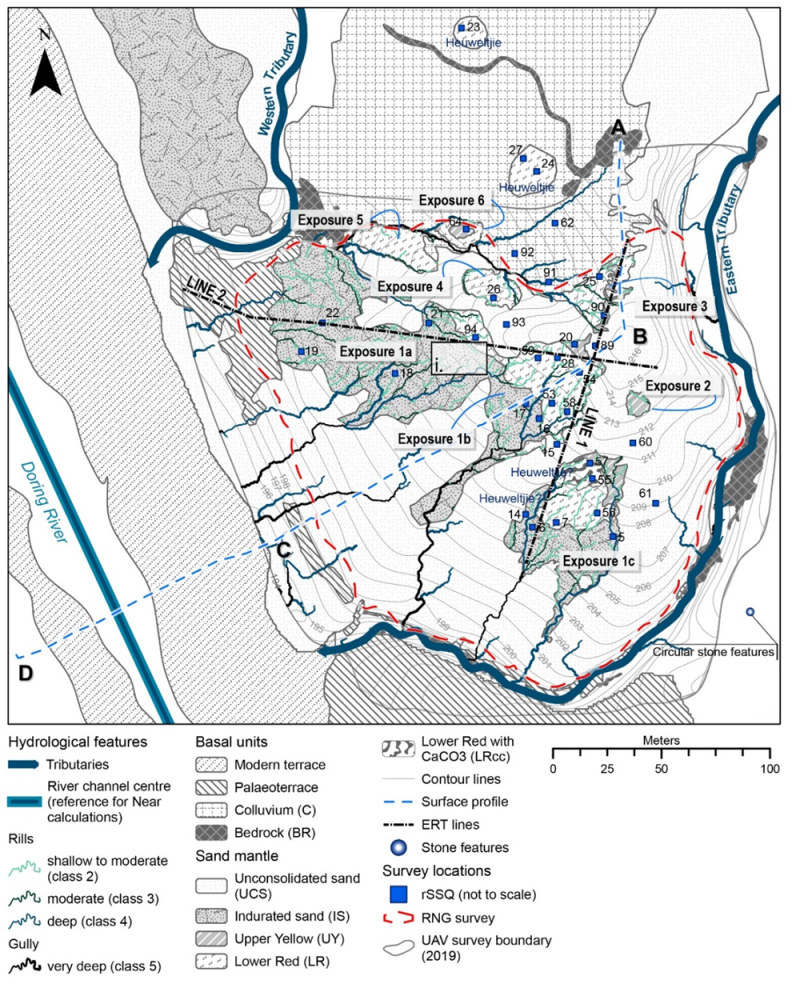
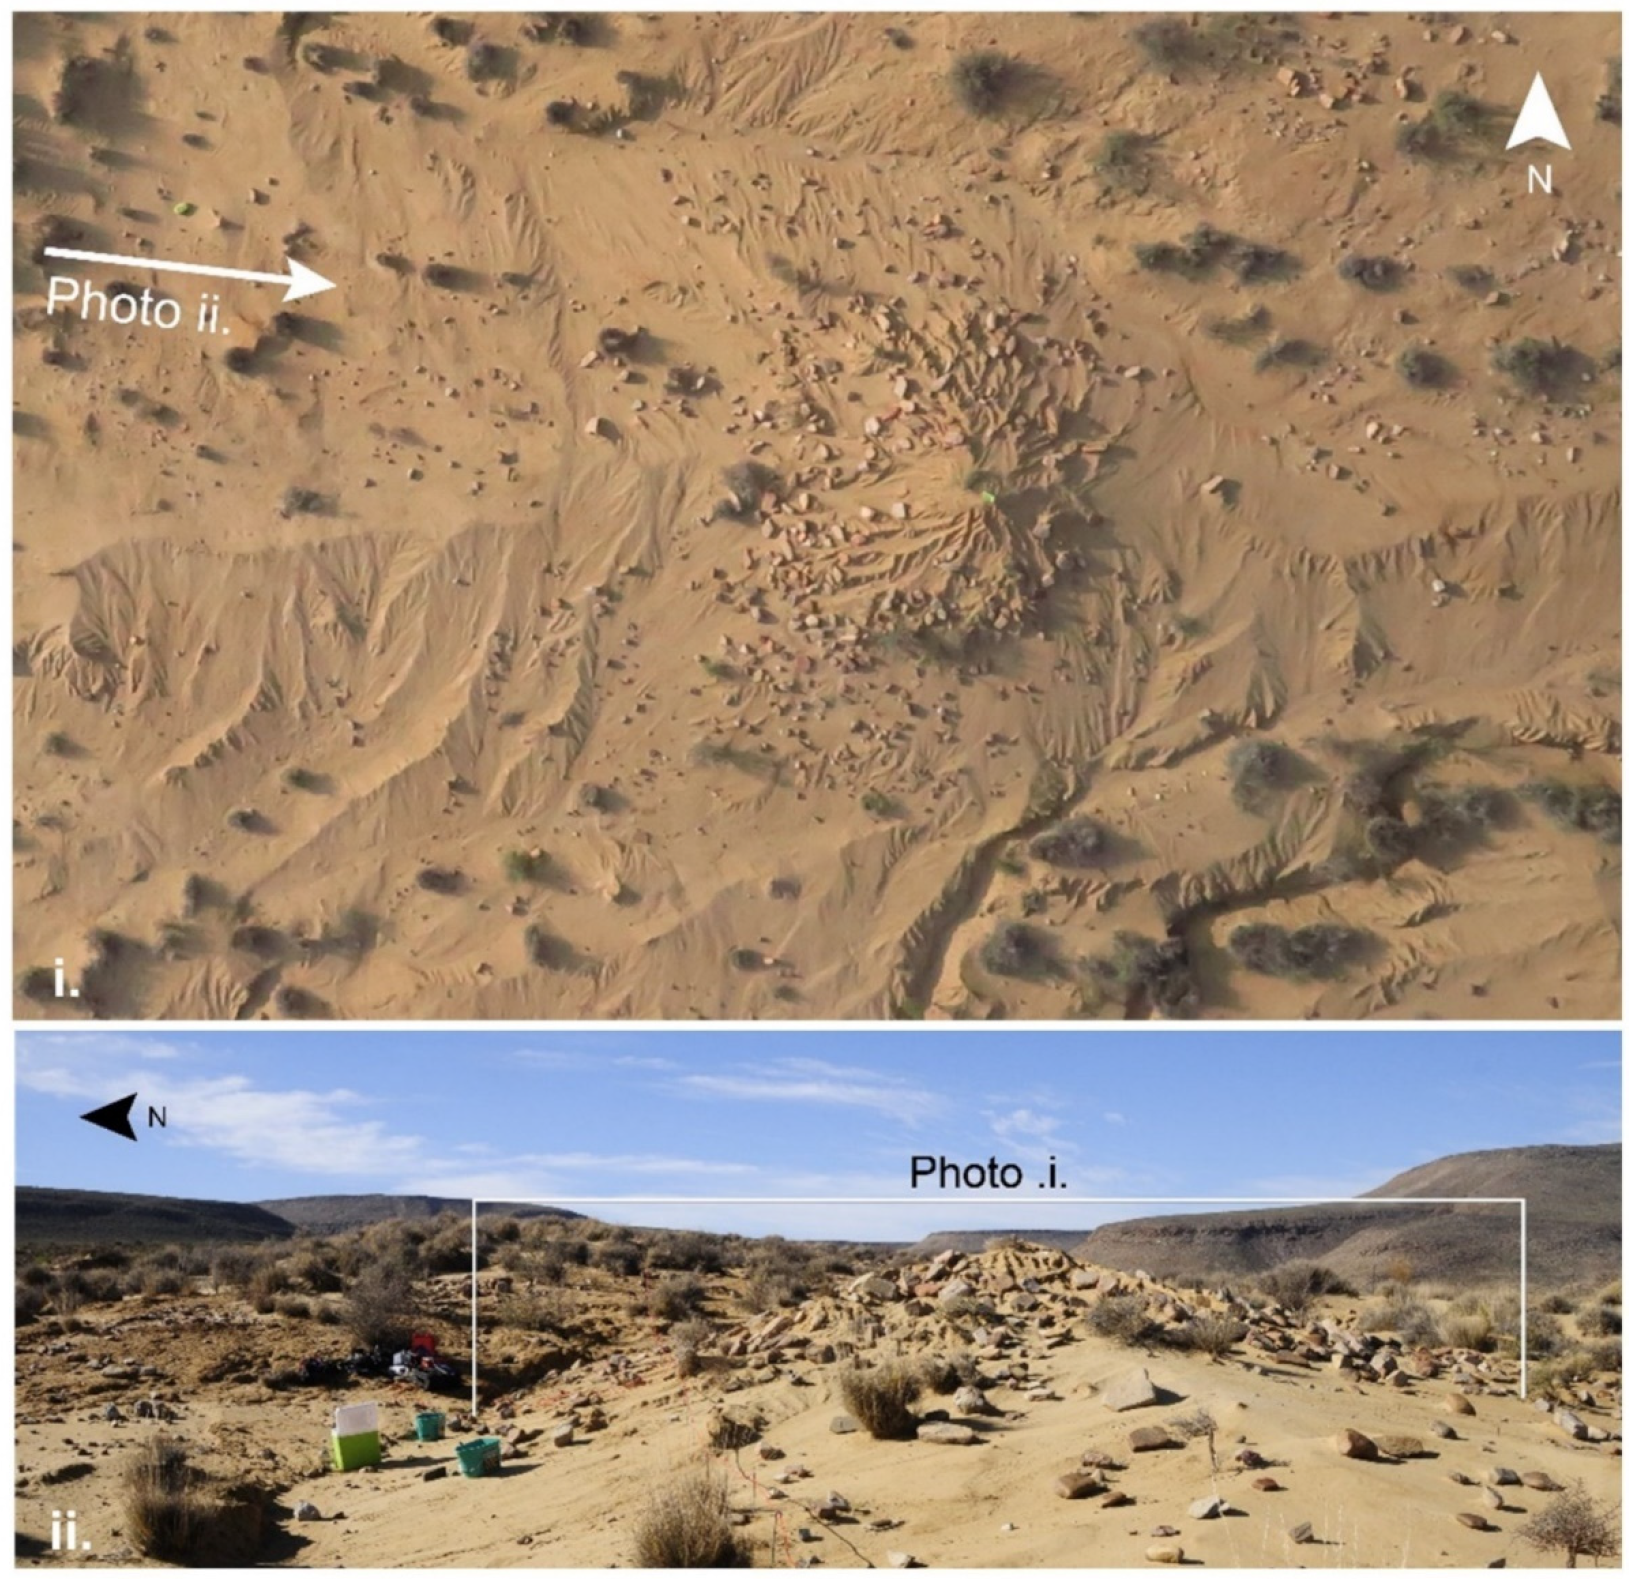
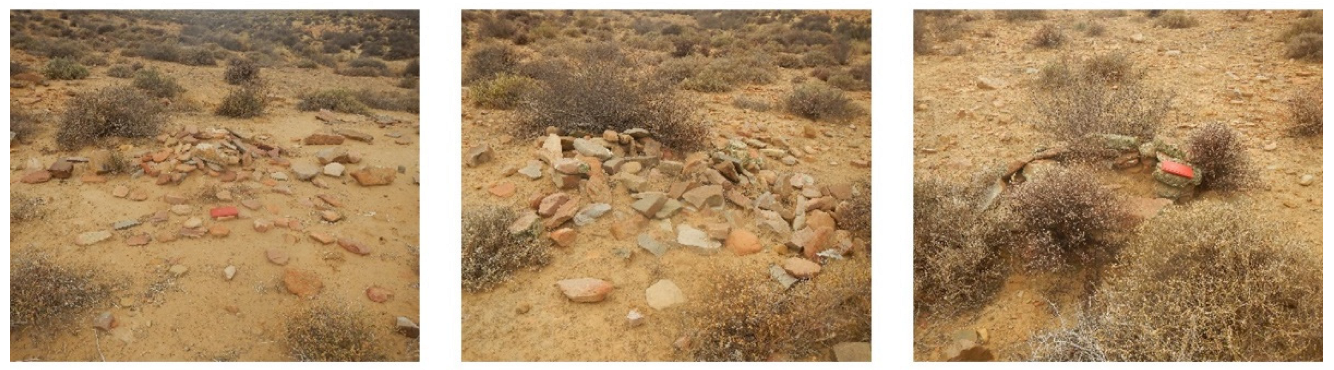
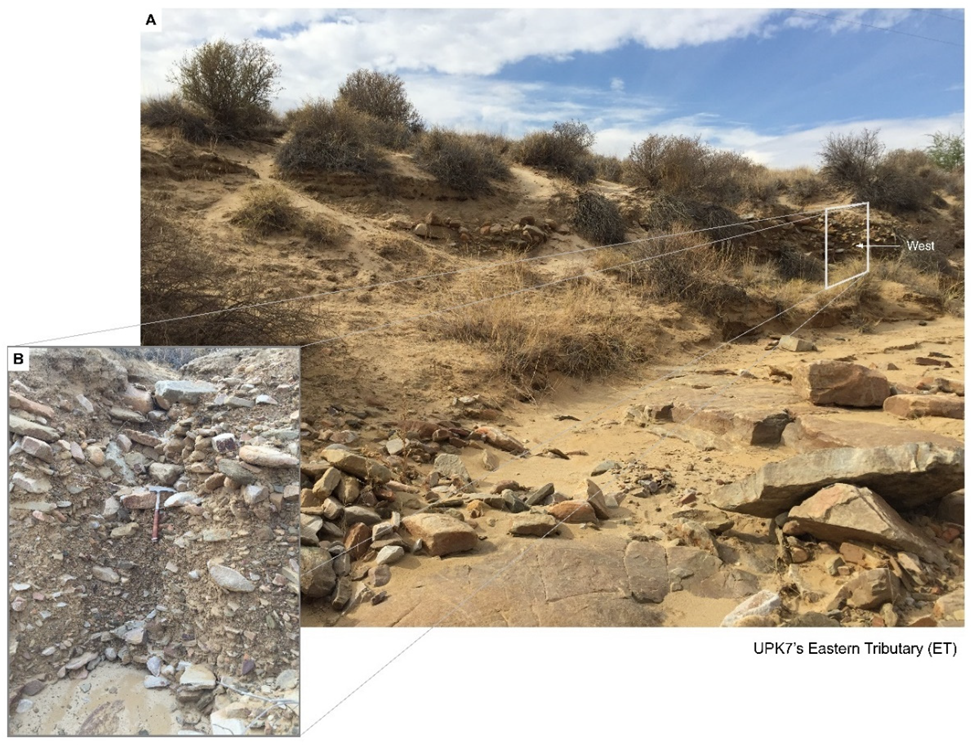
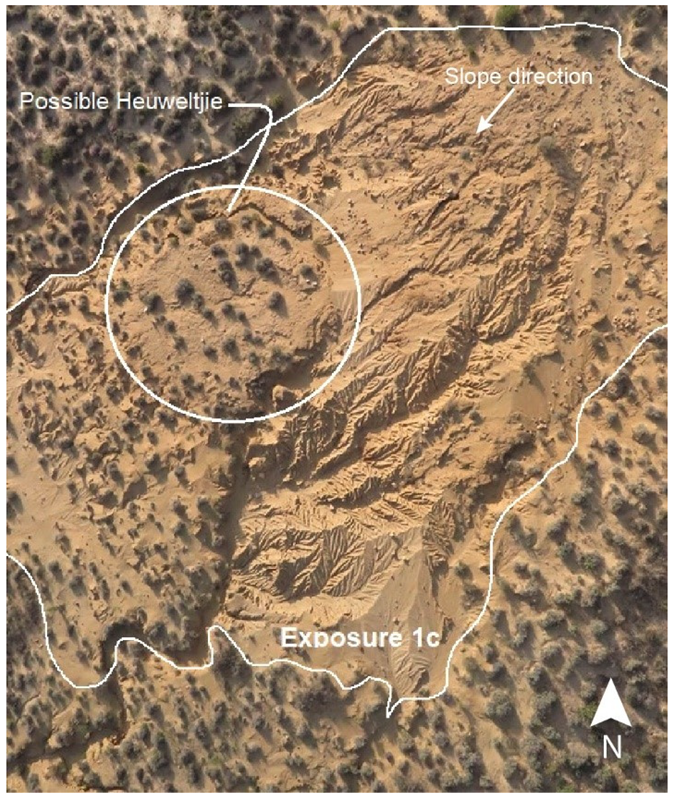
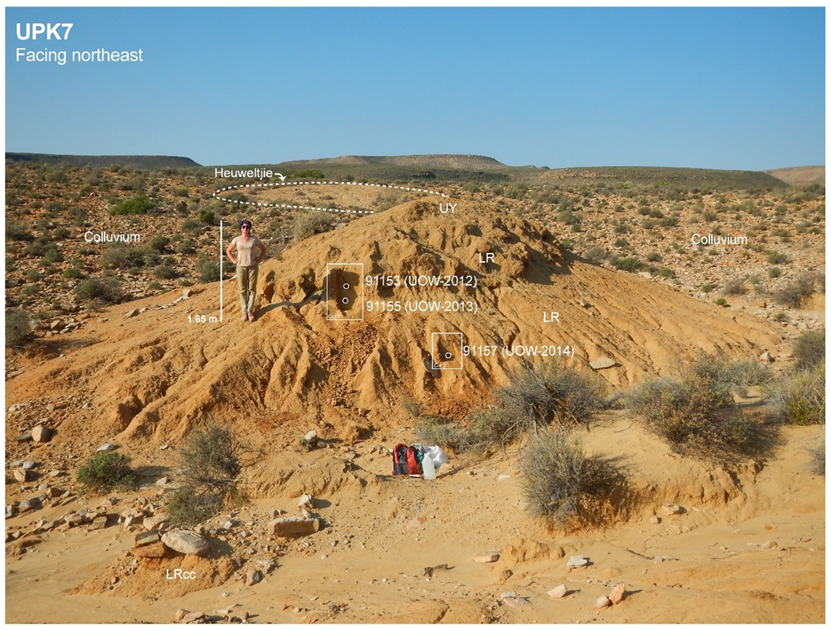
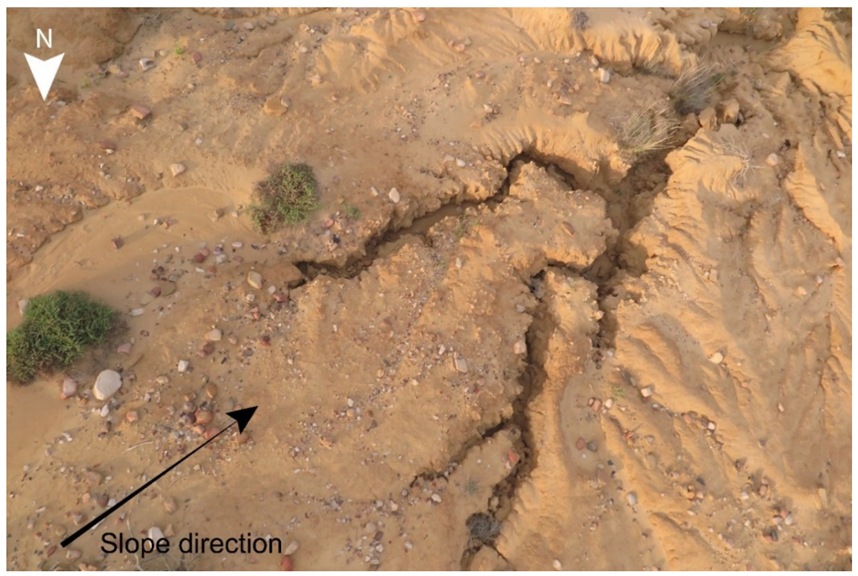
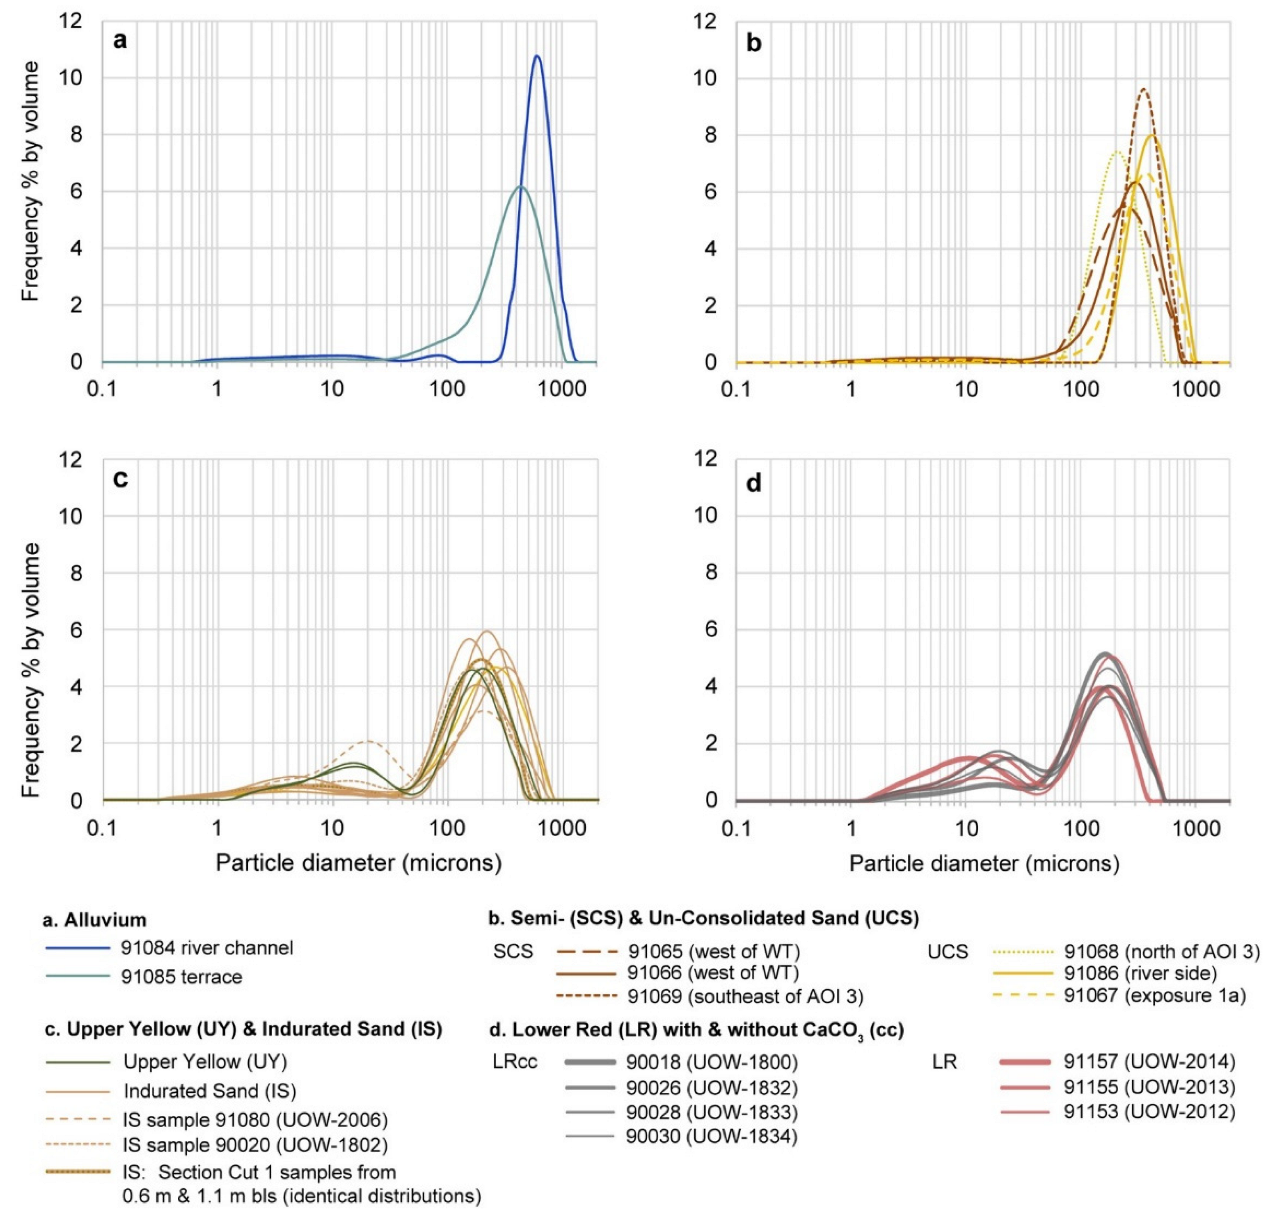
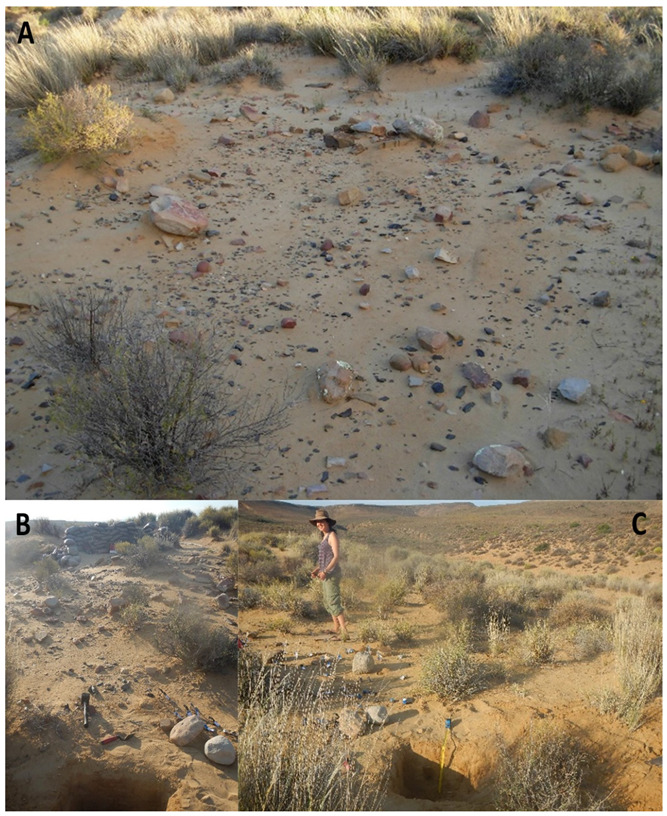
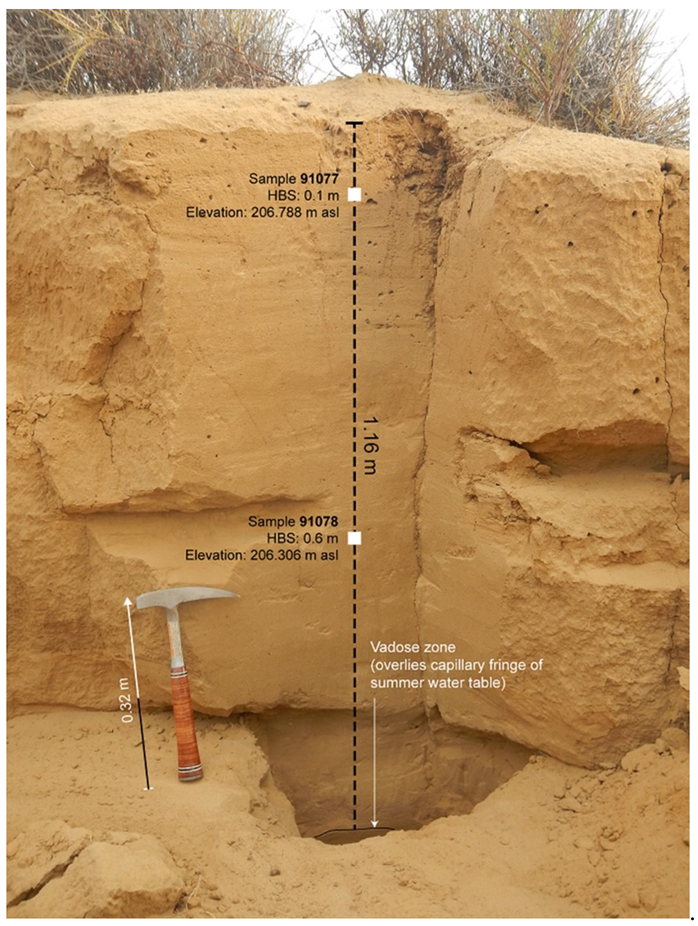
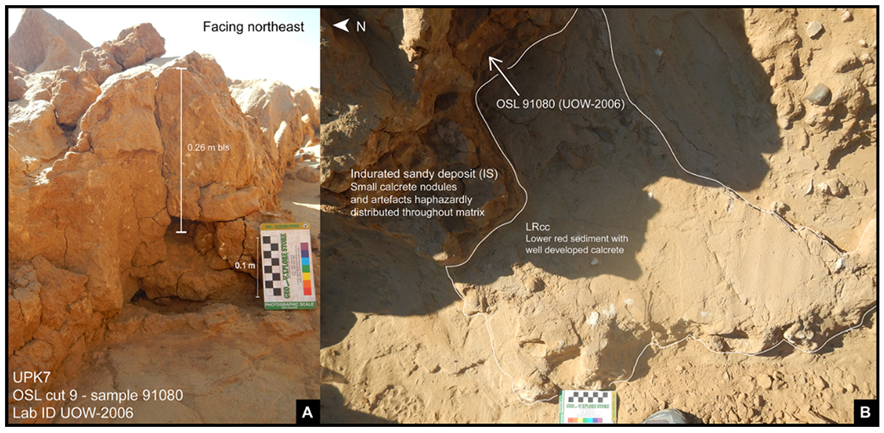
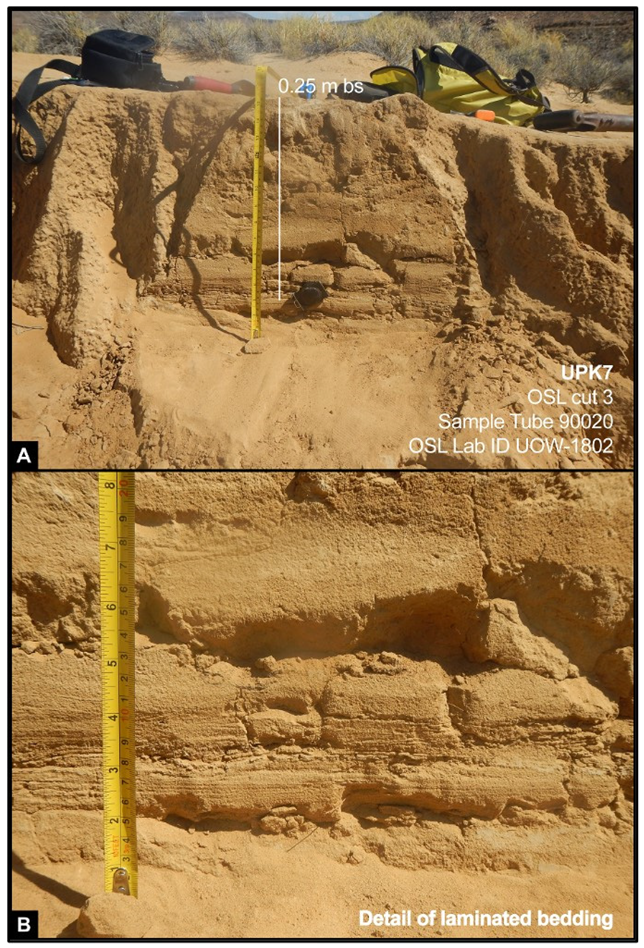
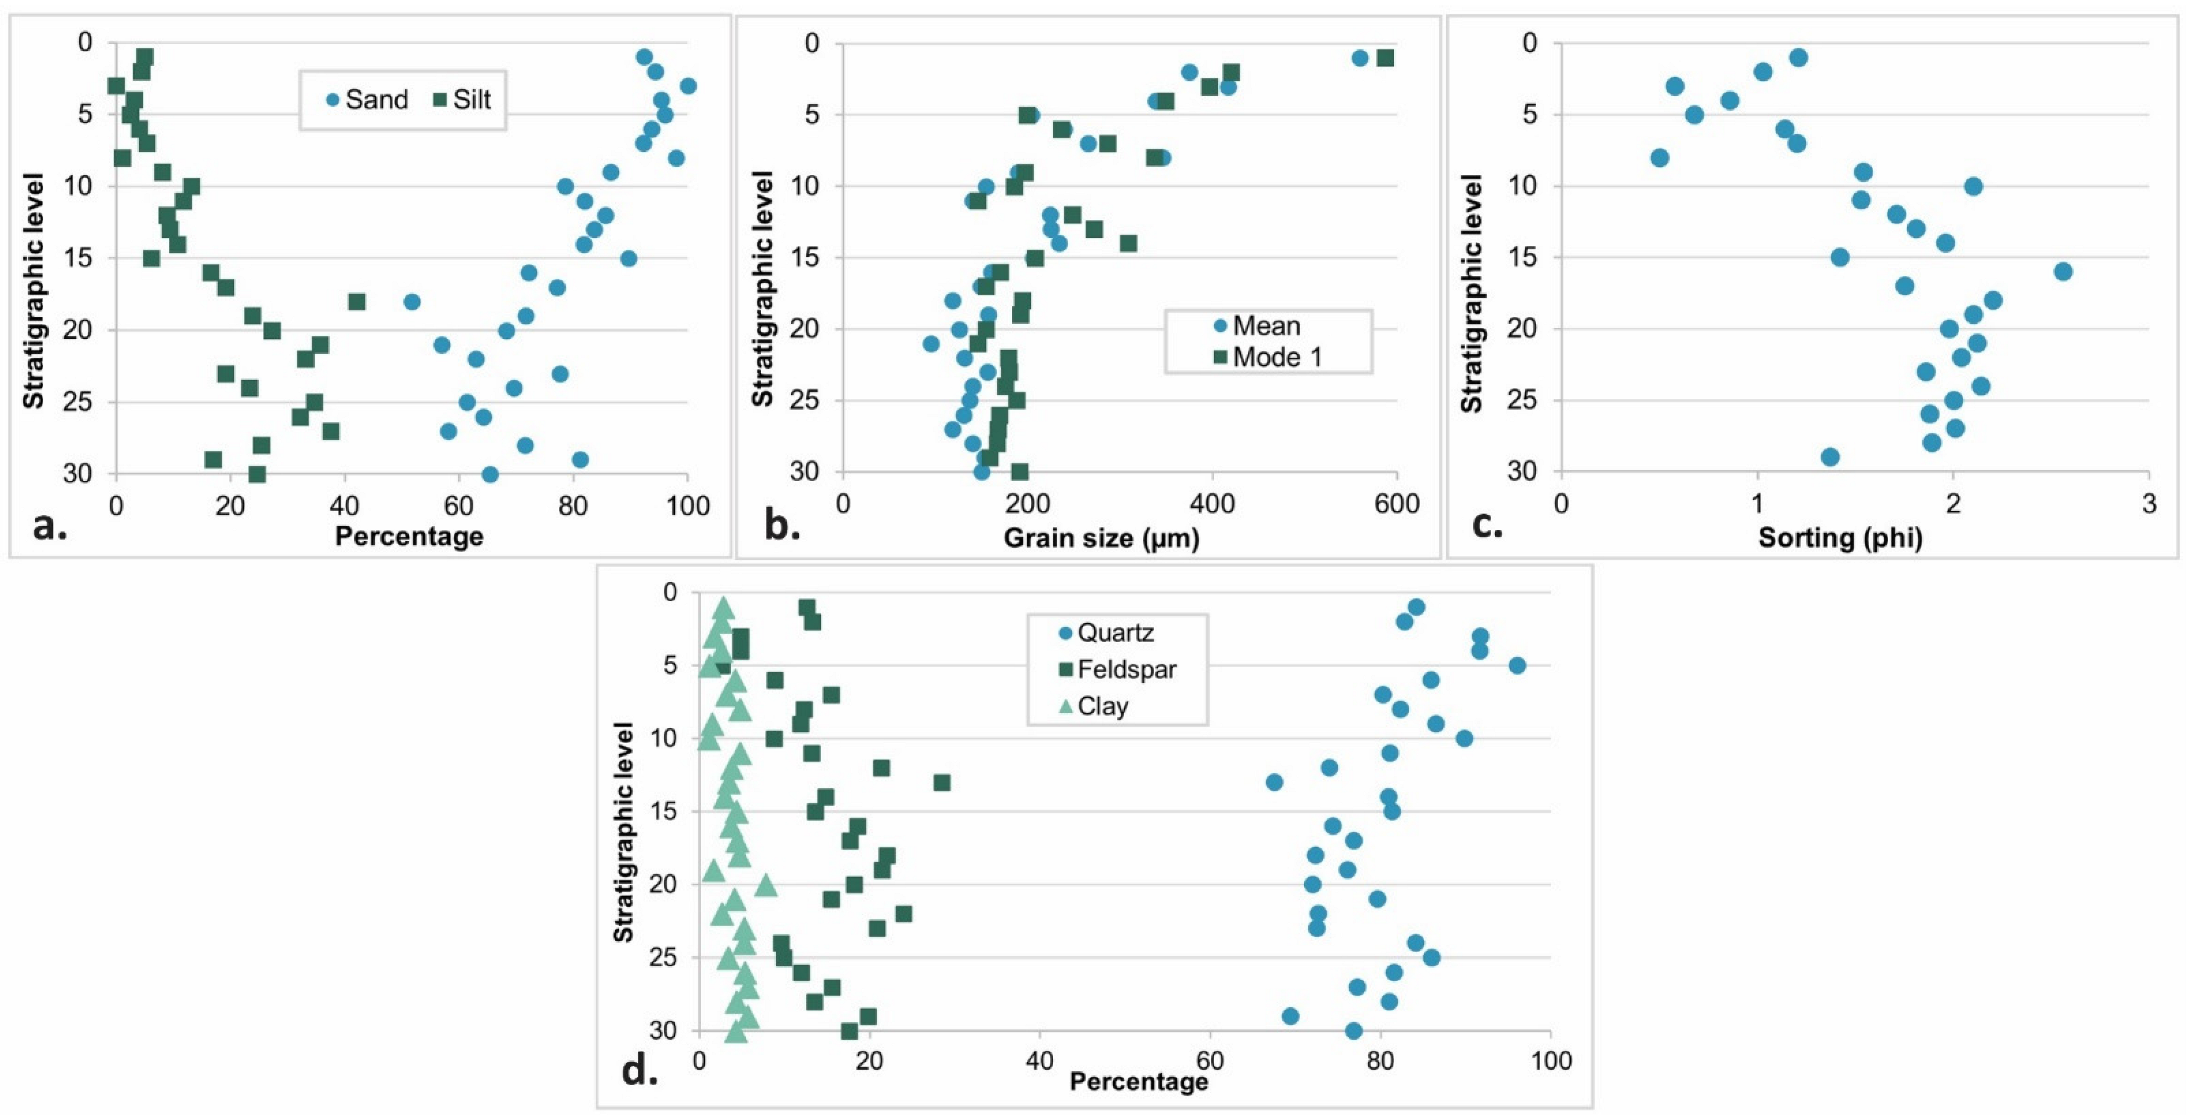
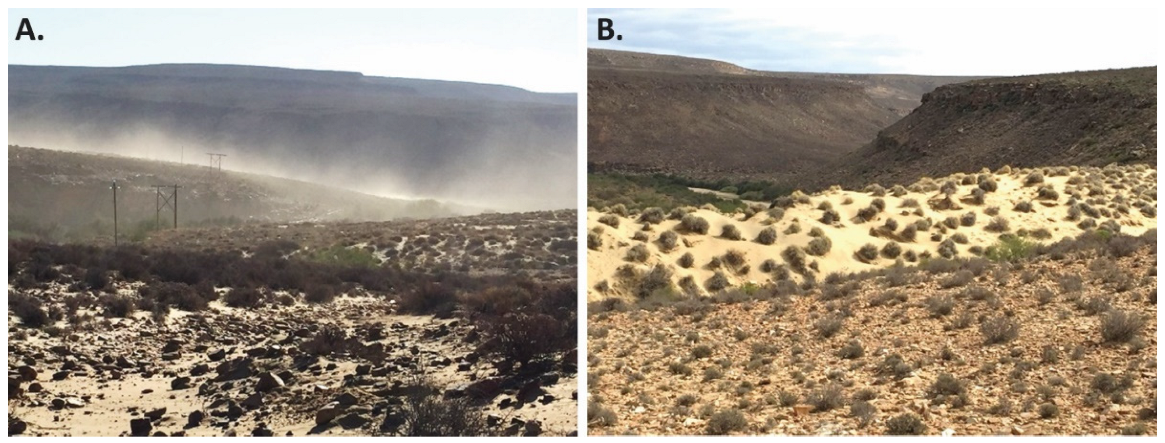
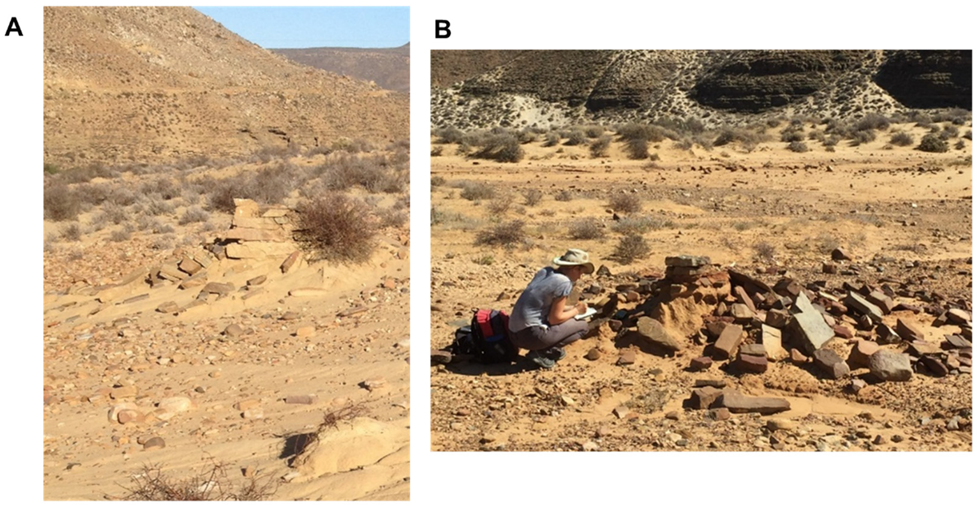
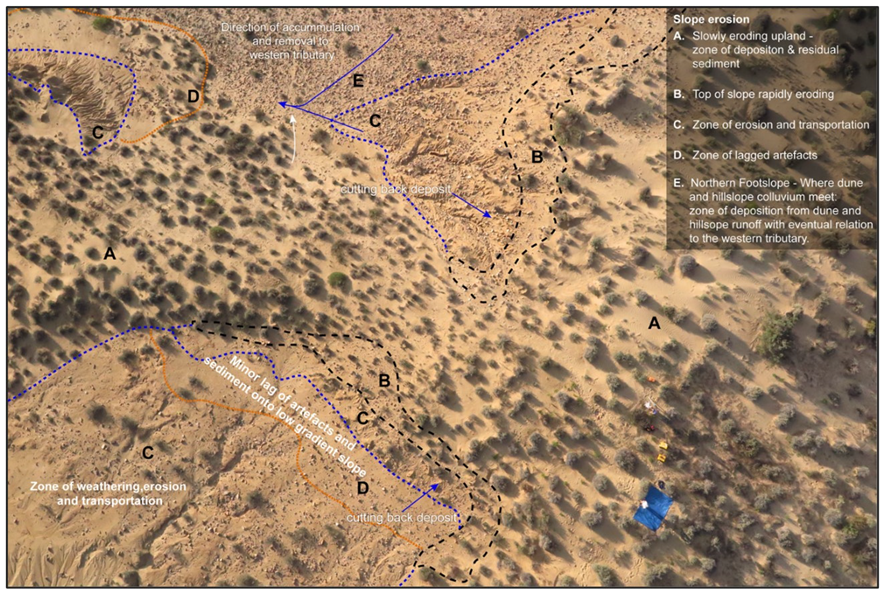
Table 1.
Identified sedimentary units that contribute to the foundation and sand mantle of UPK7, listed in their stratigraphic sequence.
Table 1.
Identified sedimentary units that contribute to the foundation and sand mantle of UPK7, listed in their stratigraphic sequence.
| Unit | Abbreviations | Description | |
|---|---|---|---|
| Modern terrace | MT | The actively aggrading landform. The most recent terrace (T0) to have formed at the base of the bank-attached bar, south of and parallel to UPK7′s palaeoterrace. | |
| Sand Mantle | Unconsolidated Sand | UCS | The most extensively exposed and youngest unit. An extensive sand sheet and dune of unconsolidated and semi-consolidated sand. Low-lying, shallow-rooting vegetation intermittently covers this unit. |
| Indurated Sand | IS | Indurated sandy sediment, with a crusted surface, prone to rilling and rarely vegetated. | |
| Upper Yellow | UY | Consolidated sand with dispersed inclusions of calcrete nodules (i.e., rhizoliths). | |
| Lower Red | LR or LRcc | Consolidated red sediment with and without veins or nodulated inclusions of calcium carbonate (cc). | |
| Palaeoterrace | PT | Composed of alluvium and riffle boulders forming a bank-attached paleochannel bar (observed as an exposed boulder bed and bench of colluvium). | |
| Colluvium | C | Composed of hillslope cobble and pebble-sized float to the north of, and beneath, the sand mantle. | |
| Bedrock | BR | Composed of clastic sedimentary rock from the Ceres Subgroup (Devonian Period, Palaeozoic Era) of the Bokkeveld Group (see Section 3.2.2). Its dominant lithological units include alternating sandstone and shale. South or upriver of UPK7 the Doring also cuts through the quartzitic sandstone and mudrock of the Witteberg Group. The river’s north-eastern catchment carves into shales and sandstones of the Karoo Ecca Group and diamictite of the Karoo Dwyka Group. Its south-western catchment carves through the quartzitic sandstone of the Cape Table Mountain Group. |
Table 2.
Dominant characteristics are summarised for each unit, including their stratigraphic relationship with other units, their thickness, location, colour, and sedimentary structures. Listed in their stratigraphic sequence.
Table 2.
Dominant characteristics are summarised for each unit, including their stratigraphic relationship with other units, their thickness, location, colour, and sedimentary structures. Listed in their stratigraphic sequence.
| Unit | Basal Contact | Upper Contact | Unit | Thickness (m) | Sample Depth (bls m) b | Elevation (m asl) c | Distance from River | Matrix Colour | Sedimentary Structures d | |
|---|---|---|---|---|---|---|---|---|---|---|
| Observed | ERT a | |||||||||
| MT/ Alluvium (T0) | PT; BR | None | MT/ Alluvium (T0) | - | - | 0–0.5 | 192–195 | 16–40 | - | Structureless-single grain (weak) |
| UCS/SCS | SCS; IS; LRcc | None | UCS/SCS | 0.6–1.4 | 5 | 0–0.7 | 202–215 | 127–248 | 10 YR 6/4 (light yellowish brown) | Structureless-single grain and layered (thin laminations, weak) |
| IS | UY?; LRcc | UCS; SCS | IS | 0.1–3.7 | 4 | 0–2.7 | 202–211 | 142–222 | Yellowish brown | Massive and layered (weak, thin laminations); fine surface cracking; crusted surface of varying thicknesses (10–20 mm); porous |
| UY | LR; LRcc | UCS; SCS | UY | 0.28–0.32 | 2–5 | 0–0.24 | 214–215 | 243–268 | 10 YR 5/6, (yellowish brown) | Massive and blocky subangular; crusted surface; porous |
| LR/LRcc | LRcc; C | LR; UY; IS; UCS | LR/LRcc | 0.3–0.8 | 3–7 | 0–0.6 | 208–218 | 201–261 | Yellowish to reddish brown | Structureless-massive (cemented)/blocky-subangular to angular; desiccation cracks and carbonate infilling; crusted surface; porous |
| PT | BR | LR; UY; IS; UCS | PT | 2.6 | 8 | - | - | - | - | Granular |
| C | BR | LR; UCS | C | - | 1.5 | 0–0.05 | 207–212 | 223–259 | 7.5 YR 7/6 to 7.5YR 5/6 (reddish yellow to strong brown) | Granular; fine desiccation cracking; crusted |
| Bedrock | Not visible | C; PT | Bedrock | - | - | - | - | - | Reddish to light grey | Massive; layered |
a Electrical Resistivity Tomography; b Below surface (bls); c Above sea level (asl); d Based on [61].
Table 3.
Texture and common inclusions summarised for each unit. Listed in their stratigraphic sequence.
Table 3.
Texture and common inclusions summarised for each unit. Listed in their stratigraphic sequence.
| Unit | Texture | Inclusions | |||||
|---|---|---|---|---|---|---|---|
| Vol. Weighted Mean Particle Size Sample Range (μm) a | Particle Size Class a | Sorting (Std Dev phi Φ) b | Rounding | Consistence (Dry) | Texture Class a | ||
| MT/ Alluvium (T0) | 374–559 μm | Medium sand | Poorly sorted (1.03–1.21) | - | Loose | Sand | None |
| UCS/SCS | 203–417 μm | Medium sand | Moderately to poorly sorted (0.50–1.20) | Medium sphericity; subangular to subrounded | Loose | Sand | Fine roots; insect burrows |
| IS | 140–225 μm | Fine to medium sand | Poorly to very poorly sorted (1.53–2.10) | - | Indurated, hard, smooth | Loamy sand | Small calcrete nodules; fine roots; insect burrows |
| UY | 119–157 μm | Very fine to fine sand | Poorly to very poorly sorted (1.98–2.20) | - | Indurated, slightly hard to hard | Sandy loam to loam | Effervescent; calcrete nodules (≤60 mm diameter); fine roots; stone artefacts |
| LR/LRcc | 95–500 μm | Very fine to medium sand | Poorly to very poorly sorted (1.37–2.56) | Moderate to high sphericity; subrounded and subangular | Indurated, slightly hard to very hard | Sandy loam to loamy sand | Insect burrows/casts; hard small calcrete nodules (≤55 mm diameter); salt crystallisation; fine roots; pores; rugose biocrusts |
| PT | - | - | - | - | - | - | - |
| C | 100–750 μm | Fine to medium sand | Very poorly sorted (2.47) | Moderate sphericity, subrounded | Compacted, hard | Sandy loam to loam | Stoney (5–300 mm max. dimensions), clay coating on quartz grains |
| B | - | - | Well sorted | - | Lithified, extremely hard, cemented | Sand | Quartz grains |
Table 4.
List of Exposure names and their average aspect. See Figure 2 for locations.
Table 4.
List of Exposure names and their average aspect. See Figure 2 for locations.
| Exposure | Hillslope Aspect |
|---|---|
| 1 | south |
| a | southwest |
| b | southwest |
| c | southeast |
| 2 | east |
| 3 | west |
| 4 | north |
| 5 | north |
| 6 | northeast–southwest |
Table 5.
UPK7 Hillslope zones and their elevation (m) ranges for each exposure.
| Exposure | Hillslope Zones and Elevation Ranges (m) | ||
|---|---|---|---|
| Upper (20%) | Middle (40%) | Lower (40%) | |
| 1a | 211.5–209.8 | 209.7–206.3 | 206.2–202.8 |
| 1b | 215–213.4 | 213.3–210.1 | 210–206.8 |
| 1c | 211–209.4 | 209.3–206.1 | 206–202.8 |
| 2 | 214.4–214.1 | 214.0–213.5 | 213.4–212.8 |
| 3 | 215.3–214.4 | 214.3–212.6 | 212.5–210.8 |
| 4 | 210.8–210.1 | 210.0–208.7 | 208.6–207.3 |
Disclaimer/Publisher’s Note: The statements, opinions and data contained in all publications are solely those of the individual author(s) and contributor(s) and not of MDPI and/or the editor(s). MDPI and/or the editor(s) disclaim responsibility for any injury to people or property resulting from any ideas, methods, instructions or products referred to in the content. |
© 2023 by the authors. Licensee MDPI, Basel, Switzerland. This article is an open access article distributed under the terms and conditions of the Creative Commons Attribution (CC BY) license (https://creativecommons.org/licenses/by/4.0/).
Share and Cite
MDPI and ACS Style
Phillips, N.; Moffat, I.; Mackay, A.; Jones, B.G. The Sedimentary Context of Open-Air Archaeology: A Case Study in the Western Cape’s Doring River Valley, South Africa. Soil Syst. 2023, 7, 25. https://doi.org/10.3390/soilsystems7010025
AMA Style
Phillips N, Moffat I, Mackay A, Jones BG. The Sedimentary Context of Open-Air Archaeology: A Case Study in the Western Cape’s Doring River Valley, South Africa. Soil Systems. 2023; 7(1):25. https://doi.org/10.3390/soilsystems7010025
Chicago/Turabian StylePhillips, Natasha, Ian Moffat, Alex Mackay, and Brian G. Jones. 2023. "The Sedimentary Context of Open-Air Archaeology: A Case Study in the Western Cape’s Doring River Valley, South Africa" Soil Systems 7, no. 1: 25. https://doi.org/10.3390/soilsystems7010025