Article

Experimental Warming of Typically Acidic and Nutrient-Poor Boreal Soils Does Not Affect Leaf-Litter Decomposition of Temperate Deciduous Tree Species

by
Nicolas Bélanger
* and
Clémence Chaput-Richard
Data Science Laboratory, Université du Québec (TÉLUQ), 5800 rue Saint-Denis, Bureau 1105, Montréal, QC H2S 3L5, Canada
*
Author to whom correspondence should be addressed.
Soil Syst. 2023, 7(1), 14; https://doi.org/10.3390/soilsystems7010014
Submission received: 25 November 2022 / Revised: 21 January 2023 / Accepted: 2 February 2023 / Published: 6 February 2023

Abstract

:
Ongoing rapid climatic changes are expected to modify the structure, composition, and functioning of forest ecosystems. Studying the influence of such changes on biogeochemical processes is thus crucial for a fuller understanding of forest response to climate change. In a temperate forest of Quebec, Canada, we emulated climate change by warming the acidic, nutrient-poor, and dry soils of two mixedwoods by 3 to 4 °C using heating cables. Leaf-litter mass loss of the local red maple, sugar maple, large-tooth aspen, and American beech were monitored to assess the ability of these tree species to condition boreal soils in the context of their northward migration under climate change. We hypothesized that decomposition rates of all leaf-litter types would be decreased equally by warming due to a drying effect of the soil and its surface, which is detrimental to microbial biomass and activity. Our results suggest differences in decomposition rates between tree species as follows: sugar maple > red maple ≥ American beech = large-tooth aspen. There was no indication of a slower turnover in these marginal soils compared to other studies conducted on typical hardwood soils. Moreover, no difference in litter mass loss was detected between treatments, likely due to a drying effect of the soil warming treatment. Results imply that climate change has a marginal influence on leaf-litter dynamics of temperate tree species on soils that are typical of the boreal forest. However, some variables that could play an important role on litter decomposition in the context of climate change were not measured (e.g., plant phenology, understory composition and density, microbes) and thus, uncertainties remain. The soil drying effect by warming also needs to be further documented and modeled. The study year was characterized by significant periods of water stress but was not considered an exceptional year in that regard. It would be relevant to test for leaf-litter dynamics during dry and wet summers and verify again our initial hypothesis of decreased leaf-litter decomposition rates due to soil warming/drying.

1. Introduction

Forests have adapted to gradual climate change over millennia, but the projected rapid increase in air temperature and decreased water availability will likely exacerbate the vulnerability of forest ecosystems as fires, insect infestations, and diseases become more prevalent [1]. Drought events will also exert adverse effects on water use by trees [2] and, in most situations, on forest carbon uptake and growth [3]. The physiological constraints that are induced by climate change will force tree species to adapt locally or find new ecological optima by shifting their ranges to higher latitudes and elevations [4,5,6].
Models that simulate rates of tree species migration are calibrated to regional climates and seed dispersal traits, but they consider neither reorganization of ecological and biogeochemical interactions nor feedback cycles between tree species and between tree species and site conditions [7]. For example, positive feedback switches [8] imply that certain plant species have generated conditions in the resident environment (e.g., soil chemical composition and allelopathic toxins through their litters) to their benefit, but these conditions are likely to decrease the colonizing success of migrating species [9,10]. Boreal (acidic) forest soils, in particular, could nutritionally constrain the northward migration of temperate deciduous tree species, if the latter are not able to (re)condition the soils to adequate nutrient levels with their generally higher quality litters compared to conifers [11,12].
Several experiments have tested the effects of warmer temperatures and extended periods of biological activity on ecosystem functioning using various methods (e.g., open-top and active heating chambers, infrared lamps). Meta-analyses suggest that warming increases N and C cycling as well as plant biomass production and foliar nutrition in various ecosystems, including forests [13,14,15,16]. Litter decomposition is also an important biogeochemical process, affecting soil C as well as nutrient availability [17]. Understanding the influence of soil warming and extension of periods with soil biological activity on litter decomposition is thus crucial for a full understanding of forest response to climate change. Based on the meta-analysis of Wu et al. [18], only a few studies have been performed regarding effects of experimental soil warming on leaf-litter decomposition in temperate deciduous tree species under field conditions. These studies suggest no change in the rates of leaf-litter decomposition due to soil warming, yet Wu et al. [18] called for more manipulative experiments under various site conditions, including monitoring of other factors such as moisture availability.
We tested decomposition rates of leaf litter from four common deciduous tree species of northeastern North America under experimental soil warming in an eastern Canadian temperate forest at its northern limit. This experiment was specifically conducted in mixedwood stands with soils similar to acidic boreal soils that deciduous tree species will encounter in the context of their northward migration under climate change. We hypothesized that decomposition rates of leaf litter would be decreased by warming due to a drying effect on the soil and its surface, which is expected to be detrimental to microbial biomass and activity, and that there would be no difference in response to soil warming between the study species. We also hypothesized that mass loss would be less than that at more southern deciduous stands due to differences in both climate and site quality.

2. Materials and Methods

2.1. Study Site

The study was conducted at the Station de biologie des Laurentides (SBL) of Université de Montréal in St. Hippolyte, Québec (45°59′20″ N, 74°00′19″ W). The forest is mostly composed of sugar maple (Acer saccharum), red maple (Acer rubrum), American beech (Fagus grandifolia), yellow birch (Betula alleghaniensis), white birch (Betula payrifera), large-tooth aspen (Populus grandidentata), eastern white cedar (Thuja occidentalis), white pine (Pinus strobus), and red spruce (Picea rubens) [19]. The site is less than 50 km from the temperate mixedwood, and consequently, stands that are dominated by tree species typical of the boreal forest such as balsam fir (Abies balsamea) and white spruce (Picea glauca) are quite common. Mean annual temperature at SBL is 4.9 °C, mean degree-days are 2845 (base 5 °C), and mean yearly precipitation is 1270 mm [20]. Thirty percent of precipitation falls as snow. Parent material is sandy loam glacial till with a chemical signature that was acquired from a mixture of local anorthosite and felsic rocks from the Precambrian Shield [21]. Soils are Orthic Humo-Ferric and Ferro-Humic Podzols with a moder forest floor [22].

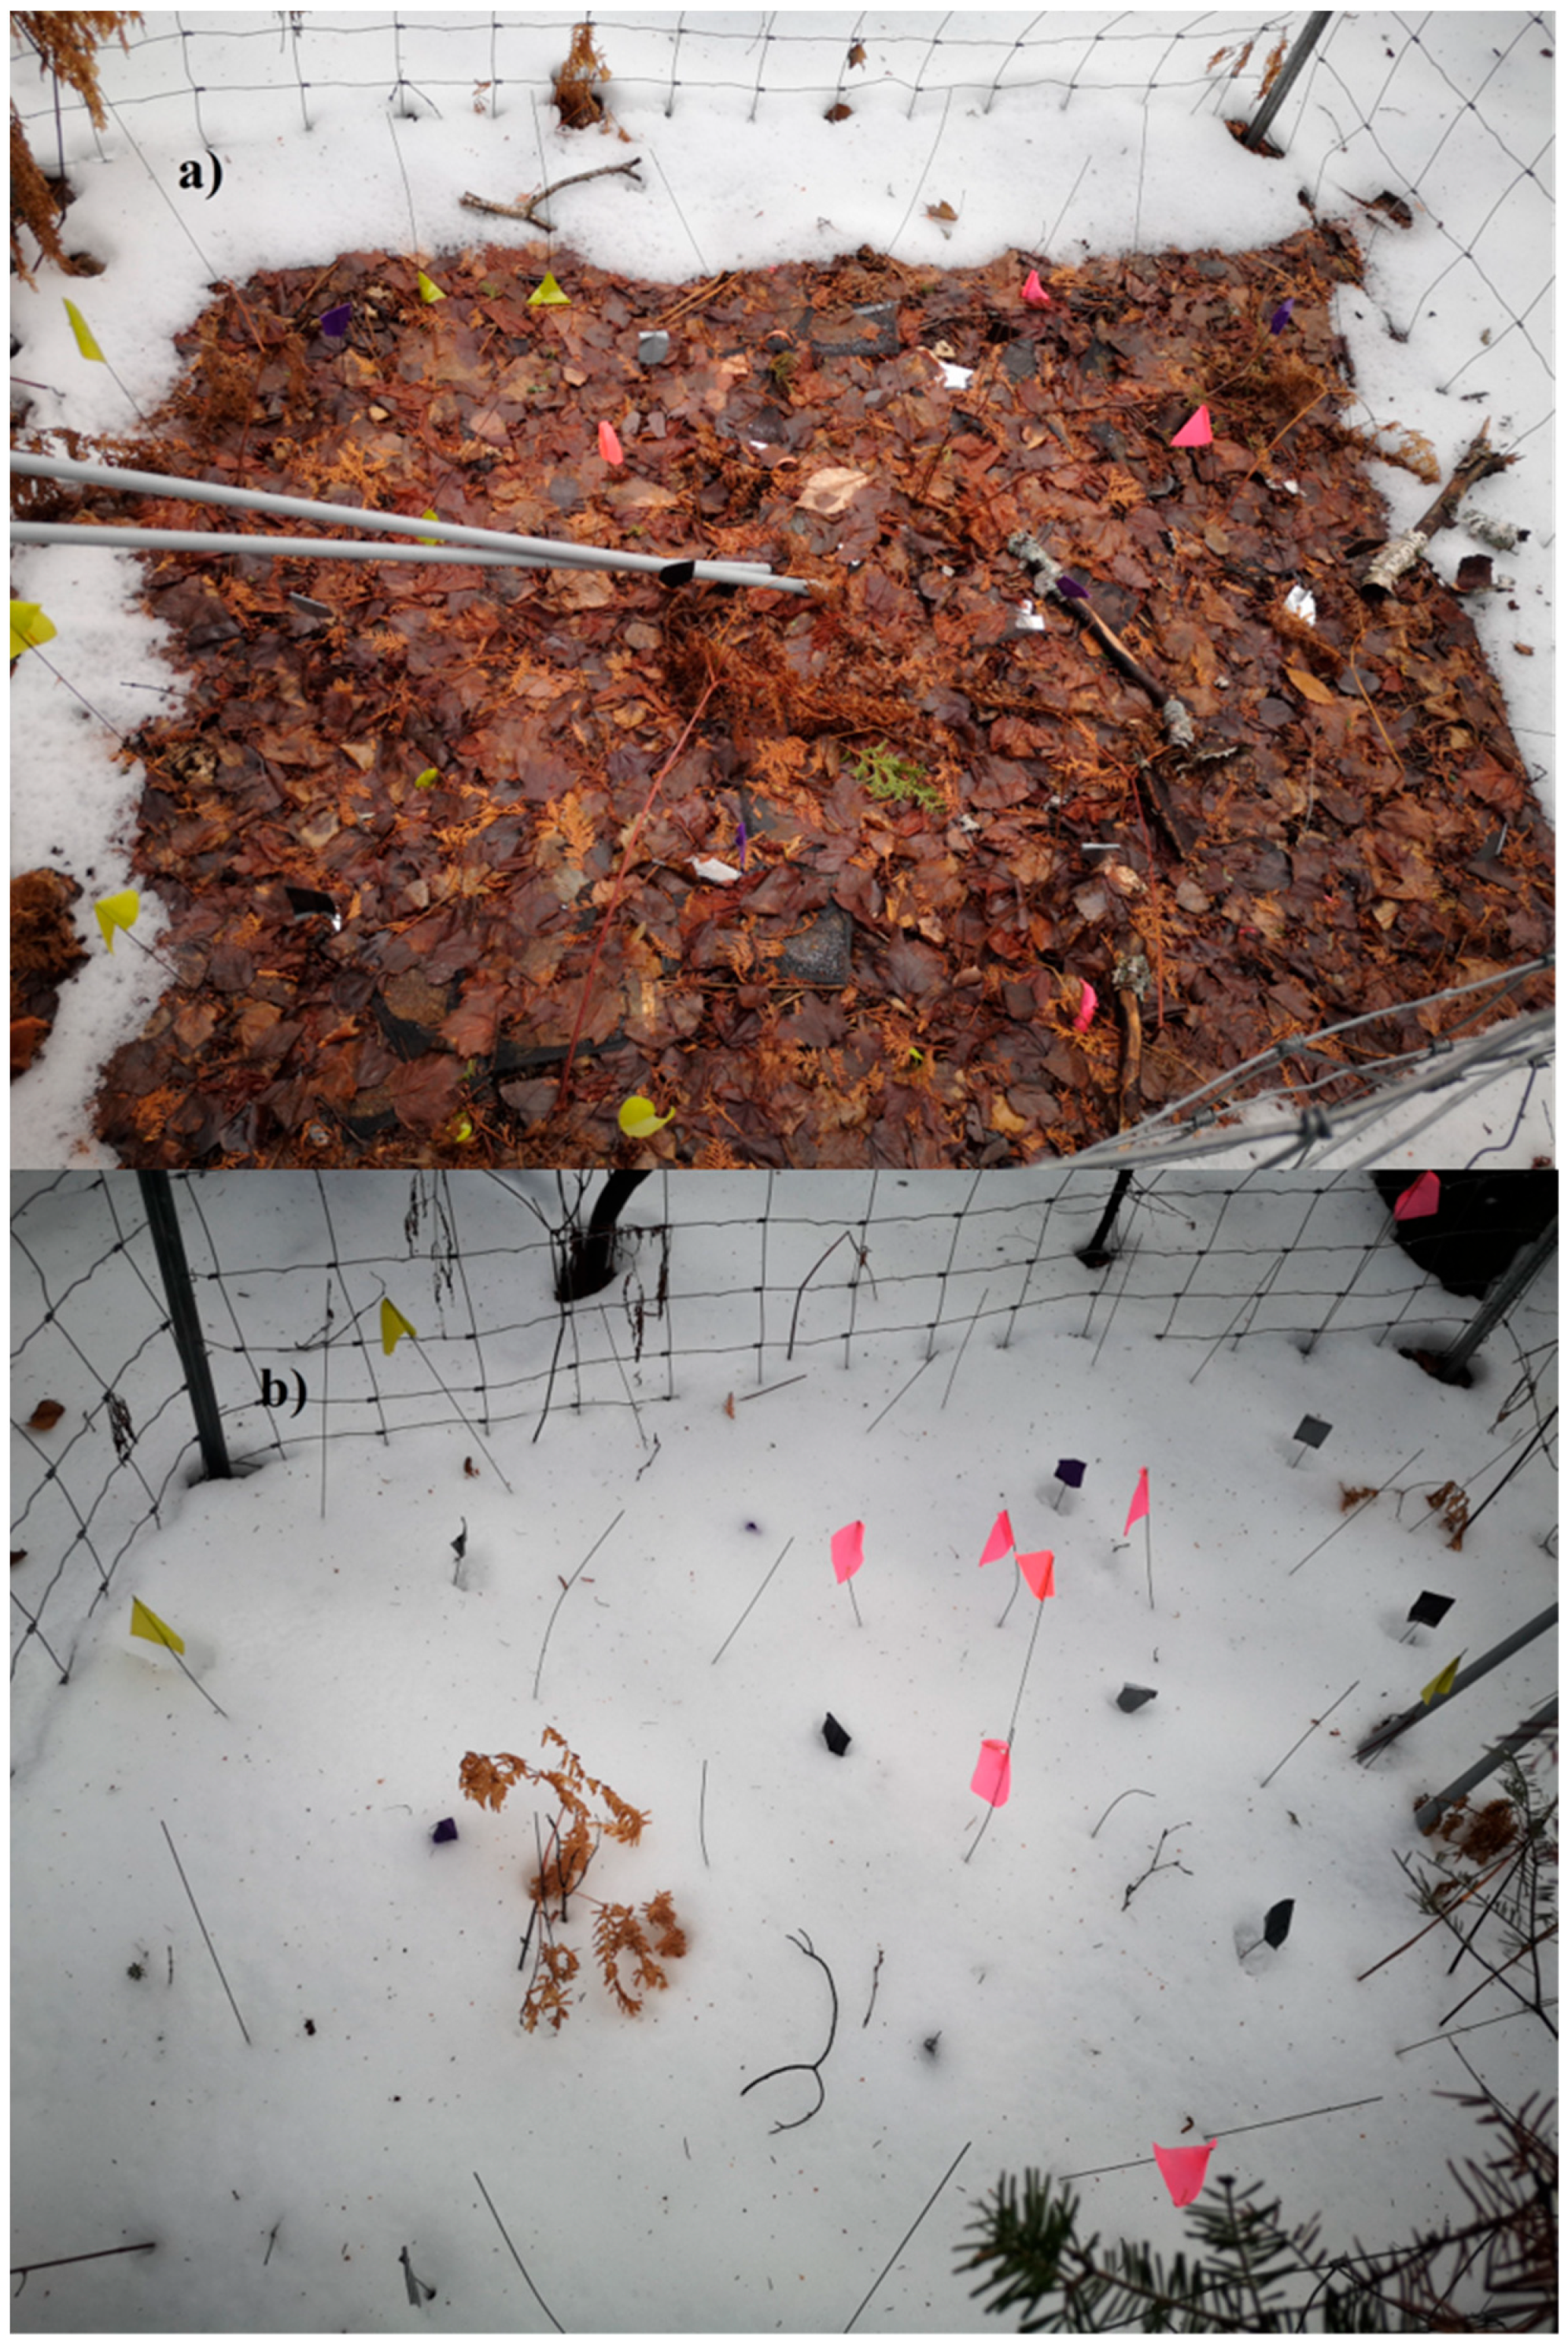
2.2. Experimental Design

Litter mass loss under control and warming was studied in two stands situated at 150 m from one another. One stand was composed mainly of balsam fir, red maple, and white birch, while the other was composed of white cedar, red maple, and white birch (see basal area and litterfall composition in Table 1 and Table 2, respectively). Due to a strong presence of conifers, both stands were selected given that they had more acidic and drier forest floors than those of typical deciduous forests. Consequently, soil properties in these plots are closer to those measured in boreal soils [12,23]. Each stand (block) included five paired plots of 1.8 m × 1.8 m each, with one plot serving as the control and the other being heated with twin conductor 120 V heating cables (RX Roof & Gutter De-Icing Cables, Danfoss Canada, Mississauga, ON). General soil chemical properties are presented for each stand in Table 3.
In heated plots, 24 m of cables were buried in a slalom pattern (~15 cm spacing) in September 2017 at the forest-floor–mineral-soil interface (~12 cm). Mechanical timers with 15 min increments were set to warm the soil for 15 min every hour during nighttime, whereas soils were heated only 3 × 15 min during daytime to maintain the temperature differential with the control plots, but not to increase it. Timers were continually adjusted to account for photoperiod. In each plot, soil temperature was measured every 15 min using a temperature probe inserted at a 10 cm depth and connected to a data logger (WatchDog 1650 Micro Station, Spectrum Technologies, Aurora, IL, USA). The (timer) method has the advantage of providing a known and equal amount of energy in each plot. This avoids any potential bias that can occur with electronic systems (set for a desired temperature differential) because of improper monitoring of temperature in the plots (e.g., insufficient number of probes to capture variation or inconsistent placement, i.e., relative distance of temperature probes with the heating cables). As shown in Figure 1, the warming treatment created a consistent temperature differential of 3 to 4 °C with the control plots.
For this specific experiment, we artificially heated the soils until 1 December 2020 and again starting on 1 April 2021. This delayed snow cover in the fall by 15 to 20 days and completed snowmelt in the spring 15 to 20 days sooner (Figure 2). As a whole, artificial heating extended the snow-free period by over a month, which is a reasonable scenario of climate change for northeastern North America [24].

2.3. Litterbags

Sugar maple, red maple, American beech, and large-tooth aspen leaves were collected in nearby hardwoods during the first week of October 2019. Samples were collected directly from branches of mature maple and beech trees by using a pole pruner, whereas freshly fallen aspen leaves were collected from the forest floor. Litter samples were quickly stored in sealed plastic bags in a frost-free freezer (−32 °C). The next autumn, leaves were taken out of the freezer and placed on paper to stabilize in the air (~21 °C) for 16 h. Litterbags were then prepared by placing 1.5 to 2.0 g of leaves in 20 cm × 20 cm size and 1 mm mesh fiberglass bags. Each litterbag contained 4 to 5 leaves, depending upon size. A total of 800 litterbags were prepared, i.e., 200 per species. Litterbags were numbered with aluminum tags and then placed on the forest floor surface in the two stands. Ten subsamples of five leaves of each species were also weighed after partial air-drying (16 h) and then dried at 65 °C for 72 h and reweighed to determine a dry mass conversion factor for calculating initial litter dry mass in the bag. The ratio between measured dry mass of the litter in the bag and initial dry mass (× 100) was used as a proxy of mass loss (%).
Ten litterbags per tree species were placed in each plot (10× in heated plots, 10× in control plots) on 6–7 October 2020, as a means of simulating litterfall. The litterbags were then collected at different intervals over about one year, i.e., 13 November 2020, 3 May, 7 June, 5 July, 2 August, and 30 August, 2021. Since we had 10 litterbags per plot, duplicates were collected at four sampling dates. Upon arrival in the laboratory, the litter was removed from the bags and separated from soil and living or dead organisms. The litter from each bag was first oven-dried at 65 °C for 72 h before being weighed. As a reference material, we also placed five nylon bags of green tea (blend of sencha and matcha, Kirkland Signature, Costco Wholesale, Issaquah, WA, USA) in each plot. Twenty bags were prior weighted to validate their 150 g commercial mass. The five green tea bags were collected on the first five sampling dates only and dried with their bags as indicated above.

2.4. Other Environmental Variables

Soil volumetric water content (VWC) was monitored to a depth of 12 cm, thus capturing both the forest floor and upper mineral soil. In total, we measured VWC on 11 dates in 2021 using Time Domain Reflectometry [25]. To do so, a FieldScout TDR 300 Soil Moisture Meter (Spectrum Technologies) was used. Each measurement consisted of the mean of twelve readings taken at random locations within the plot. Sampling at twelve random locations within the plot was done to better capture the variability in the plots, which can be larger than the measurement error (3% volumetric water content) introduced by the meter. From our experience, this is a more robust way to measure soil VWC compared to having just a couple of probes installed ‘permanently’ within each plot. Values were thereafter corrected, based upon an equation (VWCcorrected = 1.19 × VWCmeasured + 2.10, R2 = 0.97) that was developed from VWC readings of a dozen forest floor, organic and sandy materials (including SBL samples) that were first wetted to saturation and progressively dried in an oven at 65 °C until a constant weight and then at 105 °C as a final drying stage (N. Bélanger, unpublished data).
To assess NH4-N and NO3-N activity in the soil, we used Plant Root Simulator (PRS) probes (Western Ag Innovations, Saskatoon, SK, Canada). We placed (vertically) four pairs of cation and anion exchange probes into the forest floor at random locations within each plot. They were installed in mid-June 2021 and removed in mid-July, for a total of 5 weeks. Probes were then cleaned with deionized H2O and stored in the fridge in zip-seal bags until analysis. Probes were eluted for 1 h with 0.5 M HCl. NH4-N and NO3-N were then determined colorimetrically by continuous flow analysis (AutoAnalyzer 3, Seal Analytical, Mequon, WI, USA). In contrast to conventional soil extraction methods that provide a measurement of soil nutrient availability at a particular point in time, the probes are frequently used in forest ecology research where the PRS data represent dynamic measurements of ions flowing through the soil over time [20,26].

2.5. Data Analysis

Data were analyzed using the statistical module of SigmaPlot 12.0 (Systat Software, Chicago, IL, USA) and SPSS v.27 (IBM, Armonk, NY, USA). First, the proportion of mass remaining with time was fitted for all plots and species to the simple exponential decay model (X = e−kt), where X is the proportion of initial mass remaining at time t in days and k is the decomposition constant. Second, linear mixed-effect models were carried out to test the effect of soil warming (fixed factor) on indicators of litter mass loss using forest stands as a random factor. We investigated all sampling dates individually when testing for soil warming effects. We assumed that mass remaining after 31 and 202 days of incubation, i.e., the first and second collections of litterbags before snow cover and after snowmelt, respectively, corresponds mostly to a nutrient-leaching phase. We also tested mass remaining after 237, 265, 293, and 321 days, which likely includes a microbial catabolism phase. Third, we used decomposition constants (k) that were derived from the decay models as a means to test differences between species and between soil treatments within species. To do this, we first tested whether there was a blocking effect by comparing k values between the fir and cedar stands for each species and soil treatment using a simple t-test. No test detected a blocking effect, which allowed us to compare all 8 groups (8 species × 2 soil treatments) concomitantly with a one-way ANOVA. Fourth, soil VWC was compared between warmed and control plots using a paired t-test, where input was the means of warmed plots and the means of control plots computed for each sampling date. Finally, we carried out a linear mixed-model to test for differences in NO3-N and NH4-N (PRS data) between soil treatments (fixed factor) using forest stands as a random factor. For all statistical models, normality of residuals was tested (Shapiro–Wilk test), and logarithmic transformations were performed when necessary. Differences, if present, were determined with Tukey’s HSD.

3. Results and Discussion

Mass remaining is presented by tree species and as a function of soil treatment in Figure 3, whereas mass remaining of green tea is presented in Figure 4 along with simplified data from Figure 3. Table 4 reports k values for the five species under both warmed and control soils. Overall, results suggest that litter mass loss varies as a function of species following a sequence that was expected from the existing literature, but artificial heating of the soil did not lead to differences in mass loss of the different litters, with the exception of the green tea litter, which suggests an acceleration of decomposition.

3.1. Litter Type

Mass loss after 202 days (leaching phase, after snowmelt) and 321 days (microbial catabolism phase, end of experiment) in the control plots was, respectively, 58% and 64% for sugar maple, 30% and 36% for red maple, 14% and 33% for American beech, and 6% and 20% for large-tooth aspen (Figure 3). Mass loss of green tea fell between sugar maple and red maple, with a 45% loss after 202 days and a 49% loss after 293 days (Figure 4). For all five species, the decomposition trends were similar when comparing warmed plots. Statistical testing of k values suggests that sugar maple litter decomposed the fastest, followed by green tea and then red maple (Table 4). American beech and large-tooth aspen litters generally decomposed at a significantly lower rate than the three other litters, except for beech, which did not differ from red maple. Our results are fairly consistent with the literature, which suggests that rates of American beech leaf-litter decomposition fall toward the lower end of all the species, followed by the aspen species, and then red maple, sugar maple, and the birch species [27,28,29,30]. This sequence was largely attributed to the chemical signature of the litters, such as lignin and N levels, the C:N ratio, as well as other nutrients (e.g., K, P). Côté and Fyles [29] also reported the toughness of the litter (measured as the mass needed to punch a 3 mm circular hole in the leaf blade) to be the most robust variable to predict mass loss among several tree species. Similar but anecdotal testing during litterbag preparation suggests greater toughness of large-tooth aspen litter. Our data suggest that large-tooth aspen and American beech were the only species exhibiting a consistent net litter mass gain after 202 days (Figure 3). This was likely associated to nutrient immobilization by microbes, e.g., N [31]. We thus suggest an adjustment to the above-mentioned sequence by placing large-tooth aspen in the same grouping as American beech, whereas red maple mass loss appears as being slower than that of sugar maple. A mass loss of 40 to 50% is expected for green tea (Lipton) during the leaching phases [32,33]. This is consistent with the mass loss measured for green tea (Costco) in our study following the main leaching phase, i.e., the sampling after complete snowmelt (3 May 2021, 202 days into the experiment, Figure 4). In comparison, early mass loss due to leaching of sugar maple litter was also large, with 55% and 42% of mass remaining after 31 days (i.e., the sampling before snow cover on 13 November 2020) and 202 days into the experiment (Figure 3 and Figure 4).
As a whole, mass loss in our study was either similar or considerably greater and faster for sugar maple and American beech than in some studies (e.g., mass loss of about 22% and 7%, respectively; [28]), whereas it was in the same range as in other studies for red maple and large-tooth aspen [27,29,30]. Some of the discrepancy regarding sugar maple and American beech could be due to differences in the timing and way that the litter was sampled as well as the preparation of the material before incubation, including bag type and mesh size. Nevertheless, our data do not indicate in any way that leaf-litter turnover in these marginal “boreal” soils is slower compared to typically “better” hardwood soils/sites in more southern areas (e.g., Hubbard Brook and Harvard Forests in New Hampshire and Massachusetts). Leaf-litter decomposition is largely controlled by climate, viz., temperature and moisture, and litter quality, notably N content, when climate is not the limiting factor [31,34]. In this respect, despite leaf-litter dynamics being studied in mixedwoods with marginal soils, the climate was that of the northern limit of the temperate forest, rather than the boreal, whereas the litters originated from nearby hardwoods. Thus, our study may provide a robust projection of decomposition dynamics of these litter types in the boreal forest under warming as long as litter quality is of a similar standard, and as long as other variables such as plant phenology, understory composition, and density, length of the snow-free period, and moisture conditions remain constant (see Conclusion for more on uncertainties).

3.2. Artificial Heating

We found no significant difference in remaining mass loss between warmed and control soils within the same tree species at any of the sampling dates (Figure 3). Likewise, decomposition constants (k values) did not indicate that litter mass loss varied as a function of soil warming, given that all statistical comparisons between soil treatments within the same tree species were not significant (Table 4). Conversely, green tea decomposed faster under soil warming towards the end of the experiment, as indicated by the significant differences after 237, 265, and 293 days of incubation (Figure 4).
Our results partly corroborate those found in the literature. Two studies report on the effects of soil warming on leaf-litter decomposition of the tree species that were studied here. In the Adirondack Mountains of New York State, McHale et al. [35] tested three levels of soil warming (2.5, 5.0, and 7.5 °C) and found that decomposition rates of American beech leaf litter increased under the +5 °C and +7.5 °C treatments, whereas no change was observed for sugar maple leaf litter at all three soil temperature levels. Rustad and Fernandez [36] tested red maple leaf litter in Maine under a treatment that increased soil temperature by 4–5 °C and found that warming increased decomposition until about six months, but this difference disappeared after thirty months.
Both McHale et al. [35] and Rustad and Fernandez [36] used heating cables comparable to those in our study. Two other studies were relevant to temperate deciduous species and also used heating cables. In the eastern Tibetan Plateau (China), soil warming of 3.2 °C resulted in an increase in early leaf-litter decomposition of Chinese red birch (Betula albosinensis) [37]. Berbeco et al. [38] studied fine woody debris of sugar maple, red oak (Quercus rubra), and black birch (Betula lenta) under soil warming at Harvard Forest, Massachusetts, and observed an increase of decomposition rates of about 10% for maple and oak and as much as 25% for birch after one year. This effect was maintained but generally weakened over time (10 years). Finally, one study testing silver birch (Betula pendula) leaf-litter decomposition in Finland while artificially heating the soil with infrared lamps reported effects of warming on litter quality and microbial growth, but warming showed little or no effect on litter mass loss [39].
Only a few more studies report on the effects of warming under field conditions on leaf-litter decomposition of coniferous or boreal tree species (i.e., ref. [36] for red spruce in Maine, ref. [37] for dragon spruce (Picea asperata) in the Tibetan Plateau of China, and ref. [40] for black spruce (Picea mariana) in Alaska). Rustad and Fernandez [36] observed a positive long-term effect of heating on litter decomposition in Maine, whereas Xu et al. [37] and Romero-Olivares et al. [40] respectively reported no change and a decrease in mass loss with heating. More specifically, using closed-top chambers, Romero-Olivares et al. [40] showed that mass loss of non-recalcitrant C and overall mass loss of black spruce needles were higher in control plots than under warming, whereas recalcitrant C remained unchanged.
Green tea is now used to collect uniform decomposition data across a wide range of climatic and biogeophysical conditions [41,42]. In our study, it distinguished itself from the other litters because it was affected positively by soil warming toward the end of the experiment (Figure 4). Other studies have argued that during manufacturing, leaves are substantially transformed and thus, the structure of the material is altered [43,44]. The fragmented nature of the material leads to more surface area to retain water and for microbial attack compared to pristine leaf litters [45]. Therefore, green tea bags in our study possibly retained water more efficiently under the warming treatment, leading to more adequate conditions in the bags for faster decomposition. It is thus important to consider the nature of the material when comparing decomposition to other litters for which alterations were minimal. We argue that care must also be taken for the interpretation of green tea decomposition results when submitting tea litters to experimental treatments such as warming and drying because the nature of the material is bound to react differently compared to pristine litters. However, it can be useful to validate general trends, such as in our study.
Based on the literature, it can be argued that the observed acceleration in litter decomposition is due to a positive effect of warmer temperatures on soil microbes and the extension of the biologically-active period (i.e., spring and fall). Conversely, in Xu et al. [37] and Romero-Olivares et al. [40], the warming treatment reduced soil and litter water content due to increased evapotranspiration. As such, direct warming, together with indirect warming effects such as soil drying, likely exerted a negative effect on microbial biomass and soil respiration, thereby affecting decay dynamics by offsetting or surpassing the benefits of soil heating and extension of the period of biologically-active soils.

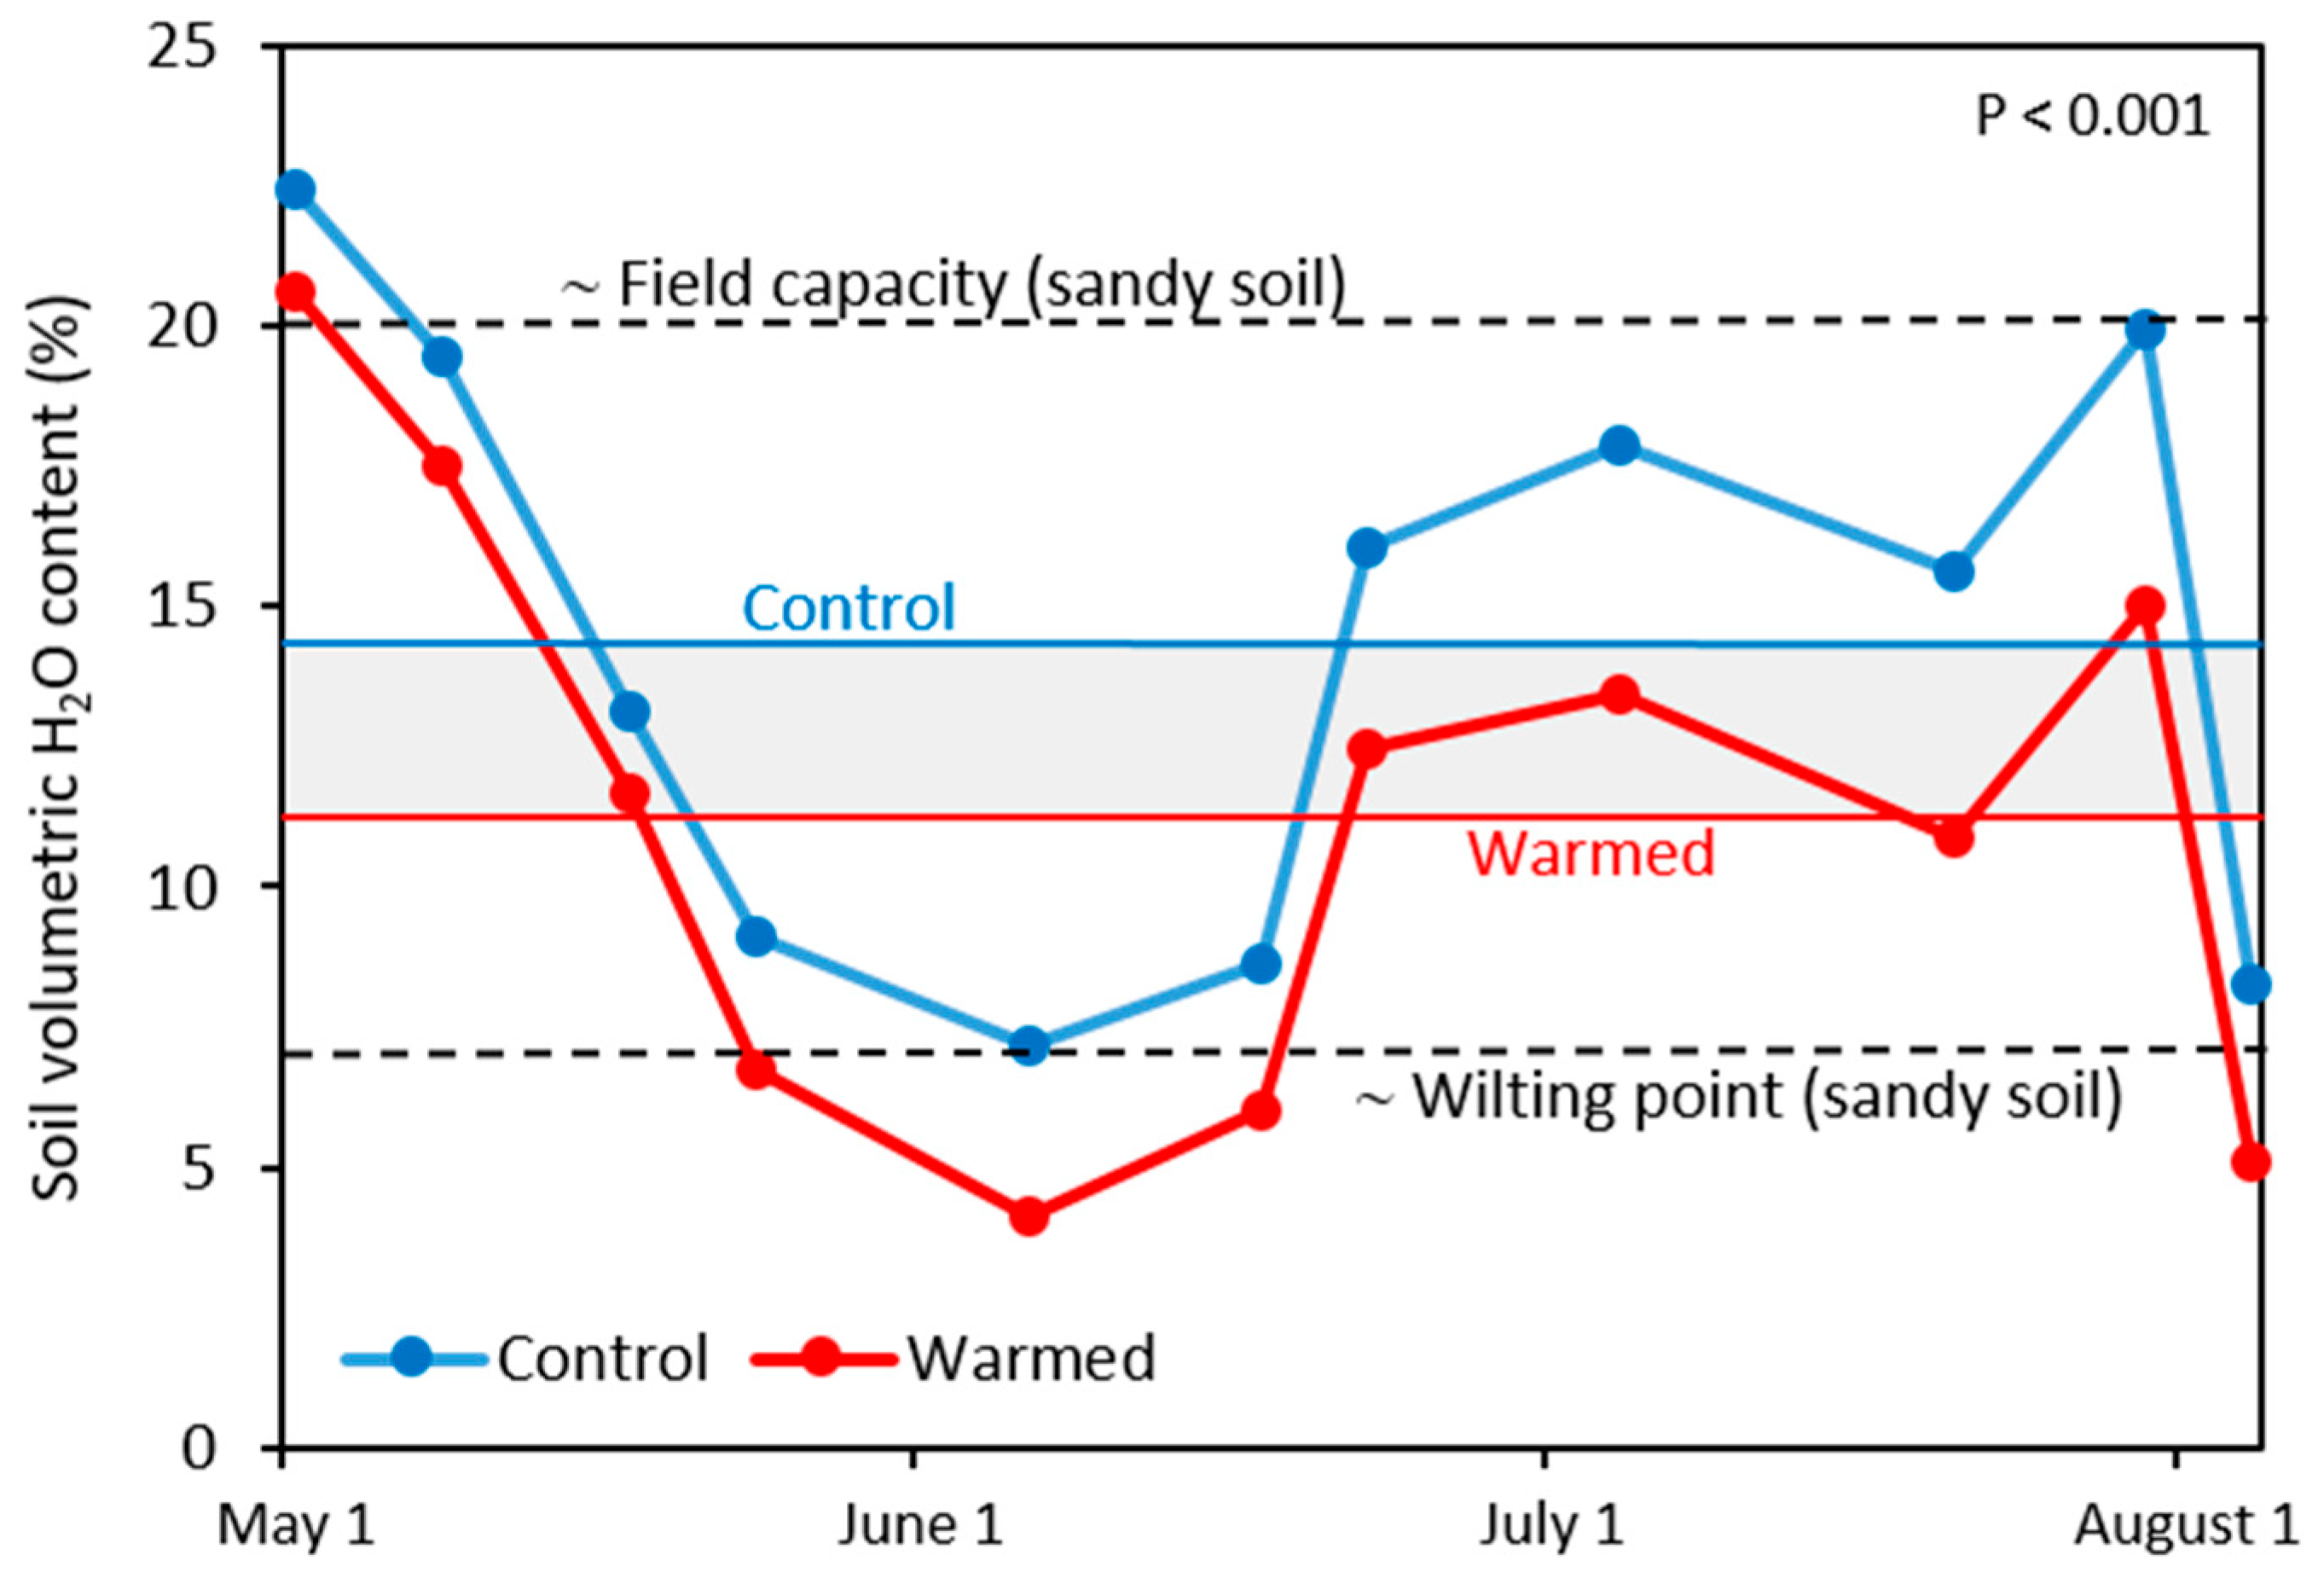
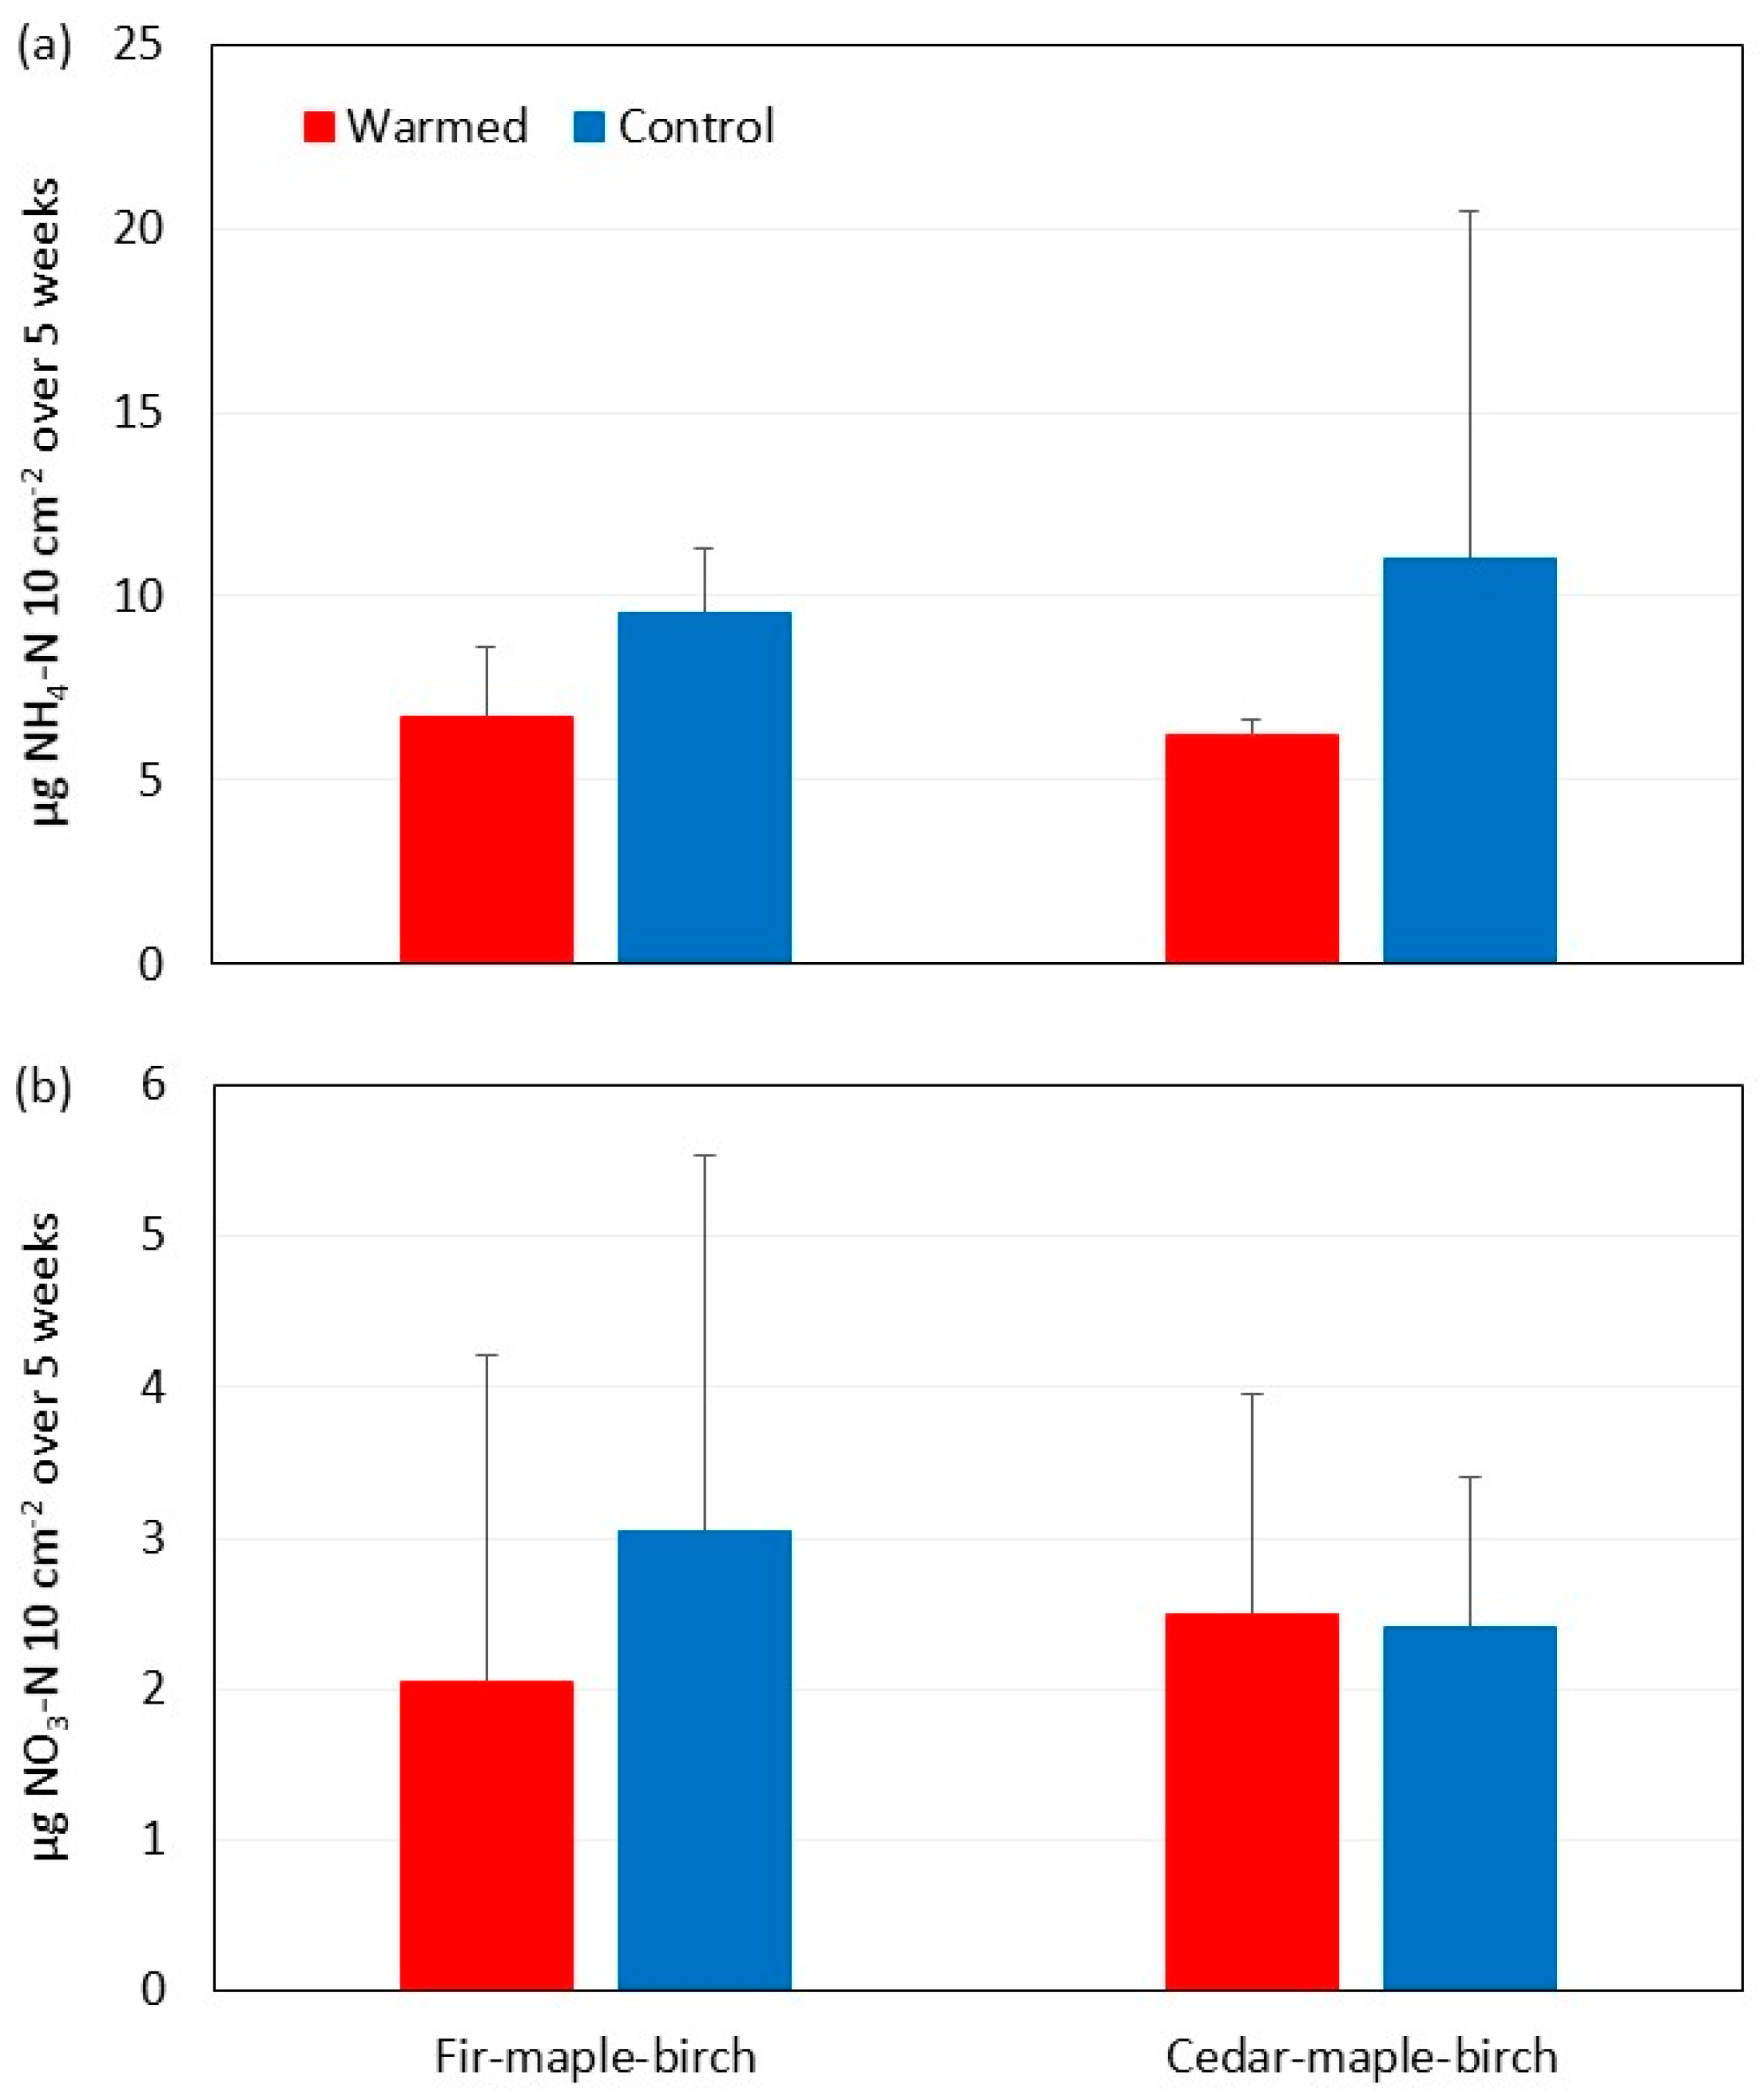
3.3. Soil Moisture and N Availability

Testing of the effects of soil heating on soil respiration and the microbial community is underway at the study site. However, the lack of a warming effect on leaf-litter decomposition due to concomitant soil drying also seems reasonable for several reasons in our study. Soil moisture under mixedwoods at the study site is lower than hardwoods due to greater interception of precipitation by the coniferous canopies due to the generally higher leaf area index than deciduous tree species as well as more persistent foliage [23]. Mixedwoods at the site are also productive ecosystems with active roots that pump water from the soil, thereby creating overall dry soil conditions in the uppermost 15 cm [12]. Another possibility is that the needle-rich litterfall promotes some water repellency properties to the forest floor [46], but this was not tested at the site.
Moreover, mean soil VWC over the eleven monitoring dates was, on average, 22% lower in the warmed plots (mean: 11.2%) compared to the control plots (mean: 14.3%) (Figure 5). The soil drying effect induced by artificial warming resulted in a statistically significant difference due to the consistency of the lower soil VWC readings in the heated plots. However, this result needs to be inferred with care considering that the divergence between treatments (mean = 3.09%; 1.45% to 4.96% depending on sampling dates) is equivalent to the TDR meter error (i.e., 3% VWC). As discussed above, soil moisture values are intrinsically low in the SBL mixedwoods. According to Datta et al. [47], a sandy soil at saturation will exhibit a VWC of no more than 30%, whereas at field capacity and permanent wilting point, VWC is closer to 20 and 7%, respectively. Our VWC data thus suggest that soil moisture conditions vary between field capacity during the wetter periods and the wilting point during the drier periods, or slightly below the wilting point in the heated plots for a few measurement dates.
In their meta-analysis, Wu et al. [18] also showed that most laboratory incubation studies resulted in increased leaf-litter decomposition with augmented temperatures, while moisture availability remained steady and at adequate levels (controlled conditions). In contrast, there is compelling evidence that precipitation addition and removal lead to significant increases and decreases in plant litter decomposition, respectively, including forest leaf litters and needles [18]. A moisture deficit that is associated with artificial heating (and consequently evapotranspiration) is thus a likely reason for the unchanged decomposition rates of tree species litters in our study, considering that the experiment was set in mixedwoods where soils are intrinsically dry. The faster decomposition of green tea litter in the same plots, on the other hand, can be explained by the more efficient retention of water (compared to the pristine leaf litters of tree species) due to its fragmented nature, which is also more prone to microbial attack because of its larger surface area [45].
The divergence in soil VWC between treatments appeared to be greater during the warm summer months (i.e., June–August; Figure 4), suggesting that suppression of microbial activity to water stress could have been more severe during that period, especially from the end of May to mid-June and at the onset of August, when soil VWC was quite low. However, we observed differences in soil VWC regardless of whether soil conditions reflected drier or wetter conditions; this included the whole month of May during drying after snowmelt. Bélanger et al. [20] also observed very low soil water potential during dry and hot spells in the spring before leaf out, which resulted in a large energy flux to the soil surface, promoting evapotranspiration. It is thus difficult to suggest that the adverse effects of artificial soil warming on soil microbial activity and litter decomposition would be restricted to just the summer months. The vulnerability to drought of northeastern North American forests seems to be increasing under climate change as a whole [48].
For the sake of comparison, we measured an average decrease in soil VWC of 22% due to a ~3.5 °C increase in soil temperature, whereas Allison et al. [49] measured an identical decrease in soil moisture (22%) despite a warming of 0.5 °C using closed-top chambers. There are many published light flux measurements under forest canopies at the research site in July, including mixedwoods, to suggest that the soil warming treatment at our site is considerable relative to solar irradiance impacting the soil surface directly. The light flux is about 13 mol m−2 d−1 in mixewoods [23], or 241 μmol m−2 s−1. This is equivalent to 52 W m−2 d−1 for a 15-h day in July in southern Quebec. Our treatment yields 395 W per 4 m2 plot (80 feet of cable in total) or 49.4 W m−2 d−1 because soils are warmed 12 h per day in July (i.e., 9 cycles during night-time and 3 cycles during day-time). The treatment therefore has similar strength to the solar flux if we consider the amount of energy directly impacting the soil, and this effect is stronger during the early and late periods of the growing season as days are shorter (less solar energy), while heating cycles are augmented to 15–16 to adjust to photoperiod and maintain the temperature difference. This boosts the artificial energy flux to 60–65 W m−2 d−1. This is, however, a rough estimate of the impacts of the artificial energy flux on soil water evaporation, because the relationship between soil water retention curves (and hydraulic conductivities) and the soil heat flux is expected to be nonlinear, and as such, it should be modeled properly (e.g., SWAP [50]) with a whole set of input variables which we did not have. Moreover, atmospheric demand (expressed as vapor pressure deficit, which is exponentially related to air temperature) is the main driver of evapotranspiration of whole ecosystems, not the heat flux per se [51,52]. The impact of the increased soil heat flux on soil moisture is thus expected to be limited.
Nutrient availability is likely another factor that could exert some control over leaf-litter decomposition. Experimental warming of forest soils mostly leads to increased mineralization, nitrification, and soil and foliage levels [14]. In boreal forests, increased N availability due to N additions can reduce the structure and diversity of fungal communities as well as decomposer biomass [49,53]. In this respect, Romero-Olivares et al. [40] suggested that increases in soil N due to warming could have similar adverse effects on litter decomposition rates. Conversely, PRS data in our study suggest a decrease in soil N activity in both forest stands, albeit not statistically significant due to large variations in the data (Figure 6). Although concomitant reductions in NH4 and NO3 uptake by plants and microbes and N mineralization due to soil drying can mask changes in soil N availability [54], low soil moisture is generally expected to reduce soil microbial activity and mineralization of N and other nutrients [55]. We suggest that the latter is observed with both soil solution NH4 and NO3 data, and as such, these data are another indirect indication that soil drying due to warming in this intrinsically dry environment can mask the benefits of increased temperatures on soil decomposer biomass and activity.

4. Conclusions

No difference in litter mass loss was detected between control and warmed plots. This was likely due to a concomitant drying of the soil, and it will thus be relevant to test if soil drying negatively affects biomass and activity of decomposers. Mass loss data indicated no suppression of leaf-litter decomposition under acidic “boreal” soils in our study compared to the same litter decomposing at the surface of typically “better” soils in more southern hardwood sites (e.g., Hubbard Brook and Harvard Forests). At first glance, our results thus imply that climate change would exert a marginal influence on leaf-litter dynamics of temperate tree species on soils that are characteristic of the boreal forest (i.e., acidic, nutrient-poor, and drier). Based on our data, northward migration or assisted migration of these four temperate deciduous tree species into boreal forests would likely not be compromised by a decreased ability to condition soils with their litters.
However, many uncertainties remain. These results can probably be repeated so long as plant phenology, understory composition and density, and the quality and quantity of litterfall remain relatively constant. This is a major assumption considering that the understory appears to be slowly thinning in some of the heated plots (N. Bélanger, personal observation). Unfortunately, changes in understory plant species and density have not been systematically measured in the plots but could play an important role on litter decomposition in the long term under climate change. The extent of the soil drying also needs to be further documented and modeled, and it remains uncertain how microbes and litter decomposition will respond to soil warming under an array of conditions in water availability. The study year was characterized by periods of substantial water stress, but it was not an exceptionally dry year. For example, two heatwaves were recorded before June 21 of the previous year (i.e., 2020) and the second one affected southern Quebec for more than one week. This was the first time in recorded history that two heatwaves hit Quebec prior to the summer solstice, with 70% less rain than normal in June. This was accompanied by an exceptional drought with unusually high soil temperatures and low water potentials in May and June, not long after snowmelt had been completed on site [12]. Conditions cooled off and precipitations were more abundant after a third, but shorter heatwave in mid-July. Soil water potentials in 2021 were well above those in 2020 (N. Bélanger, unpublished data). It would be relevant, therefore, to test leaf-litter dynamics during a summer with significantly dry periods (as predicted by climate models for Quebec) and verify whether our initial hypothesis of decreased leaf-litter decomposition rates due to soil warming/drying can be validated.
Conversely, it would be relevant to test litter dynamics during wet years and verify if artificial warming, despite some drying of the soil, produces conditions that are conducive to litter decomposition and increased mass loss compared to control conditions (similar to what was observed with green tea bags). Furthermore, microbes and litter decomposition may have responded differently had we artificially heated the soils during the whole winter, thus also affecting snow depth, the length of the snow-free periods, and possibly freeze-thaw cycles, all capable of affecting biological activity [24]. It is only through a series of consecutive artificial soil warming experiments encompassing various hydroclimatic and snow conditions that the response of litter to climate change can be fully elucidated.

Author Contributions

Conceptualization: N.B.; methodology, data curation and laboratory analysis: N.B. and C.C.-R.; writing—original draft: N.B.; writing—review and editing: C.C.-R. All authors have read and agreed to the published version of the manuscript.

Funding

Financial support was provided to N.B. by the Natural Sciences and Engineering Research Council of Canada (NSERC Discovery grant: RGPIN 2020-04931), together with grants from the Canada Foundation for Innovation John R. Evans Leaders Fund (35370) and the Innovation Fund (36014). An Undergraduate Student Research Award (USRA) by NSERC and a USRA supplement by Fonds de recherche du Québec – Nature et technologies were also awarded to C.C.-R.

Institutional Review Board Statement

Not applicable.

Informed Consent Statement

Not applicable.

Data Availability Statement

Please contact the corresponding author.

Acknowledgments

We wish to thank Alexandre Collin and Simon Lebel-Desrosiers for their assistance in setting up the experimental plots and Charlène Mélançon and Theo Stathopoulos for their help in preparing the litterbags. We are also grateful to the staff at SBL for providing access to the site and research facilities and to William F.J. Parsons for editing a draft of the manuscript.

Conflicts of Interest

The authors declare no conflict of interest.

References

  1. Allen, C.D.; Macalady, A.K.; Chenchouni, H.; Bachelet, D.; McDowell, N.; Vennetier, M.; Kitzberger, T.; Rigling, A.; Breshears, D.D.; Hogg, E.H.; et al. A global overview of drought and heat-induced tree mortality reveals emerging climate change risks for forests. For. Ecol. Manag. 2015, 259, 660–684. [Google Scholar] [CrossRef]
  2. Salomón, R.L.; Peters, R.L.; Zweifel, R.; Sass-Klaassen, U.G.W.; Stegehuis, A.I.; Smiljanic, M.; Poyatos, R.; Babst, F.; Cienciala, E.; Fonti, P.; et al. The 2018 European heatwave led to stem dehydration but not to consistent growth reductions in forests. Nat. Commun. 2022, 13, 28. [Google Scholar] [CrossRef] [PubMed]
  3. Smith, N.E.; Kooijmans, L.M.J.; Koren, G.; van Schaik, E.; van der Woude, A.M.; Wanders, N.; Ramonet, M.; Xueref-Remy, I.; Siebicke, L.; Manca, G.; et al. Spring enhancement and summer reduction in carbon uptake during the 2018 drought in northwestern Europe. Philos. Trans. R. Soc. B 2020, 375, 20190509. [Google Scholar] [CrossRef]
  4. Beckage, B.; Osborne, B.; Gavin, D.G.; Perkins, T. A rapid upward shift of a forest ecotone due to warming. Proc. Natl. Acad. Sci. USA 2008, 105, 4197–4202. [Google Scholar] [CrossRef] [PubMed]
  5. Boisvert-Marsh, L.; Périé, C.; De Blois, S. Shifting with climate? Evidence for recent changes in tree species distribution. Ecosphere 2014, 5, 83. [Google Scholar] [CrossRef]
  6. Sittaro, F.; Paquette, A.; Messier, C.; Nock, C.A. Tree range expansion in eastern North America fails to keep pace with climate warming at northern range limits. Glob. Chang. Biol. 2017, 23, 3292–3301. [Google Scholar] [CrossRef]
  7. Clark, J.S.; Bell, D.M.; Kwit, M.C.; Zhu, K. Competition-interaction landscapes for the joint response of forests to climate change. Glob. Chang. Biol. 2014, 20, 1979–1991. [Google Scholar] [CrossRef]
  8. Wilson, J.B.; Agnew, A.D.Q. Positive-feedback switches in plant communities. Adv. Ecol. Res. 1992, 23, 263–336. [Google Scholar] [CrossRef]
  9. Guisan, A.; Thuiller, W. Predicting species distribution: Offering more than simple habitat models. Ecol. Lett. 2005, 8, 993–1009. [Google Scholar] [CrossRef]
  10. Ettinger, A.K.; Hille Ris Lambers, J. Climate isn’t everything: Competitive interactions and variation by life stage will also affect range shifts under warming. Am. J. Bot. 2013, 100, 1344–1355. [Google Scholar] [CrossRef] [Green Version]
  11. Lafleur, B.; Paré, D.; Munson, A.D.; Bergeron, Y. Response of forests to climate change: Will soil conditions constrain tree species migration? Environ. Rev. 2010, 18, 279–289. [Google Scholar] [CrossRef]
  12. Collin, A.; Messier, C.; Bélanger, N. Conifer presence may negatively affect sugar maple’s ability to migrate into the boreal forest through reduced foliar nutritional status. Ecosystems 2017, 20, 701–716. [Google Scholar] [CrossRef]
  13. Lin, D.; Xia, J.; Wan, S. Climate warming and biomass accumulation of terrestrial plants: A meta-analysis. New Phytol. 2010, 188, 187–198. [Google Scholar] [CrossRef]
  14. Bai, E.; Li, S.; Xu, W.; Li, W.; Dai, W.; Jiang, P. A meta-analysis of experimental warming effects on terrestrial N pools/dynamics. New Phytol. 2013, 199, 441–451. [Google Scholar] [CrossRef]
  15. Lu, M.; Zhou, X.; Yang, Q.; Li, H.; Luo, Y.; Fang, C.; Chen, J.; Yang, X.; Li, B. Responses of ecosystem C cycle to experimental warming: A meta-analysis. Ecology 2013, 94, 726–738. [Google Scholar] [CrossRef]
  16. Carey, J.; Tang, J.; Templer, P.H.; Kroeger, K.D.; Crowther, T.W.; Burton, A.J.; Dukes, J.S.; Emmett, B.; Frey, S.D.; Heskel, M.A.; et al. Temperature response of Rs largely unaltered with experimental warming. Proc. Natl. Acad. Sci. USA 2016, 113, 13797–13802. [Google Scholar] [CrossRef]
  17. Berg, B.; McClaugherty, C. Plant Litter: Decomposition, Humus Formation, Carbon Sequestration; Springer: Berlin/Heidelberg, Germany, 2008. [Google Scholar] [CrossRef]
  18. Wu, Q.; Yue, K.; Wang, X.; Ma, Y.; Li, Y. Differential responses of litter decomposition to warming, elevated CO2, and changed precipitation regime. Plant Soil 2020, 455, 155–169. [Google Scholar] [CrossRef]
  19. Savage, C. Recolonisation Forestière dans les Basses Laurentides au sud du Domaine Climacique de L’érablière à Bouleau Jaune. Master’s Thesis, Université de Montréal, Montréal, QC, Canada, 2001. [Google Scholar]
  20. Bélanger, N.; Collin, A.; Khlifa, R.; Lebel-Desrosiers, S. Balsam fir and American beech influence soil respiration rates in opposite directions in a sugar maple forest near its northern range limit. Front. For. Glob. Chang. 2021, 4, 664584. [Google Scholar] [CrossRef]
  21. Bélanger, N.; Holmden, C.; Courchesne, F.; Côté, B.; Hendershot, W.H. Constraining soil mineral weathering 87Sr/86Sr for calcium apportionment studies of a deciduous forest growing on soils developed from granitoid igneous rocks. Geoderma 2012, 185, 84–96. [Google Scholar] [CrossRef] [Green Version]
  22. Soil Classification Working Group. The Canadian System of Soil Classification, 3rd ed.; Publication 1646; Agriculture and Agri-Food Canada: Ottawa, ON, Canada, 1998.
  23. Collin, A.; Messier, C.; Kembel, S.W.; Bélanger, N. Can sugar maple establish into the boreal forest? Insights from seedlings. Ecosphere 2018, 9, e02022. [Google Scholar] [CrossRef]
  24. Sanders-DeMott, R.; Templer, P.H. What about winter? Integrating the missing season into climate change experiments in seasonally snow covered ecosystems. Methods Ecol. Evol. 2017, 8, 1183–1191. [Google Scholar] [CrossRef]
  25. Topp, G.C.; Davis, J.L.; Annan, A.P. Electromagnetic determination of soil water content: Measurement in coaxial transmission lines. Water Resour. Res. 1980, 16, 574–582. [Google Scholar] [CrossRef]
  26. Bilodeau-Gauthier, S.; Paré, D.; Messier, C.; Bélanger, N. Root production of hybrid poplars and nitrogen mineralization improve following mounding of boreal Podzols. Can. J. For. Res. 2013, 43, 1092–1103. [Google Scholar] [CrossRef]
  27. Gosz, J.R.; Likens, G.E.; Bormann, F. Nutrient release from decomposing leaf and branch litter in the Hubbard Brook Forest, New Hampshire. Ecol. Monogr. 1973, 43, 173–191. [Google Scholar] [CrossRef]
  28. Melillo, J.M.; Aber, J.D.; Muratore, J.F. Nitrogen and lignin control of hardwood leaf litter decomposition dynamics. Ecology 1982, 63, 621–626. [Google Scholar] [CrossRef]
  29. Côté, B.; Fyles, J.W. Leaf litter disappearance of hardwood species of southern Quebec: Interaction between litter quality and stand type. Ecoscience 1994, 1, 322–328. [Google Scholar] [CrossRef]
  30. Moore, T.R.; Trofymow, J.A.; Taylor, B.; Prescott, C.; Camiré, C.; Duchesne, L.; Fyles, J.; Kozak, L.; Kranabetter, M.; Morrison, I.; et al. Rates of litter decomposition in Canadian forests. Glob. Chang. Biol. 1999, 5, 75–82. [Google Scholar] [CrossRef]
  31. Prescott, C.E. Litter decomposition: What controls it and how we can alter it to sequester more carbon in forest soils? Biogeochemistry 2010, 101, 133–149. [Google Scholar] [CrossRef]
  32. Marley, A.R.G.; Smeaton, C.; Austin, W.E.N. An assessment of the tea bag index method as a proxy for organic matter decomposition in intertidal environments. J. Geophys. Res. Biogeosci. 2019, 124, 2991–3004. [Google Scholar] [CrossRef]
  33. Blume-Werry, G.; Di Maurizio, V.; Beil, I.; Lett, S.; Schwieger, S.; Kreyling, J. Don’t drink it, bury it: Comparing decomposition rates with the tea bag index is possible without prior leaching. Plant Soil 2021, 465, 613–621. [Google Scholar] [CrossRef]
  34. Bradford, M.A.; Berg, B.; Maynard, D.S.; Wieder, W.R.; Wood, S.A. Understanding the dominant controls on litter decomposition. J. Ecol. 2016, 104, 229–238. [Google Scholar] [CrossRef]
  35. McHale, P.J.; Mitchell, M.J. Soil warming in a northern hardwood forest: Trace gas fluxes and leaf litter decomposition. Can. J. For. Res. 1998, 28, 1365–1372. [Google Scholar] [CrossRef]
  36. Rustad, L.E.; Fernandez, I.J. Soil warming: Consequences for foliar litter decay in a spruce-fir forest in Maine, USA. Soil Sci. Soc. Amer. J. 1998, 62, 1072–1080. [Google Scholar] [CrossRef]
  37. Xu, Z.; Pu, X.Z.; Yin, H.; Zhao, C.; Liu, Q.; Wu, F. Warming effects on the early decomposition of three litter types, Eastern Tibetan Plateau, China. Eur. J. Soil Sci. 2012, 63, 360–367. [Google Scholar] [CrossRef]
  38. Berbeco, M.R.; Melillo, J.M.; Orians, C.M. Soil warming accelerates decomposition of fine woody debris. Plant Soil 2012, 356, 405–417. [Google Scholar] [CrossRef]
  39. Kasurinen, A.; Silfver, T.; Rousi, M.; Mikola, J. Warming and ozone exposure effects on silver birch (Betula pendula Roth) leaf litter quality, microbial growth and decomposition. Plant Soil 2017, 414, 127–142. [Google Scholar] [CrossRef]
  40. Romero-Olivares, A.L.; Allison, S.D.; Treseder, K.K. Decomposition of recalcitrant carbon under experimental warming in boreal forest. PLoS ONE 2017, 12, e0179674. [Google Scholar] [CrossRef]
  41. Keuskamp, J.A.; Dingemans, B.J.J.; Lehtinen, T.; Sarneel, J.M.; Hefting, M.M. Tea Bag Index: A novel approach to collect unifoirm decomposition data across ecosystems. Methods Ecol. Evol. 2013, 4, 1070–1075. [Google Scholar] [CrossRef]
  42. Djukic, I.; Guerra, C.A.; Maestre, F.T.; Hagedorn, F.; Oggioni, A.; Bergami, C.; Magagna, B.; Kwon, T.; Shibata, H.; Eisenhauer, N.; et al. The TeaComposition Initiative: Unleashing the power of international collaboration to understand litter decomposition. Soil Org. 2021, 93, 73–78. [Google Scholar] [CrossRef]
  43. Duddigan, S.; Shaw, L.J.; Alexander, P.D.; Collins, C.D. Chemical underpinning of the tea bag index: An examination of the decomposition of tea leaves. Appl. Environ. Soil Sci. 2020, 2020, 6085180. [Google Scholar] [CrossRef]
  44. Mori, T.; Nakamura, R.; Aoyagi, R. Risk of misinterpreting the tea bag index: Field observations and a random simulation. Ecol. Res. 2022, 37, 381–389. [Google Scholar] [CrossRef]
  45. Didion, M.; Repo, A.; Liski, J.; Forsius, M.; Bierbaumer, M.; Djukic, I. Towards harmonizing leaf litter decomposition studies using standard tea bags—A field study and model application. Forests 2016, 7, 167. [Google Scholar] [CrossRef]
  46. Butzen, V.; Seeger, M.; Marruedo, A.; de Jonge, L.; Wengel, R.; Ries, J.B.; Casper, M.C. Water repellency under coniferous and deciduous forest—Experimental assessment and impact on overland flow. Catena 2015, 133, 255–265. [Google Scholar] [CrossRef]
  47. Datta, S.; Taghvaeian, S.; Stivers, J. Understandiung Soil Water Content and Thresholds for Irrigation Management. Oklahoma Cooperative Extension Service, Report BAE-1573; Division of Agriculture Sciences and Natural resources, Oklahoma State University: Stillwater, OK, USA, 2017. [Google Scholar]
  48. Coble, A.P.; Vadeboncoeur, M.A.; Carter Berry, Z.; Jennings, K.A.; McIntire, C.D.; Campbell, J.L.; Rustad, L.E.; Templer, P.H.; Asbjornsen, H. Are Northeastern, U.S. forests vulnerable to extreme drought? Ecol. Process. 2017, 6, 34. [Google Scholar] [CrossRef]
  49. Allison, S.D.; Hanson, C.A.; Treseder, K.K. Nitrogen fertilization reduces diversity and alters community structure of active fungi in boreal ecosystems. Soil Biol. Biochem. 2007, 39, 1878–1887. [Google Scholar] [CrossRef]
  50. Kroes, J.G.; Wesseling, J.G.; Van Dam, J.C. Integrated modelling of the soil-water-atmosphere-plant system using the model SWAP 2.0. An overview of theory and an application. Hydrol. Process. 2000, 14, 1993–2002. [Google Scholar] [CrossRef]
  51. Massmann, A.; Gentine, P.; Lin, C. When does vapor pressure deficit drive or reduce evapotranspiration? J. Adv. Model. Earth Syst. 2019, 11, 3305–3320. [Google Scholar] [CrossRef]
  52. Zhang, Q.; Manzoni, S.; Katul, G.; Porporato, A.; Yang, D. The hysteretic evapotranspiration—Vapor pressure deficit relation. J. Geophys. Res. Biogeosci. 2014, 119, 125–140. [Google Scholar] [CrossRef]
  53. Treseder, K.K. Nitrogen additions and microbial biomass: A meta-analysis of ecosystem studies. Ecol Lett. 2008, 11, 1111–1120. [Google Scholar] [CrossRef] [Green Version]
  54. Gao, D.; Bai, E.; Li, M.; Zhao, C.; Yu, K.; Hagedorn, F. Responses of soil nitrogen and phosphorus cycling to drying and rewetting cycles: A meta-analysis. Soil Biol. Biochem. 2020, 148, 107896. [Google Scholar] [CrossRef]
  55. Borken, W.; Matzner, E. Reappraisal of drying and wetting effects on C and N mineralization and fluxes in soil. Glob. Chang. Biol. 2009, 15, 808–824. [Google Scholar] [CrossRef]
Figure 1. Soil temperatures of warmed and control plots in 2021 for the fir–maple–birch stand (upper panel) and cedar–maple–birch stand (lower panel). Each line is the mean of all plots in both stands (5× warmed plots; 5× control plots). The differential line was obtained by calculating the difference between warmed and control plots of each paired plots and then computing the mean of these individual lines (5×). The general mean of the differential data line is shown in the panel.
Soilsystems 07 00014 g001
Figure 2. Snow cover on 1 December 2020 in the warmed (a) and control (b) plots of one paired plot.
Soilsystems 07 00014 g002
Figure 3. Mass remaining of leaf litter per tree species (species indicated in panels) in warmed and control plots of both stands. The rectangle spans the 25th and 75th percentiles and the horizontal and dashed lines inside the box are the median and mean, respectively. Whiskers indicate the 5th and 95th percentiles. Linear mixed-effect models revealed no significant change in mass loss (P > 0.05) due to artificial warming for any of the species tested during the different sampling dates, and as such, no statistical results are shown.
Soilsystems 07 00014 g003
Figure 4. Mass remaining of green tea litter (boxes) in comparison to tree species (LTA is large-tooth aspen, AB is American beech, RM is red maple, and SM is sugar maple). For tree species, a simple mean of the warmed and control plots in Figure 3 are shown. For green tea, data for warmed and control plots of both stands are shown. In this case, the rectangle spans the 25th and 75th percentiles and the horizontal and dashed lines inside the box are the median and mean, respectively. Whiskers indicate the 5th and 95th percentiles. Linear mixed-effect models revealed a significant change in mass loss of green tea due to artificial warming (P < 0.05) during the three last sampling dates, and as such, these statistical differences are denoted by * next to the number of days since incubation (x-axis).
Soilsystems 07 00014 g004
Figure 5. Soil volumetric water content in warmed and control plots of both stands in 2021. We show the means of all paired plots (10× warmed plots; 10× control plots) for each monitoring date (11×). The full horizontal lines are the means of both treatments, whereas the dashed lines are estimates of field capacity and wilting point for a typical sandy soil [47] such as in this study. P < 0.001 in the panel indicates that the warmed plots had a significantly lower soil volumetric water content than the control plots.
Soilsystems 07 00014 g005
Figure 6. Soil solution NH4-N (a) and NO3-N (b) activity in warmed and control plots of both stands in 2021. Values are means of all plots (10×) and error bars are standard deviations. The linear mixed-effect model revealed only marginally significant changes in N dynamics due to artificial warming (P < 0.10), and as such, no statistical results are shown.
Soilsystems 07 00014 g006
Table 1. Total basal area of the two forest stands measured in 400 m2 quadrats (20 m × 20 m) and contributions (%) of basal area by conifers and deciduous tree species.
% of Basal Area
Total Basal Area (m2 ha−1)ConifersDeciduous
Fir-maple-birch77.233.366.7
Cedar-maple-birch85.845.454.6
Table 2. Contributions (%) of tree species to the L layer in the two forest stands.
Maple spp.Birch
spp.
Large-Tooth
Aspen
American
Beech
White
Cedar
Needles
Fir-maple-birch48.8 (22.4)38.8 (23.0)4.14 (8.63)0.00 (0.00)0.00 (0.00)8.21 (4.12)
Cedar-maple-birch45.1 (11.5)14.8 (10.1)1.15 (1.24)0.09 (0.20)38.8 (7.08)0.00 (0.00)
Note: Litterfall composition was characterized for each pair of plots by collecting the L-layer in a 1 m2 quadrat (1 m × 1 m) just outside the paired plots. Material was air-dried for several days, sorted by species, and then weighed. For the species of Acer and Betula, the relatively advanced stage of decomposition of some leaves made it impossible to differentiate between species. Thus, leaves were grouped as ‘Maple’ and ‘Birch’ spp. Similarly, balsam fir and eastern hemlock needles were difficult to differentiate. Thus, they were grouped as ‘Needles’.
Table 3. Typical soil chemical composition under both forest stands.
pHCNC:NPO4-PCaAl
______ % ______ ______ mg Per kg of Soil ______
Forest floorFir-maple-birch4.88 (0.13)37.9 (7.16)1.86 (0.32)20.4 (2.00)77.7 (59.8)3589 (1217)995 (696)
Cedar-maple-birch 4.48 (0.33)44.4 (1.41)2.12 (0.05)21.0 (0.93)88.8 (35.2)3779 (547)329 (64.7)
Upper B horizonFir-maple-birch5.25 (0.22)9.36 (4.08)0.47 (0.12)19.3 (3.28)0.37 (0.18)250 (74.3)2105 (187)
Cedar-maple-birch4.73 (0.29)10.1 (2.82)0.49 (0.11)20.5 (2.27)0.46 (0.29)374 (160)1863 (325)
Note: One forest floor sample and one upper B-horizon (i.e., uppermost 20 cm) sample were collected from the 1 m2 quadrat (1 m × 1 m) just outside the paired plots to collect the L-layer (Table 2). The samples were air-dried in the laboratory and sieved through a 2 mm mesh to remove any coarse fragments. Bulk pH was measured in water using a 1:5 soil to water ratio for the forest floor samples and a 1:2 ratio for the mineral soil. Total C and N were determined on finely ground samples by high-temperature combustion, followed by infrared (C) and thermal conductivity (N) detection (EA 1108 CHNS-O Analyzer). Mehlich 3 extraction (Ziadi and Tran 2007) was performed on sieved samples to estimate soluble reactive PO43− as well as exchangeable Ca2+ and Al3+. Levels of PO4-P in the extracts were determined colorimetrically (molybdenum blue, Technicon Auto-Analyzer), whereas exchangeable Ca and Al were determined by atomic absorption/emission (AA-1475 Varian Spectrometer).
Table 4. Decomposition constants (k) computed for each tree species and green tea in warmed and control plots. Different letters among the ten groups indicate significant mean differences (P < 0.05) based on a one-way ANOVA and Tukey HSD test.
WarmedControl
Sugar maple0.00315 (0.00055) d0.00330 (0.00060) d
Green tea0.00226 (0.00031) c0.00212 (0.00025) c
Red maple0.00144 (0.00040) b0.00144 (0.00038) b
American beech0.00107 (0.00042) ab0.00094 (0.00024) ab
Large-tooth aspen0.00070 (0.00020) a0.00075 (0.00022) a
Disclaimer/Publisher’s Note: The statements, opinions and data contained in all publications are solely those of the individual author(s) and contributor(s) and not of MDPI and/or the editor(s). MDPI and/or the editor(s) disclaim responsibility for any injury to people or property resulting from any ideas, methods, instructions or products referred to in the content.

