Article

Evaluation of Soil Organic Carbon Storage of Atillo in the Ecuadorian Andean Wetlands

by
Andrés A. Beltrán-Dávalos
1,2,*,
Johanna Elizabeth Ayala Izurieta
2,3,
Magdy Mileni Echeverria Guadalupe
2,
Shari Van Wittenberghe
3,
Jesús Delegido
3,
Xosé Luis Otero Pérez
4 and
Agustín Merino
1
1
Departament of Soil Science and Agricultural Chemistry, Unit for Sustainable Environmental and Forest Management, University of Santiago de Compostela, E-27002 Lugo, Spain
2
Group of Research and Development for the Environment and Climate Change (GIDAC), Faculty of Sciences, Escuela Superior Politécnica de Chimborazo (ESPOCH), Riobamba 060155, Ecuador
3
Image Processing Laboratory (IPL), University of Valencia, 46980 Paterna, Spain
4
CRETUS, Department of Soil Science and Agricultural Chemistry, Faculty of Biology, University of Santiago de Compostela, 15782 Santiago de Compostela, Spain
*
Author to whom correspondence should be addressed.
Soil Syst. 2022, 6(4), 92; https://doi.org/10.3390/soilsystems6040092
Submission received: 20 October 2022 / Revised: 22 November 2022 / Accepted: 29 November 2022 / Published: 5 December 2022

Abstract

:
Identifying the SOC levels and revealing the potential of SOC storage of ecosystems difficult to sample and study are necessary contributions to the understanding of the global reserves of SOC. Wetlands store large amounts of SOC within their soils. They have an important role in water regulation and have great biological and floristic diversity. Therefore, this study aimed to assess the SOC stock in Atillo micro-watershed in the Ecuadorian Andean wetlands at two soil depths (0–30 cm and 30–60 cm below ground) and to assess the importance of the ecosystem and its conservation in favor of reducing emissions due to degradation processes. For that, we sampled the study zone with 101 composite samples of soil to obtain the SOC storage for each sample point in Mg/ha. A SOC estimation to evaluate its spatial distribution was performed using the geostatistical method Kriging. The results show a high storage capacity of the study zone with SOC values of 126 to 454 Mg/ha in the 0–30 cm soil profile and 148 to 350 Mg/ha in the 30–60 cm soil profile. The preservation and protection mechanisms of high SOC reserves should be taken into account to prevent the emission of CO2.

1. Introduction

Information about soil organic carbon (SOC) storage and the monitoring of soils with a great potential for carbon stock is of global interest due to its link to climate change mitigation [1,2] and due to the need to reduce the high concentrations of CO2 caused by population, being necessary to protect and preserve natural carbon sinks [3,4]. SOC studies have increased in the last years with a focus on different ecosystems, including forests, forest plantations, crops, and pastures [5,6]. SOC is the main terrestrial pool in the carbon cycle. Its variability and redistribution are widely studied for improving the accuracy of carbon assessment [7]. A large degree of variability in SOC functional group abundances showed changes at different elevations [8], and changing drying-wetting cycles in soil profiles could impact the soil C pool [9]. The concern of SOC losses has been triggering the evaluation of crop transitions and land use changes which have mainly been associated with the replacement of secondary vegetation and changes in soil properties [10]. Studies on the páramo region in Ecuador reveal a high capacity of SOC storage in the soils depending on soil types, among others factors [11]. Therefore, understanding the role of ecosystems in the global carbon cycle and their potential reserves is necessary in order to evaluate effects produced by climate change [12] and possible strategies in favor to climatic change mitigation using climate-carbon feedback [13].
Wetland environments at a global level contribute to the process of water regulation and are habitats of high biological and floristic diversity. Their flows with the environment are cataloged as the Earth’s more productive [14]. In high Andean tropical wetlands, the stock or emission of trace gases such as CH4, N2O, and CO2 is influenced by temperature levels related to altitude [15]. These flows are also characteristic of the Atillo lake system, formed in the periglacial geomorphology.
Wetlands maintain a broad classification according to three criteria (i.e., hydrological, vegetative, and edaphological), where lacustrine, fluvial, and marshy wetlands are the predominant classes in the high Andean zones. According to the Ramsar Convention and official data from the Ecuadorian Ministry of the Environment, in Ecuador, there are 18 wetlands over an area of 286,659 ha, of which 86% are located in protected areas, of which 8% are located in the Andean zone of the Ecuadorian highlands [16].
The lacustrine system of the Atillo River is an edaphic landscape inside the Sangay National Park. It is considered a World Heritage Site for its wealth of flora, fauna, and its elevation ranging from 2500 m.a.s.l. up to 4500 m.a.s.l. With low aerial biomass, the vegetation height of these ecosystems tends to decrease as elevation increases [17,18]. The accumulation levels of SOC vary from one ecosystem to another, and its formation maintains the relationship with its weathering processes and its geomorphology [19,20]. The elevation range and vegetation could also influence the level of SOC accumulation in the paramo region [21]. Hence, in medium and low terraces and valleys, there is the accumulation of allochthonous materials from the hills that surround a lacustrine system. Here the erosion is caused mainly by the effect of slope and elevation. Although dust emission redistributes SOC within terrestrial ecosystems and to the atmosphere and oceans [7], a redistribution of SOC by an effect of dust emission can be down on these wet soils that maintain a high field capacity in the hills higher than 3500 m.a.s.l and are saturated in the periglacial valley.
Weather conditions cause a cryogenic process in the evolutionary process of soil formation, which prevents an accelerated concentration of organic matter in its grasslands and wetlands. Also, a growth of the organic horizon (H) ranging from cm to several meters is produced. Wetlands are located in the tropics and subtropics [14] and, although they only cover a small proportion of the Earth’s land surface of 6% approximately, contain a large proportion of the world’s carbon 15 × 1011 t stored in terrestrial reservoirs [22,23]. Despite being an ecosystem of interest for conservation issues, agricultural activities are observed in areas where precipitation is greater than evapotranspiration. As a result, the draining necessary for the production or renewal of agricultural pastures leads to a reduction in the water mirror of the lacustrine wetlands and a decrease in the aquifer’s recharge. Therefore the agricultural systems could be more extensive and cause increased volatilization of organic carbon and loss of stability [24].
Temperature and humidity are predominant factors in the flux emission of CO2 and CH4 in high Andean marshy wetlands where acidic and anaerobic conditions are generated with strong sulfur odors [25]. Therefore, the development of methanogenic bacteria increases the concentrations of CH4 [26]. The presence of grasses and biological soil crusts formed by: lichens, bryophytes, mosses, and cyanobacteria are important components in many terrestrial ecosystems that store high concentrations of carbon [27]. Grasses as perennial vegetation, being cosmopolitan, constitute approximately 20 to 45% of the Earth’s vegetation cover [28] and offer ecosystem services such as resistance to frost, water storage, oxygen release, carbon stock, and CO2 fixation in high Andean ecosystems [29]. The low amount of aerial biomass and the moist conditions of the soil of periglacial systems without forests or shrubs contribute to a decrease in the photosynthetic process [5]; therefore, carbon sequestration takes place.
This study focuses on the Atillo lacustrine ecosystem in Chimborazo province, Ecuador, where we aimed to develop a process to identify SOC storage for all lithology types based on kriging method using in situ SOC data sampling. The objectives were: (i) to assess the SOC stock in the study zone at two soil depths (0–30 cm and 30–60 cm below ground) and (ii) to assess the importance of the ecosystem and its conservation in favor of reducing emissions due to degradation processes.

2. Materials and Methods

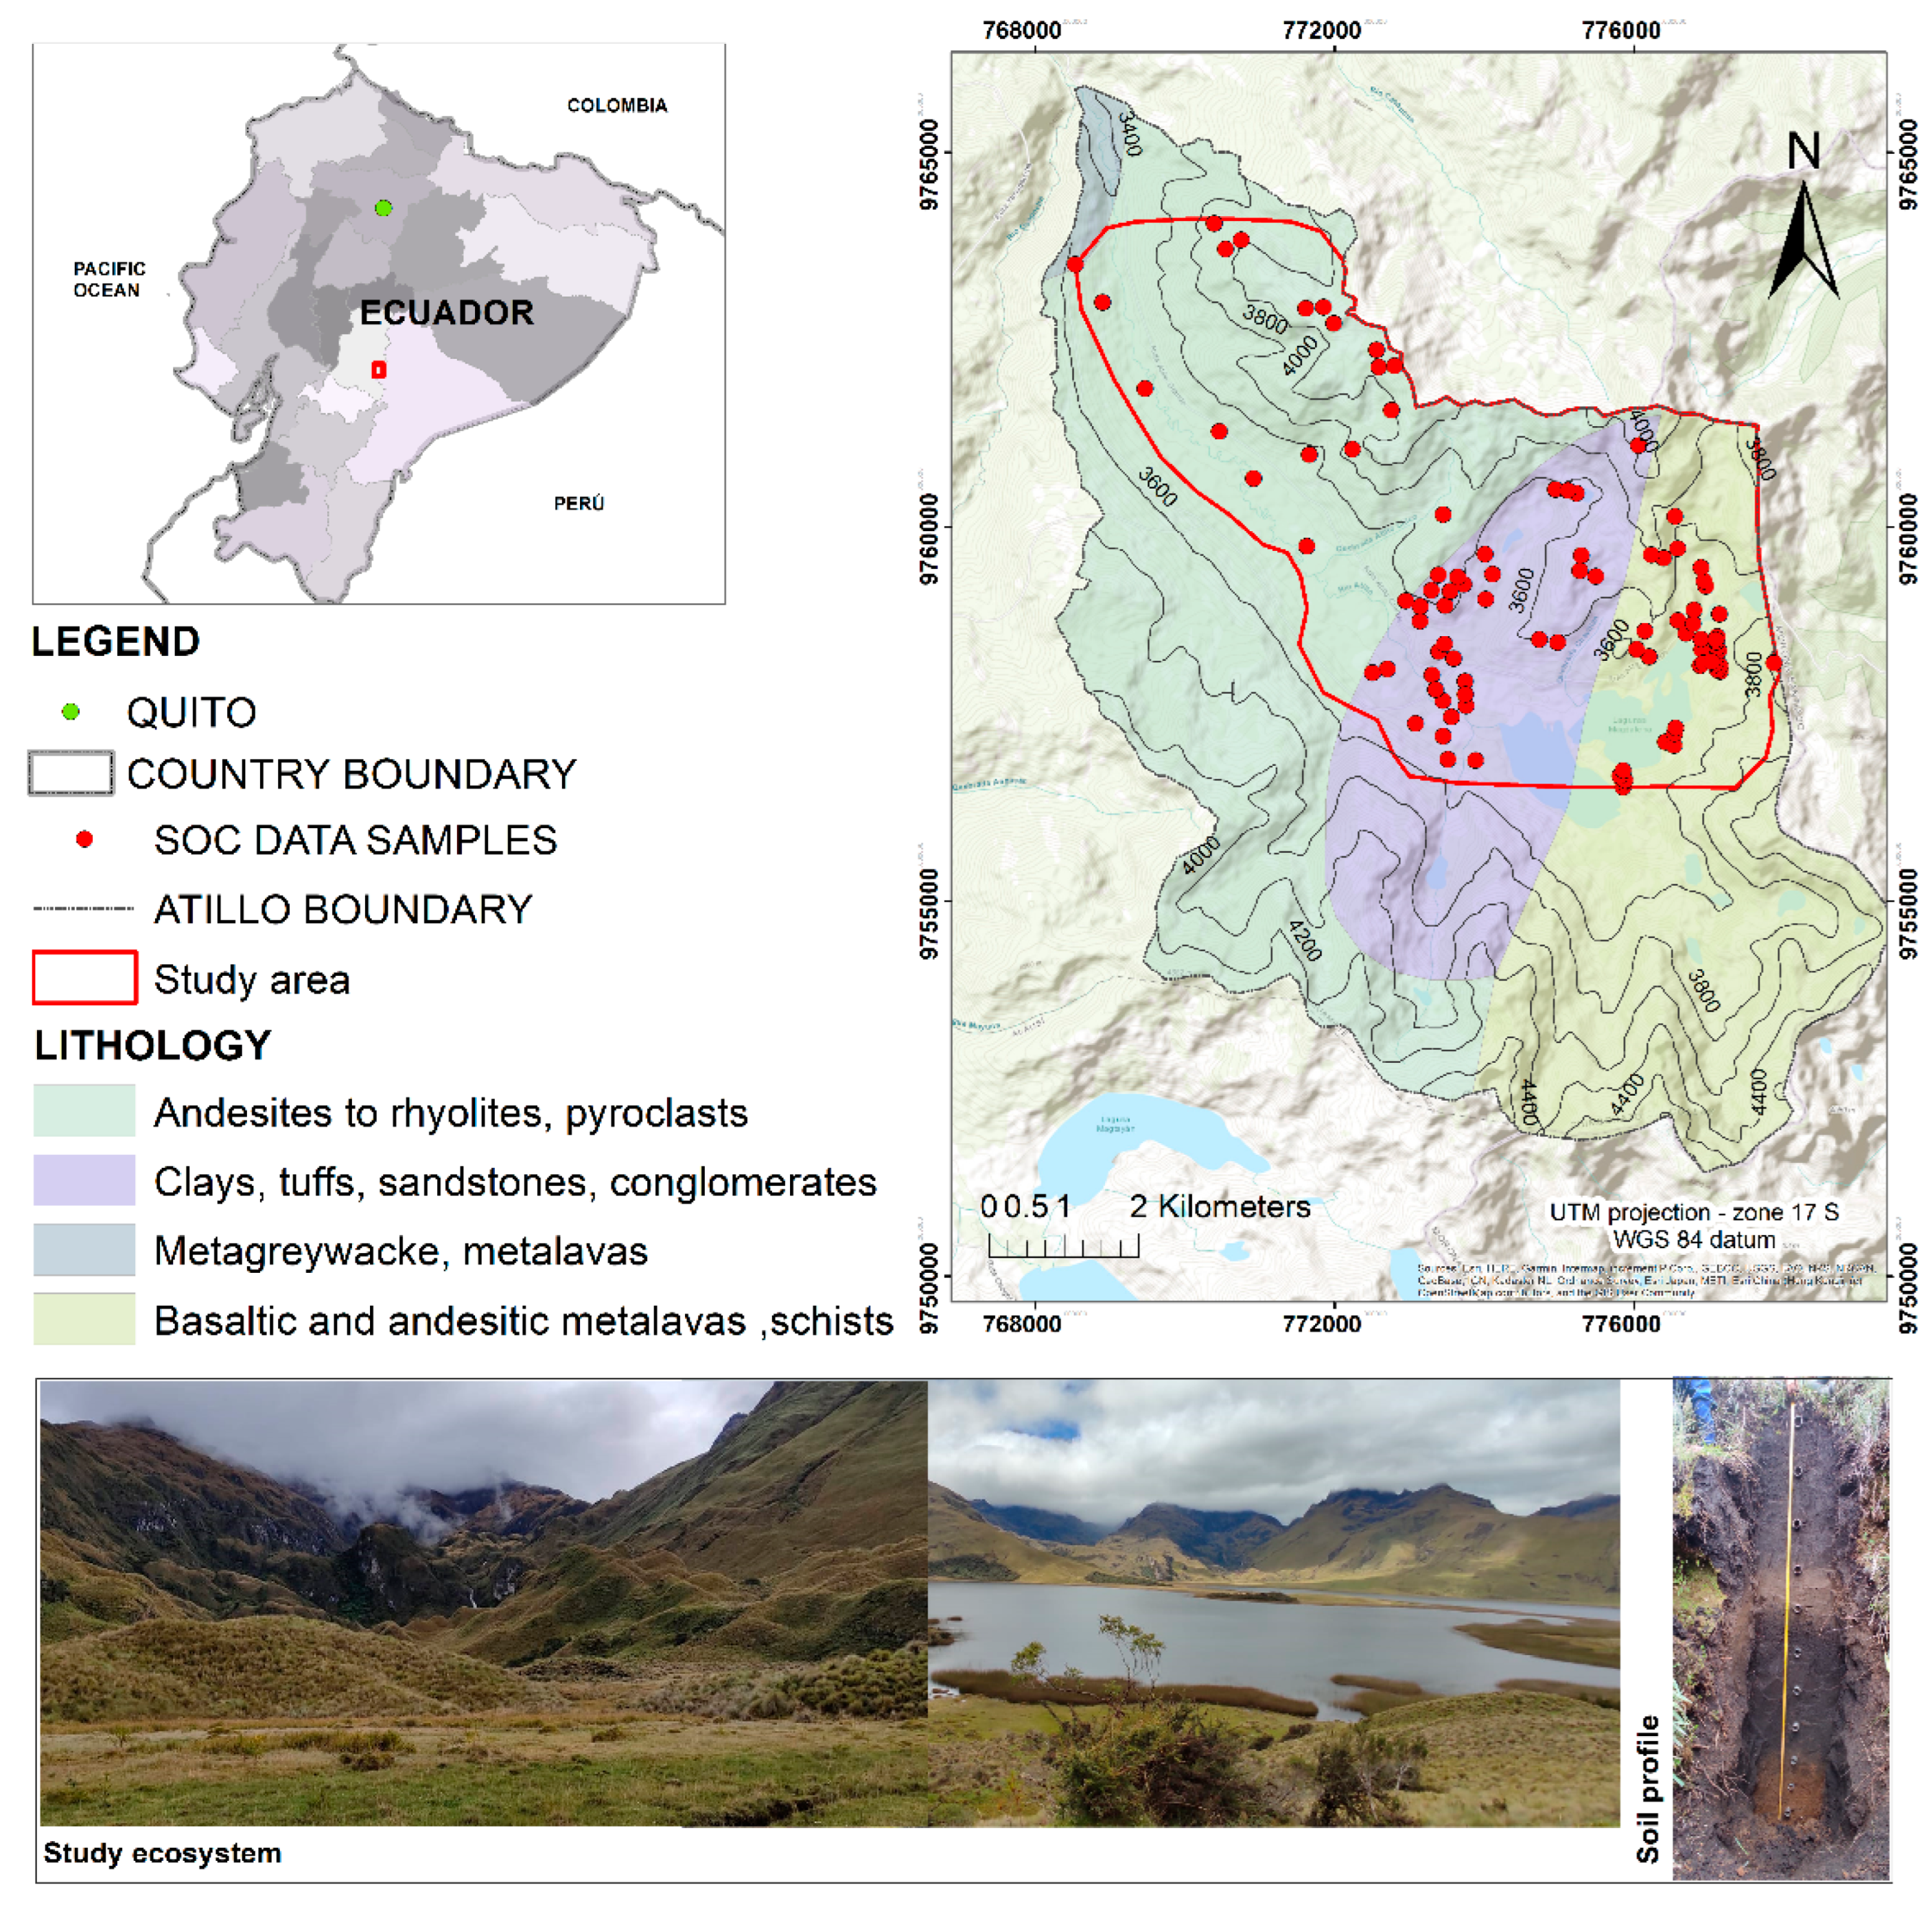
2.1. Location and General Properties of Study Area

The micro-watershed of the Atillo River (Sangay National Park reserve) is located in the Cebadas parish in the Chimborazo province, Ecuador, situated between 78°32′0″ west longitude and 2°12′0″ south latitude. The Atillo lagoon is ancestrally known as Colay and is a lacustrine system located in the periglacial geomorphology. The geological formations including to the geological ages of the Miocene-Pliocene and Jurassic, where the andesite lithologies, pyroclasts, claystone tuffs, conglomerates, and metagrauwacas schists and metalavas stand out, respectively [30]. With an area of 9448 ha and an elevation ranging from 3320 to 4616 m.a.s.l (average of 3960 m.a.s.l). This ecosystem has evident rejuvenation due to its rocky constitution observed at higher altitudes that are extremely difficult to access, especially over the south zone. Its valley, where surface runoff accumulates, maintains the form of meanders with a length of approximately 17.6 km. The relief is heterogeneous, flat areas are located in the valleys around the Atillo river, and the higher altitude areas form slopes and areas with steep relief. The difficulty of access for sampling is marked from the edges of the valley zone to the mountain profile due to the heterogeneous topography with steep slopes in some areas of the study zone. These areas are shown a rejuvenation of the soil due to its rocky composition. This study is developed over the periglacial valley area and surroundings of the Atillo lacustrine system, reaching an area of approximately 50 percent of the entire micro-watershed (see Figure 1).
The climate corresponds to an Upper High Montane type [31], with an average annual temperature ranging from 5.3 to 8.2 °C. The annual rainfall ranges from around 800 to 2500 mm [32], and the average annual evapotranspiration calculated ranges from 595 to 823 mm. The humid weather of the micro-watershed of Atillo river is characteristic of an altitudinal gradient with high humidity. The lacustrine system is contributed to by more than 250 hectares of the Atillo, Magdalena, Kuyuk, and Negra lagoons. The soils classified as Andisols, Entisols, Inceptisols, and Histosols, show high SOM contents and high porosity. The soil coloration is dark (10 YR), with characteristics of volcanic formations distinctive of Andean moors [33,34]. The predominant soils of the study area, according to [35], include Inceptisols and Histosols with acid characteristics in the foothills and river valley.
Land uses in Atillo include forest-1%; water bodies-4%; agricultural areas-15%; vegetation-80% (i.e., Evergreen Shrubland and Herbaceus Páramo-12%; Herbaceus Páramo 36%; Ultra-humid subnival Herbaceus Páramo 1%; Herbaceus and Evergreen Subnival Shrubland of the Páramo 8%); intervened areas 33% and other areas with 10% approximately. Anthropic activities in the study area are related to grazing. The effects of grazing are mainly to compact the soil and reduce its porosity, infiltration, and water retention capacity [36]. Also, the natural vegetation is in a fragile morphodynamic balance. Therefore, the implementation of irrigation projects or reservoirs in these areas could have irreversible impacts on the wetlands and the water regulation ecosystemic resource.

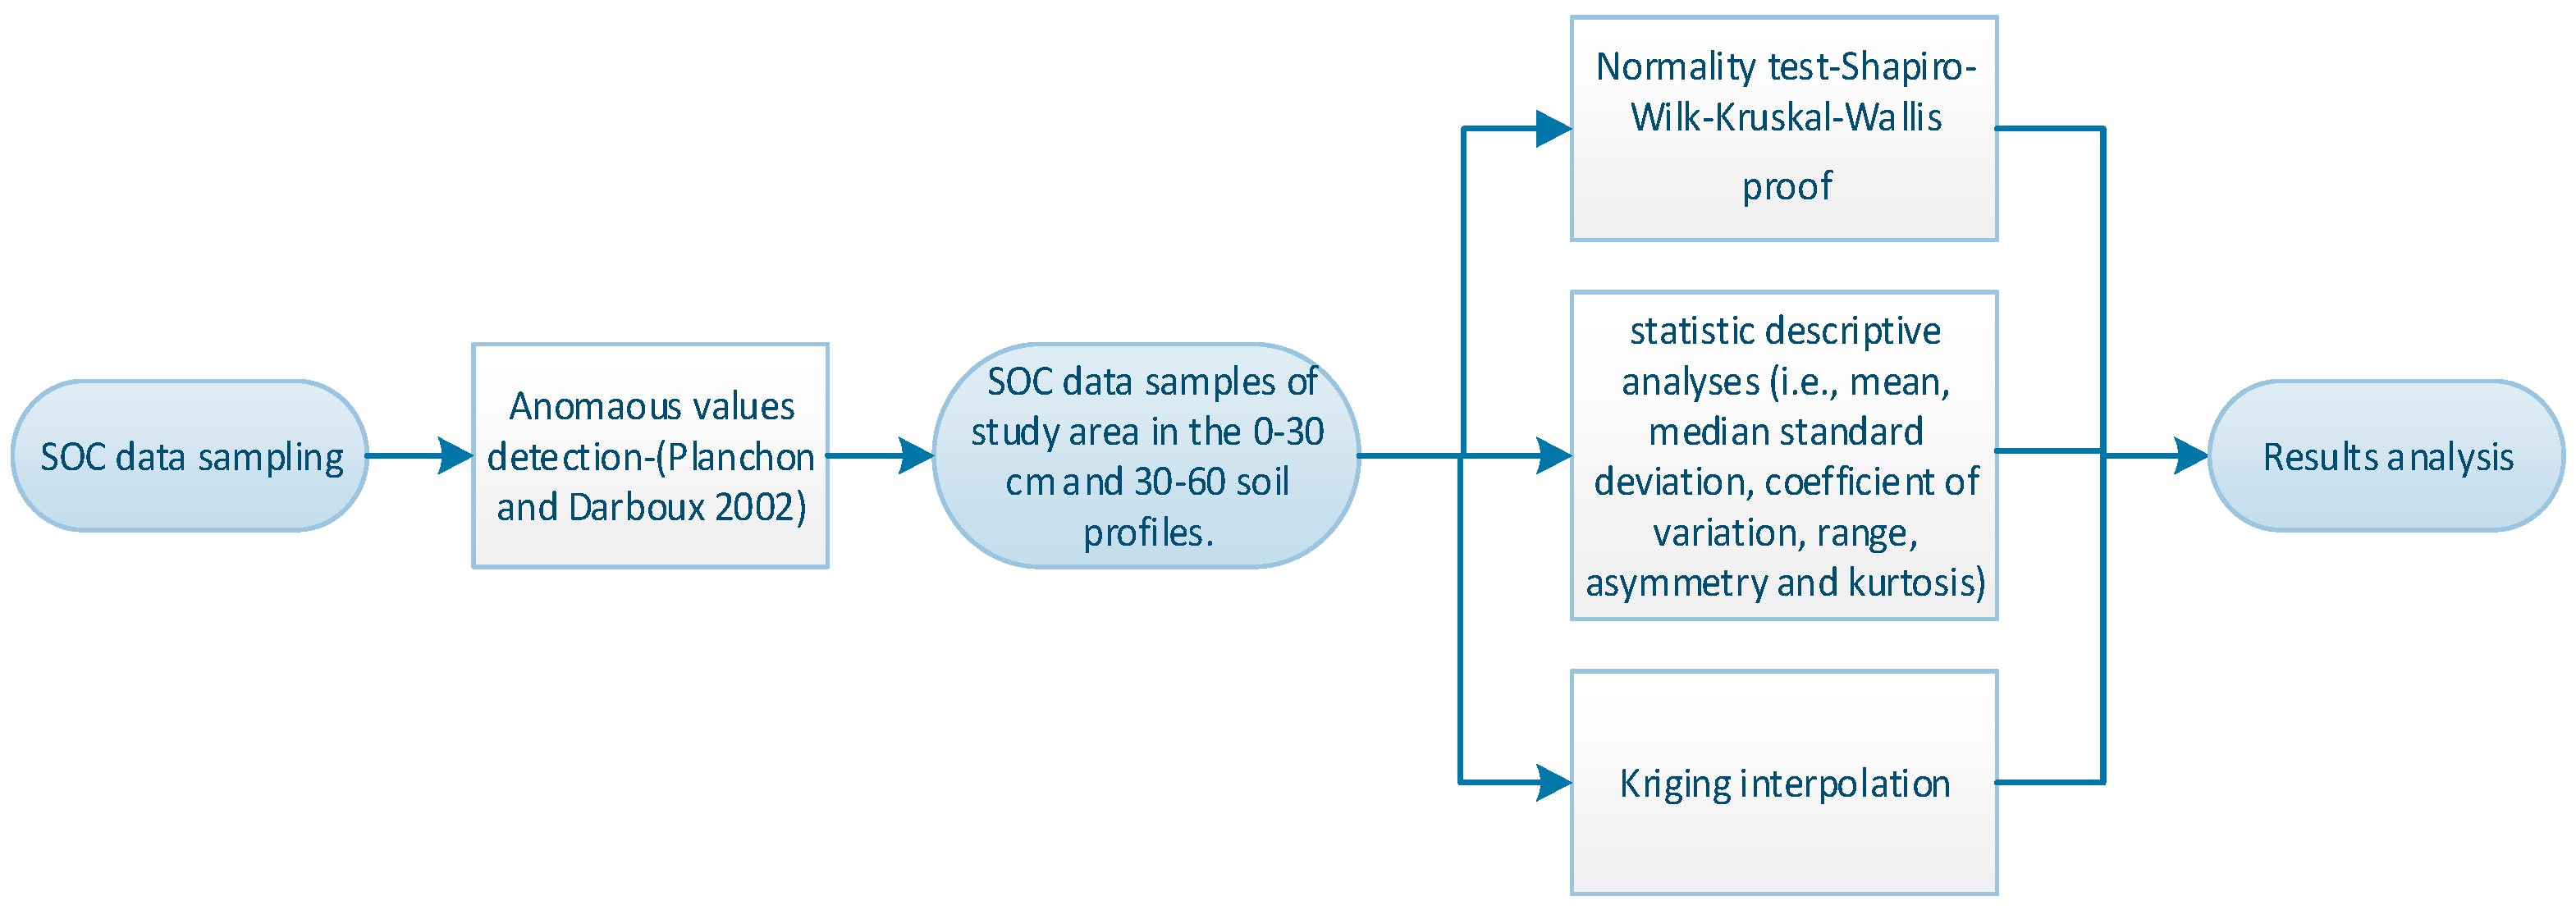
2.2. Selection of Soil Sampling Points and Sampling

Previous to the soil sample collection, the sampling density was established with 1.18 points/cm2 of the map of the Atillo river micro-watershed at a scale of 1:100,000. This led to select 101 sample points corresponding to the different lithologies/bedrock: andesites to rhyolites, pyroclasts; clays, tuffs, sandstones, conglomerates; metagrauwacas, metalavas; basaltic and andesitic metalavas, located in areas of glacial deposits and glacial deposits and volcanic deposits of the Sangay volcano, also soil formed by volcanic rocks (sedimentary) (see Figure 1 and Table S1).
The soil sampling was carried out in the second semester of 2019 (October to November 2019). Due to the fact that the swampy areas maintain organic horizons that reach up to 6 m deep, in situ monitoring was carried out, prioritizing the epipedions. A total of 101 points were selected for soil profile sampling. The geographical position (UTM coordinates, datum WGS84-zone 17 S) was obtained using a GPS (GARMIN GPSMAP 64 with 3.65 m positional accuracy in real time) of each data point. The soil samples were taken between 0–30 cm and 30–60 cm depth. Using a blast hole of 90 cm of useful length without including the handle, the internal measurement of the cylinder was 5 cm in diameter to carry out 4 soundings per sampling point and collect the composite sample. A 20 cm hole was made at the centroid using an auger to introduce 100 cm3 cylinders to collect the soil samples to obtain the bulk density [37]. The samples from each monitoring point were homogenized in situ and stored in hermetic bags. Finally, the soil samples were labeled and stored in a thermal refrigerator until they were transferred to the laboratory for their respective analysis.

2.3. Soil Analysis

Within 24 h of the sampling process, the samples were analyzed in the Environmental Protection research laboratory of the Research and Development Group for the Environment and Climate Change of Polytechnic School of Chimborazo. The homogenized samples were analyzed by the gravimetric method. So, samples were dried at 20 to 25 °C and sieved (Fisherbrand Norm-ASTM E-11e standard). Then the soil samples were dried using crucibles with 5 gr of soil, obtaining the % of humidity in a professional laboratory oven. Then the samples were weighed in a balance with high sensitivity. The carbon content was obtained using the automatic element analyzer, also known as the CHN analyzer, brand “Thermo Scientific™ FLASH 2000 CHNS/O Analyzers”. Bulk density was obtained using cylinders of 100 cm3 in both soil profiles, and SOC values in Mg/ha were obtained using bulk density and SOC% [10,38].

2.4. SOC Evaluation and Prediction by Kriging

A correction of anomalous values was carried out by applying the algorithm of [39] before the interpolation process. All SOC values of soil data sampling were merged in ArcGis 10.5, obtaining a SOC geodatabase used in this study. Geostatistical methods applied in soil mapping have the advantage of providing a statistically sound model for spatial variation, where the spatial autocorrelation is explicitly modeled, and an explicit measure of the uncertainty is associated with the prediction [11,40,41]. Kriging is the method of interpolation deriving from regionalized variable theory. It depends on expressing the spatial variation of the property in terms of the variogram, and it minimizes the prediction errors, which are themselves estimated [42]. This study used the Kriging method to obtain a surface of SOC spatial distribution in the study area, and a cross-validation process also was applied (see Figure 2).
The resulting data were analyzed by normality criteria with the Shapiro–Wilk statistical test and the Kruskal–Wallis proof for independent quantitative samples without normal distribution with a 95% confidence level [43]. The spatial variability of SOC between the lithologies of the Lacustrine System of the Sangay National Park with descriptive statistical analyses was evaluated (i.e., mean, median standard deviation, coefficient of variation, range, asymmetry, and kurtosis) for each soil profile (0–30 and 30–60 cm).

3. Results

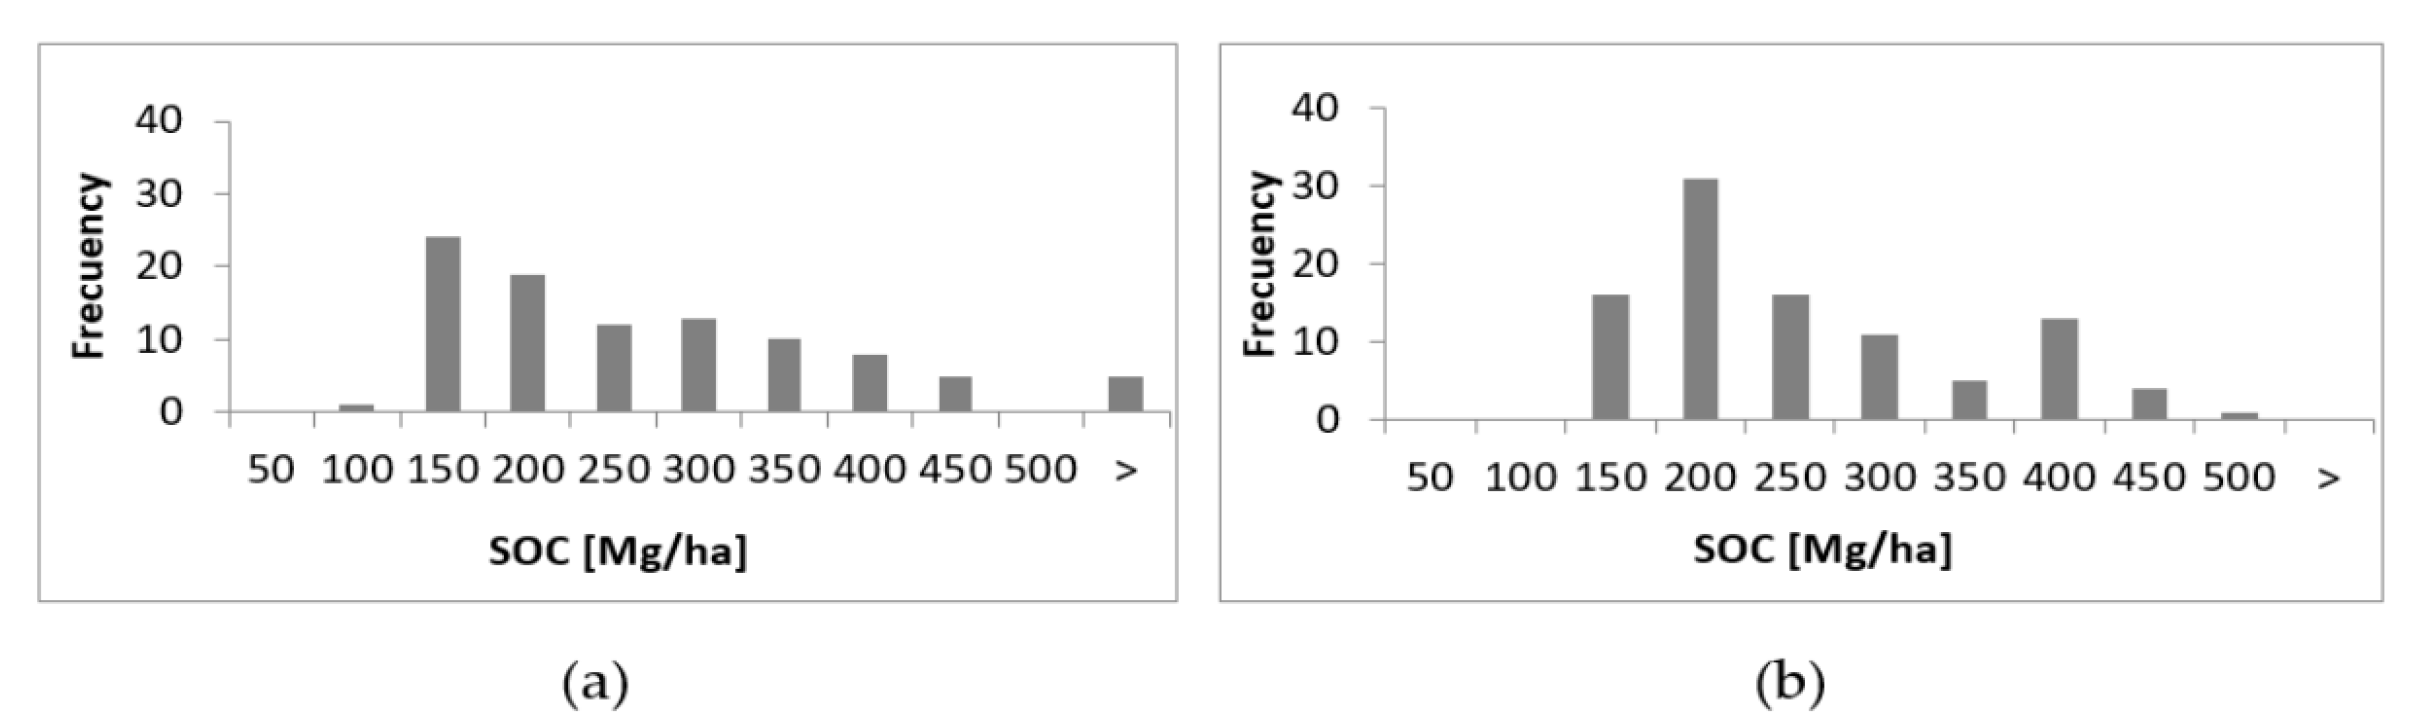
3.1. Spatial Variability of SOC Data Samples
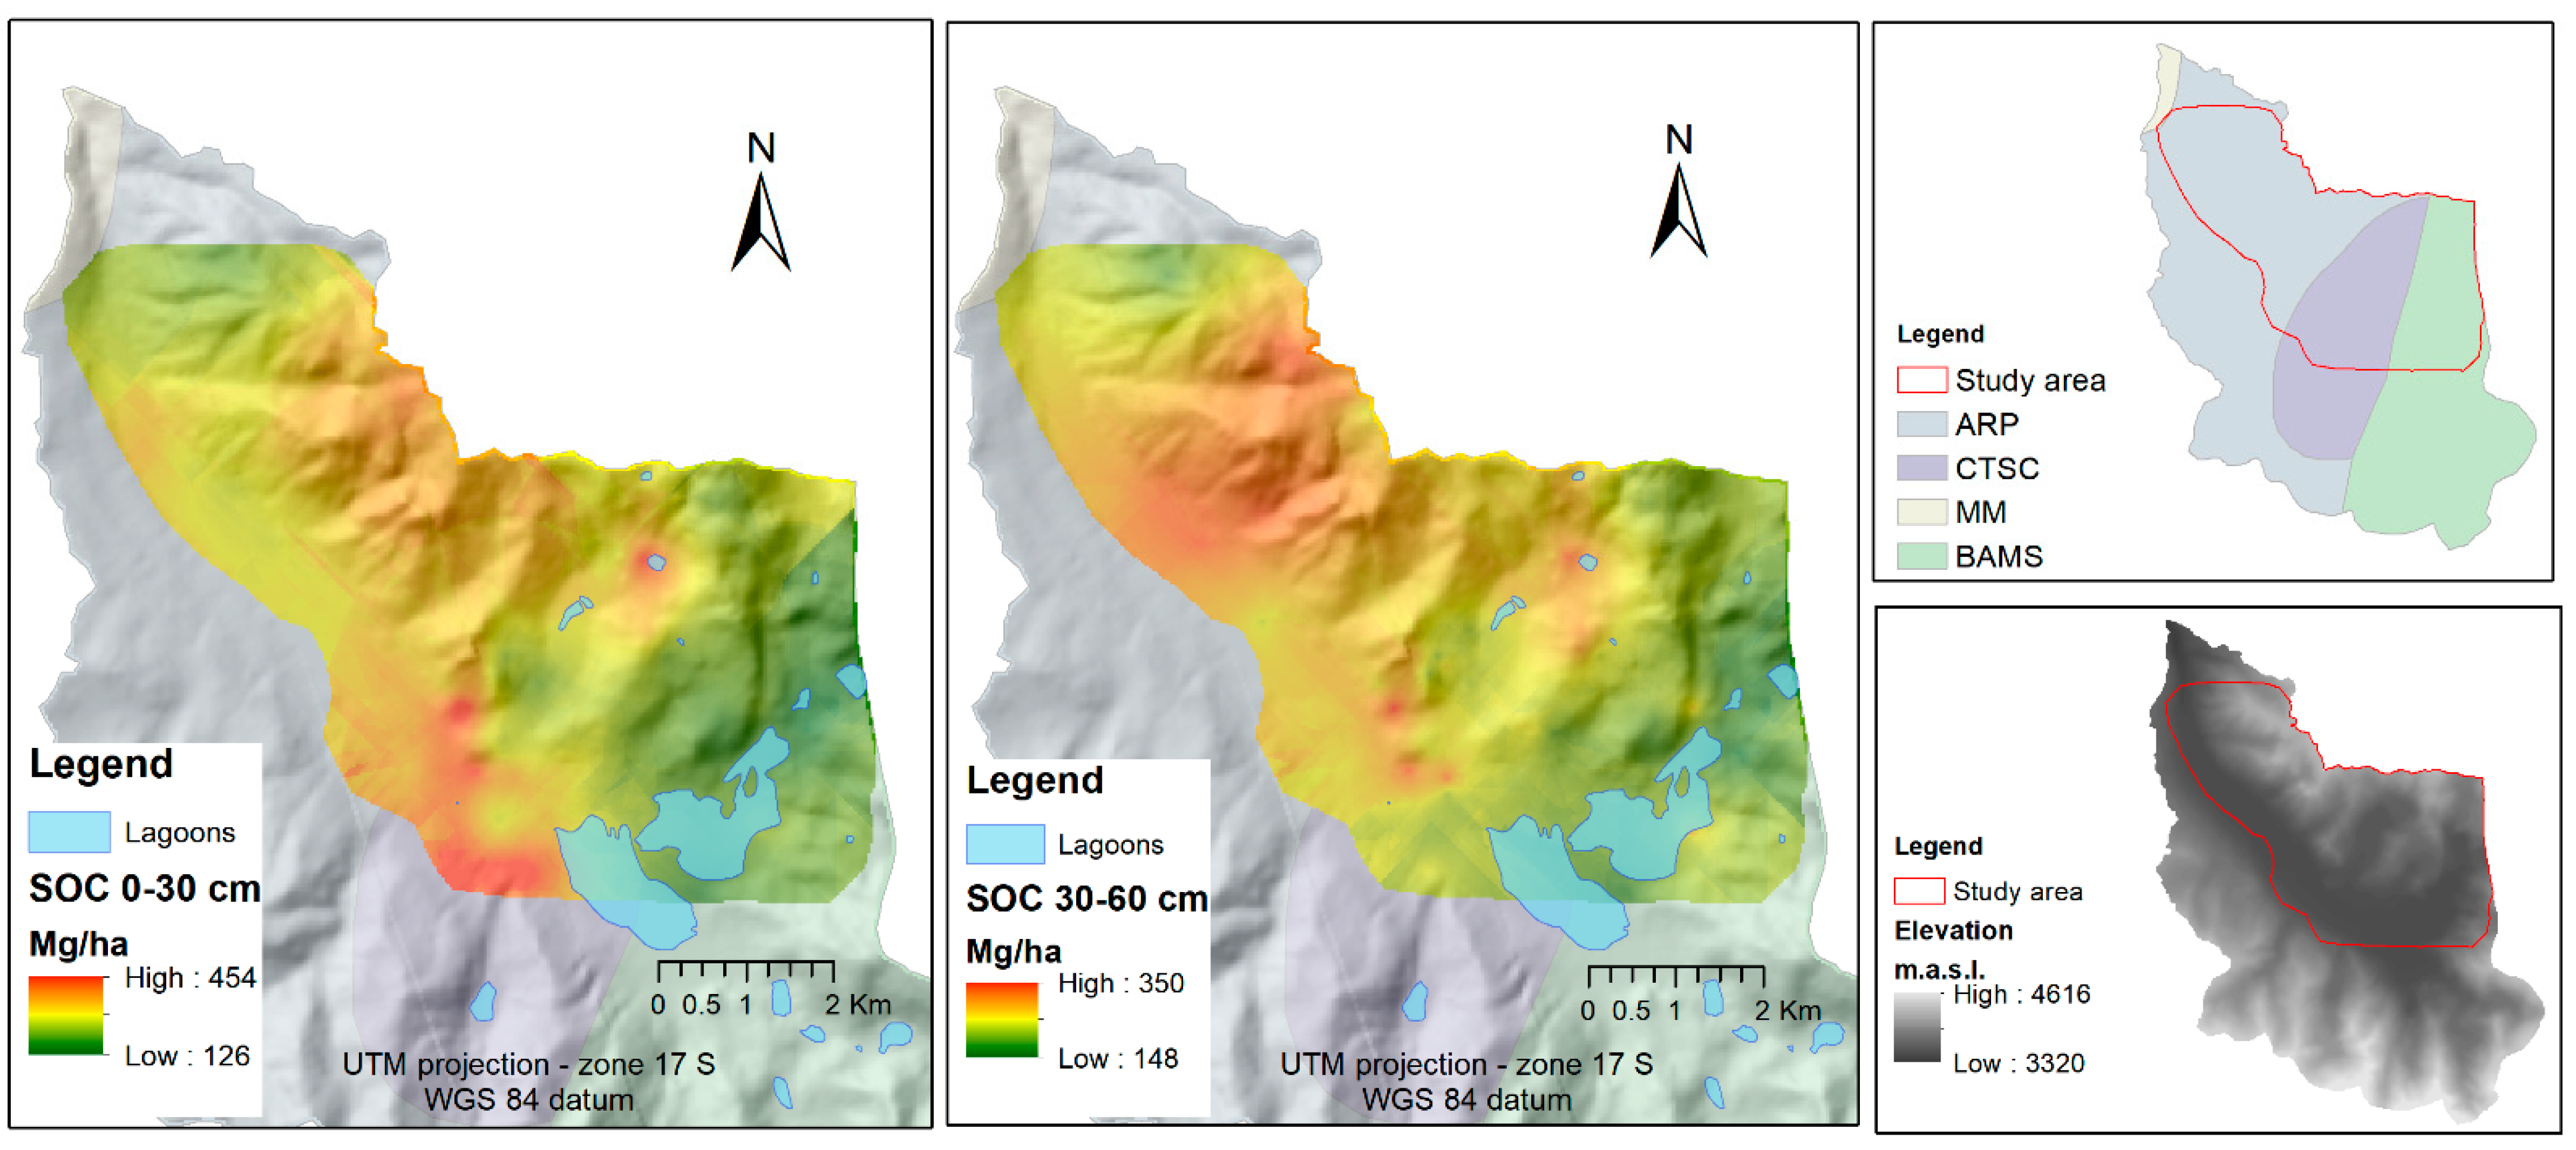
The lithologies that predominate in the lacustrine system under study presented high variability in SOC both in the profile 0–30 cm below ground and in the profile that was analyzed of 30–60 cm (see Table 1). A SOC variability at both soil depths of paramo was identified. It is in concordance with [44]. A higher concentration of SOC in the areas of periglacial zones that correspond to andesites to rhyolites and pyroclasts was identified, observing a higher proportion in elevations ranging from 3400 to 3520 m.a.s.l., while the lowest SOC values were observed in the lithology metagrauwacas and metalavas located above 3400 m. a. s. l. In the area of the lacustrine system, a non-typical behavior stands out where the lowest proportion of SOC is in the first 30 cm. The highest coefficient of variation of SOC occurs in the intervened areas of clays, tuffs, sandstones, and conglomerates of the first 30 cm (50.78%) corresponding to swampy, marshy areas of aged lagoons from the Miocene/Pliocene period.
The SOC distribution of in situ data sampling shows positive asymmetry for both soil profiles: the 0–30 cm profile and the 30–60 cm profile, with values of 7.75 and 3.12, respectively (see Figure 3a,b). High kurtosis coefficients with values of 10.43 and −0.53 were observed for the COS determined from 0–30 cm and 30–60 cm profiles, respectively, according to leptokurtic distribution. With the aforementioned, it can be identified that the frequency distribution resembles the Inverse Gaussian probability distribution, also known as the Wald distribution. Regarding the intervention and lithology strata, there is a statistically significant difference between the medians. The lithology of clays, tuffs, sandstones, and conglomerates of the marshy area in the study zone at elevations between 3400 and 3500 m.a.s.l. stores more organic carbon than the other lithologies. Approximately 47% of the total sampled areas indicate that the highest concentrations of SOC are located in the depth of 30 to 60 cm. Also, a particularity is observed due to the fact that intervened zones have higher carbon concentrations than non-intervened zones in both profiles.

3.2. SOC Estimation

SOC estimation was obtained based on SOC data sampling. The results of the estimation of SOC after applying the geostatistical method Kriging show a SOC storage ranging from 126 to 454 Mg/ha in the 0–30 cm soil profile and 148 to 350 Mg/ha in the 30–60 cm soil profile. The highest concentrations of SOC in the 0–30 cm profile correspond to the lithology of Clays, tuffs, sandstones, conglomerates, agglomerates, and glacial deposits close to the Atillo lagoon (see Figure 4). In the 30–60 cm profile, the highest concentrations of SOC are observed in zones with floodable vegetation predominates, and its water table is very high. The areas that register the highest levels of SOC correspond to lateral moraines with an altitude of less than 50 m above sea level. On the other hand, the areas of lower concentration are located on the hill of the reserve, whose lithology is predominantly volcanic rocks, where there is a dominance of low-lying grasslands as natural vegetation. In these areas, Typic Melanocryands soils predominate with characteristics of acidity, moderate to high depth, and high content of organic matter.

4. Discussion

The SOC content in the high Andean páramo varies between 119 and 397 Mg/ha in the first 40 cm of depth, as described in studies on páramo of Peru and Ecuador. In the lacustrine system studied, the peatland ecosystem stands out, reaching an average of 750 Mg C/ha in the first 60 cm higher than those reported in the high Andean paramo of Cayambe-Coca [20]. Among the reasons for this stratified storage of SOC are the high and continuous cloudiness, the low temperatures, and the high humidity. These conditions decrease the decomposition of organic matter and which causes a non-typical distribution of SOC at the vertical level of the soil, where the highest concentration is found in the deep layers [45].
The páramo soils are important ecosystems for mitigating climate change by capturing or sequestering large amounts of CO2 in its edaphic component. The micro-basin of the Atillo River is no exception, storing in its edaphological system between 126 and 454 Mg/ha in the first 30 cm of soil, similar to those reported in the paramos of Guativa la Russia in the department of Boyacá, Colombia, with an average capture of 467.9 Mg/ha [46]. Soil carbon change could be related to land conversions and activities over the Grasslands [47]. The results of lithologies of the intervened area and lower than the median of the intervened area are in concordance with other studies related to SOC on paramo region in Colombia where a positive asymmetry of 0.97 and kurtosis of 5.18, also estimated SOC values that oscillate in the range of 22 and 338 Mg/ha and medians of up to 180.52 Mg/ha are indicated [48]. Also, studies in the herbaceus páramo ecosystem of Ecuador showed values of SOC between 67–221 in the 0–30 cm soil profile and values of SOC between 32 and 179 Mg/ha in the 30–60 cm profile [49].
There are higher average concentrations of SOC on the slopes of mountains with lava flows [19], similar to the lithologies of volcanic rocks, also in the Sangay agglomerates composed of andesites and basalts. The values of bulk density are in the range of 0.5 to 1 g/cm3. Values of bulk density of glacial deposits are higher than agglomerated and agglomerated bulk density and higher than volcanic rocks. This is in concordance with the consideration that at lower bulk densities, the SOC concentrations are increased [50]. The SOC stock of lithologies and similar soil types in northern Ecuador are between 3.4 and 10.3% in the upper epipedion of 30 cm (elevations between 3000 and 4000 m.a.s.l.) [51]. Also, SOC values are lower than values in glacial deposits and agglomerates zones of the Atillo micro-watershed, with organic matter averages of 13 and 14%, respectively. These SOC concentrations are similar to those reported in the Machangara in the Azuay province and Pantanal in the Chimborazo province of Ecuador [52].
Similar coefficients between 45 and 80% stand out in a focused study about identifying the reduction in CV as a function of sampling intensities [53]. The coefficient between 20 to 40% obtained shows moderate heterogeneity in the SOC samples (see supplementary materials), typical of Total Carbon according to the criteria of [54]. Nevertheless, this characteristic predominates in the Atillo river micro-basin, despite being a homogeneous ecosystem dominated by grasses and peatlands that the ecological level is called the floodable grassland. The study zone is located in the glacial deposits zone, maintaining singularities of the biological soil crusts. It is composed mostly of vascular plants and mosses that both accumulate large amounts of water, which prevents the decomposition of organic matter and, consequently, their accumulation [27].
The described results of the investigation indicate that the Atillo lacustrine and marshy wetland can be cataloged as a carbon sink or emitter. It would depend on its operation, climate, age, and anthropic activities [23]. Anthropic activities are related to grazing and agricultural activities. Therefore, soil changes can alter ecosystem services. Hence, the preservation and protection of ecosystems such as Atillo wetlands should be taken into account to prevent CO2 emissions. Likewise, the study ecosystem contributes in similar criteria to the 30% of the seven million square kilometers of the Amazon basin considered wetlands within the RAMSAR convention [55]. Therefore the ecosystem can be considered and added within RAMSAR.
This study used the Kriging method with SOC data sampling. Soil lithologies and their spatial heterogeneity were taken into account to determine the position of each soil sample data point, which favored the method results. Even so, the topographic irregularity and also the presence of soils with high water saturation (swamps) caused to move sample point positions of in situ monitoring. Therefore our study does not include edge areas of the south zone of the micro-watershed of study (Section 2.1.). SOC estimates with statistical methods have made it possible to identify that the Andean areas of Ecuador store between 240 and 320 Mg/ha [20,56,57]. The results obtained in the Atillo river micro-watershed highlight higher concentrations of carbon in the lateral and valley moraines, formed during the Pleistocene, configuring several glacial cirques in the upper parts (3600–3800 m.a.s.l.) and the evident rejuvenation of the horns that make up the basin. Mountain range that surrounds the lacustrine system. In the middle and lower part of the micro-watershed, there are SOC concentrations between 265 and 342 Mg/ha in the 0–30 cm profile, which is stabilized thanks to the morphological configuration of the glacial valley bathed by the meander of the Atillo River. Due to the cold-humid climate that favors the accumulation of organic matter, organometallic complexes are formed with mineral particles in the soil. As the meander advances, the sandy particles in the riverside forest terrace increase [58,59], constituting an opportune scenario for carbon stock.

5. Conclusions

The geographic sampling intensity of 1.18 (dimensionless value) allowed the development of the SOC map of the Atillo micro-watershed with a coefficient of variation by lithological strata greater than 40%, which indicates high heterogeneity of the results and samples. Determining which detailed studies in the Atillo river micro-watershed would be required additional SOC data sampling points in temporal and spatial studies of SOC to explain it. Even so, the SOC estimation founded on this study obtained a mean of SOC storage for the study ecosystem of 263 Mg/ha, with a minimum of 126 Mg/ha and maximum value of 454 Mg/ha, in the 0–30 cm soil profile; and a mean of 252 Mg/ha, with a minimum and maximum of 148 and 350 Mg/ha respectively, in 30–60 cm soil profile.
The lithology and the state of conservation in the studied micro-watershed do not maintain a significant incidence in the variation of SOC. Therefore, the study area is important in the conservation processes as a buffer zone of the Sangay National Park. In the same way, it is an area with a high potential for CO2 stock that contributes to national and international mechanisms in the mitigation of global warming.
The Atillo lacustrine and marshy wetland is a carbon sink, so its preservation and protection mechanisms should be taken into account to prevent the emission of CO2 resulting from excessive grazing and inadequate agricultural mechanization. So also preserve other ecosystem benefits, such as biodiversity and the flow and quality of water.
Geostatistical interpolation using the Kriging method gave us the possibility of obtaining a spatial distribution of SOC in the Atillo wetlands. The need to explain SOC reserves in areas with extremely difficult access could be resolved in the second part of this research, using regression methods and environmental predictors of SOC.

Supplementary Materials

The following supporting information can be downloaded at: https://www.mdpi.com/article/10.3390/soilsystems6040092/s1, Table S1: SOC samples.

Author Contributions

Writing—original draft preparation, A.A.B.-D.; methodology, A.A.B.-D.; writing—review and editing, J.E.A.I., S.V.W. and J.D.; Conceptualization, M.M.E.G.; supervision, X.L.O.P. and A.M. All authors have read and agreed to the published version of the manuscript.

Funding

This research was funded by Los Sistemas Lacustres del centro del Ecuador como fuente o sumideros de dióxido de carbono como determinante para su conservación (IDIPI-234) Project, Escuela Superior Politécnica de Chimborazo (ESPOCH), Riobamba, Ecuador. S.V.W. was supported by the European Research Council (ERC) under the ERC-2021-STG PHOTOFLUX project (grant agreement 101041768).

Institutional Review Board Statement

Not applicable.

Informed Consent Statement

Not applicable.

Data Availability Statement

Not applicable.

Conflicts of Interest

The authors declare no conflict of interest.

References

  1. Crowther, T.W.; Todd-Brown, K.E.O.; Rowe, C.W.; Wieder, W.R.; Carey, J.C.; MacHmuller, M.B.; Snoek, B.L.; Fang, S.; Zhou, G.; Allison, S.D.; et al. Quantifying Global Soil Carbon Losses in Response to Warming. Nature 2016, 540, 104–108. [Google Scholar] [CrossRef] [PubMed] [Green Version]
  2. Zahasky, C.; Krevor, S. Global Geologic Carbon Storage Requirements of Climate Change Mitigation Scenarios. Energy Environ. Sci. 2020, 13, 1561–1567. [Google Scholar] [CrossRef]
  3. Corbeels, M.; Cardinael, R.; Naudin, K.; Guibert, H.; Torquebiau, E. The 4 per 1000 Goal and Soil Carbon Storage under Agroforestry and Conservation Agriculture Systems in Sub-Saharan Africa. Soil Tillage Res. 2019, 188, 16–26. [Google Scholar] [CrossRef] [Green Version]
  4. Gerke, J. The Central Role of Soil Organic Matter in Soil Fertility The Central Role of Soil Organic Matter in Soil Fertility and Carbon Storage. Soil Syst. 2022, 6, 33. [Google Scholar] [CrossRef]
  5. Pérez Atehortúa, M.; Medina Aguirre, M.F.; Hurtado Granada, A.; Arboledaapata, E.M.; Medina Sierra, M. Reservas de Carbono Del Pasto Cenchrus Clandestinus (Poaceae) En Los Sistemas de Manejo Tradicional y Silvopastoril, En Diferentes Relieves. Rev. Biol. Trop. 2019, 67, 769–783. [Google Scholar] [CrossRef]
  6. Maniatis, D.; Mollicone, D. Options for Sampling and Stratification for National Forest Inventories to Implement REDD+ under the UNFCCC. Carbon Balance Manag. 2010, 5, 9. [Google Scholar] [CrossRef] [Green Version]
  7. Chen, W.; Meng, H.; Song, H.; Zheng, H. Progress in Dust Modelling, Global Dust Budgets, and Soil Organic Carbon Dynamics. Land 2022, 11, 176. [Google Scholar] [CrossRef]
  8. Hsu, H.-T.; Lawrence, C.; Winnick, M.; Bargar, J.; Maher, K. A Molecular Investigation of Soil Organic Carbon Composition across a Subalpine Catchment. Soil Syst. 2018, 2, 6. [Google Scholar] [CrossRef] [Green Version]
  9. Qi, J.; Markewitz, D.; Foroughi, M.; Jokela, E.; Strahm, B.; Vogel, J. Drying-Wetting Cycles: Effect on Deep Soil Carbon. Soil Syst. 2018, 2, 3. [Google Scholar] [CrossRef] [Green Version]
  10. González Molina, L.; Acosta Mireles, M.; Carrillo Anzures, F.; Báez Pérez, A.; González Camacho, J.M. Cambios de Carbono Orgánico Del Suelo Bajo Escenarios de Cambio de Uso de Suelo En México. Rev. Mex. Ciencias Agrícolas 2014, 5, 1275–1285. [Google Scholar] [CrossRef]
  11. Ayala Izurieta, J.E.; Márquez, C.O.; García, V.J.; Jara Santillán, C.A.; Sisti, J.M.; Pasqualotto, N.; Van Wittenberghe, S.; Delegido, J. Multi-Predictor Mapping of Soil Organic Carbon in the Alpine Tundra: A Case Study for the Central Ecuadorian Páramo. Carbon Balance Manag. 2021, 16, 32. [Google Scholar] [CrossRef] [PubMed]
  12. Köhl, M.; Lister, A.; Scott, C.T.; Baldauf, T.; Plugge, D. Implications of Sampling Design and Sample Size for National Carbon Accounting Systems. Carbon Balance Manag. 2011, 6, 10. [Google Scholar] [CrossRef] [PubMed] [Green Version]
  13. Gross, C.D.; Harrison, R.B. The Case for Digging Deeper: Soil Organic Carbon Storage, Dynamics, and Controls in Our Changing World †. Soil Syst. 2019, 3, 28. [Google Scholar] [CrossRef] [Green Version]
  14. López-Calderón, J.M.; Riosmena-Rodríguez, R. Wetlands. In Encyclopedia of Estuaries; Kennish, M.J., Ed.; Springer Netherlands: Dordrecht, The Netherlands, 2016; pp. 738–741. ISBN 978-94-017-8801-4. [Google Scholar]
  15. Sjögersten, S.; Black, C.R.; Evers, S.; Hoyos-Santillan, J.; Wright, E.L.; Turner, B.L. Tropical Wetlands: A Missing Link in the Global Carbon Cycle? Global Biogeochem. Cycles 2014, 28, 1371–1386. [Google Scholar] [CrossRef] [PubMed] [Green Version]
  16. Ramsar The 4th Strategic Plan 2016–2024—The Convention on Wetlands of International Importance Especially as Waterfowl Habitat—the “Ramsar Convention”. In Proceedings of the 12th Meeting of the Conference of the Parties, Punta del Este, Uruguay, 1–9 June 2015.
  17. Girardin, C.A.J.; Farfan-Rios, W.; Garcia, K.; Feeley, K.J.; Jørgensen, P.M.; Murakami, A.A.; Cayola Pérez, L.; Seidel, R.; Paniagua, N.; Fuentes Claros, A.F.; et al. Spatial Patterns of Above-Ground Structure, Biomass and Composition in a Network of Six Andean Elevation Transects. Plant Ecol. Divers. 2014, 7, 161–171. [Google Scholar] [CrossRef]
  18. Yepes, A.; Herrera, J.; Phillips, J.; Cabrera, E.; Galindo, G.; Granados, E.; Duque, Á.; Barbosa, A.; Olarte, C.; Cardona, M. Contribución de Los Bosques Tropicales de Montaña En El Almacenamiento de Carbono En Colombia. Rev. Biol. Trop. 2015, 63, 69–82. [Google Scholar] [CrossRef] [Green Version]
  19. Vela Correa, G.; Blanco, J.L.; De Lourdes Rodríguez Gamiño, M. Niveles de Carbono Orgánico Total En El Suelo de Conservación Del Distrito Federal, Centro de México. Investig. Geogr. 2012, 77, 18–30. [Google Scholar] [CrossRef]
  20. Castañeda-Martín, A.E.; Montes-Pulido, C.R. Carbono Almacenado En Páramo Andino. Entramado 2017, 13, 210–221. [Google Scholar] [CrossRef]
  21. Minaya, V.; Corzo, G.; Romero-Saltos, H.; Van Der Kwast, J.; Lantinga, E.; Galárraga-Sánchez, R.; Mynett, A. Altitudinal Analysis of Carbon Stocks in the Antisana Páramo, Ecuadorian Andes. J. Plant Ecol. 2016, 9, 553–563. [Google Scholar] [CrossRef] [Green Version]
  22. Whiting, G.J.; Chanton, J.P. Greenhouse Carbon Balance of Wetlands: Methane Emission versus Carbon Sequestration. Tellus B 2001, 53, 521–528. [Google Scholar] [CrossRef]
  23. Kayranli, B.; Scholz, M.; Mustafa, A.; Hedmark, Å. Carbon Storage and Fluxes within Freshwater Wetlands: A Critical Review. Wetlands 2010, 30, 111–124. [Google Scholar] [CrossRef]
  24. Minaya Maldonado, V.G. Ecohydrology of the Andes Paramo Region; CRC Press: London, UK, 2017; ISBN 9781315116044. [Google Scholar]
  25. Fallas Rojas, T.; Ramírez Vargas, C. Factores de Emisión de CH4 y CO2 En Rastrojo de Piña (Ananas Comosus (L.) Merr. Var. Comosus), En San Carlos, Costa Rica. Rev. AgroInnovación En El Trópico Húmedo 2019, 2, 2–11. [Google Scholar] [CrossRef]
  26. Irisarri, P.; Pereyra, V.; Fernández, A.; Terra, J.; Tarlera, S. Emisiones de CH4 y N2O En Un Arrozal: Primeras Medidas En El Sistema Productivo Uruguayo. Agrociencia Uruguay 2012, 16, 1–10. [Google Scholar] [CrossRef]
  27. Castillo-Monroy, A.P.; Maestre, F.T. La Costra Biológica Del Suelo: Avances Recientes En El Conocimiento de Su Estructura y Función Ecológica. Rev. Chil. Hist. Nat. 2011, 84, 1–21. [Google Scholar] [CrossRef]
  28. Kellogg, E.A. Evolutionary History of the Grasses. Plant Physiol. 2001, 125, 1198–1205. [Google Scholar] [CrossRef] [PubMed] [Green Version]
  29. Giraldo-Cañas, D. Distribution and Invasion of C3 and C4 Grasses (Poaceae) along an Altitudinal Gradient in the Andes of Colombia. Caldasia 2010, 32, 65–86. [Google Scholar]
  30. SEMPLADES Clima e Hidrología Cantón Guamote. Memoria Técnica, Proyecto “Generación de Geoinformación Para La Gestión Del Territorio a Nivel Nacional. Escala 1:25000”; Quito. 2013.
  31. INAMHI Mapa de Climas Del Ecuador. Mapa Estac. Meteorológicas del Ecuador. 2016. Available online: https://es.weather-forecast.com/maps/Ecuador (accessed on 28 November 2022).
  32. Fundación Natura Proyecto Sangay: Evaluación de La Eficiencia de Manejo Del Parque Nacional Sangay; Quito, Ecuador. 2002. Available online: https://biblioteca.casadelacultura.gob.ec/cgi-bin/koha/opac-detail.pl?biblionumber=70749 (accessed on 28 November 2022).
  33. Buytaert, W.; Célleri, R.; De Bièvre, B.; Cisneros, F.; Wyseure, G.; Deckers, J.; Hofstede, R. Human Impact on the Hydrology of the Andean Páramos. Earth-Science Rev. 2006, 59, 53–72. [Google Scholar] [CrossRef]
  34. Buytaert, W.; Cuesta-Camacho, F.; Tobón, C. Potential Impacts of Climate Change on the Environmental Services of Humid Tropical Alpine Regions. Glob. Ecol. Biogeogr. 2011, 20, 19–33. [Google Scholar] [CrossRef]
  35. Hofstede, R.; Coppus, R.; Vásconez, P.M.; Segarra, P.; Wolf, J.; Sevink, J. El Estado de Conservación de Los Páramos de Pajonal En El Ecuador. Ecotropicos 2002, 15, 3–18. [Google Scholar]
  36. Patiño, S.; Hernández, Y.; Plata, C.; Domínguez, I.; Daza, M.; Oviedo-Ocaña, R.; Buytaert, W.; Ochoa-Tocachi, B.F. Influence of Land Use on Hydro-Physical Soil Properties of Andean Páramos and Its Effect on Streamflow Buffering. CATENA 2021, 202, 105227. [Google Scholar] [CrossRef]
  37. Gabriels, D.; Lobo, D. Métodos Para Determinar Granulometría y Densidad Aparente Del Suelo. Venesuelos 2011, 14, 37–48. [Google Scholar]
  38. Howard, J.; Hoyt, S.; Isensee, K.; Telszewski, M.; Pidgeon, E. Coastal Blue Carbon: Methods for Assessing Carbon Stocks and Emissions Factors in Mangroves, Tidal Salt Marshes, and Seagrasses; Jennifer, H., Hoyt, S., Kirsten, I., Emily, P., Maciej, T., Eds.; Conservation International, Intergovernmental Oceanographic Commission of UNESCO, International Union for Conservation of Nature: Arlington, VA, USA, 2014; ISBN 9782831717623. [Google Scholar]
  39. Planchon, O.; Darboux, F. A Fast, Simple and Versatile Algorithm to Fill the Depressions of Digital Elevation Models. Catena 2002, 46, 150–176. [Google Scholar] [CrossRef]
  40. Wadoux, A.M.J.; Minasny, B.; Mcbratney, A.B. Machine Learning for Digital Soil Mapping: Applications, Challenges and Suggested Solutions. Earth-Sci. Rev. 2020, 210, 103359. [Google Scholar] [CrossRef]
  41. Oliver, M.A. Geostatistics and Its Application to Soil Science. Soil Use Manag. 1987, 3, 8–20. [Google Scholar] [CrossRef]
  42. Oliver, M.A.; Webster, R. Kriging: A Method of Interpolation for Geographical Information Systems. Int. J. Geogr. Inf. Syst. 2007, 4, 313–332. [Google Scholar] [CrossRef]
  43. Flores-Ruiz, E.; Miranda-Novales, M.G.; Villasís-Keever, M.Á. El Protocolo de Investigación VI: Cómo Elegir La Prueba Estadística Adecuada. Estadística Inferencial. Rev. Alerg. México 2017, 64, 364–370. [Google Scholar] [CrossRef] [Green Version]
  44. Montes, C.R.; Ramos Miras, J.J.; San José Wery, A.M.; Montes-Pulido, C.R.; Ramos-Miras, J.J.; San José -Wery, A.M. Estimation of Soil Organic Carbon (SOC) at Different Soil Depths and Soil Use in the Sumapaz Paramo, Cundinamarca—Colombia. Acta Agronómica 2017, 66, 95–101. [Google Scholar] [CrossRef]
  45. Paz, F.; Etchevers, J. Distribución a Profundidad Del Carbono Orgánico En Los Suelos de México. Terra Latinoam. 2016, 34, 339–355. [Google Scholar]
  46. Africano Pérez, K.L.; Cely Reyes, G.E.; Serrano Cely, P.A. Potencial de Captura de CO2 Asociado Al Componente Edáfico En Páramos Guantiva-La Rusia, Departamento de Boyacá, Colombia. Perspect. Geográfica 2016, 21, 91–110. [Google Scholar] [CrossRef] [Green Version]
  47. Yellajosula, G.; Cihacek, L.; Faller, T.; Schauer, C. Soil Carbon Change Due to Land Conversion to Grassland in a Semi-Arid Environment. Soil Syst. 2020, 4, 43. [Google Scholar] [CrossRef]
  48. Gutiérrez, J.; Ordoñez, N.; Bolívar, A.; Bunning, S.; Guevara, M.; Medina, E.; Olivera, C.; Olmendo, G.; Rodríguez, L.; Sevilla, V.; et al. Estimación Del Carbono Orgánico En Los Suelos de Ecosistema de Páramo En Colombia. Ecosistemas 2020, 29, 1855. [Google Scholar] [CrossRef] [Green Version]
  49. Ayala Izurieta, J.E.; Jara Santillán, C.A.; Márquez, C.O.; García, V.J.; Rivera-Caicedo, J.P.; Van Wittenberghe, S.; Delegido, J.; Verrelst, J. Improving the Remote Estimation of Soil Organic Carbon in Complex Ecosystems with Sentinel-2 and GIS Using Gaussian Processes Regression. Plant Soil 2022. [Google Scholar] [CrossRef] [PubMed]
  50. Halifa-Marín, A.; Pérez-Cutillas, P.; Almagro, M.; Martínez-Mena, M.; Boix-Fayos, C. Dinámica Geomorfológica Fluvial y Cambios de Usos Del Suelo: Impacto En Los Reservorios de Carbono de Suelos y Sedimentos. Bosque 2019, 40, 3–16. [Google Scholar] [CrossRef] [Green Version]
  51. Zehetner, F.; Miller, W.P.; West, L.T. Pedogenesis of Volcanic Ash Soils in Andean Ecuador. Soil Sci. Soc. Am. J. 2003, 67, 1797–1809. [Google Scholar] [CrossRef]
  52. Podwojewski, P.; Poulenard, J.; Zambrana, T.; Hofstede, R. Overgrazing Effects on Vegetation Cover and Properties of Volcanic Ash Soil in the Páramo of Llangahua and La Esperanza (Tungurahua, Ecuador). Soil Use Manag. 2002, 18, 45–55. [Google Scholar] [CrossRef]
  53. Yu, D.S.; Zhang, Z.Q.; Yang, H.; Shi, X.Z.; Tan, M.Z.; Sun, W.X.; Wang, H.J. Effect of Soil Sampling Density on Detected Spatial Variability of Soil Organic Carbon in a Red Soil Region of China. Pedosphere 2011, 21, 207–213. [Google Scholar] [CrossRef]
  54. Warrick, A.W.; Nielsen, D.R. Spatial Variability of Soil Physical Properties in the Field. Appl. Soil Phys. 1980, 319–344. [Google Scholar] [CrossRef]
  55. Junk, W.J.; Piedade, M.T.F.; Schöngart, J.; Cohn-Haft, M.; Adeney, J.M.; Wittmann, F. A Classification of Major Naturally-Occurring Amazonian Lowland Wetlands. Wetlands 2011, 31, 623–640. [Google Scholar] [CrossRef]
  56. Batjes, N.H. Harmonized Soil Property Values for Broad-Scale Modelling (WISE30sec) with Estimates of Global Soil Carbon Stocks. Geoderma 2016, 269, 61–68. [Google Scholar] [CrossRef]
  57. Clara, L.; Fatma, R.; Viridiana, A.; Wiese, L. Carbono Orgánico Del Suelo: El Potencial Oculto; Liesl, W., Viridiana, A., Rainer, B., Ronald, V., Eds.; Organización de las Naciones Unidas para la Alimentación y Agricultura: Roma, Italy, 2017; ISBN 978-92-5-309681-7. [Google Scholar]
  58. Wagai, R.; Kajiura, M.; Asano, M.; Hiradate, S. Nature of Soil Organo-Mineral Assemblage Examined by Sequential Density Fractionation with and without Sonication: Is Allophanic Soil Different? Geoderma 2015, 241–242, 295–305. [Google Scholar] [CrossRef]
  59. García Cano, A.J. Los Meandros Del Río Segura En El Tramo de Rincón de Beniscornia (Huerta de Murcia). Oportunidades En Un Contexto de Cambio Climático. Ecosistemas 2016, 25, 98–104. [Google Scholar] [CrossRef]
Figure 1. Study area corresponding to Atillo micro-watershed of Sangay National Park and soil sample points.
Soilsystems 06 00092 g001
Figure 2. Process of evaluation and prediction of SOC.
Soilsystems 06 00092 g002
Figure 3. General distribution model of SOC in the Atillo river lake system: (a) 0–30 cm profile; (b) 30–60 cm profile. The confidence level is 95%.
Soilsystems 06 00092 g003
Figure 4. SOC estimation for 0–30 cm profile and 30–60 cm profile-influence area. ARP: Andesites to rhyolites, pyroclasts; CTSC: Clays, tuffs, sandstones, conglomerates; MM: Metagreywacke, metalavas; BAMS: Basaltic and andesitic metalavas, schists.
Soilsystems 06 00092 g004
Table 1. Statistic descriptive of SOC in Mg/ha for each lithology of the Atillo River micro-watershed.
IA/
NIA *
LithologyProfileMeanMedianStd. Dev *VC% *RangeStd. Asym *Std. Kurts *
IAAndesites to rhyolites, pyroclasts0–30 cm273.6267.575.827.7262.00.2−0.9
30–60 cm268.7278.684.231.4241.1−0.6−1.4
Clays, tuffs, sandstones, conglomerates0–30 cm324.3277.2164.750.8748.84.03.4
30–60 cm259.9236.892.935.8355.31.7−0.5
Metagreywacke, metalavas0–30 cm8.881.54.75.911.3−0.3−1.0
30–60 cm85.387.110.111.827.5−1.00.4
Basaltic and andesitic metalavas, schists0–30 cm157.3149.535.122.3108.10.8−0.4
30–60 cm176.3176.731.217.798.0−0.1−0.6
NIABasaltic and andesitic metalavas, schists0–30 cm172.2150.474.243.1319.34.44.4
30–60 cm192.9175.474.538.6313.34.54.2
* IA: intervened area; NIA: non-intervened area; Std. Dev: standard deviation; VC%: percentage coefficient of variation; Std. Asym: standardized asymmetry; Std. Kurts: standardized kurtosis.
Publisher’s Note: MDPI stays neutral with regard to jurisdictional claims in published maps and institutional affiliations.

