
Typology of Teaching Actions during COVID-19 Lockdown in the Valencian Community (Spain)
by
 and
and
María Jesús Perales-Montolio
1, 
Sonia Ortega-Gaite
2,
José González-Such
1 and
Purificación Sánchez-Delgado
1,* 1
Evaluation and Measurement Group (GemEduco), University of Valencia, 46010 Valencia, Spain
2
Evaluation and Measurement Group (GemEduco), University of Valladolid, 46010 Valencia, Spain
*
Author to whom correspondence should be addressed.
Societies 2023, 13(2), 26; https://doi.org/10.3390/soc13020026
Submission received: 21 December 2022
/
Revised: 13 January 2023
/
Accepted: 17 January 2023
/
Published: 27 January 2023
(This article belongs to the Special Issue Inclusion and Equity Education Policy during Epidemic: Actions through Active Methodologies, Technologies and Audiovisual Media)
Abstract
:The COVID-19 coronavirus affected all countries, changing living practices and patterns of social structures. Spain confined all citizens to their homes from 14 March until 21 June 2020. All schools were closed, and education was suddenly converted to an online format. This study is part of wider research and analyzes the ways in which teachers in the Valencian Community (Spain) have approached School at Home (SH) The approach of the study is based on mixed methods (quantitative surveys and qualitative focus groups) and has an exploratory aim. Multivariate profiles of the gaps (represented by composite indicators) in both groups are analyzed based on k-means cluster analysis, as well as the variables associated with each profile, using non-parametric tests. The results show three groups of teachers, established according to four types of gaps, with different perceptions of the situation. ICT proficiency was very important, as well as family situation and support during confinement. The main lines of research derived from this study in relation to CSE and teacher outcomes are proposed.
Keywords:
COVID-19; school at home; inequality gaps; teaching methodology; teachers; digital teaching; ICT1. Introduction
1.1. COVID-19 Lockdown: A Key Moment to Study
The COVID-19 pandemic in Spain led to the confinement of the entire population under a “state of alarm” from 14 March until 21 June (Real Decreto 463/2020), affecting the entire education system and leading to the implementation of distance learning between schools and homes, supervised by teachers and families depending on the context.
As we have explained, “the COVID-19 pandemic has created the largest disruption of education systems in human history by affecting nearly 1.6 billion learners in more than 200 countries. Closures of schools, institutions and other learning spaces have impacted more than 94% of the world’s student population” [1].
A necessary contextual aspect to understand the framework in which the study was conducted is that the type of lockdown decreed in Spain was almost absolute; no one could leave their home except for “essential professionals” (see characteristics in Table Synthesis of characteristics (Ch) of the lockdown that was carried out in Spain between 14 March and 21 June 2020 [1]).
Therefore, the closure of schools and online education provoked a moment of analysis of the context of school care and its incidence on vulnerable groups. In this sense, studies have been carried out on non-teaching periods during school holidays and Socio-Economic and Cultural Level NSEC [2,3,4,5,6]; however, this situation is completely new and the risk factors and social exclusion are varied [7,8,9]. This study does not concern situations of vulnerability of groups of disadvantaged families or under NSEC, which could generate different intervening factors. For example, type of family, typology of the house where they live, employment situation of family members, material resources for the use of Information and Communication Technologies (ICT), knowledge of the use of these resources for cultural and educational uses, emotional situation during confinement, etc., are all analyzed.
This unprecedented situation was a key moment to analyze what associated factors—as well as the resulting inequalities—could occur in society when schools were unable to operate on a face-to-face basis. Our research group, GemEduco 1 (Evaluation and Measurement Group: Education for Social Cohesion, included in the Register of Research Groups of the University of Valencia (GIUV2016-290), Spain), analyzed this situation in the School at Home Research (SH). The initial descriptive study can be consulted in [10].
These types of situations, which in most cases are unbalanced or different, could create different scenarios not only in situations of vulnerability, as discussed above, but could also generate gaps in personal and family well-being. Therefore, the SH study turned out to be necessary.
1.2. The Teacher Situation
In our context and in other countries, a multitude of studies have emerged analyzing the impact of the situation of confinement in education. These studies confirm the existence of a multidimensional gap (methodological, socio-economic and technological) that hinders a real transformation of education [11]. Through a sociological perspective, we analyze the perspective of the different actors involved [12] and delve into the perspective of students and university professors, who also had to limit themselves to online teaching [13]. Other studies focus on specific schools with a higher risk of social exclusion [14] or assess the difficulties of teachers and families to carry out teaching that meets the needs of students and their families [15].
No teaching guidelines, either from the public administration or management teams of subsidized/private centers, were offered at that time; everything was improvised. Teachers had to face this situation with no previously organized support from institutions and with barely any digital competence. Teachers had to work with their own resources: the computers and internet connection they had at home. In addition, they had no indication of how to separate their working day from the rest of their day, and they had to simultaneously attend to their own family responsibilities. At the same time, teachers had to motivate and accompany students and families, who also had very different situations. In some cases, they had computer resources and training to do so, but in other cases they had many difficulties [10,15].
During home schooling, teachers would necessarily have to carry out their work at a distance. Therefore, various situations of inequality can arise; for example, some teachers could be affected by their poor training in distance education. In Spain, initial teacher training is always directed towards competences for face-to-face teaching. There is very little training in information and communication technologies, and even less in their use in distance learning. Teachers are usually ICT proficient as users of platforms and software, but ICT are not always integrated in schools as teaching tools. Teachers had to develop strategies for distance learning from one day to the next and with very little support.
This article complements the work presented earlier on this issue of families who experienced this situation in the Valencian Community (Spain). To this end, it presents an exploratory analysis of the differential teacher profiles that could be established from the identified inequalities and their link with the associated variables, which were carried out with teachers, that help to understand school functioning in SH. Previous studies have presented the aforementioned global study report and a specific study of learning ecologies [16] that teachers implemented from home. Teachers learned with peers and autonomously, with the help of the internet. In some cases, they were also supported by management teams. Another specific study analyzed the differential variables that affected families linked with the levels of education that their children were studying [17].
2. Goals
This article analyzes the perceptions of the teachers who taught students in Early Childhood Education (ECE), Basic Education (BE) and Compulsory Secondary Education (CSE) 2 in the Valencian Community (VC), Spain [10]. In Spain, ECE is organized in two cycles (0–3 and 3–6 years) and is not compulsory, although there is a great demand given the ever-growing participation of women in the workforce; BE (6 grades) and CSE (4 grades) are compulsory.
The general objective is to record the perception of teachers of developing (challenges, difficulties, achievements) SH by considering the diversity of the educational situations that could exist during lockdown.
As specific objectives of this study (in parallel to the study carried out with families), we can:
- Identify the most appropriate solution for the number of household profiles, described in terms of the composite indicators.
- Describe each of the profiles belonging to the cluster typology in terms of the composite indicators and their association with demographic and other external variables.
- Analyze the inequality profiles in the family, socio-labor and pedagogical conditions of teachers, and their relationship with their performance in SH; analyze their association with demographic variables, the methodologies used and the expectation of student achievement.
- Collect information based on focus groups to have a complementary qualitative approach that helps us to confirm and expand, if necessary, the quantitative results.
3. Materials and Methods
3.1. Design
This is an exploratory study based on information provided by teachers. As we explained earlier, this study is developed in the same research that pertains to the families [1]. The study uses a research strategy of mixed models (quantitative/qualitative) based on an online survey with focus groups adding and complementing information about the investigation objectives [1,18,19,20,21]).
3.2. Participants
In Spain on the whole, 1708 valid teacher surveys were collected that reported on 5539 students; in a parallel study presented in another paper, 3758 valid household surveys were also analyzed. In all groups, between 70% and 80% of the cases were from the Valencian Community 3. This article focuses only on data from this geographic area with teachers’ samples.
Based on the data available on the website of the Ministry of Education, Training and Vocational Training of Spain [22], the number of non-university teachers in the Valencian Community is 74,908. Due to the structure and organization of the educational system, it is not possible to disaggregate the teaching staff that only teach at high school, although it is possible to estimate those in Secondary Education who teach Vocational Training 4. In the Spanish educational system, Baccalaureate and Professional Training (Formative Cycles) are part of upper secondary education and are not compulsory. These groups were not included in our study, given that due to their age (minimum for the first year between 16 and 18 years old), their dependence on their families is less than in the cases of compulsory education. The teachers from the Valencian Community who teach the Early Childhood School, Basic School, and Secondary School levels (including high school) amount to 68,790. In the sample refined for the study, 1351 cases belong to the Valencian Community. When taking the data of both populations as a reference, the confidence level of this sample was 99%, with a confidence interval of <3.5% and a percentage of 50%.
Even though samples were statistically significant for a number of the total cases, when using Snowball Sampling we were unable to ensure the sample’s representativeness in relation to randomness and stratification 5. In the population, the strata distribution is: Type (Public: 66.22%; Subsidized/Private: 33.78%) and Level of Education (ECE: 25.59%; BE: 44.68%; CSE: 29.73%). It was also not possible to establish representativeness in relation to the proportional distribution for provinces in the Valencian Community. For this reason, attention was paid to the analysis sample composition according to the indicators, which helped us to describe its characteristics and the diversity of the collected cases. For this purpose, we used the Gini coefficient [23].
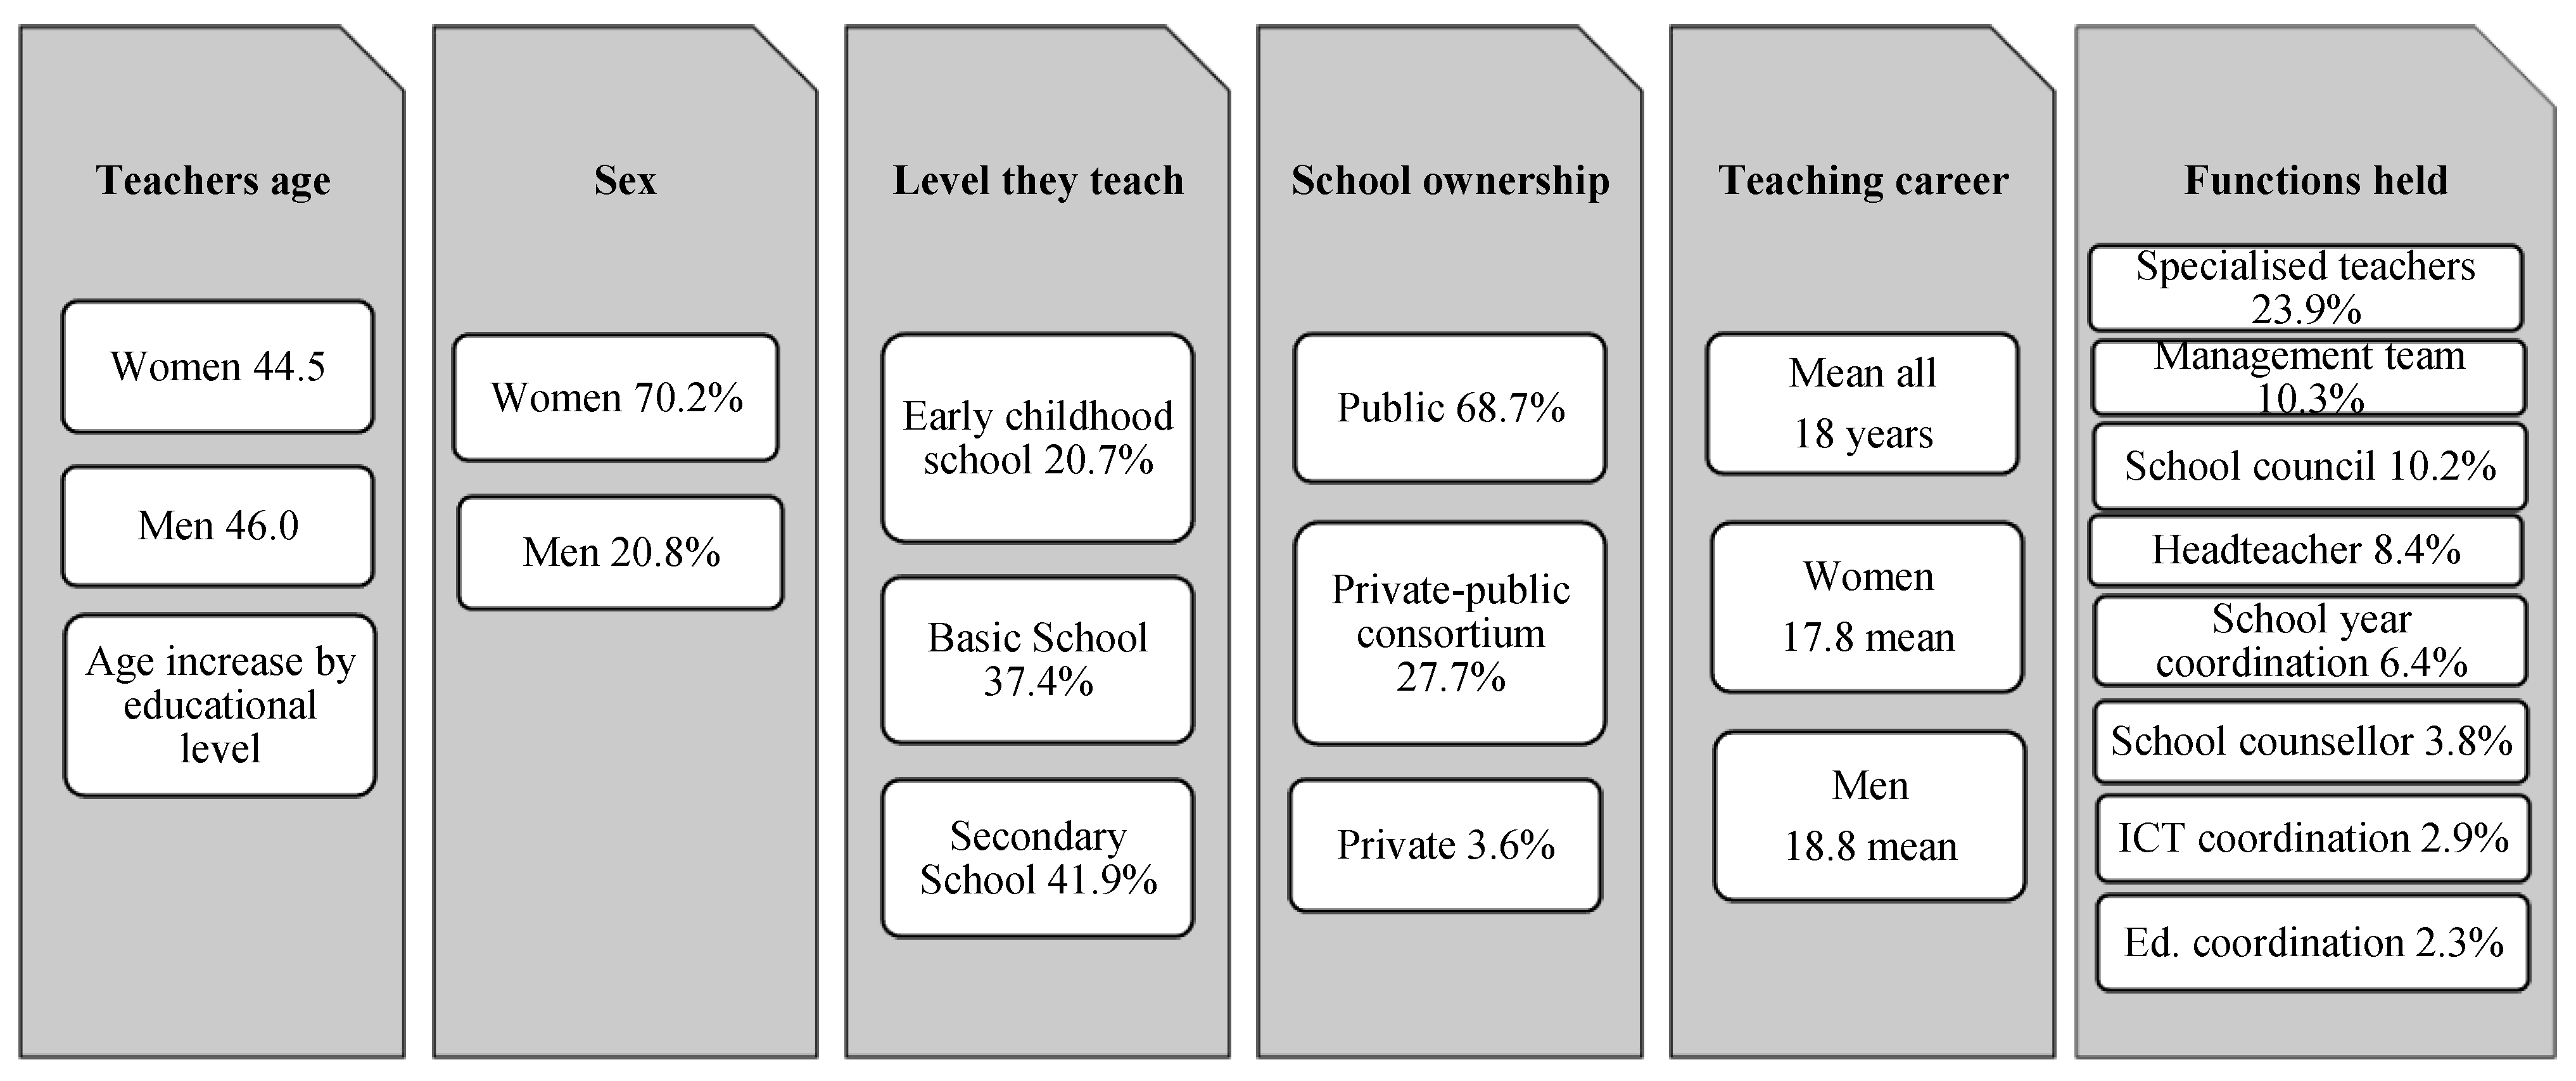
The sample that completed the teacher survey represents a very homogeneous mean NSEC (Gini = 0.135), regardless of whether they were teachers from public or subsidized/private centers. The characteristics of the people who completed the surveys are found in Figure 1.
In the qualitative approach, we were able to work with the following groups of participants: ECE Teachers N = 9 teachers; BE N = 9; CSE N = 8; Special education teachers (in ordinary schools) N = 6 and Special education teachers (in special education schools) N = 7.
3.3. Data Gathering: Variables, Indicators and Instruments
During lockdown, Snowball Sampling was carried out using social networks [24] to apply the surveys with teachers (the data collected in each one is synthesized in Table 1).
The survey included 33 questions and was common for all teachers, but was adapted for the three levels of education studied (early childhood, basic and compulsory). At the end, the survey included an open question for suggestions and comments.
These surveys were administered between April and June 2020 via two online surveys, using Lime Survey, with computer/tablet and mobile phone dissemination formats. The complete surveys can be consulted in [10] (pp. 184–220).
As the teaching staff belonged to public and state-assisted/private centers 6, they could provide information about vulnerable groups, but not with the desired level of detail. The Spanish education system contains three types of centers, depending on funding: (a) public (state funding); (b) subsidized (mixed funding: private schools supported by state funding); (c) private (private funding). In this study, we grouped types (b) and (c) because they tend to have different socio-economic conditions than public schools and the number of completely private centers is very small in the Valencian Community (around 2%).
As we have previously discussed [1], in considering our previous experience in other socio-educational evaluative studies [25,26,27], we included a qualitative approach to better understand the results observed in the survey, and to identify any signs that had not been detected by the quantitative study. For this reason, we collected data from focus groups made up of teachers per levels of education (early childhood, basic and secondary) with teachers responsible for attending to social and educational diversity, and representative families from different economic and cultural levels.
In Table 2, we present the questions which structure the focus groups. Each focus group session lasted between one-and-a-half and two hours. Debate was structured according to the survey inquiry dimensions by fostering participation flexibly so that any matters that the participants considered were the most relevant that could emerge 7.
3.4. Procedure
The phases that this study was conducted in are found in Table 3. In designing the survey, we ensured content validity in accordance with the objectives of the study, the technical quality of the items and an online format that would facilitate its application. The initial study was conducted between April and early July 2020 and focused on collecting quantitative data during the lock-in 8. In addition to this work, we continue to conduct secondary studies to deepen the lines of research derived from the initial results published in [10].
The initial School at Home (SH) study provided the descriptive results of the surveys held with families and teachers. The preparation of compound indicators, conceived as different gaps, allowed groups of families and teachers with a different facilitating or hindering situations to be identified in order to deal with SH.
The central point in this exploratory study is the “Compound Indicators of Gaps about SH”. These indicators are the result of jointly considering several items that describe the situation of teachers regarding different aspects, as shown in Table 4 9. Throughout the text, we have left the abbreviations of indicators exactly as they were published in Spanish in Jornet-Meliá et al (2020).
3.5. Data Analysis
In this study, we use the same strategy that is used in the study of families [1] in order to construct an exploratory study that was carried out using the k-means cluster analysis, using Compound Indicators of Gaps about SH as variables and the Euclidean distance following the iteration and classification procedure; we studied different profiles of classification, using the most representative solution in each case. Then, a qualitative approach with focus groups and their analysis was performed.
In order to select the number of groups with the k-means cluster analysis we have selected these criteria: (a) minimum intragroup variability; (b) statistically significant differences in the centroids of the identified groups; (c) no residual groups of subjects existing (in our case, we interpret a residual if the number of cases for a group is below 5% of all analyzed cases); (d) parsimony; (d) as a verification element of (a) and (d) concurring, we employed Elbow Method-Inertia (EMI) [28].
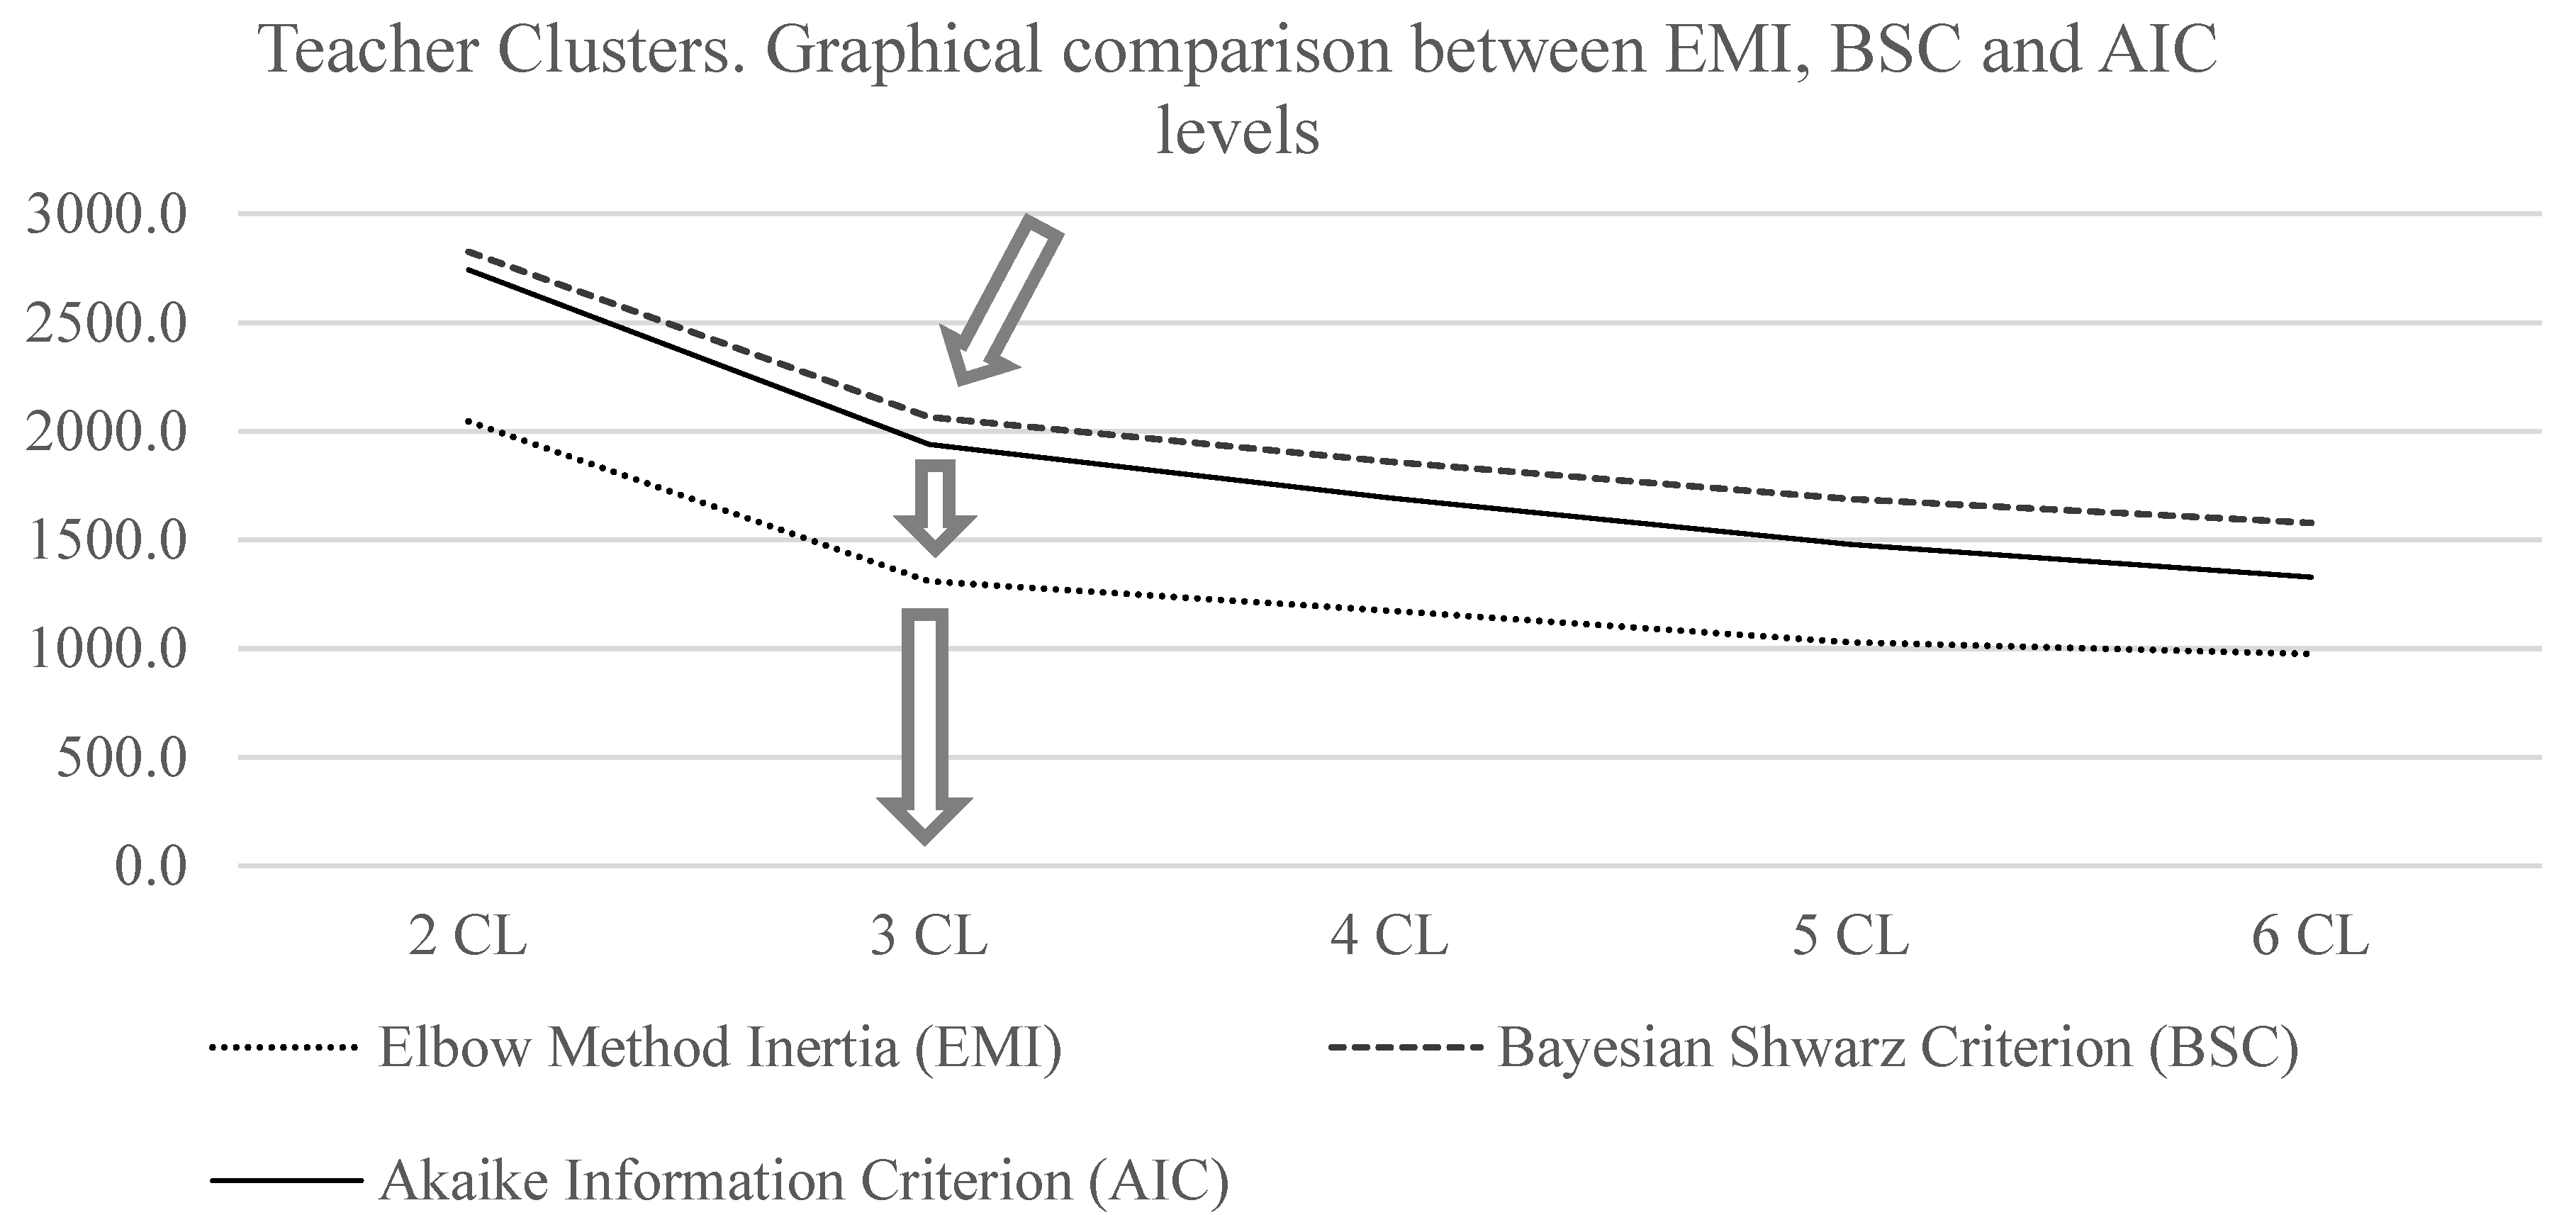
Looking for the best cluster solution, if the same solutions would be obtained, the groups were analyzed by randomizing the cases in order (Figure 2). Adding to this, we used EMI to analyze the relation between the Bayesian Shwarz Criterion (BSC) and the Akaike Information Criterion (AIC), finding that all the indicators were efficient [29,30]. The most representative solution was characterized by the groups according to their demographic issues and the variables were measured in the surveys. Nonparametric tests (Mann–Whitney U, Kruskal–Wallis H) were used because the variables did not mostly meet the necessary normality conditions to apply parametric tests, the Chi-square test and/or the likelihood ratio as association measures.
In the qualitative study, a three-step sequence was established using the transcripts of the focus groups: 1. decomposition into content units; 2. identification and classification of elements; 3. synthesis and grouping, according to the recommendations proposed by different authors [31,32,33,34]. Two different judges analyzed each transcript to ensure the reliability and validity of the data. Semantic units were assigned to the categories of the quantitative questionnaire, and an inductive procedure was implemented by reading the material without considering pre-established categories.
First, one “decontextualization” step was performed by separating relevant portions from the context and then “recontextualization” was performed by grouping data into codes of similar meanings [35]. With this analysis and with the responses classified, we synthesized the aspects of the intra- and interfocus groups looking for identifying common situations in both groups, as well as the differences between the participants and the focus groups, and found that there was usually richer information than in the questionnaire questions, although sometimes the answers were similar.
4. Results
4.1. Characteristics of the Participating Teachers
As we point out in the Participants section, we employed the Gini coefficient to characterize the degree of inequality between the teachers who answered the survey about the social/family conditions that represent the context for performing teacher work at home. As a reference, this is applied to compound indicator Gap 5 (NQUINTILDESIGUAL), which is the result of assigning the sum of Gaps 1 to 4 to quintiles. The Gini coefficient is very low (0.135), which demonstrates that, during confinement, the teacher sample had a very low inequality level because of their possibilities of working from home. This makes it a very homogeneous group despite some specific differences between teachers from public education centers and those from state-assisted/private ones [10,16].
As previously established, the four types of Gap compound indicators were calculated according to the different aspects that generated differences in dealing with SH. The general profile of the gaps, which appeared in the teachers from the Valencian Community to perform SH (see graphs Gap1 to Gap 4 in Figure 3, Figure 4, Figure 5 and Figure 6), can be synthesized into the following aspects [10] (pp. 134–147):
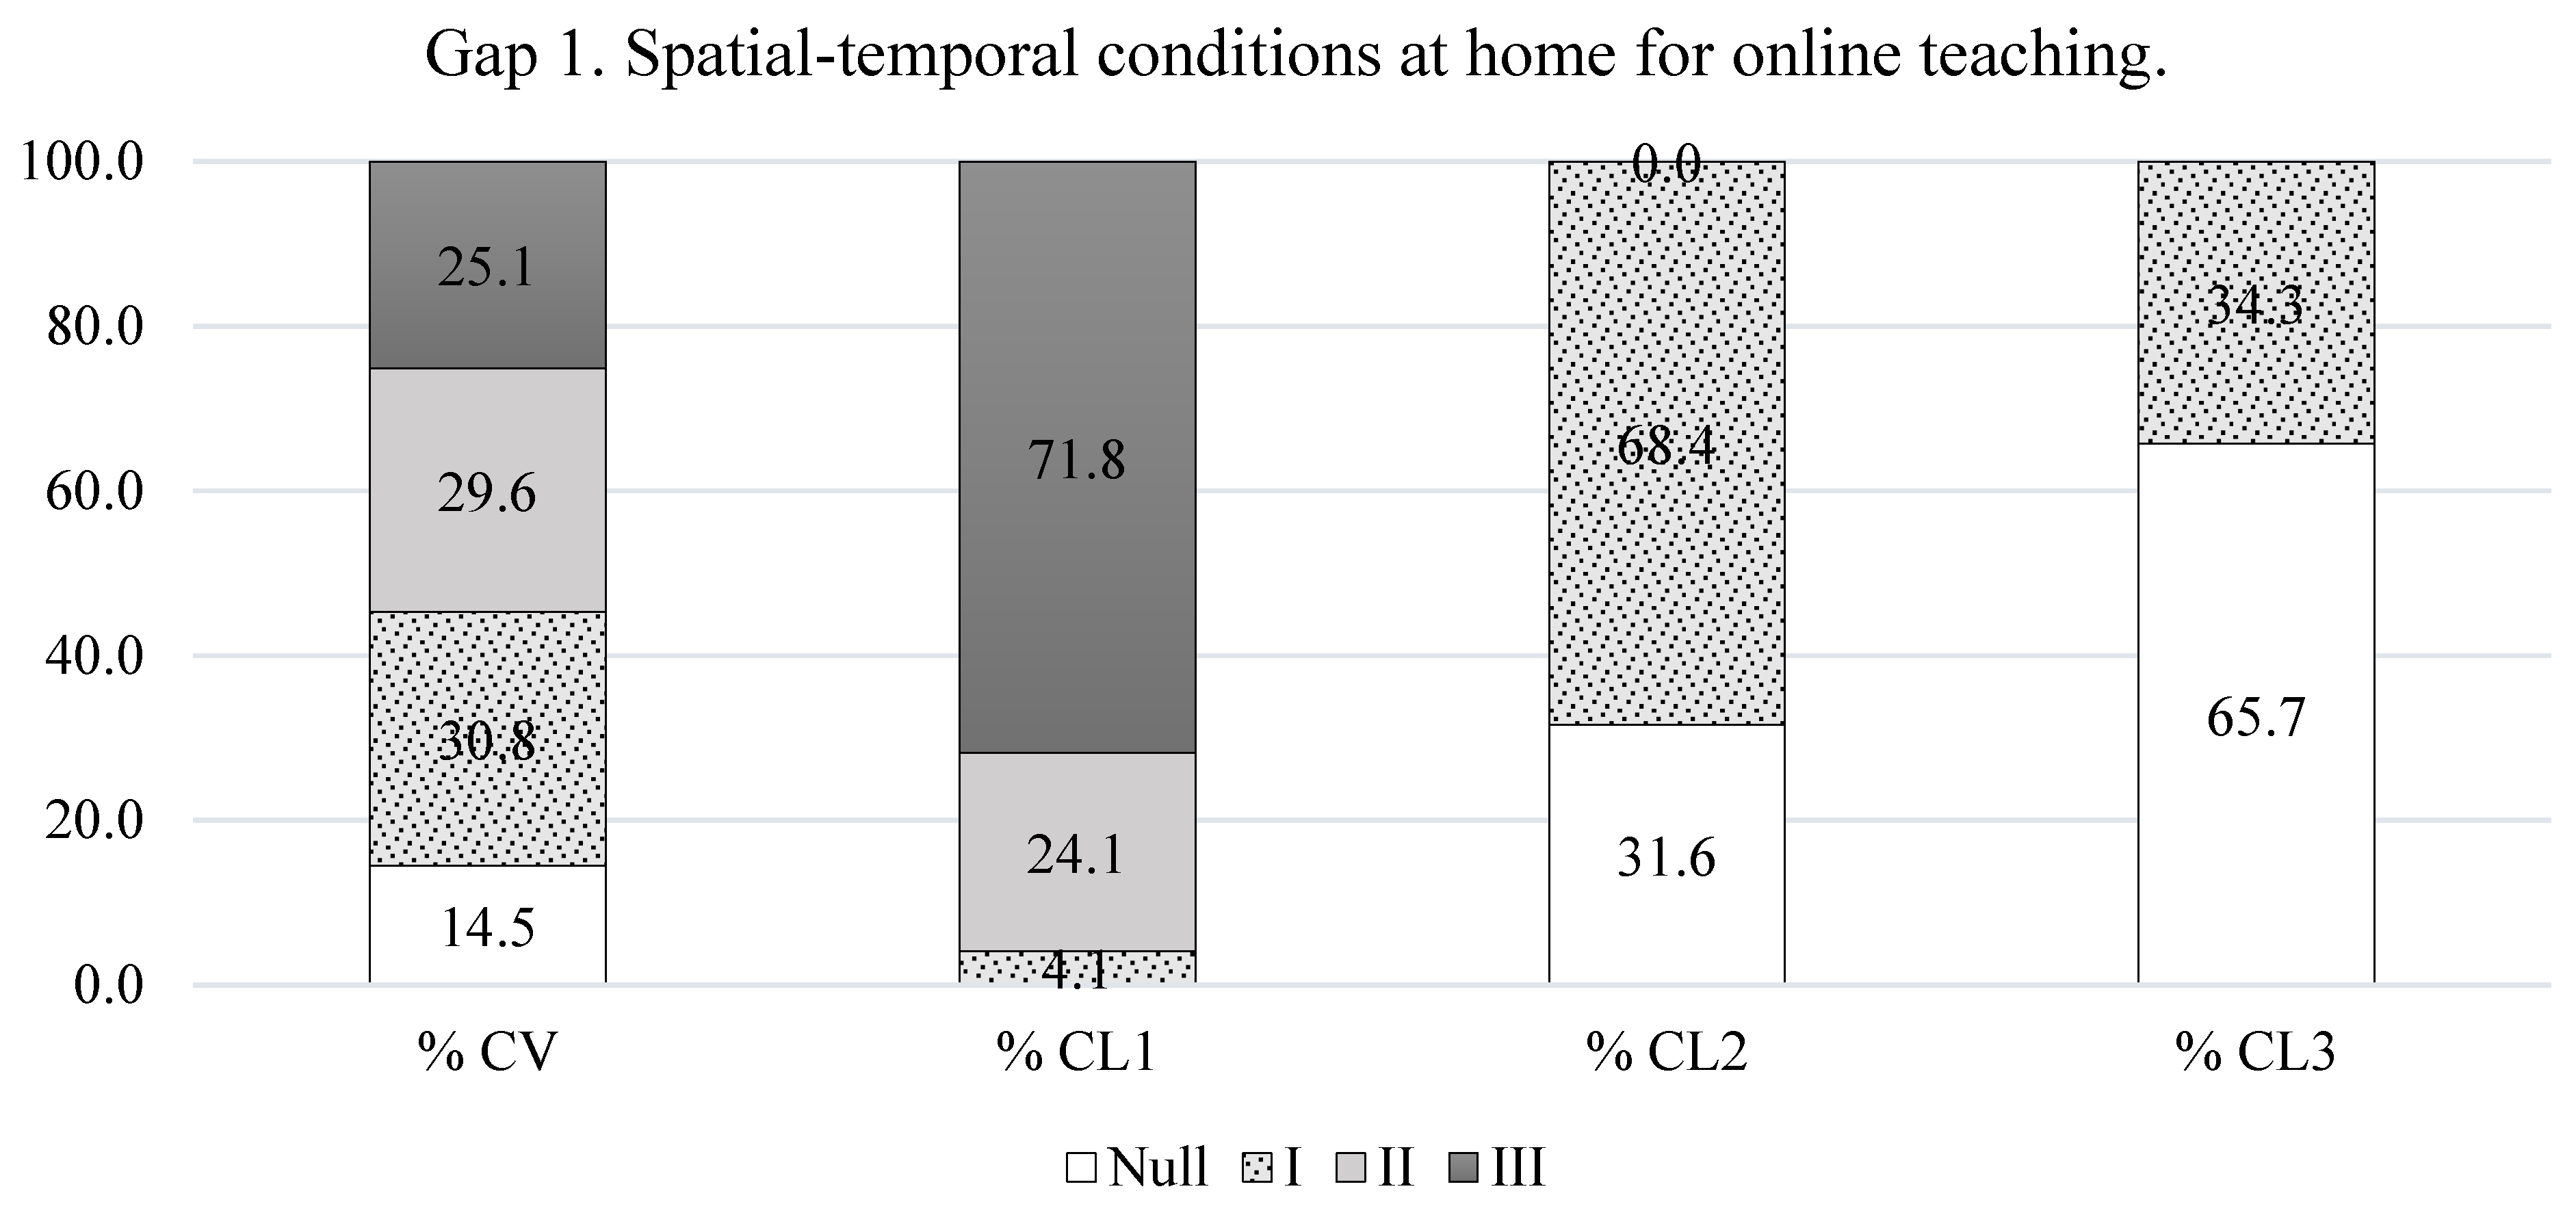
- Gap 1 (the spatio-temporal conditions at home for them to perform their teaching work) refers to: not having space at home to telework, not enough time and/or not having set working hours to teach over the Internet. In the Valencian Community, only 14.5% have suitable conditions and are not affected by this gap; 30.8% have a level 1 gap and 54.7% have gaps at levels II or III.
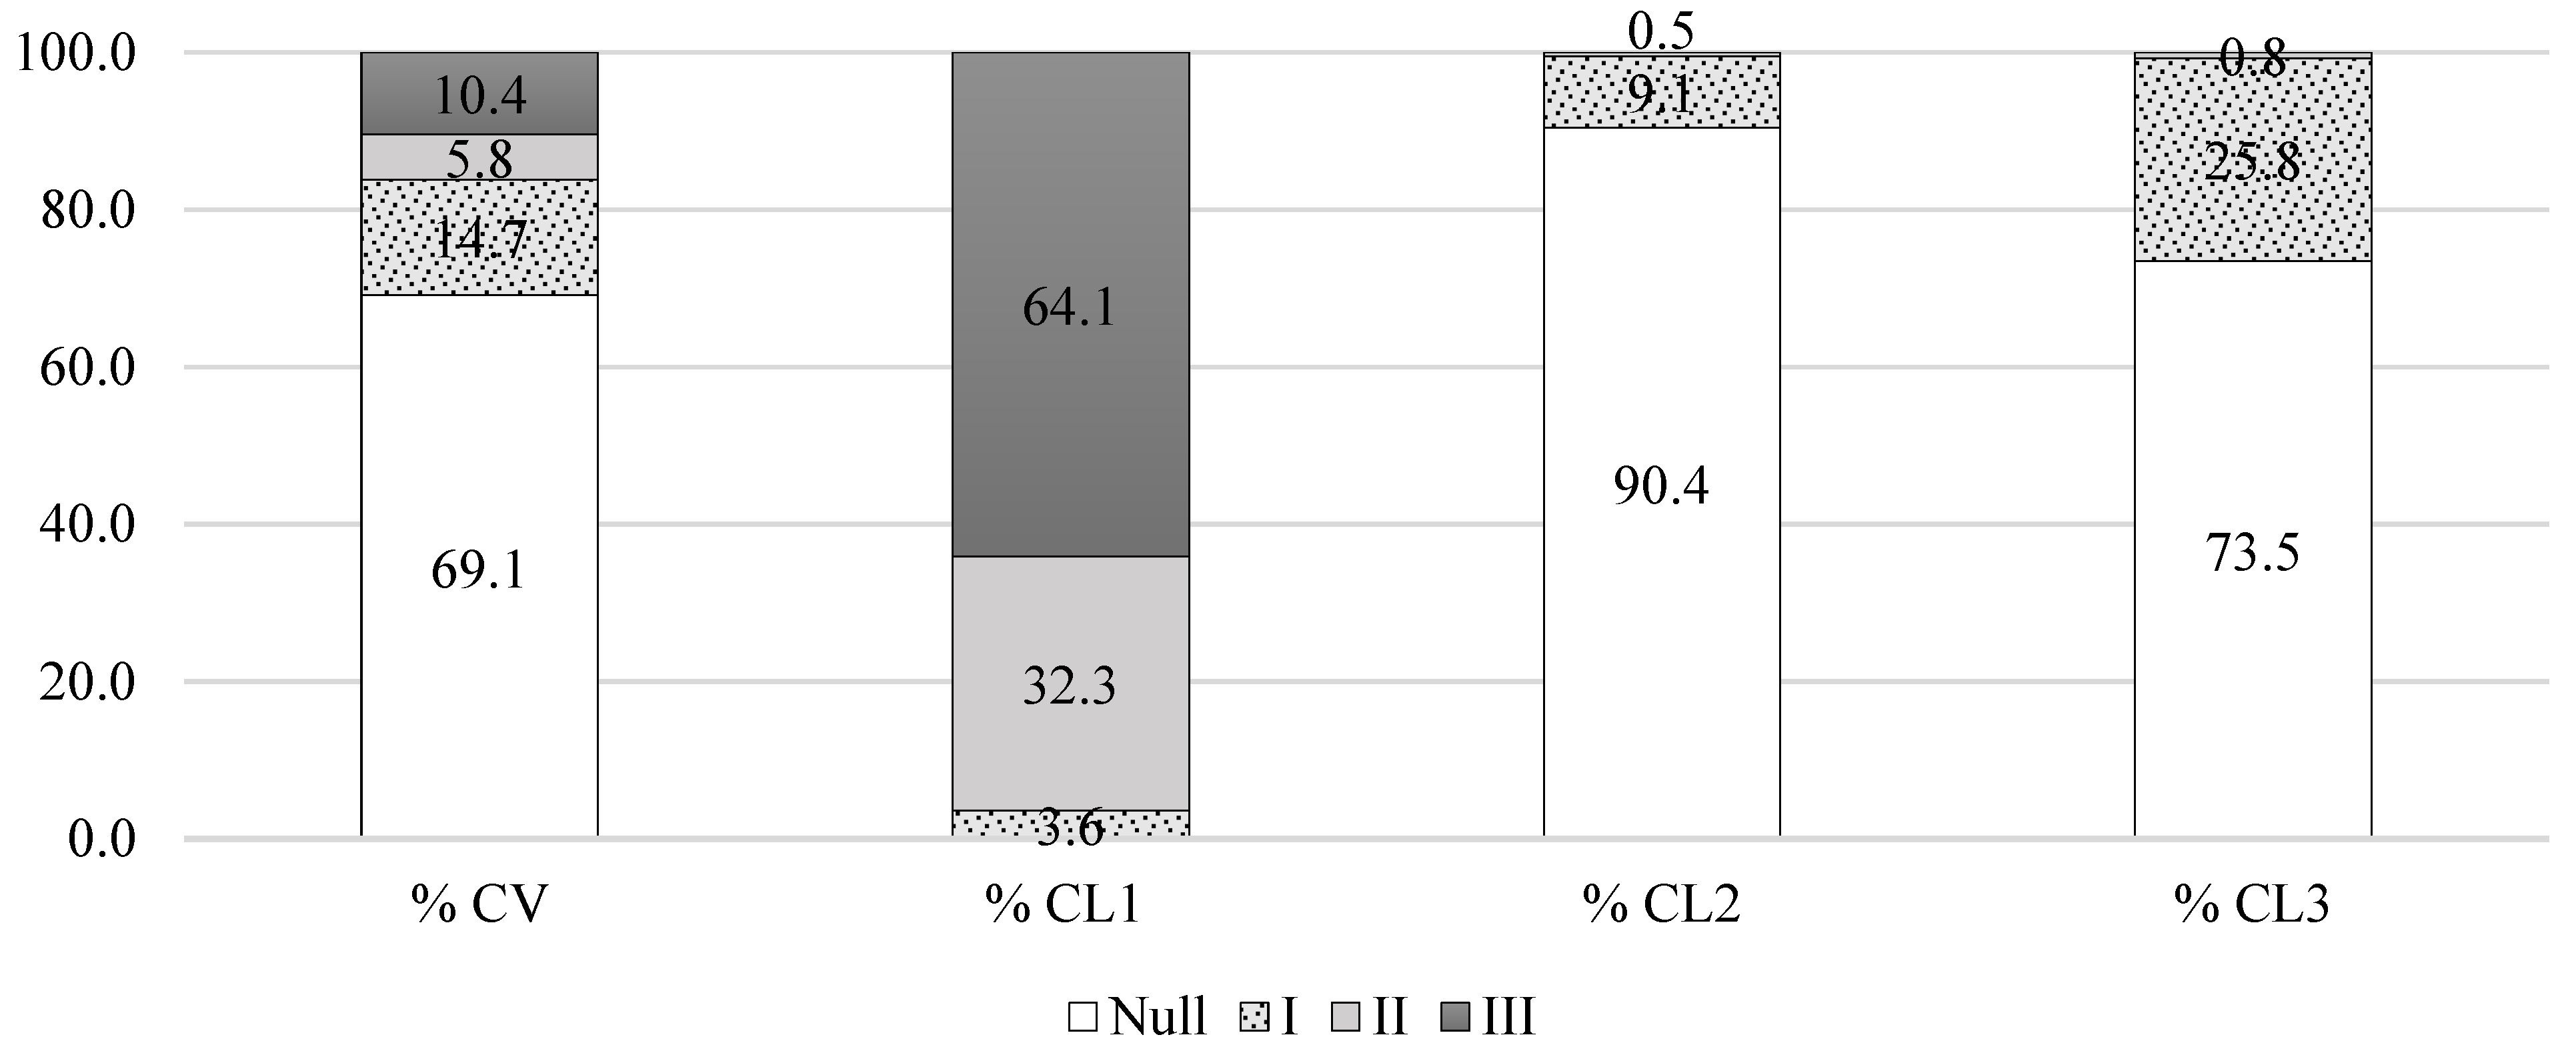
- Gap 2 (ICT resources to teach from home) refers to: not having a suitable Internet connection (and/or Wi-Fi), not having suitable computers and/or tablets and/or mobile phones with adequate data. In the Valencian Community, 69.1% have suitable conditions and are not affected by this gap, 14.7% have a level I gap and 16.2% have gaps at levels II or III.
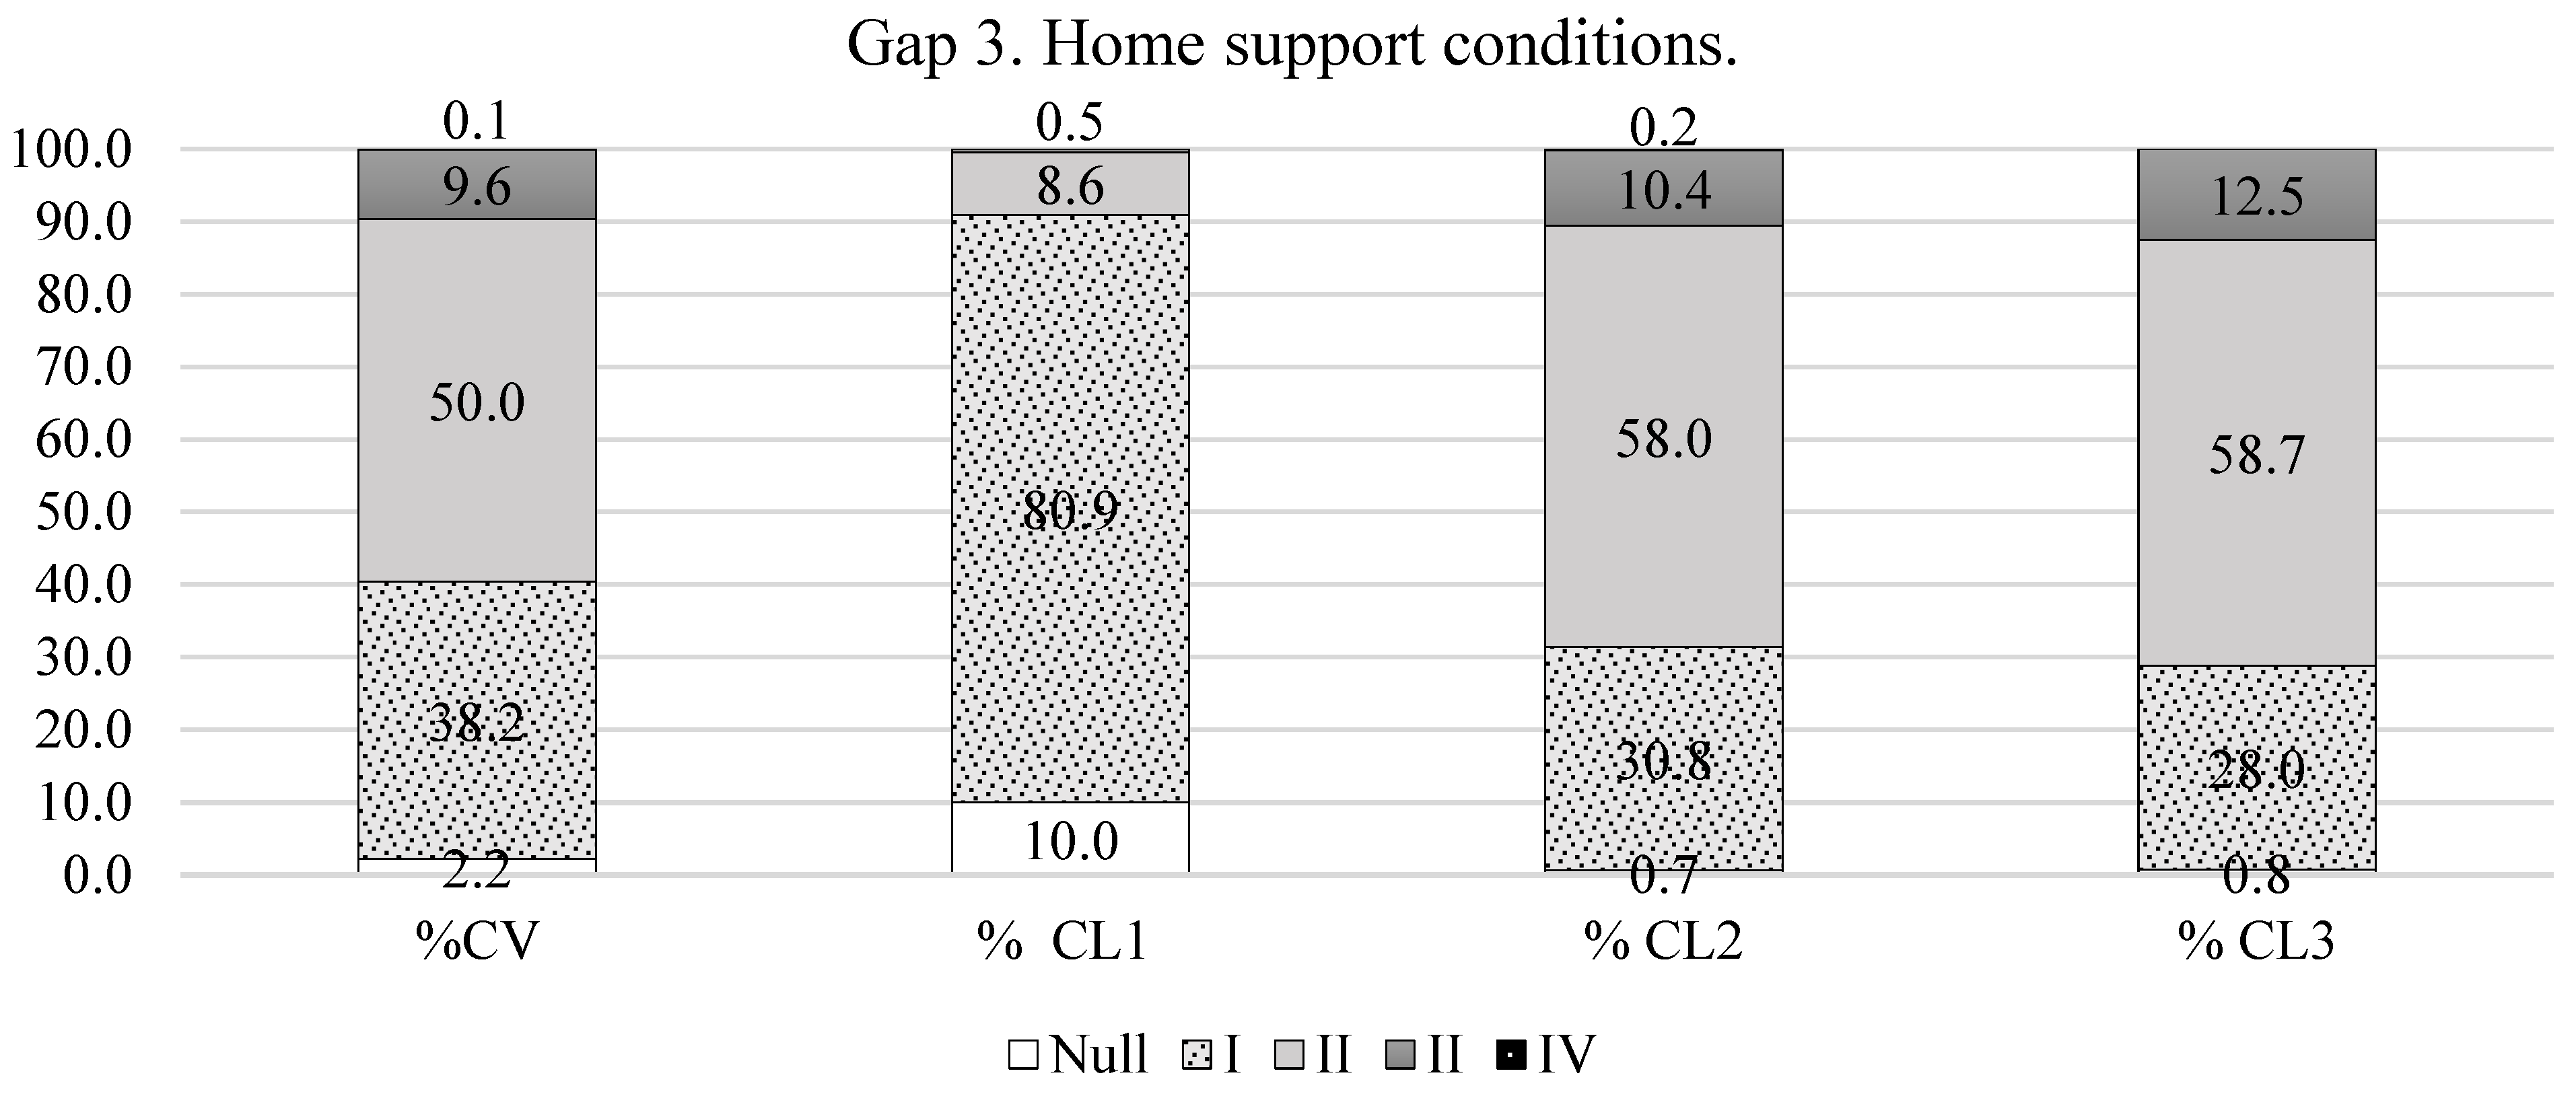
- Gap 3 (lack of home support to telework) includes: not having anyone at home to help them to do other tasks so that they can telework, having elderly or sick (dependent) people to attend to, having to personally maintain their home (clean, shop, meals, healthcare, etc.) and/or having a disease that does not allow them to suitably work 10 (this does not include “having children of school age” because this was considered independently as Gap 4). In the Valencian Community, only 2.2% of teachers have suitable conditions and do not face these problems, 38.2% have a level I gap, 50% have a gap at level II and 9.7% had gaps at levels III or IV.
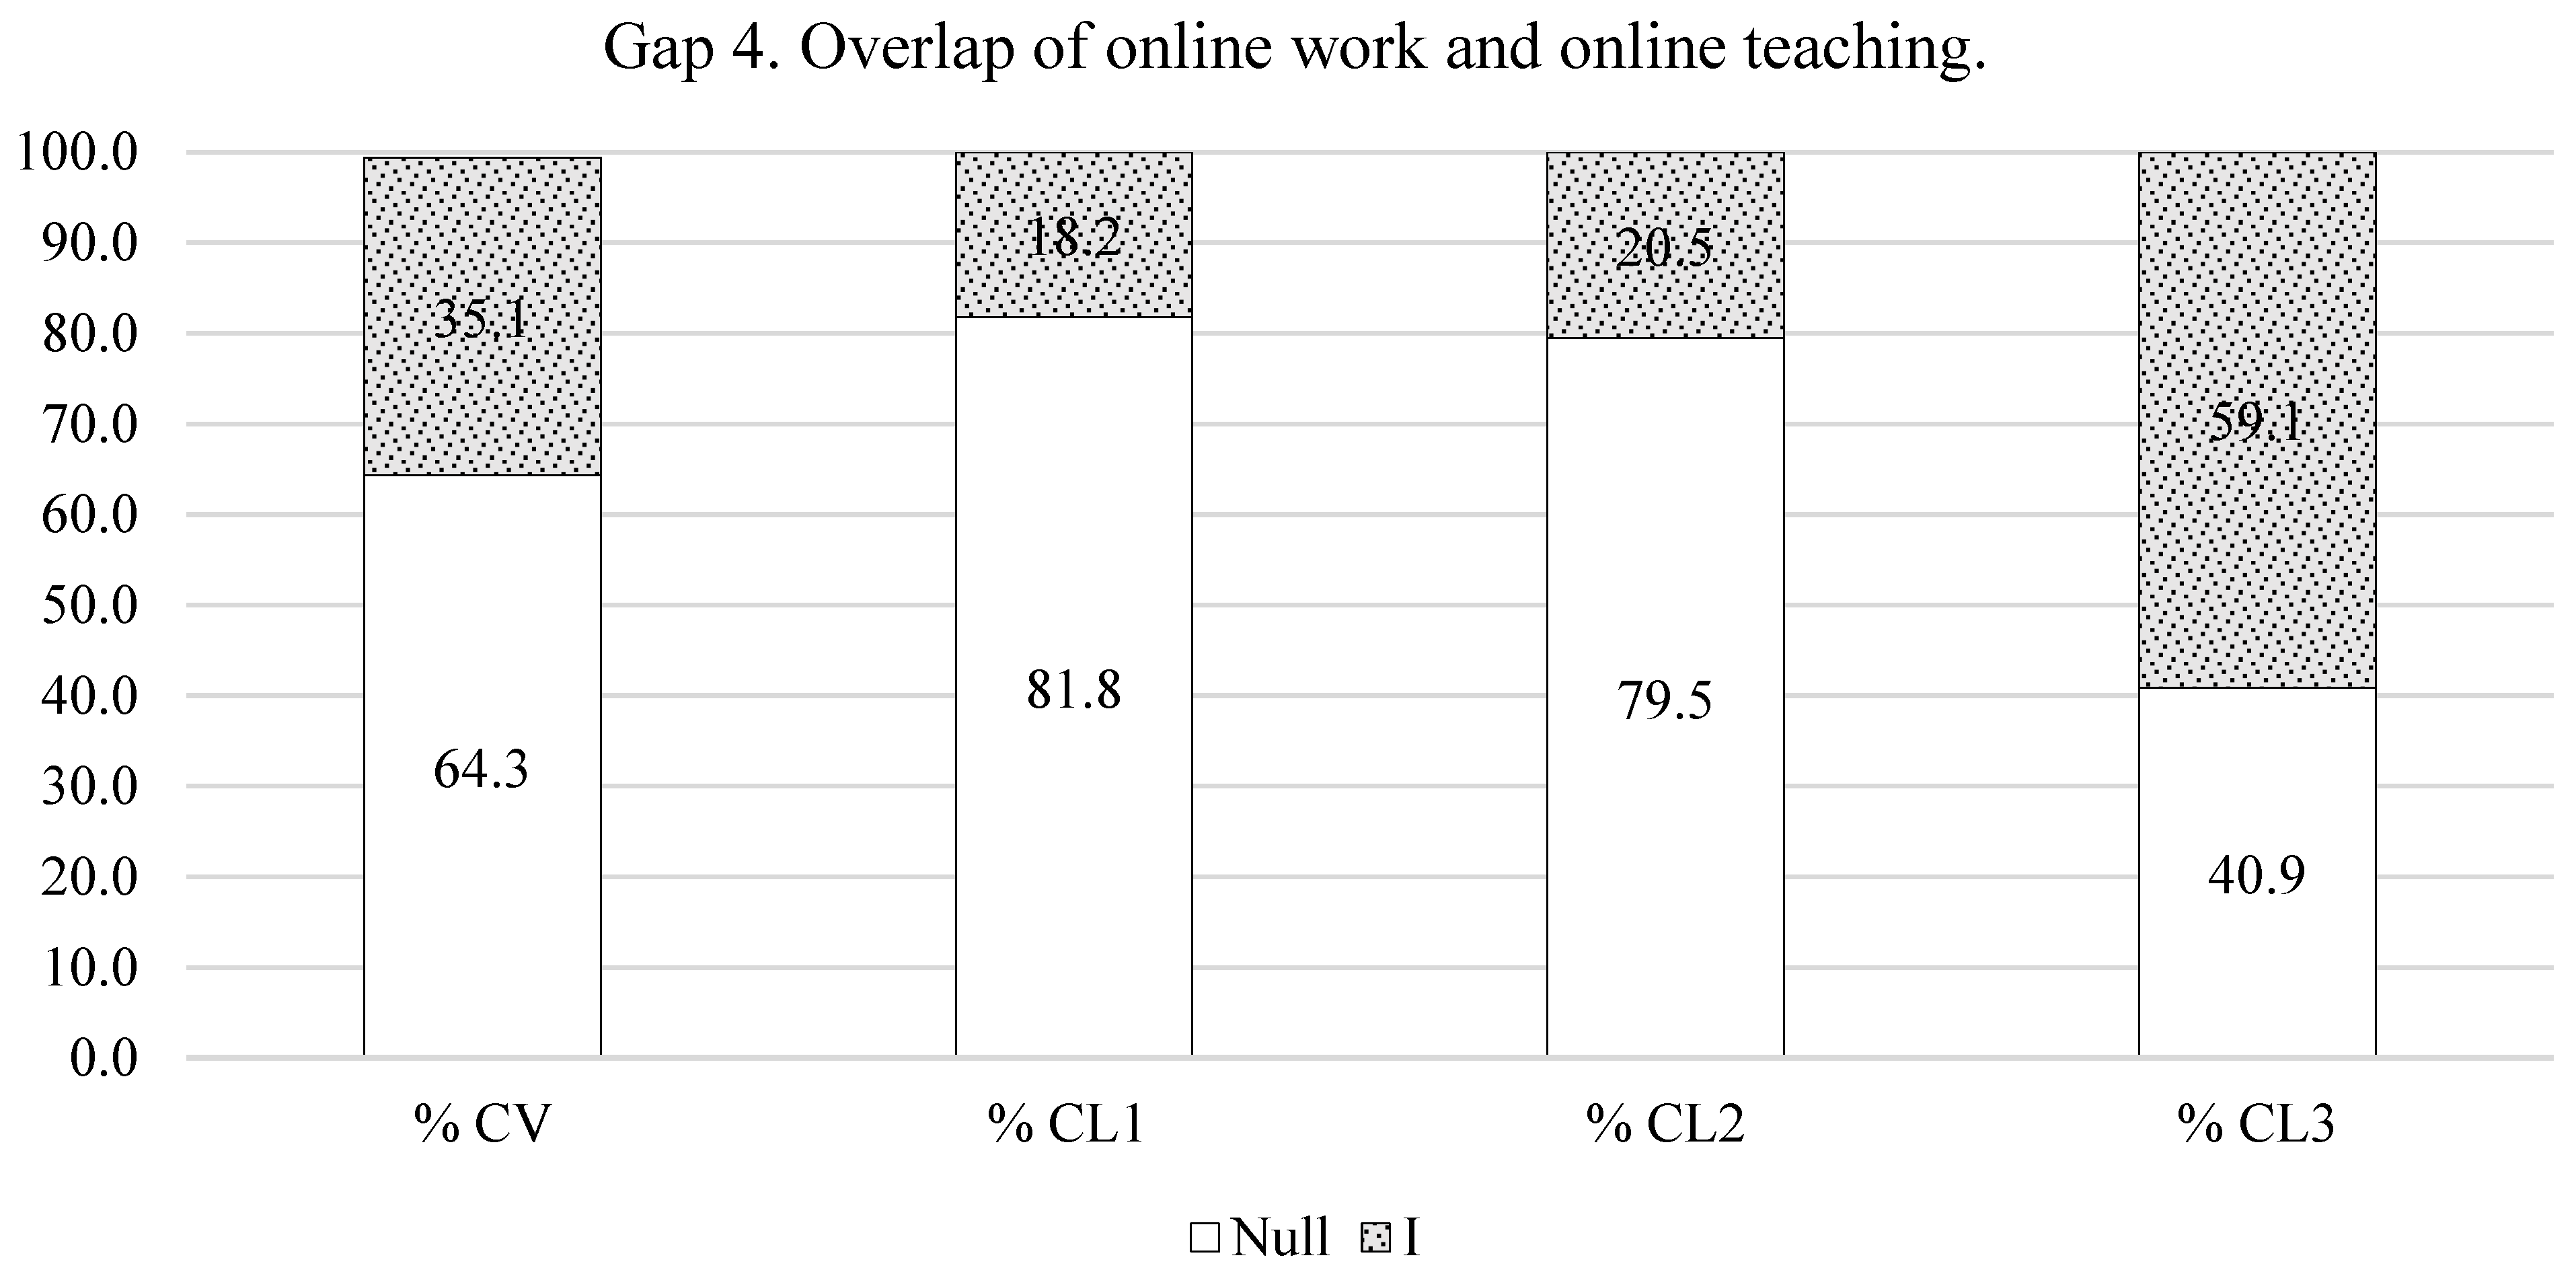
- Gap 4 (teachers teleworking overlaps with the role of mothers/fathers of children of school age) is a dichotomic gap: does not apply (64.3%); applies (35.1%).
4.2. Profiles of the Obstacles (Gaps) That Teachers Came across to Perform Their Teaching Work from Home
The teachers who participated in this study were classified according to how they suffered these gaps to later analyze how this was associated with their way of dealing with SH. To this end, five classification solutions were explored by a k-means cluster analysis, which went from two to six groups. All the solutions presented clusters that complied with the significant differences criteria between cluster centroids (p ≤ 0.0001 in all cases). There were no residual clusters until the 5-group solution (N < 5%). One residual cluster was identified in this solution, and two appeared in the 6-cluster one. From the seventh iteration, there were no changes in the absolute maximum coordinate for any centroid, with a minimum distance between the initial centroids of 3.873.
In order to select the most efficient solution for the classification, the procedure described in the Materials and Methods section was followed. As shown in Figure 2, the intragroup variability levels measured by three procedures (EMI, BSC, AIC) follow the same pattern of change: the intraclass correlation coefficient among the three levels is 0.994 and the bivariate correlation coefficients (Pearson) are, respectively: EMI-BSC (0.997); EMI-AIC (0.992) and BSC-AIC (0.999). In all cases, they are statistically significant (p ≤ 0.0001). Bearing in mind the efficiency criterion in the classification that lies in the aforementioned indicators, the most suitable solution is the 3-cluster solution (Figure 2), from which point the most marked reduction inflection of intragroup variability takes place and becomes stable from this point.
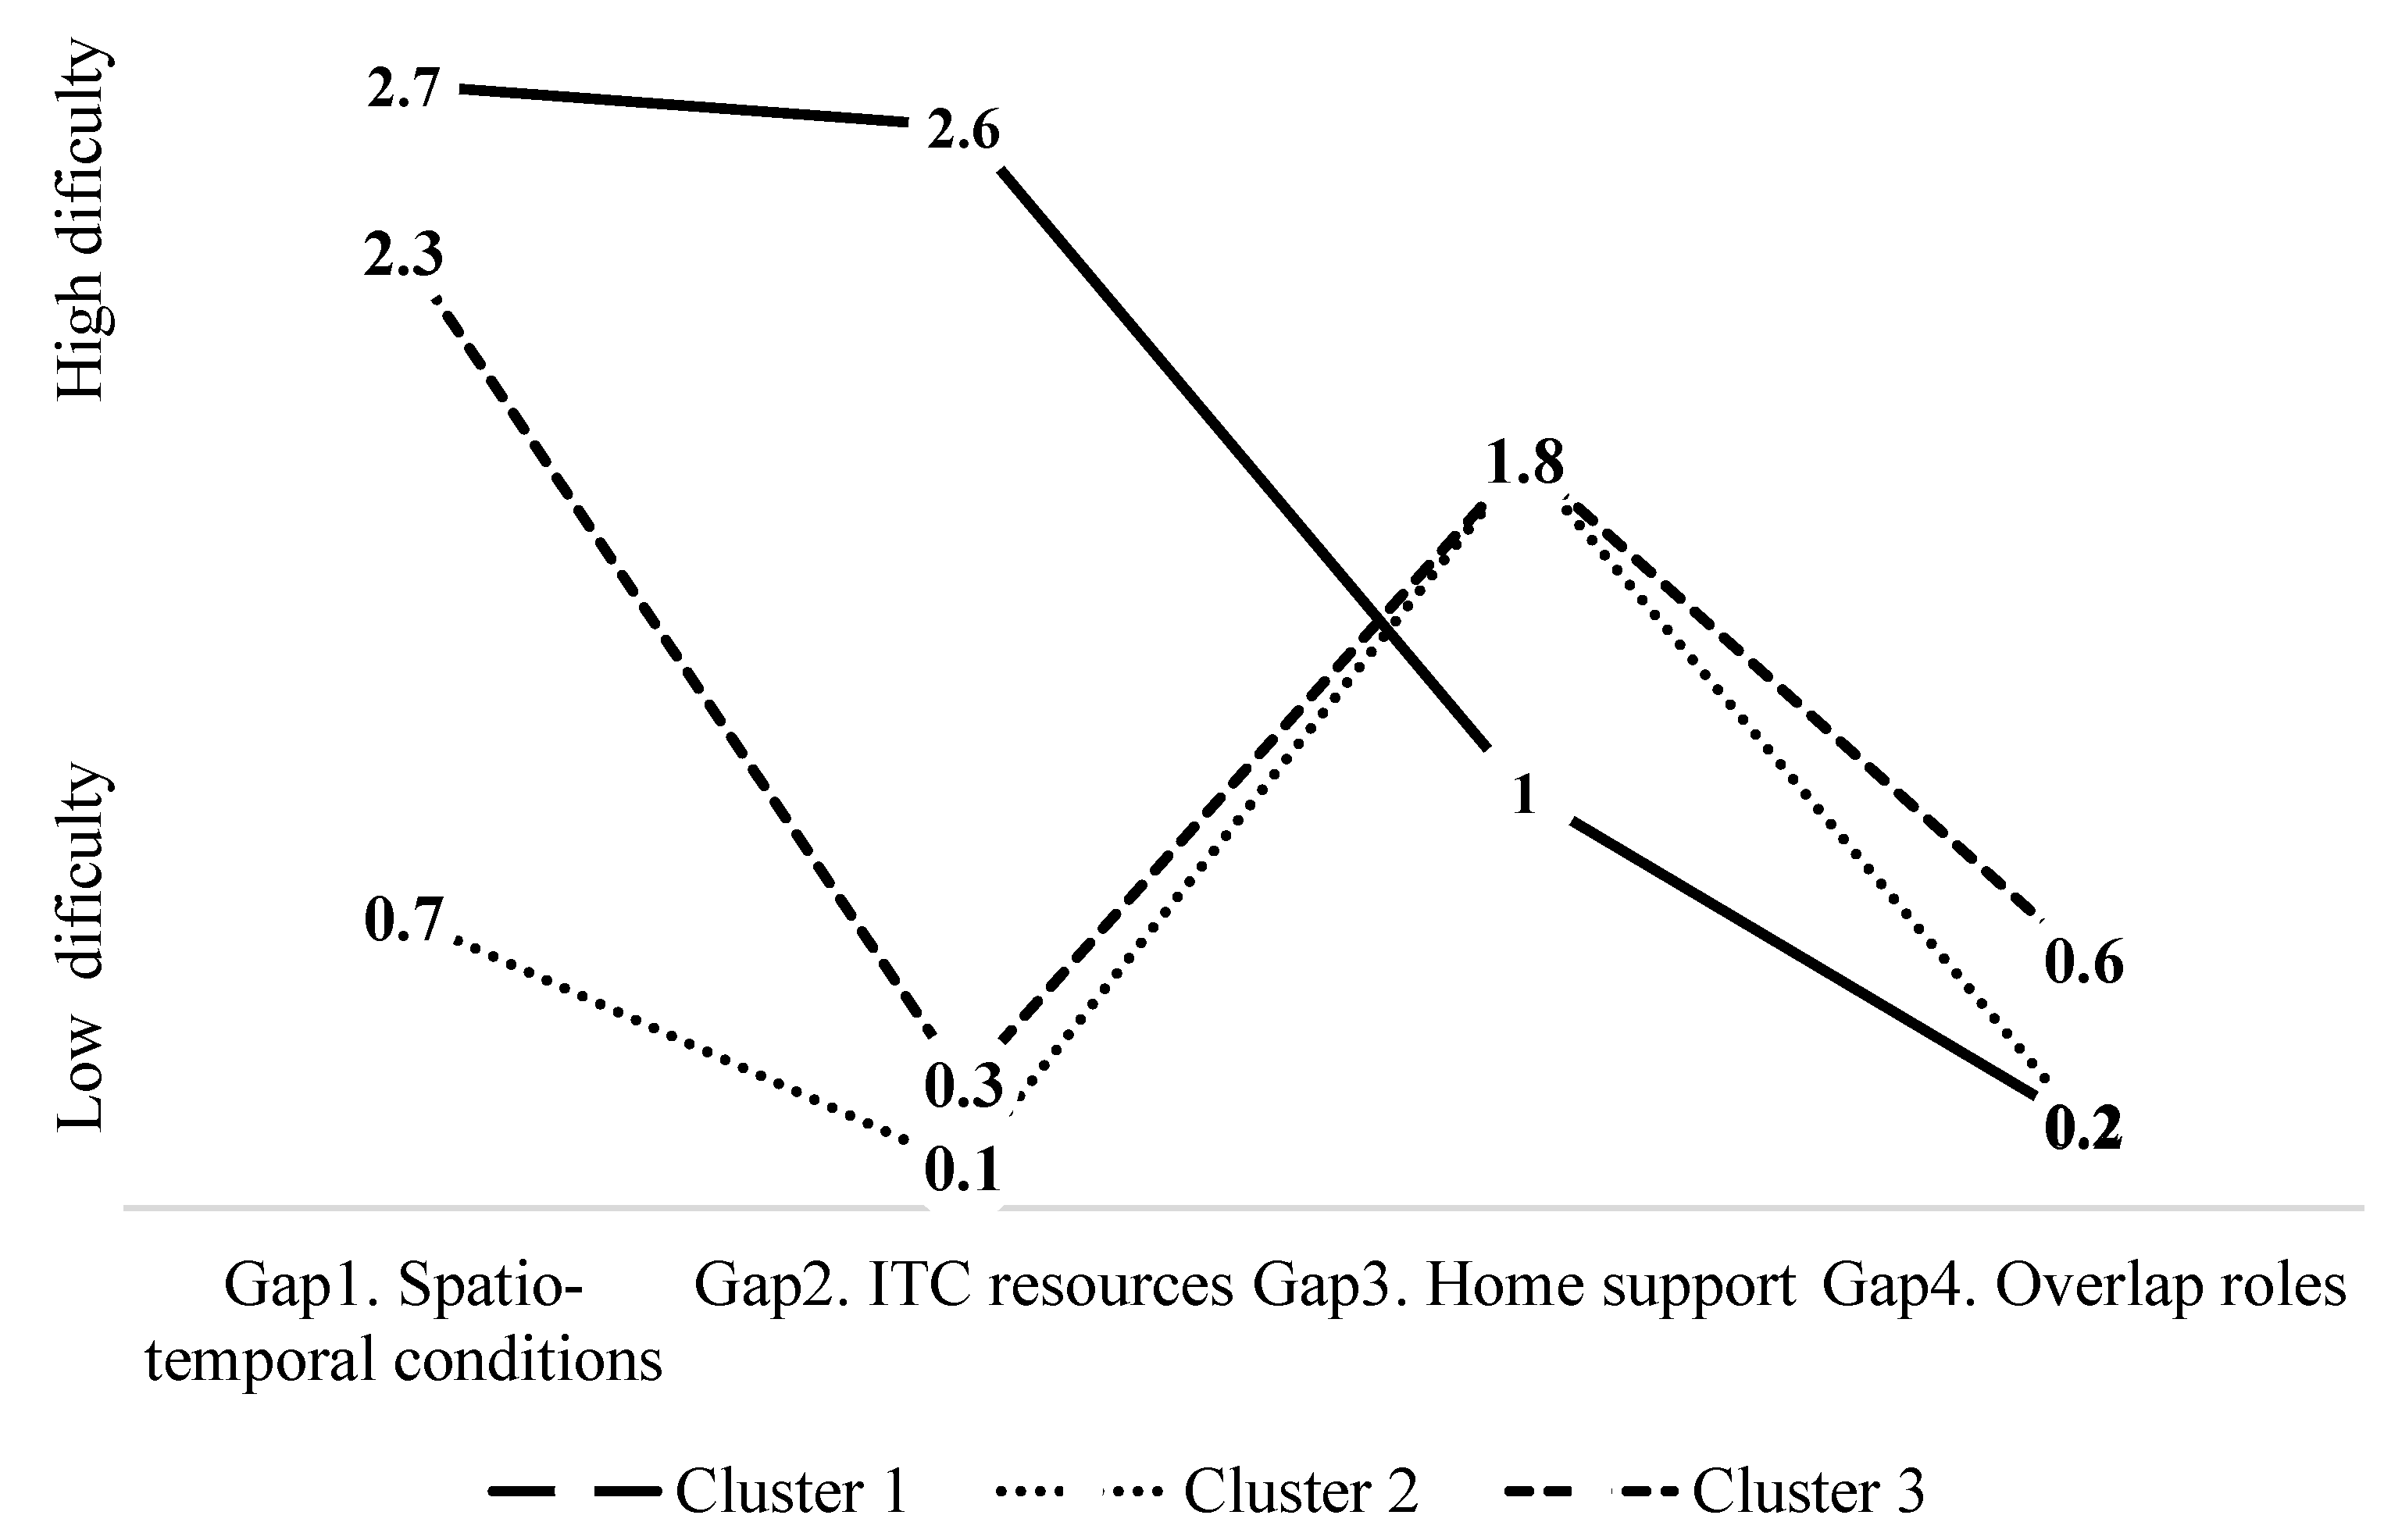
In the 3-cluster solution, the three clusters present profiles whose centroids are statistically different (ANOVA/F, p ≤ 0.0001). CL1 includes 16.4% of the cases, CL2 has 44.3% and CL3 has 39.3%. The clusters have the following traits (Figure 7):
(a) CL1 is characterized by having problems under the spatio-temporal conditions to perform SH and seriously lacking computer resources (level III for Gaps 1 and 2). Nevertheless, the conditions for home support and overlapping tasks are better (level I for the home support Gap and level 0 for the incompatibility between the teaching role and having children of school age Gap). Specifically, in the group of teachers included in CL1, 71.8% have difficulties at level III and 24.1% have difficulties at level II in Gap 1; in Gap 2, 64.1% have difficulties at level III and 32.3% have difficulties at level II. In Gap 3, 80.9% have difficulties at level I and 10% have no difficulties. In Gap 4, 81.8% have no difficulties.
(b) CL2 is characterized by inadequate spatio-temporal conditions (Gap 1), but they are better than those of CL1. They have good technological resources (Gap 2) and fewer problems with teaching and parental roles overlapping (Gap 4) than the groups on the whole as well as the outcomes in the Valencian Community. Conversely, they have more problems due to lack of home support (Gap 3). Most of the teachers in CL2 (68.4%) are at level I in Gap 1 and at level 0 in Gap 2 (90.4%) and Gap 3 (79.5%), while 58% have difficulties in Gap 3 (level II).
(c) CL3 is characterized by having few spatio-temporal difficulties (Gap 1) and fewer problems with technological resources (Gap 2). However, they face even greater difficulties than CL2 for lack of home support and also for teaching/parental roles overlapping (Gap 4). In Gap 1, only 34.3% are at level I, and the others have no such difficulties; in Gap 2, 25.8% are at level I, 0.8% are at level II and the rest have no difficulties. Gap 3 is the cluster with the greatest difficulties, with 71.2% between levels II and III, and 28% at level I. Gap 4 presents the most difficulties with 59.1%.
4.3. Cluster-Associated Variables
Now is the moment for to look at each cluster’s distinguishing characteristics according to the associated variables. Table 5 presents the details for each variable, in the total group of Valencian Community Teachers, and in each cluster, with the level of significant associations or differences.
CL1 comprises a high percentage of teachers who work in public education centers (72%) with the fewest home support difficulties (Gap 3). It presents the least teaching role/caring for children of school age overlap (Gap 4), and it reflects not having children of this age or them being older and requiring less care (Figure 2). This teachers group identified fewer difficulties and gaps for families accessing ICT (Table 5). However, this cluster was quite isolated to perform SH, its teachers are less autodidactic, and it states receiving less support to perform SH. This group has least adapted to the teaching and evaluation methodology and has the least initiatives to maintain student engagement in SH learning. The teachers in this group were those who communicated the least with a tutor when facing problems. CL1 indicates that student participation was lower in a worse learning environment and with lower performance expectations (about 25%). It is also the group that more frequently notes negative Internet use (cyberbullying), but states that this use is controllable and like what takes place during face-to-face schooling. CL1 detects the fewest difficulties for families to perform SH (resources, time, training, etc.) (Table 5). As it is not very likely that the families worked with were objectively different (no significant differences among clusters for type of education centers, or for identifying percentages of families at risk of social exclusion), this profile possibly includes teachers with less expertise/interest in facing the challenge of carrying out SH, those making few ICT adaptations to the teaching methodology, and those with no specific demands raised for families. Moreover, because they as teachers have fewer available resources and might not show much interest in ICT, they are most likely to show less judgment, interest or possibilities to identify these difficulties in families. These teachers indicate having more difficulties with their own conditions—e.g., possessing the technology to face SH—than families (Table 5).
Clusters 2 and 3 have similar implication levels to one another, but different profiles.
The teachers in CL2 are older, have more experience and more of them work in private/state-assisted centers than the teachers in CL3. This may be linked with the notion that teachers’ occupational stability in private/state-assisted education centers is greater than in public ones; moreover, teachers in the public education system who work in schools near large cities tend to do so when they are older and might work in schools covering more diverse groups. Indeed, according to a report on the Valencian Education System [36,37], the Valencian Community school map is very unbalanced: the capital city of Valencia includes a higher proportion of state-assisted education centers than the rest of the Valencian Community, and the public education centers in the capital city of Valencia tend to cover more diverse populations. This is perhaps why CL2 teachers identify more extreme family situations for available Internet connections (better for some families, but a higher percentage of having no Internet connection in others). These teachers report slightly more family gaps than those in CL1 but point out that parents have more time (Table 5). As for what teachers received to perform online teaching, the teachers in CL2 state having received more than those in CL1 and are also more autonomous. CL2 teachers indicate requiring less time and finding it less difficult to adapt their teaching to an online form (Table 5). According to the teaching strategies they adopted, they report having felt closer to “recreating face-to-face teaching” by contacting students using synchronous classes for their class group, and more frequently resorting to instant messaging with families. This is the most active and most involved teacher group that reports collaborating more with a tutor (Table 5). The Spanish Ministry of Education ordered teachers to evaluate academic year 2019/20 with what they had taught face-to-face. Therefore, the message that it transmitted to the general population, and to teachers in particular, was that what they had managed to teach during the last 3-month period of that academic year “would not be evaluated” so as to avoid those students and families with more difficulties not being disadvantaged. Based on what the teachers in the focus groups state, this meant that students felt significantly less motivation and made much less effort, especially in Secondary Education. Despite Ministry recommendations about evaluations 11, this is also the cluster that paid the most attention to and followed these recommendations. These teachers point out that student participation was similar to that during face-to-face schooling and their achievement expectations are higher than in CL1 (25–50% of what is expected during a 3-month face-to-face teaching period).
Finally, CL3 is the group with the fewest perceived difficulties. It is formed by the same percentage of teachers from public education centers as CL1, but includes the youngest teachers with the least professional experience (similar to the mean in the Valencian Community).
Their Internet access falls in line with the average of the Valencian Community, but this group indicates encountering more difficulties in families (Table 5). They present as being the most autodidactic and receiving the most support from colleagues. In turn, these teachers claim little institutional support for performing SH. They also state having to not only spend more time and encountering more difficulties to adapt their subject matters to online teaching, but also having to adapt working hours more flexibly. Regarding employed resources, their intention was not to “recreate face-to-face teaching”, but to organize themselves by employing textbooks as reference material, giving and receiving tasks by e-mail, using and/or recording tutorials to send to students, and organizing synchronous video conferences to solve doubts (Table 5). These teachers probably form the most representative and realistic group of what could actually be done. It is the second most active cluster (after CL2) in developing strategies to avoid excluding students, collaborating with the tutor and using evaluations. It reports higher student participation with a better learning climate and its achievement expectations are higher.
As for contributions from the qualitative approach, we only stress a few ideas to supplement the quantitative study (Table 6).
In general, the focus groups negatively evaluated the education administration’s response, which came late and was not very efficient. However, they positively evaluated teacher–management coordination (except in Secondary Education, with a wider variety of experiences), which stresses supportive colleagues (quotations 2 and 3).
The feelings in the focus groups are both negative and positive. Negative feelings include uncertainty, fear and, in Special Education, dissatisfaction with not being able to adequately reach out to families. Positive feelings include feeling satisfied with having adapted and offering a positive response under such difficult conditions (quotation 8); the way of reinforcing students and families feeling accompanied is also stressed, especially in Early Childhood, Primary and Special Education (quotation 10).
Undoubtedly, the described data have led us to pose more questions than answers, but we obtained some very interesting elements. One variable that was expected to have a strong impact was teachers’ age. Significant differences among clusters are found, but their means for age and years’ experience are similar, despite being traditional differentiating variables. It would be most interesting to study other variables in relation to quality of life and the professional career profile linked with their contracts 12. Teachers in the Spanish public education system can work in two situations: temporary contracts or civil servants. The former often change center and location each academic year. Civil servants also spend several years changing centers until they obtain a fixed post that they are satisfied with. Because this aspect—the conditions the working environment in centers, collaboration with colleagues, support networks, etc.—was not included in our survey, we are unaware of this situation. There is interest in innovation and permanent training, as well as the teachers integrating culture/education into their lives with ICT. This is probably one of the first research lines about continuing with subsequent studies, along with an analysis of families’ gender/role, family type and professional development variables.
Moreover, aspects related to initial teacher training (usually for face-to-face teaching), centers’ organizational element and teaching development [36,37] can explain the reactions like those set out by CL1 (16.4% of the sample). Therefore, this is another research line that these results indicate.
5. Discussion
We have worked this presentation by following the objectives set out in this article.
The teachers’ sample, which answered the survey by considering all the gap indicators, is very homogeneous. By means of the Gini coefficient, we find that they present very few overall inequalities. This fact is representative of teachers’ reality in Spain. The public teaching system has an equal-pay-for-all system with incentives for seniority, innovation or management. Teachers from state-assisted education centers are paid a similar, albeit slightly lower, salary than those working in public/private ones. This means that they all belong to the socio-economic middle class, but they normally have higher cultural levels/levels of education than other professionals at the same economic level in other business or industrial sectors.
Through the k-means cluster analysis, the compound indicators allowed us to identify three clearly distinguishing teacher profiles of their situation to carry out SH during confinement. The study has been able to describe each of the profiles belonging to the cluster typology in terms of the composite indicators and their association with demographic and other external variables.
CL1 (16.4% of the cases) is the sample with the most problems. In particular, it has the worst spatio-temporal conditions, as well as serious problems caused by lack of ICT resources. However, it perceives fewer difficulties in support for maintaining homes and fewer cases of occupational tasks overlapping attending to children of school age. CL2 (44.3% of the teachers) finds itself in the best situation of all three groups. Its spatio-temporal conditions are somewhat insufficient, and it requires more support for maintaining homes, but has good ICT resources and presents the best situation for family and working lives. CL3, which contains 39.3% of those surveyed, is the second group with more spatio-temporal difficulties, has the most work-family conciliation problems, and considerably lacks support for maintaining homes, although its available ICT resources are acceptable.
Therefore, even though all the surveyed teachers are identified as “middle class”, their family contexts include diverse characteristics, which have been associated with the way they carry out their education work from home. CL2 is in the best situation, followed by CL3, while CL1 is in the worst situation for carrying out SH.
Which variables associated with these profiles stand out? No differences appear among the clusters for teachers’ gender or the level of education they teach. One variable that could be expected to have a strong impact is age.
For students’ families, no differences are observed among the teachers’ clusters for NSEC, level of social exclusion or willingness to collaborate. All the teachers’ groups made attempts to bear in mind any problems with connection, understanding and motivation that both families and students had.
Finally, the focus group identified the positive and negative feelings of teachers about SH. Moreover, the teachers in the focus groups negatively evaluated the education administration’s response (which came late and was not very efficient) and in general, they positively evaluated teacher–management coordination.
6. Conclusions
The study carried out has made it possible to achieve the objectives set.
To identify the most appropriate solution for the number of household profiles, the usual criteria were used together with the Elbow Method-Inertia (EMI), which helped us to identify the classification more efficiently.
The profiles of teachers are described as belonging to the clusters in terms of the composite indicators and their association with demographic and external variables. In addition, we analyzed the inequality profiles in the family, socio-labor and pedagogical conditions of teachers and their relationship with their performance in SH. Three clusters of teachers are described with the four gaps. Technological resources and skills were very important and the situation showed the need to strengthen the ITC competences of teachers and, above all, of the education system as a whole [11,36] but the situation for family and working lives and the support for maintaining homes were also determining factors in the perception of the situation.
The focus groups confirmed the loneliness that had been experienced by many teachers, and it also showed the number of feelings, positive and negative, they had about the situation. Along the same lines, other studies have also shown this ambivalence in perceptions, albeit from a more sociological perspective [12].
To end these reflections, we identify some considerations about the study limitations and future research lines that could be derived from it.
Our overall study report [10] (pp. 176–177) indicates some questions that have been reaffirmed by the present study and others that we have previously performed [16,17], and briefly refer to them in the specific reflections that derive from the present work.
First, one of the most relevant conclusions we reached with this study is the excessive totality of the NSEC indicator as an independent, and almost permanent, variable in differential studies about education. Without scoring its value, this indicator very much concentrates on economic elements, and does not reflect on the complexity of the diversity of the so-called “middle classes”. Therefore, it does not allow their socio-economic conditions to be analyzed with their children’s schooling process according to the NSEC level. It is necessary to investigate new compound indicators by taking the concept that we used to define gaps, which were analyzed according to their reliability and validity to suitably represent situations that represent families’ diverse structure, style and quality of life.
The analysis of the teachers’ responses reveals the importance of studying the development of the teaching profession in Spain. The present study does not venture into specific matters such as contract types (civil servants, substitute posts, permanent contracts, etc.), years of experience at the school the teachers presently work at, or governance [36,37,38]. Nonetheless, they are key matters to help us to understand the teaching team’s level of coordination or colleagues’ support when facing an extreme situation like SH.
SH has been an opportunity to look in-depth at understanding not only social structures and needs, but also educational responses. To make the most of this and look at the possible future, and how to anticipate it, we must know to what extent we can bring it forward [39]. We cannot keep responding to social needs when they are evident and have definitely affected part of the population negatively.
The education policy cannot be conceived without taking a systemic and holistic approach. It is necessary to coordinate government decisions about economic, social and environmental, etc., policies along with educational ones. Social cohesion as the basis for personal development and social transformation requires us taking this approach together. We need to be particularly careful with generating inequalities that can form precisely from not dealing with social development on the whole, which must balance and distribute well-being as fairly as possible.
All this evidences the need for new research approaches to evaluate education with a view to deal with these questions globally in order to better understand how processes work. In this way, we will be able to design strategies to revitalize the family–school synergy in children’s educational–school development and, consequently, in social transformation from education.
Author Contributions
All authors have made an equal contribution to the research. All authors have read and agreed to the published version of the manuscript.
Funding
This research received no external funding.
Institutional Review Board Statement
The study was anonymous and conducted in accordance with the Ethical norms.
Informed Consent Statement
Informed consent was obtained from all subjects involved in the study.
Data Availability Statement
Not applicable.
Acknowledgments
We are grateful to colleagues of: (a) the Teachers’ Union Federació d’Ensenyament de Comissions Obreres-País Valenciá (FE-CCOO-PV); (b) Union of Valencian Teaching Cooperatives (UCEV); (c) European Forum of Education Administrators (FEAE-Spain); (d) Students of the Pedagogy, Social Education, Teaching and Speech Therapy degrees, and of the Psychopedagogy, Special Needs Education, Policy, Management and Direction of Educational Organizations, and Educational So-cial Action masters degrees, all of the University of Valencia; (e) Teachers from Florida Universitaria and the Catholic University of Valencia; (f) Confederation of parents’ associations of Castilla y León (CONFAPACAL) and teachers of early childhood, basic and secondary and university education, who collaborated individually in the dissemination of the survey. Our thanks to all of them.
Conflicts of Interest
The authors declare no conflict of interest.
| 1 | Evaluation and Measurement Group: Education for Social Cohesion, included in the Register of Research Groups of the University of Valencia (GIUV2016-290), Spain. |
| 2 | In Spain, ECE is organized in two cycles (0–3 and 3–6 years) and is not compulsory, although there is a great demand, given the ever-growing participation of women in the world of work. BE (6 grades) and CSE (4 grades) are compulsory. |
| 3 | The surveys were carried out without external funding, nor the collaboration of the Valencian, or Spanish governments. However, we did have the support, to disseminate the surveys, from: (a) the teachers' union Federació d'Ensenyament de Comissions Obreres-País Valenciá (FE-CCOO-PV); (b) Union of Valencian Teaching Cooperatives (UCEV); (c) European Forum of Education Administrators (FEAE-Spain), (d) Students of the Pedagogy, Social Education, Teaching and Speech Therapy degrees, and of the Psychopedagogy, Special Needs a Education, Policy, Management and Direction of Educational Organizations, and Educational Social Action masters degrees, all of the University of Valencia; (e) Teachers from Florida Universitaria and the Catholic University of Valencia; (f) Confederation of parents’ associations of Castilla y León (CONFAPACAL) and teachers of early childhood, basic and secondary and university education, who collaborated individually in the dissemination of the survey. Our thanks to all of them. |
| 4 | In the Spanish educational system, Baccalaureate and Professional Training (Formative Cycles) are part of what we can call upper secondary education and are not compulsory. These groups were not included in our study, given that, due to their age (minimum for the first year between 16 and 18 years old), their dependence on their families is less than in the cases of compulsory education. |
| 5 | In the population, the strata distribution is: Type (Public: 66.22%; Subsidized/Private: 33.78%) and Level of Education (ECE: 25.59%; BE: 44.68%; CSE: 29.73%). Nor was it possible to establish representativeness in relation to the proportional distribution for provinces in the Valencian Community. |
| 6 | The Spanish education system contains three types of centers, depending on funding: (a) public (state funding); (b) subsidized (mixed funding: private schools supported by state funding), (c) private (private funding). In this study we grouped types (b) and (c) because they tend to have different socio-economic conditions than public schools and the number of completely private centers is very small in the Valencian Community (around 2%). |
| 7 | The focus groups held were structured around the questions that are presented in Table 3. |
| 8 | The phases that this study was done in are found in Table 4. |
| 9 | Throughout the text, we have left the abbreviations of indicators exactly as they were published in Spanish in Jornet-Meliá et al. (2020). |
| 10 | This does not include “having children of school age” because this was considered independently as Gap 4. |
| 11 | The Spanish Ministry of Education ordered teachers to evaluate academic year 2019/20 basically with what they had taught face-to-face. Therefore, the message that it transmitted to the general population, and to teachers in particular, was that what they had managed to teach during the last 3-month period of that academic year “would not be evaluated” so as to avoid those students and families with more difficulties not being disadvantaged. Based on what the teachers in the focus groups state, this meant students that felt significantly less motivation and made much less effort, especially in Secondary Education. |
| 12 | Teachers in the Spanish public education system can work in two situations: temporary contracts or civil servants. The former often change center and location each academic year. Civil servants also spend several years changing centers until they obtain a fixed post that they are satisfied with. As this aspect, which conditions the working environment in centers, collaboration with colleagues, support networks, etc., was not included in our survey, we are unaware of this situation. |
References
- Jornet-Meliá, J.M.; Sancho-Alvarez, C.; Bakieva-Karimova, M. Analysis of Profiles of Family Educational Situations During COVID-19 Lockdown in the Valencian Community (Spain). Societies 2023, accepted, in press. [Google Scholar] [CrossRef]
- Entwisle, D.R.; Alexander, K.L.; Olson, L.S. Children, Schools, and Inequality; Westview Press: Boulder, CO, USA, 1997. [Google Scholar]
- Alexander, K.L.; Entwisle, D.R.; Olson, L.S. Schools, achievement, and inequality: A seasonal perspective. Educ. Eval. Policy Anal. 2001, 23, 171–191. [Google Scholar] [CrossRef] [Green Version]
- Martínez Rizo, F. ¿Puede la escuela reducir las desigualdades del rendimiento? Páginas Educ. 2009, 2, 7–27. [Google Scholar] [CrossRef]
- Martínez-Rizo, F. Contextos vulnerables: Las aportaciones de la evaluación. Bordón 2012, 64, 41–50. [Google Scholar]
- Martínez-Rizo, F. La escuela, ¿gran igualadora o mecanismo de reproducción? La desigualdad social y educativa más de 50 años después de Coleman. Rev. Latinoam. Estud. Educ. 2019, 49, 253–284. [Google Scholar] [CrossRef]
- Council of Europe. Concerted Development of Social Cohesion Indicators. Methodological Guide; Council of Europe: Strasbourg, France, 2005; Available online: http://www.coe.int/t/dg3/socialpolicies/socialcohesiondev/source/GUIDE_en.pdf (accessed on 13 November 2022).
- CEPAL. Un Sistema de Indicadores Para el Seguimiento de la Cohesión Social en América Latina; CEPAL-EUROsocial: Santiago, Chile, 2007; Available online: http://hdl.handle.net/11362/2862 (accessed on 17 November 2021).
- Jornet-Meliá, J.M. Dimensiones docentes y Cohesión Social. Rev. Iberoam. Evaluación Educ. 2012, 5, 349–362. [Google Scholar]
- Jornet-Meliá, J.M.; González-Such, J.; Perales-Montolio, M.J.; Sánchez-Delgado, P.; Bakieva, M.; Sancho-Álvarez, C.; Ortega-Gaite, S. Informe Técnico: La Escuela en Casa. Resumen Ejecutivo; Ediciones Palmero: Valencia, Spain, 2020; Available online: https://www.uv.es/gem/CoVid-19.wiki (accessed on 13 November 2022).
- Hernández-Ortega, J.; Álvarez-Herrero, J.-F. Gestión educativa del confinamiento por COVID-19: Percepción del docente en España. Rev. Esp. Educ. Comp. 2021, 38, 129–150. [Google Scholar] [CrossRef]
- Beltrán, J.; Venegas, M. Educar en época de confinamiento: La tarea de renovar un mundo común. Rev. Sociol. Educ.-RASE 2020, 13, 92–104. [Google Scholar] [CrossRef]
- Tejedor, S.; Cervi, L.; Tusa, F.; Parola, A. Educación en tiempos de pandemia: Reflexiones de alumnos y profesores sobre la enseñanza virtual universitaria en España, Italia y Ecuador. Rev. Lat. Comun. Soc. 2020, 78, 1–21. [Google Scholar] [CrossRef]
- Fernández-Rodrigo, L. Alumnado que no sigue las actividades educativas: El caso de una escuela de alta complejidad durante el confinamiento por COVID-19. Soc. Infanc. 2020, 4, 195–288. [Google Scholar] [CrossRef]
- Hortigüela-Alcalá, D.; Pérez-Pueyo, Á.; López-Aguado, M.; Manso-Ayuso, J.; Fernández-Río, J. Familias y Docentes: Garantes del aprendizaje durante el confinamiento. Rev. Int. Educ. Justicia Soc. 2020, 9, 353–370. [Google Scholar] [CrossRef]
- González-Such, J.; Perales Montolío, M.J.; Ortega-Gaite, S.; Sánchez-Delgado, P. Ecologías de aprendizaje digital de los docentes: La Escuela en casa durante la COVID-19 en la Comunidad Valenciana. Rev. Publ. 2021, 51, 165–190. [Google Scholar] [CrossRef]
- Sánchez-Delgado, P.; Bakieva-Karimova, M.; Sancho-Álvarez, C.; Jornet-Meliá, J.M. Estudio diferencial del rol familiar en la educación a distancia en confinamiento debido al COVID-19. REDIE 2022, 24, 1–18. [Google Scholar] [CrossRef]
- Creswell, J.W.; Plano Clark, V.L. Designing and Conducting Mixed Methods Research, 2nd ed.; Sage: Thousand Oaks, CA, USA, 2017. [Google Scholar]
- Sánchez-Gómez, M.C.; Martín-Cilleros, M.V. Implementation of focus group in health research. In Computer Supported Qualitative Research; Studies in Systems, Decision and Control; Costa, A., Reis, L., de Sousa, F.N., Moreira, A., Lamas, D., Eds.; Springer: Cham, Switzerland, 2017; Volume 71, pp. 49–62. [Google Scholar] [CrossRef]
- Bazeley, P. Integrating Analysis in Mixed Methods Research; SAGE Publications Ltd.: London, UK, 2018. [Google Scholar]
- Sánchez-Gómez, M.C.; Rodrigues, A.I.; Costa, A.P. From qualitative methods to mixed models: Current trend in social science research. RISTI-Rev. Ibér. Sist. Tecnol. Inf. 2018, 28, 9–12. [Google Scholar] [CrossRef]
- MEFP EDUCAbase. Enseñanzas no Universitarias. Estadística del Profesorado y Otro Personal. Curso 2019–2020. Resultados Detallados. Available online: https://www.educacionyfp.gob.es2021 (accessed on 17 November 2021).
- Ceriani, L.; Verme, P. The origins of the Gini index: Extracts from Variabilità e Mutabilità (1912) by Corrado Gini. J. Econ. Inequal. 2012, 10, 421–443. [Google Scholar] [CrossRef]
- Goodman, L.A. Snowball Sampling. Ann. Math. Stat. 1961, 32, 148–170. [Google Scholar] [CrossRef]
- Sánchez-Santamaría, J.; González Such, J.; Perales-Montolío, M.J. Orientaciones. Grupos de Discusión; Internal MAVACO Project Document; Universitat de València: Valencia, Spain, 2021. [Google Scholar]
- González Such, J.; Sánchez Delgado, P.; Sancho, C. Técnicas Evaluativas 2. In Investigación Evaluativa. Una Perspectiva Basada en la Complementariedad Metodológica (Cuantitativa-Cualitativa); Jornet, J.M., González Such, J., Perales, M.J., Eds.; CREA: Lima, Peru, 2013; pp. 112–126. [Google Scholar]
- Perales-Montolío, M.J.; Sánchez-Santamaría, J.; González-Such, J. El uso de grupos focales en el proyecto MAVACO. Consideraciones metodológicas y operativas. In La Evaluación de Sistemas Educativos. ¿Qué Informaciones Interesan a los Colectivos Implicados? Jornet, J.M., García García, M., González Such, J., Eds.; PUV: Valencia, Spain, 2012; pp. 47–58. [Google Scholar]
- Syakur, M.A.; Khotimah, B.K.; Rochman, E.M.S.; Satoto, B.D. Integration K-Means Clustering Method and Elbow Method for identification of the best customer profile cluster. IOP Conf. Ser.: Mater. Sci. Eng. 2018, 336, 012017. [Google Scholar] [CrossRef] [Green Version]
- Bozdogan, H. Model selection and Akaike’s information criterion (AIC): The general theory and its analytical extensions. Psychometrika 1987, 52, 345–370. [Google Scholar] [CrossRef]
- Kodinariya, T.M.; Makwana, P.R. Review on determining number of cluster in k-means clustering. Int. J. 2013, 1, 90–95. [Google Scholar] [CrossRef]
- Miles, M.; Huberman, A.M. Qualitative Data Analysis. A Source Book of New Methods; Sage: Beverly Hills, CA, USA, 1984. [Google Scholar]
- Miles, M.; Huberman, A.M. Data Management and Analysis Methods. Handbook of Qualitative Research; Denzin, N.K., Lincoln, Y.S., Eds.; Sage: Beverly Hills, CA, USA, 1994. [Google Scholar]
- Rodríguez Sabiote, C.; Lorenzo Quiles, O.; Herrera Torres, L. Teoría y práctica del análisis de datos cualitativos. Proceso general y criterios de calidad. Rev. Int. Cienc. Soc. Humanid. 2005, 15, 133–154. [Google Scholar]
- Stake, R.E. Qualitative Research: Studying How Things Work; The Guilford Press: New York, NY, USA, 2010. [Google Scholar]
- Tesch, R. Qualitative Research: Analysis Types and Software Tools; The Falmer Press: New York, NY, USA, 1990. [Google Scholar] [CrossRef]
- García Martín, J.; García Martín, S. Uso de herramientas digitales para la docencia en España durante la pandemia COVID-19. Rev. Española Educ. Comp. 2021, 38, 151–173. [Google Scholar] [CrossRef]
- INEE Informe TALIS. Estudio Internacional de la Enseñanza y el Aprendizaje. Informe Español. Volumen I Ministerio de Educación y Formación Profesional de España: Secretaría Técnica. 2018. Available online: https://sede.educacion.gob.es/publiventa/descarga.action?f_codigo_agc=19872 (accessed on 17 November 2021).
- INEE Informe TALIS. Estudio Internacional de la Enseñanza y el Aprendizaje. Informe español. Volumen II. Ministerio de Educación y Formación Profesional de España: Secretaría Técnica. 2018. Available online: https://sede.educacion.gob.es/publiventa/descarga.action?f_codigo_agc=21168 (accessed on 17 November 2021).
- Jornet-Meliá, J.M. Reflexiones sobre el futuro de la educación en España. In Proceedings of the VII Conferência Ibérica de Inovação na Educação comTecnologias da Informação e Comunicação, Madrid, Spain, 18–19 February 2021. [Google Scholar]
Figure 1.
Basic characteristics of the teachers surveyed in the Valencian Community (Spain).

Figure 2.
Teachers. Graphs of decision criteria of efficient cluster solution and centroid profiles, percentage of gaps in 3-group analysis.
Figure 2.
Teachers. Graphs of decision criteria of efficient cluster solution and centroid profiles, percentage of gaps in 3-group analysis.

Figure 3.
Percentage distribution of gap 1 in the 3-group cluster solution compared to the total of the VC.
Figure 3.
Percentage distribution of gap 1 in the 3-group cluster solution compared to the total of the VC.

Figure 4.
Percentage distribution of gap 2 in the 3-group cluster solution compared to the total of the VC.
Figure 4.
Percentage distribution of gap 2 in the 3-group cluster solution compared to the total of the VC.

Figure 5.
Percentage distribution of gap 3 in the 3-group cluster solution compared to the total of the VC.
Figure 5.
Percentage distribution of gap 3 in the 3-group cluster solution compared to the total of the VC.

Figure 6.
Percentage distribution of gap 4 in the 3-group cluster solution compared to the total of the VC.
Figure 6.
Percentage distribution of gap 4 in the 3-group cluster solution compared to the total of the VC.

Figure 7.
Gaps profiles for 3 groups per K-means cluster.


Table 1.
School at Home (SH) survey content sections.
| Sections | Description |
|---|---|
| Participant profile | Location, type of school, professional position, department, sex, age, professional experience, perception of family social status. |
| Home conditions for online work | Home conditions for online education, technological resources used during confinement, digital pre-training, previous experience in technological resources, digital support received. |
| Technological adaptation and digital uses at home | Criteria and adaptation of teaching methods, teacher coordination, difficulties in adapting subjects, time spent teaching online, routines and schedules performed in online work. |
| Student’s school performance during confinement | Criteria and techniques for monitoring academic performance, resources to prevent early school leaving, level of student participation, perception of the level of achievement, perception of coexistence in the virtual classroom group, learning climate. |
| Difficulties and proposals | Problems, overall satisfaction and post-pandemic online proposals. |
| Emotions and personal sensations | Self-report of frequent emotions in online school during confinement and aspects that are affected. |
Table 2.
Synthesis of questions that guided the development of the focus groups carried out with teachers.
Table 2.
Synthesis of questions that guided the development of the focus groups carried out with teachers.
| Script of Focus Groups with Teachers |
|---|
| What conditions did they have at home? and in schools? Who helped you to carry out the SH? Did they carry out their work in a coordinated way with their schools? What teaching methodologies were they able to use? What conditions did you observe in the families? How did it affect performance, motivation, socialization, learning climate...? Do you think it would be convenient to include online activities when face to face schooling recommences? Why? |
Table 3.
Phases of study development: School at Home.
| Phase | Activities |
|---|---|
| I | Definition of study goals. |
| II | Documentation: (a) similar studies and (b) studies on school absence and its impact on learning. |
| III | Survey design: (a) first draft (GemEduco); (b) logical review of overall content and item formulation (reviewers: teachers and families); (c) pilot test (groups of teachers and families, e-mail contact); (d) second draft for online application; (e) pilot test in online format; (f) revision: final design of survey for online application (GemEduco). |
| IV | Data collection: (a) contacting people and organizations supporting the dissemination of the survey; (b) dissemination through social networks. |
| V | Quantitative data analysis: (a) database debugging and, (b) statistical analysis. |
| VI | Technical report: executive summary of the School at Home study. Dissemination through social and academic networks. |
Table 4.
Compound Indicators of Gaps about School at Home (SH).
| Teachers Indicators | Interpretation Scale |
|---|---|
| GAP-1 BRECET: spatial-temporal conditions at home for online teaching (ICD1 = Σ[p20.1R, p20.5R, p20.63) | Null (=0); Level 1 (=1) Level 2 (=2); Level 3 (=3) |
| GAP-2 BRECTECH: technological conditions for teaching from home (ICD2 = Σ[p20.2R, p20.3R, p20.4R) | Null (=0); Level 1 (=1) Level 2 (=2); Level 3 (=3) |
| GAP-3 BRECAH: home support conditions (ICD3 = Σ[p20.7R, p20.9, p20.10, p20.11) | Null (=0); Level 1 (=1) Level 2 (=2); Level 3 (=3) |
| GAP-4 BRECSTTEEC: overlap of online work and online teaching (ICD4 = Σ[p20.8]) | Null (=0) Single level (=1) |
| GAP-5 NQUINDESIGUAL: global inequality indicator (ICD6 = quintiles of Σ[BRECET, BRECTECH, BRECAH, BRECSTTEEC]) | Level 1 Min. inequality (quintiles bottom 20%); Level 2; Level 3; Level 4; Level 5 Max. inequality (quintiles top 20%) |
Table 5.
Teacher perceptions of the SH functioning in the VC and its association with clusters.
| Obstacles Observed by the Teachers in the Families to Carry out the SH * | Cluster | Total | Sig. | ||
|---|---|---|---|---|---|
| 1 | 2 | 3 | |||
| They do not have an internet connection | 10.5% | 23.6% | 22.3% | 20.9% | 0.000 |
| The internet connection they have is inadequate | 18.7% | 38.7% | 40.2% | 36.0% | 0.000 |
| Families do not have adequate computers or tablets | 26.5% | 53.6% | 55.8% | 50.0% | 0.000 |
| They can only connect via mobile phone | 21.9% | 40.1% | 46.3% | 39.5% | 0.000 |
| They do not have mobile phones for their children to connect to study | 1.4% | 4.8% | 6.5% | 4.9% | 0.013 |
| Parents lack knowledge about technology and students do not have the necessary support to use it | 16.4% | 43.5% | 44.6% | 39.5% | 0.000 |
| Parents do not have sufficient academic training to help them with content questions | 19.6% | 41.7% | 40.8% | 37.7% | 0.000 |
| Parents do not have time to be with their children. | 19.2% | 40.4% | 51.6% | 41.3% | 0.000 |
| Parents have not been motivating their children to continue with tasks in a normal way | 11.4% | 21.2% | 21.0% | 19.5% | 0.004 |
| Parents have not been willing to have contact with teachers to support them in what they should do at home | 7.8% | 10.0% | 12.4% | 10.6% | 0.147 |
| Support received by teachers to carry out the SH * | Cluster | Total | Sig. | ||
| 1 | 2 | 3 | |||
| I have not needed support and I have been able to do it autonomously | 13.6% | 33.6% | 27.5% | 27.9% | 0.000 |
| The administration or the institution where I work | 8.6% | 26.6% | 18.4% | 20.4% | 0.000 |
| Support from a publisher | 7.3% | 13.5% | 11.0% | 11.5% | 0.042 |
| Colleagues who have more training | 23.2% | 51.3% | 50.4% | 46.3% | 0.000 |
| I have been self-taught (I have used tutorials, for example, from YouTube or other platforms...) | 23.2% | 54.1% | 63.6% | 52.8% | 0.000 |
| No one has supported me and I did not know how to do it online (I have sent tasks by email and they have been returned to me to correct) | 6.4% | 6.1% | 7.4% | 6.6% | 0.666 |
| I have not been able to teach online because the situation of the families or the students does not allow it | 0.9% | 2.9% | 3.4% | 2.8% | 0.160 |
| Adaptation of teaching to carry out SH ** | Cluster | Total | Sig. | ||
| 1 | 2 | 3 | |||
| To what extent have teachers coordinated to design teaching online? (1, not at all; 2, a little; 3, a lot, 4, a lot) | 2.63 | 2.70 | 2.80 | 2.74 | 0.133 |
| How easy has it been for you to adapt the subject for teaching online? (1, very difficult–5, very easy) | 2.62 | 2.88 | 2.61 | 2.74 | 0.000 |
| How long did it take you to design, deliver and monitor teaching online? (1, less time; 2, the same time; 3, more time than my usual working day) | 2.70 | 2.71 | 2.85 | 2.77 | 0.000 |
| During lockdown, has an online class schedule been maintained, just as in face-to-face teaching? (1 = No, not at all; up to 5 = Yes, with the same duration of classes) | 2.19 | 2.26 | 1.94 | 2.12 | 0.000 |
| Methodology used for teaching in the SH * | Cluster | Total | Sig. | ||
| 1 | 2 | 3 | |||
| I have used textbooks and I have outlined the tasks. | 19.1% | 42.3% | 46.6% | 40.2% | 0.000 |
| I have held video conferences in real time with the class group to give explanations. | 19.5% | 42.9% | 35.2% | 36.1% | 0.000 |
| I have held video conference question and answer sessions in real time. | 12.3% | 33.8% | 34.3% | 30.5% | 0.000 |
| I have answered emails to clarify individual doubts. | 40.5% | 81.3% | 84.5% | 75.9% | 0.000 |
| I have used question and answer Forums | 7.3% | 18.5% | 18.6% | 16.7% | 0.000 |
| I have used instant messaging (WhatsApp, Telegram. etc.) | 17.7% | 47.0% | 41.9% | 40.2% | 0.000 |
| I have used YouTube tutorials to support teaching | 17.3% | 38.4% | 44.9% | 37.5% | 0.000 |
| I have recorded video tutorials for families | 7.3% | 18.5% | 18.4% | 16.6% | 0.000 |
| I have recorded video tutorials for students | 15.5% | 38.6% | 41.1% | 35.8% | 0.000 |
| Strategies used by teachers to keep students involved in learning in SH * | Cluster | Total | Sig. | ||
| 1 | 2 | 3 | |||
| Contact the student, through his/her family, to speak with him/her (phone call, WhatsApp...) to see what their difficulties are | 23.7% | 55.7% | 55.6% | 50.4% | 0.000 |
| Contact the family (phone call, WhatsApp...) to see what their difficulties are | 28.8% | 64.0% | 63.4% | 58.0% | 0.000 |
| In the case of connection problems (internet connection, lack of computer), look for alternatives to facilitate the continuity of learning | 15.5% | 43.1% | 43.3% | 38.6% | 0.000 |
| In the case of motivational problems, establish a personalized plan and reinforce the response | 13.7% | 39.9% | 40.8% | 35.9% | 0.000 |
| In the case of comprehension problems, personally carry out individual adaptations | 13.2% | 39.2% | 44.4% | 37.0% | 0.000 |
| In the case of comprehension problems, my center has auxiliary classrooms and therapeutic pedagogy attention online | 3.7% | 10.7% | 9.1% | 8.9% | 0.008 |
| In any case, inform the tutor so that they can deal with the case | 8.7% | 26.9% | 30.7% | 25.4% | 0.000 |
| Evaluation criteria, techniques and resources used in the SH * | Cluster | Total | Sig. | ||
| 1 | 2 | 3 | |||
| Practically the same as in face-to-face teaching | 6.8% | 9% | 7% | 7.9% | 0.402 |
| Analyze the tasks they perform | 26.0% | 63.3% | 67.4% | 58.8% | 0.000 |
| Oral tests over the internet | 5.9% | 9.5% | 9.1% | 8.8% | 0.264 |
| Written tests (open questions) online | 6.8% | 16.3% | 15.9% | 14.6% | 0.002 |
| E-Portfolios | 3.7% | 10.3% | 7.6% | 8.2% | 0.007 |
| Consider their available technology resources | 11.9% | 39.0% | 37.6% | 34.0% | 0.000 |
| Analyze the effort they make | 24.7% | 72.6% | 76.7% | 66.4% | 0.000 |
| Take into account if they lack family support | 14.6% | 41.9% | 42.3% | 37.6% | 0.000 |
| Consider the information provided by the family | 14.6% | 43.2% | 42.7% | 38.3% | 0.000 |
| Considering the diversity of students’ situations in terms of ICT resources at home, almost none of the criteria and evaluation techniques have been applied | 7.3% | 9.3% | 13.3% | 10.6% | 0.000 |
| Participation. SH learning climate and academic achievement compared to classroom teaching ** | Cluster | Total | Sig. | ||
| 1 | 2 | 3 | |||
| What level of participation have students had compared to face-to-face? (1 = Lower; 2 = Same; 3 = Higher) | 1.45 | 1.55 | 1.47 | 1.51 | 0.098 |
| Has the SH detected any negative use by students that affects the coexistence of your class group (eg deterioration of coexistence, cyberbullying, etc.)? (1 = No, no cases; up to 5 = Many new cases) | 1.69 | 1.30 | 1.32 | 1.35 | 0.000 |
| How do you rate the learning climate that has been created in the SH compared to the one that occurs in your class groups in face-to-face teaching? (1 = Much worse; 2 = Worse; 3 = Same; 4 = Better; 5 = Much better) | 2.27 | 2.48 | 2.39 | 2.42 | 0.076 |
| What percentage of learning do you think will have been achieved in this trimester compared to previous years, due to the difficulties caused by the pandemic? (1 = Less than 5%; 2 = 5–25%; 3 = 25–50%; 4 = 50–75%; 5 = More than 75%; 6 = Almost 100%) | 3.11 | 3.34 | 3.24 | 3.28 | 0.040 |
| Would you use online activities when you return to face-to-face teaching? * | Cluster | Total | Sig. | ||
| 1 | 2 | 3 | |||
| Do you consider it beneficial to include any teaching activity online? (Filter for the following questions) | 93.6% | 90.3% | 89.3% | 90.5% | 0.192 |
| Yes, for the training of students | 22.9% | 42.7% | 49.0% | 41.8% | 0.000 |
| Yes, for more direct participation with families | 16.1% | 30.6% | 28.6% | 27.4% | 0.000 |
| Yes, for the better integration of ICT in educational and cultural use | 25.9% | 73.3% | 65.5% | 62.2% | 0.000 |
Note: Used analyses: * Chi-square; ** H Kruskal–Wallis. * Questions with a dichotomous scale (Yes, No). The percentages of those who have marked “yes” are presented.
Table 6.
Focus Group Quotes Teachers.
| Quote 1. |
|---|
| “When we went into lockdown, I found that my computer, which I have not used for 7 years, had no batteries, no mouse, I was using my finger because I only use it for the evaluations and to enter the marks. I usually work at school and if I bring work I bring it on paper, then I found that I didn’t even have a battery for the computer and I didn’t even know how to do it.” (GF2P3. Elementary) |
| Quote 2. |
| “A lot of group therapy that allowed us to meet many colleagues and that also allowed us to see the weaknesses that we had at that moment and how we could resolve them in future circumstances.” (GF4P5. Special needs education). |
| Quote 3. |
| “We were a bit lost, and coordination was not wonderful, but many teachers had not worked like that so I can speak of lack of coordination, but even so I would not have liked to be in the shoes of the management team because it was crazy what it supposed because it was very difficult to coordinate, I think.” (GF3P8. High school). |
| Quote 4. |
| “Each teacher at home with mobile phones recorded themselves in a corner of the house” (GF1P5. Kindergarten). |
| Quote 5. |
| “We already had these activities before because we had the platform active and I think there are many teachers who have maintained the activities online and who have increased the amount of tasks they do through the platform.” (GF3P3. High school). |
| Quote 6. |
| “Then I started podcasting the syllabus because I was at MIT and then I did a kind of podcast radio show, and I was uploading it to the classroom with explanations and exercises on that to see the feedback from the students.” (GF3P7. High school). |
| Quote 7. |
| “There was a lot of debate about what other ways of evaluating there were for assignments or rubrics, for example, myself, in physics and chemistry, instead of setting them a task of solving I asked them to presented me with a problem to solve for them, that way the kid did a different exam.” (GF3P4. High school). |
| Quote 8. |
| “Although I have collaborated with them, on what they have asked of me, I can say to my colleagues that it was frustrating from the point of view of not being able to contribute or not being able to reach families with those actions that we normally do at school.” GF4P3. Special Needs Education) |
| Quote 9. |
| “It was very positive, but it is true that we had the feeling that the emotional load of the meetings was so great that it was really difficult to pose it as something purely informative, that is, we saw it more as professional accompaniment, which, also for some of the kids was very positive, programs that nothing is to ask how we are, how we are, how we have done the activities, are we liking them or not, but not an approach that we are going to give a class.” (GF2P4. Elementary) |
| Quote 10. |
| “This has affected performance, the administration did not help us in that regard, since that message that was given by raising their hand (passing automatically) was demotivating.” (GF3P4. High school). |
Disclaimer/Publisher’s Note: The statements, opinions and data contained in all publications are solely those of the individual author(s) and contributor(s) and not of MDPI and/or the editor(s). MDPI and/or the editor(s) disclaim responsibility for any injury to people or property resulting from any ideas, methods, instructions or products referred to in the content. |
© 2023 by the authors. Licensee MDPI, Basel, Switzerland. This article is an open access article distributed under the terms and conditions of the Creative Commons Attribution (CC BY) license (https://creativecommons.org/licenses/by/4.0/).
Share and Cite
MDPI and ACS Style
Perales-Montolio, M.J.; Ortega-Gaite, S.; González-Such, J.; Sánchez-Delgado, P. Typology of Teaching Actions during COVID-19 Lockdown in the Valencian Community (Spain). Societies 2023, 13, 26. https://doi.org/10.3390/soc13020026
AMA Style
Perales-Montolio MJ, Ortega-Gaite S, González-Such J, Sánchez-Delgado P. Typology of Teaching Actions during COVID-19 Lockdown in the Valencian Community (Spain). Societies. 2023; 13(2):26. https://doi.org/10.3390/soc13020026
Chicago/Turabian StylePerales-Montolio, María Jesús, Sonia Ortega-Gaite, José González-Such, and Purificación Sánchez-Delgado. 2023. "Typology of Teaching Actions during COVID-19 Lockdown in the Valencian Community (Spain)" Societies 13, no. 2: 26. https://doi.org/10.3390/soc13020026
Note that from the first issue of 2016, this journal uses article numbers instead of page numbers. See further details here.