Ground-based Measurements of Atmospheric Trace Gases in Beijing during the Olympic Games


State Key Laboratory of Remote Sensing Sciences, Faculty of Geographical Science, Beijing Normal University, Beijing 100875, China
Sci 2019, 1(1), 23; https://doi.org/10.3390/sci1010023
Submission received: 25 November 2018
/
Accepted: 4 December 2018
/
Published: 15 April 2019
Abstract
:A portable Fourier Transform Spectrometer (B3M-IR) is built and used to measure atmospheric trace gases in the city of Beijing during Olympic Games in 2008. A short description of the instrument is first provided in this paper. A detailed spectral analysis is then presented. The total columns of ozone (O3), carbon monoxide (CO), methane (CH4) and nitrous oxide (N2O) are retrieved from the ground-based solar absorption spectra recorded by the B3M-IR during the Olympic Games. Lacking validation data, only the retrieved total column of O3 is compared with that retrieved by MAX-DOAS, which is deployed at the same station. The mean difference between the two methods of measurement is 6.5%, demonstrating the performance and reliability of B3M-IR.
1. Introduction
Since the industrialization of the last two centuries, manmade trace gases have increasingly influenced atmospheric composition and produced great impacts on the atmospheric environment and global climate change. An example of these impacts is the ozone depletion in the Antarctic region [1], which has driven scientists worldwide to conduct extensive studies to understand the composition of our atmosphere. Measuring the sources and sinks of the trace gases as well as their spatial and temporal variation are very helpful in achieving this goal. Different kinds of instruments and methods have been developed for trace gas measurements since then. There exist several satellite products of atmospheric columns of various trace gases [2,3]. Aside from these space-borne remote sensing sensors, the ground-based Fourier Transfer Spectrometers (FTS) can provide long-term data of trace gases, which can also be used to validate the algorithms and products of the satellites. Thus, it is an indispensable method for atmospheric trace gas monitoring. A global network, Network for the Detection of Atmospheric Composition and Change (NDACC) (www.ndacc.org), was founded with an aim of providing long-term high quality stratospheric parameters [4]. The data acquired from NDACC stations have been widely used in atmospheric change detection, atmospheric chemistry model validation and satellite products validation [5,6].
Unfortunately, only scattered work has been carried out to acquire the total column of limited trace gases from ground-based spectrometers in China [7,8]. Information on the vertical distribution of trace gases comes primarily from the products of limited satellites. The drawback of these products of satellites is that the satellite repeat cycle takes a considerable amount of time and cannot satisfy the monitoring requirements. To determine the air quality of Beijing during the 2008 summer Olympic Games, the Chinese Academy of Sciences constructed an air quality monitoring station on the top floor of the main building of the Institute of Remote Sensing Applications. Its geographical position is (40.00° N, 116.37° N) and it is adjacent to the main buildings of the Olympic Games. Three kinds of instruments are deployed in the station. They are as follows: (1) in situ traditional chemistry sampling instruments for the measurements of near surface trace gases; (2) MAX-DOAS [8] for the total column measurements of trace gases; and (3) ground-based FTS for the vertical profile measurements of trace gases. In this work, the first atmospheric trace gases measurements using our ground-based B3M-IR FTS in Beijing during the Olympic Games are reported.
2. Atmospheric Trace Gas Measurements
2.1. Data Acquisition
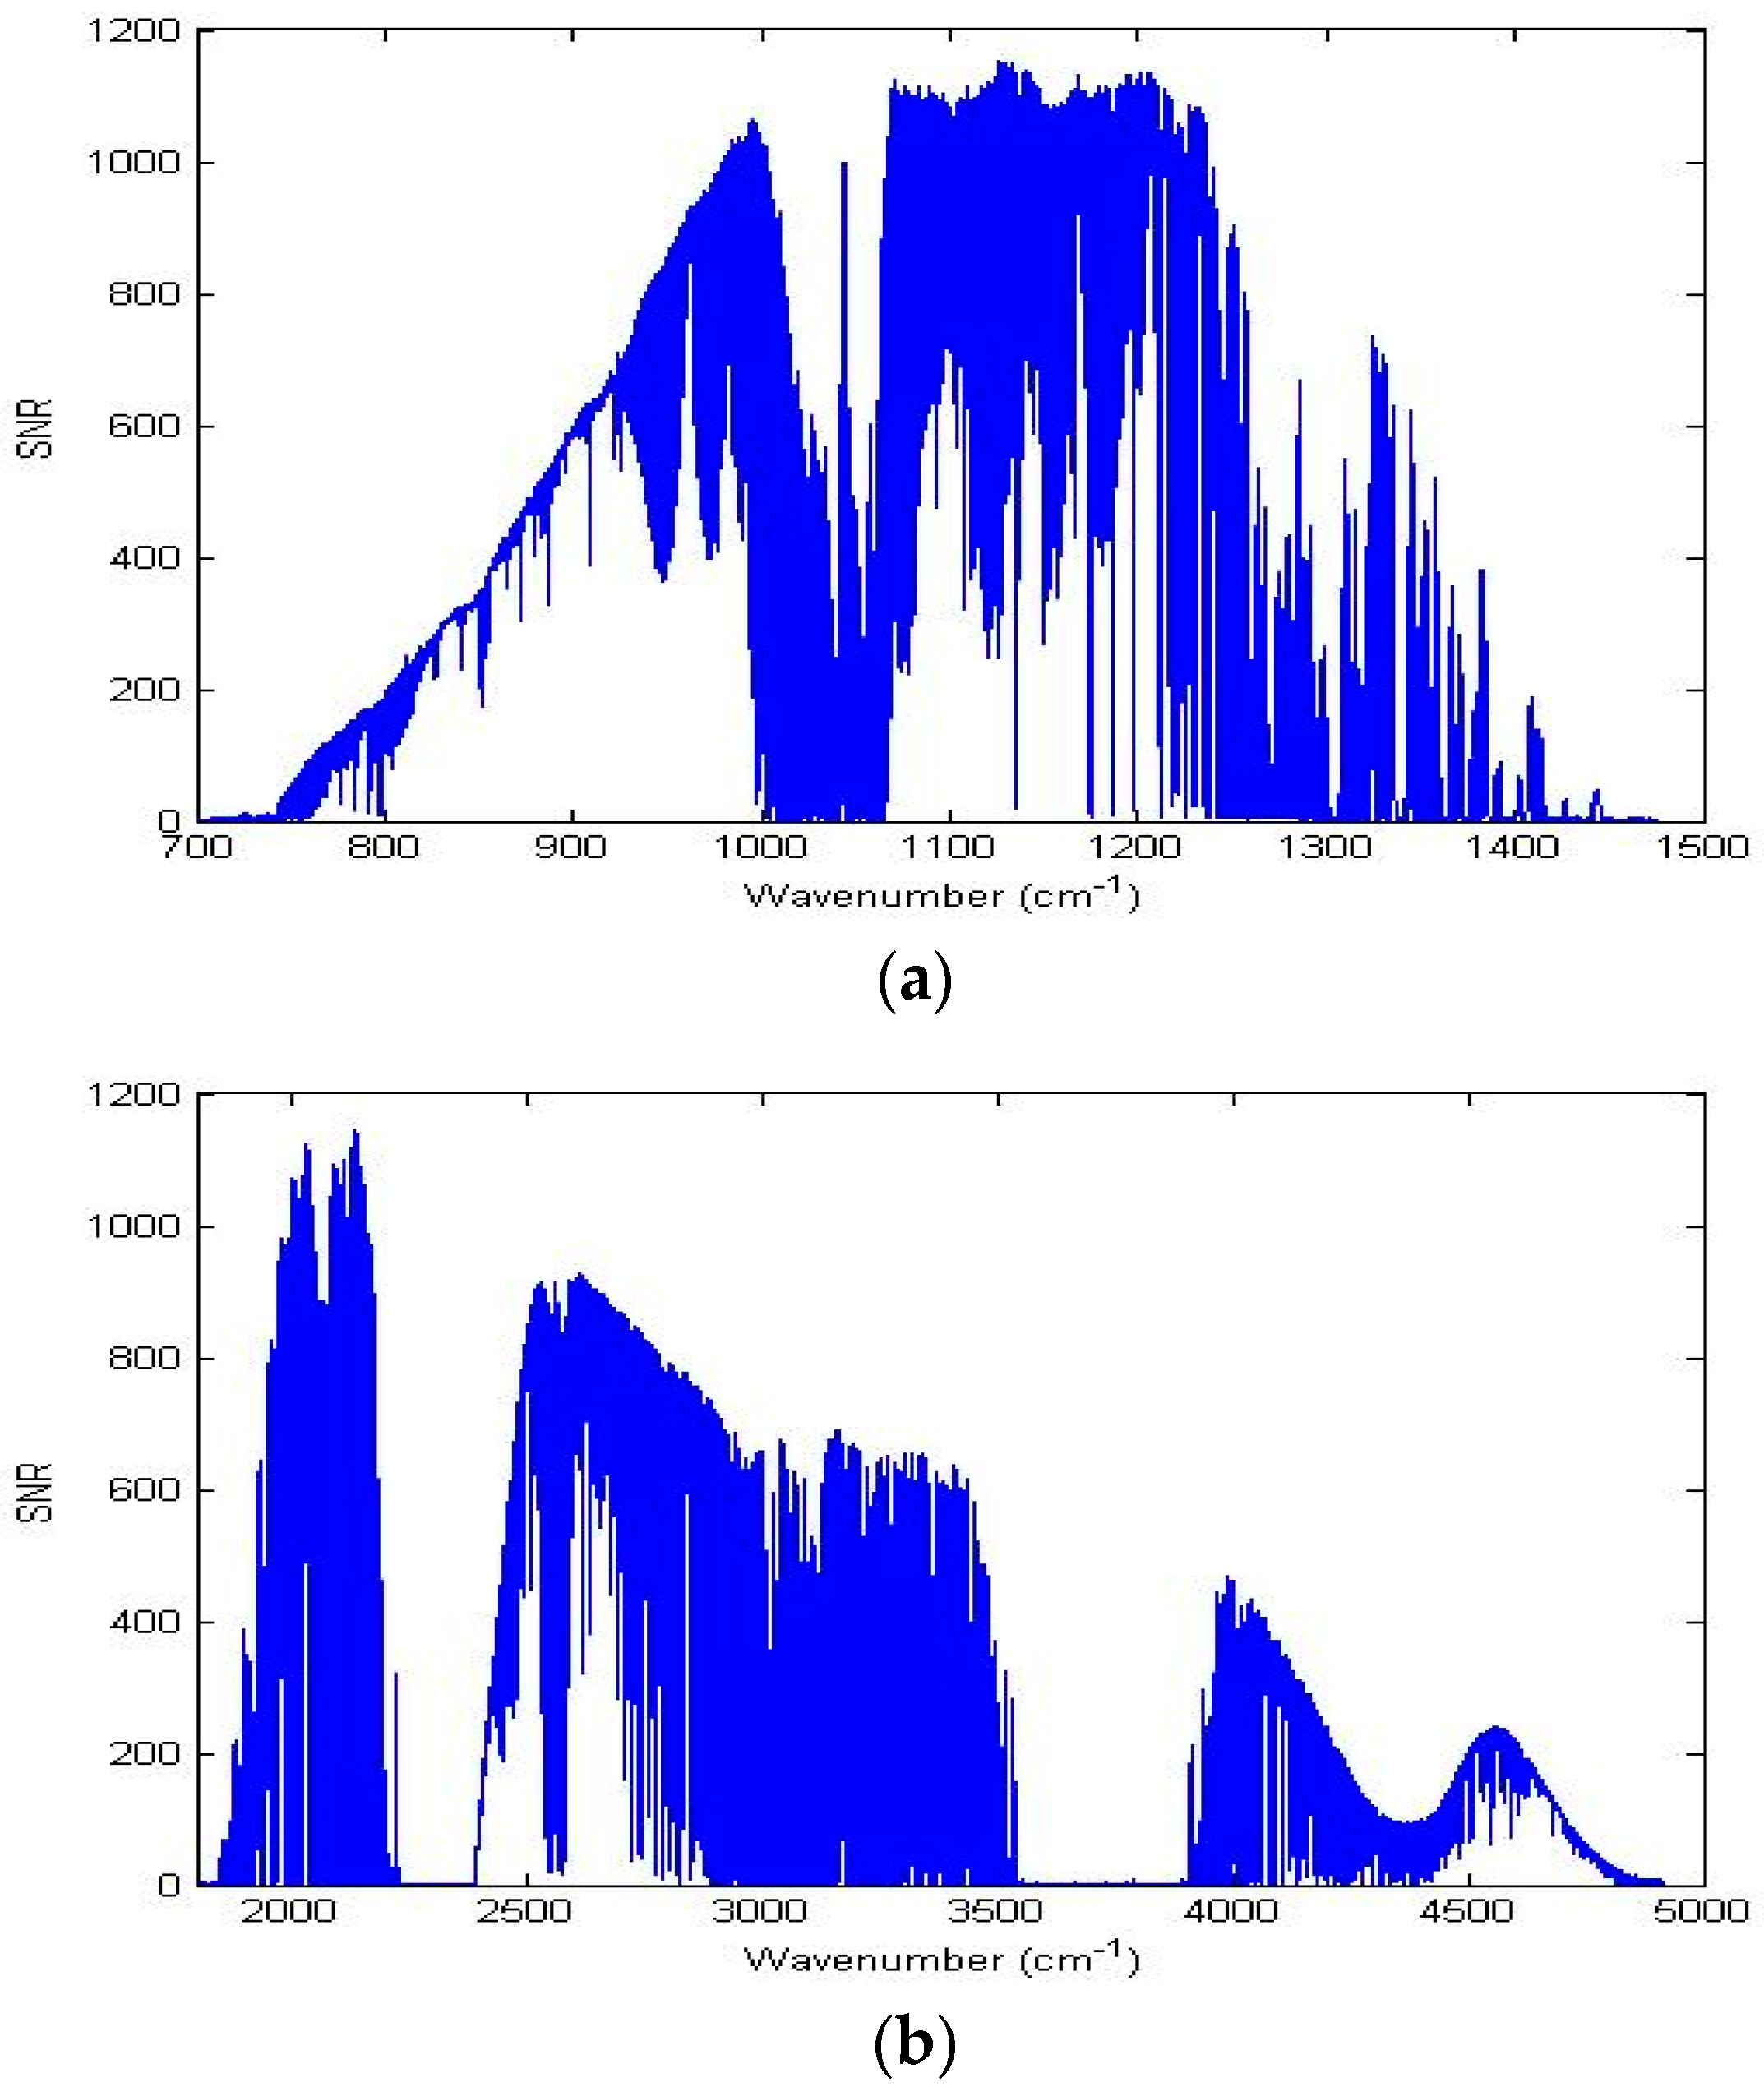
The FTS used to acquire the solar absorption spectra is named as B3M-IR, which is developed by Beijing Vision Sky Aerospace Technology Co., Ltd. in cooperation with Canada’s ABB Bomem Inc. The sun tracker used to lock to the center of the sun is developed by the Beijing Vision Sky Aerospace Technology Co., Ltd. The maximum optical path difference (OPD) of the B3M-IR is 25.2 cm, which provides a maximized apodized spectral resolution of 0.02 cm−1. The B3M-IR is equipped with two photovoltaic detectors, an indium antimonide (InSb) and a mercury cadmium telluride (MCT) detector. Together they cover the spectral range of 750–4100 cm−1. The instrumental line shape (ILS) is a critical index used to characterize the performance of an FTS and has an important influence on the accuracy of trace gases retrieval. The ILS of B3M-IR is determined by measuring the transmission spectra of a 1000 K blackbody through a low-pressure gas cell full of CO and by retrieving the phase error and modulation efficiency of the B3M-IR from CO absorption features with the software LINEFIT [9]. The results of B3M-IR ILS measurements are presented in Figure 1. Another important factor that influences the accuracy of trace gas retrieval is the instrumental signal-to-nose ratio (SNR). As shown in Figure 2, B3M-IR can achieve an SNR better than 100 in the microwindows usually used for trace gases retrieval. Using our data acquisition system, we obtained the clear sky solar absorption spectraduring the Olympic Games. The observation was started on July 22th, 2008 and ended on September 5th, 2008.
2.2. Data Analysis
2.2.1. A Priori and Auxiliary Quantities
The relationship between the measured solar absorption spectrum and the state of atmospheric trace gas is nonlinear and the physical radiative transfer process is very complicated. After linearization, the measurement vector and the retrieval state vector are connected via a forward matrix operator, which maps the retrieval state vector into the measurement vector. However, this forward matrix is a rank defect matrix and zero space always appears in the solution. Thus, a priori is needed to constrain the solution. The a priori volume mixing ratio (VMR) profiles of target gases and the interferences are derived from the combination of the Halogen Occultation Experiment (HALOE) V1.9 data between 2000 and 2005 [3], the Atmospheric Infrared Sounder (AIRS) Level 2 supplemental products between 2005 and 2007 (http://mirador.gsfc.nasa.gov/), the Michelson Interferometer for Passive Atmospheric Sounding (MIPAS) reference profile (www.atm.ox.ac.uk/group/mipas/species), and the Toronto Atmospheric Observatory (TAO) a priori [11].
The nearest grid point of National Centers for Environmental Prediction (NCEP) reanalysis data is about 200 km from our station, and NCEP pressure and temperature (PT) profiles in Beijing can only reach about 35 km. Thus, the PT profiles of AIRS Level 2 supplemental products are adopted (http://mirador.gsfc.nasa.gov/), which covers the surface to 75 km. Above this, the built-in mid-latitude Summer atmosphere in the radiative transfer code Modtran 4.0 [12] is used.
2.2.2. Spectroscopic Parameters and Microwindow Selection
Spectroscopic parameters from the 2004 HITRAN compilation [13] are used to calculate absorption features with a voigt line shape in SFIT2. Trace gas retrievals are usually carried out in small microwindows that contain the spectral absorption features of the target gas as well as the absorption features of interferences. The selection of the spectral range of each microwindow is based on previous work [14] and the characteristics of our FTS. The selected microwindows are listed in Table 1.
2.2.3. Retrieval Method
Generally, trace gas vertical profile retrieval from a ground-based solar absorption spectrum is an under-determined (ill-posed) problem. Analytical solution does not exist. The trace gas vertical profile is derived from the measured spectra by iteratively adjusting the concentration of the target gas and interferences in the selected microwindows until the differences between the simulated and measured spectra are minimized. There are many algorithms that can accomplish this task [15,16]. The Rodgers Optimal Estimation method (OEM) is widely employed in the field of trace gas vertical profile retrieval from ground-based solar absorption spectroscopy [15,17,18]. The OEM is semi-empirically implemented in the SFIT2 algorithm, which is the successor of SFIT and was jointly developed by the NASA-Langley Research Center and the National Institute of Water and Atmospheric Research at Lauder, New Zealand [19,20]. Intercomparison studies show that SFIT2 is a robust algorithm [21]. Thus, the SFIT2 algorithm is adopted in this study.
A ray tracing program FSCATM [22,23] is used in SFIT2 to calculate a model atmosphere using pressure, temperature and a priori VMR profiles. The FSCATM program also calculates air mass factors for each layer. Together with the High Resolution Transmission Molecular Absorption (HITRAN) 2004 spectral database [13] and the instrumental parameters which include a wavenumber scale multiplier, spectral resolution, field of view (FOV) and ILS, the model atmosphere is used to simulate observed spectra with the forward model in the trace gas VMR profile retrieval. The used forward model in SFIT2 is a multi-layer, multi-species, line-by-line (LBL) radiative transfer model originally developed by the NASA Langley Research Center. In the iterative process, trace gases VMR is iteratively adjusted and output after the maximum iterative number is completed or the cost function is minimized. Several data files used for post-error analysis are also output.
2.2.4. Retrieval Characterization
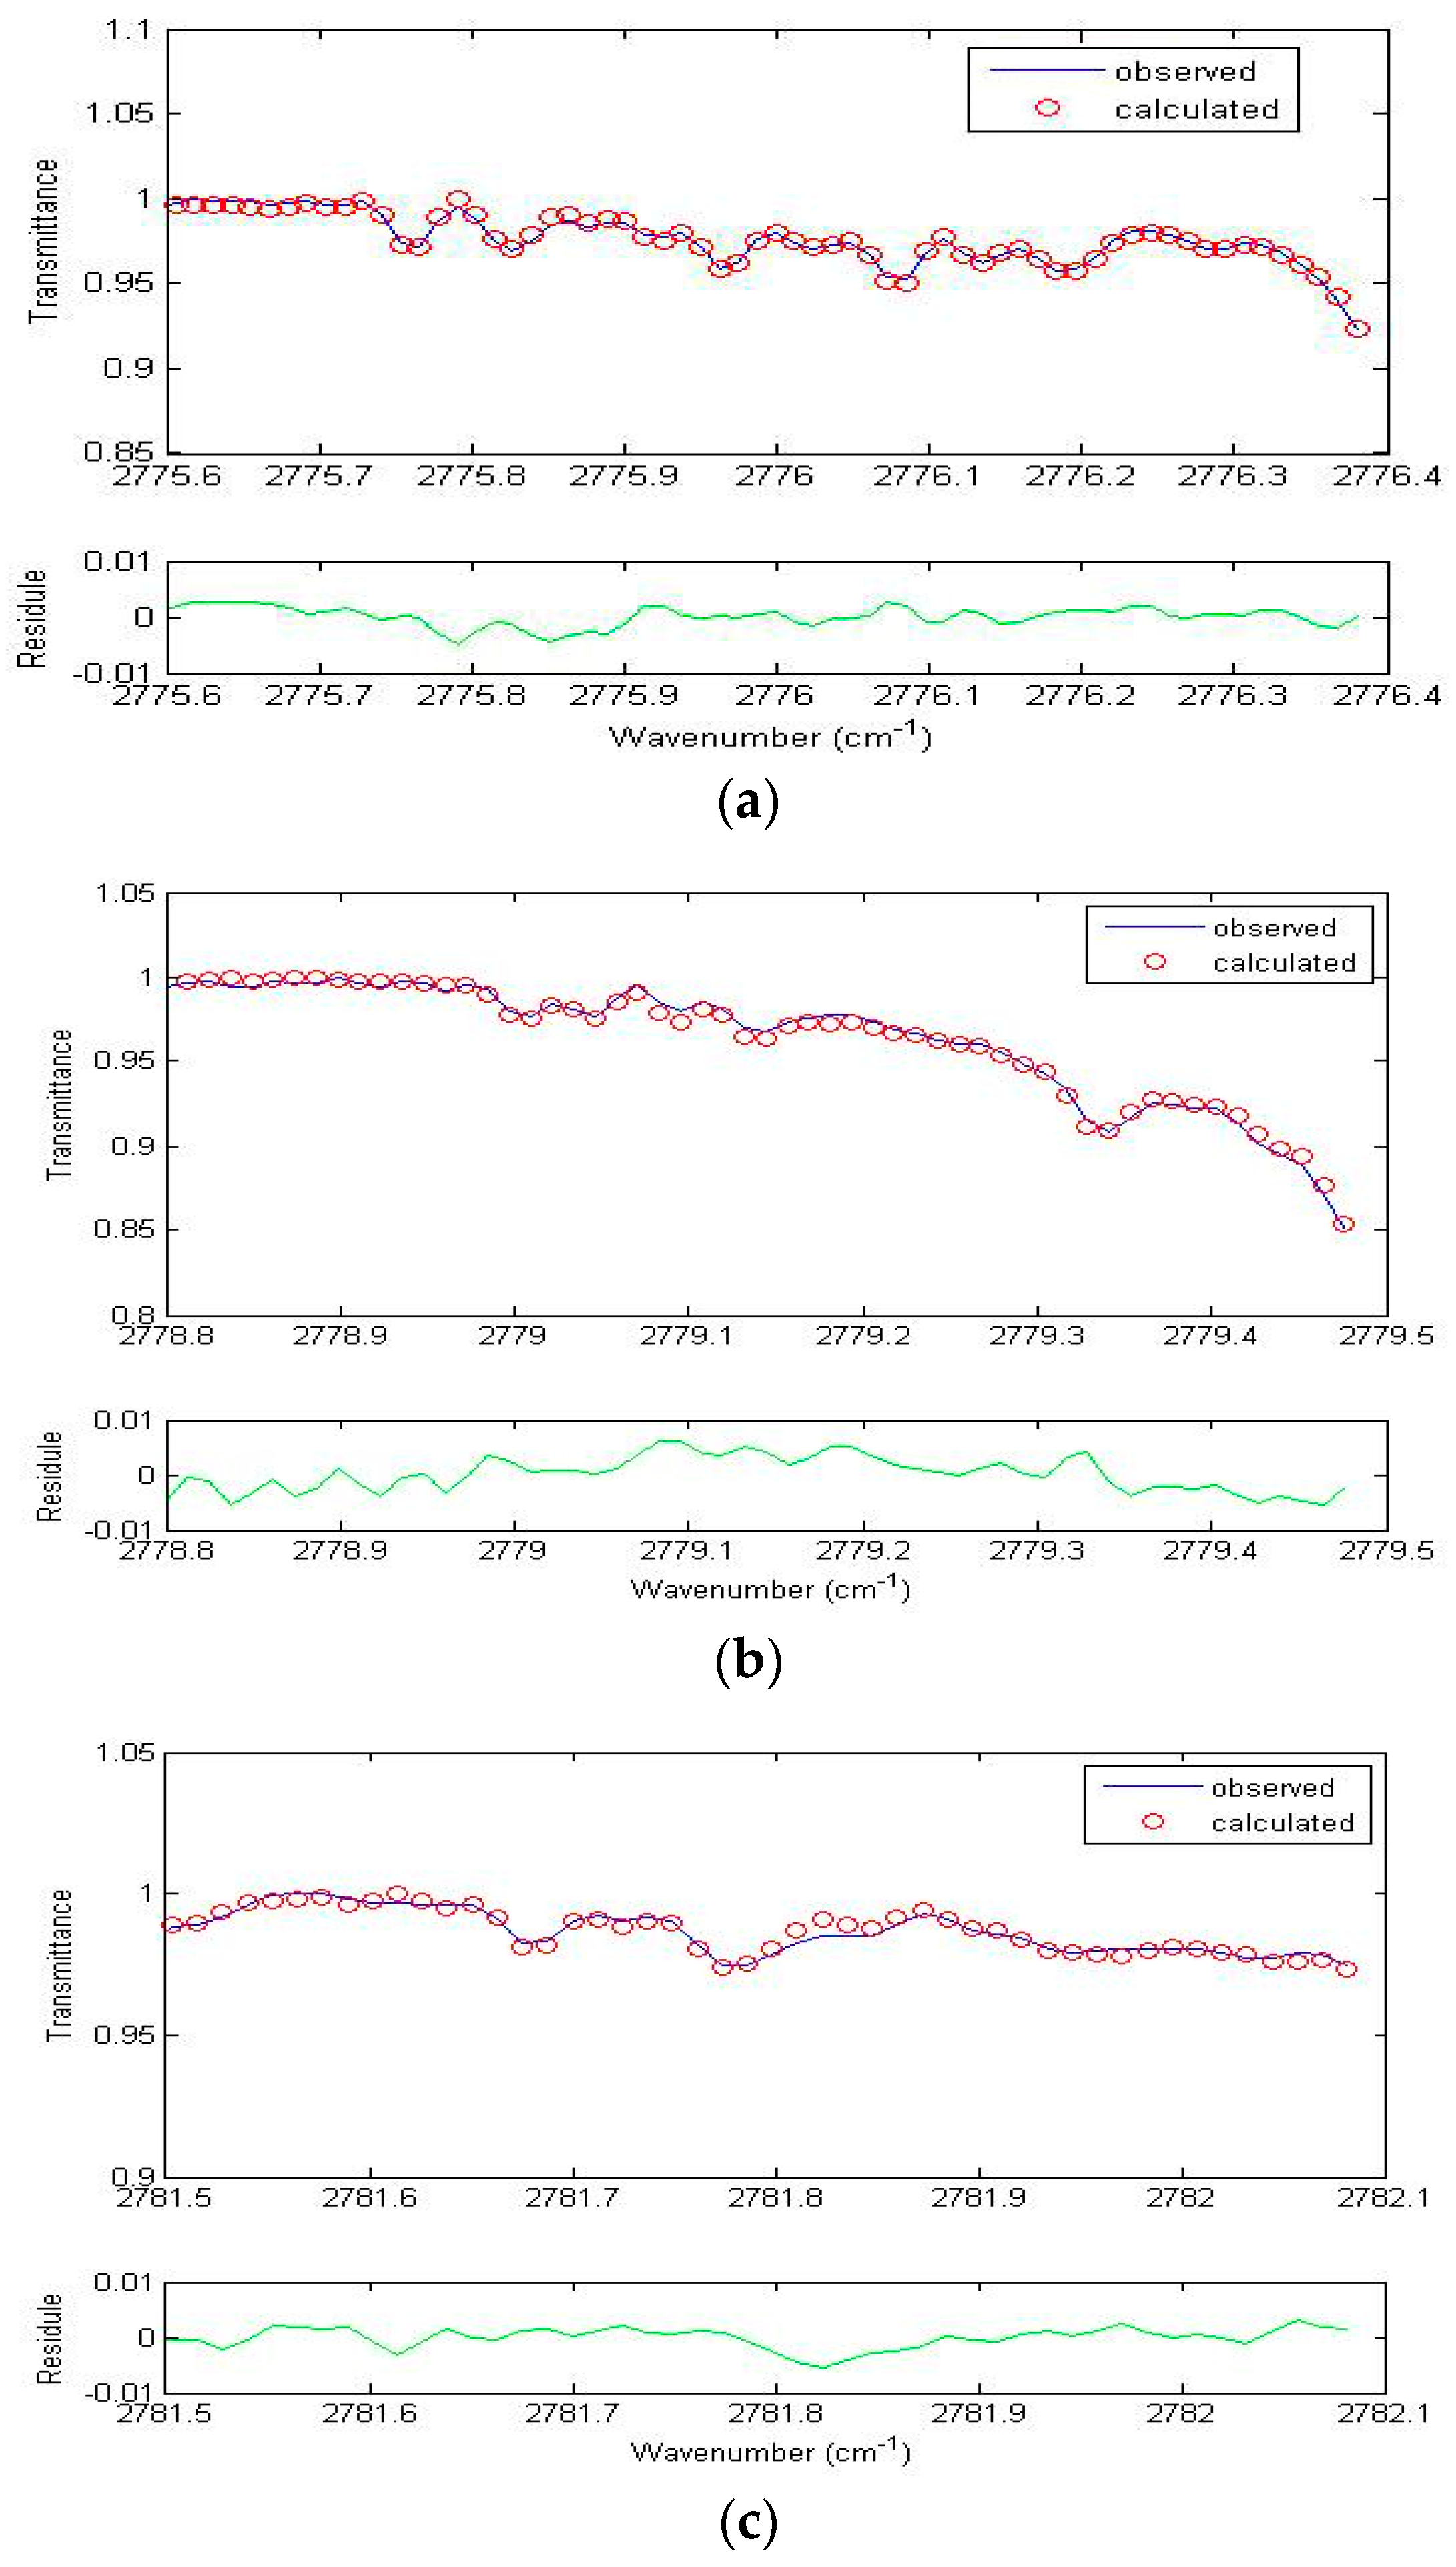
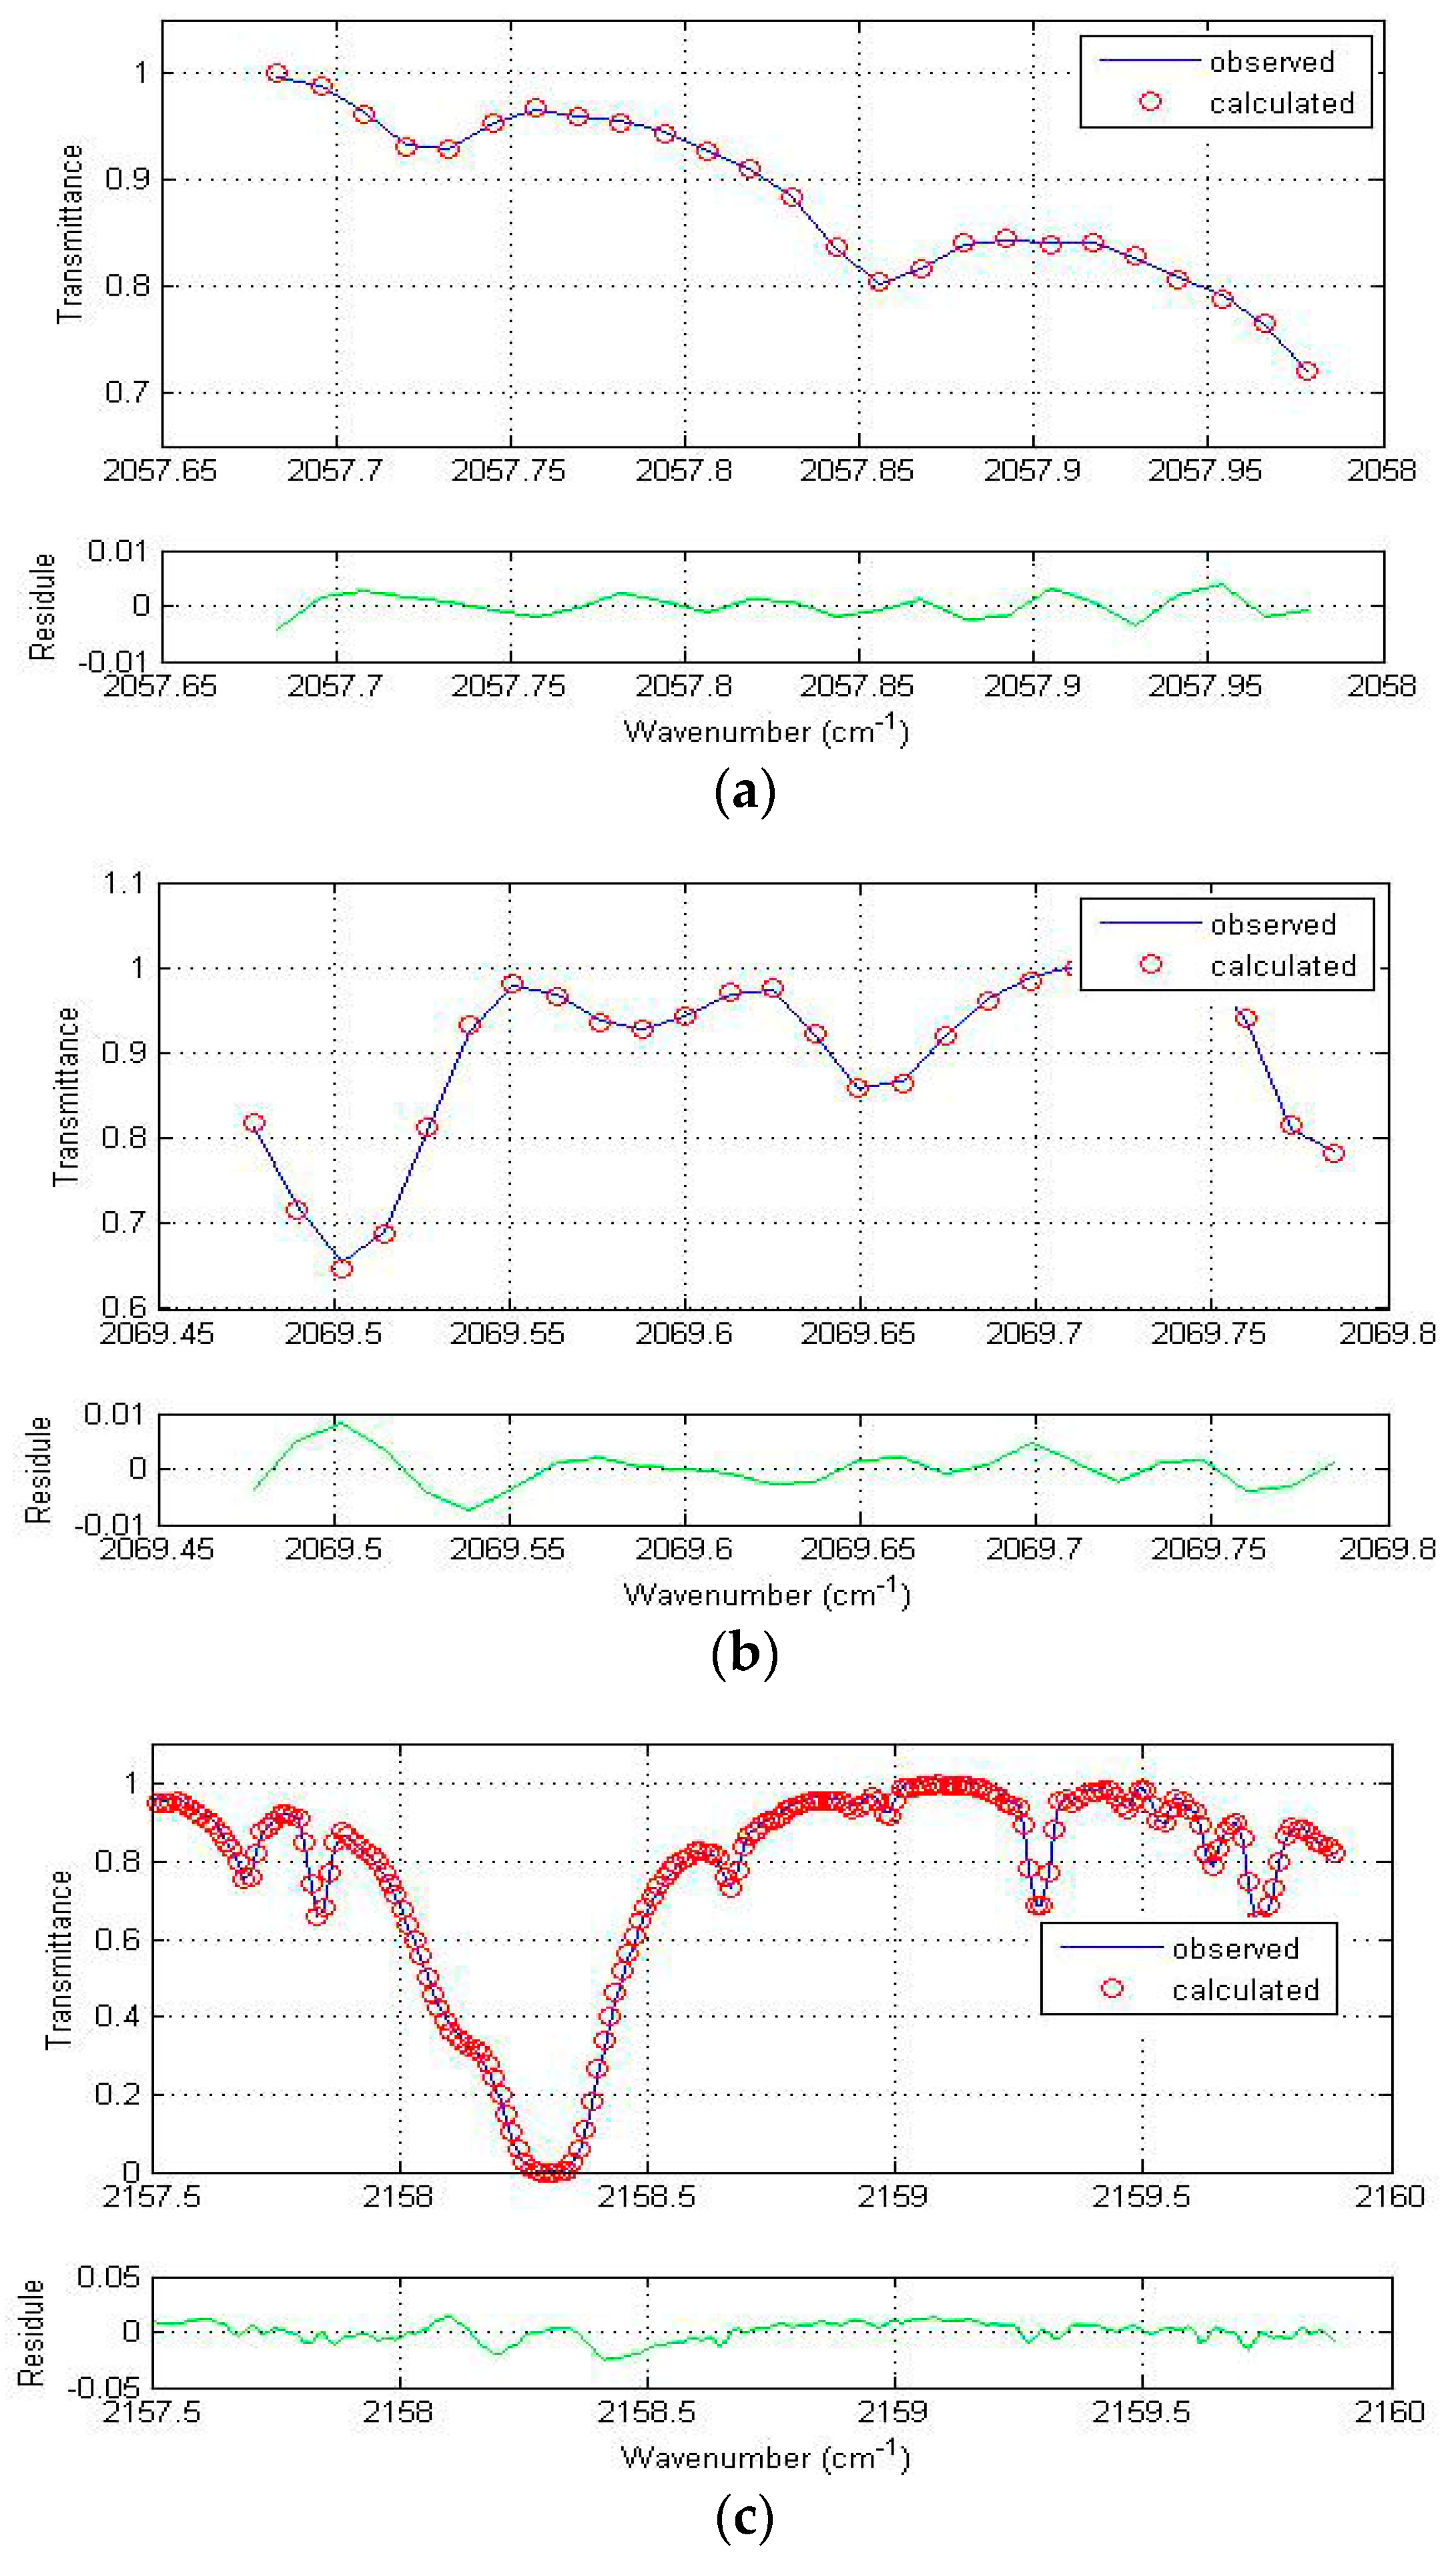
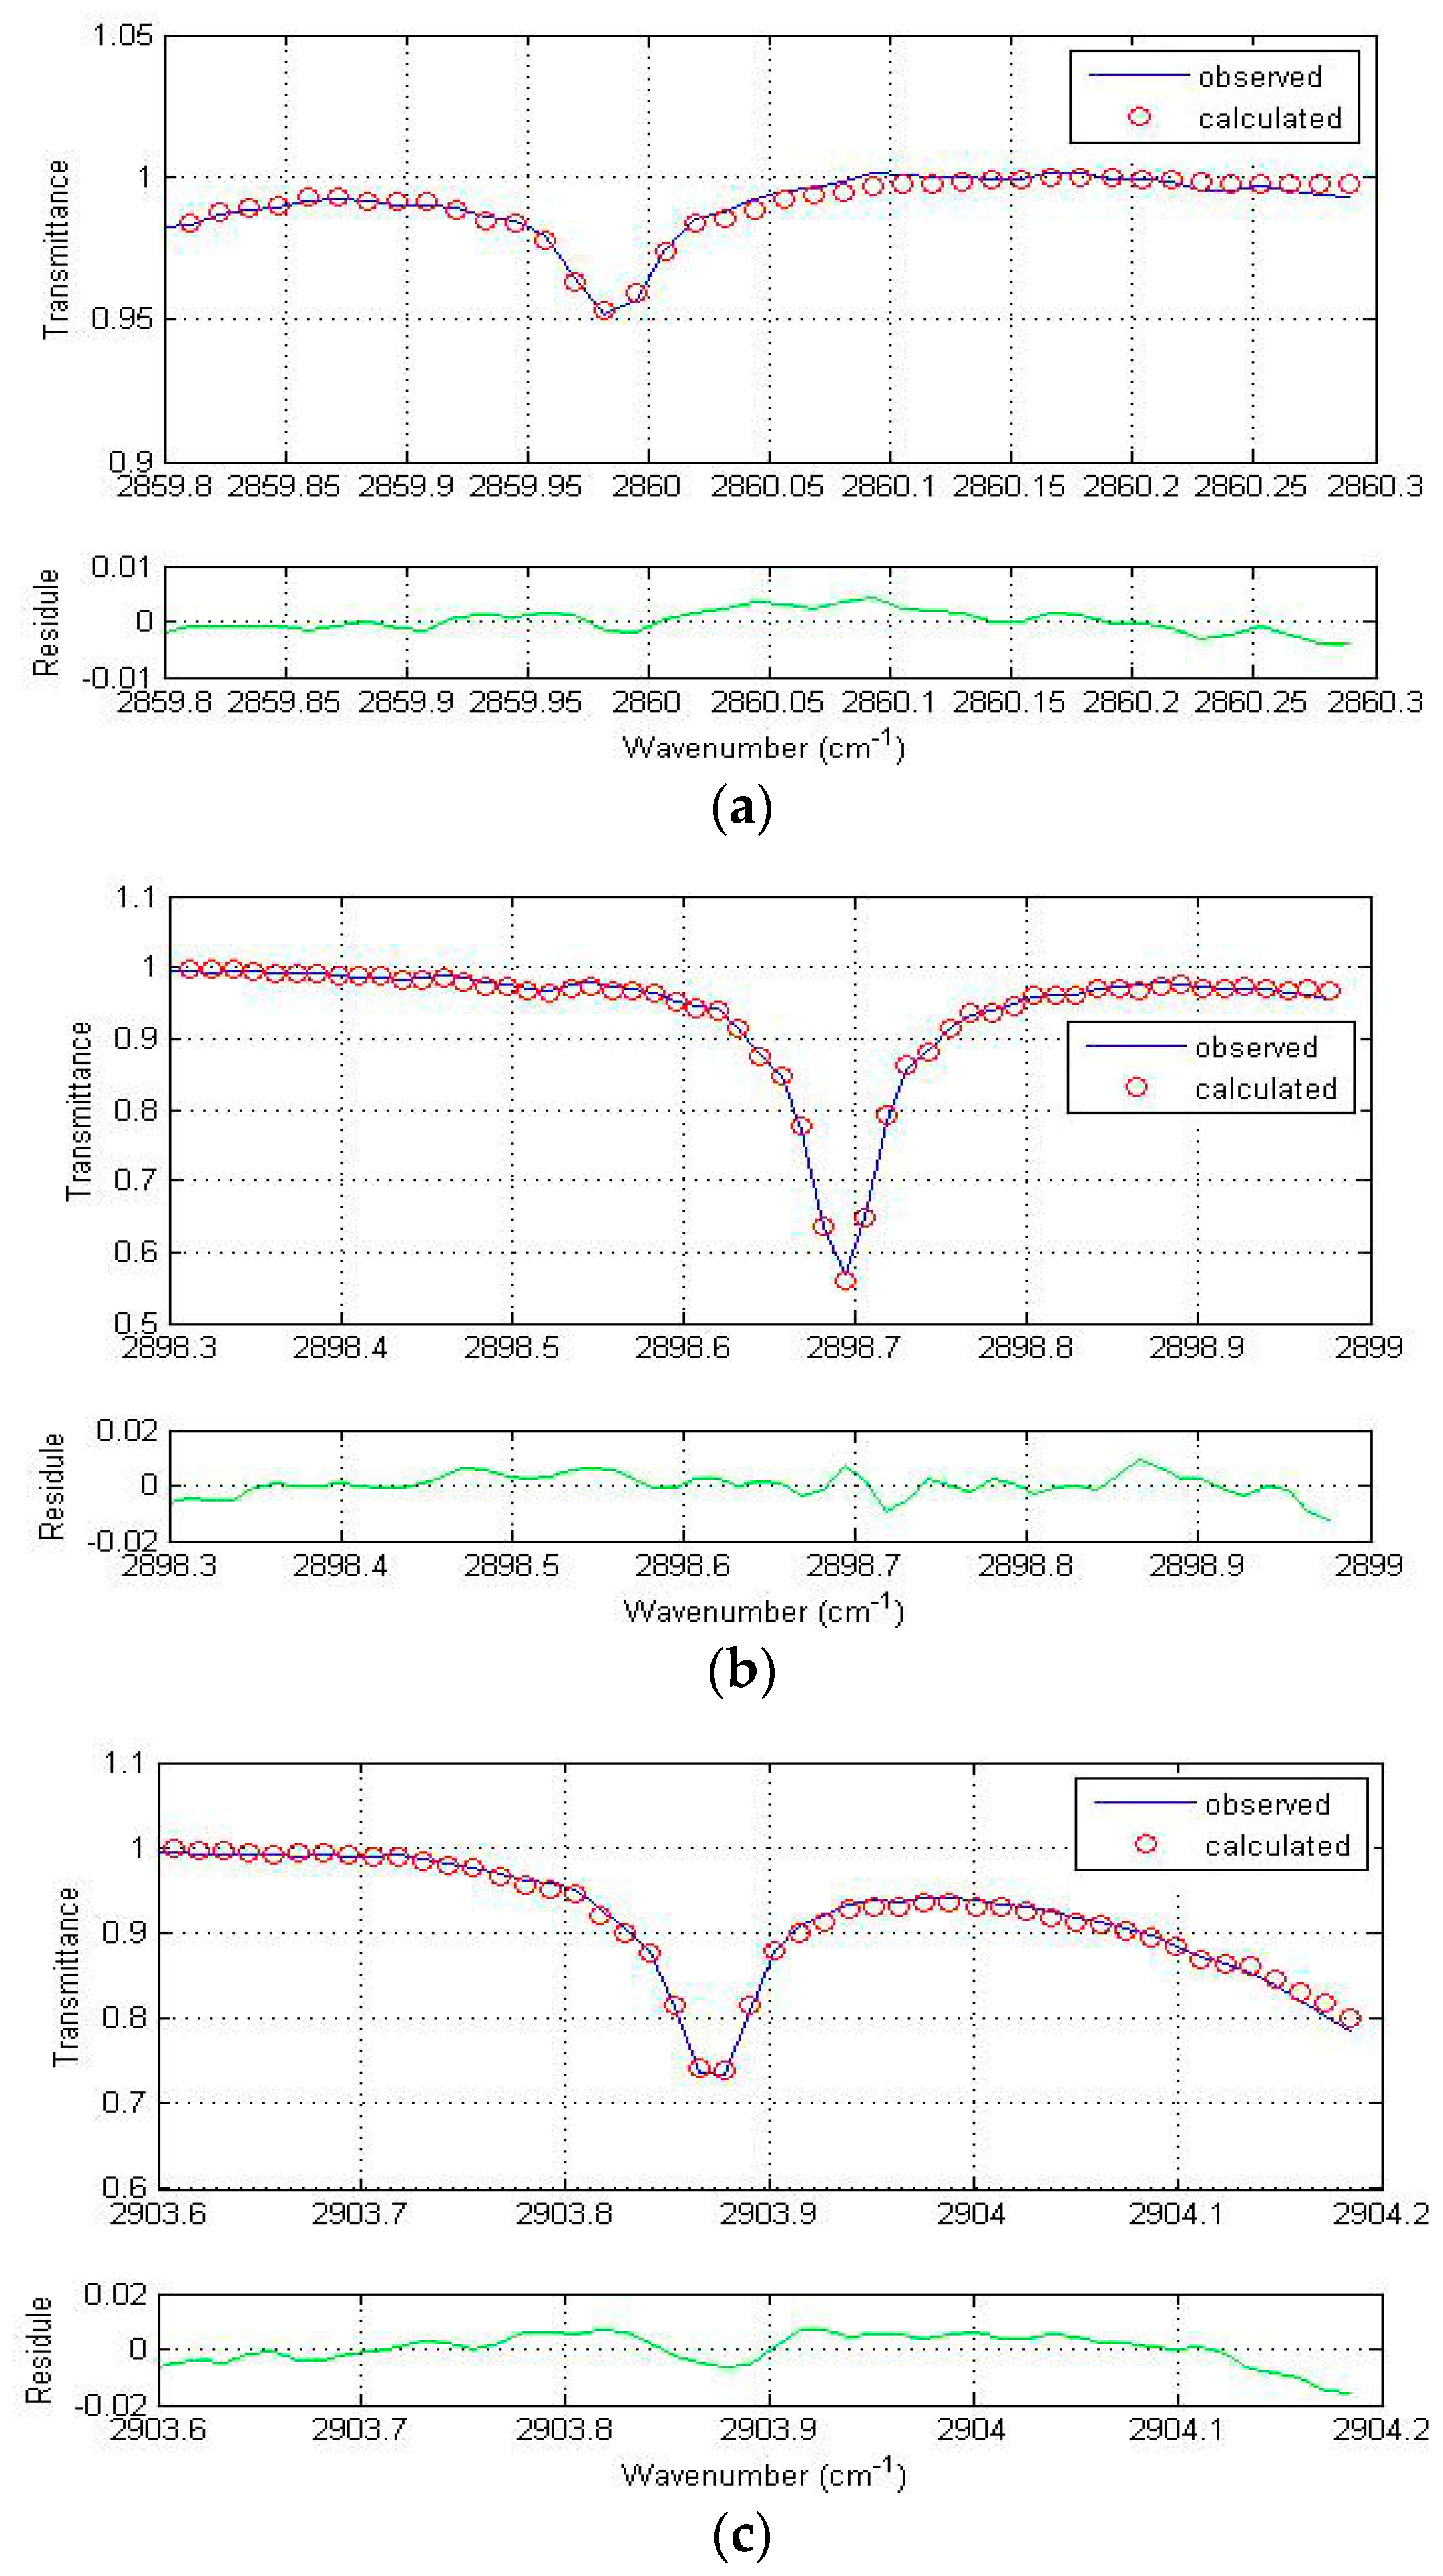
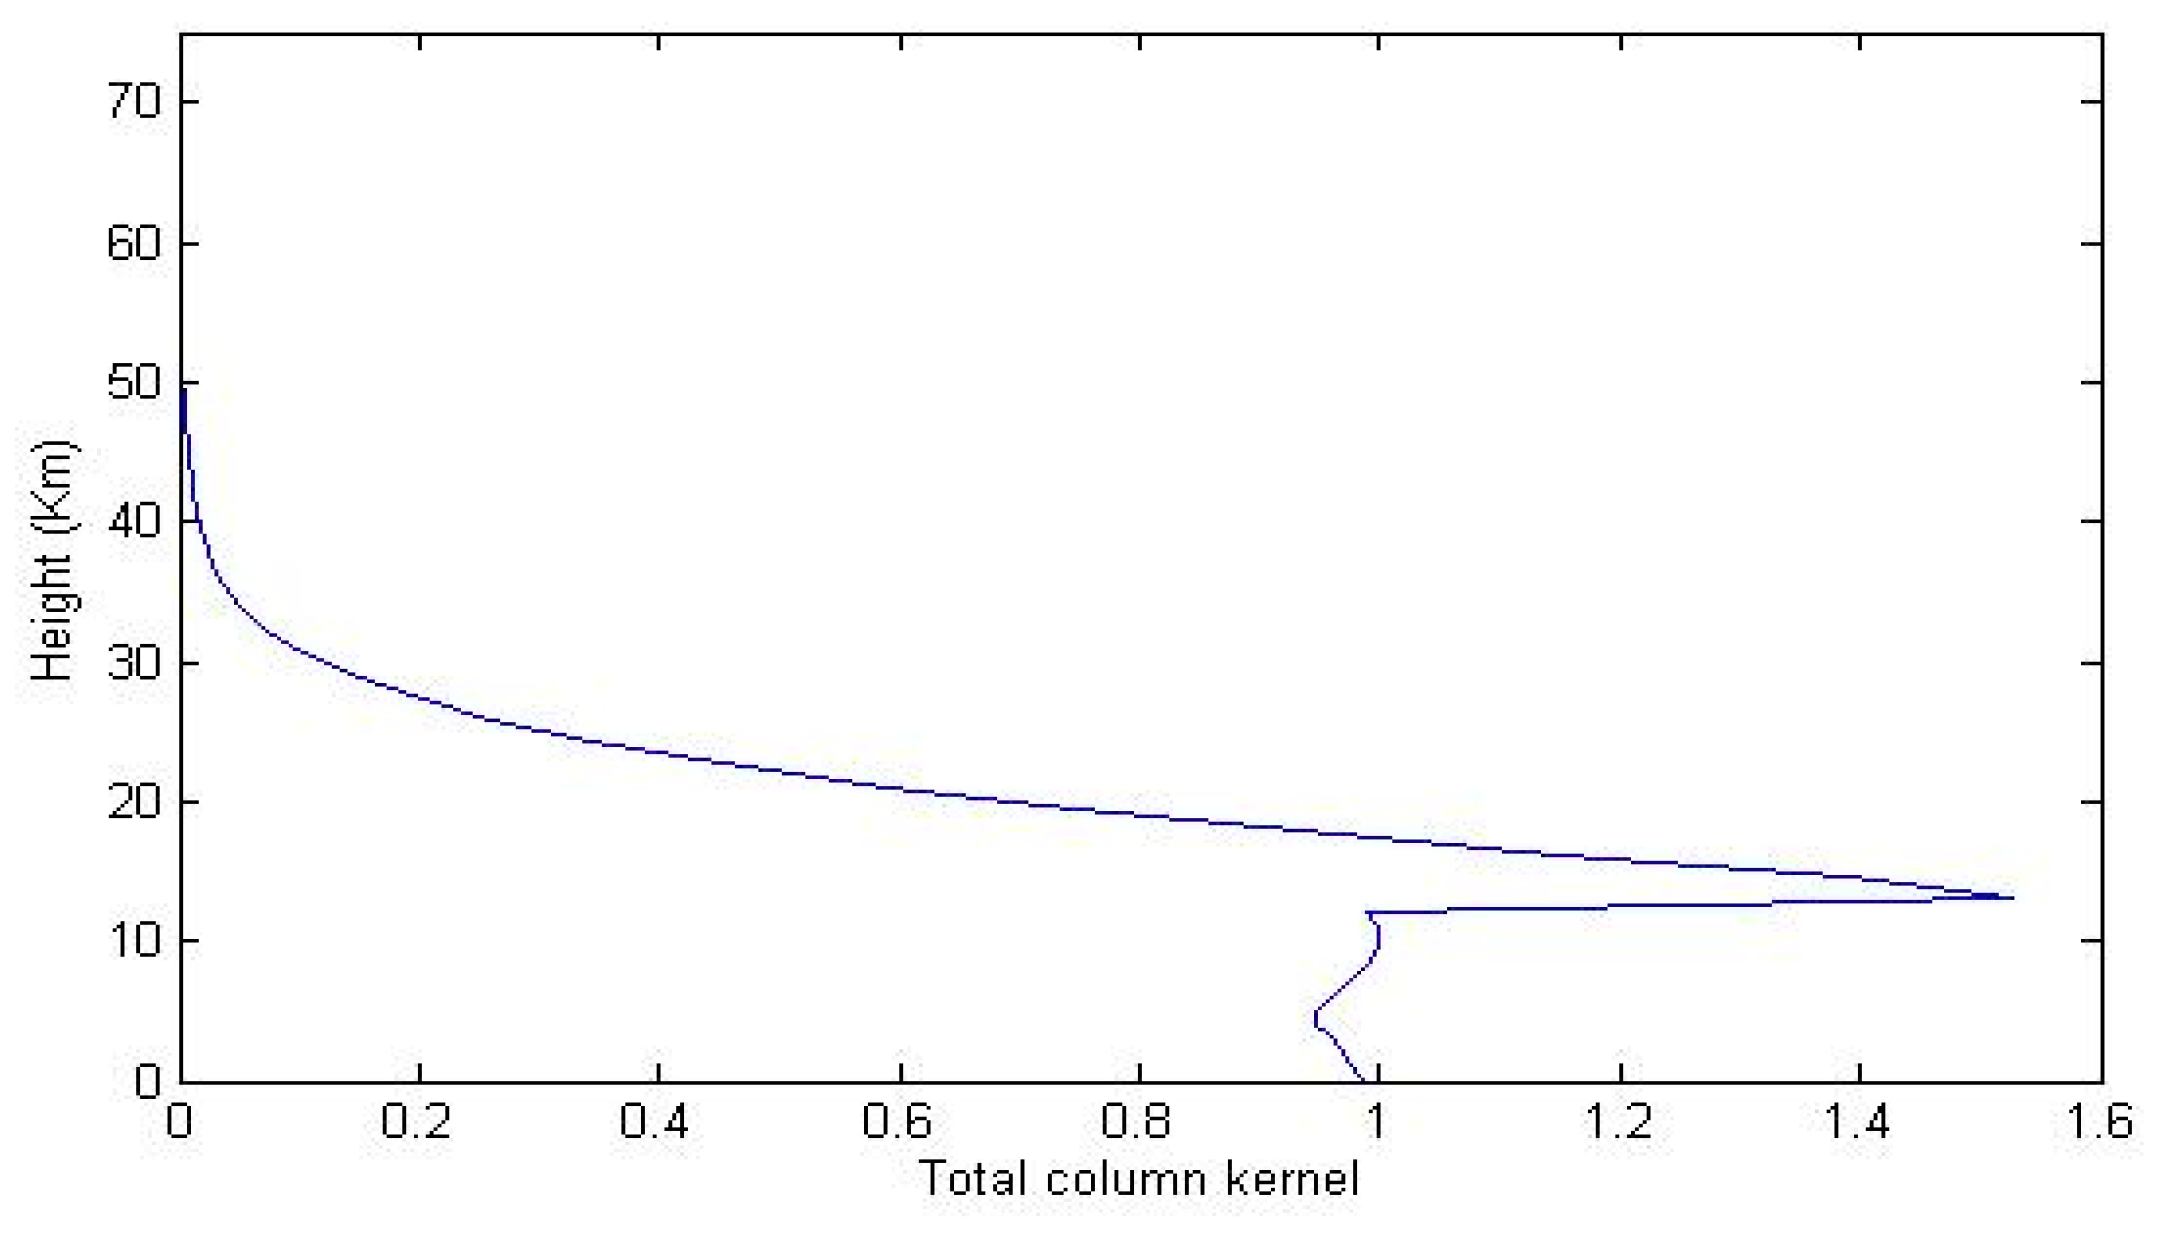
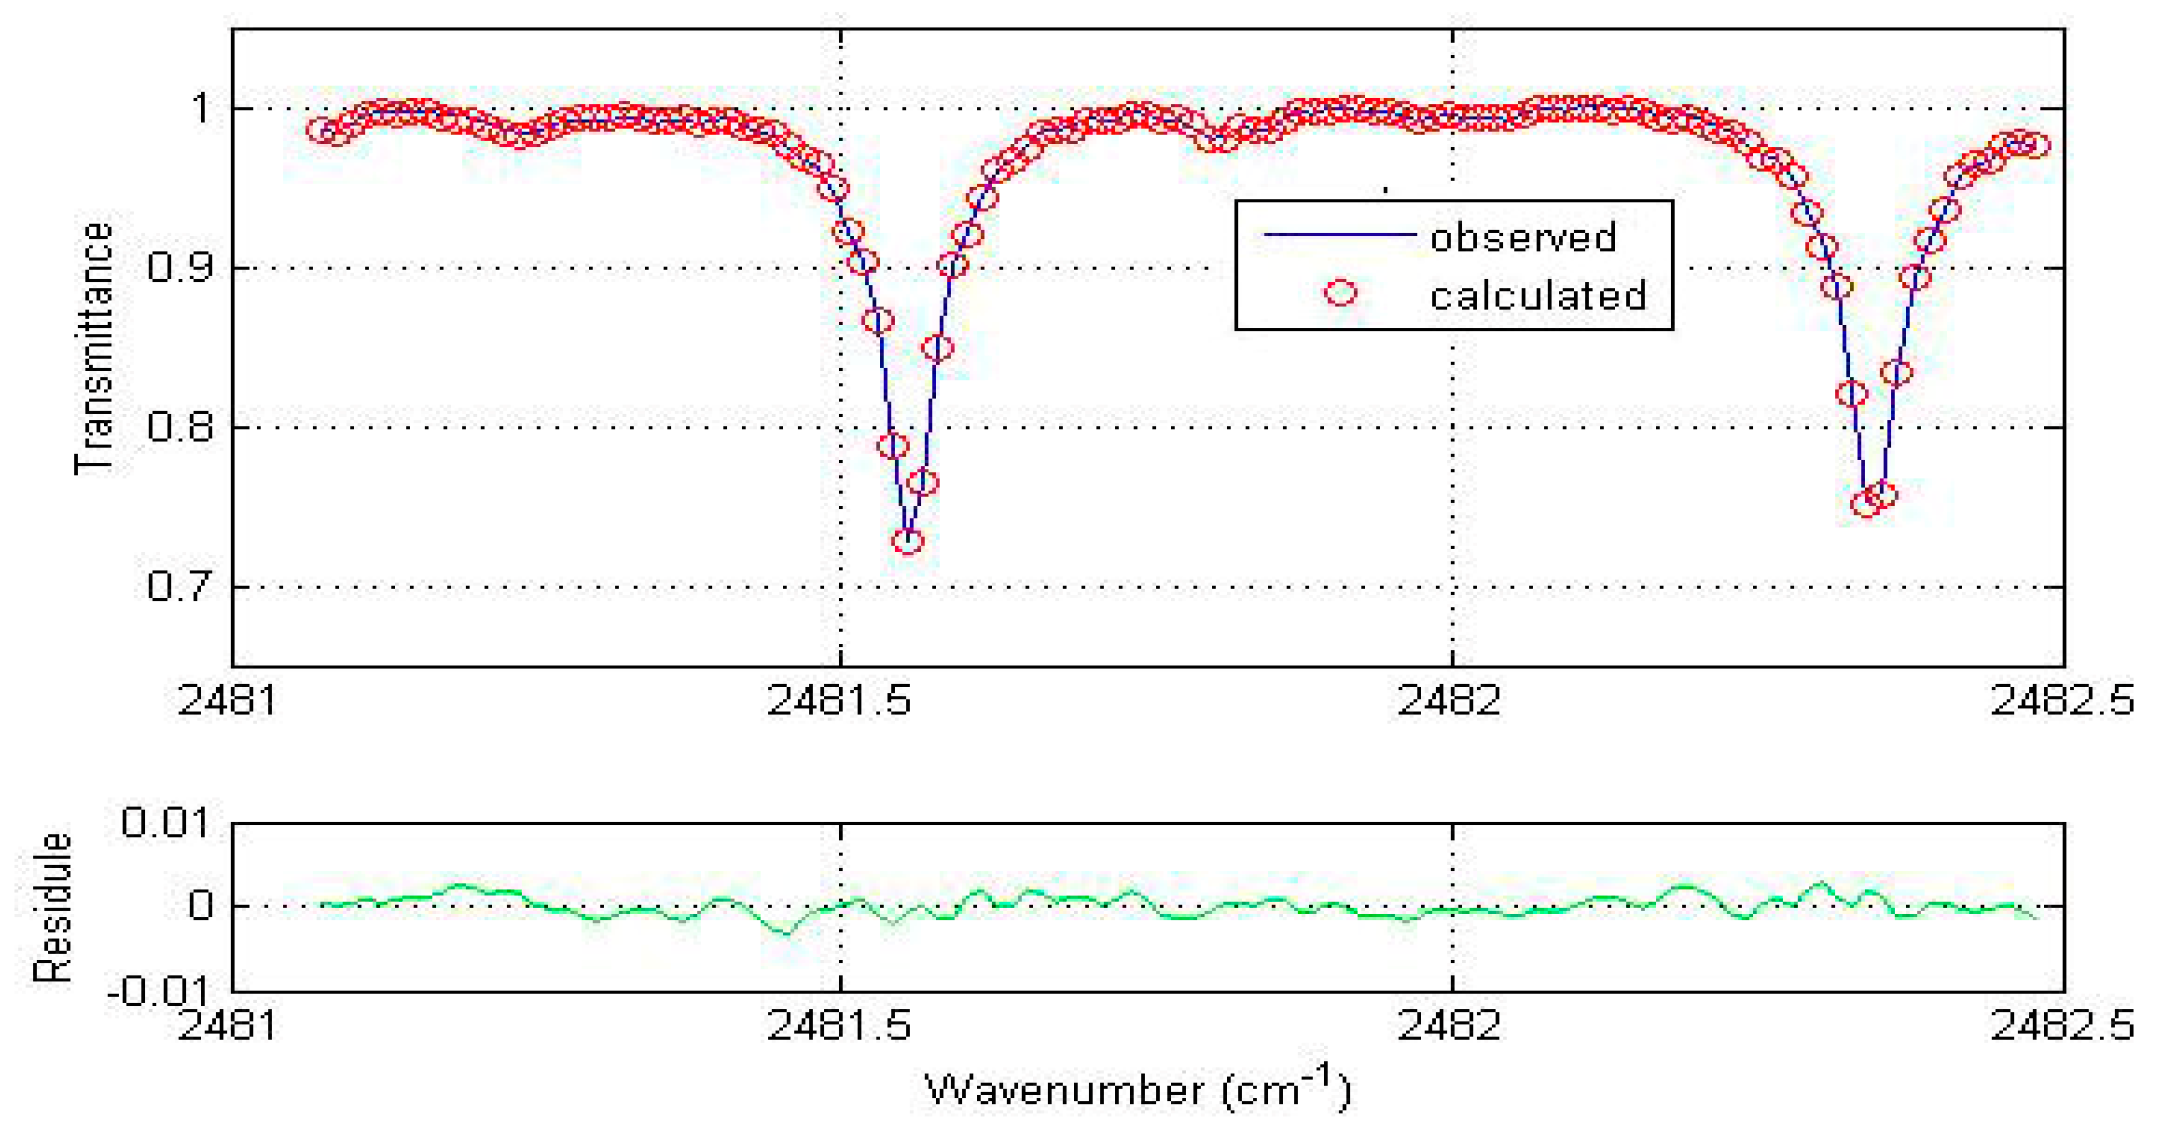
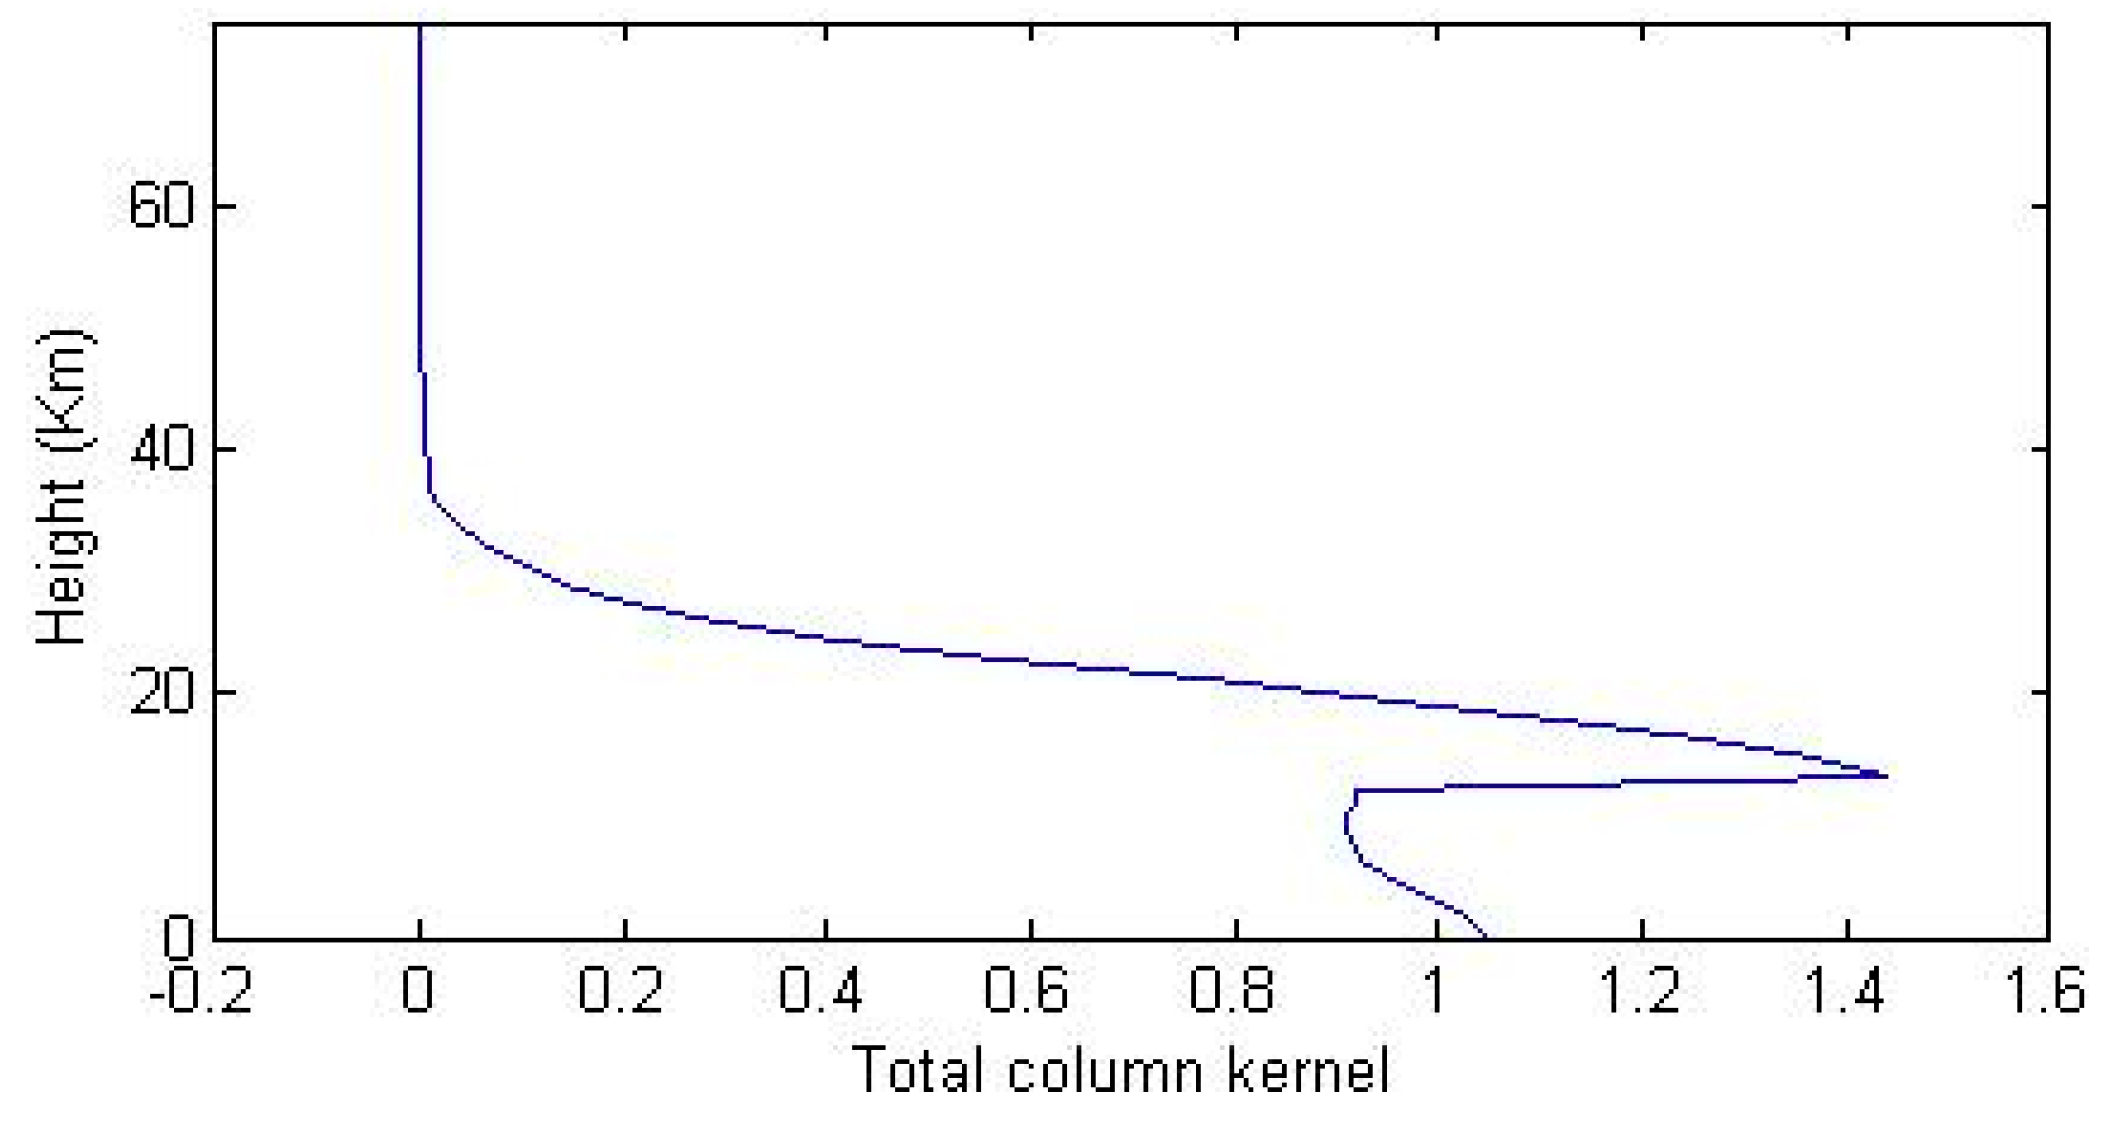
The Root Mean Square (RMS) residual error and averaging kernels were used to characterize the retrieval. The RMS residual error can be used to measure the quality of the spectral fits. If the RMS residual value is very small, the retrieval can be thought as successful. The averaging kernels provide the theoretical basis for determining the altitude sensitivity of a given atmospheric measurement, as well as the sensitivity of the retrieval state vector to the true state vector. The averaging kernels can also reflect the sensitivity of the retrieval column to the true state. Figure 3 presents an example of spectral fits for O3 retrieval in the three microwindows. The mean RMS residual value for the three spectral fit microwindows is 0.305%. Figure 4 shows the total column averaging kernel for O3. The retrieval is most sensitive to the stratosphere between 15 and 35 km. The spectral fit results and the total column averaging kernel for CO retrievals are shown in Figure 5 and Figure 6, respectively. The mean RMS residual value for is 0.87% for three microwindows, and the total column averaging kernel clearly show sensitivity to the troposphere and lower stratosphere. As shown in Figure 7 and Figure 8, the spectral fits and averaging kernels for CH4 retrievals are similar with those of CO. The mean RMS residual value for the three microwindows is 0.597%, and the total column averaging kernel show good sensitivity to the troposphere. The spectral fit result for N2O is better than that of the other trace gases with a mean RMS residual of 0.159% (Figure 9). The total column averaging kernel indicates that good sensitivity for the N2O retrievals in the troposphere and lower stratosphere (Figure 10). Generally, the RME residual of spectral fit for the selected four trace gases is very small, which means that the measured solar absorption spectra can be well replicated and the retrieval is successful. The altitude sensitivity of total column reflected by total averaging kernel is consistent with the results of previous studies [24,25,26].
3. Results
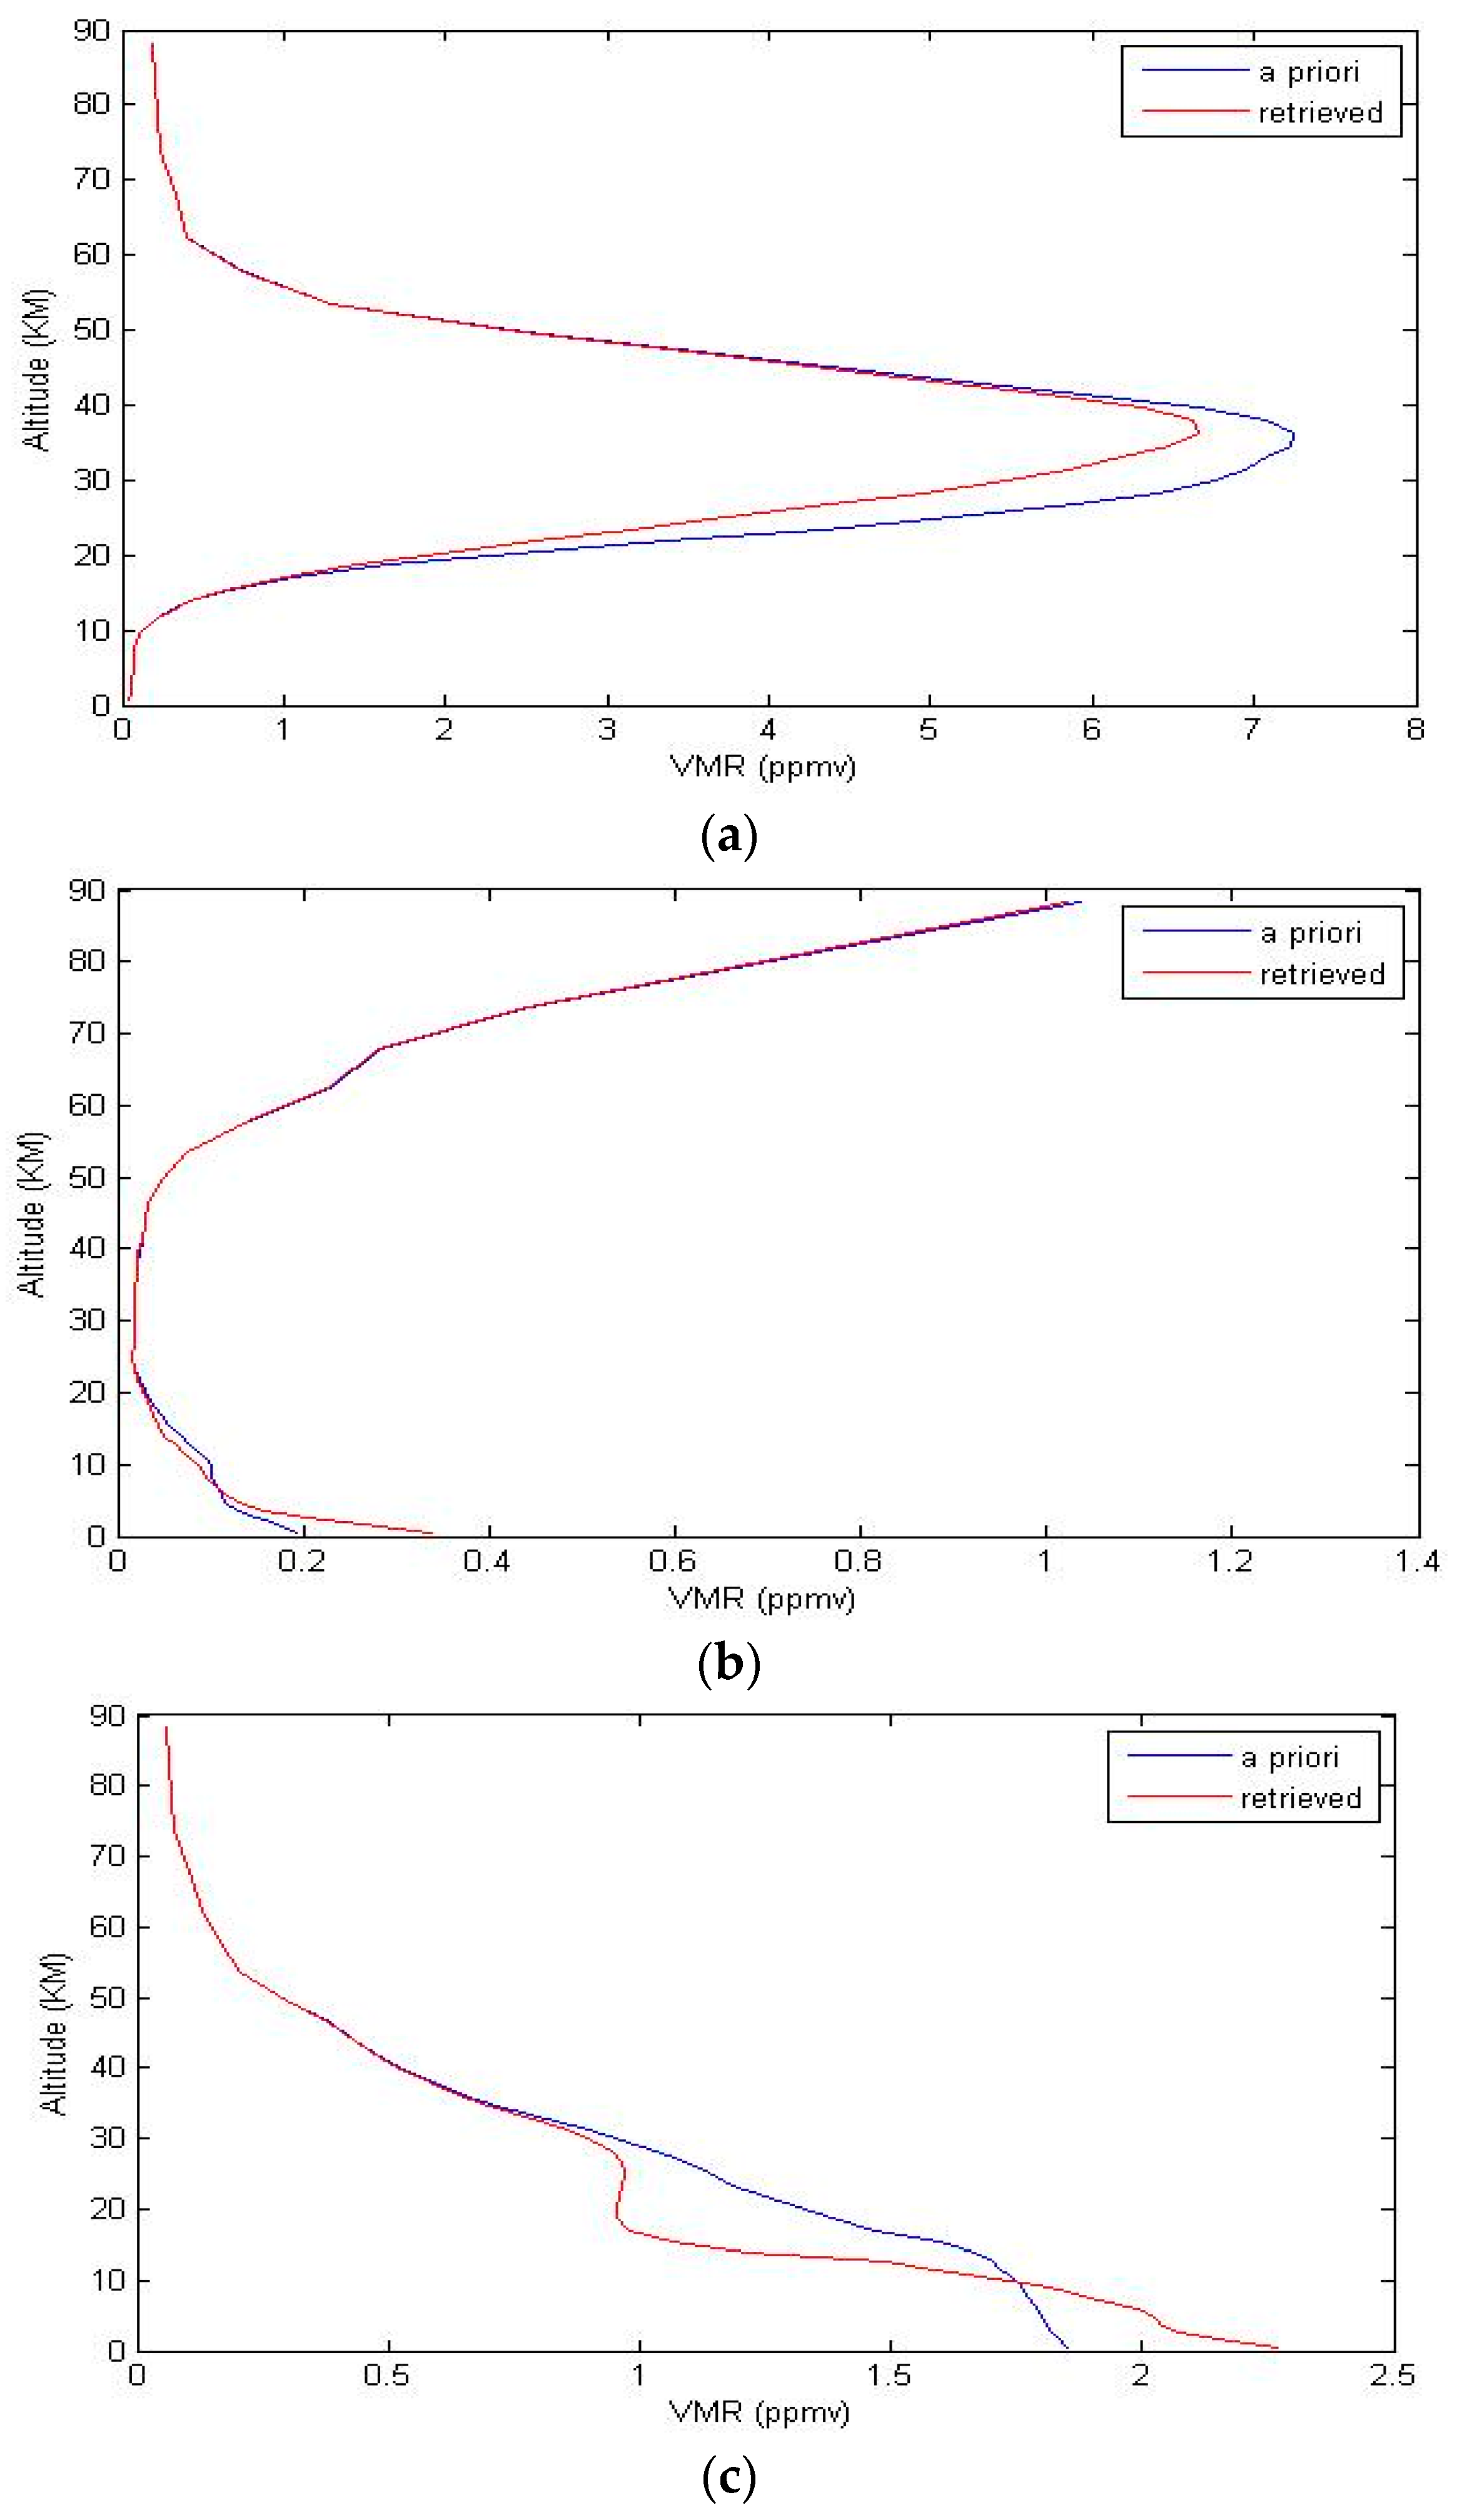
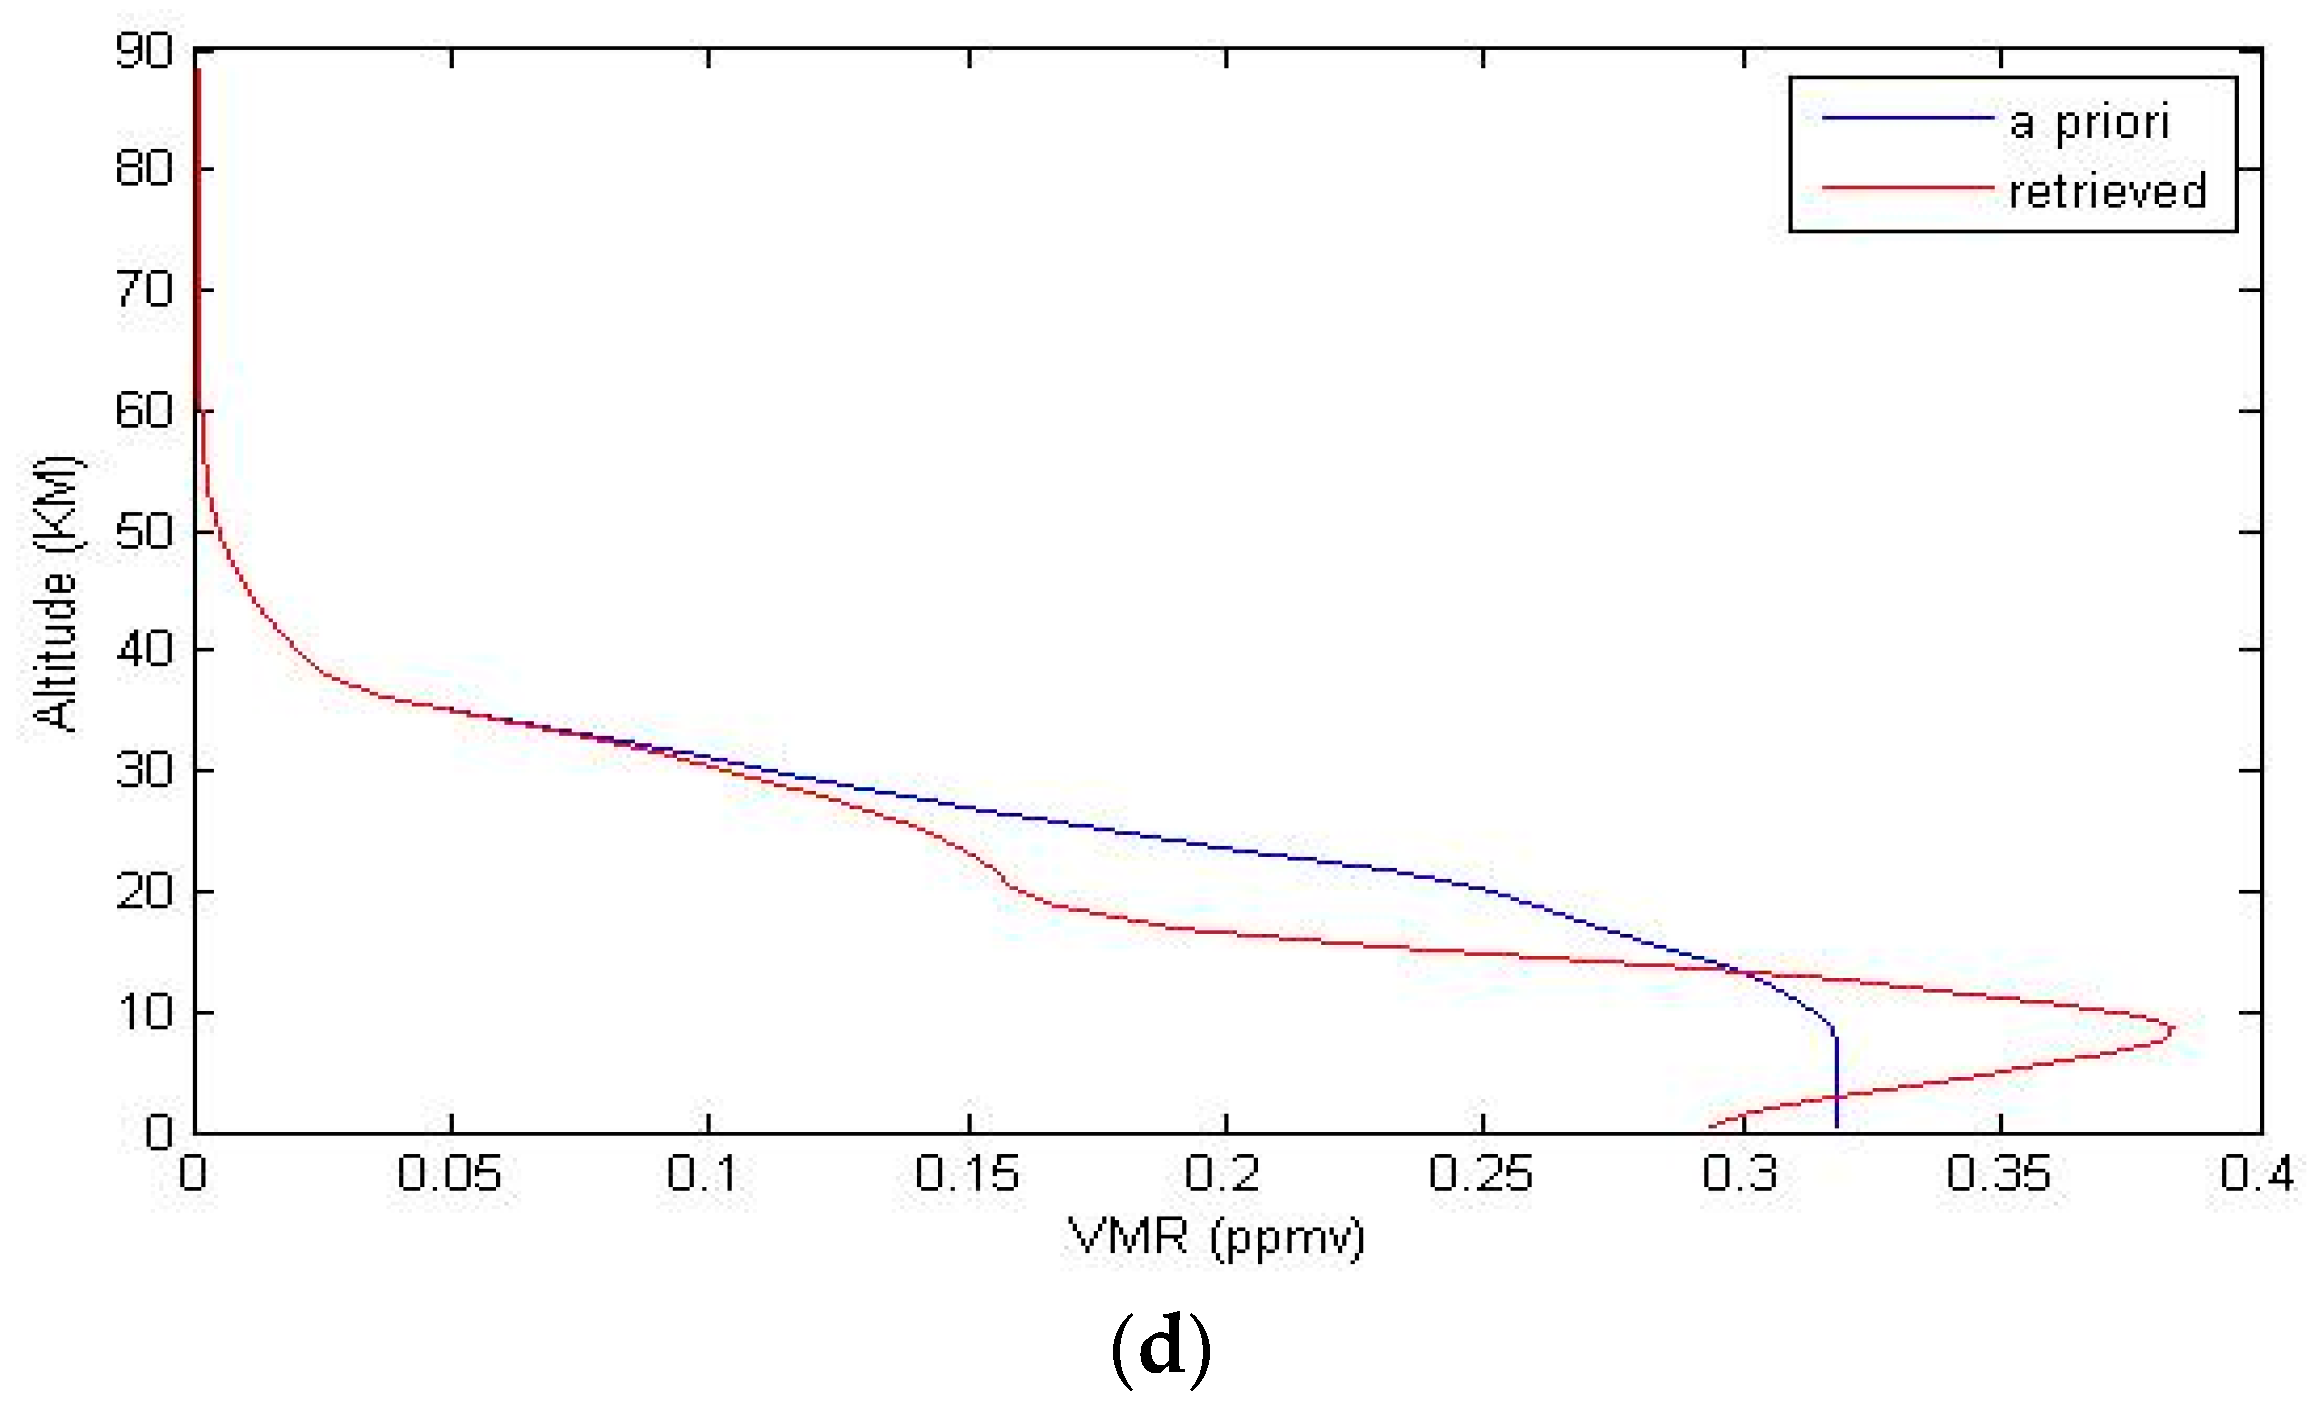
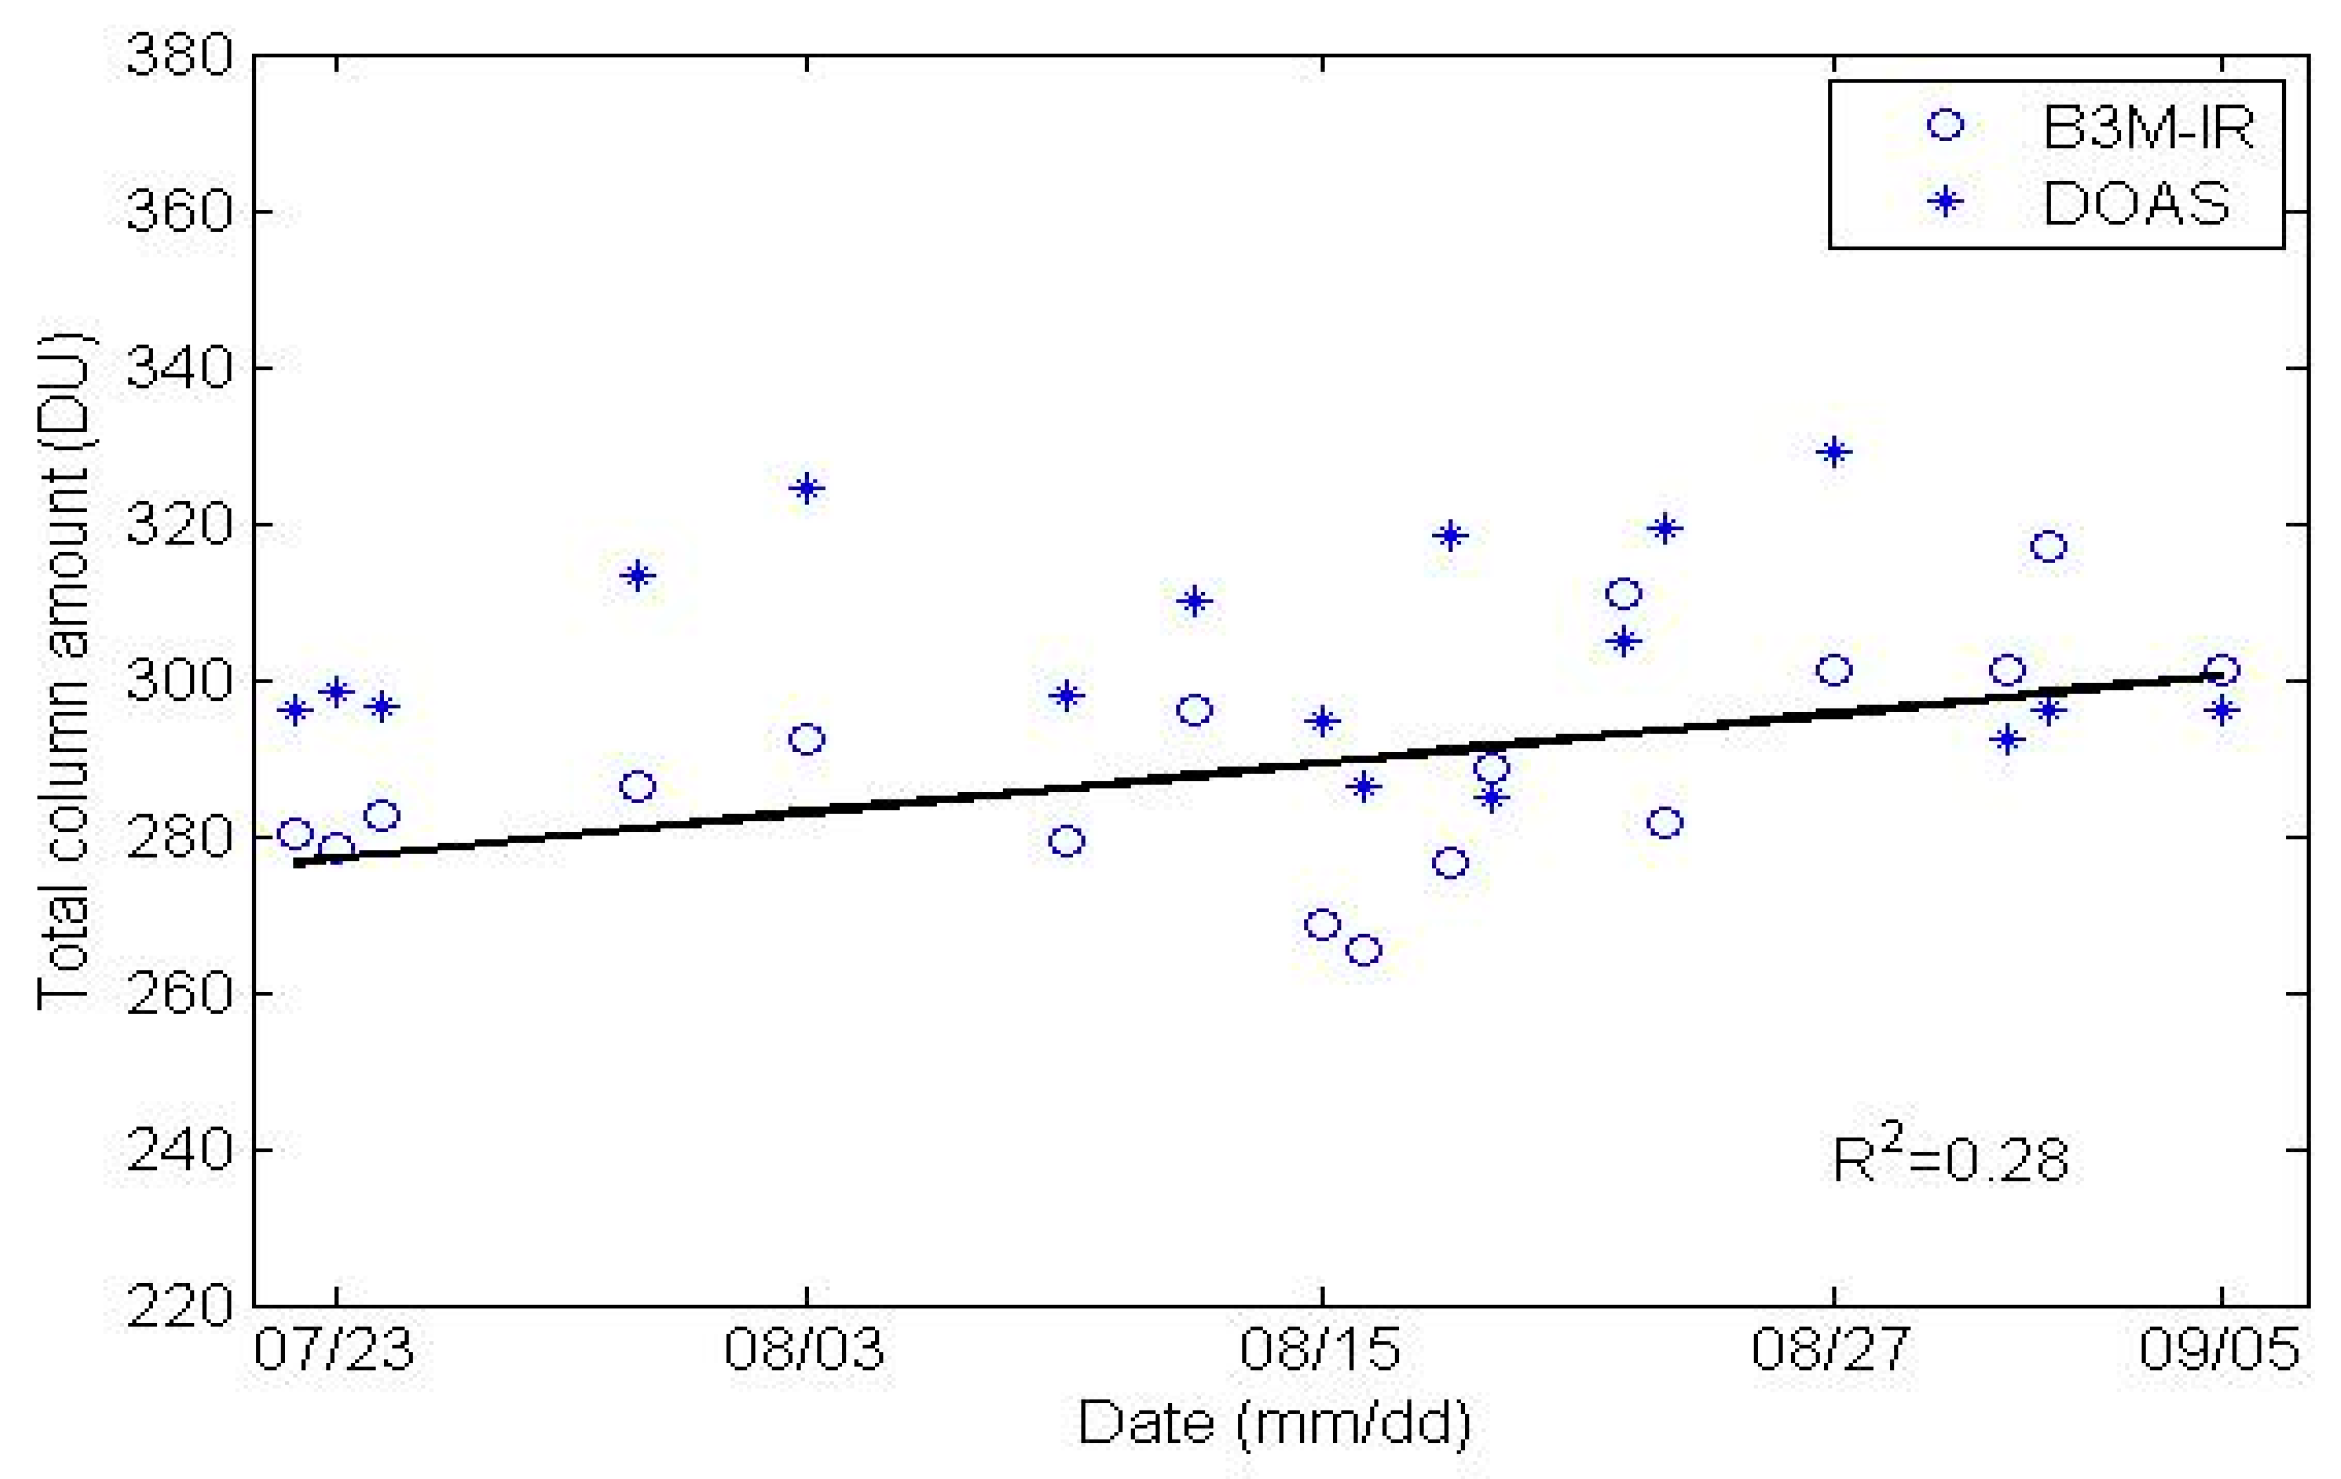
With the observed clear sky solar absorption spectra, we carried out the retrieval of atmospheric trace gas vertical profile and total column. An example of vertical profile retrieval for O3, CO, CH4 and N2O are shown in Figure 11. As the airspace was controlled during the Olympic Games, we could not acquire ozonesonde data. Thus the retrieved ozone vertical profile could not be evaluated by comparing it with the ozonesonde data. To address this problem, we simply compared the ozone total column amount with that derived from coincident MAX-DOAS measurements. The comparison result is presented in Figure 12. Note gaps exist in Figure 12, Figure 13, Figure 14 and Figure 15 due to the appearance of cloudy sky. There seems to be a linear increasing trend for O3 total column amount, but it is not significant and R2 is only 0.28.. Generally, the total column amount retrieved from B3M-IR is lower than that that derived from MAX-DOAS. The average relative error is relatively large and amounts to 6.5%. There are two possible reasons for this: (1) the spectral resolution of B3M-IR is 0.02 cm−1, which is an order lower than that of the commonly used FTS, and (2) the observation time of B3M-IR is not matched with that of MAX-DOAS. The former measurements were obtained at about 1:30 PM and the latter at about 12:00 noon. The time interval was approximately 1.5 hours. Elaborate synchronous experiments need to be carried out in the future to evaluate further the retrieval result of B3M-IR.
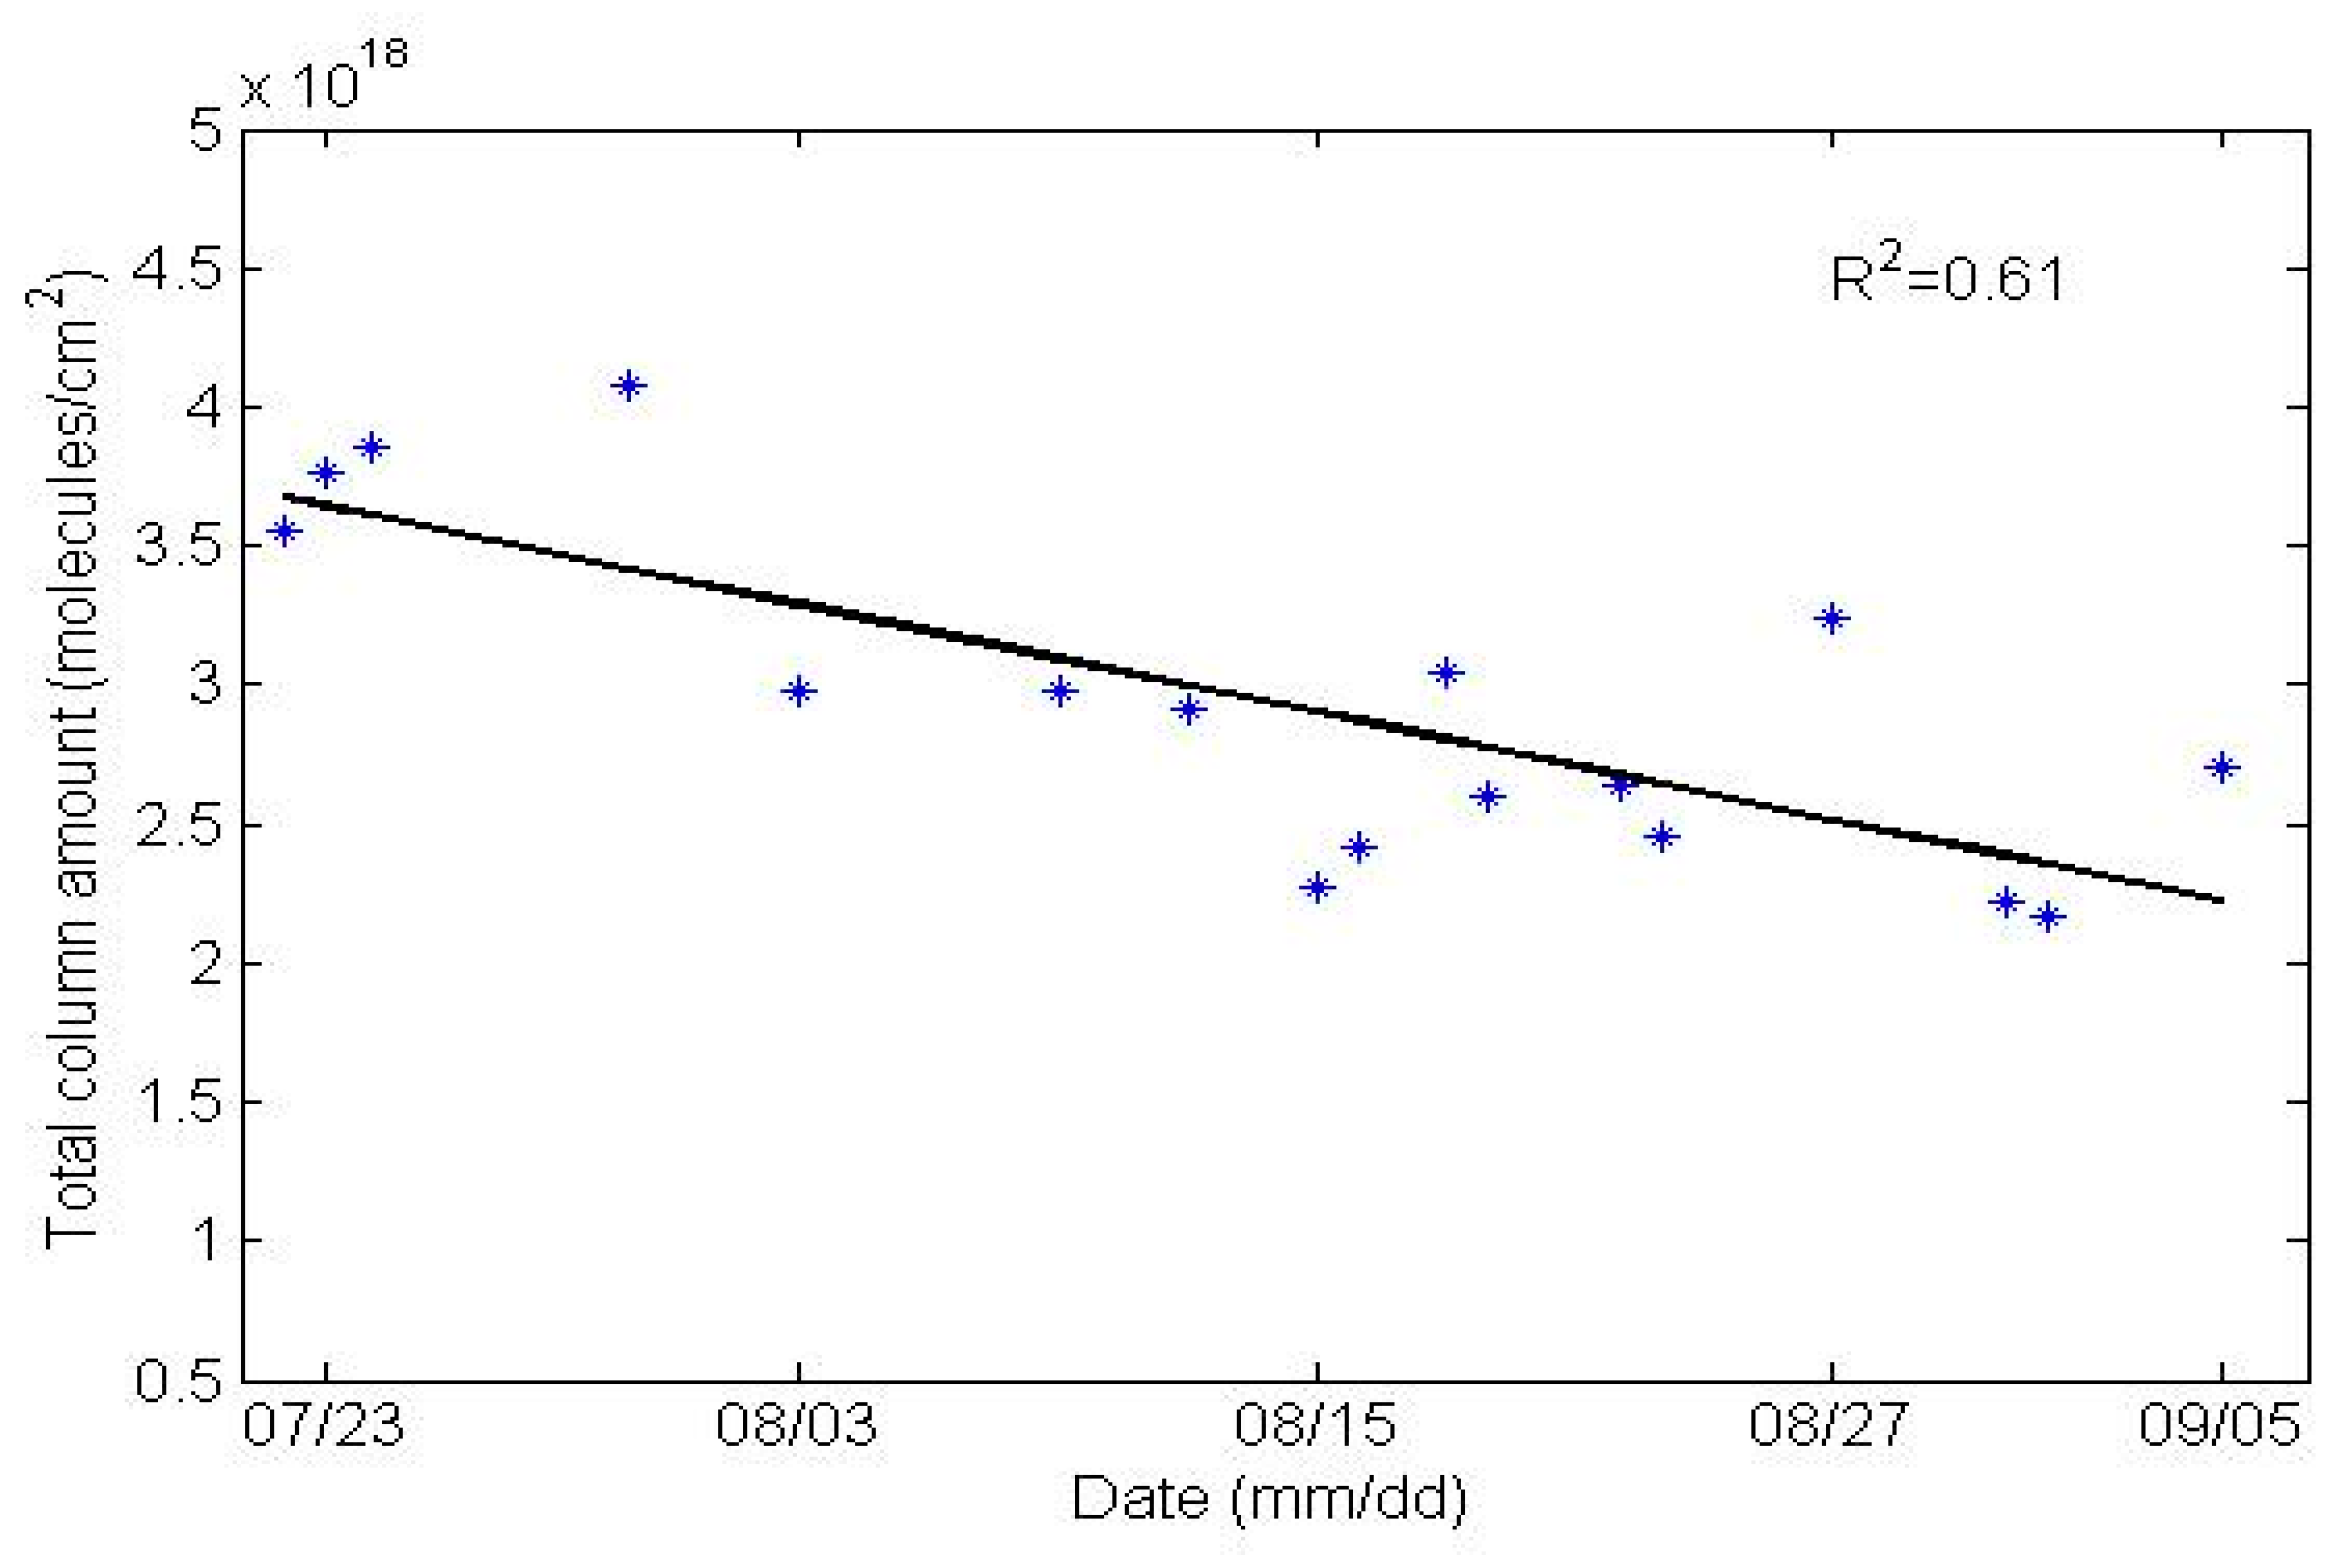
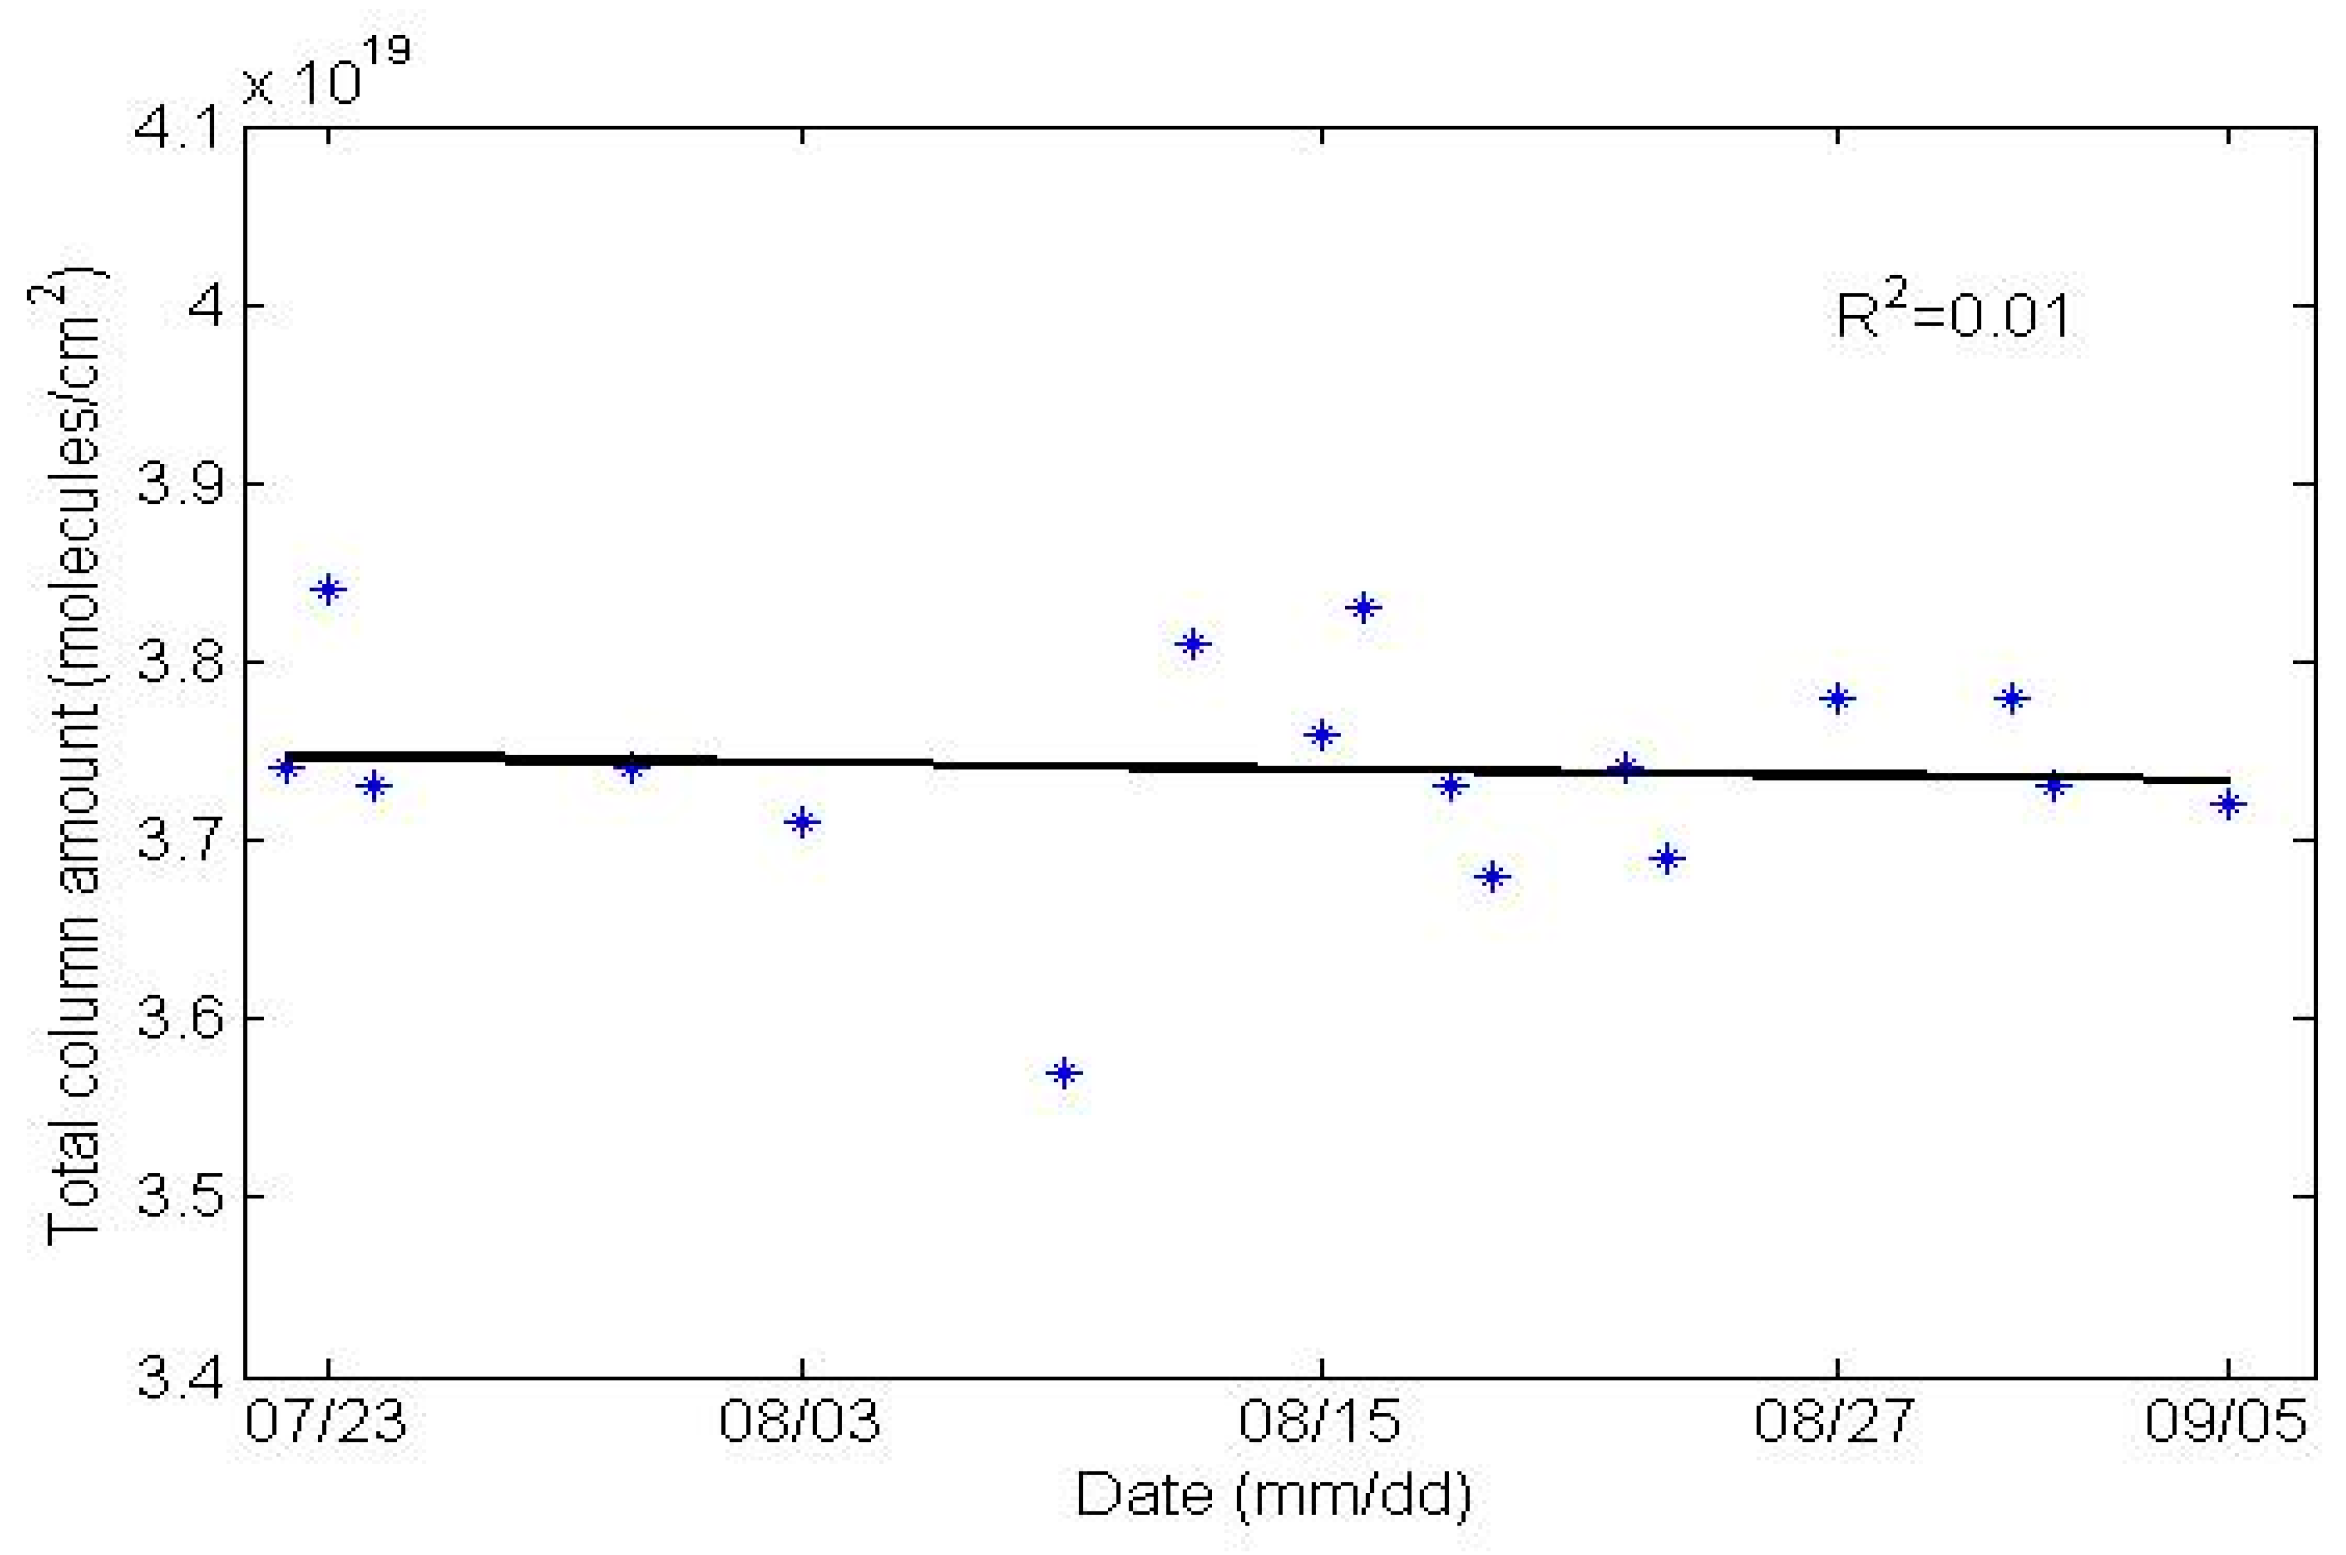
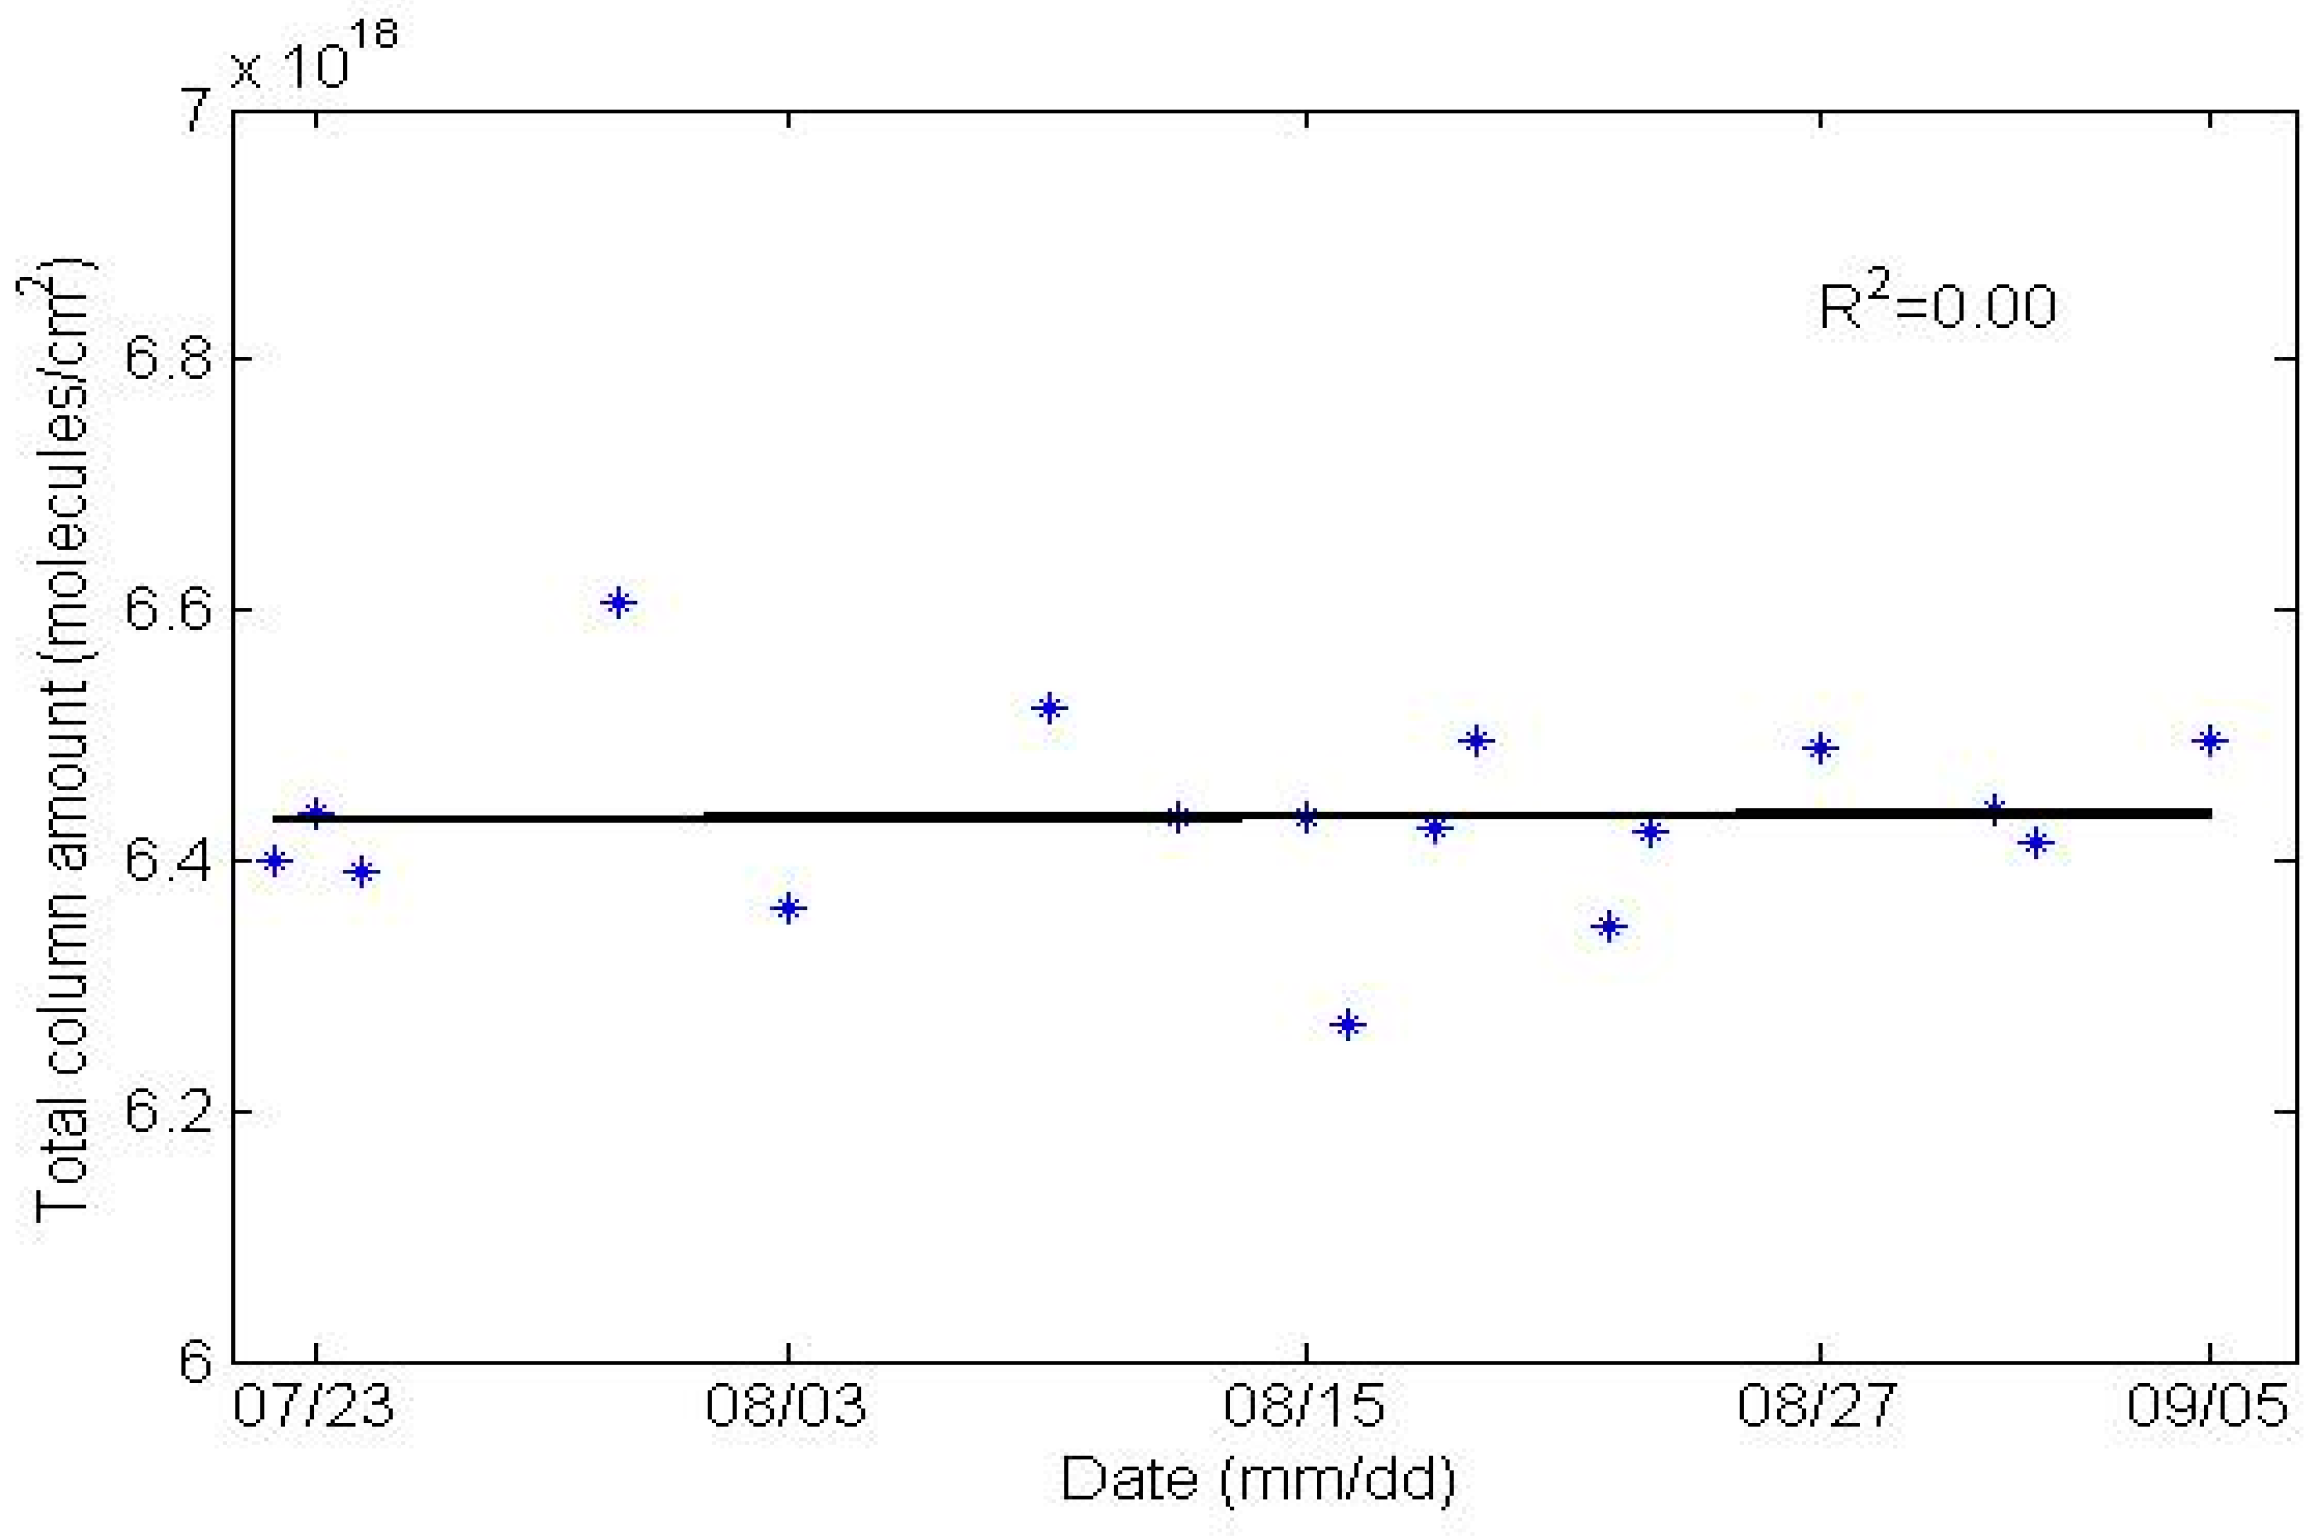
The total column amount of CO is shown in Figure 13. The total column amount of CO at the end of July, 2008 is the highest, and then it began to decrease gradually. There is a significant linear decreasing, and R2 reaches 0.61. This kind of phenomenon may be attributed to traffic control policies adopted by the Beijing government, such as ban vehicles with even and odd-numbered license plates on alternate days from July 20 to September 20. The decrease in man-made emission sources of trace gases alleviates air pollution in Beijing. The total column amounts of CH4 and N2O are shown in Figure 14 and Figure 15. There are almost no variations in the CH4 and N2O total column amount. The results of these three trace gases were not validated due to the lack of validation data.
4. Summary
The clear sky solar absorption spectra were recorded with a ground-based spectrometer B3M-IR during the Olympic Games in Beijing, from which the total columns and vertical VMR profiles of O3, CO, CH4 and N2O were derived. The residues of spectral fit indicate that the measured data were reliable and the retrieval was successful. Lacking validation data, only the total columns of O3 were compared with those derived from MAX-DOAS measurements. Due to the coarse spectral resolution of B3M-IR and a mismatch in data acquisition time, the average relative error was slightly large, amounting to 6.5% overall. There seems a decreasing trend in O3 total column amount but it is not significant, and almost no variations in the CH4 and N2O total column amount. Regarding the CO total column amount, there is a significant linear decreasing, and R2 reaches 0.61. The total column amount decrease of CO indicates that the government’s “ban vehicles with even and odd-numbered license plates on alternate days from July 20 to September 20” policy is taking effect.
Supplementary Materials
Reviewers’ comments and authors’ reply are available online at https://www.mdpi.com/2413-4155/1/1/23/s1.
Funding
This work was partly supported by the National Key Research and Development Program of China via grant 2016YFA0600101, the National Natural Science Foundation of China via grant 41771365, and the National Natural Science Foundation of China via grant 41371323.
Acknowledgments
The authors would like to thank N. Jones at the University of Wollongong, Australia for providing the SFIT2 code and helpful advice. We would also like to thank C. P. Rinsland of the NASA Langley Research Center for his encouragement and kind help.
Conflicts of Interest
The author declares no conflict of interest.
References
- Farman, J.C.; Gardiner, B.G.; Shanklin, J.D. Large loss of total ozone in antarctica reveal seasonal clox/nox interaction. Nature 1985, 315, 207–210. [Google Scholar] [CrossRef]
- Aumann, H.; Chanhine, M.T.; Gautier, C. AIRS/AMSU/HSB on the aqua mission: Design, science objectives, data products, and processing systems. IEEE Trans. Geosci. Remote Sens. 2003, 41, 253–264. [Google Scholar] [CrossRef]
- Russell, J.M.I.; Gordley, L.L.; Park, J.H.; Drayson, S.R.; Hesketh, W.D.; Cicerone, R.J.; Tuck, A.F.; Frederick, J.E.; Harries, J.E.; Crutzen, P.J. The halogen occulation experiment. J. Geophys. Res. 1993, 98, 10777–10797. [Google Scholar] [CrossRef]
- Kurylo, M.J.; Zander, R. The NDSC--its status after 10 years of operation. In Proceedings of the 19th Quadrennial Ozone Symposium, Sapporo, Japan, 3–8 July 2000; Hokkaido University: Sapporo, Japan, 2000; pp. 167–168. [Google Scholar]
- Pougatchev, N.S.; Connor, B.J.; Jones, N.B.; Rinsland, C.P. Validation of ozone retrievals from ground-based solar spectra. Geophys. Res. Lett. 1996, 23, 1637–1640. [Google Scholar] [CrossRef]
- Rinsland, C.P.; Mahieu, E.; Zander, R.; Jones, N.B.; Chipperfield, M.P.; Goldman, A. Long-term of inorganic chlorine from ground-based infrared solar spectra: Past increases and evidence for stablization. J. Geophys. Res. 2003, 108, 4252–4273. [Google Scholar] [CrossRef]
- Wei, H.; HU, H. Measurement of atmospheric pollution gas NO2 column abundance from ground based solar spectra. J. Remote Sens. 2001, 2001, 220–226. [Google Scholar]
- Fu, Q.; Liu, W.; Si, S.; Zhang, Y.; Xie, P. Determination of the vertical column density of trace gas measured by max-doas. Acta Photon. Sin. 2009, 38, 1216–1220. [Google Scholar]
- Hase, F.; Blumenstock, T.; Paton-Was, C. Analysis of the instrumental line shape of high-resolution fourier transform ir spectrometers with gas cell measurements and new retrieval software. Appl. Opt. 1999, 38, 109–113. [Google Scholar] [CrossRef]
- Wei, H.; Ren, L.; Fan, D.; Soucy, M.-A. Performance of portable high-resolution fourier transform spectrometer for trace gas remote sensing. In Proceedings of the SPIE 8562, Infrared, Millimeter-Wave, and Terahertz Technologies II, Beijing, China, 5 December 2012; Volume 8562. [Google Scholar]
- Wiacek, A.; Taylor, J.R.; Strong, K.; Saari, R.; Kerzenmacher, T.E.; Jones, N.B.; Griffith, D.W.T. Ground-based solar absorption ftir spectroscopy: Characteriation of retrievals and first results from a novel optical design instrument at a new ndacc complementary station. J. Atmos. Ocean. Technol. 2007, 24, 432–448. [Google Scholar] [CrossRef]
- Berk, A.; Anderson, G.; Acharya, P.; Hoke, M.; Chetwynd, J.; Bernstein, L.; Shettle, E.; Matthew, M.; Adler-Golder, S. Modtran4 Version 3 Revision 1 User’s Manual; Air Force Research Laboratory: Hanscom Air Force Base, MA, USA, 2003. [Google Scholar]
- Rothman, L.S.; Jacquemart, D.; Barbe, A.; Benner, D.C.; Birk, M.; Brown, L.R. The hitran 2004 molecular spectroscopic database. J. Quant. Spectrosc. Radiat. Transf. 2005, 96, 139–204. [Google Scholar] [CrossRef]
- Meier, A.; Toon, G.C.; Rinsland, C.P.; Goldman, A.; Hase, F. Spectroscopic Atlas of Atmospheric Microwindows in the Middle Infra-Red; Swedish Institute of Space Physics: Kiruna, Sweden, 2004. [Google Scholar]
- Rodgers, C.D. Inverse Methods for Atmospheric Sounding: Theory and Practice; World Scientific: Singapore, 2000. [Google Scholar]
- Koner, P.K.; Drummond, J.R. Atmospheric trace gases profile retrievals using the nonlinear regularized total least squares method. J. Quant. Spectrosc. Radiat. Transf. 2008, 109, 2045–2059. [Google Scholar] [CrossRef]
- Rodgers, C.D. Retrieval of atmospheric temperature and composition from remoted measurements of thermal radiation. Rev. Geophys. Space Phys. 1976, 14, 609–633. [Google Scholar] [CrossRef]
- Rodgers, C.D. Characterization and error analysis of profiles retrieved from remote sensing sounding measurements. J. Geophys. Res. 1990, 95, 5587–5595. [Google Scholar] [CrossRef]
- Rinsland, C.P.; Jones, N.B.; Connor, B.J.; Logan, J.A.; Pougatchev, N.S.; Goldman, A.; Murray, F.J.; Stephen, T.M.; Pine, A.S.; Zander, R.; et al. Northern and southern hemisphere ground-based infrared spectroscopic measurements of tropospheric carbon monoxide and methane. J. Geophys. Res. 1999, 102, 28197–28217. [Google Scholar]
- Rinsland, C.P.; Goldman, A.; Connor, B.J.; Stephen, T.M.; Jones, N.B.; Wood, S.W.; Murcray, F.J.; David, S.J.; Blatherwick, R.D.; Zander, R.; et al. Correlation relationships of stratospheric moleculer constituents from high sepctral resolution ground-based infrared solar absorption spectra. J. Geophys. Res. 2000, 105, 14637–14652. [Google Scholar] [CrossRef]
- Hase, F.; Hannigan, J.W.; Coffey, M.T.; Goldman, A.; Hophner, M.; Jones, N.B.; Rinsland, C.P.; Wood, S.W. Intercomparison of retrieval codes used for the analysis of high-resolution, ground-based FTIR measurements. J. Quant. Spectrosc. Radiat. Transf. 2004, 87, 25–52. [Google Scholar] [CrossRef]
- Galley, W.O.; Kneizys, F.X.; Clough, S.A. Air Mass Computer Program For Atmospheric Transmittance/Radiance Calculation: FSCATM; Report AFGL-TR-83-0065; ERP 828 Air Force Geophysics Laboratory: Hanscom Airforce Base, MA, USA, 1983. [Google Scholar]
- Meier, A.; Goldman, A.; Manning, P.S.; Stephen, T.M.; Rinsland, C.P.; Jones, N.B.; Wood, S.W. Improvements to air mass calculations for ground-based infrared measurements. J. Quant. Spectrosc. Radiat. Transf. 2004, 83, 109–113. [Google Scholar] [CrossRef]
- Notholt, J.; Toon, G.C.; Rinsland, C.P.; Pougatchev, N.S.; Jones, N.B.; Connor, B.J.; Weller, R.; Gautrois, M.; Schrems, O. Latitudinal variations of trace gas concentrations in the free troposphere measured by solar absorption spectroscopy during a ship cruise. J. Geophys. Res. 2000, 105, 1337–1349. [Google Scholar] [CrossRef]
- Taylor, J.R.; Wunch, D.; Midwinter, D.; Wiacek, A.; Drummnd, J.R.; Strong, K. An extended intercomparison of simultaneous ground-based fourier transform infrared spectrometer measurements at the Toronto Atmospheric Observatory. J. Quant. Spectrosc. Radiat. Transf. 2008, 109, 2244–2260. [Google Scholar] [CrossRef]
- Sung, K.; Skelton, R.; Walker, K.A.; Boone, C.D.; Fu, D.; Bernath, P.F. N2O and O3 arctic column amounts from PARIS-IR observations: Retrievals, characterization and error analysis. J. Quant. Spectrosc. Radiat. Transf. 2007, 107, 385–406. [Google Scholar] [CrossRef]
Figure 1.
(a) The observed and fitted CO line, with residuals shown in the lower panel; (b) Retrieved phase error and modulation efficiency from the CO cell [10].
Figure 1.
(a) The observed and fitted CO line, with residuals shown in the lower panel; (b) Retrieved phase error and modulation efficiency from the CO cell [10].

Figure 2.
The SNR of B3M-IR.using (a) an MCT detector; (b) an InSb detector [10].
Figure 2.
The SNR of B3M-IR.using (a) an MCT detector; (b) an InSb detector [10].

Figure 3.
Example of fits and residuals for O3 in three selected microwindows.

Figure 4.
Example of a total column averaging kernel for O3.

Figure 5.
Example of fits and residuals for CO in three selected microwindows.

Figure 6.
Example of a total column averaging kernel for CO.

Figure 7.
Example of fits and residuals for CH4 in three selected microwindows.

Figure 8.
Example of a total column averaging kernel for CH4.

Figure 9.
Example of fits and residuals for N2O in three selected microwindows.

Figure 10.
Example of total column averaging kernel for N2O.

Figure 11.
Examples of trace gas VMR retrieval. (a) O3; (b) CO; (c) CH4; (d) N2O.


Figure 12.
Comparison of B3M-IR total column of O3 with that from MAX-DOAS.

Figure 13.
Time series of CO total column derived from B3M-IR measurements.

Figure 14.
Time series of CH4 total column derived from B3M-IR measurements.

Figure 15.
Time series of N2O total column derived from B3M-IR measurements.


Table 1.
Microwindows and interferences used in the trace gas retrieval from B3M-IR measurements.
| Target Gas | Microwindow (cm−1) | Interfering Gases | SNR |
|---|---|---|---|
| O3 | 2775.5814–2776.3923 | CH4, CO2, HCl, N2O | ~500 |
| 2778.7756–2779.4882 | CH4, HDO, N2O | ~550 | |
| 2781.4784–2782.0927 | CH4, HDO, N2O, CO2 | ~520 | |
| CO | 2057.6834–2057.9906 | CO2, OCS, O3, H2O | ~320 |
| 2069.4775–2069.7969 | CO2, OCS, O3, H2O | ~340 | |
| 2157.4779–2159.8981 | N2O, H2O, O3, CO2 | ~300 | |
| CH4 | 2859.7856–2860.2894 | H2O, O3, HCL | ~525 |
| 2898.2758–2898.9884 | ~475 | ||
| 2903.5831–2904.1974 | ~360 | ||
| N2O | 2481.0756–2482.4884 | H2O, CO2, O3, CH4 | ~270 |
© 2019 by the author. Licensee MDPI, Basel, Switzerland. This article is an open access article distributed under the terms and conditions of the Creative Commons Attribution (CC BY) license (http://creativecommons.org/licenses/by/4.0/).
Share and Cite
MDPI and ACS Style
Cheng, J. Ground-based Measurements of Atmospheric Trace Gases in Beijing during the Olympic Games. Sci 2019, 1, 23. https://doi.org/10.3390/sci1010023
AMA Style
Cheng J. Ground-based Measurements of Atmospheric Trace Gases in Beijing during the Olympic Games. Sci. 2019; 1(1):23. https://doi.org/10.3390/sci1010023
Chicago/Turabian StyleCheng, Jie. 2019. "Ground-based Measurements of Atmospheric Trace Gases in Beijing during the Olympic Games" Sci 1, no. 1: 23. https://doi.org/10.3390/sci1010023