
Advantages of IoT-Based Geotechnical Monitoring Systems Integrating Automatic Procedures for Data Acquisition and Elaboration


Abstract
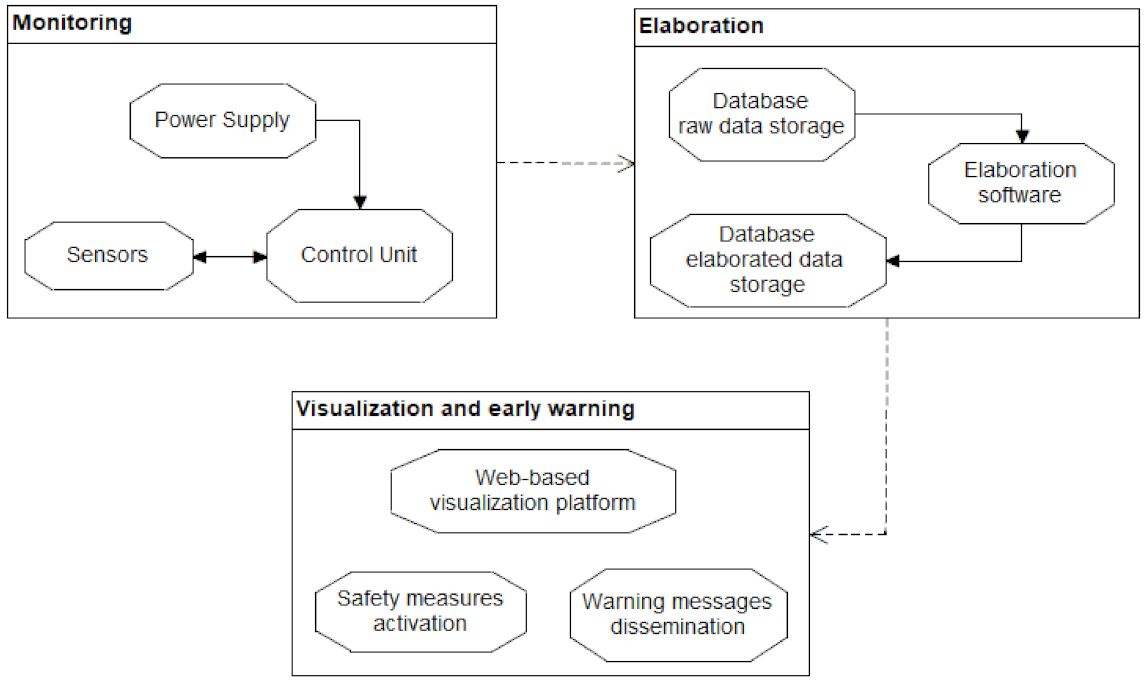
:1. Introduction
- -
- The perception layer, consisting of a network of connected sensors responsible for collecting the data and transmit them to the elaboration center;
- -
- The data layer, which entails dataset storage and elaboration. This is an essential component in an IoT-based system since traditional approaches are usually unable to manage the amount of data generated by an automatic system;
- -
- The presentation layer, where monitoring outcomes are represented and made available for the end-user through dedicated mobile applications or web-based services.
2. Materials and Methods
2.1. Control Unit
2.2. Sensors
2.3. Data Transmission and Storage
2.4. Elaboration and Self-Check Controls
- Recognition of spike noise;
- Coherence of gravity acceleration vector;
- Variability of gravity acceleration vector;
- Coherence of magnetic field vector;
- VVariability of magnetic field vector;
- Coherence of node temperature;
- Running average;
- Recognition of instrumental noise;
- Recognition of not-operating sensors.
2.4.1. Recognition of Spike Noise (I)
- is the data to be evaluated;
- is the complementary error function;
- is the error function [30].
- is the identification process of outlier i;
- is the sampling period;
- is the frequency of data transmission;
- represents the dimension of the dataset window.
2.4.2. Coherence and Variability of Gravity Acceleration and Magnetic Field Vector (II, III, IV and V)
2.4.3. Running Average (VII)
2.5. Web Platform and Alarms
3. Results and Discussion
4. Conclusions
Author Contributions
Funding
Institutional Review Board Statement
Informed Consent Statement
Data Availability Statement
Conflicts of Interest
References
- Dunnicliff, J.; Marr, W.A.; Standing, J. Principles of geotechnical monitoring. In ICE Manual of Geotechnical Engineering: Volume II; Burland, J., Chapman, T., Skinner, H., Brown, M., Eds.; Thomas Telford Ltd.: London, UK, 2012; pp. 1363–1377. [Google Scholar] [CrossRef]
- Zhang, Y.F.; Cai, M.F. Geotechnical Engineering Intelligent Monitoring and Controlling System and its Application in Pit Engineering. Appl. Mech. Mater. 2011, 105-107, 1561–1566. [Google Scholar] [CrossRef]
- Valletta, A.; Carri, A.; Segalini, A. Innovative monitoring instruments as support tools for natural risks management. Rendiconti Online della Società Geologica Italiana 2019, 48, 76–83. [Google Scholar] [CrossRef]
- Giorgetti, A.; Lucchi, M.; Tavelli, E.; Barla, M.; Gigli, G.; Casagli, N.; Chiani, M.; Dardari, D. A Robust Wireless Sensor Network for Landslide Risk Analysis: System Design, Deployment, and Field Testing. IEEE Sensors J. 2016, 16, 6374–6386. [Google Scholar] [CrossRef]
- El Moulat, M.; Debauche, O.; Mahmoudi, S.; Brahim, L.A.; Manneback, P.; Lebeau, F. Monitoring System Using Internet of Things For Potential Landslides. Procedia Comput. Sci. 2018, 134, 26–34. [Google Scholar] [CrossRef]
- Lo, H.-C.; Hsu, S.-M.; Chou, P.-Y.; Ke, C.-C. Mitigating drought and landslide simultaneously for mountain tribes of Taiwan: Hydrogeological investigation, modelling, and development of an intelligent hazard prevention system. Nat. Hazards 2020, 103, 3101–3121. [Google Scholar] [CrossRef]
- Abraham, M.T.; Satyam, N.; Pradhan, B.; Alamri, A.M. IoT-Based Geotechnical Monitoring of Unstable Slopes for Landslide Early Warning in the Darjeeling Himalayas. Sensors 2020, 20, 2611. [Google Scholar] [CrossRef]
- Bai, D.; Tang, J.; Lu, G.; Zhu, Z.; Liu, T.; Fang, J. The design and application of landslide monitoring and early warning system based on microservice architecture. Geomat. Nat. Hazards Risk 2020, 11, 928–948. [Google Scholar] [CrossRef]
- Oguz, E.A.; Robinson, K.; Depina, I.; Thakur, V. IoT-Based Strategies for Risk Management of Rainfall-Induced Landslides: A Review. In Proceedings of the 7th International Symposium on Geotechnical Safety and Risk (ISGSR 2019), Taipei, Taiwan, 11–13 December 2019; Research Publishing Services: Singapore, 2019; pp. 733–738. [Google Scholar]
- Chaturvedi, P.; Thakur, K.K.; Mali, N.; Kala, V.U.; Kumar, S.; Yadav, S.; Dutt, V. A low-cost iot framework for landslide prediction and risk communication. In Internet of Things A to Z; Hasan, Q., Ed.; John Wiley & Sons: Hoboken, NJ, USA, 2018; pp. 593–610. [Google Scholar]
- Butler, M.; Angelopoulos, M.; Mahy, D. Efficient IoT-enabled landslide monitoring. In Proceedings of the 2019 IEEE 5th World Forum on Internet of Things (WF-IoT), Limerick, Ireland, 15–18 April 2019; pp. 171–176. [Google Scholar]
- Terzis, A.; Anandarajah, A.; Moore, K.; Wang, I.-J. Slip surface localization in wireless sensor networks for landslide prediction. In Proceedings of the 5th International Conference on Information Processing in Sensor Networks, Nashville, TN, USA, 19–29 April 2006; Association for Computing Machinery: New York, NY, USA, 2006; pp. 109–116. [Google Scholar]
- Aggarwal, S.; Mishra, P.K.; Sumakar, K.V.S.; Chaturvedi, P. Landslide Monitoring System Implementing IOT Using Video Camera. In Proceedings of the 3rd International Conference for Convergence in Technology (I2CT), Prune, India, 6–8 April 2018; Institute of Electrical and Electronics Engineers (IEEE): Piscawatay, NJ, USA, 2018; pp. 1–4. [Google Scholar]
- Xie, Y.; Liu, J. Analysis of early-warning threshold for metro construction collapse risk based on D-S evidence theory and rough set. Wuhan Univ. J. Nat. Sci. 2017, 22, 510–516. [Google Scholar] [CrossRef]
- Wang, M.; Xiao, J.; Rong, X. Remote Monitoring and Early Warning System for Subway Construction. Pavement Geotech. Eng. Transp. 2013, 135–141. [Google Scholar] [CrossRef]
- Ding, L.Y.; Zhou, C.; Deng, Q.X.; Luo, H.B.; Ye, X.W.; Ni, Y.Q.; Guo, P. Real-time safety early warning system for cross passage construction in Yangtze Riverbed Metro Tunnel based on the internet of things. Autom. Constr. 2013, 36, 25–37. [Google Scholar] [CrossRef]
- Wang, L.; Xu, S.; Qiu, J.; Wang, K.; Ma, E.; Li, C.; Guo, C. Automatic Monitoring System in Underground Engineering Construction: Review and Prospect. Adv. Civ. Eng. 2020, 2020, 1–16. [Google Scholar] [CrossRef]
- Liu, Q.; Lu, G.; Huang, J.; Bai, D. Development of tunnel intelligent monitoring and early warning system based on micro-service architecture: The case of AnPing tunnel. Geomatics Nat. Hazards Risk 2020, 11, 1404–1425. [Google Scholar] [CrossRef]
- Segalini, A.; Carri, A.; Valletta, A.; Cavalca, E. Internet-of-Things principles applied to geotechnical monitoring activities: The Internet of Natural Hazards (IoNH) approach. In Proceedings of the 3rd ICITG—International Conference on Information Technology in Geo-Engineering, Guimaraes, Portugal, 29 September–02 October 2019. [Google Scholar]
- Huang, J.; Huang, R.; Ju, N.; Xu, Q.; He, C. 3D WebGIS-Based Platform for Debris Flow Early Warning: A Case Study. Eng. Geol. 2015, 197, 57–66. [Google Scholar] [CrossRef]
- Reid, M.E.; Lahusen, R.G.; Baum, R.L.; Kean, J.W.; Schulz, W.H.; Highland, L.M. Real-Time Monitoring of Landslides. Report No. 2012–3008, Fact Sheet; USGS Publications: Reston, VA, USA, 2012. [Google Scholar] [CrossRef] [Green Version]
- Segalini, A.; Chiapponi, L.; Pastarini, B.; Carini, C. Automated Inclinometer Monitoring Based on Micro Electro-Mechanical System Technology: Applications and Verification. In Proceedings of the Landslide Science for a Safer Geoenvironment; Sassa, K., Canuti, P., Yin, Y., Eds.; Springer: New York, NY, USA, 2014; pp. 595–600. [Google Scholar]
- Reid, M.E.; Baum, R.L.; LaHusen, R.G.; Ellis, W.L. Capturing landslide dynamics and hydrologic triggers using near-real-time monitoring. In Landslides and Engineering Slopes—From the past to the future. Proceedings of the 10th International Symposium on Landslides and Engineered Slopes; Chen, Z., Zhang, J.-M., Ho, K., Wu, F.-Q., Li, Z.-K., Chen, Z., Zhang, J.-M., Ho, K., Wu, F.-Q., Li, Z.-K., Eds.; Taylonr and Francis: Abingdon, UK, 2008. [Google Scholar]
- Segalini, A.; Giovannelli, R.; Chiapponi, L.; Carri, A. Integrated Analysis of Data Collected by an Innovative Monitoring System and Results of a 3D Numerical Model in Boschetto Landslide. In Landslides and Engineered Slopes. Experience, Theory and Practice: Proceedings of the 12th International Symposium on Landslides, Napoli, Italy, 12–19 June 2016; Aversa, S., Cascini, L., Picarelli, L., Scavia, C., Eds.; CRC Press: Boca Raton, FL, USA, 2016; pp. 579–585. [Google Scholar]
- Tinti, F.; Carri, A.; Kasmaee, S.; Valletta, A.; Segalini, A.; Bonduà, S.; Bortolotti, V. Ground temperature monitoring for a coaxial geothermal heat exchangers field: Practical aspects and main issues from the first year of measurements. Min. Geol. Pet. Eng. Bull. 2018, 33, 47–57. [Google Scholar] [CrossRef] [Green Version]
- Lunardi, P.; Gatti, M. Tunnel monitoring system—A contribution for the preparation of guidelines. In Proceedings of the ITA—AITES 2010 World Tunnel Congress—WTC “Tunnel vision towards 2020”, Vancouver, Canada, 14–20 May 2010. [Google Scholar]
- Carri, A. Innovative Monitoring Instrumentations and Methods for Landslide Risk Management and Mitigation. PhD. Thesis, Department of Engineering and Architecture, University of Parma, Parma, Italy, 2019. Available online: https://hdl.handle.net/1889/3734 (accessed on 18 December 2017).
- Zhang, H.; Wu, Y. Removing spike noise from track alignment irregularities measures using an iteration filter. In Proceedings of the 2017 5th International Conference on Computer-Aided Design Manufacturing Modeling and Simulation (CDMMS 2017); AIP Publishing: Melville, NY, USA, 2017; Volume 1834, p. 30007. [Google Scholar]
- Hoaglin, D.C.; Mosteller, F.; Tukey, J.W. Understanding Robust and Exploratory Data Analysis; John Wiley & Sons: Hoboken, NY, USA, 2006; p. 404. ISBN 0-471-09777-2. [Google Scholar]
- Glaisher, J. XXXII. On a class of definite integrals. Lond. Edinb. Dublin Philos. Mag. J. Sci. 1871, 42, 294–302. [Google Scholar] [CrossRef]
- Allasia, P.; Manconi, A.; Giordan, D.; Baldo, M.; Lollino, G. ADVICE: A New Approach for Near-Real-Time Monitoring of Surface Displacements in Landslide Hazard Scenarios. Sensors 2013, 13, 8285–8302. [Google Scholar] [CrossRef] [Green Version]
- Storm, K. Introduction to construction statistics using Excel. In Industrial Process Plant Construction Estimating and Man-Hour Analysis; Gulf Professional Publishing: Houston, TX, USA, 2019; pp. 1–21. [Google Scholar]
- Frigerio, S.; Schenato, L.; Bossi, G.; Cavalli, M.; Mantovani, M.; Marcato, G.; Pasuto, A. A web-based platform for automatic and continuous landslide monitoring: The Rotolon (Eastern Italian Alps) case study. Comput. Geosci. 2014, 63, 96–105. [Google Scholar] [CrossRef]
- Carlà, T.; Intrieri, E.; Di Traglia, F.; Nolesini, T.; Gigli, G.; Casagli, N. Guidelines on the use of inverse velocity method as a tool for setting alarm thresholds and forecasting landslides and structure collapses. Landslides 2017, 14, 517–534. [Google Scholar] [CrossRef] [Green Version]
- Bicocchi, G.; D’Ambrosio, M.; Rossi, G.; Rosi, A.; Tacconi-Stefanelli, C.; Segoni, S.; Nocentini, M.; Vannocci, P.; Tofani, V. Geotechnical in situ measures to improve landslides forecasting models: A case study in Tuscany (Central Italy). In Landslides and Engineered Slopes. Experience, Theory and Practice, Proceedings of the 12th International Symposium on Landslides, Napoli, Italy, 12–19 June 2016; Aversa, S., Cascini, L., Picarelli, L., Scavia, C., Eds.; Taylor and Francis: Boca Raton, FL, USA; CRC Press: Abingdon, London, UK; pp. 419–424.
- Krkač, M.; Arbanas, S.M.; Arbanas, Ž.; Bernat, S.; Špehar, K.; Watanabe, N.; Nagai, O.; Sassa, K.; Marui, H.; Furuya, G.; et al. Review of monitoring parameters of the Kostanjek landslide (Zagreb, Croatia). In Landslide Science for a Safer Geoenvironment; Sassa, K., Canuti, P., Yin, Y., Eds.; Springer: Cham, Switzerland, 2014; pp. 637–643. [Google Scholar]
- Fukuzono, T. A new method for predicting the failure time of a slope. In Proceedings of the 4th International Conference and Field Workshop on Landslides, Tokyo, Japan, 23–31 August 1985; Tokyo University Press: Tokyo, Japan, 1985; pp. 145–150. [Google Scholar]
- Voight, B. A method for prediction of volcanic eruptions. Nat. Cell Biol. 1988, 332, 125–130. [Google Scholar] [CrossRef]
- Rose, N.; Hungr, O. Forecasting potential rock slope failure in open pit mines using the inverse-velocity method. Int. J. Rock Mech. Min. Sci. 2007, 44, 308–320. [Google Scholar] [CrossRef]
- Zimmer, V.L.; Sitar, N. Detection and location of rock falls using seismic and infrasound sensors. Eng. Geol. 2015, 193, 49–60. [Google Scholar] [CrossRef] [Green Version]
- Hajovsky, R.; Pies, M.; Velicka, J. Monitoring the condition of the protective fence above the railway track. IFAC Pap. OnLine 2019, 52, 145–150. [Google Scholar] [CrossRef]
- Yan, Y.; Li, T.; Liu, J.; Wang, W.; Su, Q. Monitoring and early warning method for a rockfall along railways based on vibration signal characteristics. Sci. Rep. 2019, 9, 1–10. [Google Scholar] [CrossRef] [PubMed]
- Segalini, A.; Valletta, A.; Carri, A.; Cavalca, E. Monitoring of a retaining wall with innovative multi-parameter tools. In Proceedings of the 4th Regional Symposium on Landslides in the Adriatic—Balkan Region, Sarajevo, Bosnia and Herzegovina, 23–25 October 2019; Uljarević, M., Zekan, S., Salković, S., Ibrahimović, D., Eds.; Geotechnical Society of Bosnia and Herzegovina: Sarajevo, October, 2019. [Google Scholar] [CrossRef]


Publisher’s Note: MDPI stays neutral with regard to jurisdictional claims in published maps and institutional affiliations. |
© 2021 by the authors. Licensee MDPI, Basel, Switzerland. This article is an open access article distributed under the terms and conditions of the Creative Commons Attribution (CC BY) license (http://creativecommons.org/licenses/by/4.0/).
Share and Cite
Carri, A.; Valletta, A.; Cavalca, E.; Savi, R.; Segalini, A. Advantages of IoT-Based Geotechnical Monitoring Systems Integrating Automatic Procedures for Data Acquisition and Elaboration. Sensors 2021, 21, 2249. https://doi.org/10.3390/s21062249
Carri A, Valletta A, Cavalca E, Savi R, Segalini A. Advantages of IoT-Based Geotechnical Monitoring Systems Integrating Automatic Procedures for Data Acquisition and Elaboration. Sensors. 2021; 21(6):2249. https://doi.org/10.3390/s21062249
Chicago/Turabian StyleCarri, Andrea, Alessandro Valletta, Edoardo Cavalca, Roberto Savi, and Andrea Segalini. 2021. "Advantages of IoT-Based Geotechnical Monitoring Systems Integrating Automatic Procedures for Data Acquisition and Elaboration" Sensors 21, no. 6: 2249. https://doi.org/10.3390/s21062249