
Measuring Nanoscale Distances by Structured Illumination Microscopy and Image Cross-Correlation Spectroscopy (SIM-ICCS)

 ,
,  , and
, and 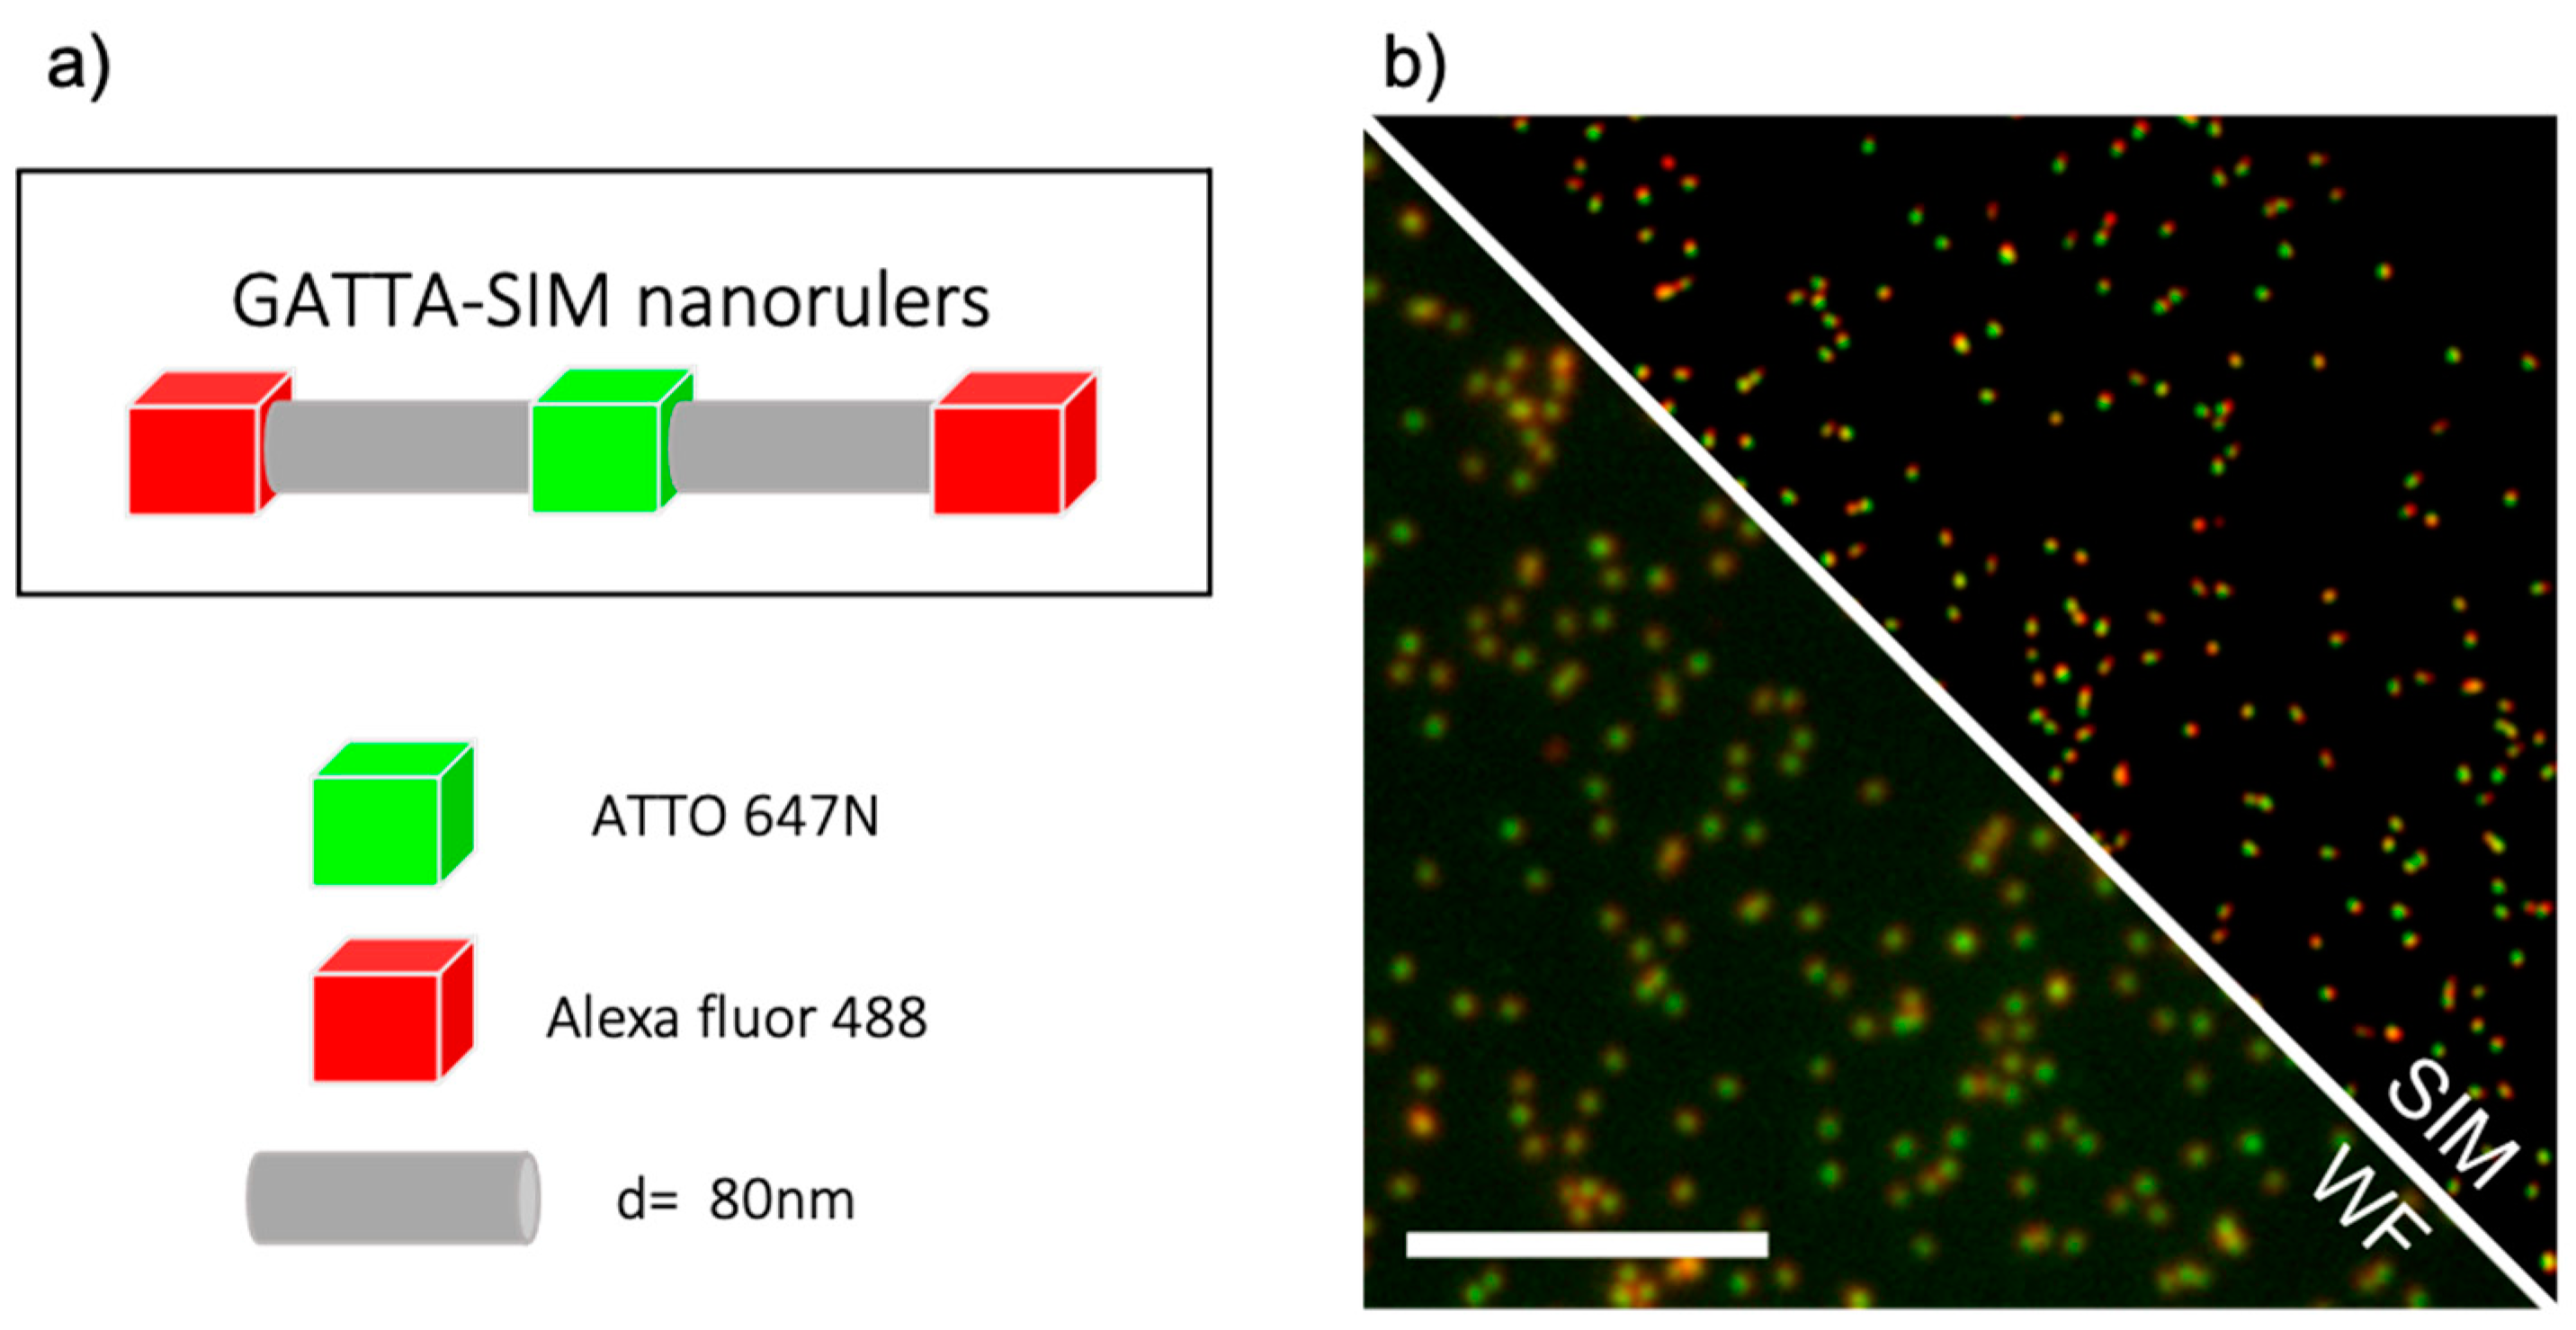
Abstract
:1. Introduction
2. Materials and Methods
2.1. Samples
2.2. Immunostaining
2.3. Experiments
2.4. Image Cross Correlation Spectroscopy (ICCS) Analysis
2.5. Object-Based Analysis
3. Results
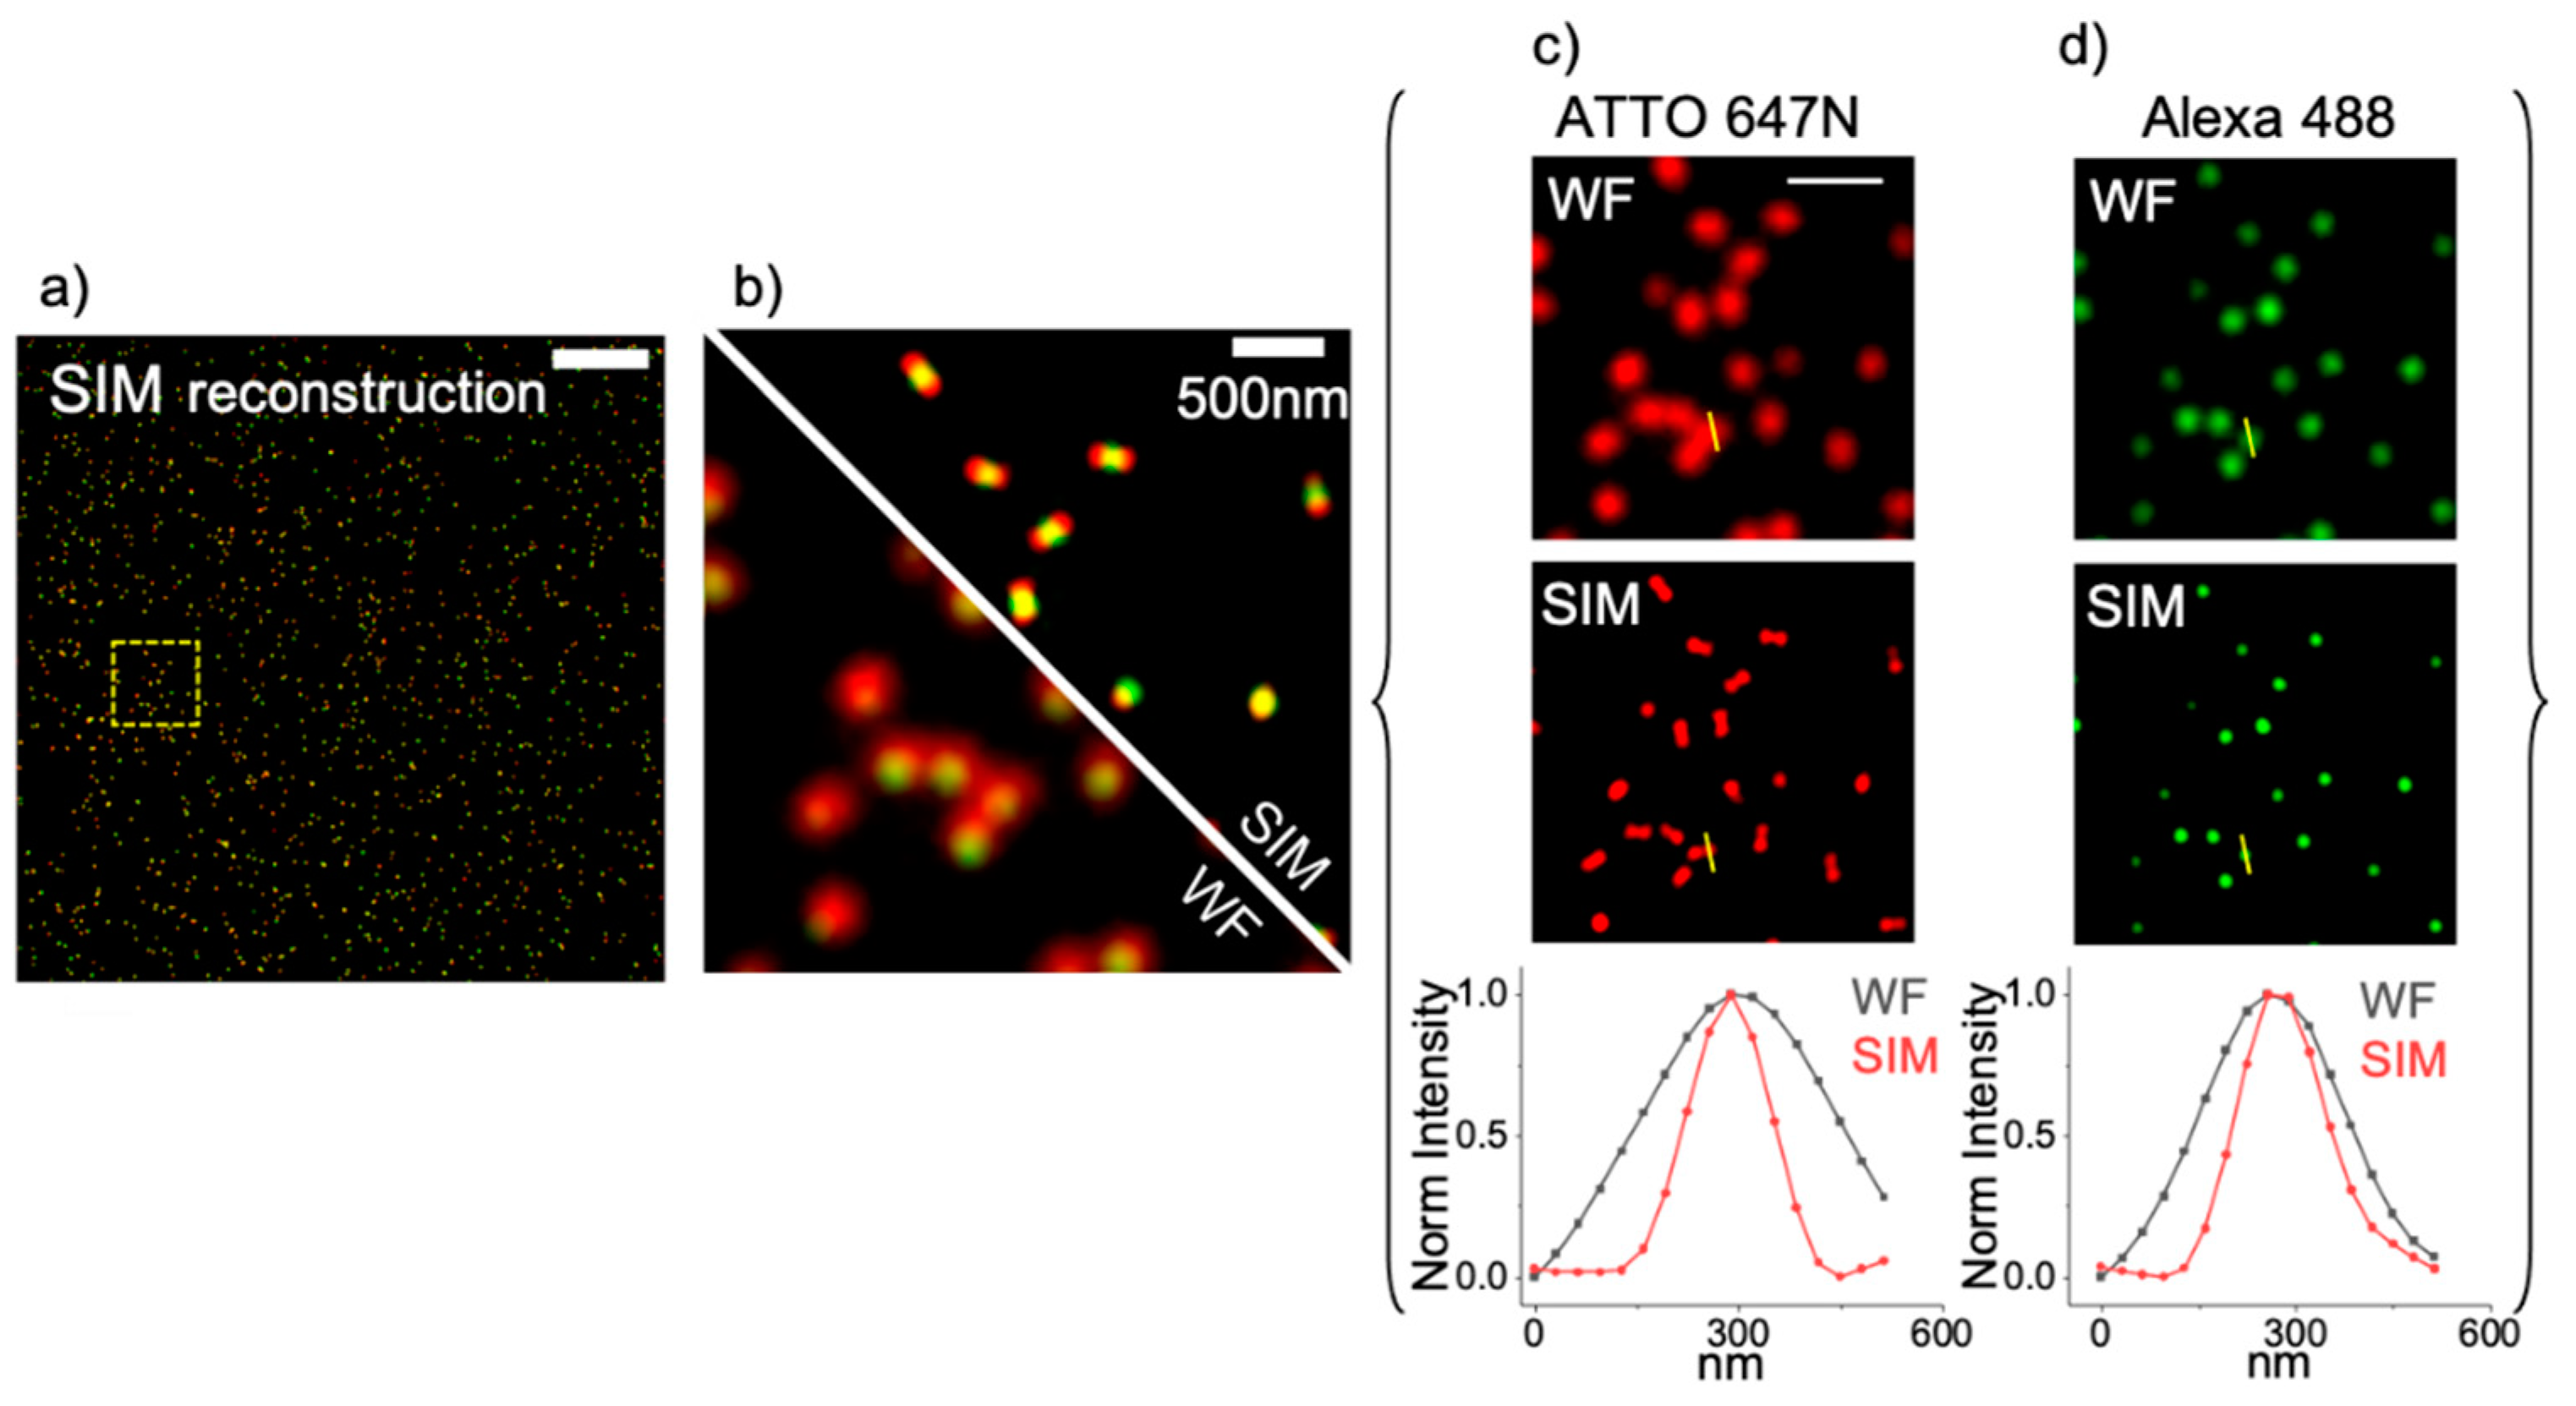
3.1. SIM Imaging of Optical Nanorulers
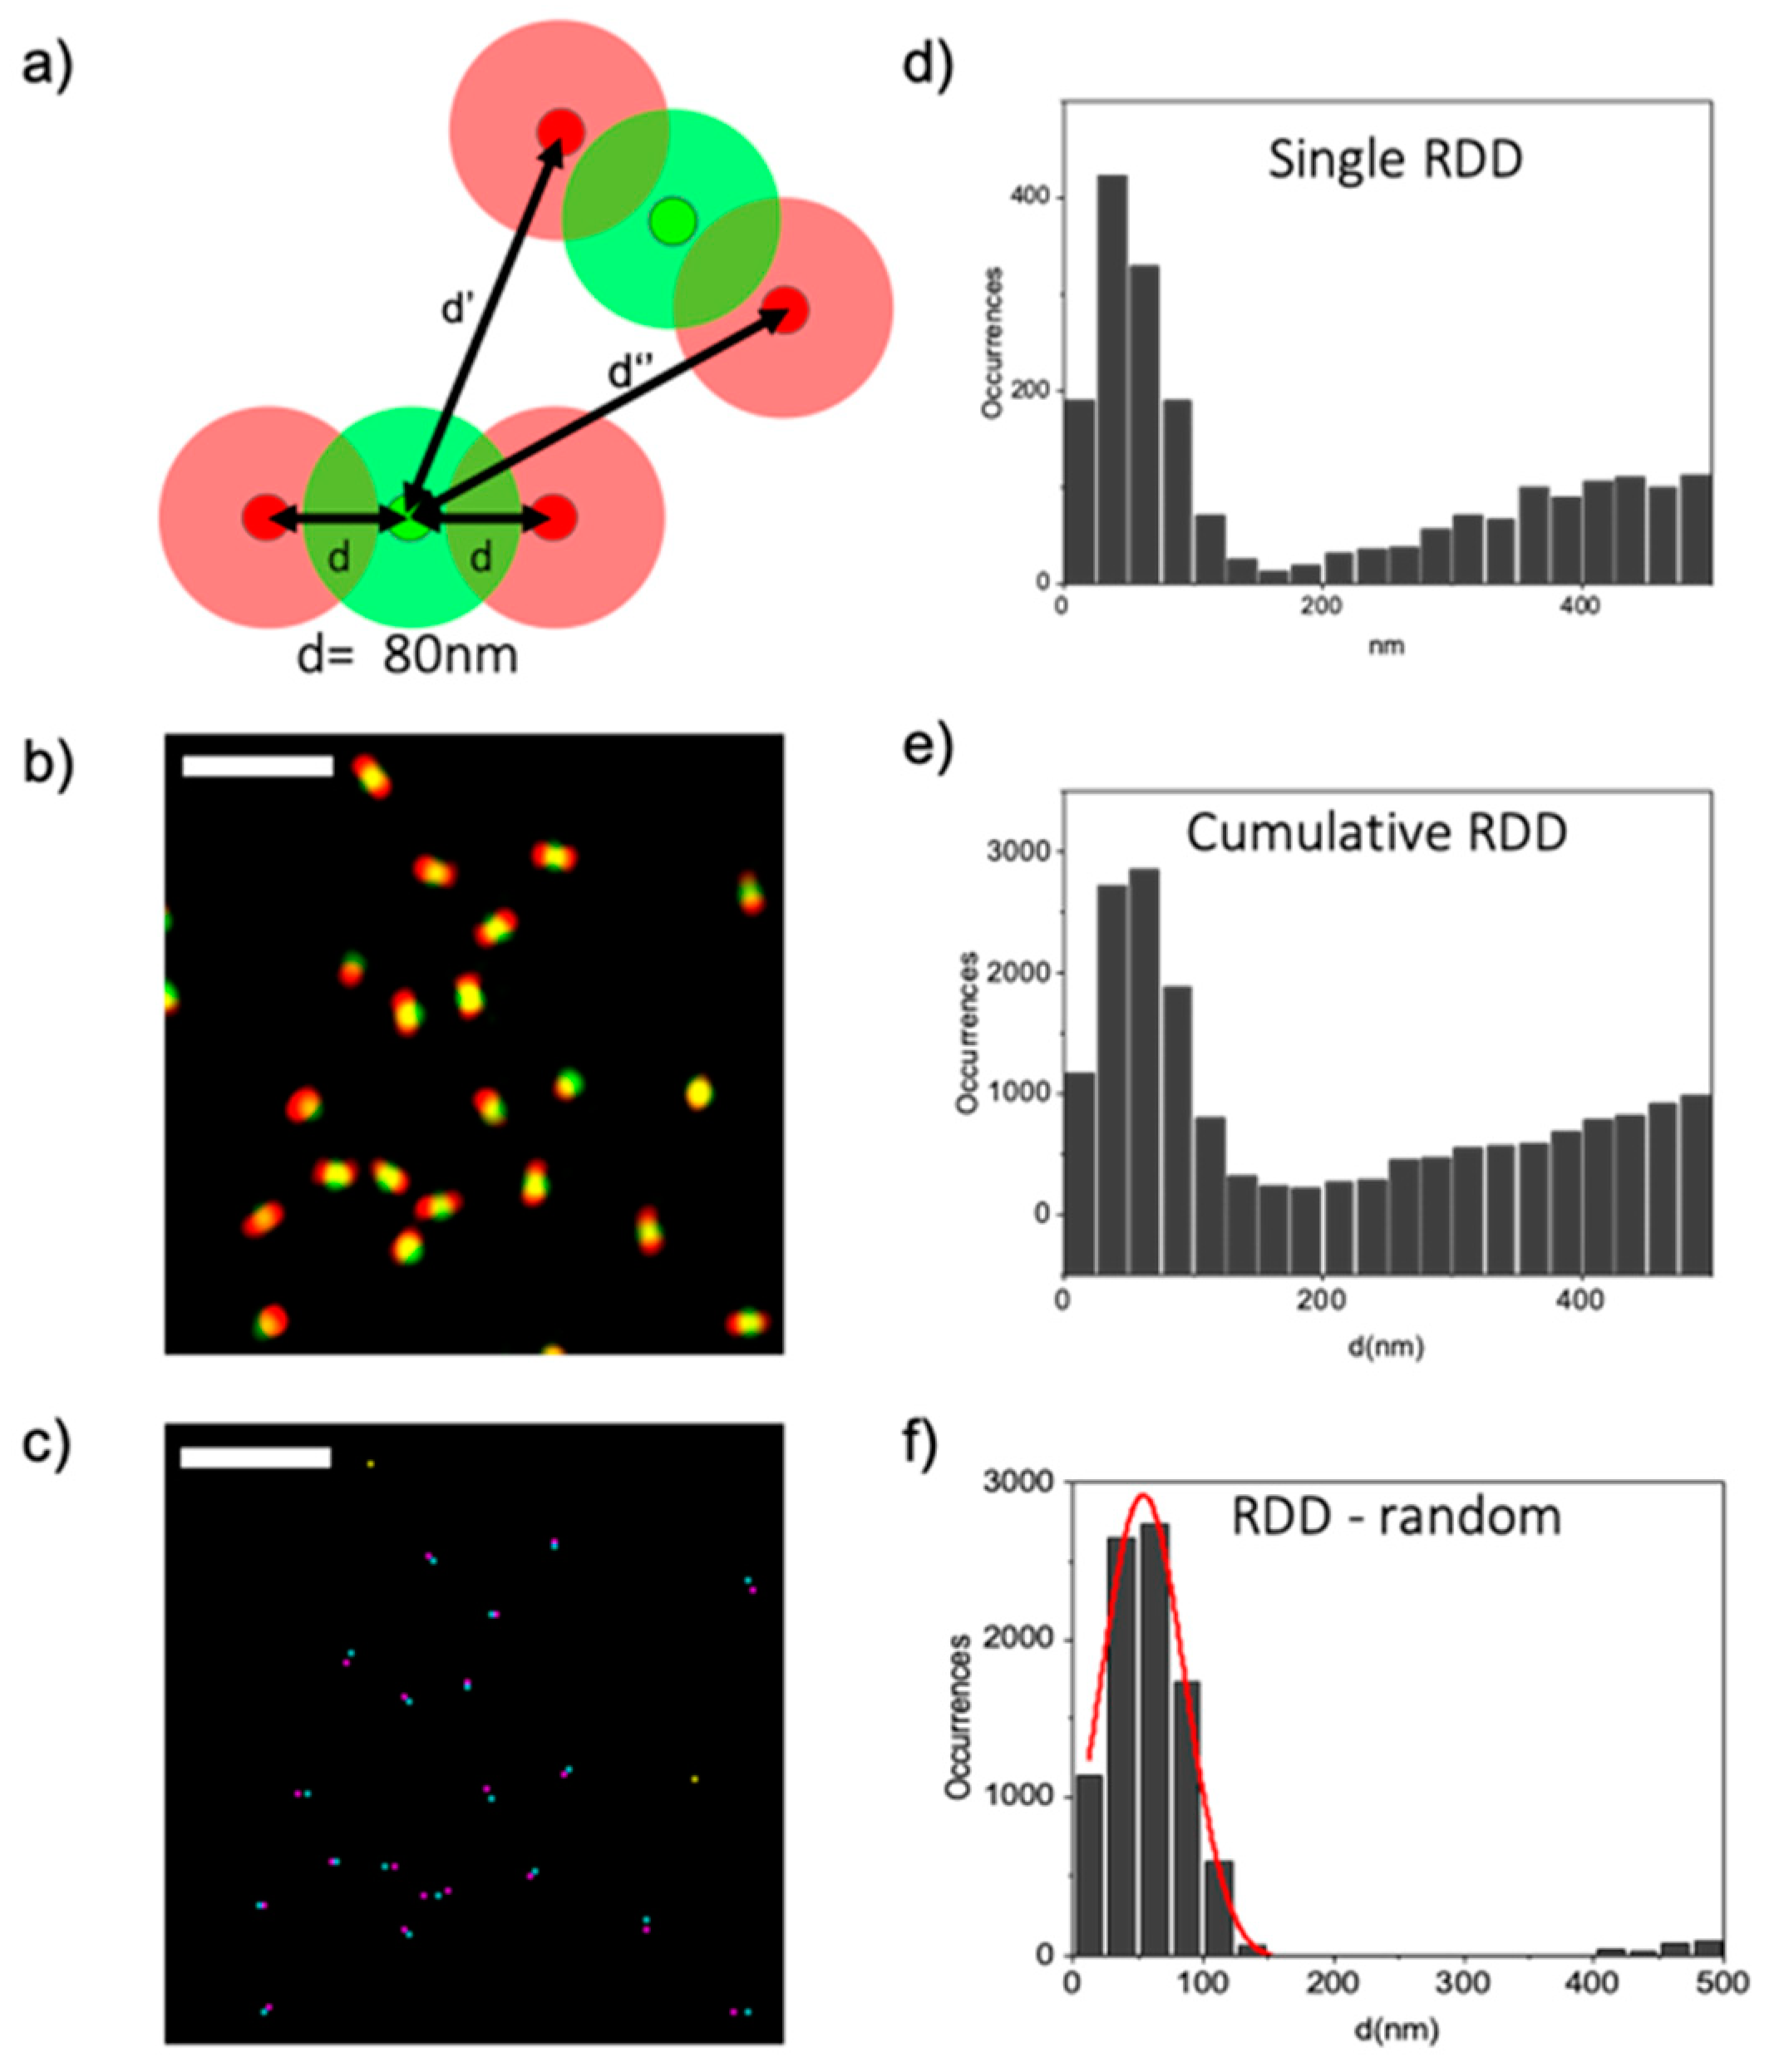
3.2. Object-Based Analysis of SIM Images of Optical Nanorulers
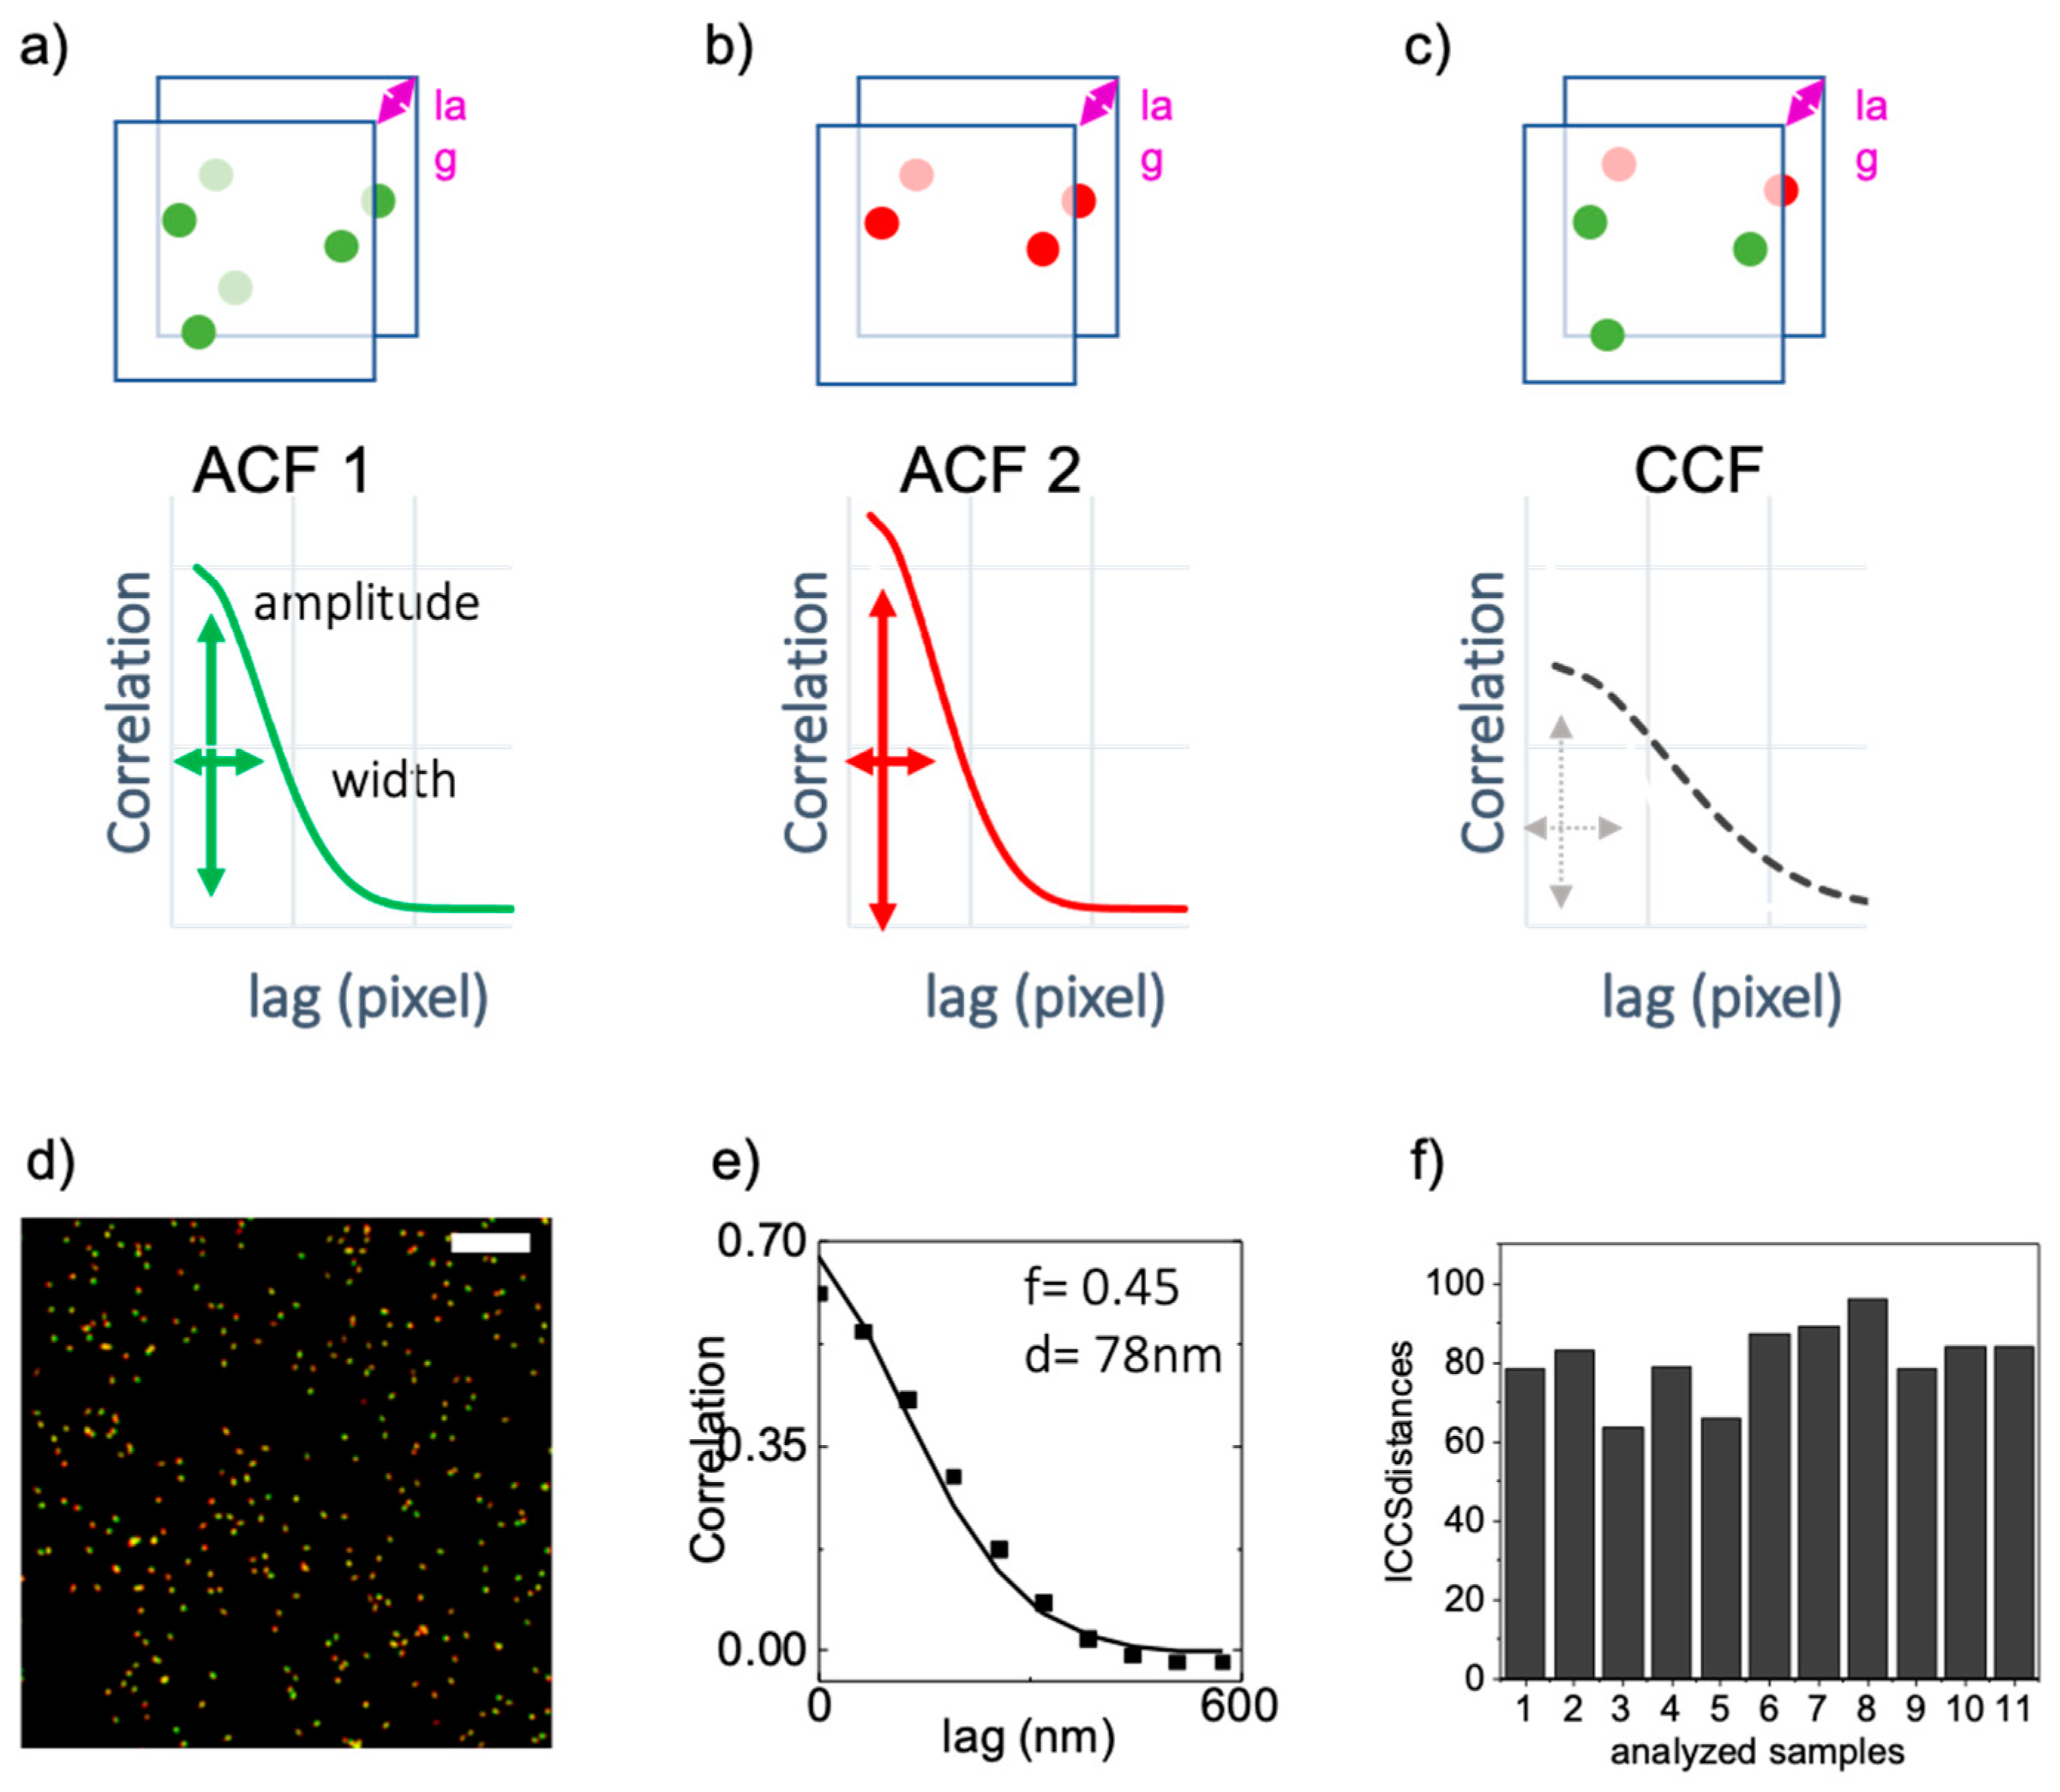
3.3. SIM-ICCS Analysis of Optical Nanorulers
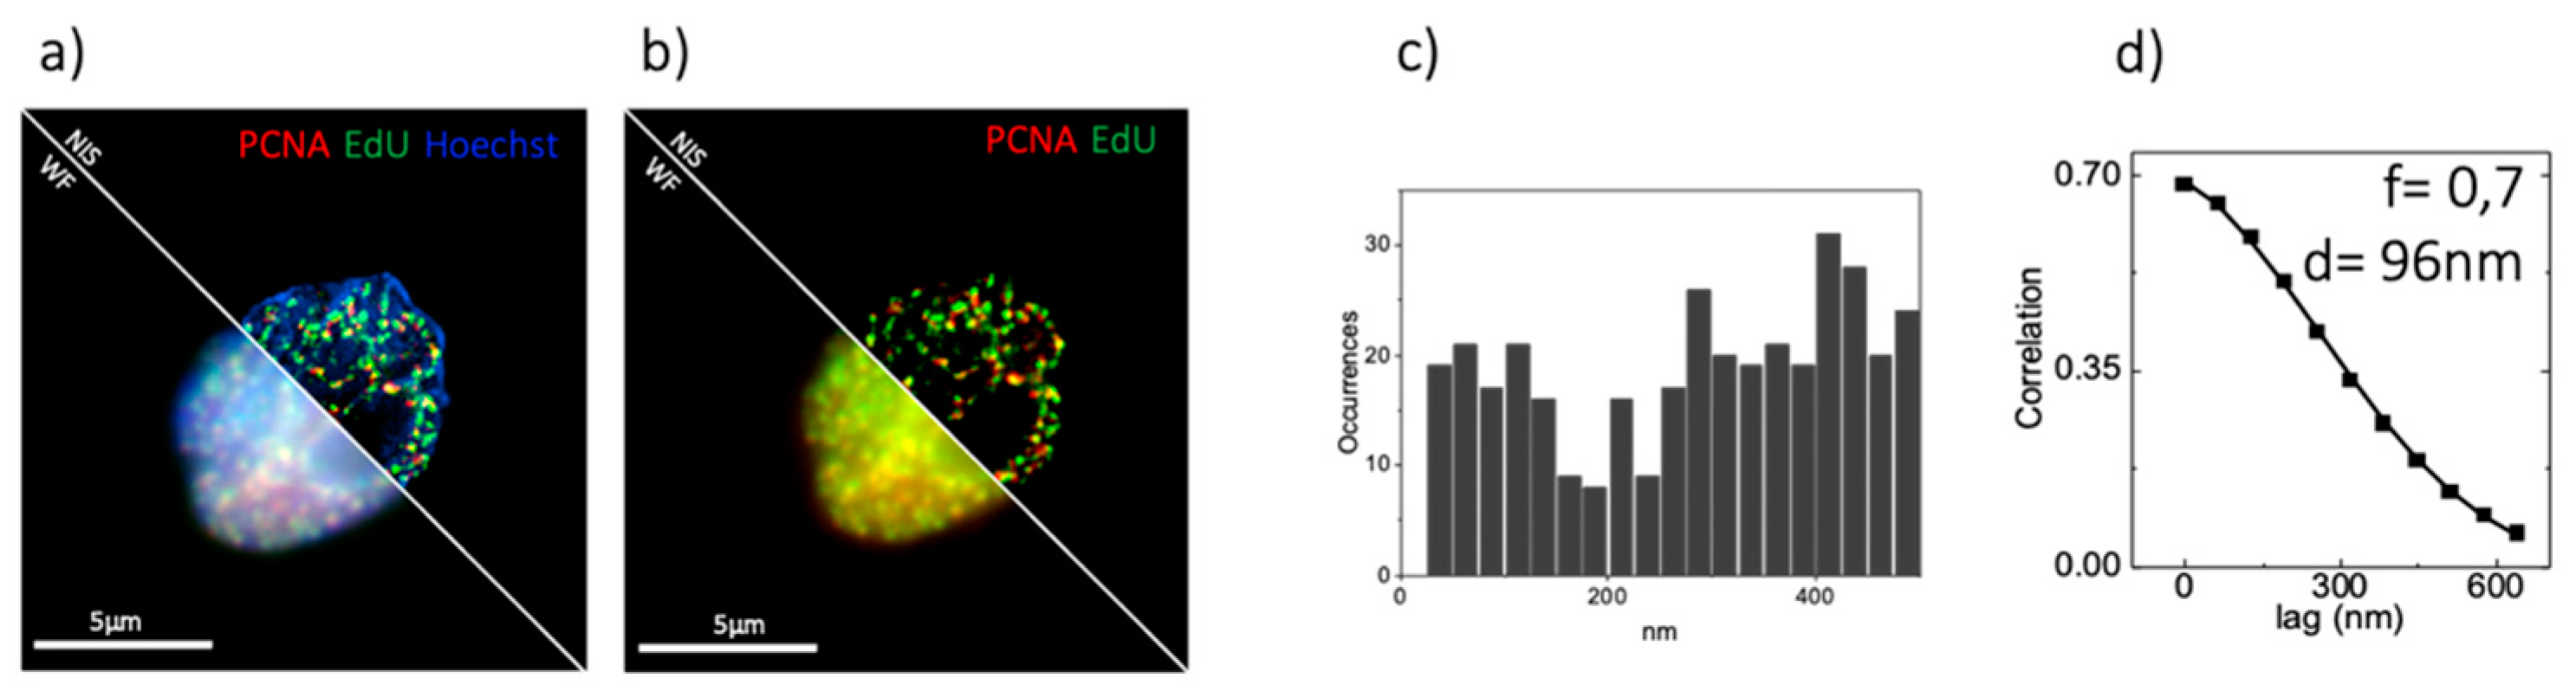
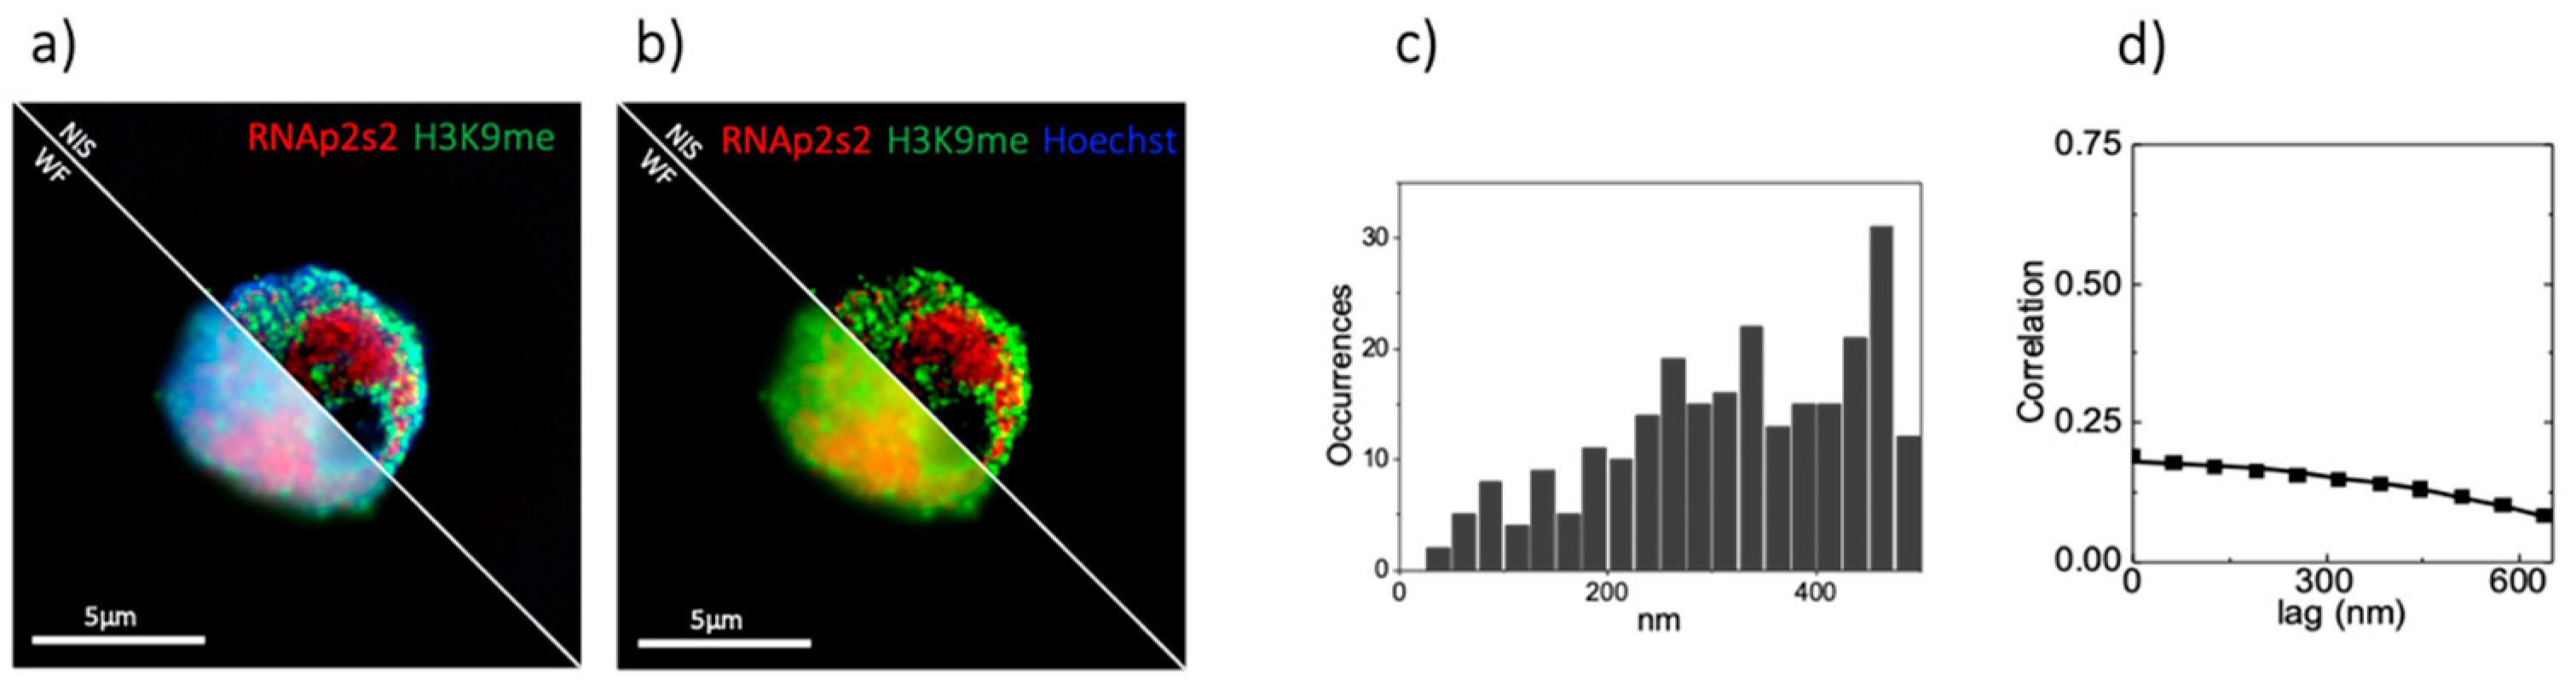
3.4. SIM-ICCS Analysis on Biological Samples
4. Discussion
5. Conclusions
Author Contributions
Funding
Institutional Review Board Statement
Informed Consent Statement
Data Availability Statement
Acknowledgments
Conflicts of Interest
References
- Negrini, S.; Gorgoulis, V.G.; Halazonetis, T.D. Genomic instability—An evolving hallmark of cancer. Nat. Rev. Mol. Cell Biol. 2010, 11, 220–228. [Google Scholar] [CrossRef]
- Markaki, Y.; Gunkel, M.; Schermelleh, L.; Beichmanis, S.; Neumann, J.; Heidemann, M.; Leonhardt, H.; Eick, D.; Cremer, C.; Cremer, T. Functional nuclear organization of transcription and DNA replication: A topographical marriage between chromatin domains and the interchromatin compartment. Cold Spring Harb. Symp. Quant Biol. 2010, 75, 475–492. [Google Scholar] [CrossRef] [Green Version]
- Wey, X.; Samarabandu, J.; Devdhar, R.S.; Siegel, A.J.; Acharya, R.; Berezney, R. Segregation of transcription and replication sites into higher order domains. Science 1998, 281, 1502–1506. [Google Scholar] [CrossRef]
- Gaillard, H.; García-Muse, T.; Aguilera, A. Replication stress and cancer. Nat. Rev. Cancer 2015, 15, 276–289. [Google Scholar] [CrossRef]
- Kotsantis, P.; Silva, L.M.; Irmscher, S.; Jones, R.M.; Folkes, L.; Gromak, N.; Petermann, E. Increased global transcription activity as a mechanism of replication stress in cancer. Nat. Commun. 2016, 7, 13087. [Google Scholar] [CrossRef]
- Helmrich, A.; Ballarino, M.; Nudler, E.; Tora, L. Transcription-replication encounters, consequences and genomic instability. Nat. Struct. Mol. Biol. 2013, 20, 412–418. [Google Scholar] [CrossRef] [PubMed]
- Bintu, B.; Mateo, L.J.; Su, J.H.; Sinnott-Armstrong, N.A.; Parker, M.; Kinrot, S.; Yamaya, K.; Boettiger, A.N.; Zhuang, X. Super-resolution chromatin tracing reveals domains and cooperative interactions in single cells. Science 2018, 362, 1783. [Google Scholar] [CrossRef] [Green Version]
- Stryer, L.; Haugland, R.P. Energy Transfer: A spectroscopic ruler. PNAS 1967, 58, 719–726. [Google Scholar] [CrossRef] [PubMed] [Green Version]
- Pelicci, S.; Diaspro, A.; Lanzanò, L. Chromatin nanoscale compaction in live cells visualized by acceptor-to-donor ratio corrected Förster resonance energy transfer between DNA dyes. J. Biophotonics 2019, 12, e201900164. [Google Scholar] [CrossRef] [Green Version]
- Gustafsdottir, S.M.; Schallmeiner, E.; Fredriksson, S.; Gullberg, M.; Söderberg, O.; Jarvius, M.; Jarvius, J.; Howell, M.; Landegren, U. Proximity ligation assays for sensitive and specific protein analyses. Anal. Biochem. 2005, 345, 2–9. [Google Scholar] [CrossRef] [PubMed]
- Huang, B.; Babcock, H.; Zhuang, X. Breaking the diffraction barrier: Super-resolution imaging of cells. Cell 2010, 143, 1047–1058. [Google Scholar] [CrossRef] [Green Version]
- Schermelleh, L.; Ferrand, A.; Huser, T.; Eggeling, C.; Sauer, M.; Biehlmaier, O.; Drummen, G.P.C. Super-resolution microscopy demystified. Nat. Cell Biol. 2019, 21, 72–84. [Google Scholar] [CrossRef]
- Betzig, E.; Patterson, G.H.; Sougrat, R.; Lindwasser, O.W.; Olenych, S.; Bonifacino, J.S.; Davidson, M.W.; Lippincott-Schwartz, J.; Hess, H.F. Imaging intracellular fluorescent proteins at nanometer resolution. Science 2006, 313, 1642–1645. [Google Scholar] [CrossRef] [Green Version]
- Hell, S.W.; Wichmann, J. Breaking the diffraction resolution limit by stimulated emission: Stimulated-emission-depletion fluorescence microscopy. Optics Lett. 1994, 19, 780–782. [Google Scholar] [CrossRef] [PubMed]
- Vicidomini, G.; Bianchini, P.; Diaspro, A. STED super-resolved microscopy. Nat. Methods 2018, 15, 173–182. [Google Scholar] [CrossRef]
- Gustafsson, M.G.L. Surpassing the lateral resolution limit by a factor of two using structured illumination microscopy. J. Microscopy 2001. [Google Scholar] [CrossRef] [PubMed] [Green Version]
- Bolte, S.; Cordelieres, F.P. A guided tour into subcellular colocalization analysis in light microscopy. J. Microsc. 2006, 224, 213–232. [Google Scholar] [CrossRef]
- Arena, E.T.; Rueden, C.T.; Hiner, M.C.; Wang, S.; Yuan, M.; Eliceiri, K.W. Quantitating the cell: Turning images into numbers with Image. J. Wiley Interdiscip. Rev. Dev. Biol. 2017, 6, e260. [Google Scholar] [CrossRef]
- Levet, F.; Hosy, E.; Kechkar, A.; Butler, C.; Beghin, A.; Choquet, D.; Sibarita, J.B. SR-Tesseler: A method to segment and quantify localization-based super-resolution microscopy data. Nat. Methods 2015, 12, 1065–1071. [Google Scholar] [CrossRef] [PubMed]
- Paul, M.W.; de Gruiter, H.M.; Lin, Z.; Baarends, W.M.; van Cappellen, W.A.; Houtsmuller, A.B.; Slotman, J.A. SMoLR: Visualization and analysis of single-molecule localization microscopy data in R. BMC Bioinform. 2019, 20, 30. [Google Scholar] [CrossRef]
- Caetano, F.A.; Dirk, B.S.; Tam, J.H.; Cavanagh, P.C.; Goiko, M.; Ferguson, S.S.; Pasternak, S.H.; Dikeakos, J.D.; de Bruyn, J.R.; Heit, B. HeitMIiSR: Molecular interactions in super-resolution imaging enables the analysis of protein interactions, dynamics and formation of multi-protein structures. PLoS Comput. Biol. 2015, 11, e1004634. [Google Scholar] [CrossRef] [Green Version]
- Manders, E.M.M.; Verbeek, F.J.; Aten, J.A. Measurement of co-localization of objects in dual-colour confocal images. J. Microsc. 1993, 169, 375–382. [Google Scholar] [CrossRef]
- Adler, J.; Parmryd, I. Quantifying colocalization by correlation: The Pearson correlation coefficient is superior to the Mander’s overlap coefficient. Cytom. Part A 2010, 77, 733–742. [Google Scholar] [CrossRef]
- Magde, D.; Elson, E.; Webb, W.W. Thermodynamic fluctuations in a reacting system-measurement by fluorescence correlation spectroscopy. Phys. Rev. Lett. 1972, 29, 705–708. [Google Scholar] [CrossRef]
- Bacia, K.; Schwille, P. Practical guidelines for dual-color fluorescence cross-correlation spectroscopy. Nat. Protoc. 2007, 2, 2842–2856. [Google Scholar] [CrossRef]
- Foo, Y.H.; Naredi-Rainer, N.; Wohland, T. Factors affecting the quantification of biomolecular interactions by fluorescence cross- correlation spectroscopy. Biophys. J. 2012, 102, 1174–1183. [Google Scholar] [CrossRef] [Green Version]
- Comeau, J.W.; Costantino, S.; Wiseman, P.W. A guide to accurare fluorescence microscopy colocalization measurements. Biophys. J. 2006, 91, 4611–4622. [Google Scholar] [CrossRef] [PubMed] [Green Version]
- Dreier, J.; Kolin, D.L.; Wiseman, P.W. Superresolution and fluorescence dynamics evidence reveal that intact liposomes do not cross the human skin barrier. PLoS ONE 2016, 11, e0146514. [Google Scholar] [CrossRef] [PubMed] [Green Version]
- Oneto, M.; Scipioni, L.; Sarmento, M.J.; Cainero, I.; Pelicci, S.; Furia, L.; Pelicci, P.G.; Dellino, G.I.; Bianchini, P.; Faretta, M.; et al. Nanoscale Distribution of Nuclear Sites by Super-Resolved Image Cross-Correlation Spectroscopy. Biophys. J. 2019, 117, 2054–2065. [Google Scholar] [CrossRef] [PubMed] [Green Version]
- Ashdown, G.W.; Burn, G.L.; Williamson, D.J.; Pandžić, E.; Peters, R.; Holden, M.; Ewers, H.; Shao, L.; Wiseman, P.W.; Owen, D.M. Live-cell super- resolution reveals F-actin and plasma membrane dynamics at the T cell synapse. Biophys. J. 2017, 112, 1703–1713. [Google Scholar] [CrossRef] [Green Version]
- Scipioni, L.; Gratton, E.; Diaspro, A.; Lanzanò, L. Phasor analysis of local ICS detects heterogeneity in size and number of intracellular vesicles. Biophys. J. 2016, 111, 619–629. [Google Scholar] [CrossRef] [Green Version]
- Rogaia, D.; Grignani, F.; Nicoletti, I.; Pelicci, P.G. The acute promyelocytic leukemia-specific PML/RAR alpha fusion protein reduces the frequency of commitment to apoptosis upon growth factor deprivation of GM-CSF- dependent myeloid cells. Leukemia 1995, 9, 1467–1472. [Google Scholar] [PubMed]
- Scipioni, L.; Di Bona, M.; Vicidomini, G.; Diaspro, A.; Lanzanò, L. Local raster image correlation spectroscopy generates high-resolution intracellular diffusion maps. Commun. Biol. 2018, 1, 1–10. [Google Scholar] [CrossRef] [PubMed] [Green Version]
- Di Bona, M.; Mancini, M.A.; Mazza, D.; Vicidomini, G.; Diaspro, A.; Lanzanò, L. Measuring mobility in chromatin by intensity-sorted FCS. Biophys. J. 2019, 116, 987–999. [Google Scholar] [CrossRef] [PubMed] [Green Version]
- Hendrix, J.; Dekens, T.; Schrimpf, W.; Lamb, D.C. Arbitrary-Region Raster Image Correlation Spectroscopy. Biophys. J. 2016, 111, 1785–1796. [Google Scholar] [CrossRef] [Green Version]


Publisher’s Note: MDPI stays neutral with regard to jurisdictional claims in published maps and institutional affiliations. |
© 2021 by the authors. Licensee MDPI, Basel, Switzerland. This article is an open access article distributed under the terms and conditions of the Creative Commons Attribution (CC BY) license (http://creativecommons.org/licenses/by/4.0/).
Share and Cite
Cainero, I.; Cerutti, E.; Faretta, M.; Dellino, G.I.; Pelicci, P.G.; Diaspro, A.; Lanzanò, L. Measuring Nanoscale Distances by Structured Illumination Microscopy and Image Cross-Correlation Spectroscopy (SIM-ICCS). Sensors 2021, 21, 2010. https://doi.org/10.3390/s21062010
Cainero I, Cerutti E, Faretta M, Dellino GI, Pelicci PG, Diaspro A, Lanzanò L. Measuring Nanoscale Distances by Structured Illumination Microscopy and Image Cross-Correlation Spectroscopy (SIM-ICCS). Sensors. 2021; 21(6):2010. https://doi.org/10.3390/s21062010
Chicago/Turabian StyleCainero, Isotta, Elena Cerutti, Mario Faretta, Gaetano Ivan Dellino, Pier Giuseppe Pelicci, Alberto Diaspro, and Luca Lanzanò. 2021. "Measuring Nanoscale Distances by Structured Illumination Microscopy and Image Cross-Correlation Spectroscopy (SIM-ICCS)" Sensors 21, no. 6: 2010. https://doi.org/10.3390/s21062010