A Hydrogen Gas Sensor Based on TiO2 Nanoparticles on Alumina Substrate
by
Siti Amaniah Mohd Chachuli
1,2,*, 
Mohd Nizar Hamidon
1,
Md. Shuhazlly Mamat
3,
Mehmet Ertugrul
4 and
Nor Hapishah Abdullah
1 1
Institute of Advanced Technology, University Putra Malaysia, Serdang 43400, Selangor, Malaysia
2
Faculty of Electronic & Computer Engineering, Universiti Teknikal Malaysia Melaka, Hang Tuah Jaya, Durian Tunggal 76100, Melaka, Malaysia
3
Faculty of Sciences, University Putra Malaysia, Serdang 43400, Selangor, Malaysia
4
Engineering Faculty, Ataturk University, 25240 Erzurum, Turkey
*
Author to whom correspondence should be addressed.
Sensors 2018, 18(8), 2483; https://doi.org/10.3390/s18082483
Submission received: 2 May 2018
/
Revised: 8 June 2018
/
Accepted: 24 June 2018
/
Published: 1 August 2018
(This article belongs to the Collection Gas Sensors)
Abstract
:High demand of semiconductor gas sensor works at low operating temperature to as low as 100 °C has led to the fabrication of gas sensor based on TiO2 nanoparticles. A sensing film of gas sensor was prepared by mixing the sensing material, TiO2 (P25) and glass powder, and B2O3 with organic binder. The sensing film was annealed at temperature of 500 °C in 30 min. The morphological and structural properties of the sensing film were characterized by field emission scanning electron microscopy (FESEM), energy-dispersive X-ray spectroscopy (EDX) and X-ray diffraction (XRD). The gas sensor was exposed to hydrogen with concentration of 100–1000 ppm and was tested at different operating temperatures which are 100 °C, 200 °C, and 300 °C to find the optimum operating temperature for producing the highest sensitivity. The gas sensor exhibited p-type conductivity based on decreased current when exposed to hydrogen. The gas sensor showed capability in sensing low concentration of hydrogen to as low as 100 ppm at 100 °C.
1. Introduction
Detection of hydrogen in fuel cell, combustion engines and monitoring faults in transformer have gained incredible interest from many researchers especially from gas sensing area. Hubert et al. reported that 1400 publications have been published in gas sensing from 1975 until 2010 [1]. Hydrogen which is known as a colorless, odorless, tasteless, and flammable gas, cannot be detected by human senses [2], thus its presence should be detected and analyzed. With a mixture of oxygen, leakage of hydrogen can cause explosions and degradation of many types of steels [3]. Hydrogen can also become flammable and explosive if the concentration is higher than 4% in air [4].
Different sensing technologies have been employed to detect hydrogen, such as catalyst, thermal conductivity, electrochemical, resistance based, work function based, mechanical, and optical [2]. Among them, electrochemical and resistance-based technologies are the most preferred due to their ability to detect low hydrogen concentration and acceptable selectivity [2]. It has been reported that effective sensing materials to sense hydrogen are based on palladium (Pd) [5,6,7,8,9,10,11,12,13,14,15] and metal-oxide semiconductors (MOX) such as SnO2 [16,17,18,19], ZnO [20,21,22,23], TiO2 [24,25,26,27,28,29,30], WO3 [31], and NiO [32] because of their capability to detect hydrogen with low concentration and ability to work at room temperature. Palladium is high sensitive to hydrogen; however it also has drawbacks such as hysteresis behavior in electrical resistance because of adsorption of hydrogen in the structure of Pd [5]. Recently, a hydrogen gas sensor based on carbon-based materials such as carbon nanotubes [33,34,35], graphene [36,37,38,39], and reduced graphene oxide (RGO) [40,41] has also attracted high attention because it is highly sensitive to the changes in the chemical environments [42,43], and offers high performance, label free chemical sensing [44].
TiO2 has been chosen in this work because it is known as a chemically stable, nontoxic, biocompatible, inexpensive, wide band gap semiconducting material [45]. Due to being inexpensive, hydrogen gas sensors based on TiO2 also can become affordable and safe hydrogen gas sensors [46]. Among the metal-oxide semiconductors, the TiO2 gas sensor has been reported to be able to work under low operating temperatures, up to as low as room temperature [28,47,48], with fast response [29]. These criteria have made TiO2 a practical material for gas sensing applications.
In this paper, a TiO2 gas sensor was fabricated on the alumina substrate using screen-printed method and was tested to different concentration of hydrogen from 100–1000 ppm at three different operating temperatures: 100 °C, 200 °C, and 300 °C.
2. Materials and Methods
2.1. Preparation and Fabrication of Gas Sensor
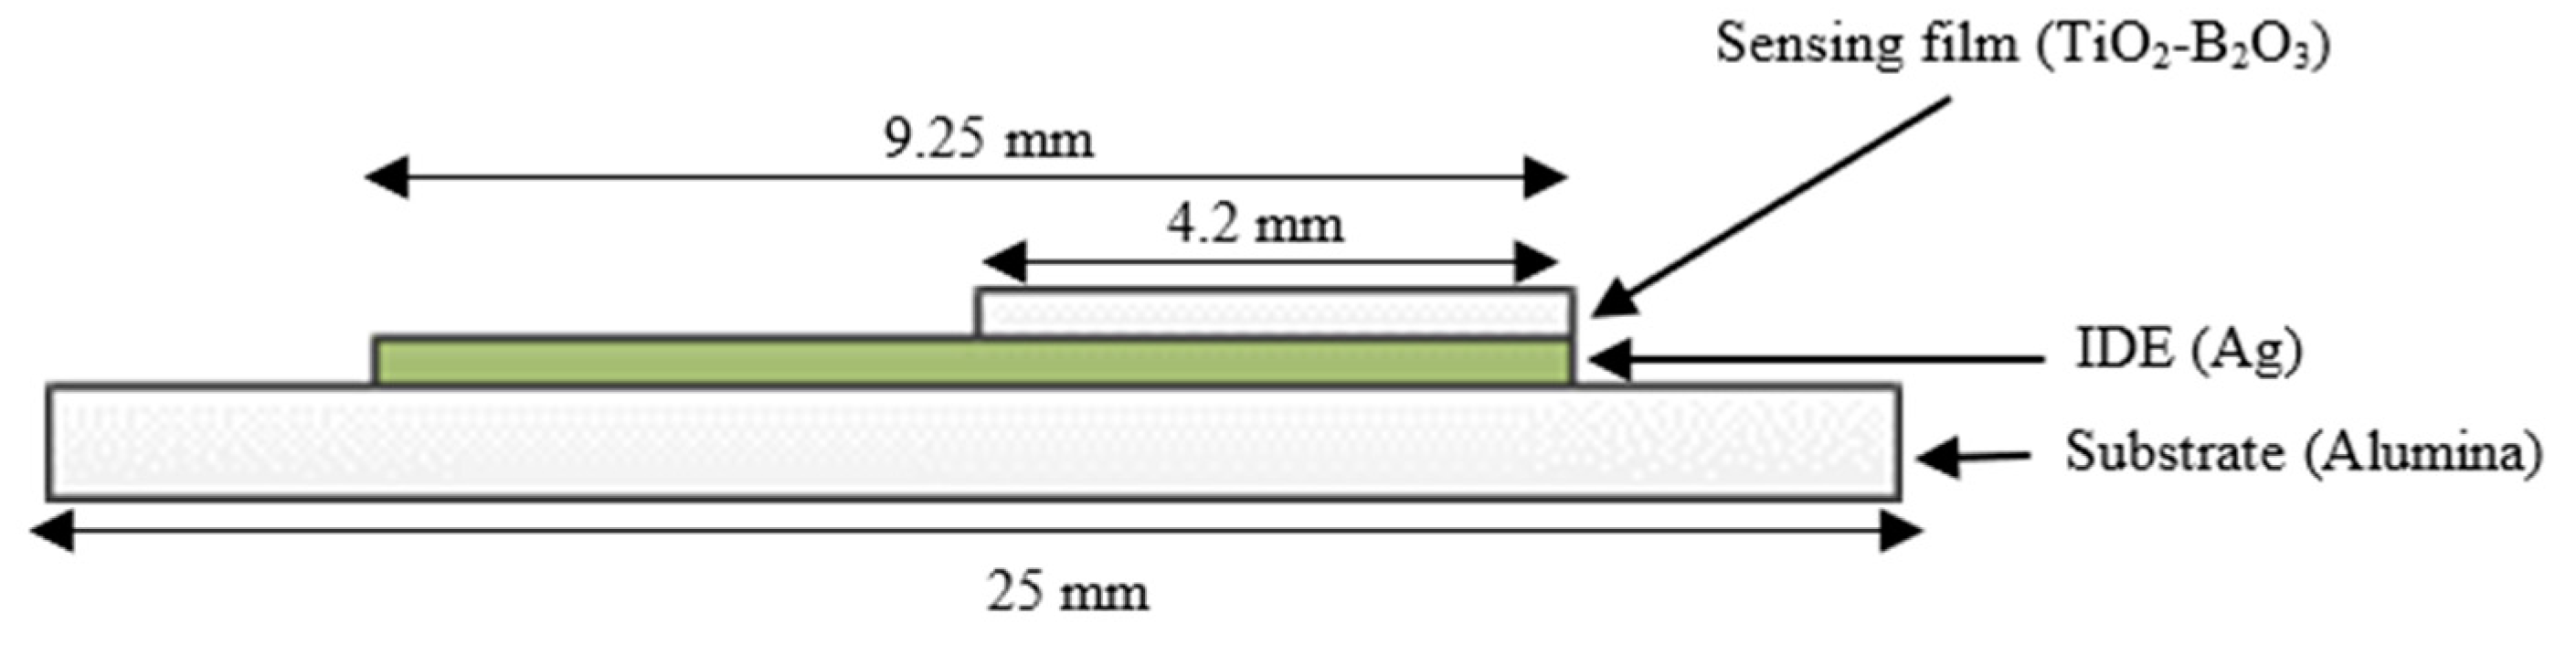
Gas sensor used in this work consist of two layers, which are an interdigitated electrode (IDE) and sensing film, as shown in Figure 1. The IDE used in this work was a silver-conductive paste (DGP80 TESM8020) provided by Sigma-Aldrich (Steinheim am Albuch, Germany) and the sensing material used in this work was TiO2 (Aeroxide® P25) provided by Sigma-Aldrich (Steinheim am Albuch, Germany). IDE and the sensing film were deposited on the alumina substrate using a screen printing method. Initially, IDE was deposited as first layer on the alumina substrate, followed by annealing in the furnace at temperature of 120 °C for 30 min. Air was used as a carrier gas in the furnace.
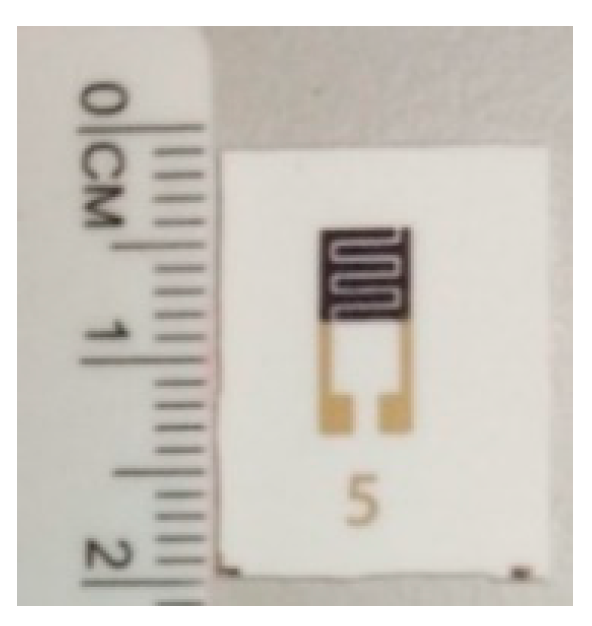
In order to deposit TiO2 on the alumina substrate, TiO2 powder was prepared as a paste. Firstly, 90 wt % of TiO2 powder was mixed with 10 wt % of glass powder, boron oxide (B2O3), using m-xylene as a medium in an ultrasonic bath for 90 min. Then, it was dried in an oven and was ground in a mortar. The purpose of glass powder is to hold the nanoparticles of TiO2 on the substrate and to ensure good adhesion between TiO2 and the alumina substrate. B2O3 was chosen as the glass powder in this work because it has a low melting point of 450 °C. This method have been presented in [49,50]. Organic binder was prepared by mixing m-xylene, linseed oil, and α-terpineol. The paste was prepared by mixing the TiO2-B2O3 with organic binder until homogeneous paste was obtained. Then, TiO2-B2O3 paste was deposited on the top of IDE and it was annealed in the furnace at temperature of 500 °C for 30 min. The fabricated gas sensor is shown in Figure 2. The size of the sensing film was 4.2 × 4.2 mm, while the size of the IDE was 9.25 × 4.2 mm. The IDE was fully covered by TiO2-B2O3 paste in order to increase the sensitivity of the gas sensor. Black color on the sensing film of gas sensor might be caused by diffusion of silver (IDE) into the TiO2 (Figure 2). It was reported that the silver diffused into TiO2 at a temperature of 400 °C [51].
2.2. Characterization Method of TiO2-B2O3
Characterizations of TiO2-B2O3 were made using a thermogravimetric analyzer (TGA), field emission scanning electron microscopy (FESEM), energy-dispersive X-ray spectroscopy (EDX), and X-ray diffraction (XRD). Thermal analysis of TiO2-B2O3 paste was tested using TGA (Brand: Mettler Toledo (Greifensee, Switzerland, Model: TGA/DSC 1 HT)) with heating rate 10 °C/min and air as the carrier for the temperature range: 25–1000 °C. The surface morphology of the thick films was analyzed using FESEM (Model: Nova Nanosem 230 (Thermo Fisher Scientific, Oregon City, OR, USA), and element composition was examined by EDX inside the FESEM. XRD (Brand: Philips (Almelo, The Netherlands), Model: PW 3040/60 MPD X’pert High Pro Panalytical) studies were carried out for powder and thick film over a 2θ range from 20° to 80°. The scanning time for TiO2 (P25) and TiO2-B2O3 powder were 5 min, and one hour for TiO2-B2O3 thick films.
2.3. Gas Response Measurement
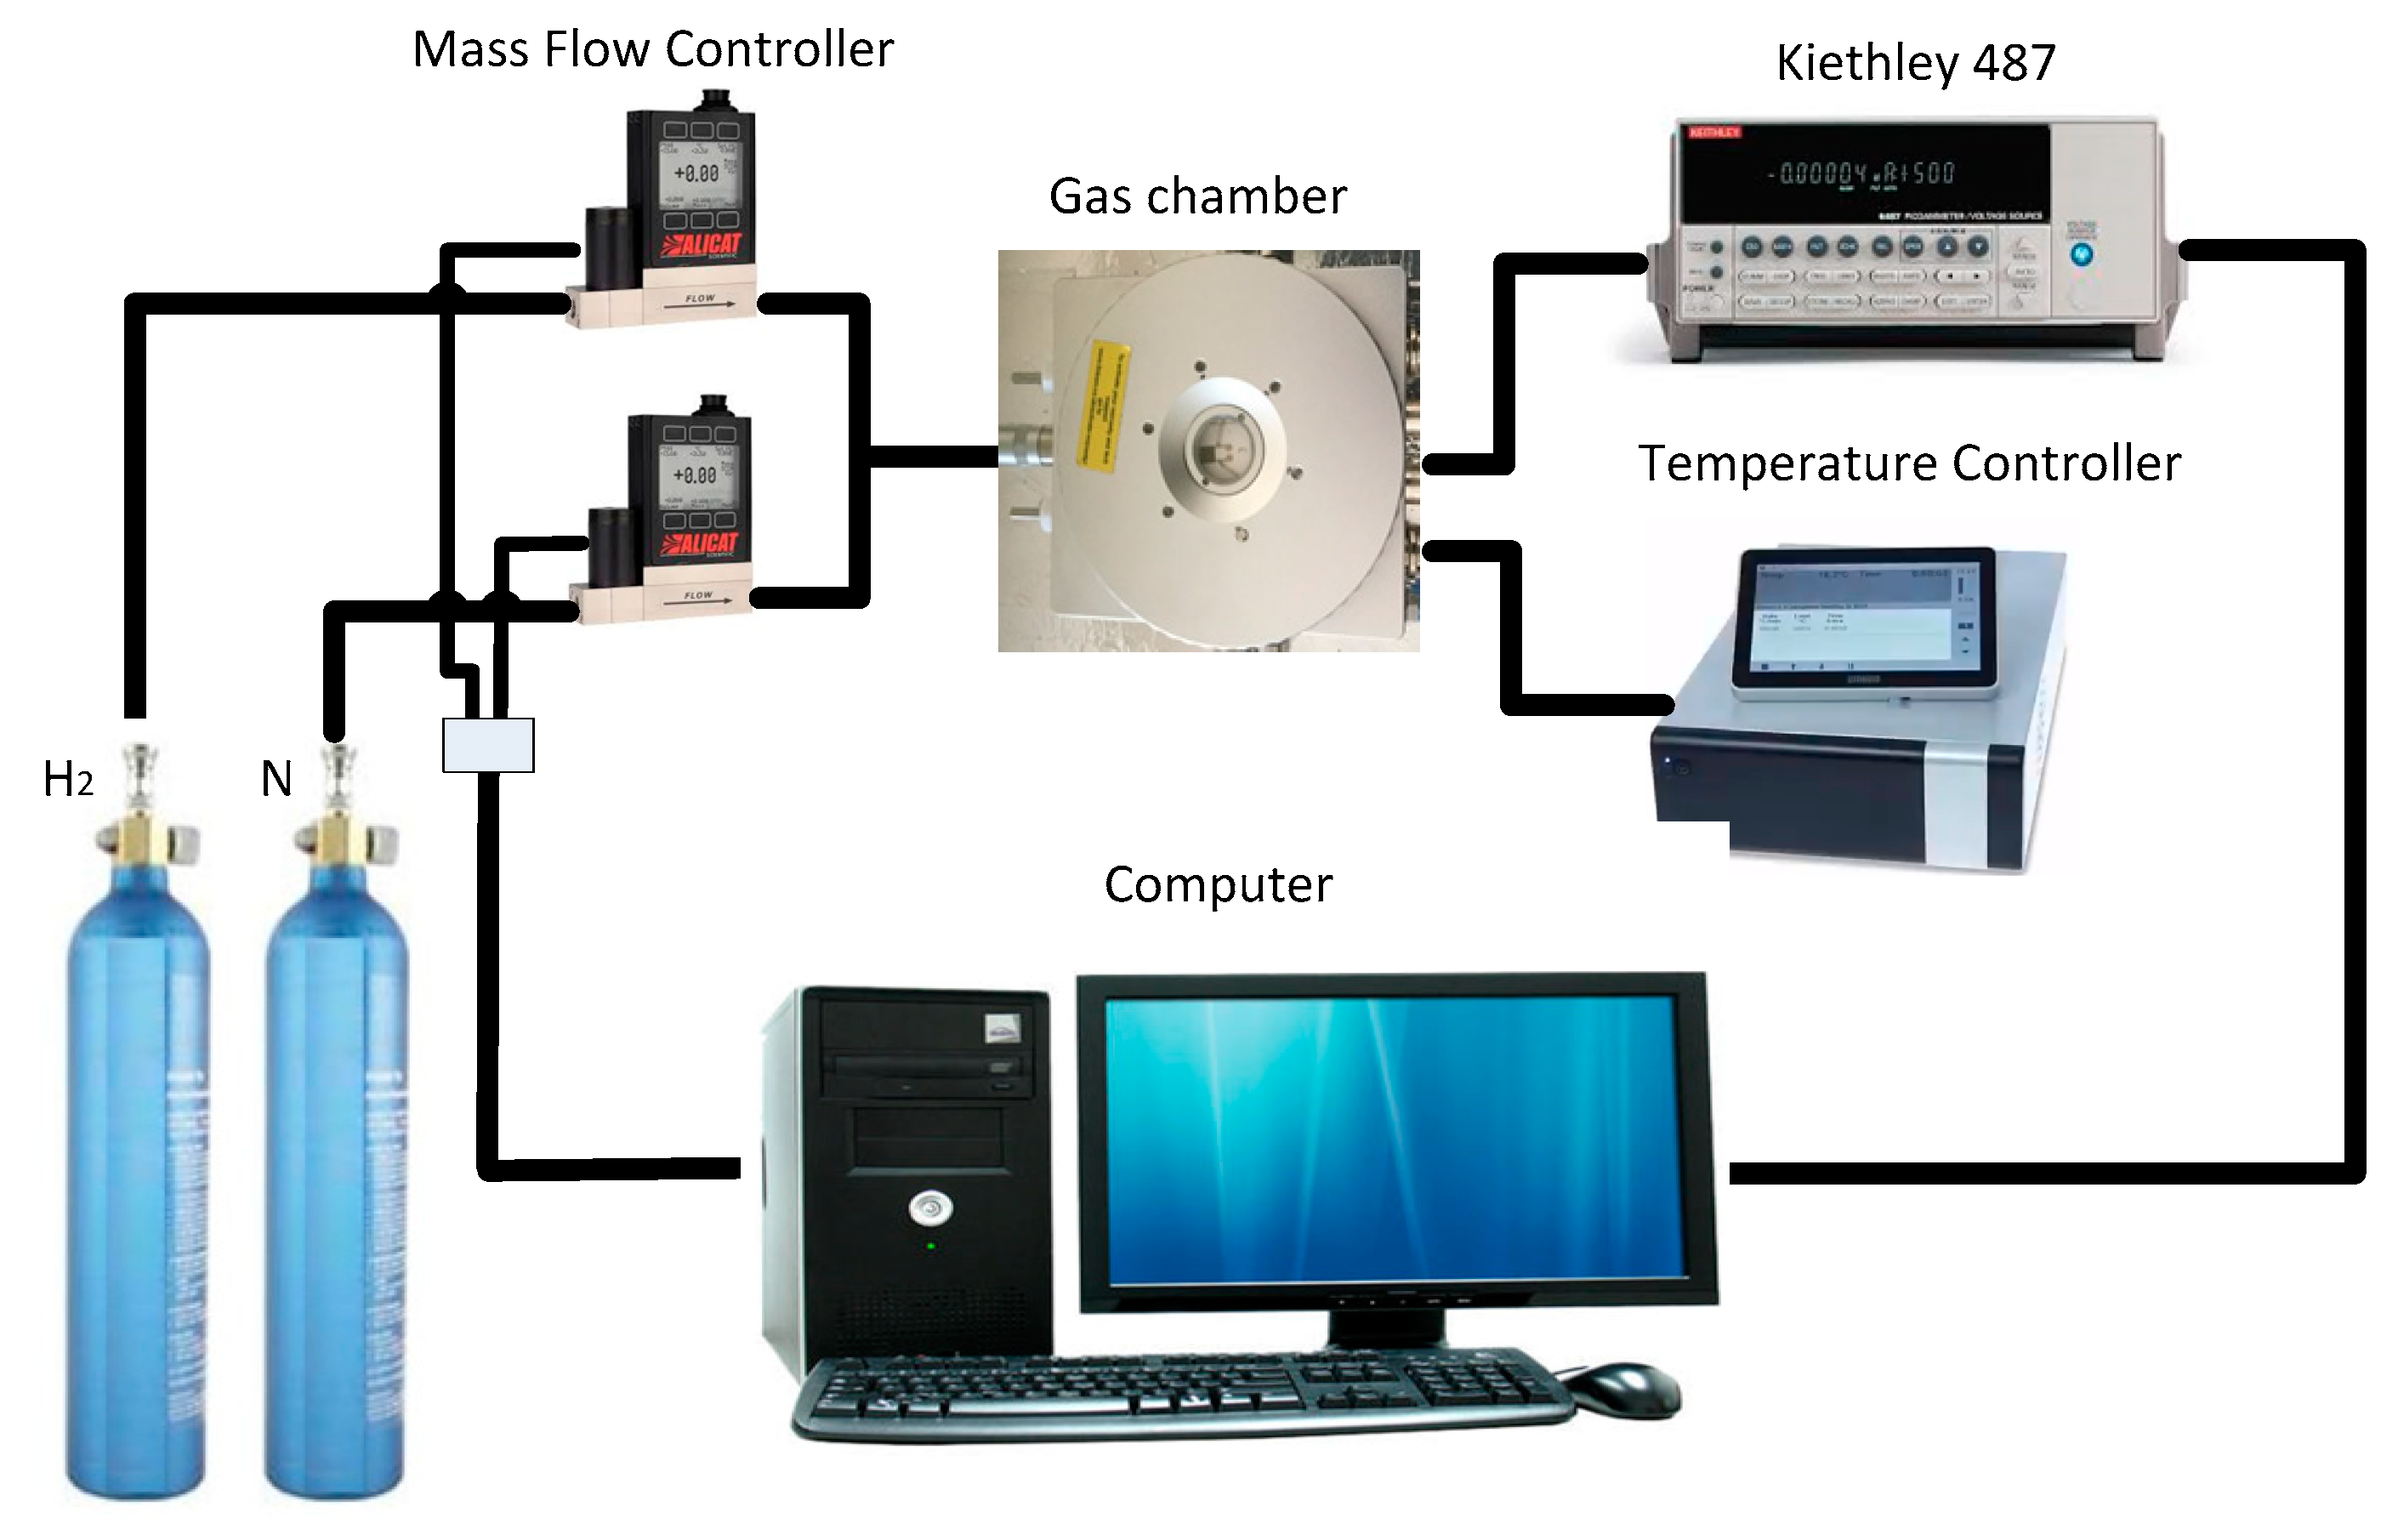
Gas sensing measurements were performed in gas chamber with different ppm levels of hydrogen from 100–1000 ppm. As a carrier gas, 500 sccm nitrogen was used. Experimental setup of gas chamber is shown in Figure 3. Gas chamber was obtained from Linkam Scientific (Tadworth, UK, Model: HFS600). The gas chamber was connected to the mass flow controller, temperature controller, and Kiethley 487 Picoammeter/Voltage source. Three different operating temperatures were tested on gas sensor which are 100 °C, 200 °C, and 300 °C to find the optimum operating temperature that can produce highest sensitivity to hydrogen. For measurement, 10 V voltage source was applied to the IDE of gas sensor and current was observed as the response of gas sensor.
3. Results and Discussion
3.1. Characterization of TiO2-B2O3 Using TGA, FESEM, EDX and XRD
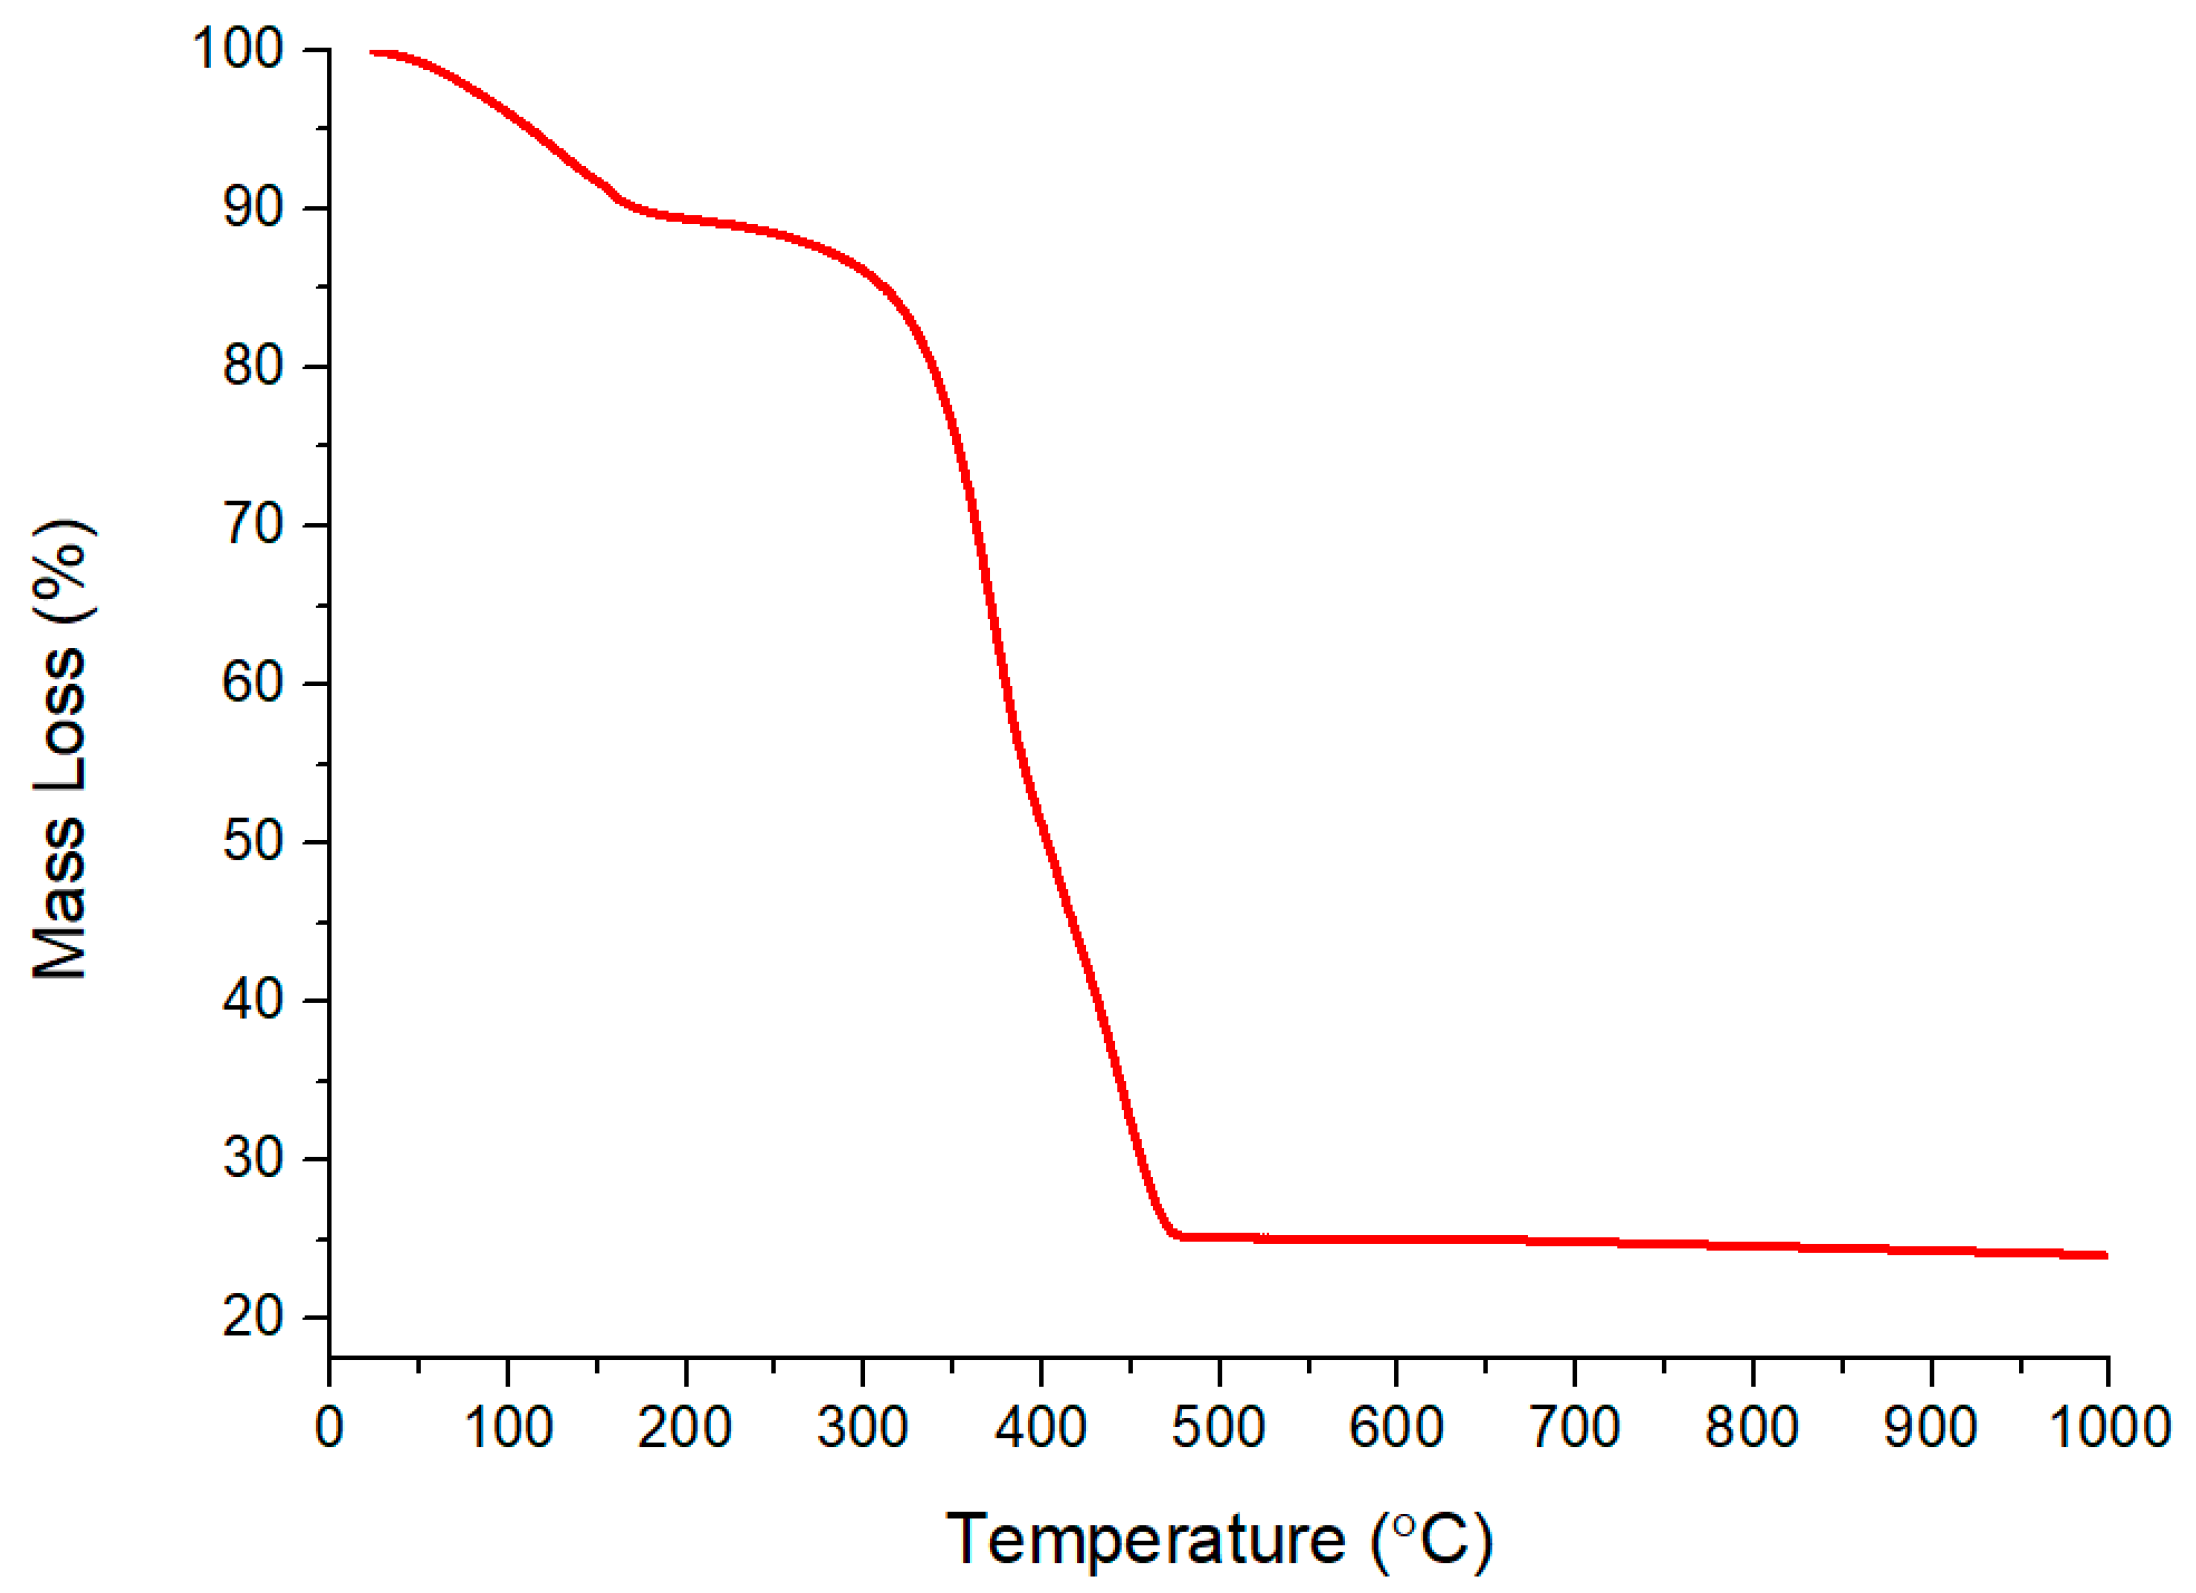
TGA analysis was performed to determine the thermal behavior of the TiO2-B2O3 paste and to find an optimum calcination temperature. Figure 4 shows total mass loss of TiO2-B2O3 paste over a temperature range of 25 to 1000 °C. At 400 °C, mass loss was measured approximately 49.61%, which indicated that the organic binder was not fully evaporated at this temperature. It became decreased again when temperature reached at 500 °C which approximately 25.12%. Composition ratio of TiO2-B2O3 powder and organic binder used in this work was 30:70. It can be seen that the organic binder was fully evaporated at temperature of 500 °C. Therefore, this temperature has been chosen as the annealing temperature for the sensing film.
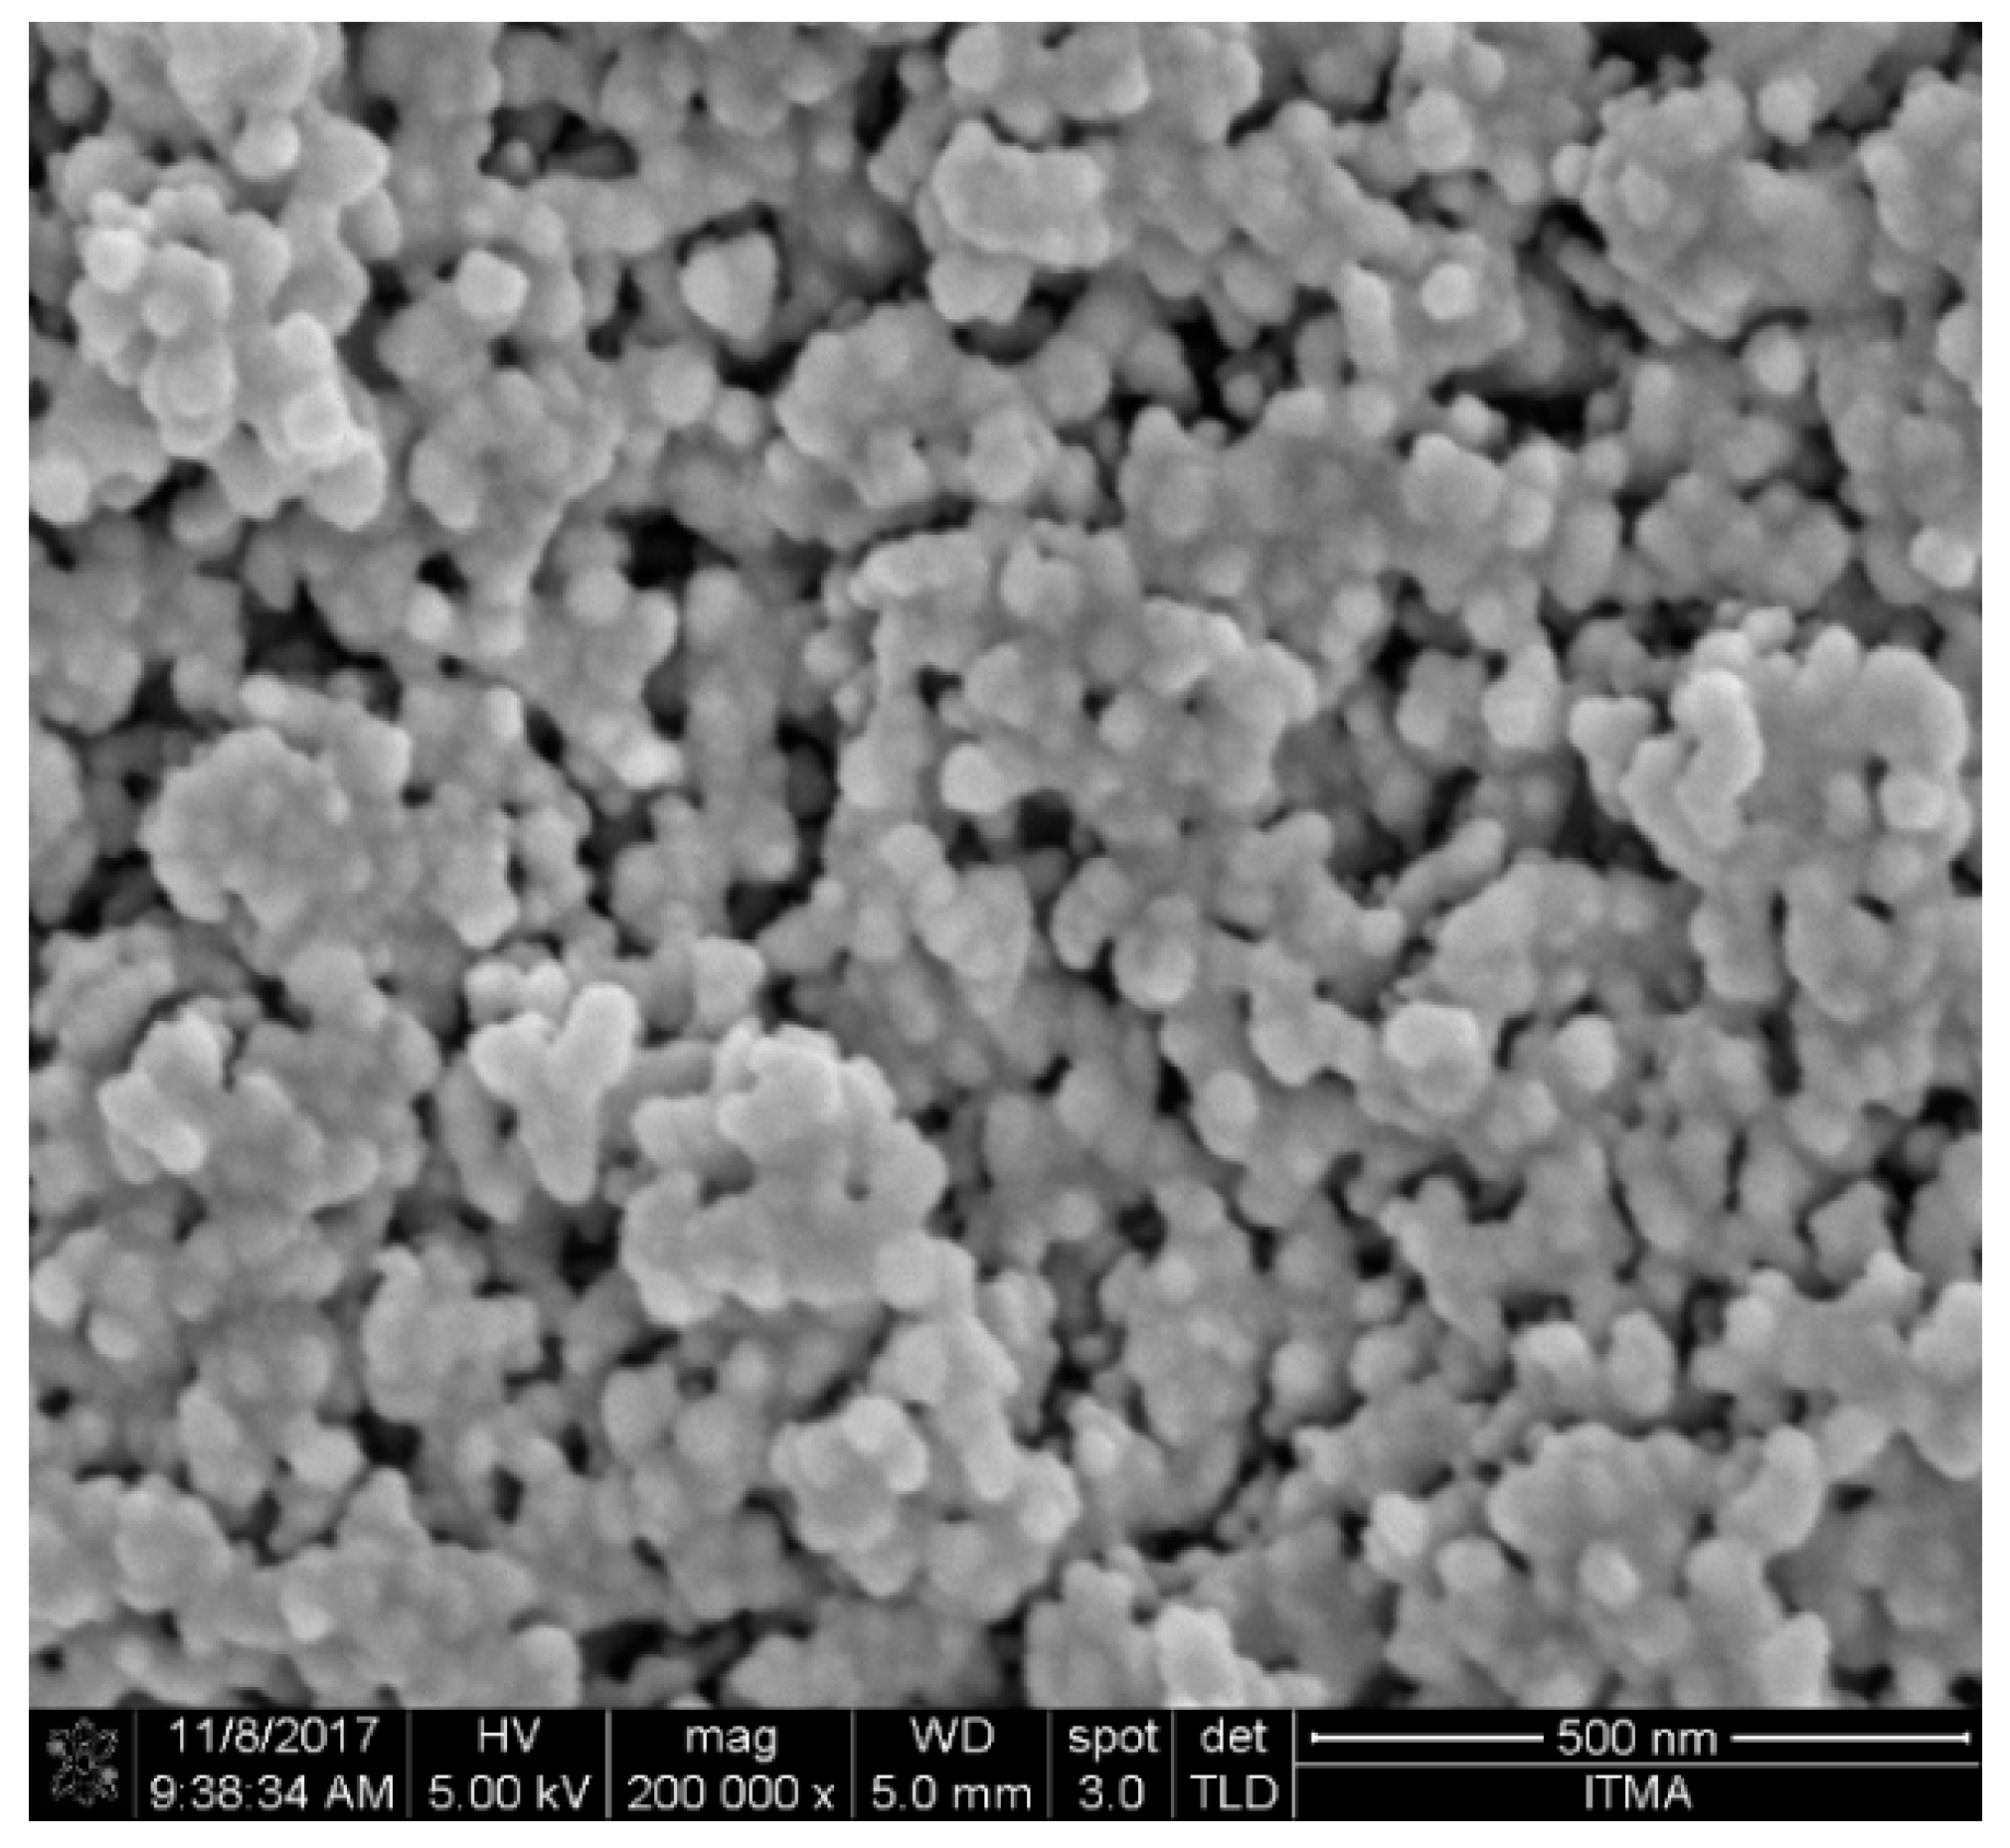
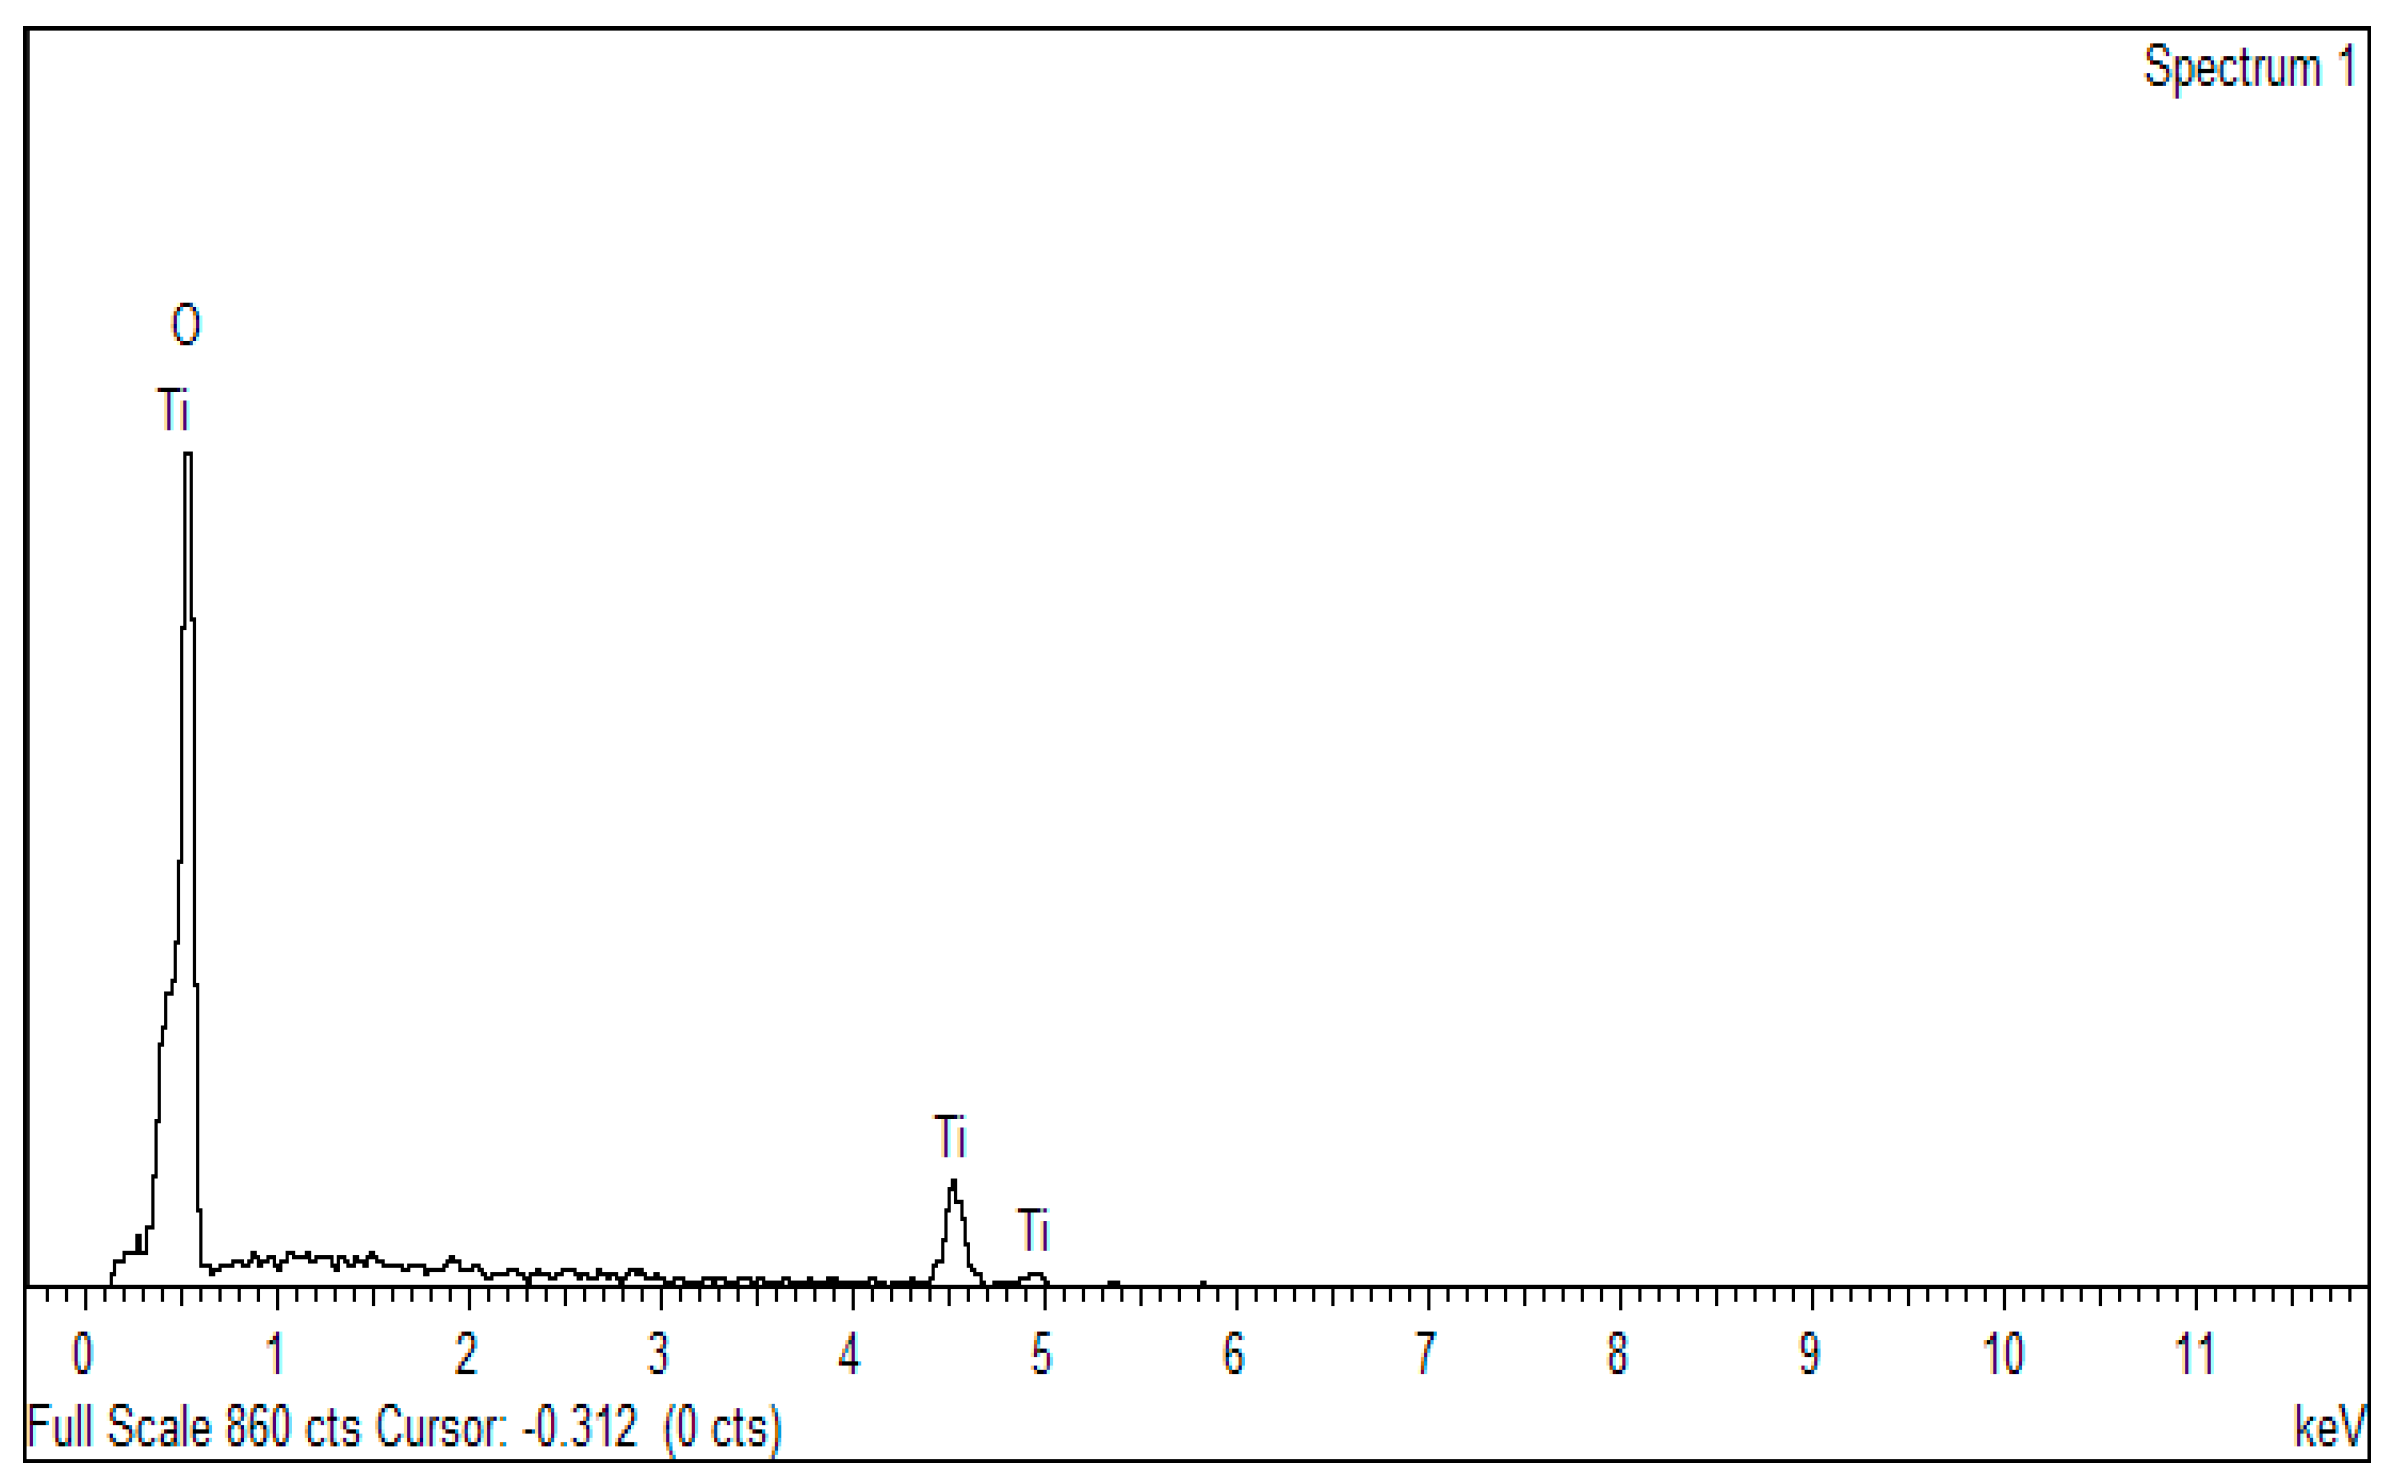
The morphology of the TiO2-B2O3 nanoparticles (NP) structure at a temperature of 500 °C is shown in Figure 5. It can be seen that the nanoparticles of TiO2 was clearly seen at 200k magnification. Field emission scanning electron microscopy (FESEM) images shown the uniformity of nanostructures due to the homogeneity of prepared paste. Average diameter of nanoparticles was observed to be in 40–70 nm. The EDX result showed that peak of Ti was detected at temperature of 500 °C as shown in Figure 6. These results confirmed that TiO2 was crystalline at this temperature. Thus, it has been chosen as the sensing film of the gas sensor, and will be tested with hydrogen exposure in gas chamber.
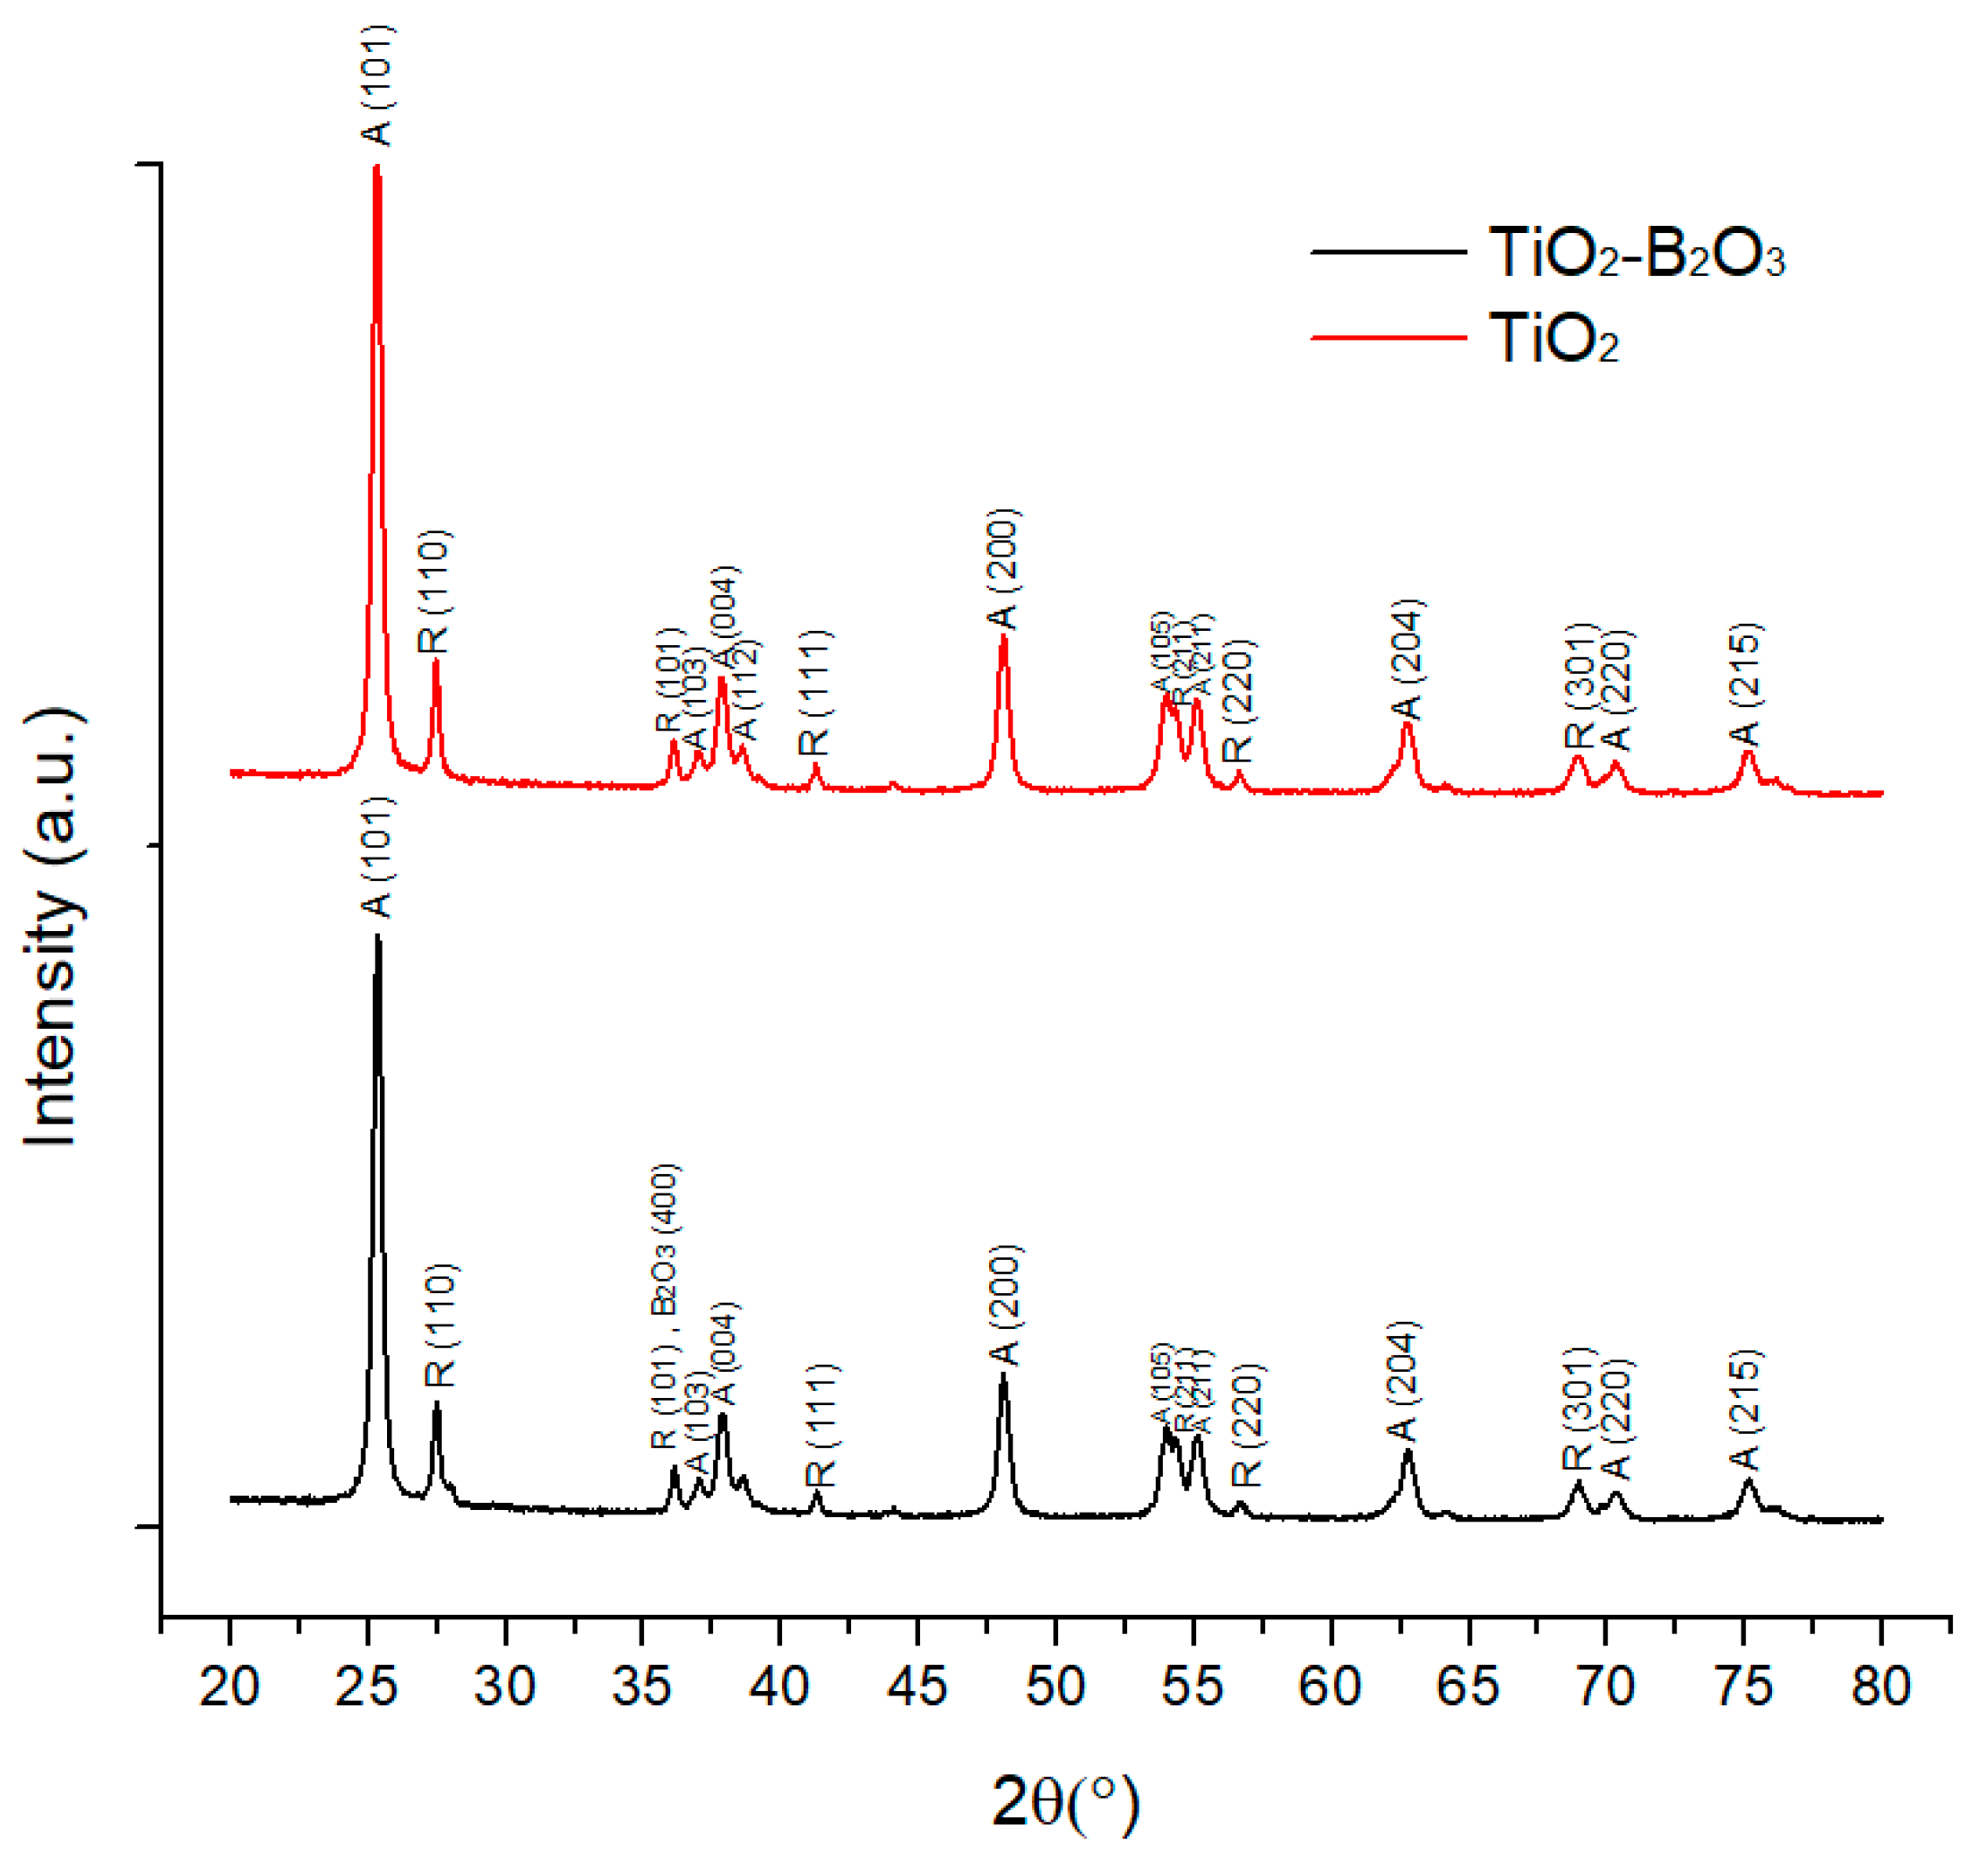
Figure 7 shows the XRD pattern of TiO2 (P25) and TiO2-B2O3 without heat treatment. XRD analyses were examined using X’Pert HighScore software. From XRD spectra, it can be seen that both figures (TiO2 and TiO2-B2O3) consisted of rutile and anatase phases. It can be observed that pure titanium had a peak at 2θ = 25.35° (Figure 7 and Figure 8). According to literature, this peak was attributed to the anatase (101) TiO2 phase. Whereas, a high peak of rutile phase (110) was located at 2θ = 27.49° (Figure 7 and Figure 8). It was reported that crystallinity of TiO2 was decreased with the addition of boron content [52]. This work also showed that the intensity of TiO2 was decreased when added with B2O3. It can also be seen that the peak of anatase (101) in TiO2-B2O3 was lower than peak of anatase (101) in TiO2 at 2θ = 25.35°. Meanwhile, a small peak of B2O3 was observed at 2θ = 36.04° in TiO2-B2O3. This phase also contributed to the rutile phase (101).
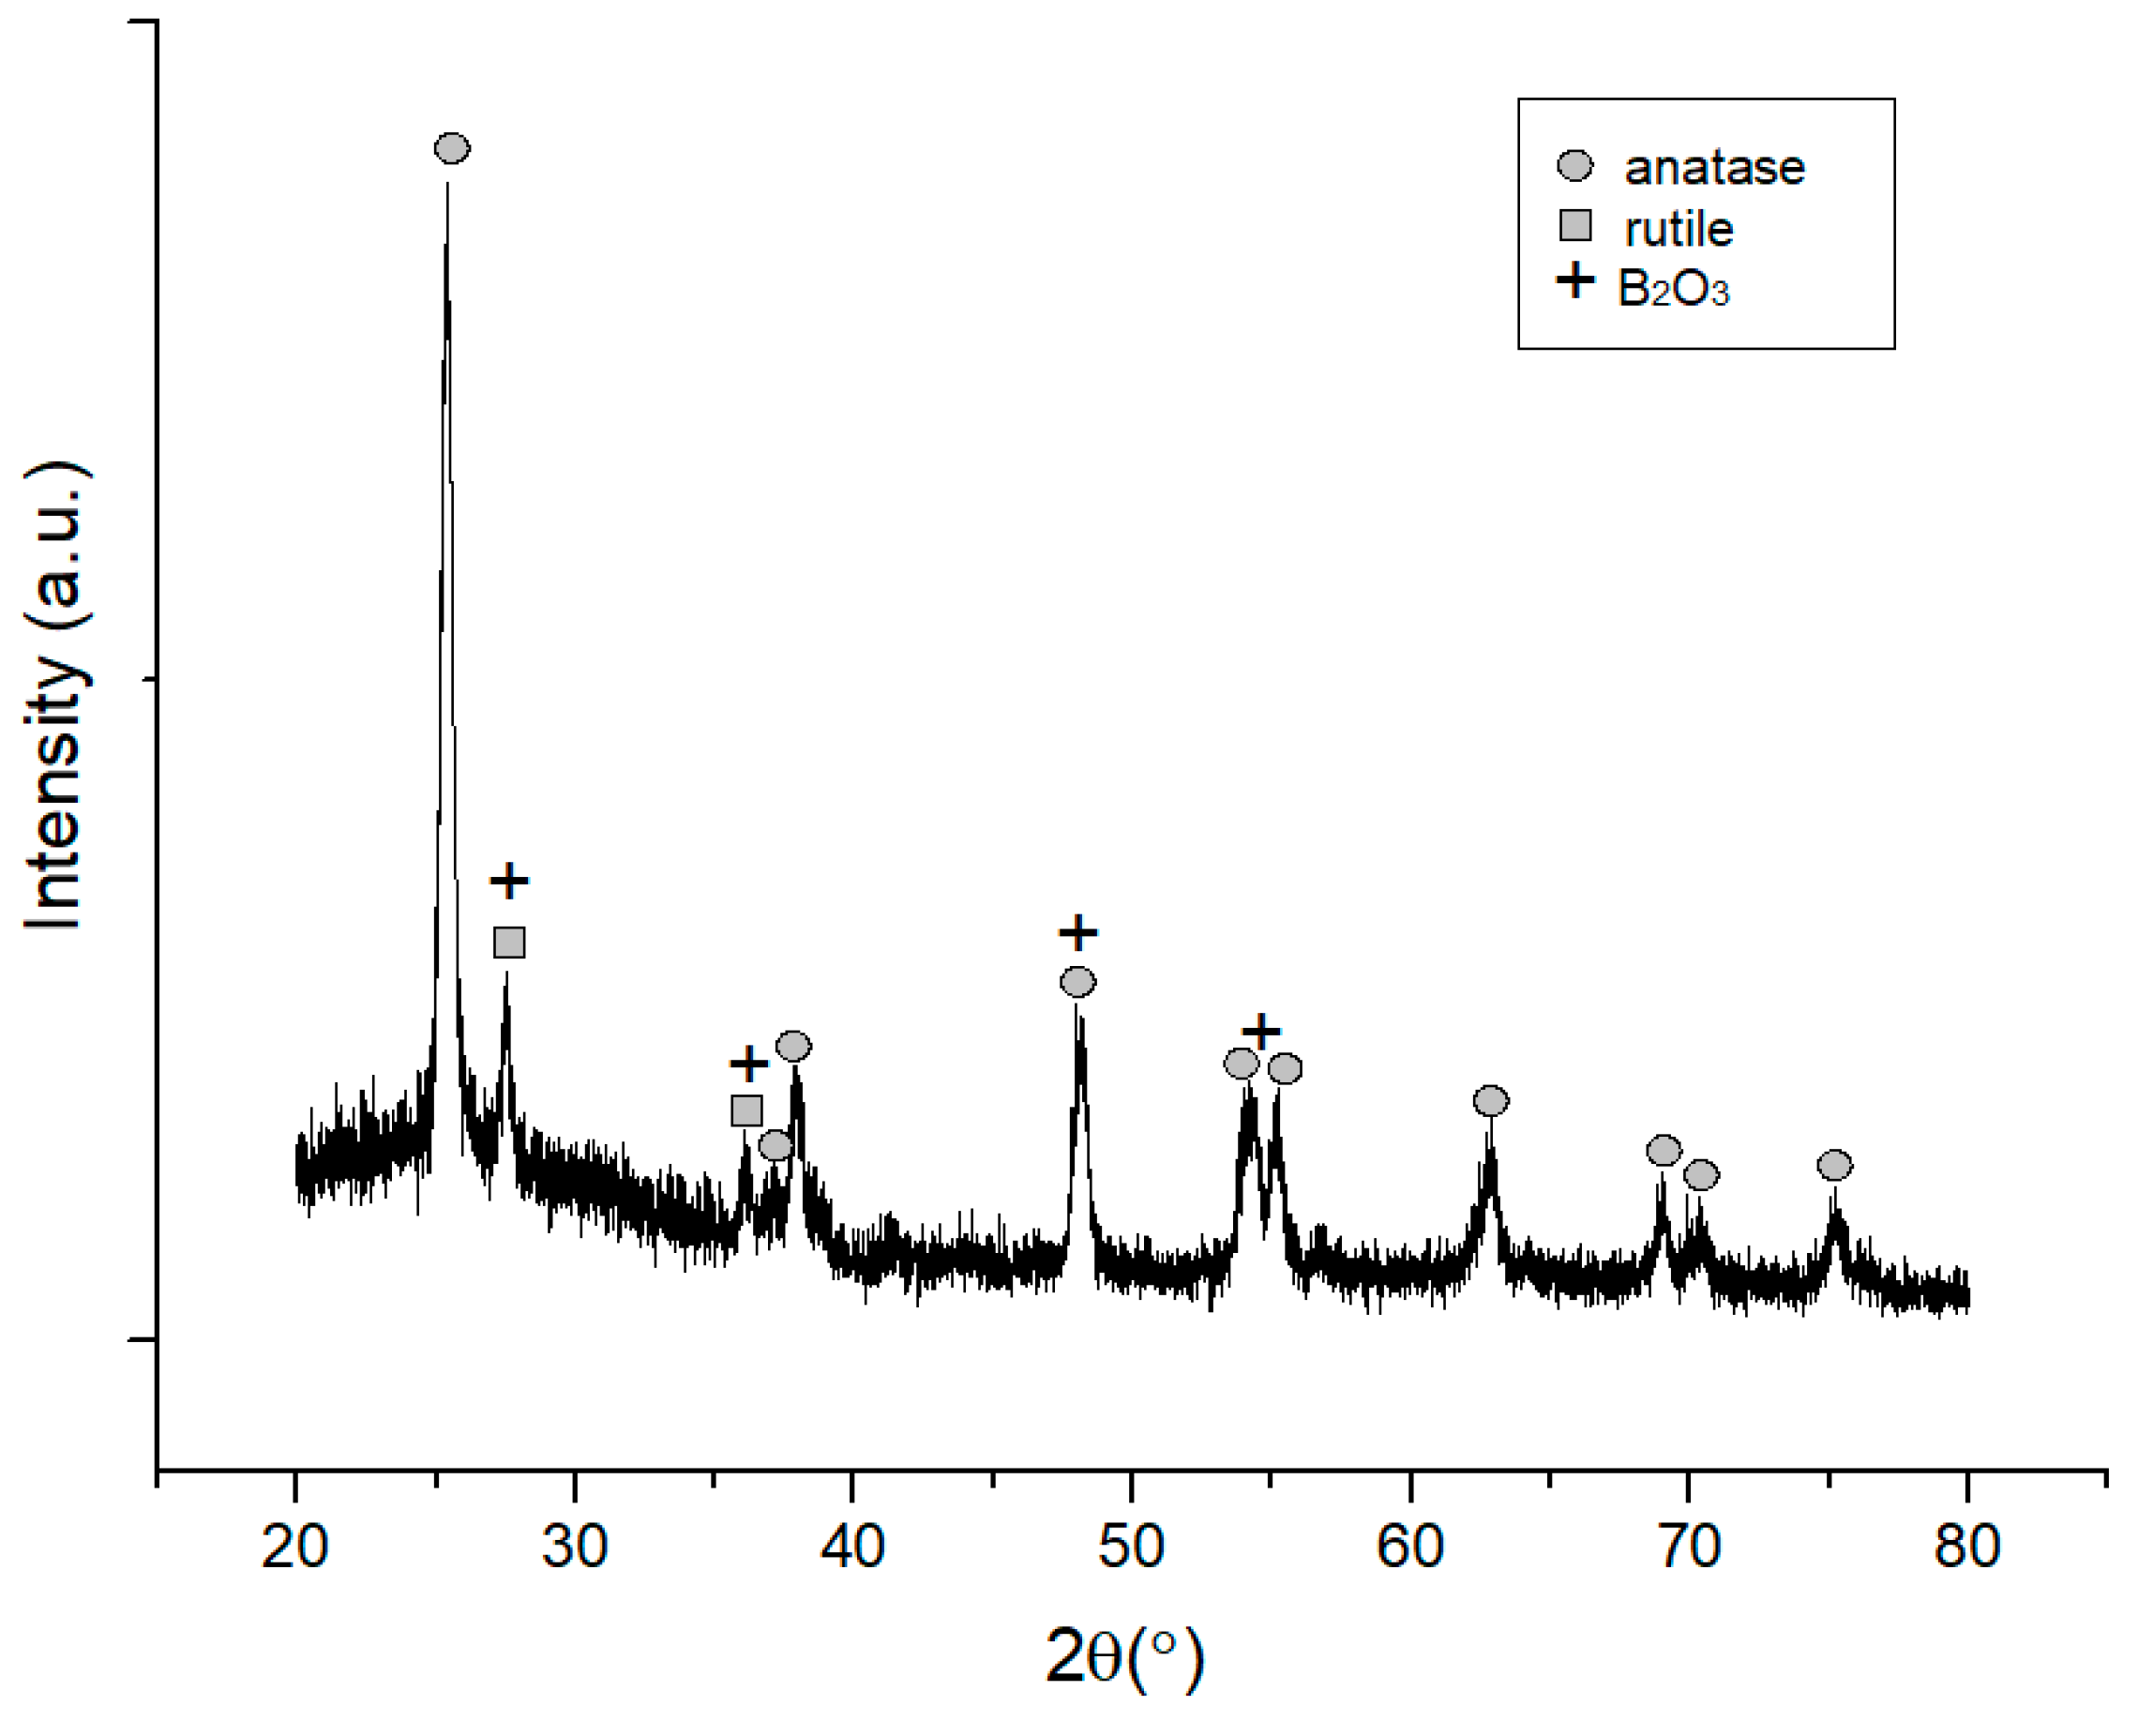
Figure 8 shows XRD pattern of TiO2-B2O3 thick film at T = 500 °C. It can be seen that, XRD pattern of anatase and rutile phases in TiO2-B2O3 thick film was similar as XRD pattern in Figure 7. Whereas, B2O3 peaks were also detected in thick film at 2θ = 27.76°, 36.04°, 48.37° and 54.58°. It was also observed that peaks of B2O3 were detected at similar location of anatase (2θ = 48.37°) and rutile phases (2θ = 27.76°, 36.04° and 54.58°). This analysis also indicated that the XRD pattern of TiO2 was not affected by the presence of B2O3.
3.2. Electrical Characteristics of TiO2-B2O3 Gas Sensor
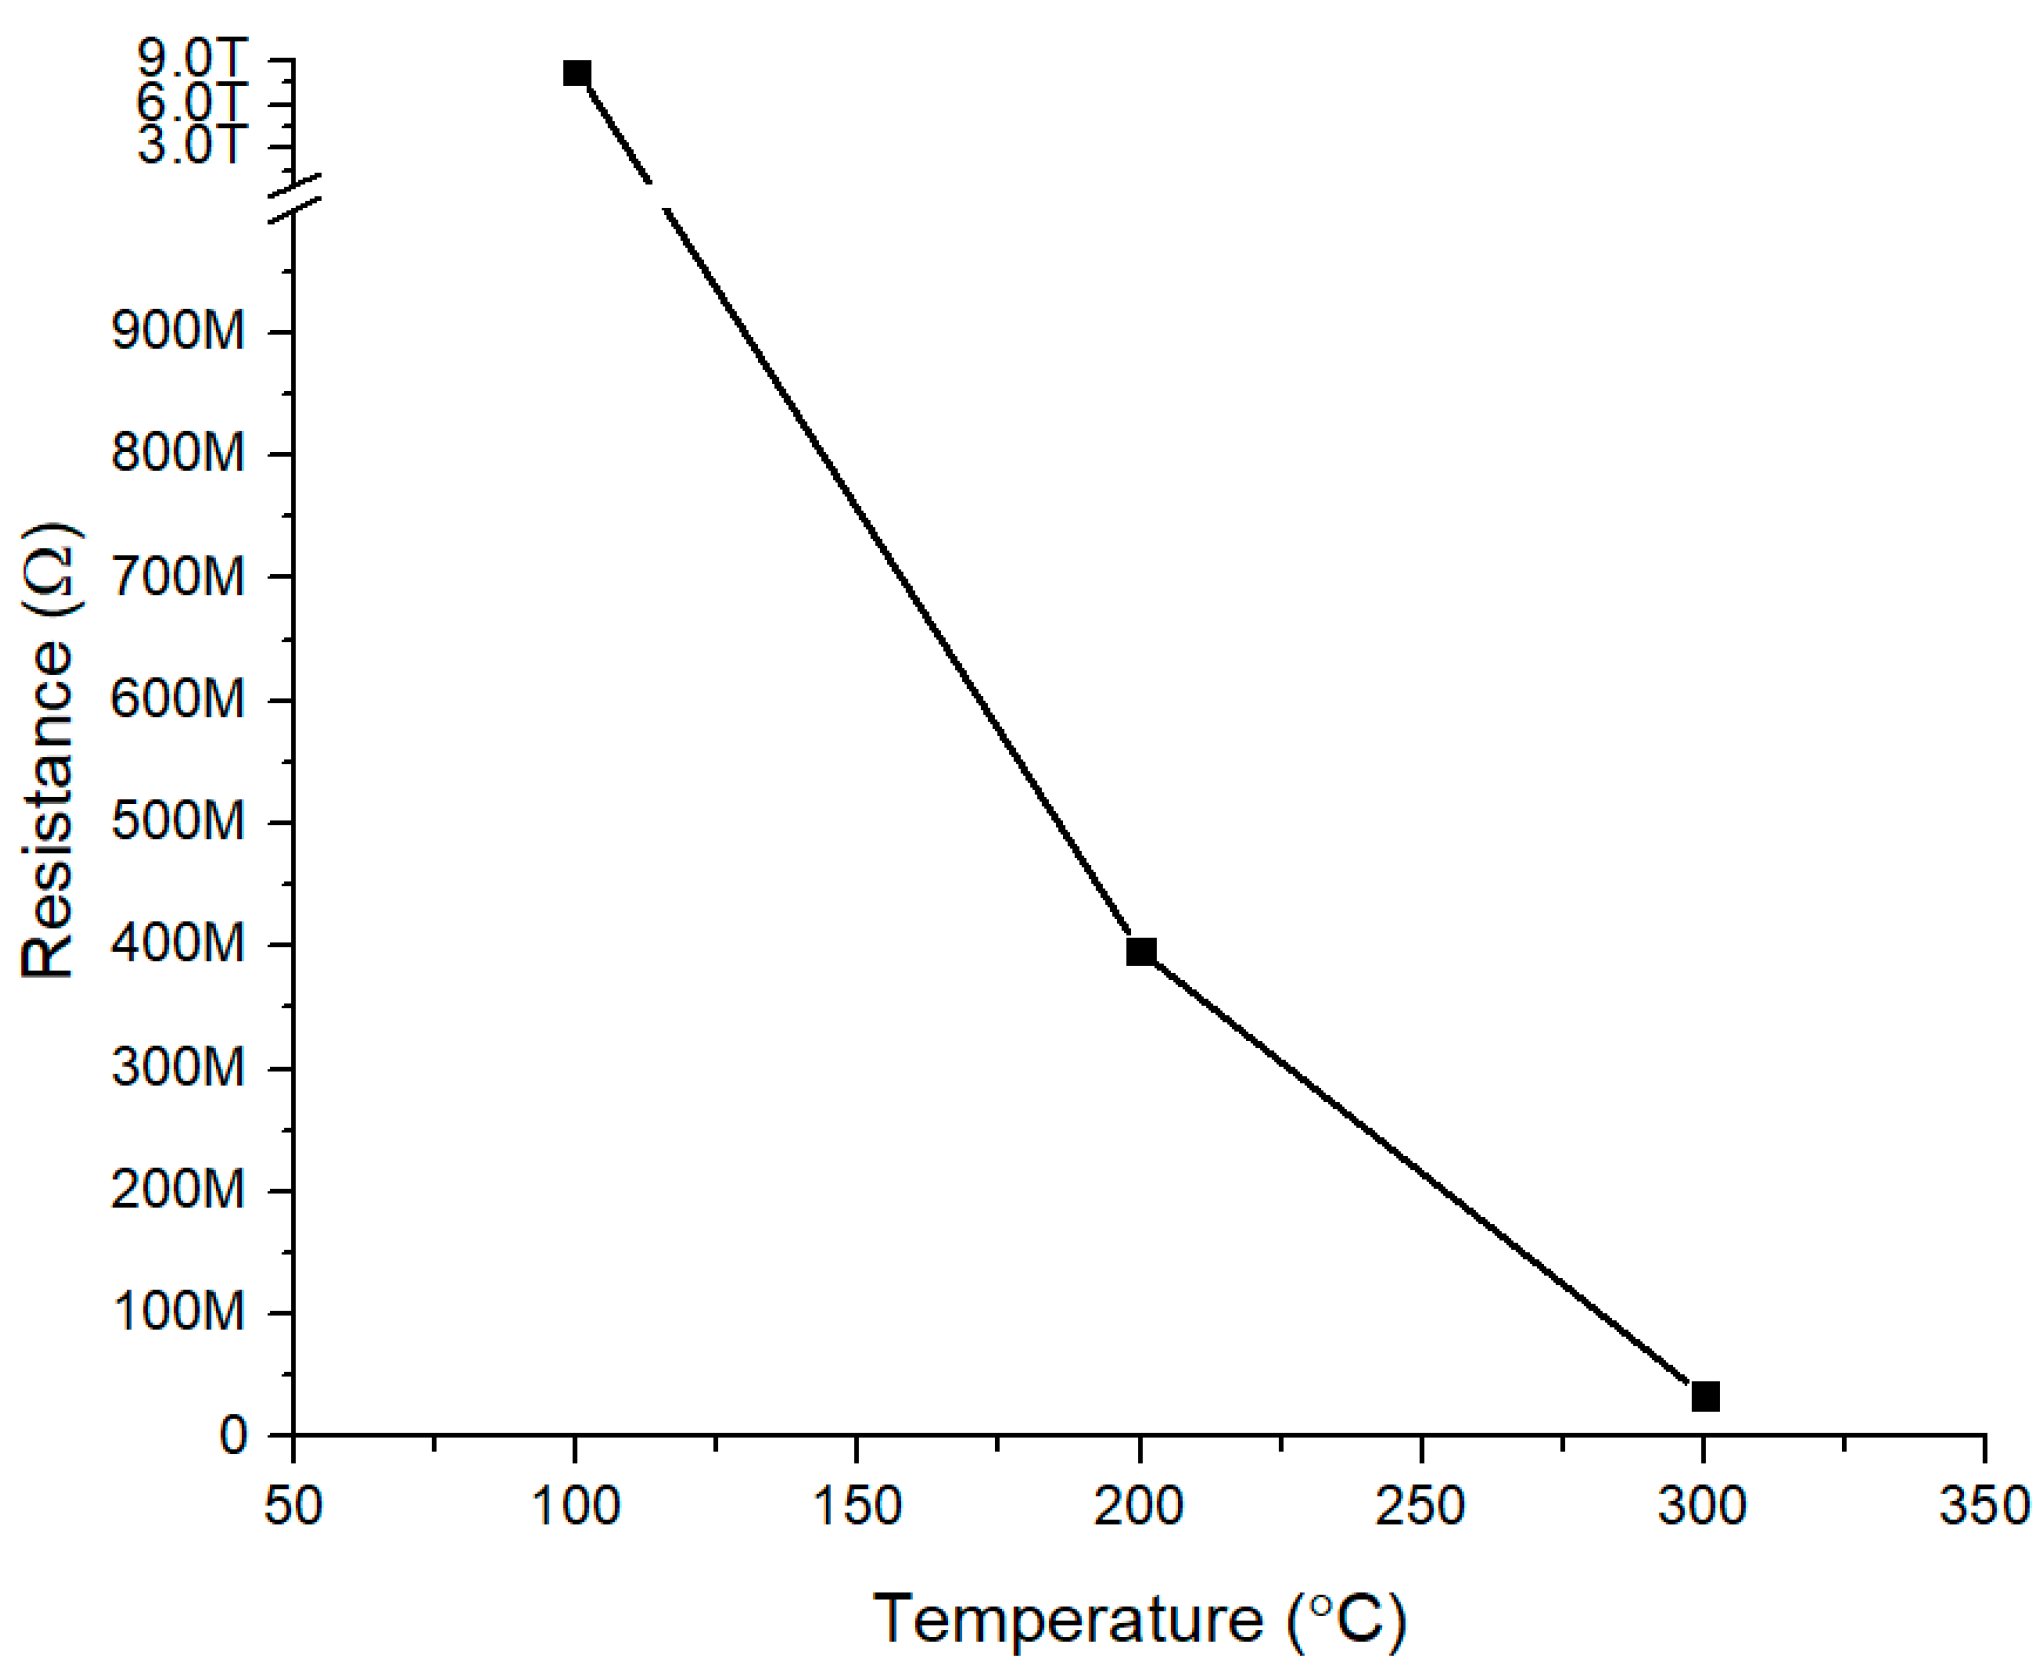
Electrical characteristics of the TiO2-B2O3 gas sensor that annealed at 500 °C were studied. Figure 9 shows the resistance of TiO2-B2O3 gas sensor at the operating temperatures: 100 °C, 200 °C, and 300 °C. The graph showed that resistance was approximately 8.36 TΩ at 100 °C. This caused the range of current to be below than 1 pA. The resistance was dropped sharply at a temperature of 200 °C and 300 °C, where the values were approximately 39.59 GΩ and 33.74 MΩ respectively. This phenomenon can be caused by the conversion of silver (electrode) to metallic silver at operating temperatures of 200 °C and 300 °C, where it was decomposed into silver and oxygen [53]. This metallic silver has decreased the resistivity of the gas sensor and improved the conductivity of the gas sensor.
3.3. Performance of TiO2-B2O3 Gas Sensor at Different Operating Temperatures
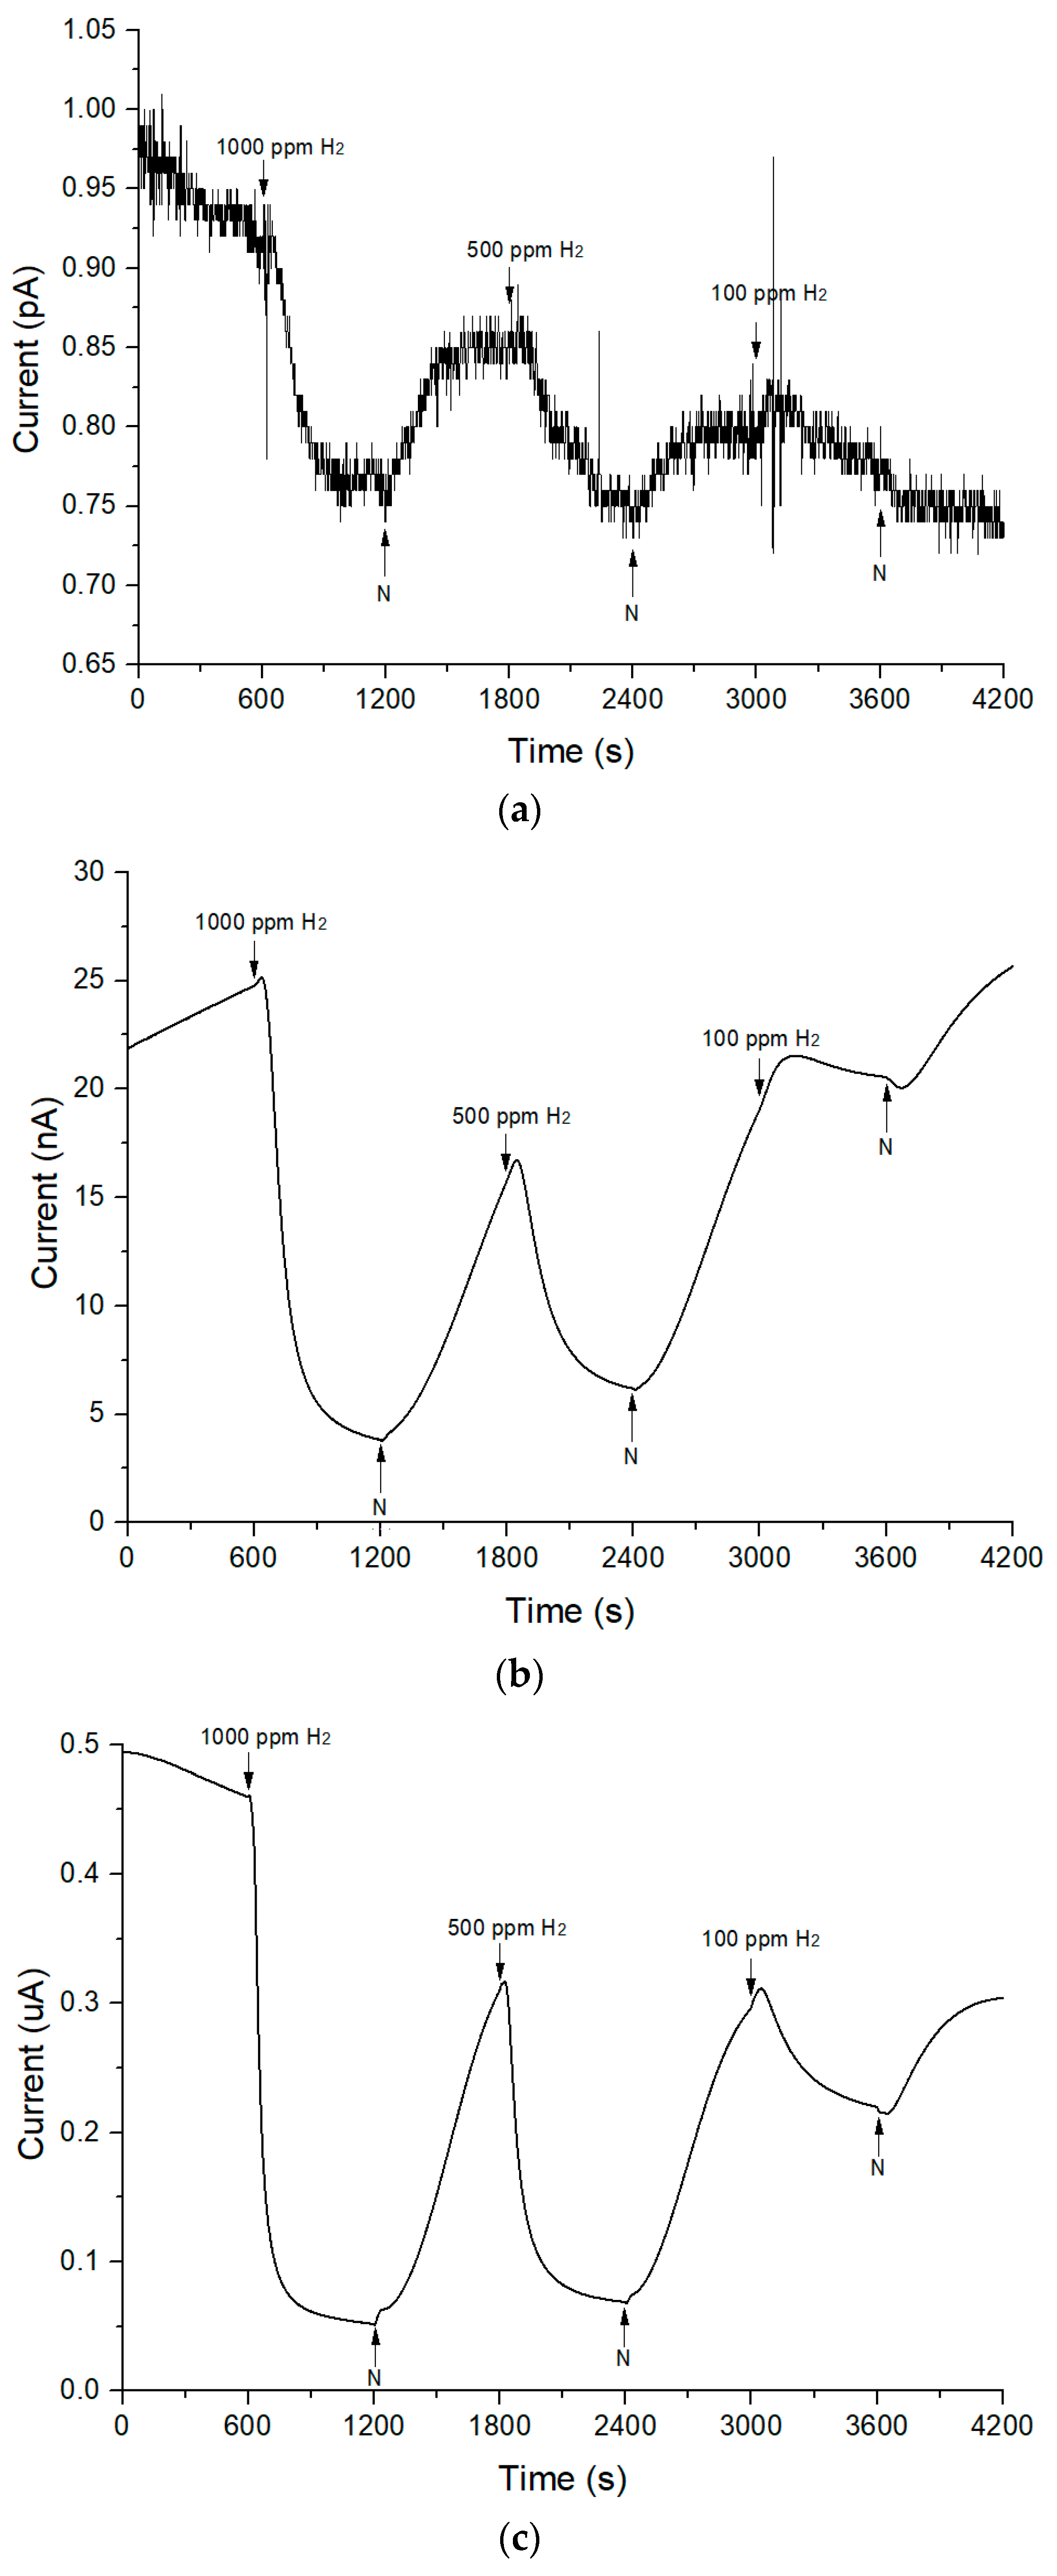
Figure 10 shows the response of TiO2-B2O3 gas sensors at operating temperatures: 100 °C, 200 °C and 300 °C. It can be seen that in Figure 10a, the measurement was quite sensitive to noise when the experiment was carried out at 100 °C. It was observed that the response was not as smooth as the response in Figure 10b,c. This environment occurred because the measured current was very low, which is below than 1 pA. As the operating temperature increased, the observed current started to increase and showed high response to hydrogen. From experiments have been conducted, TiO2-B2O3 gas sensor able to sense low concentration of hydrogen as low as 100 ppm at 100 °C. However, it also has been observed that the TiO2-B2O3 gas sensor was unable to operate at room temperature. Response showed that the observed current was decreased when exposed to hydrogen and it was increased when exposed to the nitrogen. It also means that resistance of TiO2-B2O3 increased when exposed to the hydrogen and decreased when exposed to the nitrogen. This behavior indicated that TiO2-B2O3 gas sensor is a p-type gas sensor based on its response. P-type responses might be caused by diffusion of silver into TiO2. Sheini and Rohani [51] have compared the sensing mechanism of TiO2 to reducing gas before and after silver diffusion into TiO2 and found that sensing mechanism of gas sensor has been changed to p-type when silver diffused into TiO2. The sensitivity of p-type gas sensor can be calculated as follows [54]:
where RH2 is resistance in hydrogen flow and RN is initial resistance in nitrogen flow.
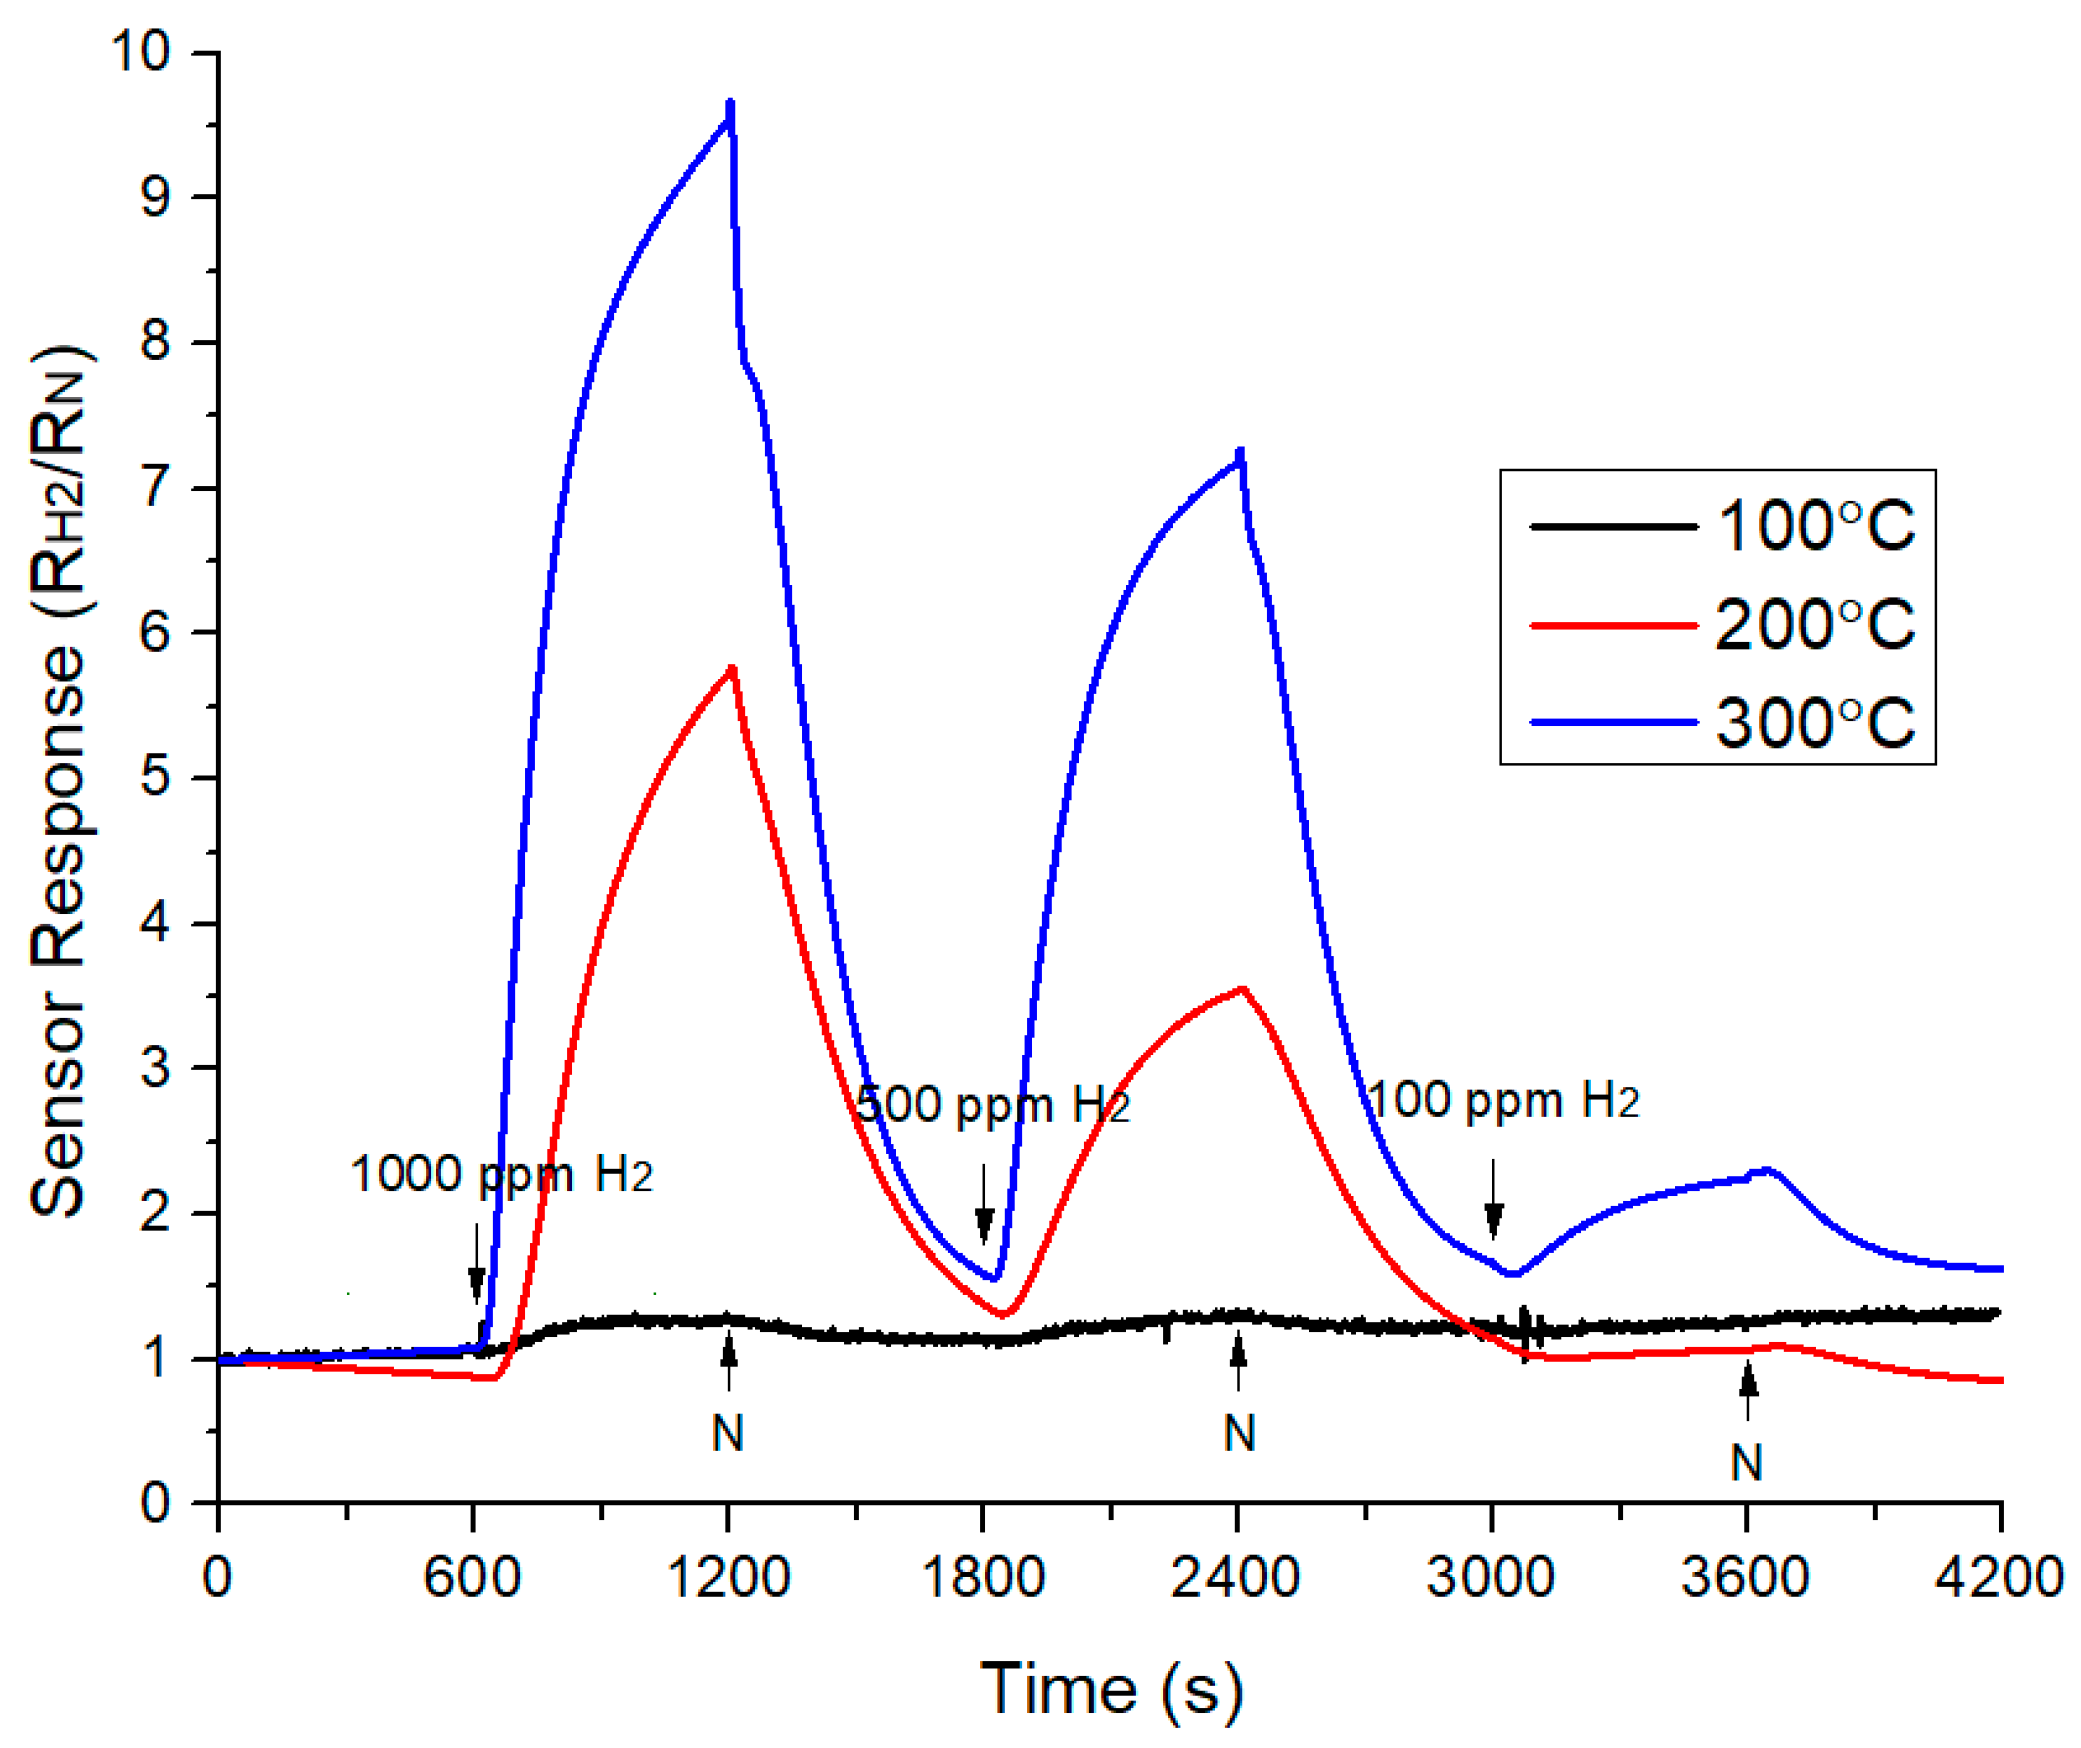
Comparison of sensor response at different operating temperature is shown in Figure 11. The gas sensor responded well to hydrogen. It also found that the responses values were unable to return to the original value, which is 1. This indicated that the responses were not fully recovered when nitrogen was flowed to the gas chamber. It can be seen that the value of sensor response was very low at an operating temperature of 100 °C compared to the operating temperature at 200 °C and 300 °C. The highest peak of sensor response was achieved at an operating temperature of 300 °C. The sensitivity was increased when the operating temperature was higher. The sensitivity of 100 ppm of H2 was the lowest at an operating temperature 200 °C due to the sensor response being the lowest at this temperature (Figure 10). Among three different temperatures, highest sensitivity was obtained at an operating temperature of 300 °C and the sensitivity values were 2.30, 7.28, and 9.68 at 100 ppm, 500 ppm, and 1000 ppm respectively. From observation, it can be concluded that resistance was decreased when temperature was increased. These indicated that flow of current will become higher as temperature increased, where more electrons can pass through the gas sensor and increase the conductivity. Overall, it can improve the sensitivity of the gas sensor.
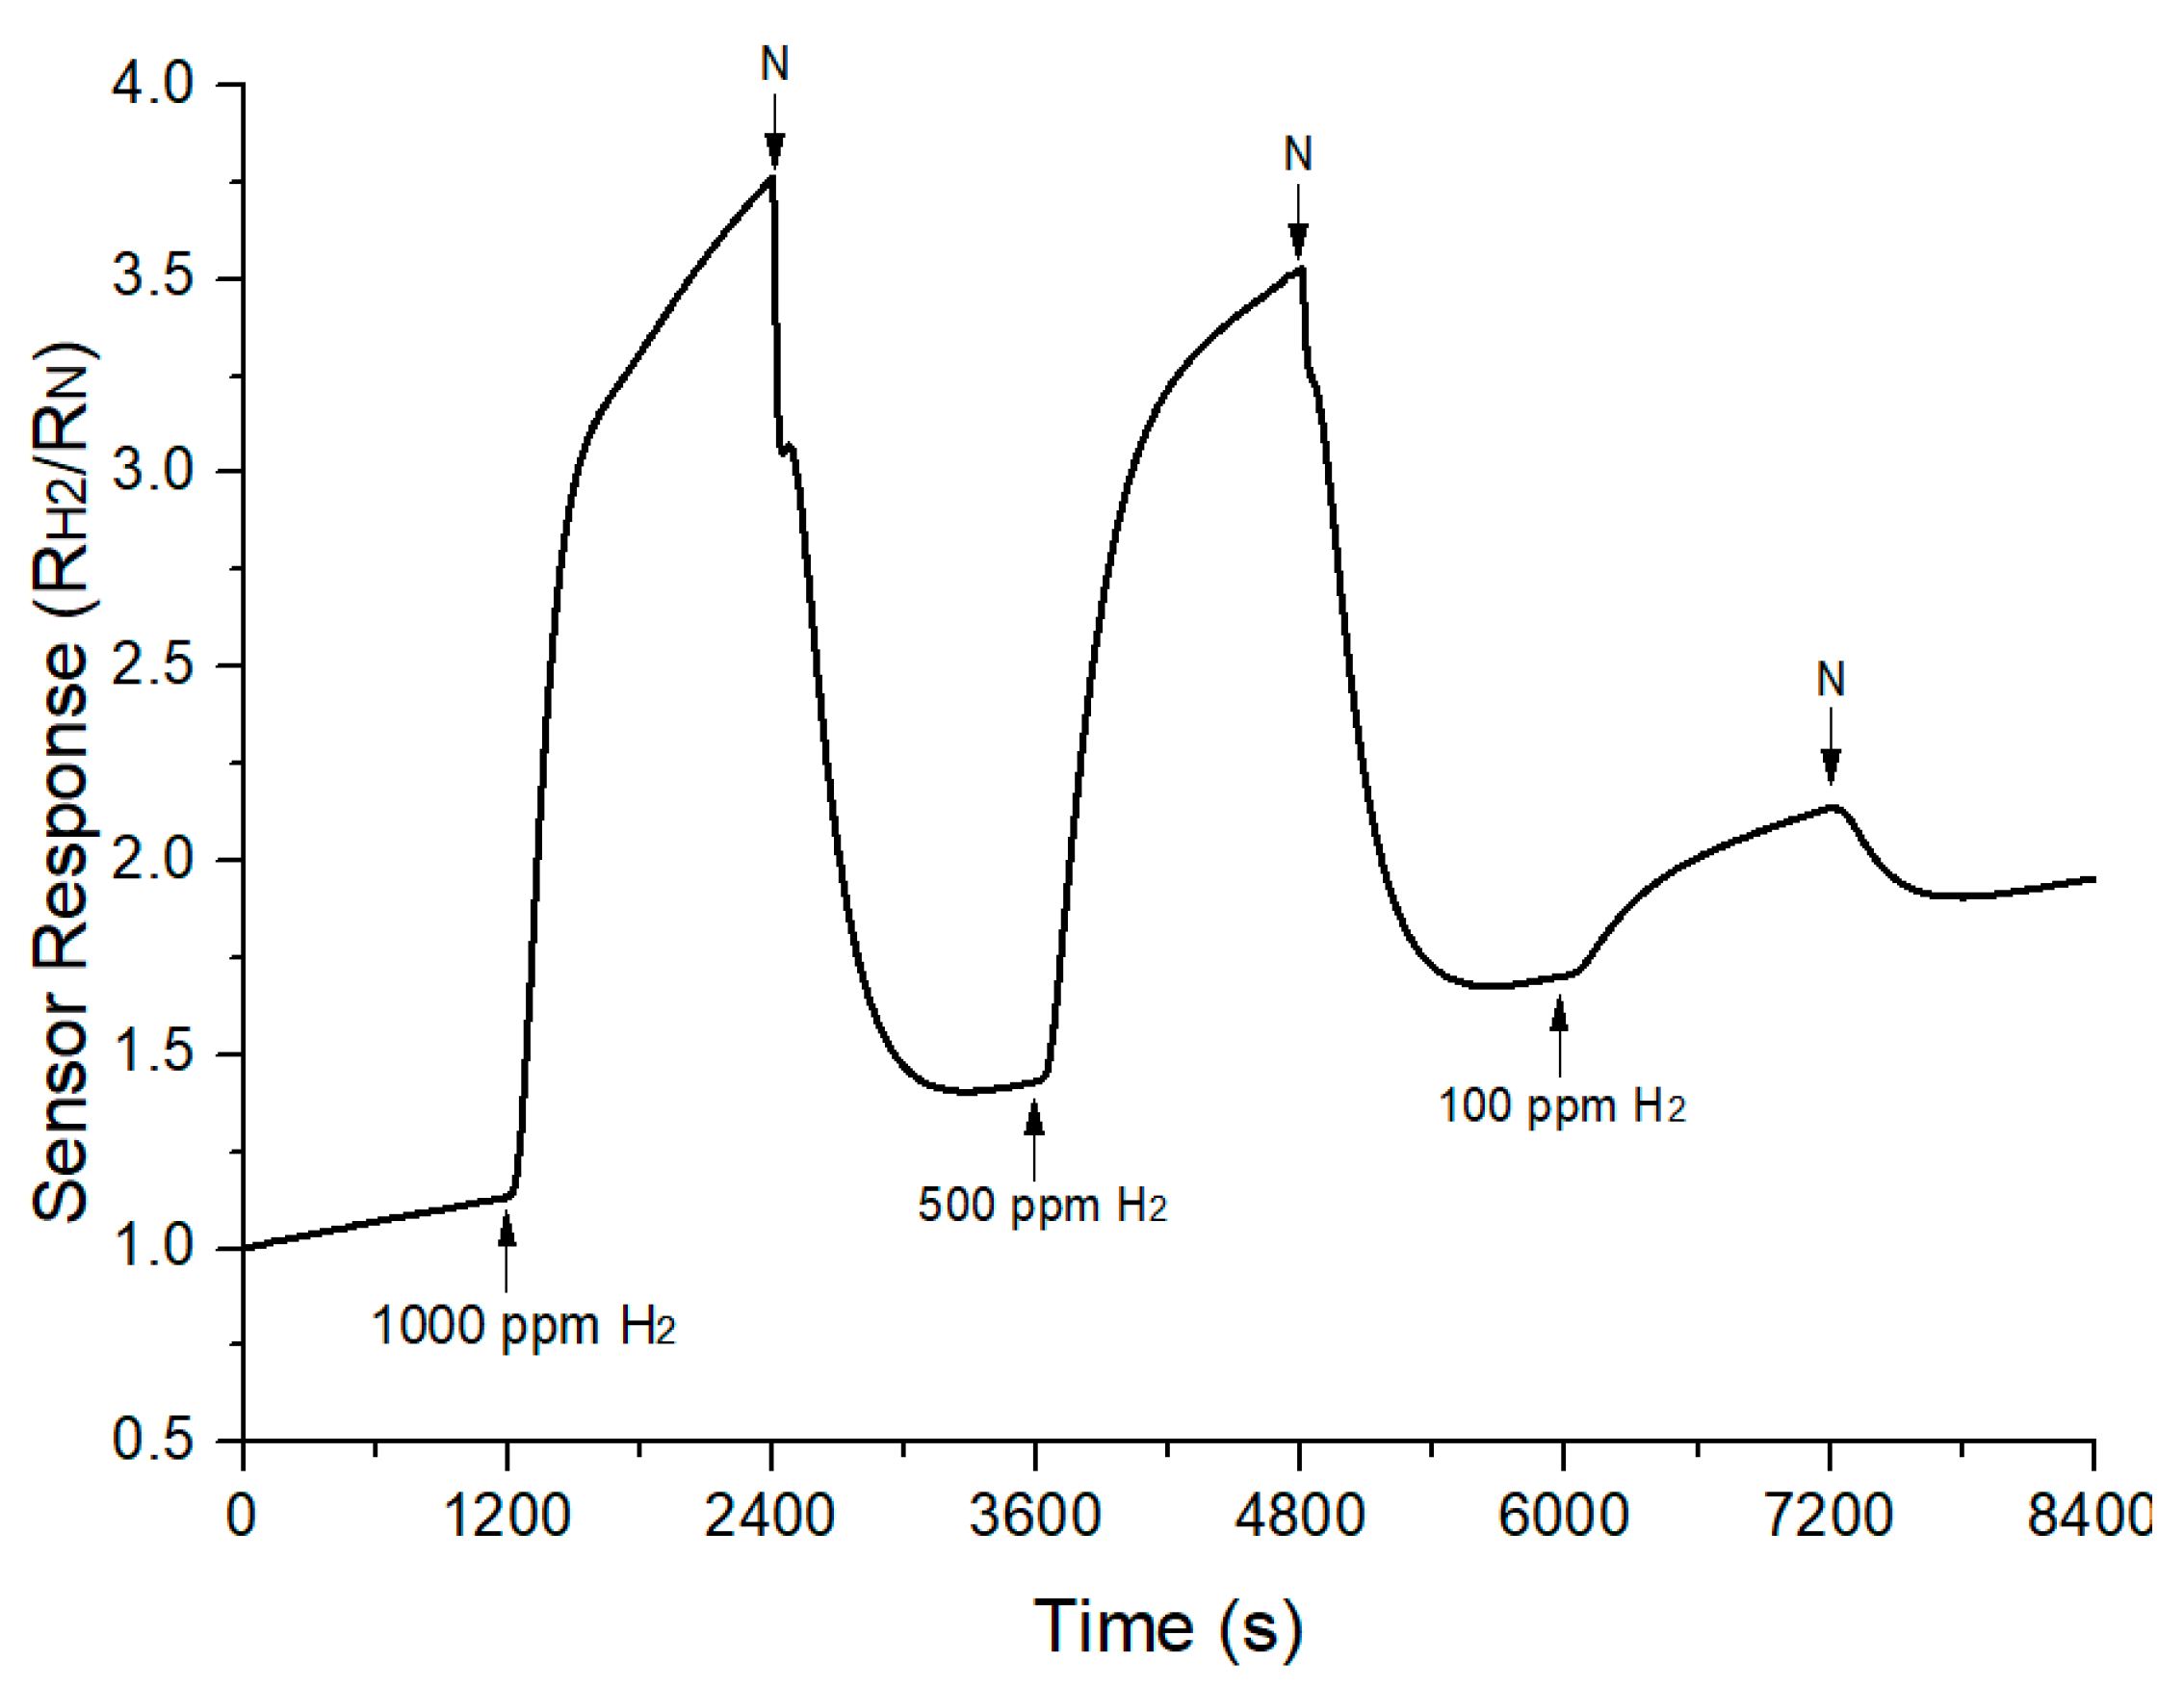
In term of stability and repeatability properties of TiO2-B2O3 gas sensor, the same sample has been exposed to hydrogen at optimal operating temperature, which is at 300 °C. The cycle time of hydrogen and nitrogen was increased to 1200 s for this measurement. The sensor response of TiO2-B2O3 gas sensor is shown in Figure 12. It can be seen that the gas sensor was unable to recover well when exposed to hydrogen even though the cycle time has been increased to two-fold from the previous measurement. However, this measurement has shown the gas sensor has repeatability properties without large drift, based on its similar behavior when exposed to hydrogen. In terms of stability properties, the gas sensor can be considered to have good stability, since the sensitivity reduced to 61.16% after six months. Sensitivity decreases with time have also been reported in [55,56].
4. Conclusions
A TiO2-B2O3 gas sensor that calcined at 500 °C has shown good performance to low concentrations of hydrogen, as low as 100 ppm at different operating temperatures. The gas sensor also showed an ability to perform at low operating temperatures, to as low as 100 °C. Responses showed that the TiO2-B2O3 gas sensor behaved as a p-type gas sensor, based on decreased currents when exposed to hydrogen. Results showed that highest sensitivity was achieved at an operating temperature of 300 °C with sensitivity values at 1.44, 4.60, and 8.90 for 100 ppm, 500 ppm, and 1000 ppm respectively.
Author Contributions
Formal Analysis, N.H.A.; Writing-Original Draft Preparation, S.A.M.C.; Supervision, M.N.H., M.S.M., and M.E.
Funding
This research was funded by Research Management Centre, Universiti Putra Malaysia.
Acknowledgments
The author would like to thank members of Physic Laboratory, Science Faculty, Ataturk University for providing facilities for gas sensor measurement.
Conflicts of Interest
The authors declare no conflict of interest.
References
- Hübert, T.; Boon-Brett, L.; Palmisano, V.; Bader, M.A. Developments in gas sensor technology for hydrogen safety. Int. J. Hydrog. Energy 2004, 39, 20474–20483. [Google Scholar] [CrossRef]
- Hubert, T.; Boon-Brett, L.; Black, G.; Banach, U. Hydrogen sensors—A review. Sens. Actuators B Chem. 2011, 157, 329–352. [Google Scholar] [CrossRef]
- Hirth, J.P. Effects of Hydrogen on the Properties of Iron and Steel. Metall. Trans. A 1980, 11, 861–890. [Google Scholar] [CrossRef]
- Jones, T.A.; Walsh, P.T. Flammable gas detection—The role of the platinum metals. Platin. Met. Rev. 1988, 32, 50–60. [Google Scholar]
- Lewis, F.A. The Palladium-Hydrogen System a Survey of Hydride Formation and the Effects. Platin. Met. Rev. 1982, 26, 20–27. [Google Scholar]
- Lee, E.; Min, J.; Lee, E.; Noh, J.; Hyoun, J.; Jung, B.; Lee, W. Hydrogen gas sensing performance of Pd–Ni alloy thin films. Thin Solid Films 2010, 519, 880–884. [Google Scholar] [CrossRef]
- Im, Y.; Lee, C.; Vasquez, R.P.; Bangar, M.A.; Myung, N.V.; Menke, E.; Penner, R.M.; Yun, M. Investigation of a Single Pd Nanowire for Use as a Hydrogen Sensor. Small 2006, 2, 356–358. [Google Scholar] [CrossRef] [PubMed]
- Atashbar, M.Z.; Banerji, D.; Singamaneni, S. Room-temperature hydrogen sensor based on palladium nanowires. IEEE Sens. J. 2005, 5, 792–797. [Google Scholar] [CrossRef]
- Yun, M.; Myung, N.V.; Vasquez, R.P.; Lee, C.; Menke, E.; Penner, R.M. Electrochemically grown wires for individually addressable sensor arrays. Nano Lett. 2004, 4, 419–422. [Google Scholar] [CrossRef]
- Xu, T.; Zach, M.P.; Xiao, Z.L.; Rosenmann, D.; Welp, U.; Kwok, W.K.; Crabtree, G.W. Self-assembled monolayer-enhanced hydrogen sensing with ultrathin palladium films. Appl. Phys. Lett. 2005, 86, 203104. [Google Scholar] [CrossRef]
- Tien, C.L.; Chen, H.W.; Liu, W.F.; Jyu, S.S.; Lin, S.W.; Lin, Y.S. Hydrogen sensor based on side-polished fiber Bragg gratings coated with thin palladium film. Thin Solid Films 2008, 516, 5360–5363. [Google Scholar] [CrossRef]
- Cabrera, A.L. Hydrogen absorption in palladium films sensed by changes in their resistivity. Science 1997, 45, 79–83. [Google Scholar]
- Öztürk, S.; Kılınç, N. Pd thin films on flexible substrate for hydrogen sensor. J. Alloy. Compd. 2016, 674, 179–184. [Google Scholar] [CrossRef]
- Kyun, T.K.; Sang, J.S.; Sung, M.C. Hydrogen gas sensor using Pd nanowires electro-deposited into anodized alumina template. IEEE Sens. J. 2006, 6, 509–513. [Google Scholar] [CrossRef]
- Noh, L.-S.; Lee, J.M. Low-Dimensional Palladium Nanostructures for Fast and Reliable Hydrogen Gas Detection. Sensors 2011, 11, 825–851. [Google Scholar] [CrossRef] [PubMed] [Green Version]
- Zhang, D.; Sun, Y.; Jiang, C.; Zhang, Y. Room temperature hydrogen gas sensor based on palladium decorated tin oxide/molybdenum disulfide ternary hybrid via hydrothermal route. Sens. Actuators B Chem. 2017, 242, 15–24. [Google Scholar] [CrossRef]
- Tournier, G.; Pijolat, C. Selective filter for SnO2-based gas sensor: Application to hydrogen trace detection. Sens. Actuators B Chem. 2005, 106, 553–562. [Google Scholar] [CrossRef]
- Shukla, S.; Ludwig, L.; Parrish, C.; Seal, S. Inverse-catalyst-effect observed for nanocrystalline-doped tin oxide sensor at lower operating temperatures. Sens. Actuators B Chem. 2005, 104, 223–231. [Google Scholar] [CrossRef]
- Xue, N.; Zhang, Q.; Zhang, S.; Zong, P.; Yang, F. Highly Sensitive and Selective Hydrogen Gas Sensor Using the Mesoporous SnO2 Modified Layers. Sensors 2017, 17, 2351. [Google Scholar] [CrossRef] [PubMed]
- Rashid, T.R.; Phan, D.T.; Chung, G.S. A flexible hydrogen sensor based on Pd nanoparticles decorated ZnO nanorods grown on polyimide tape. Sens. Actuators B Chem. 2013, 185, 777–784. [Google Scholar] [CrossRef]
- Phan, D.-T.; Chung, G.-S. Effects of different morphologies of ZnO films on hydrogen sensing properties. J. Electroceram. 2014, 32, 353–360. [Google Scholar] [CrossRef]
- Anand, K.; Singh, O.; Pal, M.; Kaur, J.; Chand, R. Hydrogen sensor based on graphene/ZnO nanocomposite. Sens. Actuators B Chem. 2014, 195, 409–415. [Google Scholar] [CrossRef]
- Cardoza-Contreras, M.N.; Romo-Herrera, J.M.; Ríos, L.A.; García-Gutiérrez, R.; Zepeda, T.A.; Contreras, O.E. Single ZnO Nanowire-based gas sensors to detect low concentrations of hydrogen. Sensors 2015, 15, 30539–30544. [Google Scholar] [CrossRef] [PubMed]
- Postica, V.; Reimer, T.; Lazari, E.; Ababii, N.; Shishiyanu, S.; Railean, S.; Kaidas, V.; Kaps, S.; Synthesis, A.; Nanostructured, U.T. Sensing Properties of Ultra-Thin TiO2 Nanostructured Films Based Sensors. In Proceedings of the 3rd International Conference on Nanotechnologies and Biomedical Engineering, Chisinau, Moldova, 23–26 September 2015. [Google Scholar]
- Krško, O.; Plecenik, T.; Roch, T.; Grančič, B.; Satrapinskyy, L.; Truchlý, M.; Ďurina, P.; Gregor, M.; Kúš, P.; Plecenik, A. Flexible highly sensitive hydrogen gas sensor based on a TiO2 thin film on polyimide foil. Sens. Actuators B Chem. 2017, 240, 1058–1065. [Google Scholar] [CrossRef]
- Zhang, M.L.; Ning, T.; Zhang, S.; Li, Z.; Cao, Q.; Yuan, Z. Response time and mechanism of Pd modified TiO2 gas sensor. Mater. Sci. Semicond. Process. 2014, 20, 375–380. [Google Scholar] [CrossRef]
- Peng, X.; Wang, Z.; Huang, P.; Chen, X.; Fu, X.; Dai, W. Comparative study of two different TiO2 film sensors on response to H2 under UV light and room temperature. Sensors 2016, 16, 1249. [Google Scholar] [CrossRef] [PubMed]
- Krško, O.; Plecenik, T.; Moško, M.; Haidry, A.A.; Ďurina, P.; Truchlý, M.; Grančič, B.; Gregor, M.; Roch, T.; Satrapinskyy, L.; et al. Highly Sensitive Hydrogen Semiconductor Gas Sensor Operating at Room Temperature. Procedia Eng. 2015, 120, 618–622. [Google Scholar] [CrossRef]
- Zhang, M.; Yuan, Z.; Song, J.; Zheng, C. Improvement and mechanism for the fast response of a Pt/TiO2 gas sensor. Sens. Actuators B Chem. 2010, 148, 87–92. [Google Scholar] [CrossRef]
- Alev, O.; Erdem, Ş.; Necmettin, K.; Ziya, Z. Gas sensor application of hydrothermally growth TiO2 nanorods. Procedia Eng. 2015, 120, 1162–1165. [Google Scholar] [CrossRef]
- Ippolito, S.J.; Kandasamy, S.; Kalantar-Zadeh, K.; Wlodarski, W. Hydrogen sensing characteristics of WO3 thin film conductometric sensors activated by Pt and Au catalysts. Sens. Actuators B Chem. 2005, 108, 154–158. [Google Scholar] [CrossRef]
- Kamal, T. High performance NiO decorated graphene as a potential H2 gas sensor. J. Alloy. Compd. 2017, 729, 1058–1063. [Google Scholar] [CrossRef]
- Dhall, S.; Jaggi, N.; Nathawat, R. Functionalized multiwalled carbon nanotubes based hydrogen gas sensor. Sens. Actuators A Phys. 2013, 201, 321–327. [Google Scholar] [CrossRef]
- Dhall, S.; Jaggi, N. Highly dispersed platinum sputtered multiwall carbon nanotubes based hydrogen gas sensor at room temperature. Sens. Actuators A Phys. 2015, 224, 50–56. [Google Scholar] [CrossRef]
- Wongchoosuk, C.; Wisitsoraat, A.; Phokharatkul, D.; Tuantranont, A.; Kerdcharoen, T. Multi-walled carbon nanotube-doped tungsten oxide thin films for hydrogen gas sensing. Sensors 2010, 10, 7705–7715. [Google Scholar] [CrossRef] [PubMed]
- Chung, M.G.; Kim, D.H.; Seo, D.K.; Kim, T.; Im, H.U.; Lee, H.M.; Yoo, J.B.; Hong, S.H.; Kang, T.J.; Kim, Y.H. Flexible hydrogen sensors using graphene with palladium nanoparticle decoration. Sens. Actuators B Chem. 2012, 169, 387–392. [Google Scholar] [CrossRef]
- Phan, D.T.; Chung, G.S. Characteristics of resistivity-type hydrogen sensing based on palladium-graphene nanocomposites. Int. J. Hydrog. Energy 2014, 39, 620–629. [Google Scholar] [CrossRef]
- Kumar, R.; Malik, S.; Mehta, B.R. Interface induced hydrogen sensing in Pd nanoparticle/graphene composite layers. Sens. Actuators B Chem. 2015, 209, 919–926. [Google Scholar] [CrossRef]
- Eom, N.S.A.; Cho, H.-B.; Song, Y.; Lee, W.; Sekino, T.; Choa, Y.-H. Room-Temperature H2 Gas Sensing Characterization Solution Dropping Method. Sensors 2017, 17, 2750. [Google Scholar] [CrossRef] [PubMed]
- Pandey, P.A.; Wilson, N.R.; Covington, J.A. Pd-doped reduced graphene oxide sensing films for H2 detection. Sens. Actuators B Chem. 2013, 183, 478–487. [Google Scholar] [CrossRef]
- Drewniak, S.; Muzyka, R.; Stolarczyk, A.; Pustelny, T.; Kotyczka-Morańska, M.; Setkiewicz, M. Studies of Reduced Graphene Oxide and Graphite Oxide in the Aspect of Their Possible Application in Gas Sensors. Sensors 2016, 16, 103. [Google Scholar] [CrossRef] [PubMed]
- Llobet, E. Gas sensors using carbon nanomaterials: A review. Sens. Actuators B Chem. 2013, 179, 32–45. [Google Scholar] [CrossRef]
- Hill, E.W.; Vijayaragahvan, A.; Novoselov, K. Graphene sensors. IEEE Sens. J. 2011, 11, 3161–3170. [Google Scholar] [CrossRef]
- Hu, P.; Zhang, P.; Li, J.; Wang, L.; O’Neill, Z.; Estrela, W. Carbon nanostructure-based field-effect transistors for label-free chemical/biological sensors. Sensors 2010, 10, 5133–5159. [Google Scholar] [CrossRef] [PubMed] [Green Version]
- Banerjee, A.N. The design, fabrication, and photocatalytic utility of nanostructured semiconductors: Focus on TiO2-based nanostructures. Nanotechnol. Sci. Appl. 2011, 4, 35–65. [Google Scholar] [CrossRef] [PubMed]
- Mor, G.K.; Varghese, O.K.; Paulose, M.; Ong, K.G.; Grimes, C.A. Fabrication of hydrogen sensors with transparent titanium oxide nanotube-array thin films as sensing elements. Thin Solid Films 2006, 496, 42–48. [Google Scholar] [CrossRef]
- Li, Z.; Ding, D.; Ning, C. P-Type hydrogen sensing with Al- and V-doped TiO2 nanostructures. Nanoscale Res. Lett. 2013, 8, 25. [Google Scholar] [CrossRef] [PubMed]
- Şennik, E.; Çolak, Z.; Kilinç, N.; Öztürk, Z.Z. Synthesis of highly-ordered TiO2 nanotubes for a hydrogen sensor. Int. J. Hydrog. Energy 2010, 35, 4420–4427. [Google Scholar] [CrossRef]
- Abadi, M.H.S.; Hamidon, M.N.; Shaari, A.H.; Abdullah, N.; Wagiran, R.; Misro, N. Nanocrystalline SnO2-Pt Thick Film Gas Sensor for Air Pollution Applications. Sens. Transducers 2011, 125, 76–88. [Google Scholar]
- Ehsani, M.; Hamidon, M.N.; Member, S.; Toudeshki, A.; Abadi, M.H.S.; Rezaeian, S. CO2 Gas Sensing Properties of Screen-Printed La2O3/SnO2 Thick Film. IEEE Sens. J. 2016, 16, 6839–6845. [Google Scholar] [CrossRef]
- Sheini, N.A.; Rohani, M. Ag-doped titanium dioxide gas sensor. IOP Conf. Ser. Mater. Sci. Eng. 2016, 108, 012033. [Google Scholar] [CrossRef] [Green Version]
- Saidi, W.; Hfaidh, N.; Rasheed, M.; Girtan, M.; Megriche, A.; el Maaoui, M. Effect of B2O3 addition on optical and structural properties of TiO2 as a new blocking layer for multiple dye sensitive solar cell application (DSSC). RSC Adv. 2016, 6, 68819–68826. [Google Scholar] [CrossRef] [Green Version]
- Garner, W.E.; Reeves, L.W. The Thermal Decomposition of Silver Oxide. Trans. Faraday Soc. 1954, 50, 254–260. [Google Scholar] [CrossRef]
- Gu, H.; Wang, Z.; Hu, Y. Hydrogen Gas Sensors Based on Semiconductor Oxide Nanostructures. Sensors 2012, 12, 5517–5550. [Google Scholar] [CrossRef] [PubMed] [Green Version]
- Shaalan, N.M.; Rashad, M.; Abdel-Rahim, M.A. Repeatability of indium oxide gas sensors for detecting methane at low temperature. Mater. Sci. Semicond. Process. 2016, 56, 260–264. [Google Scholar] [CrossRef]
- Zhou, Q.; Chen, W.; Peng, S.; Su, X. Nano-tin oxide gas sensor detection characteristic for hydrocarbon gases dissolved in transformer oil. In Proceedings of the 2012 International Conference on High Voltage Engineering and Application, Shanghai, China, 17–20 September 2012; pp. 384–387. [Google Scholar]
Figure 1.
Front view of the TiO2-B2O3 gas sensor.

Figure 2.
Fabricated TiO2-B2O3 gas sensor on alumina substrate using a screen-printing method.

Figure 3.
Experimental setup of gas sensing measurement.

Figure 4.
Thermal Behavior of TiO2-B2O3 paste using thermogravimetric analysis (TGA).

Figure 5.
Field emission scanning electron microscopy (FESEM) image of TiO2-B2O3 on the alumina substrate at T = 500 °C.
Figure 5.
Field emission scanning electron microscopy (FESEM) image of TiO2-B2O3 on the alumina substrate at T = 500 °C.

Figure 6.
Energy-dispersive X-ray (EDX) results of TiO2-B2O3 on the alumina substrate at T = 500 °C.
Figure 6.
Energy-dispersive X-ray (EDX) results of TiO2-B2O3 on the alumina substrate at T = 500 °C.

Figure 7.
X-ray diffraction pattern of TiO2 (P25) and TiO2-B2O3.

Figure 8.
X-ray diffraction pattern of TiO2-B2O3 thick film at T = 500 °C.

Figure 9.
Electrical Characteristics of TiO2-B2O3 at different operating temperature.

Figure 10.
Response of TiO2-B2O3 gas sensor to hydrogen at different operating temperature (a) T = 100 °C (b) T = 200 °C (c) T = 300 °C.
Figure 10.
Response of TiO2-B2O3 gas sensor to hydrogen at different operating temperature (a) T = 100 °C (b) T = 200 °C (c) T = 300 °C.

Figure 11.
Sensor response of TiO2-B2O3 gas sensor at different operating temperature.

Figure 12.
Sensor response of TiO2-B2O3 gas sensor to hydrogen at 300 °C.

© 2018 by the authors. Licensee MDPI, Basel, Switzerland. This article is an open access article distributed under the terms and conditions of the Creative Commons Attribution (CC BY) license (http://creativecommons.org/licenses/by/4.0/).
Share and Cite
MDPI and ACS Style
Mohd Chachuli, S.A.; Hamidon, M.N.; Mamat, M.S.; Ertugrul, M.; Abdullah, N.H. A Hydrogen Gas Sensor Based on TiO2 Nanoparticles on Alumina Substrate. Sensors 2018, 18, 2483. https://doi.org/10.3390/s18082483
AMA Style
Mohd Chachuli SA, Hamidon MN, Mamat MS, Ertugrul M, Abdullah NH. A Hydrogen Gas Sensor Based on TiO2 Nanoparticles on Alumina Substrate. Sensors. 2018; 18(8):2483. https://doi.org/10.3390/s18082483
Chicago/Turabian StyleMohd Chachuli, Siti Amaniah, Mohd Nizar Hamidon, Md. Shuhazlly Mamat, Mehmet Ertugrul, and Nor Hapishah Abdullah. 2018. "A Hydrogen Gas Sensor Based on TiO2 Nanoparticles on Alumina Substrate" Sensors 18, no. 8: 2483. https://doi.org/10.3390/s18082483
Note that from the first issue of 2016, this journal uses article numbers instead of page numbers. See further details here.