Utilization of Inexpensive Carbon-Based Substrates as Platforms for Sensing


1
Department of Mechanical Engineering, Iowa State University, Ames, IA 50011, USA
2
Department of Materials Science and Engineering, Iowa State University, Ames, IA 50011, USA
3
Microelectronics Research Center, Iowa State University, Ames, IA 50011, USA
*
Author to whom correspondence should be addressed.
Sensors 2018, 18(8), 2444; https://doi.org/10.3390/s18082444
Submission received: 28 June 2018
/
Revised: 22 July 2018
/
Accepted: 22 July 2018
/
Published: 27 July 2018
(This article belongs to the Special Issue Spectroscopy Based Sensors)
Abstract
:Gold (Au) has been widely used as a material for Surface Enhanced Raman Spectroscopy (SERS) due to its plasmonic properties, stability and biocompatibility. Conventionally for SERS application, Au is deposited on a rigid substrate such as glass or silicon. The rigid substrates severely limit analyte collection efficiency as well as portability. Here, flexible substrates like carbon cloth and carbon paper were investigated as potential substrate candidates for SERS application. The flexible substrates were coated with Au nanostructures by electrodeposition. Model analyte, Rhodamine 6G was utilized to demonstrate the capabilities of the flexible SERS substrates. Additionally, the pesticide paraoxon was also detected on the flexible SERS substrates as well as on a real sample like the apple fruit.
1. Introduction
Detection of trace biological analytes and hazardous chemicals has become increasing important, since serious health risks and environmental problems can be mitigated or prevented by early detection. The field of sensing has demonstrated potential applications in a range of areas including environmental monitoring [1,2], anti-terrorism [3,4], biomedical diagnostics [5], forensic science [6], and food safety [2]. There are several conventional analytical techniques that have been utilized for the ultrasensitive detection of these analytes, some of which include high-performance liquid chromatography (HPLC) and gas chromatography-mass spectroscopy GC/MS [2], capillary electrochromatography (CE) [7], enzyme cycling assays [8], photoluminescence [9], and ion mobility spectrometry [10]. However, these techniques are time-consuming and require expensive equipment. They also require complicated sample pre-treatments, which can be handled only by trained personnel. Thus in order to overcome the limitations of these conventional techniques, researchers have explored and utilized other techniques like Surface Enhanced Raman Spectroscopy (SERS). With the advent of portable Raman Spectroscopy, sensing of trace analytes has become accessible, rapid, sensitive and affordable. Since its discovery in 1974 [11], the field of SERS has grown into an active area of research, including both experimental and theoretical studies [12], and has evolved from its fundamental understanding to promising applications [13].
There are many different types of SERS materials with varying morphologies utilized for detection purposes. Some researchers have used colloidal metallic nanoparticles or their colloidal aggregates in solution for SERS detection [14,15]. Although the preparation of these materials is simple, such approaches do not yield reliable outcomes. The SERS performance has been found to be inconsistent and thus not suitable for non-aqueous applications [16,17]. Other types of SERS materials have rough surfaces [18]. This can be obtained by creating metallic nanoholes [19], concentric rings [20], nanogaps [21], nanoparticles [22,23] and their arrays [24], or nanodisk array [25]. Further, SERS detection was possible by employing porous membrane, [26] latex microspheres, [27] and polystyrene colloidal particles [27]. Additionally, three dimensional (3D) nanostructures such as nanorods, nanocones, etc., have provided precise detection of trace analytes. Although these materials and their varying morphologies showed promising detection capabilities, they are expensive to fabricate and require specialized equipment with trained personnel. In addition, the cost of a conventional SERS substrate like silicon is $0.5/1 g, whereas flexible substrates like paper cost only $0.001/1 g. Moreover, the aforementioned materials and varying morphologies are often fabricated on substrates that are rigid including glass [28,29,30], silicon [31,32], and glass capillary [33]. These underlying rigid substrates are expensive and brittle, which make them ineffective for in-field detection of analytes that can be directly transferred from the target products; for example, in food packaging industry and agricultural fields.
To improve the usability of materials, with varying morphologies, in SERS detection flexible substrates have been explored including filter paper [16,17,34,35,36,37,38,39], adhesive tape [40], cotton [4,41], carbon cloth [42], polymer nanofibers [43], polymer nanotubes [44], and electrospun poly(vinyl alcohol) nanofibers [35,45]. The fabrication techniques used for such flexible substrates include ink-jet printing [34,39], dip coating [17,35], templating [16], drop casting [40], and electroless deposition [38,42]. Although some of these methods are simple, they require long preparation time or dry time (12–48 h), large material use, special equipment and trained personnel.
In the present investigation, the potential of inexpensive flexible substrates was explored by the fabrication of Au nanostructures on carbon cloth and carbon paper. These Au nanostructures were prepared by electrodeposition. The resulting substrates demonstrated successful detection of different types of organic molecules, including R6G and paraoxon. The detection of analytes using these flexible substrates was reproducible and reliable.
Scanning electron microscopy was used to investigate the morphology, size, density and coverage of Au nanostructures on the underlying flexible substrates. Compositional analysis was done using Energy Dispersive X-ray Spectroscopy. UV-Vis spectroscopy was used for determining optical property of the deposited Au nanostructures. Finally, SERS performance of the flexible substrates was evaluated by Raman spectroscopy.
2. Materials and Methods
2.1. Materials
The chemicals used for the electrodeposition of Au nanostructures were gold (III) chloride trihydrate (HAuCl4·3H2O, ≥99.9%) and potassium hydroxide (KOH, ≥85.8%). These chemicals were purchased from Sigma-Aldrich (St. Louis, MO, USA) and Fisher Scientific (Hanover park, IL, USA), respectively. The substrates used for electrodeposition of the Au nanostructures were carbon cloth (AvCarb Material Solutions, 1071 HCB) and wet-proofed carbon paper (Toray, 060) purchased from Fuel Cell Store (College Station, TX, USA). The chemicals used for cleaning the substrates were acetone, hydrochloric acid (HCl, 36.5–38.0%), and nitric acid (HNO3, 68.0–70.0%), purchased from Fisher Scientific. For SERS experiments, Rhodamine 6G dye (R6G, 99%) and paraoxon-ethyl (C10H14NO6P, ≥90%) were purchased from Sigma-Aldrich. Deionized (DI) water was used for preparing all precursor and analyte solutions.
2.2. Fabrication of Au Nanostructures via Electrodeposition
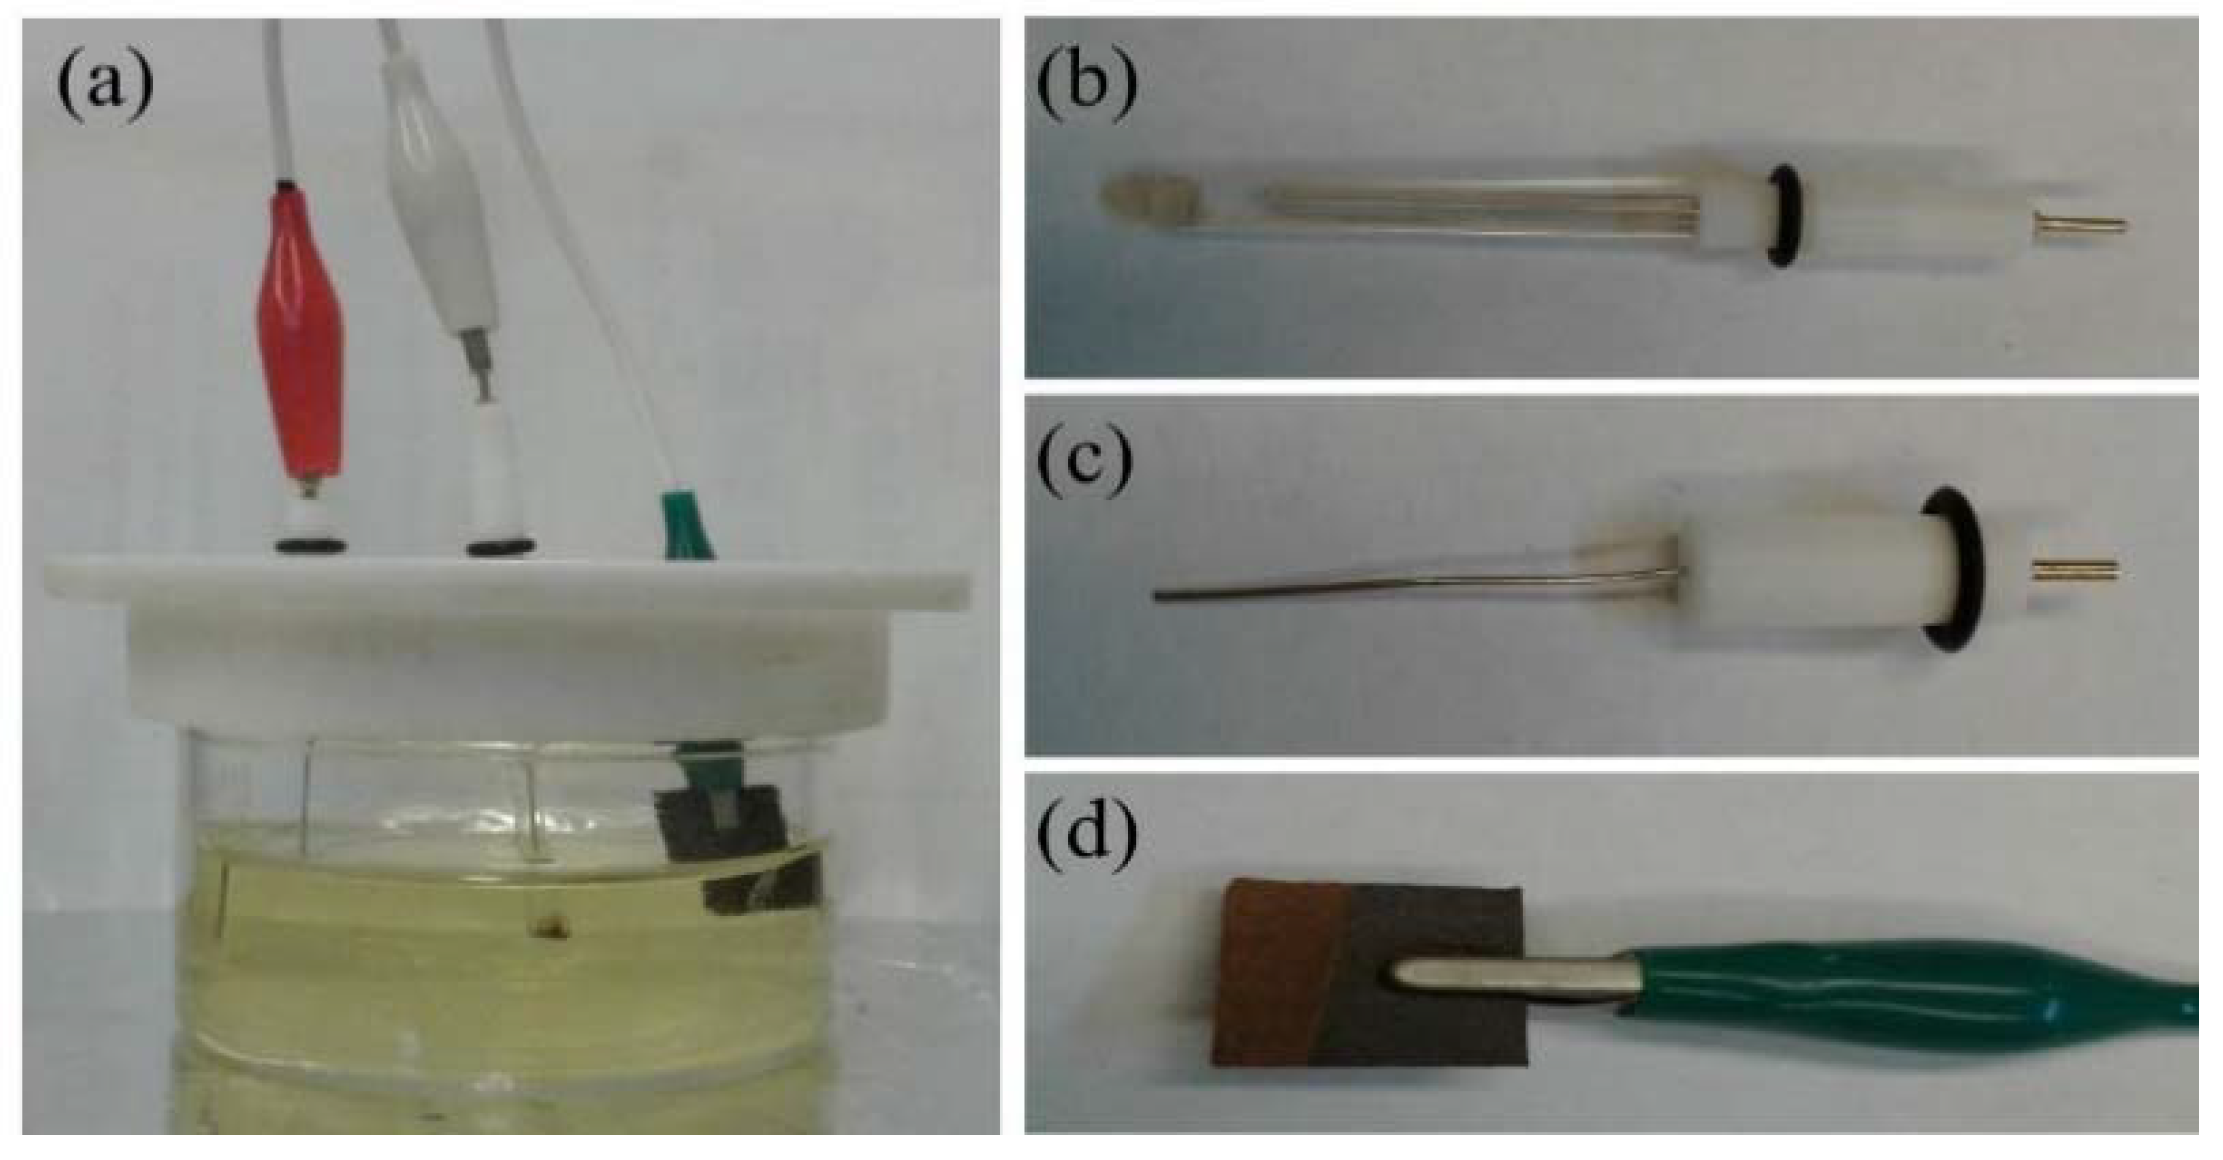
The Au nanostructures were fabricated via electrodeposition using a three electrode electrochemical cell as shown in Figure 1. The electrochemical cell consisted of an Ag/AgCl reference electrode (Figure 1b), a 2 mm diameter platinum wire counter electrode (Figure 1c) and carbon cloth or carbon paper, as the working electrode (Figure 1d). Prior to electrodeposition, the carbon paper was cleaned by ultrasonicating in an acetone bath for 10 min. This was followed by cleaning with hydrochloric acid and nitric acid for 1 min each. For carbon cloth, the cleaning procedure was carried out in three steps. The carbon cloth was first immersed in acetone for 1 h, followed by submerging in boiling DI water for 10 min. In the final step, the carbon cloth was cleaned using an acetone bath in an ultrasonicator for 10 min [46]. The substrates were rinsed with DI water after each cleaning step.
For the electrodeposition of Au nanostructures, the electrolyte solution was prepared by dissolving HAuCl4 in DI water to obtain a concentration of 3 mM. The pH of the electrolyte was adjusted to 3 using KOH. The electrodeposition was carried out at room temperature for 70 min, at an applied potential of −0.8 V [47].
To prepare the dye solution, 0.8 mg of R6G was dissolved in 5 mL of DI water, and was utilized as a stock solution. Similarly, paraoxon stock solution was prepared by mixing 30 μL of oily concentrated paraoxon with 1 mL DI water. To prepare samples for SERS experiments, a small volume of the stock solution was diluted to the desired concentration. Further, 300 μL of the diluted solution was drop cast onto the Au nanostructures fabricated on either carbon cloth or carbon paper. The substrates were then dried under ambient conditions. Prior to drop casting, the wettability of the substrates was improved by oxygen plasma treatment, for 1 min under medium radio frequency power level (11 W) by a plasma cleaner (PDC-001, Harrick Plasma, Ithaca, NY, USA).
2.3. Characterization
The Au nanostructure morphology was studied using scanning electron microscopy (SEM) using a FEI Quanta-250 SEM instrument operating at 10 kV accelerating voltage. The SEM instrument was equipped with an Oxford Aztec Energy Dispersive X-ray (EDX) analysis system, which was used to conduct compositional analyses on the sample surface. The optical properties were studied using UV-Vis absorption spectroscopy, which used a Perkin Elmer Lambda 25 spectrophotometer to obtain the necessary data. To prepare samples for UV-Vis measurements, each sample was immersed in 1 mL of DI water and sonicated at the highest power for 5 min to detach the Au nanostructures from the substrates. The SERS measurements were performed at room temperature on a Renishaw Dispersive Raman Spectrometer with Ar-ion laser at 488 nm, using 50× objective lens, with incident power of 5 mW for 4 accumulations. Here, each accumulation was of 30 s duration. The SERS spectra were collected from several samples and from random regions on each sample to confirm reproducibility and uniformity respectively.
3. Results and Discussion
3.1. Characterization of Gold Nanostructures
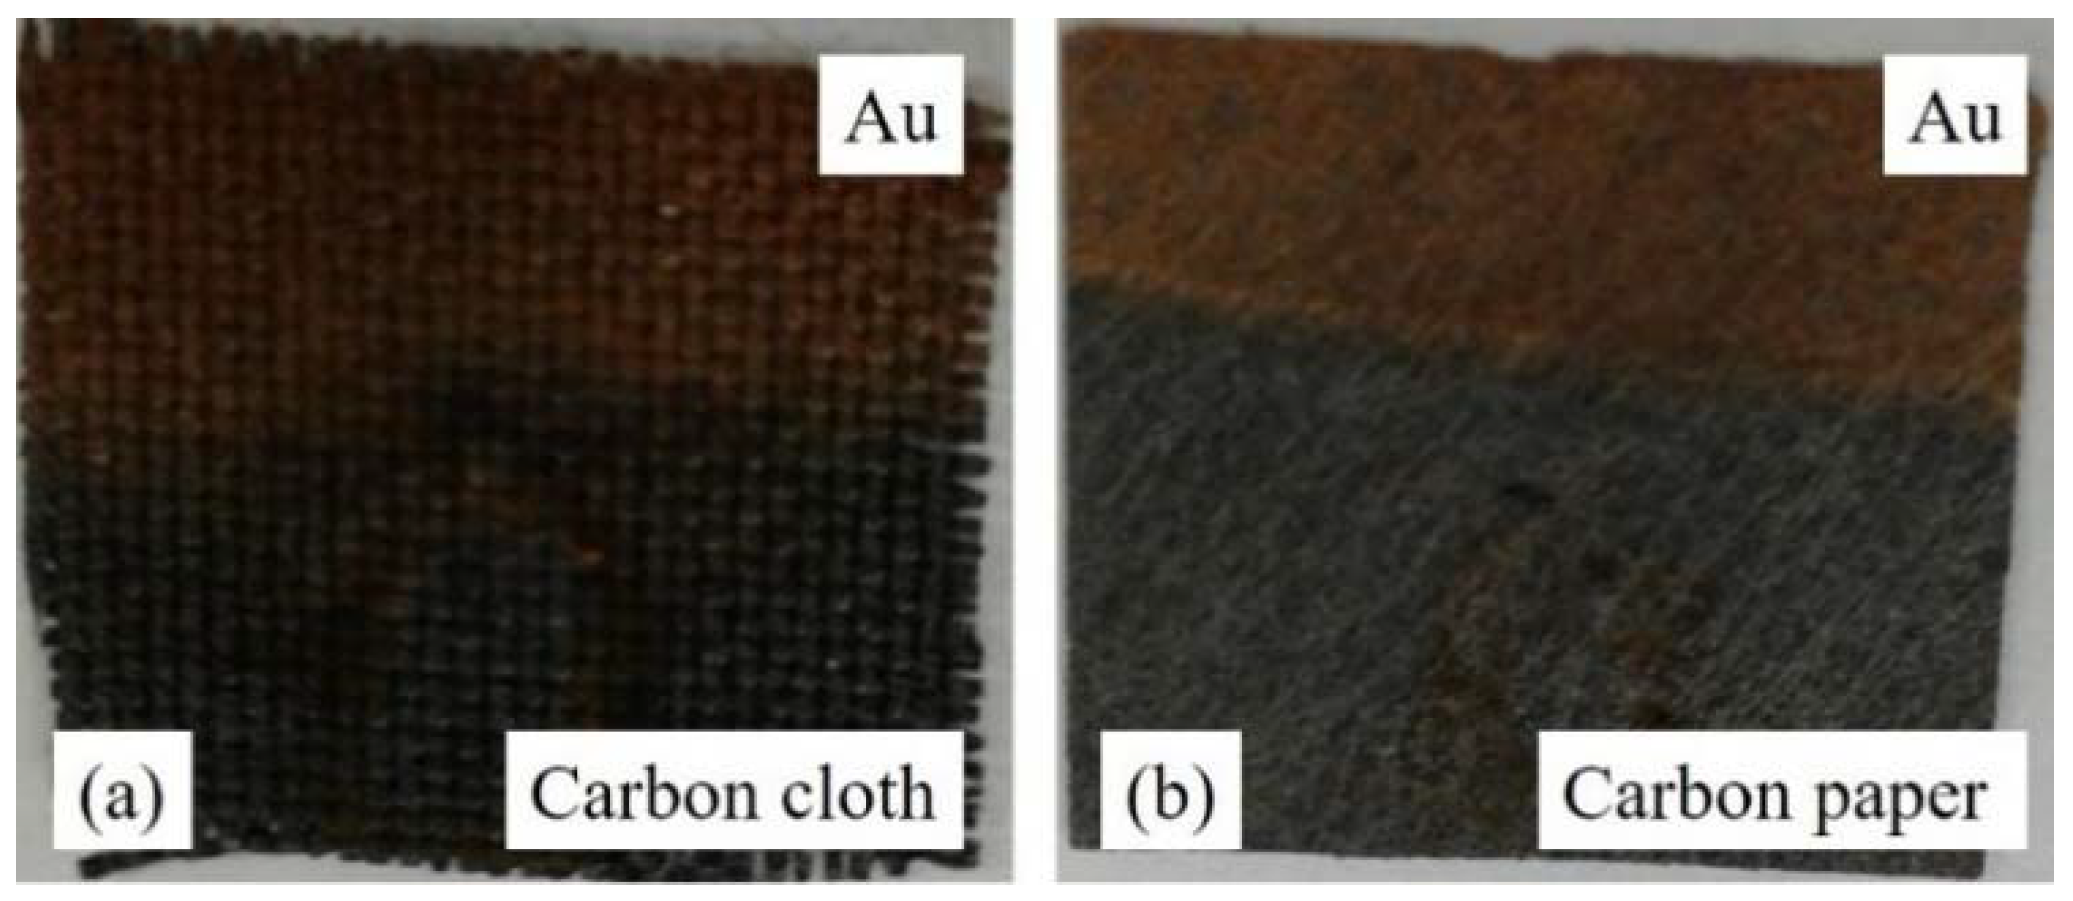
The digital photographs of the as-prepared carbon cloth and carbon paper electrodeposited with Au nanostructures are shown in Figure 2. The photographs clearly show a uniform and continuous deposition of Au; a dark golden color on both carbon cloth and carbon paper. The detailed electrodeposition conditions followed in this work were reported elsewhere by our group [47].
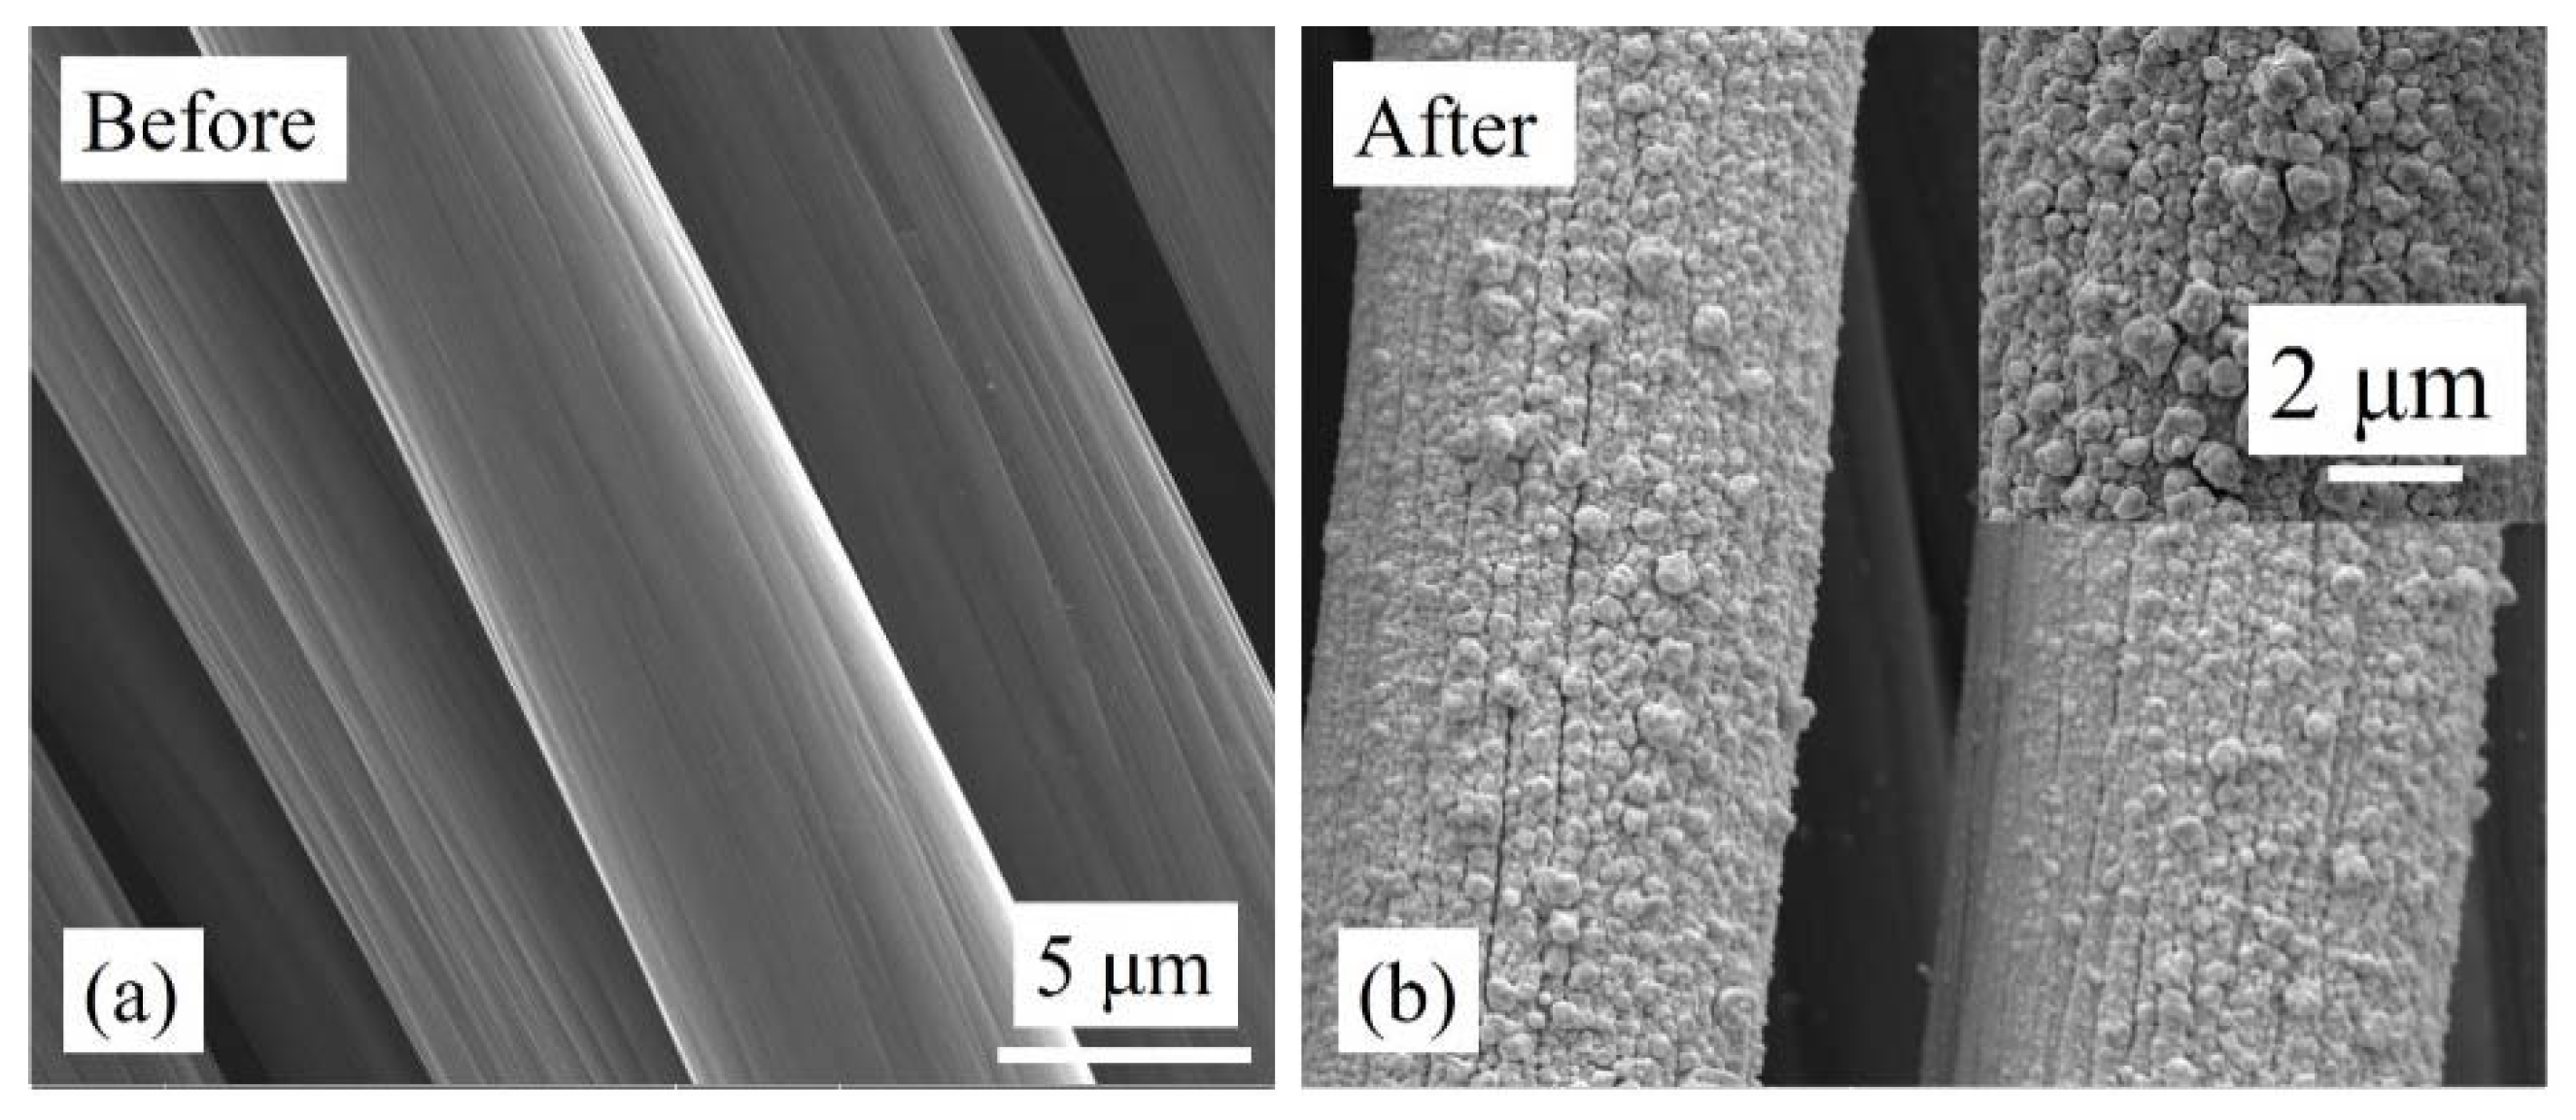
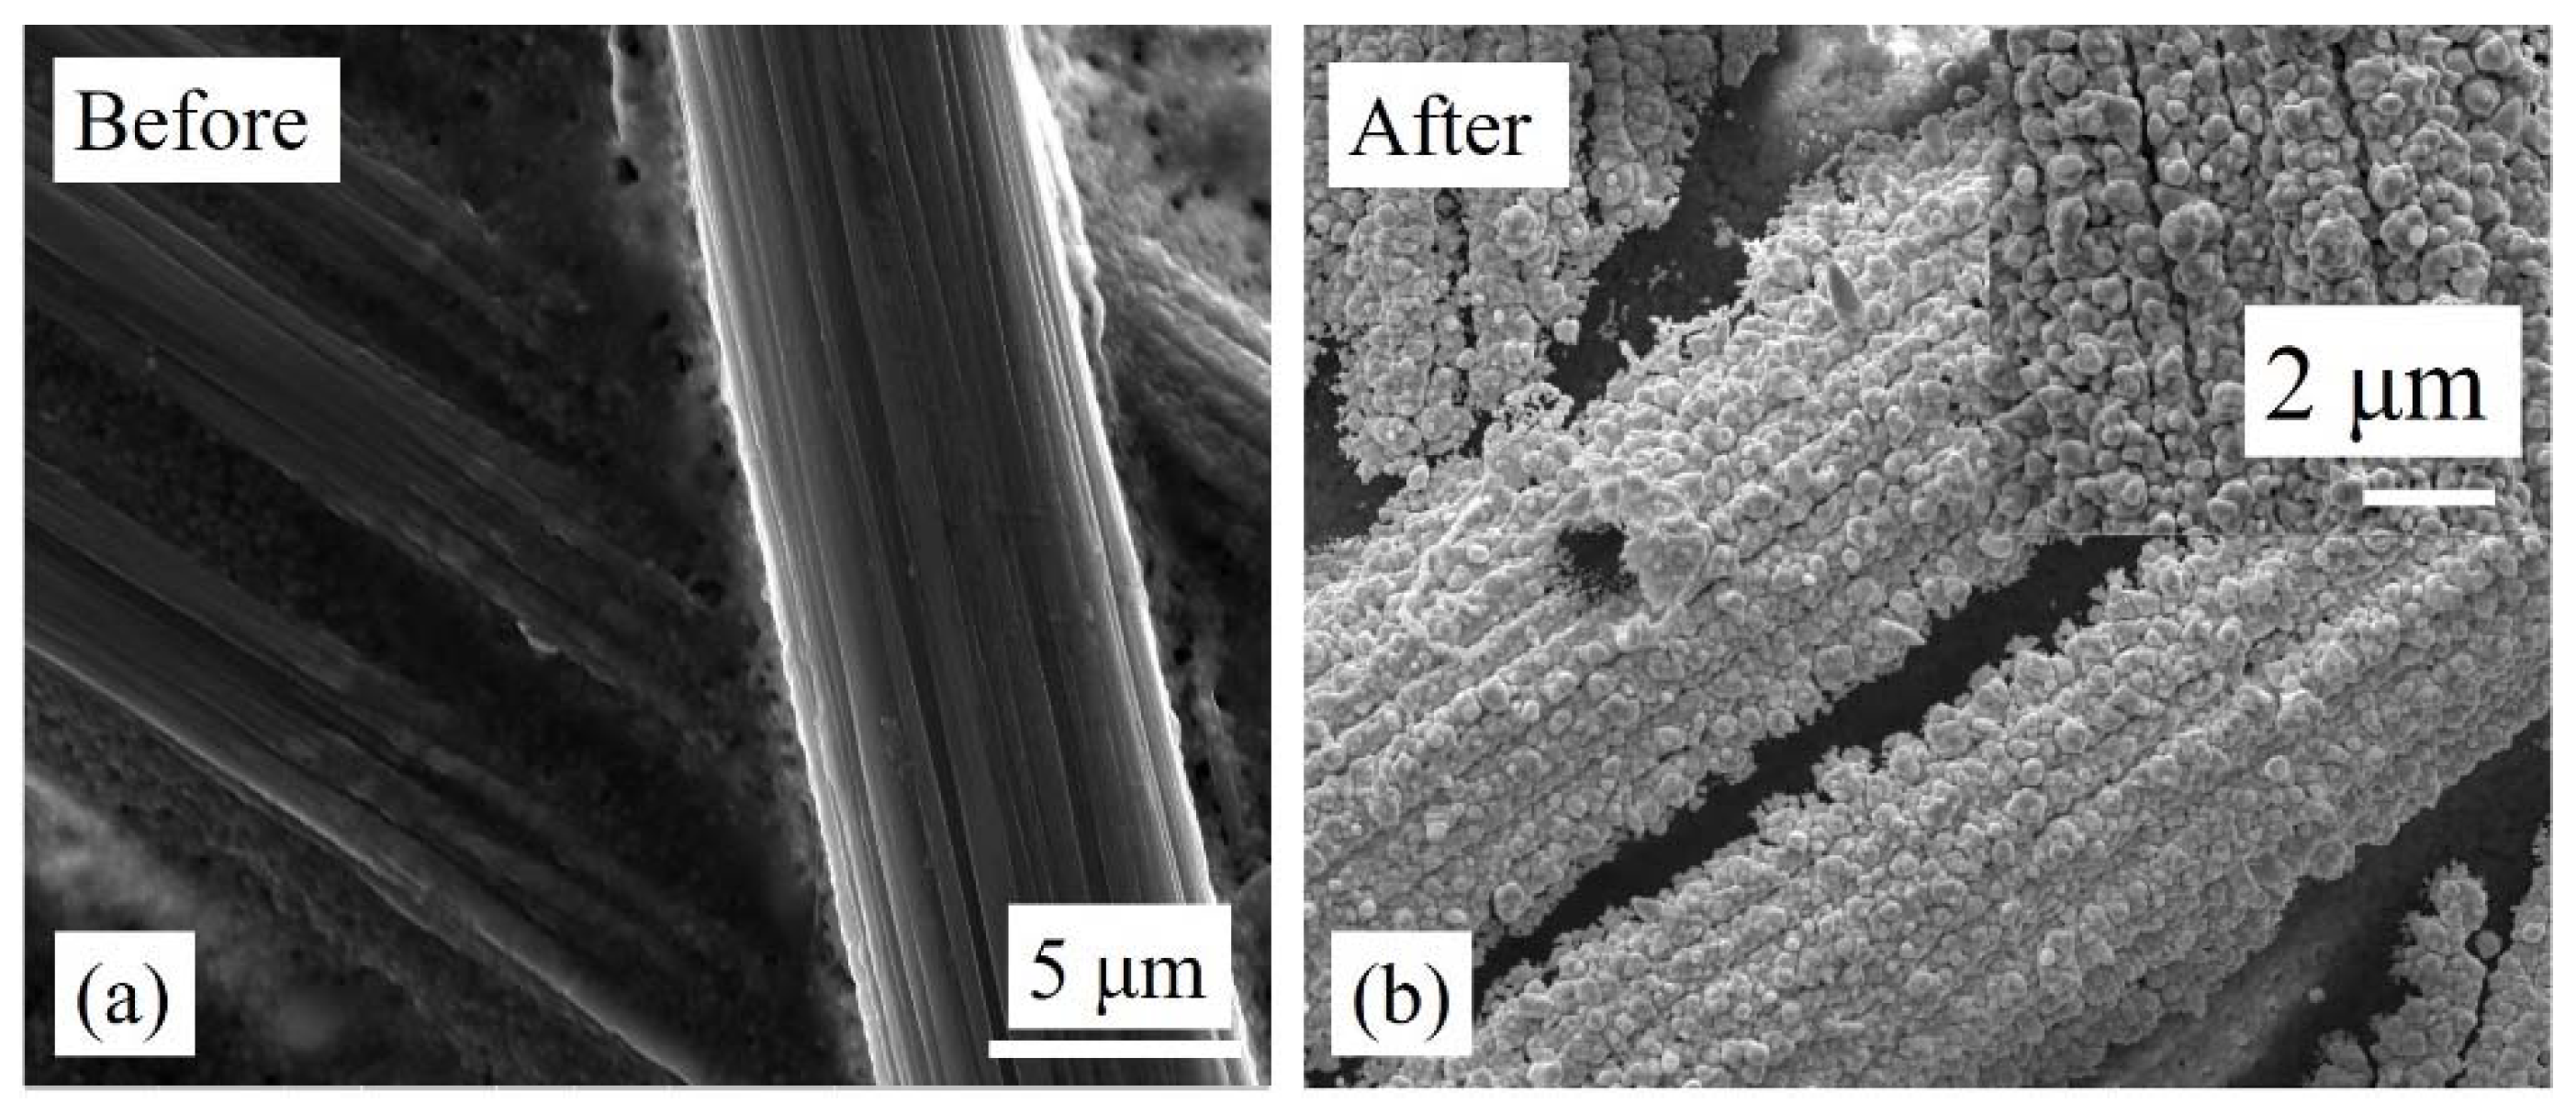
Figure 3 and Figure 4 show carbon cloth and carbon paper before and after Au nanostructure deposition. Prior to deposition, the carbon cloth and carbon paper have a smooth surface with uniform width of its constituent strands. After the deposition of Au, the thickness of the constituent strands increased and was clearly seen in the SEM images (Figure 3b and Figure 4b). A compact layer of Au nanostructures was observed, which covered the surface of the substrates. The surface of the deposited Au layer appeared to be rough as a result of the coalescence of Au nanostructures. Above the compact layer, a sub-monolayer of Au nanostructures was also observed (insets of Figure 3b and Figure 4b). The details of the deposition mechanism have been explained in our previous work [47,48].
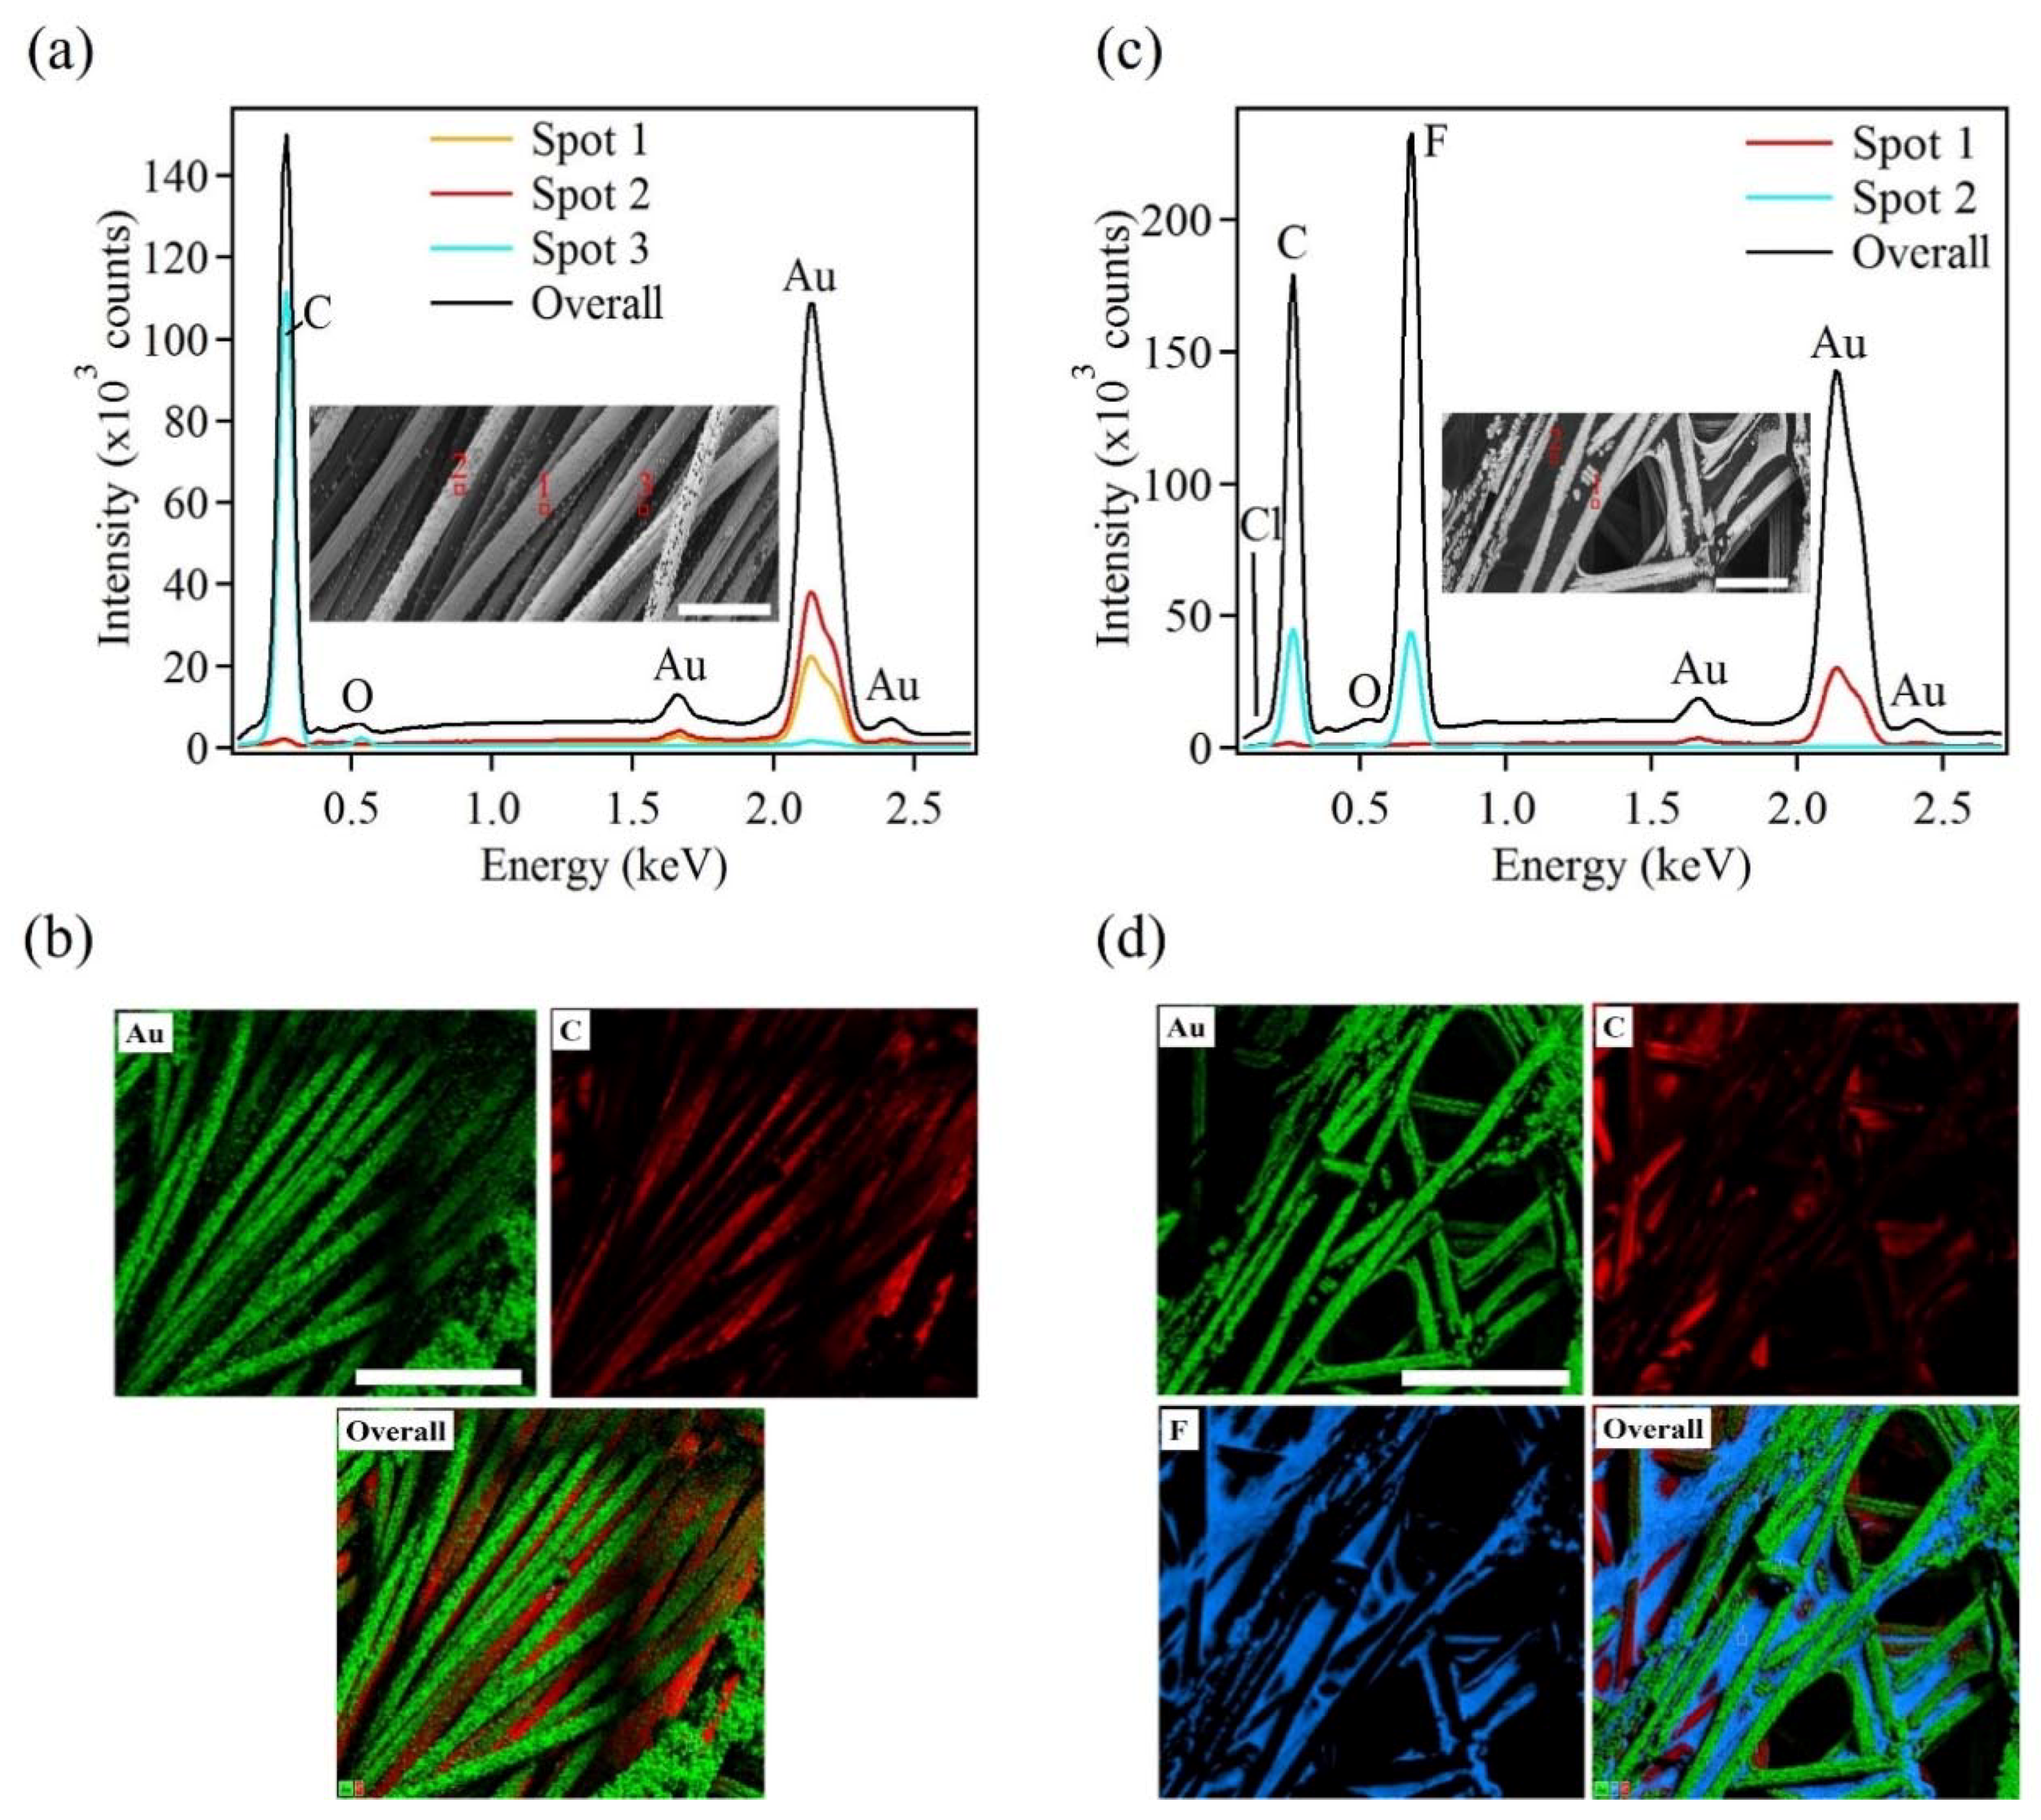
The chemical composition of the as-synthesized samples was determined by EDX. The EDX spectra obtained from the carbon cloth and carbon paper samples are presented in Figure 5. From the carbon cloth, the EDX spectra indicated a strong presence of Au. The spectra were recorded from different regions with varying depths on the sample as indicated in the inset of Figure 5a. It can be seen that the intensity of the Au signal from different regions varied. This was due to the variation in the deposition of Au with respect to the depth of the constituent strands that make up the carbon cloth. From the SEM images it was clear that the Au deposition occurred on the uppermost strands whereas the strands underneath remained partially or fully uncoated. Along with the Au, the EDX spectra showed the presence of C and trace amount of O. The presence of C was due to the underlying carbon cloth substrate. The trace amount of O was attributed to small amount of surface contamination. Figure 5b shows the elemental mapping obtained from the Au coated carbon cloth. The elemental maps indicate the presence of Au and C.
Similarly, compositional analysis on the Au coated carbon paper sample was performed. Figure 5c presents EDX spectra taken at different regions of varying depths on the sample as indicated by the inset in Figure 5c. Here, EDX spectra indicated similar trends, when compared to the carbon cloth substrate. The EDX spectrum, taken from the topmost layer of the sample, showed high intensity peaks of Au, F and C. The next spectrum exhibited lower intensity peaks, which was taken from a deeper portion of the sample. The presence of Au and C was clearly seen from the EDX data. The presence of Cl and F ions were attributed to the remnant Au precursor and adhesive resin, used in the preparation of the carbon paper, respectively [46]. The indication of O in the spectra was due to surface contamination. From the EDX data, it was inferred that the Au deposition varied along the depth of the sample. Thus future efforts will be focused on obtaining a more uniform and complete coating on layered substrates such as carbon cloth and carbon paper. Table 1 shows mass fraction analyses of the chemical elements obtained by EDX. Here, the table indicates that Au was the primary element deposited on the carbon-based substrates.
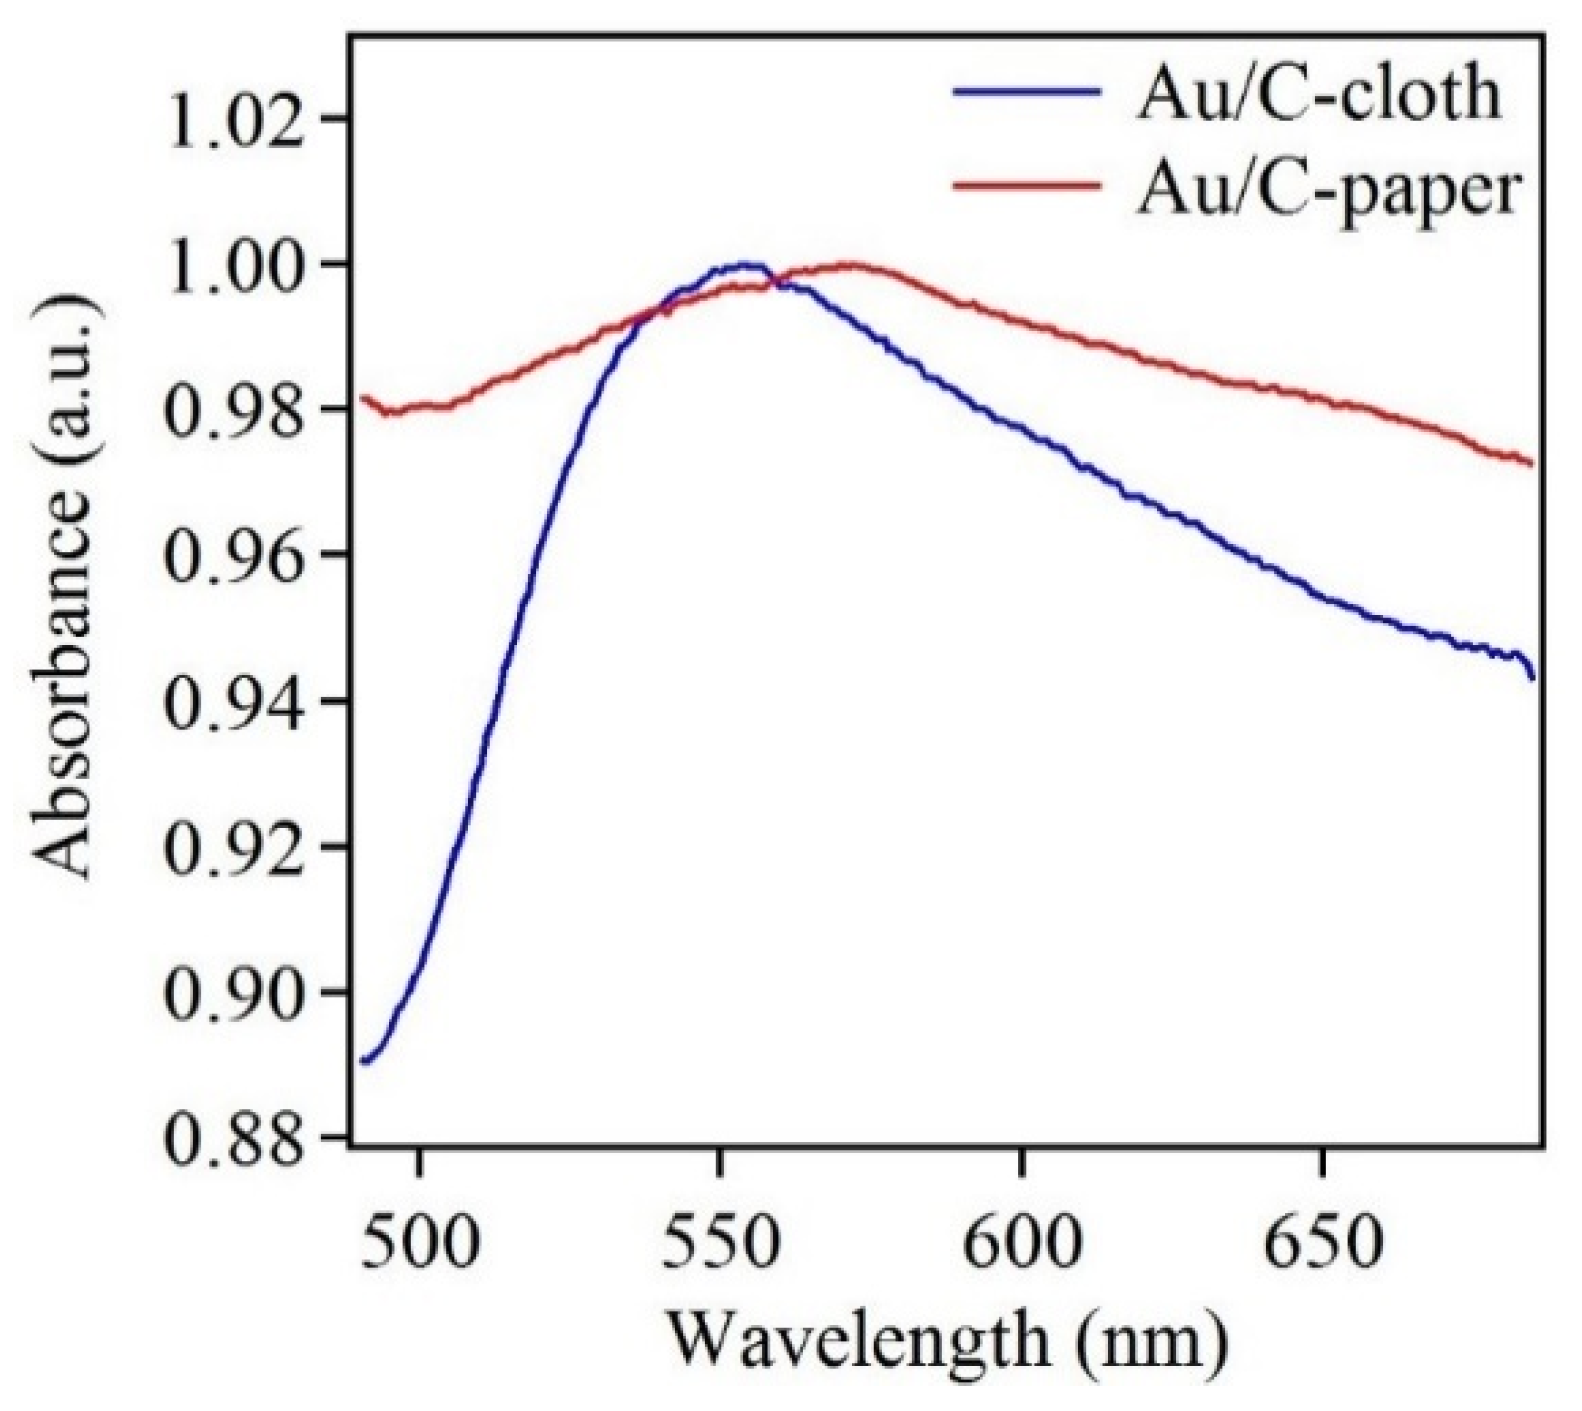
Along with the EDX data, UV-Vis absorption data was also obtained. The absorption spectra from samples of Au electrodeposited on carbon cloth and carbon paper are presented in Figure 6. Both spectra show characteristic absorption peaks of Au. The red-shift beyond 550 nm indicates that the Au nanostructures were large in size. Additionally, a large full width half maximum of the absorption spectra indicates a broad size distribution [49]. Thus, the UV-Vis data conformed the SEM data, which implies large nanostructure size and broad size distribution.
3.2. Electrodeposited Gold Nanostructures for SERS Application
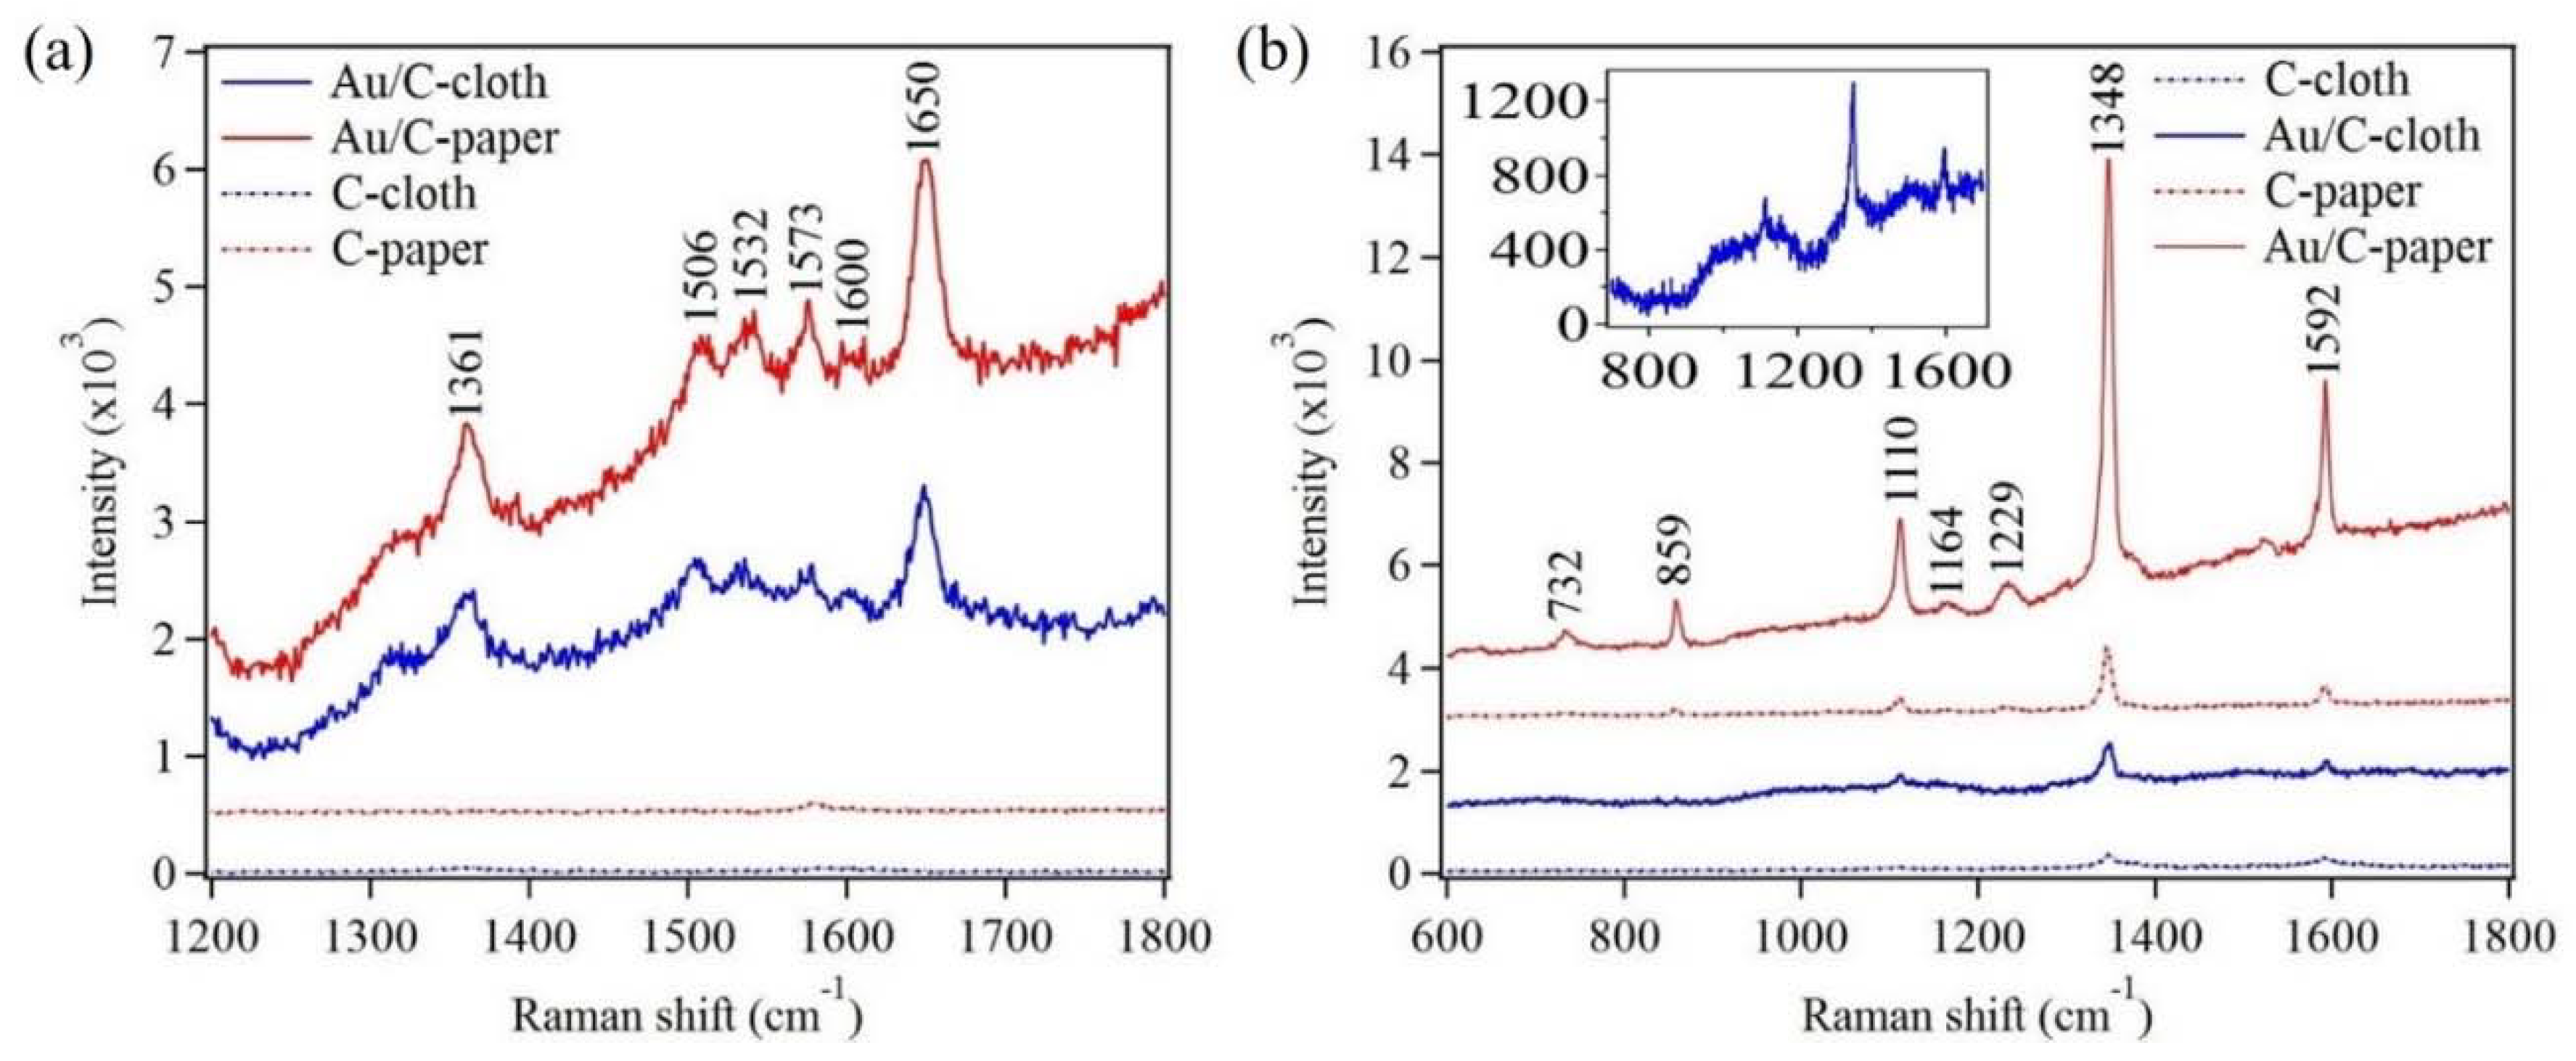
The fabricated Au nanostructures were evaluated for the detection of R6G and paraoxon via SERS. The organic molecule, R6G, has been widely used for SERS studies since it has well documented and clearly defined Raman modes. Figure 7a shows Raman spectra of R6G (10−5 M), on flexible substrates like carbon cloth and carbon paper, in the presence and absence of Au nanostructures. The sample preparation was carried out by drop casting R6G on the flexible substrates. The Raman modes of R6G were not observed on substrates in the absence of Au nanostructures. However, in the presence of Au nanostructures characteristic Raman modes of R6G were clearly observed on both carbon cloth and carbon paper (Figure 7a and Table 2).
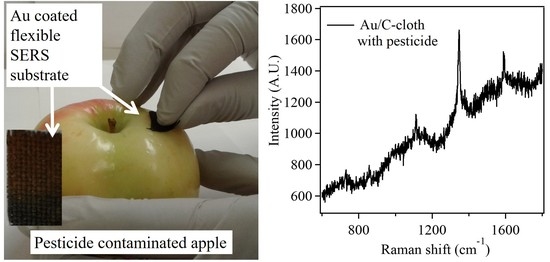
In order to further test the sample’s capabilities to detect real and small organic molecules, an organophosphorus pesticide, paraoxon was used. Figure 7b shows Raman spectra of paraoxon (10−2 M), which was drop casted on flexible substrates in the presence and absence of Au nanostructures. A very weak Raman signal of paraoxon was observed on the flexible substrates in the absence of Au nanostructures. However, strong characteristic Raman modes for paraoxon were observed, on flexible substrates, in the presence of Au nanostructures (Figure 7b and Table 2). The inset in Figure 7b clearly shows the Raman mode of paraoxon on Au nanostructures electrodeposited on carbon cloth [50]. The increase in the Raman signal was attributed to the localized electromagnetic field enhancement due to the presence of plasmonic nanostructures. The electrodeposited Au nanostructures not only increase the surface area but create small crevices, which are conducive to trapping of photons for a finite amount of time. This trapping of photons leads to an increase in the electromagnetic field in the small crevices, thus generating a clear and intense Raman signal [51,52].
Additionally, it is noteworthy that the Raman signal intensity, in all samples, was always higher for the carbon paper compared to carbon cloth. This increase in signal intensity was attributed to the different surface wetting properties of both flexible substrates. The carbon paper was observed to be more hydrophilic compared to the carbon cloth, which governed the absorbing capability of the probe molecules.
3.3. In-Field Testing Using Gold Nanostructures for Detection of Paraoxon via SERS
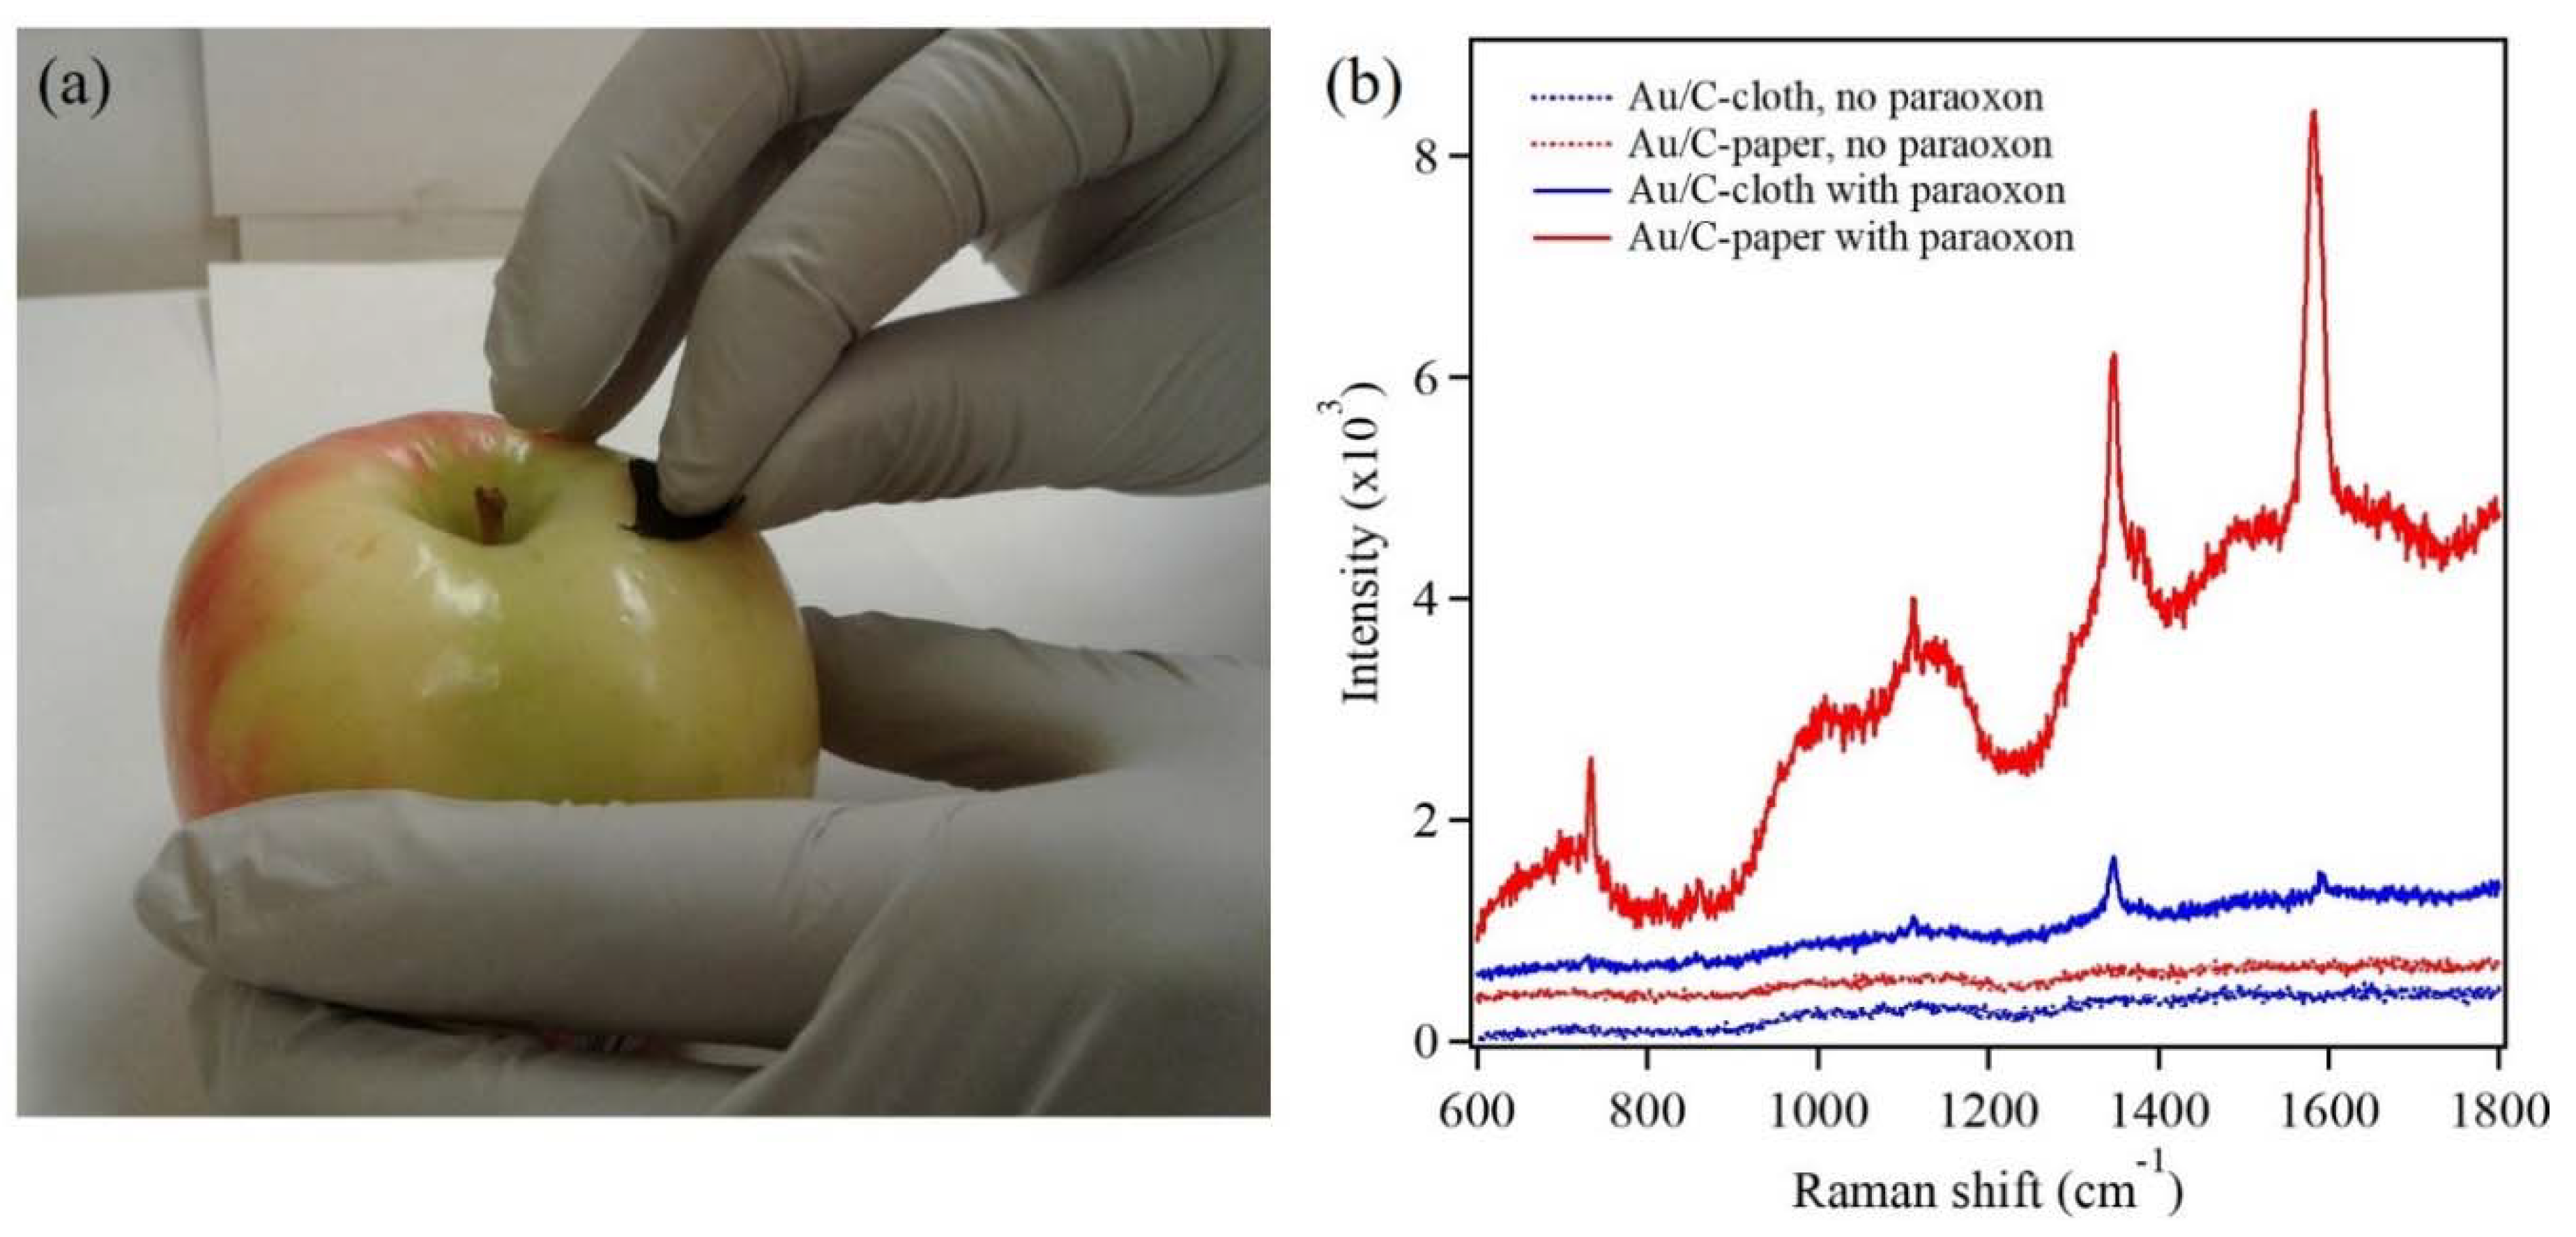
The in-field testing was mainly focused on the viability of Au nanostructures on flexible substrates to detect analytes, which are present on food products. The analyte in the present investigation was paraoxon (10−2 M), which was drop casted on the skin of an apple and was dried under ambient conditions. Further, the paraoxon was directly transferred onto the Au nanostructures electrodeposited on both the flexible substrates. This was carried out by immersing the flexible substrate, with Au nanostructures, in DI water and was used to wipe the paraoxon-infected area on the apple (Figure 8a). These flexible substrates were then used for the detection of paraoxon via SERS. Figure 8b shows Raman spectra of the flexible substrates before and after paraoxon transfer. The characteristic Raman modes of paraoxon were observed for both flexible substrates. Thus, it can be clearly seen that paraoxon was successfully transferred to the substrates and was also successfully detected. Thus, this investigation validates the stability and robustness of the Au nanostructure coated flexible substrates. It further demonstrates that a flexible substrate is more valuable than a rigid SERS substrate in such in-field testing applications. These flexible SERS substrates can find potential applications in not only the food packaging industry but also in agricultural fields, thus empowering farmers to regulate the pesticide usage in their fields. The present investigation has worked with concentration of paraoxon being on the higher side. However, this is a proof of concept study to demonstrate the viability of a flexible substrate as a SERS substrate and its potential application.
4. Conclusions
In summary, Au nanostructures were successfully electrodeposited on flexible substrates including carbon cloth and carbon paper. The flexible substrates were thoroughly characterized by SEM, EDX, and UV-Vis to indicate the presence of Au nanostructures. These flexible substrates with Au nanostructures were then used to demonstrate their viability as SERS substrates for the detection of R6G and paraoxon. Additionally, successful in-field testing of these flexible substrates was carried out to detect paraoxon on an apple’s skin. The SERS data indicated characteristic Raman modes for all analytes that were investigated. The detection of analytes was possible due to the plasmonic properties of the Au nanostructures, which led to the localized enhancement of the electromagnetic field.
Supplementary Materials
Supplementary File 1Author Contributions
M.T. and S.P. conceived and designed the experiments. A.F. performed synthesis via electrodeposition. A.W. performed the Raman measurements. M.T. and S.P. analyzed the data and wrote the manuscript.
Funding
Iowa State University Startup fund is the funding agency.
Acknowledgments
The authors acknowledge funding support from Iowa State University Startup Fund. S.P. thanks the Catron Fellowship. The authors would like to thank Warren Straszheim for help with SEM and EDX characterization. The authors declare no competing financial interest. The authors would like to thank Steven Kmiec for acquiring some Raman spectra.
Conflicts of Interest
The authors declare no conflicts of interest.
References
- Halvorson, R.; Vikesland, P. Surface-Enhanced Raman Spectroscopy (SERS) for Environmental Analyses. Environ. Sci. Technol. 2010, 44, 7749–7755. [Google Scholar] [CrossRef] [PubMed]
- Aragay, G.; Pino, F.; Merkoci, A. Nanomaterials for Sensing and Destroying Pesticides. Chem. Rev. 2012, 112, 5317–5338. [Google Scholar] [CrossRef] [PubMed]
- Zhang, C.; Wang, K.; Han, D.; Pang, Q. Surface enhanced Raman scattering (SERS) spectra of trinitrotoluene in silver colloids prepared by microwave heating method. Spectrochim. Acta Part A Mol. Biomol. Spectrosc. 2014, 122, 387–391. [Google Scholar] [CrossRef] [PubMed]
- Gong, Z.; Du, H.; Cheng, F.; Wang, C.; Wang, C.; Fan, M. Fabrication of SERS Swab for Direct Detection of Trace Explosives in Fingerprints. ACS Appl. Mater. Interfaces 2014, 6, 21931–21937. [Google Scholar] [CrossRef] [PubMed]
- Tripp, R.; Dluhy, R.; Zhao, Y. Novel nanostructures for SERS biosensing. Nano Today 2008, 3, 31–37. [Google Scholar] [CrossRef]
- Muehlethaler, C.; Leona, M.; Lombardi, J. Review of Surface Enhanced Raman Scattering Applications in Forensic Science. Anal. Chem. 2016, 88, 152–169. [Google Scholar] [CrossRef] [PubMed]
- Xie, W.; Xu, A.; Yeung, E. Determination of NAD(+) and NADH in a Single Cell under Hydrogen Peroxide Stress by Capillary Electrophoresis. Anal. Chem. 2009, 81, 1280–1284. [Google Scholar] [CrossRef] [PubMed]
- Reisch, A.; Elpeleg, O.; Pon, L.; Schon, E. Biochemical assays for mitochondrial activity: Assays of TCA cycle enzymes and PDHc. Methods Cell Biol. 2007, 80, 199–222. [Google Scholar] [PubMed]
- Patra, D.; Mishra, A. Fluorescence quenching of benzo[k]fluoranthene in poly(vinyl alcohol) film: A possible optical sensor for nitro aromatic compounds. Sens. Actuators B Chem. 2001, 80, 278–282. [Google Scholar] [CrossRef]
- Hill, H.; Simpson, G. Capabilities and limitations of ion mobility spectrometry for field screening applications. Field Anal. Chem. Technol. 1997, 1, 119–134. [Google Scholar] [CrossRef]
- Fleischmann, M.; Hendra, P.; Mcquillan, A. Raman-spectra of pyridine adsorbed at a silver electrode. Chem. Phys. Lett. 1974, 26, 163–166. [Google Scholar] [CrossRef]
- Lin, X.; Cui, Y.; Xu, Y.; Ren, B.; Tian, Z. Surface-enhanced Raman spectroscopy: Substrate-related issues. Anal. Bioanal. Chem. 2009, 394, 1729–1745. [Google Scholar] [CrossRef] [PubMed]
- Fan, M.; Andrade, G.; Brolo, A. A review on the fabrication of substrates for surface enhanced Raman spectroscopy and their applications in analytical chemistry. Anal. Chim. Acta 2011, 693, 7–25. [Google Scholar] [CrossRef] [PubMed]
- Cao, Y.; Jin, R.; Mirkin, C. Nanoparticles with Raman spectroscopic fingerprints for DNA and RNA detection. Science 2002, 297, 1536–1540. [Google Scholar] [CrossRef] [PubMed]
- Kneipp, K.; Haka, A.; Kneipp, H.; Badizadegan, K.; Yoshizawa, N.; Boone, C.; Shafer-Peltier, K.; Motz, J.; Dasari, R.; Feld, M. Surface-enhanced Raman Spectroscopy in single living cells using gold nanoparticles. Appl. Spectrosc. 2002, 56, 150–154. [Google Scholar] [CrossRef]
- Villa, J.; dos Santos, D.; Poppi, R. Fabrication of gold nanoparticle-coated paper and its use as a sensitive substrate for quantitative SERS analysis. Microchim. Acta 2016, 183, 2745–2752. [Google Scholar] [CrossRef]
- Lee, C.; Hankus, M.; Tian, L.; Pellegrino, P.; Singamaneni, S. Highly Sensitive Surface Enhanced Raman Scattering Substrates Based on Filter Paper Loaded with Plasmonic Nanostructures. Anal. Chem. 2011, 83, 8953–8958. [Google Scholar] [CrossRef] [PubMed]
- Cai, W.; Ren, B.; Li, X.; She, C.; Liu, F.; Cai, X.; Tian, Z. Investigation of surface-enhanced Raman scattering from platinum electrodes using a confocal Raman microscope: Dependence of surface roughening pretreatment. Surf. Sci. 1998, 406, 9–22. [Google Scholar] [CrossRef]
- Brolo, A.; Arctander, E.; Gordon, R.; Leathem, B.; Kavanagh, K. Nanohole-enhanced Raman scattering. Nano Lett. 2004, 4, 2015–2018. [Google Scholar] [CrossRef]
- Min, Q.; Santos, M.; Girotto, E.; Brolo, A.; Gordon, R. Localized Raman enhancement from a double-hole nanostructure in a metal film. J. Phys. Chem. C 2008, 112, 15098–15101. [Google Scholar] [CrossRef]
- Im, H.; Bantz, K.; Lindquist, N.; Haynes, C.; Oh, S. Vertically Oriented Sub-10-nm Plasmonic Nanogap Arrays. Nano Lett. 2010, 10, 2231–2236. [Google Scholar] [CrossRef] [PubMed]
- Tran, M.; Whale, A.; Padalkar, S. Exploring the Efficacy of Platinum and Palladium Nanostructures for Organic Molecule Detection via Raman Spectroscopy. Sensors 2018, 18, 147. [Google Scholar] [CrossRef] [PubMed]
- Zhang, J.; Joshi, P.; Zhou, Y.; Ding, R.; Zhang, P. Quantitative SERS-based DNA detection assisted by magnetic microspheres. Chem. Commun. 2015, 51, 15284–15286. [Google Scholar] [CrossRef] [PubMed]
- McFarland, A.; Young, M.; Dieringer, J.; Van Duyne, R. Wavelength-scanned surface-enhanced Raman excitation spectroscopy. J. Phys. Chem. B 2005, 109, 11279–11285. [Google Scholar] [CrossRef] [PubMed]
- Abu Hatab, N.; Oran, J.; Sepaniak, M. Surface-enhanced Raman spectroscopy substrates created via electron beam lithography and nanotransfer printing. ACS Nano 2008, 2, 377–385. [Google Scholar] [CrossRef] [PubMed]
- Ko, H.; Chang, S.; Tsukruk, V. Porous Substrates for Label-Free Molecular Level Detection of Nonresonant Organic Molecules. ACS Nano 2009, 3, 181–188. [Google Scholar] [CrossRef] [PubMed]
- Tessier, P.; Velev, O.; Kalambur, A.; Lenhoff, A.; Rabolt, J.; Kaler, E. Structured metallic films for optical and spectroscopic applications via colloidal crystal templating. Adv. Mater. 2001, 13, 396–400. [Google Scholar] [CrossRef]
- Jiang, X.; Qin, X.; Yin, D.; Gong, M.; Yang, L.; Zhao, B.; Ruan, W. Rapid monitoring of benzylpenicillin sodium using Raman and surface enhanced Raman spectroscopy. Spectrochim. Acta Part A Mol. Biomol. Spectrosc. 2015, 140, 474–478. [Google Scholar] [CrossRef] [PubMed]
- Li, Y.; Lu, G.; Wu, X.; Shi, G. Electrochemical fabrication of two-dimensional palladium nanostructures as substrates for surface enhanced Raman scattering. J. Phys. Chem. B 2006, 110, 24585–24592. [Google Scholar] [CrossRef] [PubMed]
- Kannan, P.; Dolinska, J.; Maiyalagan, T.; Opallo, M. Facile and rapid synthesis of Pd nanodendrites for electrocatalysis and surface-enhanced Raman scattering applications. Nanoscale 2014, 6, 11169–11176. [Google Scholar] [CrossRef] [PubMed] [Green Version]
- Li, H.; Chong, X.; Chen, Y.; Yang, L.; Luo, L.; Zhao, B.; Tian, Y. Detection of 6-Thioguanine by surface-enhanced Raman scattering spectroscopy using silver nanoparticles-coated silicon wafer. Colloids Surf. A Physicochem. Eng. Asp. 2016, 493, 52–58. [Google Scholar] [CrossRef]
- Ye, W.; Liu, J.; Liu, Q.; Zhou, F.; Liu, W. Surfactant-free and controllable synthesis of hierarchical platinum nanostructures and their comparative studies in electrocatalysis, surface-enhanced Raman scattering and surface wettability. Electrochim. Acta 2010, 55, 8649–8654. [Google Scholar] [CrossRef]
- Liu, J.; Wang, J.; Huang, W.; Yu, L.; Ren, X.; Wen, W.; Yu, S. Ordering Ag nanowire arrays by a glass capillary: A portable, reusable and durable SERS substrate. Sci. Rep. 2012, 2, 987. [Google Scholar] [CrossRef] [PubMed]
- Yu, W.; White, I. Inkjet-printed paper-based SERS dipsticks and swabs for trace chemical detection. Analyst 2013, 138, 1020–1025. [Google Scholar] [CrossRef] [PubMed]
- Lee, C.; Tian, L.; Singamaneni, S. Paper-Based SERS Swab for Rapid Trace Detection on Real-World Surfaces. ACS Appl. Mater. Interfaces 2010, 2, 3429–3435. [Google Scholar] [CrossRef] [PubMed]
- Wei, W.; Huang, Q. Rapid fabrication of silver nanoparticle-coated filter paper as SERS substrate for low-abundance molecules detection. Spectrochim. Acta Part A Mol. Biomol. Spectrosc. 2017, 179, 211–215. [Google Scholar] [CrossRef] [PubMed]
- Ngo, Y.; Li, D.; Simon, G.; Garnier, G. Gold Nanoparticle-Paper as a Three-Dimensional Surface Enhanced Raman Scattering Substrate. Langmuir 2012, 28, 8782–8790. [Google Scholar] [CrossRef] [PubMed]
- Zhu, Y.; Li, M.; Yu, D.; Yang, L. A novel paper rag as ‘D-SERS’ substrate for detection of pesticide residues at various peels. Talanta 2014, 128, 117–124. [Google Scholar] [CrossRef] [PubMed]
- Yu, W.; White, I. Inkjet Printed Surface Enhanced Raman Spectroscopy Array on Cellulose Paper. Anal. Chem. 2010, 82, 9626–9630. [Google Scholar] [CrossRef] [PubMed] [Green Version]
- Chen, J.; Huang, Y.; Kannan, P.; Zhang, L.; Lin, Z.; Zhang, J.; Chen, T.; Guo, L. Flexible and Adhesive Surface Enhance Raman Scattering Active Tape for Rapid Detection of Pesticide Residues in Fruits and Vegetables. Anal. Chem. 2016, 88, 2149–2155. [Google Scholar] [CrossRef] [PubMed]
- Qu, L.; Geng, Y.; Bao, Z.; Riaz, S.; Li, H. Silver nanoparticles on cotton swabs for improved surface-enhanced Raman scattering, its application to the detection of carbaryl. Microchim. Acta 2016, 183, 1307–1313. [Google Scholar] [CrossRef]
- Zhao, W.; Xu, Z.; Sun, T.; Liu, S.; Wu, X.; Ma, Z.; He, J.; Chen, C. Carbon cloth surface-decorated with silver nanoparticles for surface-enhanced Raman scattering. J. Alloys Compd. 2014, 584, 635–639. [Google Scholar] [CrossRef]
- Wang, P.; Zhang, L.; Xia, Y.; Tong, L.; Xu, X.; Ying, Y. Polymer Nanofibers Embedded with Aligned Gold Nanorods: A New Platform for Plasmonic Studies and Optical Sensing. Nano Lett. 2012, 12, 3145–3150. [Google Scholar] [CrossRef] [PubMed]
- Huang, L.; Zhou, Y.; Han, S.; Yan, Y.; Zhou, L.; Chen, W.; Zhou, P.; Chen, X.; Roy, V. Controlled Assembly of Silver Nanoparticles Monolayer on 3D Polymer Nanotubes and their Applications. Small 2014, 10, 4645–4650. [Google Scholar] [CrossRef] [PubMed]
- He, D.; Hu, B.; Yao, Q.; Wang, K.; Yu, S. Large-Scale Synthesis of Flexible Free-Standing SERS Substrates with High Sensitivity: Electrospun PVA Nanofibers Embedded with Controlled Alignment of Silver Nanoparticles. ACS Nano 2009, 3, 3993–4002. [Google Scholar] [CrossRef] [PubMed]
- Zhang, Z.; Su, F.; Wang, K.; Jiang, W.; Men, X.; Liu, W. Study on the friction and wear properties of carbon fabric composites reinforced with micro- and nano-particles. Mater. Sci. Eng. A Struct. Mater. Prop. Microstruct. Process. 2005, 404, 251–258. [Google Scholar] [CrossRef]
- Tran, M.; Mundt, C.; Lan, T.; Padalkar, S. Electrodeposition of Gold Nanostructures Having Controlled Morphology. J. Nanosci. Nanotechnol. 2018, 18, 3492–3498. [Google Scholar] [CrossRef] [PubMed]
- Lan, T.; Mundt, C.; Tran, M.; Padalkar, S. Effect of gold underlayer on copper(I) oxide photocathode performance. J. Mater. Res. 2017, 32, 1656–1664. [Google Scholar] [CrossRef]
- Tran, M.; DePenning, R.; Turner, M.; Padalkar, S. Effect of Citrate Ratio and Temperature on Gold Nanoparticle Size and Morphology. Mater. Res. Express 2016, 3, 105027. [Google Scholar] [CrossRef]
- Wang, B.; Zhang, L.; Zhou, X. Synthesis of silver nanocubes as a SERS substrate for the determination of pesticide paraoxon and thiram. Spectrochim. Acta Part A Mol. Biomol. Spectrosc. 2014, 121, 63–69. [Google Scholar] [CrossRef] [PubMed]
- Sharma, B.; Frontiera, R.; Henry, A.; Ringe, E.; Van Duyne, R. SERS: Materials, applications, the future. Mater. Today 2012, 15, 16–25. [Google Scholar] [CrossRef]
- Doering, W.; Nie, S. Single-molecule and single-nanoparticle SERS: Examining the roles of surface active sites and chemical enhancement. J. Phys. Chem. B 2002, 106, 311–317. [Google Scholar] [CrossRef]
- He, X.; Gao, Y.; Mahjouri-Samani, M.; Black, P.; Allen, J.; Mitchell, M.; Xiong, W.; Zhou, Y.; Jiang, L.; Lu, Y. Surface-enhanced Raman spectroscopy using gold-coated horizontally aligned carbon nanotubes. Nanotechnology 2012, 23, 205702. [Google Scholar] [CrossRef] [PubMed]
- Yamamoto, Y.; Hasegawa, K.; Hasegawa, Y.; Takahashi, N.; Kitahama, Y.; Fukuoka, S.; Murase, N.; Baba, Y.; Ozaki, Y.; Itoh, T. Direct conversion of silver complexes to nanoscale hexagonal columns on a copper alloy for plasmonic applications. Phys. Chem. Chem. Phys. 2013, 15, 14611–14615. [Google Scholar] [CrossRef] [PubMed]
- Hildebrandt, P.; Stockburger, M. Surface-enhanced resonance Raman-spectroscopy of Rhodamine-6G adsorbed on colloidal silver. J. Phys. Chem. 1984, 88, 5935–5944. [Google Scholar] [CrossRef]
- Zhang, Y.; Zheng, J.; Gao, G.; Kong, Y.; Zhi, X.; Wang, K.; Zhang, X.; Cui, D. Biosynthesis of gold nanoparticles using chloroplasts. Int. J. Nanomed. 2011, 6, 2899–2906. [Google Scholar] [CrossRef] [PubMed]
- Fathi, F.; Lagugne-Labarthet, F.; Pedersen, D.; Kraatz, H. Studies of the interaction of two organophosphonates with nanostructured silver surfaces. Analyst 2012, 137, 4448–4453. [Google Scholar] [CrossRef] [PubMed]
Figure 1.
Photographs of the electrochemical cell (a), which consists of an Ag/AgCl reference electrode (b), platinum counter electrode (c) and carbon paper as working electrode (d).
Figure 1.
Photographs of the electrochemical cell (a), which consists of an Ag/AgCl reference electrode (b), platinum counter electrode (c) and carbon paper as working electrode (d).

Figure 2.
Photographs showing carbon cloth (a) and carbon paper (b) after electrodeposition of Au nanostructures.
Figure 2.
Photographs showing carbon cloth (a) and carbon paper (b) after electrodeposition of Au nanostructures.

Figure 3.
SEM images of carbon cloth (a) before and (b) after electrodeposition of Au nanostructures. The inset shows Au-electrodeposited carbon cloth at higher magnification.
Figure 3.
SEM images of carbon cloth (a) before and (b) after electrodeposition of Au nanostructures. The inset shows Au-electrodeposited carbon cloth at higher magnification.

Figure 4.
SEM images of carbon paper (a) before and (b) after electrodeposition of Au nanostructures. The inset shows Au-electrodeposited carbon paper at higher magnification.
Figure 4.
SEM images of carbon paper (a) before and (b) after electrodeposition of Au nanostructures. The inset shows Au-electrodeposited carbon paper at higher magnification.

Figure 5.
Energy dispersive x-ray (EDX) spectra and mapping analysis of Au nanostructures electrodeposited on (a,b) carbon cloth, and (c,d) carbon paper, respectively. The insets show the different regions where EDX patterns were taken. The scale bars in the insets and the EDX mapping are 50 μm and 100 μm, respectively.

Figure 6.
Normalized UV-Vis spectra of Au-electrodeposited carbon cloth and carbon paper.

Figure 7.
Raman spectra of 10−5 M and 10−6 M R6G drop casted on Au coated carbon cloth and carbon paper respectively (a). Raman spectra of 10−2 M paraoxon drop casted on both flexible substrates in the presence and absence of Au nanostructures (b).
Figure 7.
Raman spectra of 10−5 M and 10−6 M R6G drop casted on Au coated carbon cloth and carbon paper respectively (a). Raman spectra of 10−2 M paraoxon drop casted on both flexible substrates in the presence and absence of Au nanostructures (b).

Figure 8.
Wiping the contaminated area on an apple’s skin by carbon cloth electrodeposited with Au nanostructures for detection of paraoxon (10−2 M) via SERS (a). Raman spectra showing characteristic Raman modes of paraoxon (b).
Figure 8.
Wiping the contaminated area on an apple’s skin by carbon cloth electrodeposited with Au nanostructures for detection of paraoxon (10−2 M) via SERS (a). Raman spectra showing characteristic Raman modes of paraoxon (b).


Table 1.
Mass fraction analysis of chemical elements obtained by EDX.
| Element | C | O | F | Cl | Au | Total |
|---|---|---|---|---|---|---|
| Au/C-Cloth | 2.86 | 0.20 | N/A | 0.03 | 96.91 | 100.00 |
| Au/C-paper | 2.56 | 0.37 | 0.37 | 0.07 | 96.62 | 100.00 |
Table 2.
Raman mode assignments for R6G and paraoxon pesticide corresponding to Figure 7.
Table 2.
Raman mode assignments for R6G and paraoxon pesticide corresponding to Figure 7.
| Raman Mode (cm−1) | Assignment for R6G | Reference |
|---|---|---|
| 1361 | Aromatic C–C stretching, in-plane C–H bending | [53,54,55,56] |
| 1506, 1532 | Aromatic C–C stretching, C–N stretching, C–H bending, N–H bending | [53,54,55] |
| 1573, 1600 | Aromatic C–C stretching, in-plane N–H bending | [53,54,55] |
| 1650 | Aromatic C–C stretching, in-plane C–H bending | [53,54,55,56] |
| Raman Peak (cm−1) | Assignment for Paraoxon | Reference |
| 732 | NO2 scissor, C–C bending | [3,57] |
| 859 | NO2 scissor (Aromatic–NO2) | [3,57] |
| 1110 | C–H band (in plane)/NO2 asymmetric stretching | [3,57] |
| 1348 | Symmetry stretching NO2 | [3,57] |
| 1592 | Phenyl ring vibration | [3,57] |
© 2018 by the authors. Licensee MDPI, Basel, Switzerland. This article is an open access article distributed under the terms and conditions of the Creative Commons Attribution (CC BY) license (http://creativecommons.org/licenses/by/4.0/).
Share and Cite
MDPI and ACS Style
Tran, M.; Fallatah, A.; Whale, A.; Padalkar, S. Utilization of Inexpensive Carbon-Based Substrates as Platforms for Sensing. Sensors 2018, 18, 2444. https://doi.org/10.3390/s18082444
AMA Style
Tran M, Fallatah A, Whale A, Padalkar S. Utilization of Inexpensive Carbon-Based Substrates as Platforms for Sensing. Sensors. 2018; 18(8):2444. https://doi.org/10.3390/s18082444
Chicago/Turabian StyleTran, Minh, Ahmad Fallatah, Alison Whale, and Sonal Padalkar. 2018. "Utilization of Inexpensive Carbon-Based Substrates as Platforms for Sensing" Sensors 18, no. 8: 2444. https://doi.org/10.3390/s18082444
Note that from the first issue of 2016, this journal uses article numbers instead of page numbers. See further details here.