Mapping and Assessment of PM10 and O3 Removal by Woody Vegetation at Urban and Regional Level

 , , ,
, , ,
Abstract
:
1. Introduction
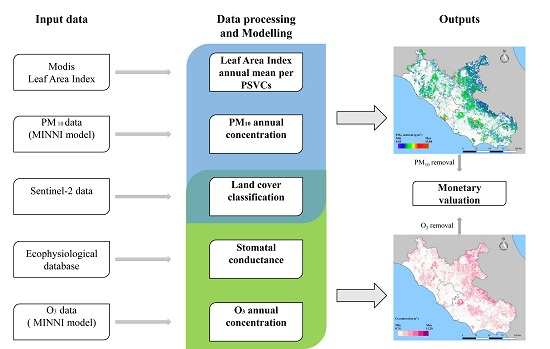
2. Methods
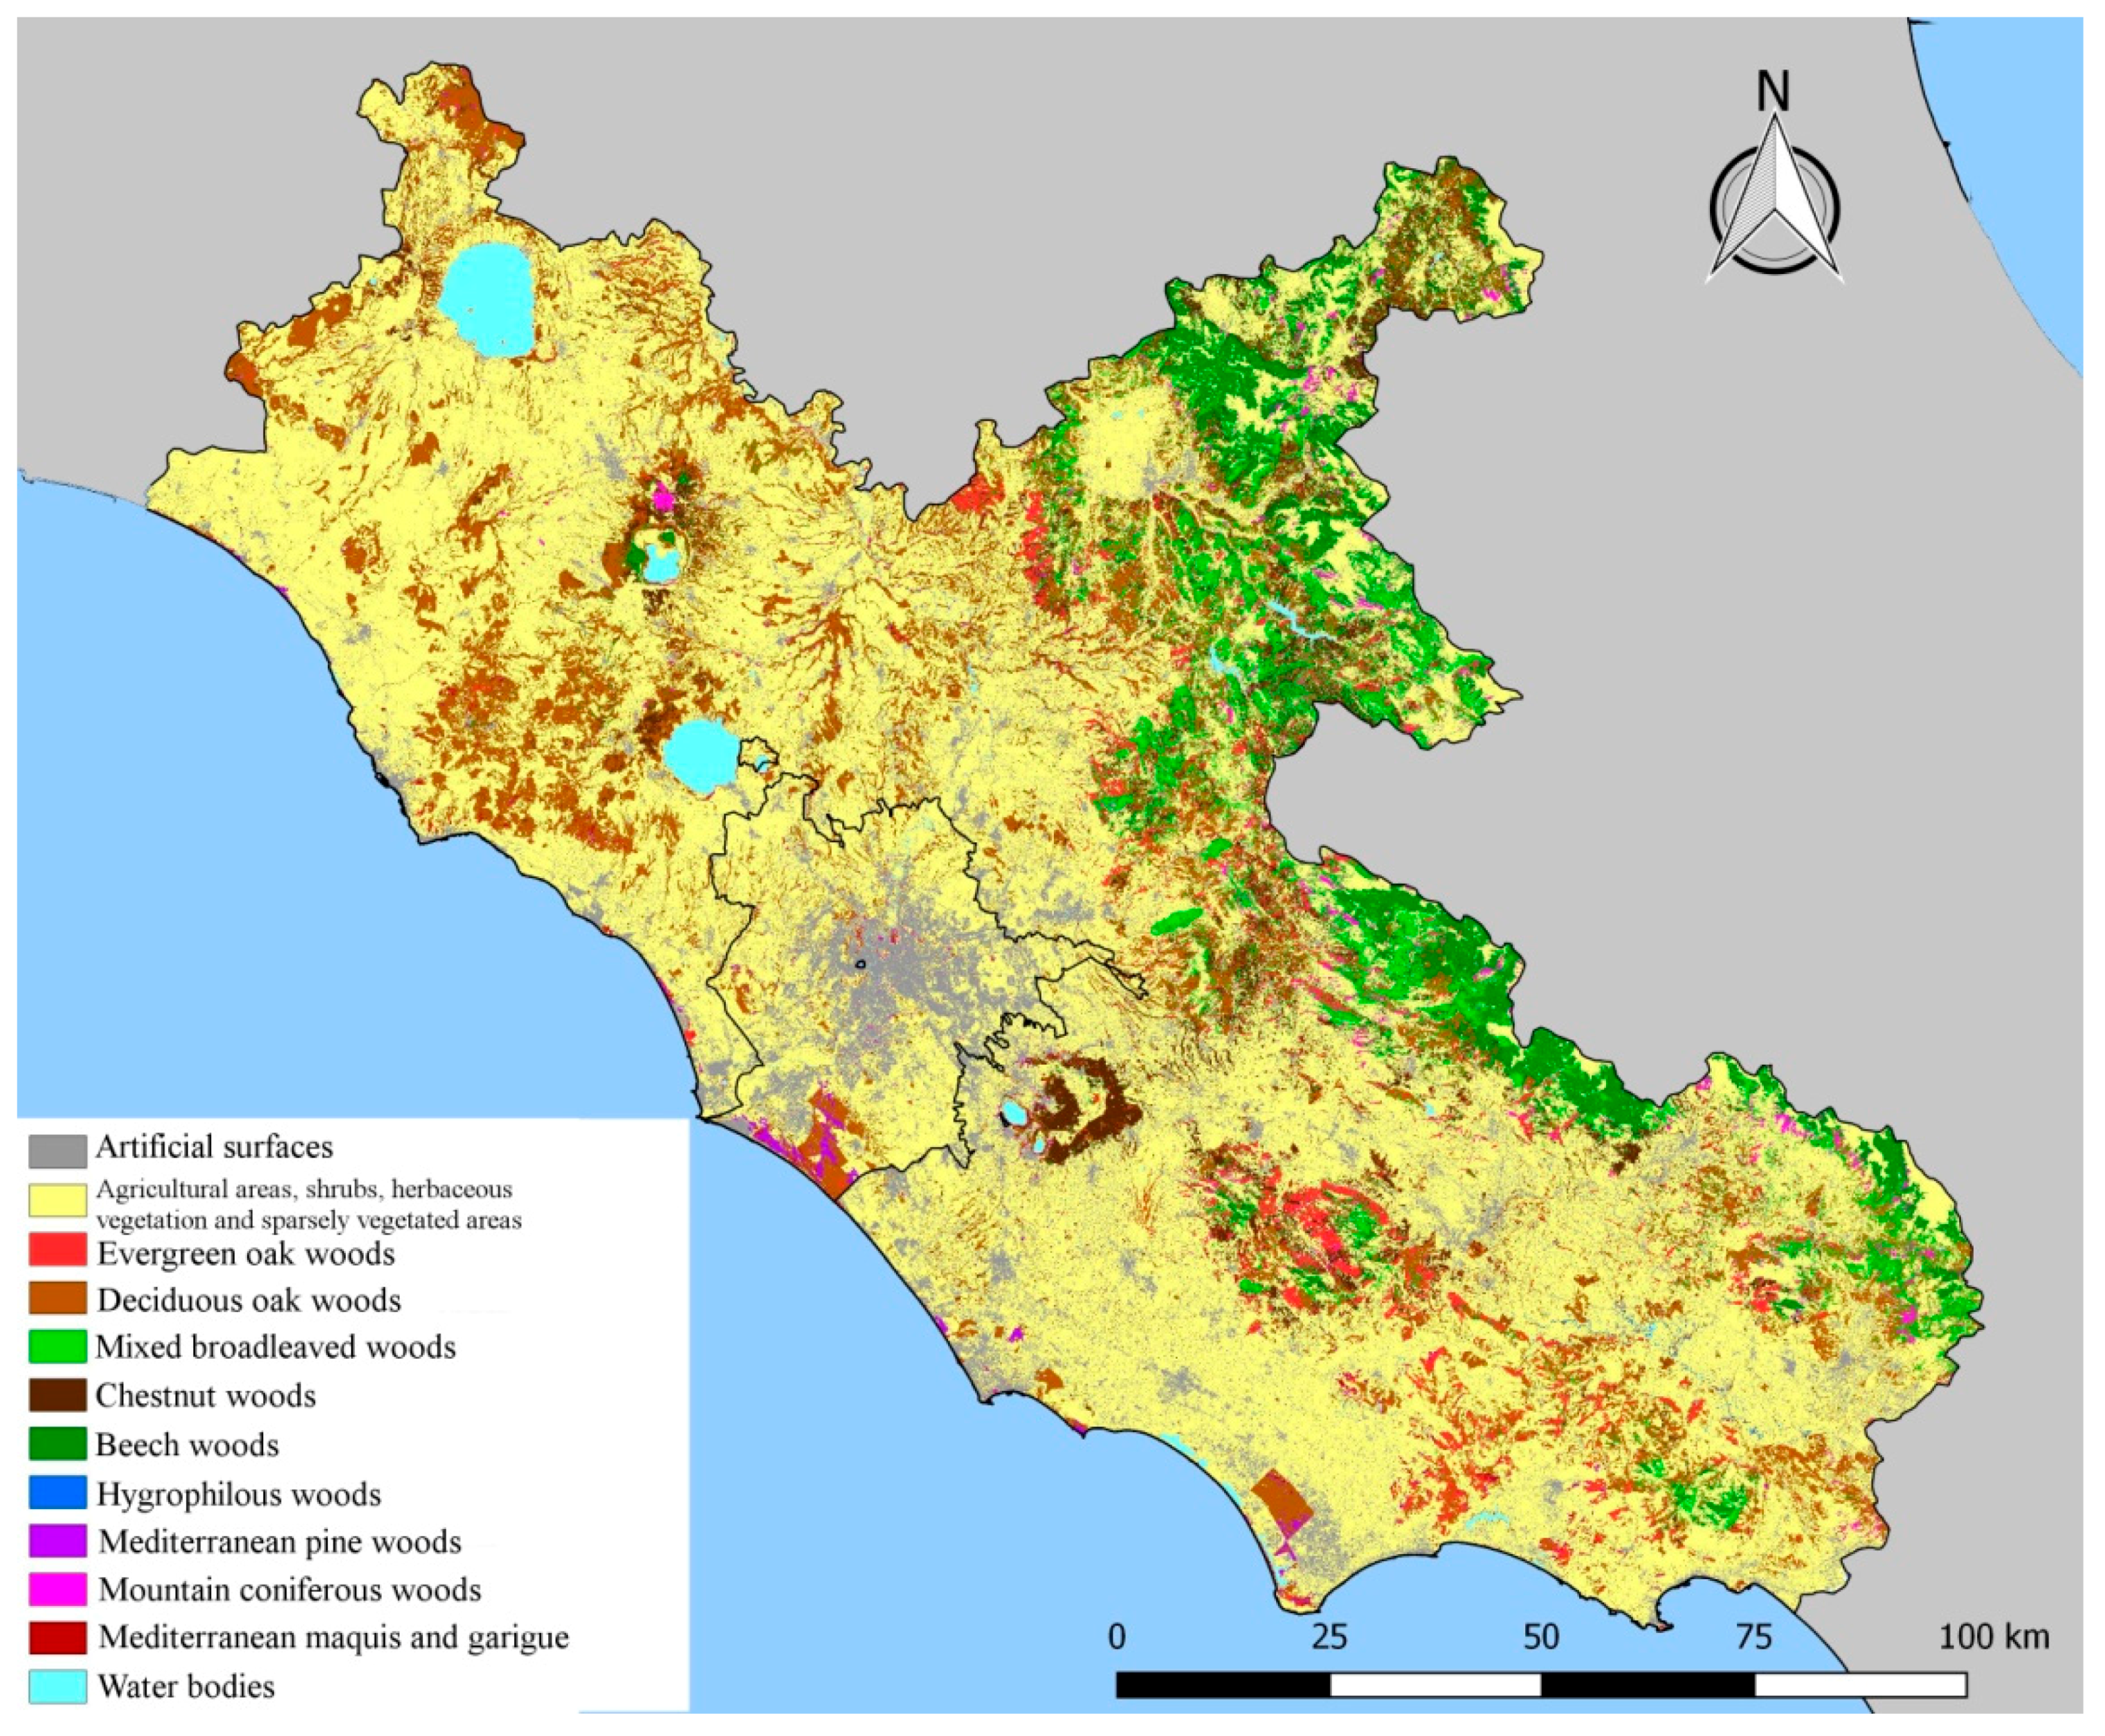
2.1. Study Area: The Latium Region and the Municipality of Rome
2.2. Ecosystem Mapping
2.3. Air Pollutant Concentration
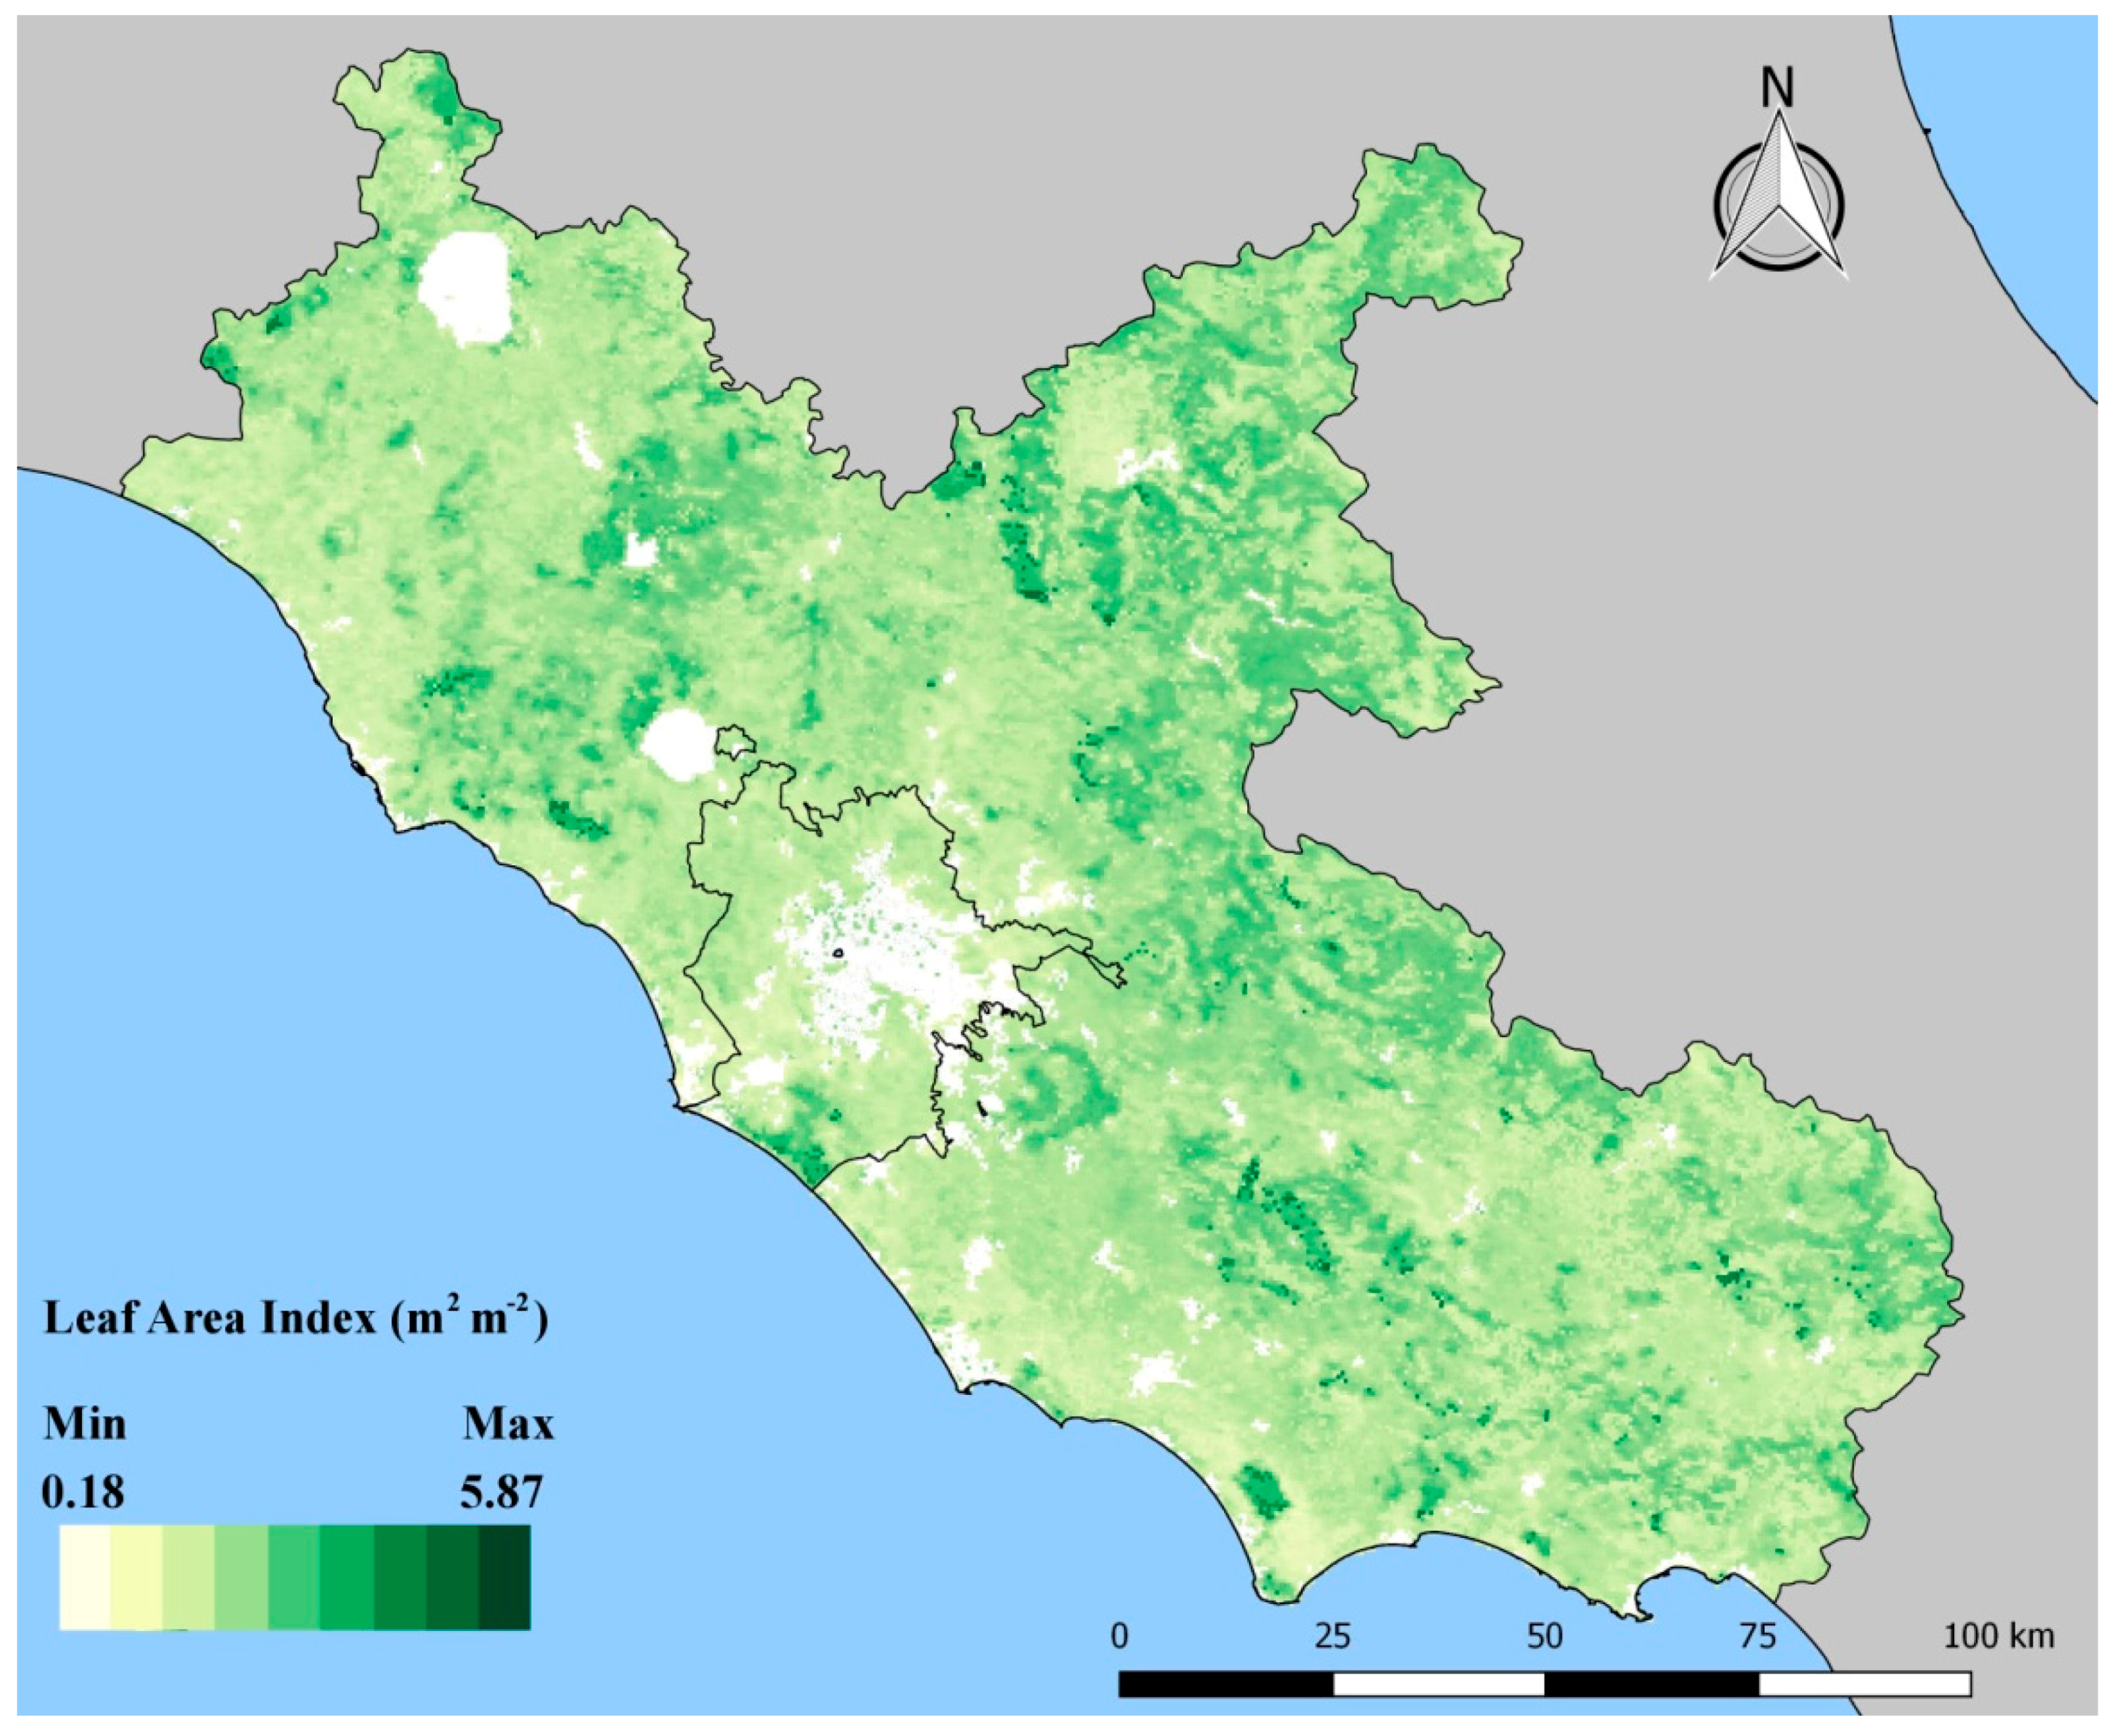
2.4. Leaf Area Index
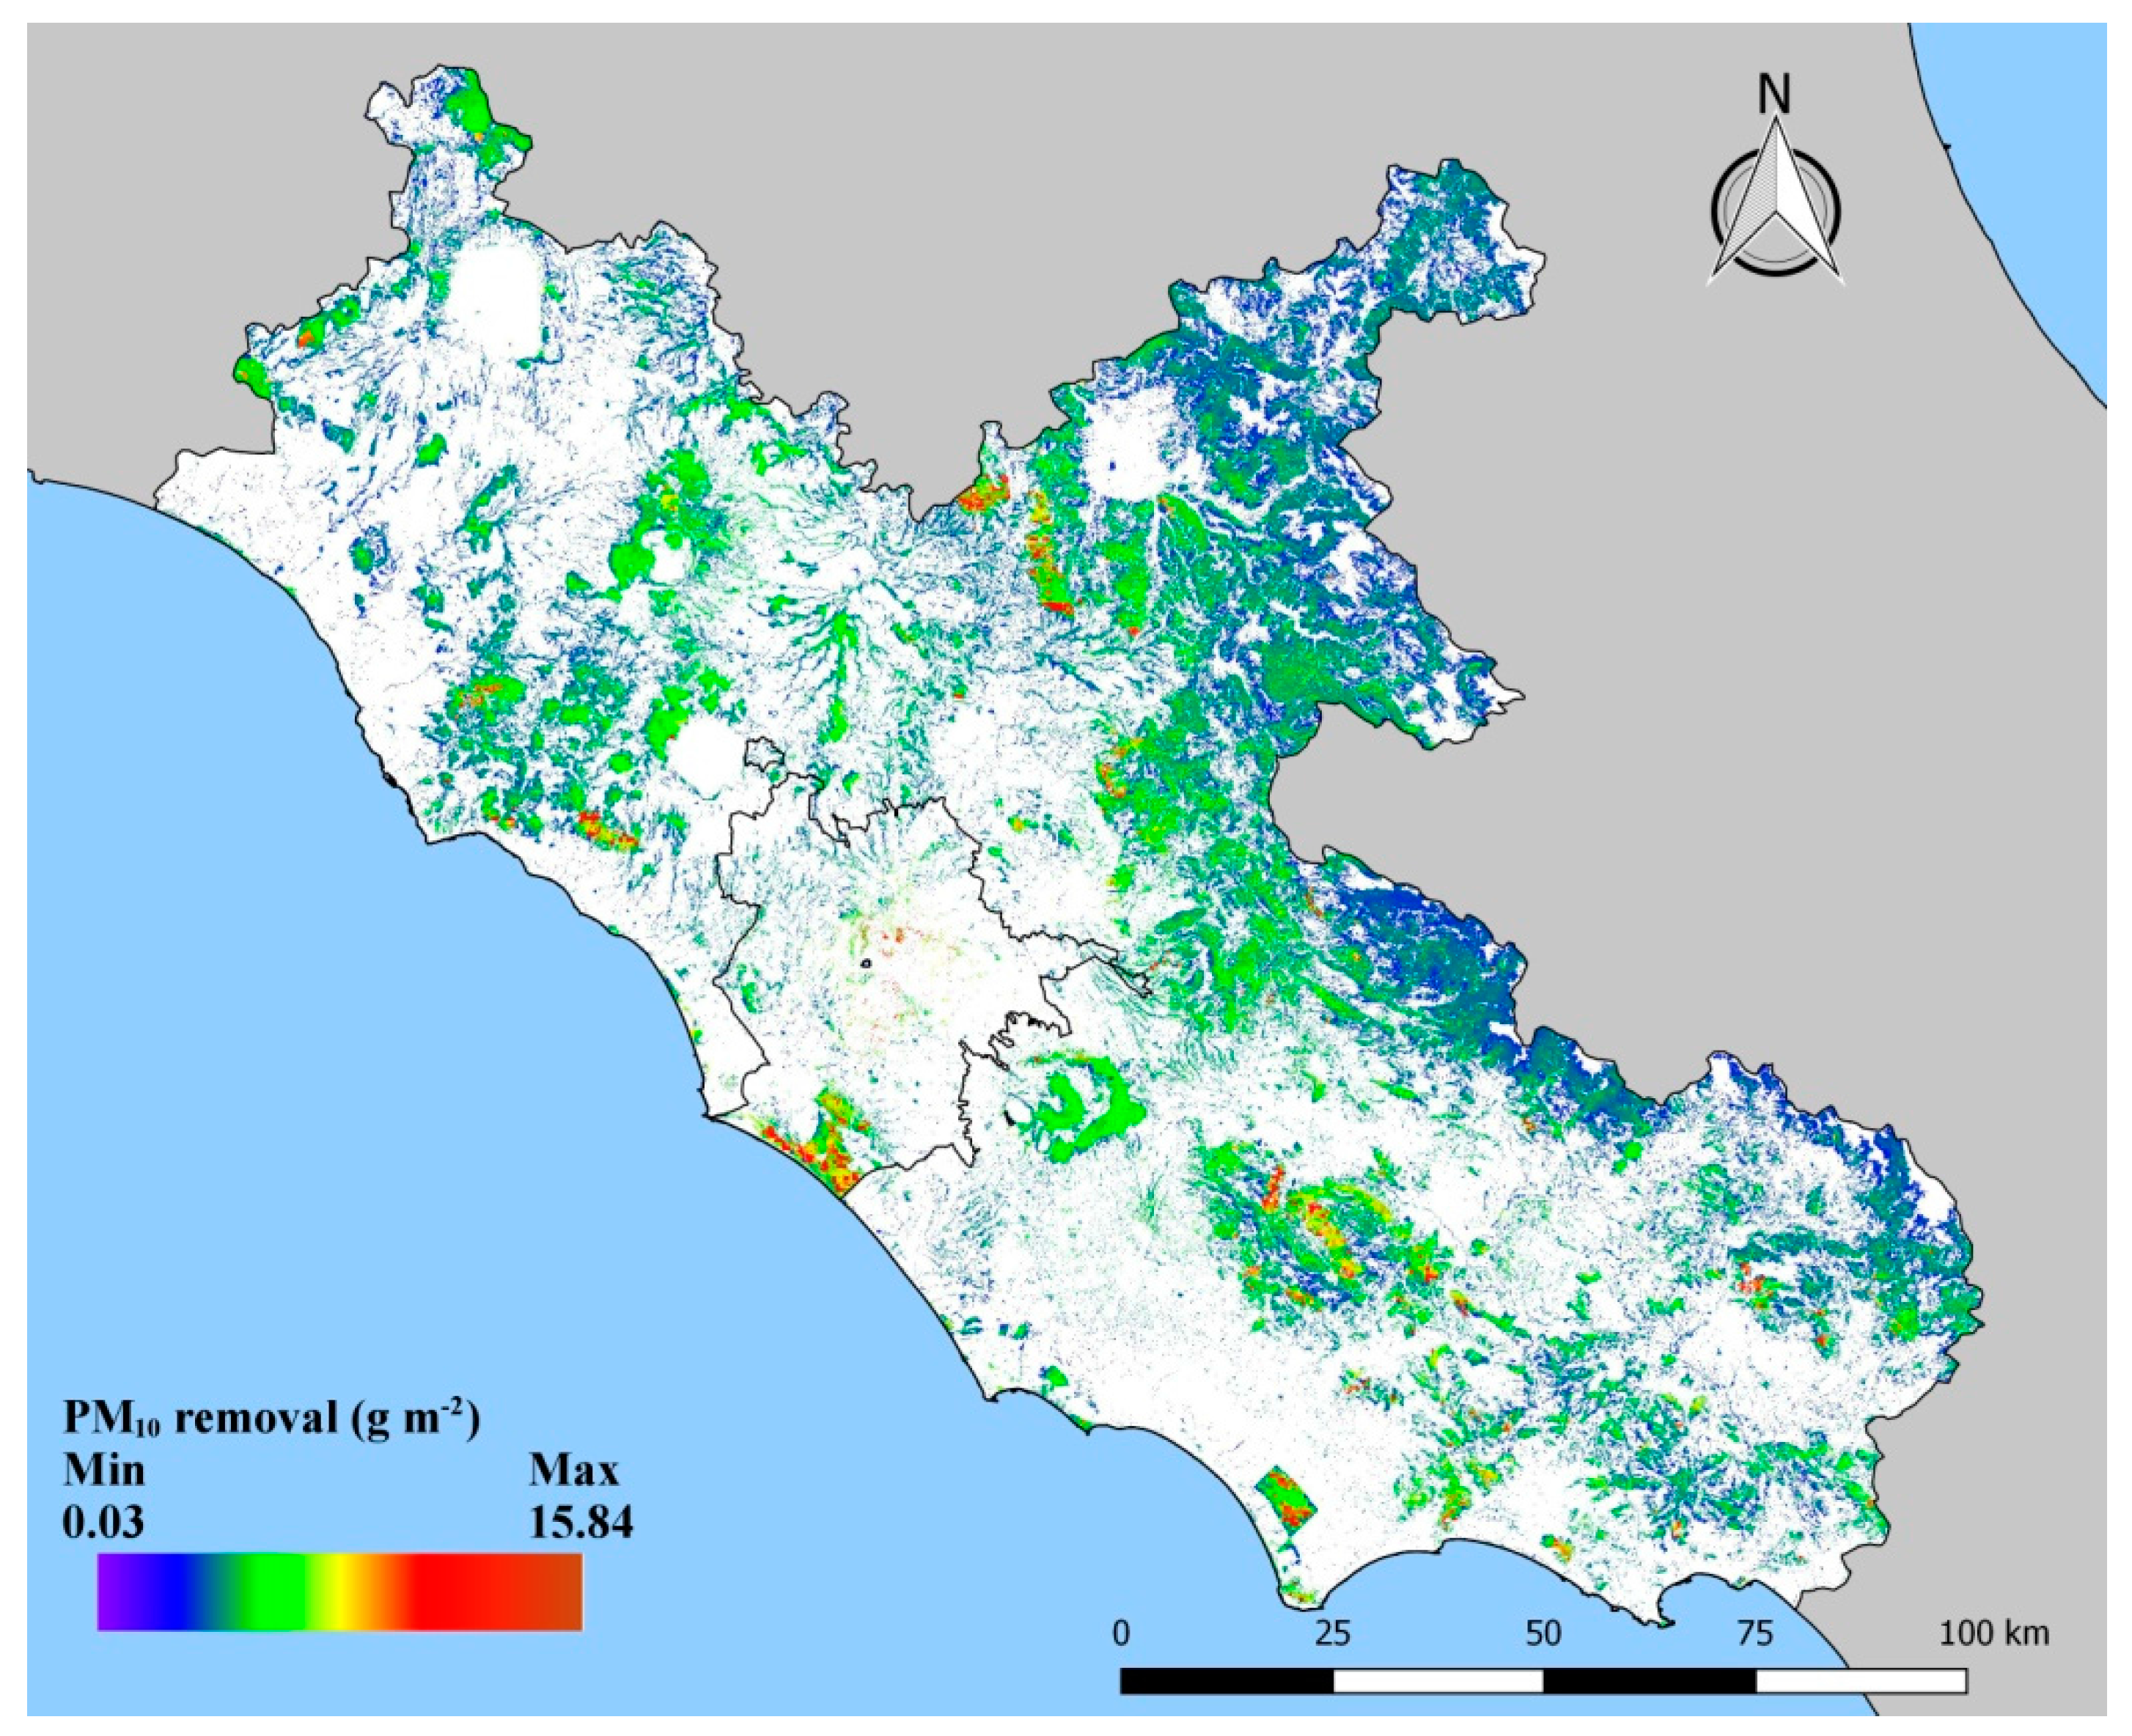
2.5. PM10 Deposition
2.6. O3 Absorption
2.7. Monetary Valuation
3. Results
3.1. Ecosystem Mapping
3.2. Leaf Area Index
3.3. PM10 Deposition
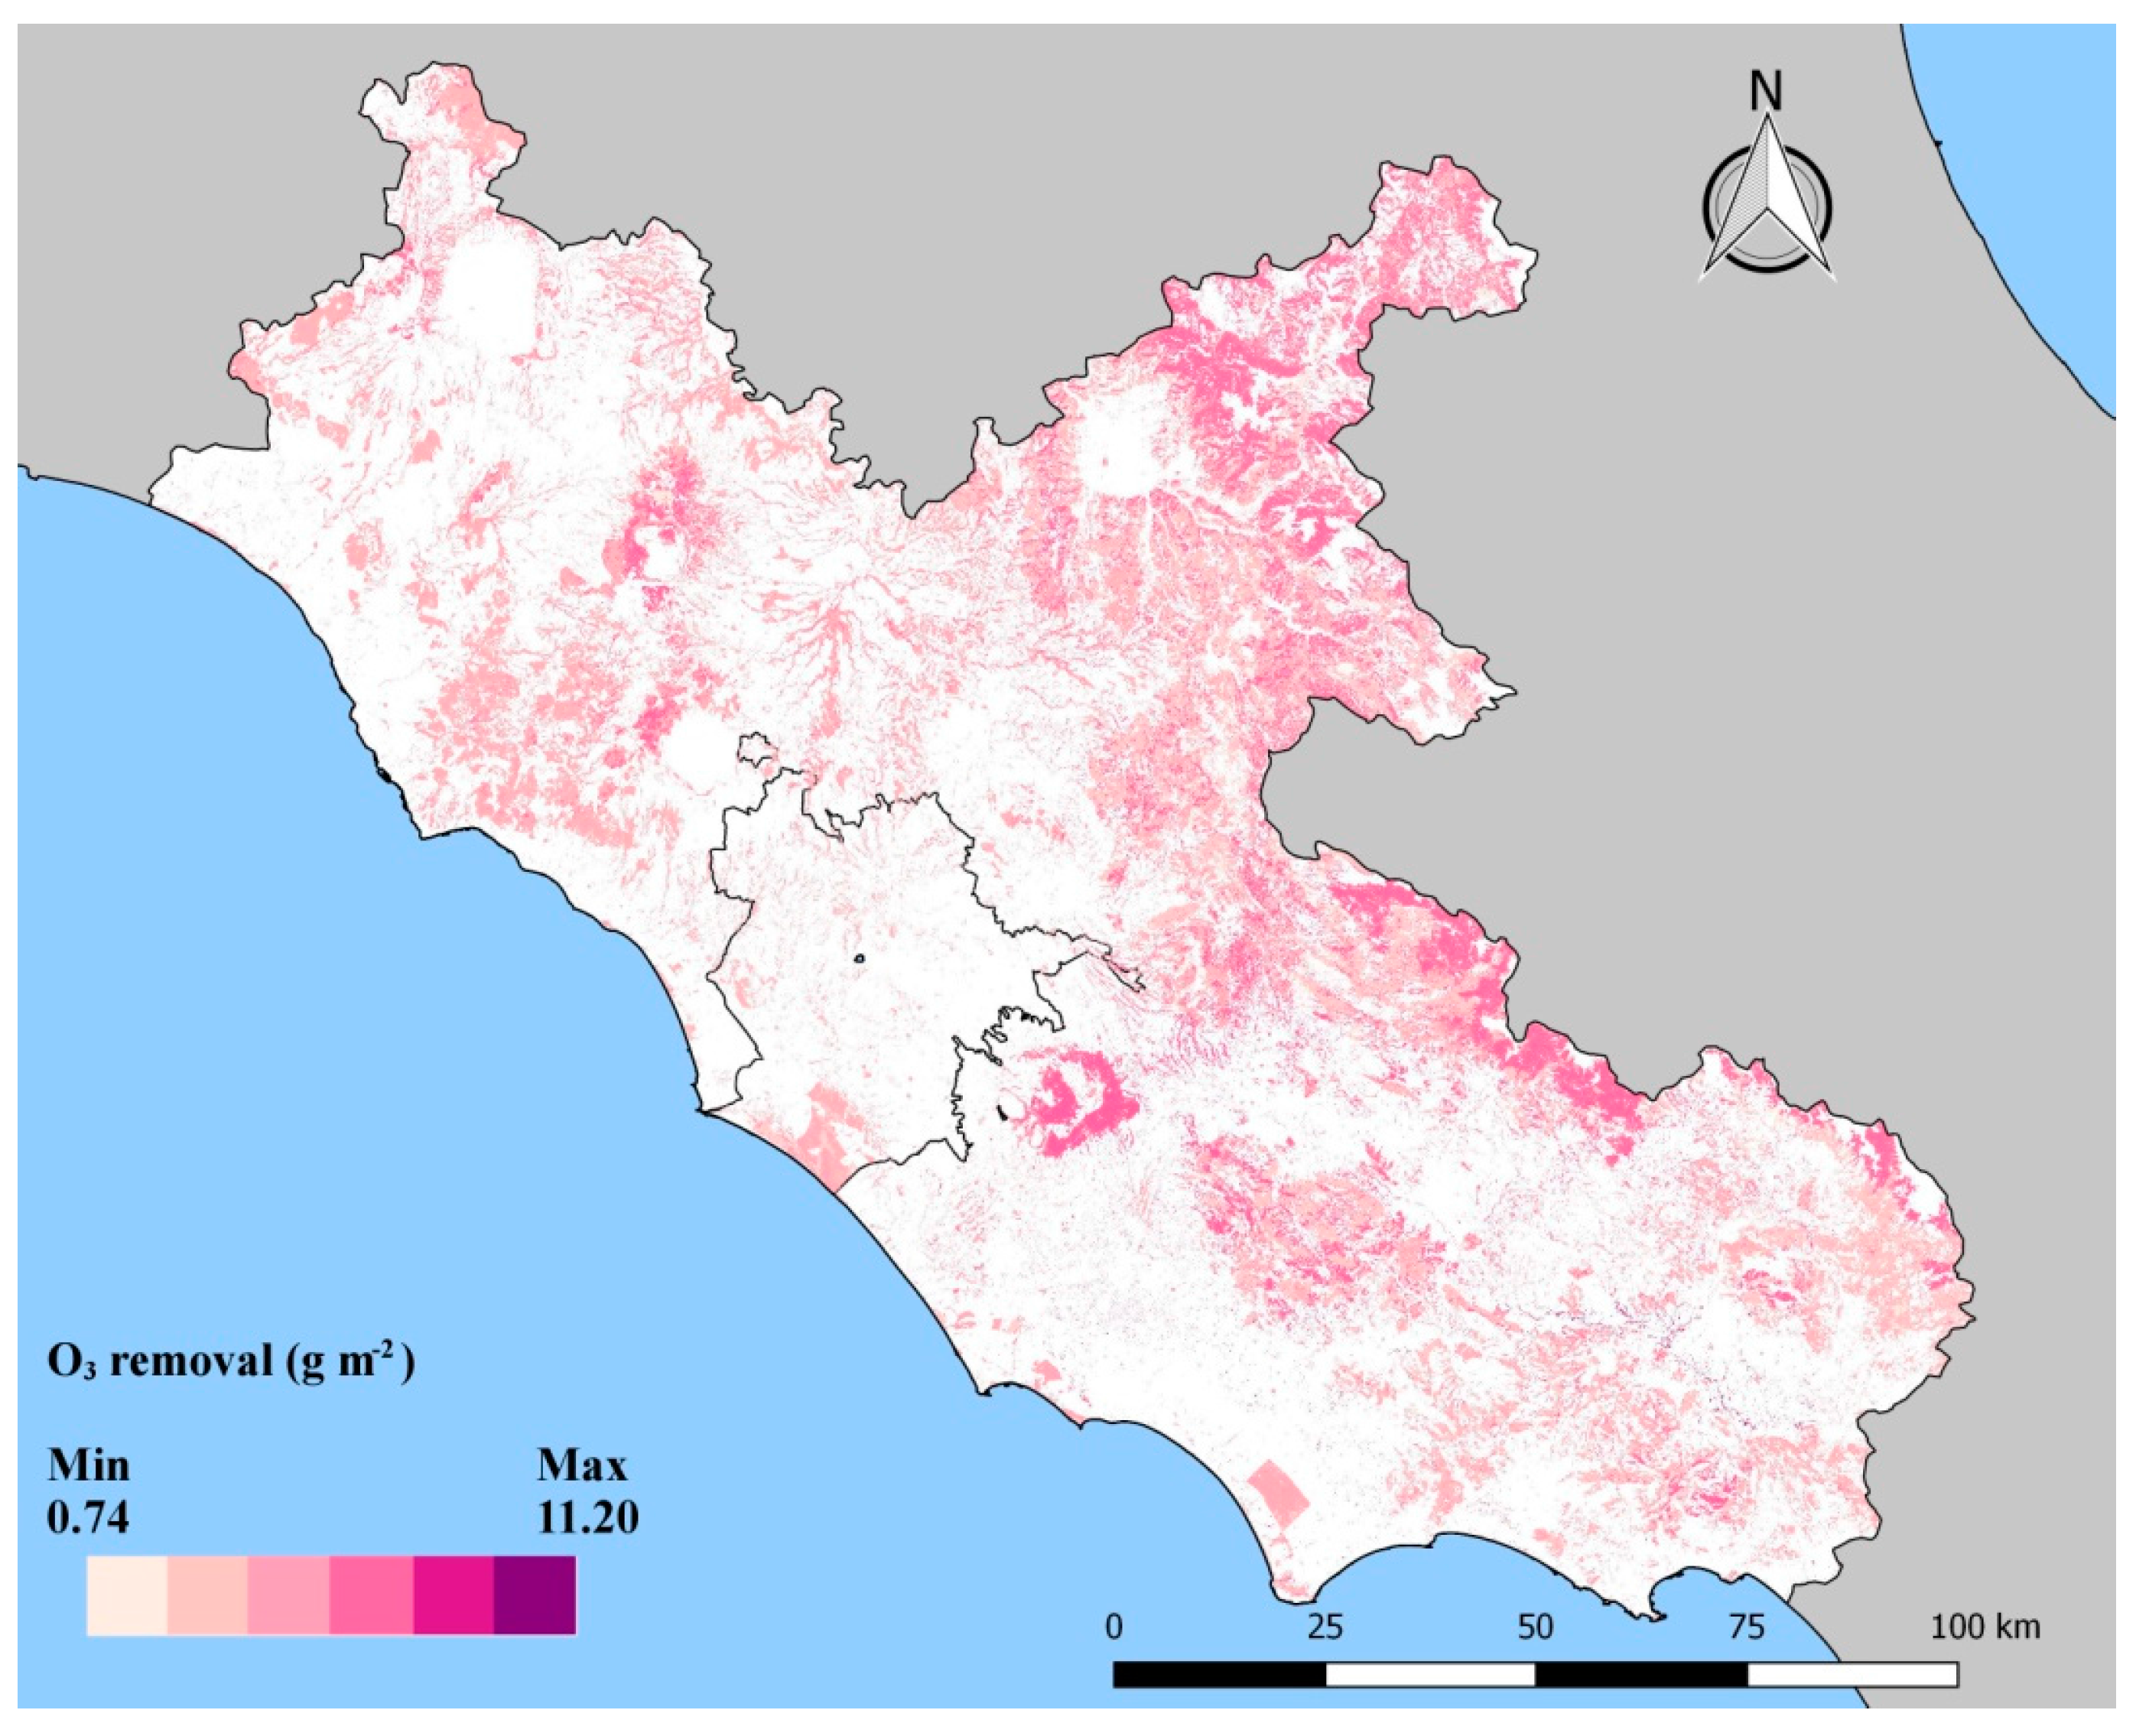
3.4. O3 Absorption
4. Discussion
5. Conclusions
Supplementary Materials
Acknowledgments
Author Contributions
Conflicts of Interest
References
- Troy, A.; Wilson, M.A. Mapping ecosystem services: Practical challenges and opportunities in linking GIS and value transfer. Ecol. Econ. 2006, 60, 435–449. [Google Scholar] [CrossRef]
- Dawson, T.P.; Cutler, M.E.J.; Brown, C. The role of remote sensing in the development of SMART indicators for ecosystem services assessment. Biodiversity 2016, 17, 136–148. [Google Scholar] [CrossRef]
- ISPRA. 2016. Available online: http://www.isprambiente.gov.it/it/pubblicazioni/rapporti/consumo-di-suolo-dinamiche-territoriali-e-servizi-ecosistemici (accessed on 3 July 2017).
- Metzger, M.J.; Rounsevell, M.D.A.; Acosta-Michlik, L.; Leemans, R.; Schröter, D. The vulnerability of ecosystem services to land use change. Agric. Ecosyst. Environ. 2006, 114, 69–85. [Google Scholar] [CrossRef]
- Rose, R.A.; Byler, D.; Eastman, J.R.; Fleishman, E.; Geller, G.; Goetz, S.; Guild, L.; Hamilton, H.; Hansen, M.; Headley, R.; et al. Ten ways remote sensing can contribute to conservation. Conserv. Biol. 2015, 29, 350–359. [Google Scholar] [CrossRef] [PubMed]
- Maes, J.; Liquete, C.; Teller, A.; Erhard, M.; Paracchini, M.L.; Barredo, J.I.; Grizzetti, B.; Cardoso, A.; Somma, F.; Petersen, J.-E.; et al. An indicator framework for assessing ecosystem services in support of the EU Biodiversity Strategy to 2020. Ecosyst. Serv. 2016, 17, 14–23. [Google Scholar] [CrossRef]
- Naidoo, R.; Balmford, A.; Costanza, R.; Fisher, B.; Green, R.E.; Lehner, B.; Malcolm, T.R.; Ricketts, T.H. Global mapping of ecosystem services and conservation priorities. Proc. Natl. Acad. Sci. USA 2008, 105, 9495–9500. [Google Scholar] [CrossRef] [PubMed]
- Manes, F.; Incerti, G.; Salvatori, E.; Vitale, M.; Ricotta, C.; Costanza, R. Urban ecosystem services: Tree diversity and stability of tropospheric ozone removal. Ecol. Appl. 2012, 22, 349–360. [Google Scholar] [CrossRef] [PubMed]
- Baró, F.; Chaparro, L.; Gómez-Baggethun, E.; Langemeyer, J.; Nowak, D.J.; Terradas, J. Contribution of Ecosystem Services to Air Quality and Climate Change Mitigation Policies: The Case of Urban Forests in Barcelona, Spain. AMBIO 2014, 43, 466–479. [Google Scholar] [CrossRef] [PubMed]
- Larondelle, N.; Haase, D.; Kabisch, N. Mapping the diversity of regulating ecosystem services in European cities. Glob. Environ. Chang. 2014, 26, 119–129. [Google Scholar] [CrossRef]
- Anselmi, S.; Chiesi, M.; Giannini, M.; Manes, F.; Maselli, F. Estimation of Mediterranean forest transpiration and photosynthesis through the use of an ecosystem simulation model driven by remotely sensed data. Glob. Ecol. Biogeogr. 2004, 13, 371–380. [Google Scholar] [CrossRef]
- Lewis, D.; Phinn, S.; Arroyo, L. Cost-Effectiveness of Seven Approaches to Map Vegetation Communities—A Case Study from Northern Australia’s Tropical Savannas. Remote Sens. 2013, 5, 377–414. [Google Scholar] [CrossRef]
- Grignetti, A.; Salvatori, R.; Casacchia, R.; Manes, F. Mediterranean vegetation analysis by multi-temporal satellite sensor data. Int. J. Remote Sens. 1997, 18, 1307–1318. [Google Scholar] [CrossRef]
- Minchella, A.; Del Frate, F.; Capogna, F.; Anselmi, S.; Manes, F. Use of multitemporal SAR data for monitoring vegetation recovery of Mediterranean burned areas. Remote Sens. Environ. 2009, 113, 588–597. [Google Scholar] [CrossRef]
- Sutton, P.C.; Costanza, R. Global estimates of market and non-market values derived from nighttime satellite imagery, land cover, and ecosystem service valuation. Ecol. Econ. 2002, 41, 509–527. [Google Scholar] [CrossRef]
- Cabello, J.; Fernández, N.; Alcaraz-Segura, D.; Oyonarte, C.; Piñeiro, G.; Altesor, A.; Delibes, M.; Paruelo, J.M. The ecosystem functioning dimension in conservation: Insights from remote sensing. Biodivers. Conserv. 2012, 21, 3287–3305. [Google Scholar] [CrossRef] [Green Version]
- Delegido, J.; Verrelst, J.; Alonso, L.; Moreno, J. Evaluation of Sentinel-2 Red-Edge Bands for Empirical Estimation of Green LAI and Chlorophyll Content. Sensors 2011, 11, 7063–7081. [Google Scholar] [CrossRef] [PubMed]
- Munafò, M.; Congedo, L. Measuring and monitoring land cover. In Urban Expansion, Land Cover and Soil Ecosystem Services; Routledge: Abingdon, UK, 2017; p. 19. [Google Scholar]
- Larondelle, N.; Haase, D. Urban ecosystem services assessment along a rural–urban gradient: A cross-analysis of European cities. Ecol. Indic. 2013, 29, 179–190. [Google Scholar] [CrossRef]
- Hirabayashi, S.; Nowak, D.J. Comprehensive national database of tree effects on air quality and human health in the United States. Environ. Pollut. 2016, 215, 48–57. [Google Scholar] [CrossRef] [PubMed]
- Lee, J.Y.; Lee, S.H.; Hong, S.-C.; Kim, H. Projecting future summer mortality due to ambient ozone concentration and temperature changes. Atmos. Environ. 2017, 156, 88–94. [Google Scholar] [CrossRef]
- McPhearson, T.; Pickett, S.T.A.; Grimm, N.B.; Niemelä, J.; Alberti, M.; Elmqvist, T.; Weber, C.; Haase, D.; Breuste, J.; Qureshi, S. Advancing Urban Ecology toward a Science of Cities. BioScience 2016, 66, 198–212. [Google Scholar] [CrossRef]
- Capotorti, G.; Mollo, B.; Zavattero, L.; Anzellotti, I.; Celesti-Grapow, L. Setting Priorities for Urban Forest Planning. A Comprehensive Response to Ecological and Social Needs for the Metropolitan Area of Rome (Italy). Sustainability 2015, 7, 3958–3976. [Google Scholar] [CrossRef]
- Manes, F.; Marando, F.; Capotorti, G.; Blasi, C.; Salvatori, E.; Fusaro, L.; Ciancarella, L.; Mircea, M.; Marchetti, M.; Chirici, G.; et al. Regulating Ecosystem Services of forests in ten Italian Metropolitan Cities: Air quality improvement by PM10 and O3 removal. Ecol. Indic. 2016, 67, 425–440. [Google Scholar] [CrossRef]
- Marando, F.; Salvatori, E.; Fusaro, L.; Manes, F. Removal of PM10 by Forests as a Nature-Based Solution for Air Quality Improvement in the Metropolitan City of Rome. Forests 2016, 7, 150. [Google Scholar] [CrossRef]
- Maes, J.; Jacobs, S. Nature-Based Solutions for Europe’s Sustainable Development. Conserv. Lett. 2017, 10, 121–124. [Google Scholar] [CrossRef]
- European Environment Agency (EEA). 2016. Available online: https://www.eea.europa.eu/publications/air-quality-in-europe-2016 (accessed on 3 July 2017).
- Simpson, D.; Arneth, A.; Mills, G.; Solberg, S.; Uddling, J. Ozone—The persistent menace: Interactions with the N cycle and climate change. Curr. Opin. Environ. Sustain. 2014, 9, 9–19. [Google Scholar] [CrossRef] [Green Version]
- Beelen, R.; Hoek, G.; Pebesma, E.; Vienneau, D.; de Hoogh, K.; Briggs, D.J. Mapping of background air pollution at a fine spatial scale across the European Union. Sci. Total Environ. 2009, 407, 1852–1867. [Google Scholar] [CrossRef] [PubMed]
- Perrino, C.; Catrambone, M.; Pietrodangelo, A. Influence of atmospheric stability on the mass concentration and chemical composition of atmospheric particles: A case study in Rome, Italy. Environ. Int. 2008, 34, 621–628. [Google Scholar] [CrossRef] [PubMed]
- Fusaro, L.; Salvatori, E.; Mereu, S.; Silli, V.; Bernardini, A.; Tinelli, A.; Manes, F. Researches in Castelporziano test site: Ecophysiological studies on Mediterranean vegetation in a changing environment. Rend. Lincei 2015, 1–9. [Google Scholar] [CrossRef]
- Fuhrer, J.; Val Martin, M.; Mills, G.; Heald, C.L.; Harmens, H.; Hayes, F.; Sharps, K.; Bender, J.; Ashmore, M.R. Current and future ozone risks to global terrestrial biodiversity and ecosystem processes. Ecol. Evol. 2016, 6, 8785–8799. [Google Scholar] [CrossRef] [PubMed]
- Tiwary, A.; Sinnett, D.; Peachey, C.; Chalabi, Z.; Vardoulakis, S.; Fletcher, T.; Leonardi, G.; Grundy, C.; Azapagic, A.; Hutchings, T.R. An integrated tool to assess the role of new planting in PM10 capture and the human health benefits: A case study in London. Environ. Pollut. 2009, 157, 2645–2653. [Google Scholar] [CrossRef] [PubMed]
- Tallis, M.; Taylor, G.; Sinnett, D.; Freer-Smith, P. Estimating the removal of atmospheric particulate pollution by the urban tree canopy of London, under current and future environments. Landsc. Urban Plan. 2011, 103, 129–138. [Google Scholar] [CrossRef]
- Setälä, H.; Viippola, V.; Rantalainen, A.-L.; Pennanen, A.; Yli-Pelkonen, V. Does urban vegetation mitigate air pollution in northern conditions? Environ. Pollut. 2013, 183, 104–112. [Google Scholar] [CrossRef] [PubMed]
- Manes, F.; Blasi, C.; Salvatori, E.; Capotorti, G.; Galante, G.; Feoli, E.; Incerti, G. Natural vegetation and ecosystem services related to air quality improvement: Tropospheric ozone removal by evergreen and deciduous forests in latium (Italy). Ann. Bot. 2012, 2, 79–86. [Google Scholar] [CrossRef]
- Baró, F.; Gómez-Baggethun, E.; Haase, D. Ecosystem service bundles along the urban-rural gradient: Insights for landscape planning and management. Ecosyst. Serv. 2017, 24, 147–159. [Google Scholar] [CrossRef]
- Hauck, J.; Görg, C.; Varjopuro, R.; Ratamäki, O.; Maes, J.; Wittmer, H.; Jax, K. Maps have an air of authority: Potential benefits and challenges of ecosystem service maps at different levels of decision making. Ecosyst. Serv. 2013, 4, 25–32. [Google Scholar] [CrossRef]
- Maes, J.; Teller, A.; Erhard, M.; Liquete, C.; Braat, L.; Berry, P.; Egoh, B.; Puydarrieux, P.; Fiorina, C.; Santos-Martín, F.; Paracchini, M.; et al. Mapping and Assessment of Ecosystems and Their Services—An Analytical Framework for Ecosystem Assessments under Action 5 of the EU Biodiversity Strategy to 2020; Publications Office of the European Union: Luxembourg, 2013; ISBN 978-92-79-29369-6. [Google Scholar]
- Blasi, C. Carta del fitoclima dell’area romana (1:100.000). Inf. Bot. Ital. 2001, 33, 240–243. [Google Scholar]
- Capotorti, G.; Guida, D.; Siervo, V.; Smiraglia, D.; Blasi, C. Ecological classification of land and conservation of biodiversity at the national level: The case of Italy. Biol. Conserv. 2012, 147, 174–183. [Google Scholar] [CrossRef]
- Latini, M.; Bartolucci, F.; Conti, F.; Iberite, M.; Nicolella, G.; Scoppola, A.; Abbate, G. Detecting Phytogeographic Units Based on Native Woody Flora: A Case Study in Central Peninsular Italy. Bot. Rev. 2017, 1–29. [Google Scholar] [CrossRef]
- Frondoni, R.; Mollo, B.; Capotorti, G. A landscape analysis of land cover change in the Municipality of Rome (Italy): Spatio-temporal characteristics and ecological implications of land cover transitions from 1954 to 2001. Landsc. Urban Plan. 2011, 100, 117–128. [Google Scholar] [CrossRef]
- Manes, F.; Grignetti, A.; Tinelli, A.; Lenz, R.; Ciccioli, P. General features of the Castelporziano test site. Atmos. Environ. 1997, 31, 19–25. [Google Scholar] [CrossRef]
- Congedo, L.; Macchi, S. The demographic dimension of climate change vulnerability: Exploring the relation between population growth and urban sprawl in Dar es Salaam. Curr. Opin. Environ. Sustain. 2015, 13, 1–10. [Google Scholar] [CrossRef]
- Mircea, M.; Ciancarella, L.; Briganti, G.; Calori, G.; Cappelletti, A.; Cionni, I.; Costa, M.; Cremona, G.; D’Isidoro, M.; Finardi, S.; et al. Assessment of the AMS-MINNI system capabilities to simulate air quality over Italy for the calendar year 2005. Atmos. Environ. 2014, 84, 178–188. [Google Scholar] [CrossRef]
- Kukkonen, J.; Olsson, T.; Schultz, D.M.; Baklanov, A.; Klein, T.; Miranda, A.I.; Monteiro, A.; Hirtl, M.; Tarvainen, V.; Boy, M.; et al. A review of operational, regional-scale, chemical weather forecasting models in Europe. Atmos. Chem. Phys. 2012, 12, 1–87. [Google Scholar] [CrossRef] [Green Version]
- Carter, W.P.L. A detailed mechanism for the gas-phase atmospheric reactions of organic compounds. Atmos. Environ. Part A 1990, 24, 481–518. [Google Scholar] [CrossRef]
- Binkowski, F.S. Aerosols in models-3 CMAQ. In Science Algorithms EPA Models-3 Community Multiscale Air Quality CMAQ Modeling System; U.S. Environmental Protection Agency: Washington, DC, USA, 1999; p. 10-1. [Google Scholar]
- Binkowski, F.S.; Roselle, S.J. Models-3 Community Multiscale Air Quality (CMAQ) model aerosol component 1. Model description. J. Geophys. Res. Atmos. 2003, 108, 4183. [Google Scholar] [CrossRef]
- Nenes, A.; Pandis, S.N.; Pilinis, C. ISORROPIA: A New Thermodynamic Equilibrium Model for Multiphase Multicomponent Inorganic Aerosols. Aquat. Geochem. 1998, 4, 123–152. [Google Scholar] [CrossRef]
- Schell, B.; Ackermann, I.J.; Hass, H.; Binkowski, F.S.; Ebel, A. Modeling the formation of secondary organic aerosol within a comprehensive air quality model system. J. Geophys. Res. Atmos. 2001, 106, 28275–28293. [Google Scholar] [CrossRef]
- Cotton, W.R.; Sr, R.A.P.; Walko, R.L.; Liston, G.E.; Tremback, C.J.; Jiang, H.; McAnelly, R.L.; Harrington, J.Y.; Nicholls, M.E.; Carrio, G.G.; et al. RAMS 2001: Current status and future directions. Meteorol. Atmos. Phys. 2003, 82, 5–29. [Google Scholar] [CrossRef]
- Mircea, M.; Grigoras, G.; D’Isidoro, M.; Righini, G.; Adani, M.; Briganti, G.; Ciancarella, L.; Cappelletti, A.; Calori, G.; Cionni, I.; et al. Impact of grid resolution on aerosol predictions: A case study over Italy. Aerosol Air Qual. Res. 2016, 16, 1253–1267. [Google Scholar] [CrossRef]
- Borak, J.S.; Jasinski, M.F. Effective interpolation of incomplete satellite-derived leaf-area index time series for the continental United States. Agric. For. Meteorol. 2009, 149, 320–332. [Google Scholar] [CrossRef]
- Welles, J.M.; Cohen, S. Canopy structure measurement by gap fraction analysis using commercial instrumentation. J. Exp. Bot. 1996, 47, 1335–1342. [Google Scholar] [CrossRef]
- Sprintsin, M.; Karnieli, A.; Berliner, P.; Rotenberg, E.; Yakir, D.; Cohen, S. Evaluating the performance of the MODIS Leaf Area Index (LAI) product over a Mediterranean dryland planted forest. Int. J. Remote Sens. 2009, 30, 5061–5069. [Google Scholar] [CrossRef]
- Sprintsin, M.; Karnieli, A.; Berliner, P.; Rotenberg, E.; Yakir, D.; Cohen, S. The effect of spatial resolution on the accuracy of leaf area index estimation for a forest planted in the desert transition zone. Remote Sens. Environ. 2007, 109, 416–428. [Google Scholar] [CrossRef]
- Nowak, D.J. Air pollution removal by Chicago’s urban forest. Gen. Tech. Rep. NE 1994, 63–81. [Google Scholar]
- Yang, J.; McBride, J.; Zhou, J.; Sun, Z. The urban forest in Beijing and its role in air pollution reduction. Urban For. Urban Green. 2005, 3, 65–78. [Google Scholar] [CrossRef]
- Lovett, G.M. Atmospheric Deposition of Nutrients and Pollutants in North America: An Ecological Perspective. Ecol. Appl. 1994, 4, 629–650. [Google Scholar] [CrossRef]
- Escobedo, F.J.; Nowak, D.J. Spatial heterogeneity and air pollution removal by an urban forest. Landsc. Urban Plan. 2009, 90, 102–110. [Google Scholar] [CrossRef]
- Manes, F.; Vitale, M.; Maria Fabi, A.; De Santis, F.; Zona, D. Estimates of potential ozone stomatal uptake in mature trees of Quercus ilex in a Mediterranean climate. Environ. Exp. Bot. 2007, 59, 235–241. [Google Scholar] [CrossRef]
- Mugnozza, S.G. Ecologia Strutturale e Funzionale di Faggete Italiane; Edagricole: Bologna, Italy, 1999. [Google Scholar]
- Wieser, G.; Tegischer, K.; Tausz, M.; Häberle, K.-H.; Grams, T.E.E.; Matyssek, R. Age effects on Norway spruce (Picea abies) susceptibility to ozone uptake: A novel approach relating stress avoidance to defense. Tree Physiol. 2002, 22, 583–590. [Google Scholar] [CrossRef] [PubMed]
- Vitale, M.; Anselmi, S.; Salvatori, E.; Manes, F. New approaches to study the relationship between stomatal conductance and environmental factors under Mediterranean climatic conditions. Atmos. Environ. 2007, 41, 5385–5397. [Google Scholar] [CrossRef]
- Mereu, S.; Salvatori, E.; Fusaro, L.; Gerosa, G.; Muys, B.; Manes, F. An integrated approach shows different use of water resources from Mediterranean maquis species in a coastal dune ecosystem. Biogeosciences 2009, 6, 2599–2610. [Google Scholar] [CrossRef]
- Salvatori, E.; Fusaro, L.; Manes, F. Chlorophyll fluorescence for phenotyping drought-stressed trees in a mixed deciduous forest. Ann. Bot. 2016, 6, 39–49. [Google Scholar] [CrossRef]
- Nowak, D.J.; Crane, D.E.; Stevens, J.C. Air pollution removal by urban trees and shrubs in the United States. Urban For. Urban Green. 2006, 4, 115–123. [Google Scholar] [CrossRef]
- European Environment Agency (EEA). 2014. Available online: https://www.eea.europa.eu/publications/environmental-indicator-report-2014 (accessed on 3 July 2017).
- Kremer, P.; Hamstead, Z.; Haase, D.; McPhearson, T.; Frantzeskaki, N.; Andersson, E.; Kabisch, N.; Larondelle, N.; Rall, E.; Voigt, A.; et al. Key insights for the future of urban ecosystem services research. Ecol. Soc. 2016, 21. [Google Scholar] [CrossRef] [Green Version]
- Alonso, R.; Vivanco, M.G.; González-Fernández, I.; Bermejo, V.; Palomino, I.; Garrido, J.L.; Elvira, S.; Salvador, P.; Artíñano, B. Modelling the influence of peri-urban trees in the air quality of Madrid region (Spain). Environ. Pollut. 2011, 159, 2138–2147. [Google Scholar] [CrossRef] [PubMed]
- Cattani, G.; Bucchianico, D.; Menno, A.D.; Dina, D.; Inglessis, M.; Notaro, C.; Settimo, G.; Viviano, G.; Marconi, A. Evaluation of the temporal variation of air quality in Rome, Italy from 1999 to 2008. Annali dell'Istituto Superiore di Sanità 2010, 46, 242–253. [Google Scholar] [CrossRef] [PubMed]
- Gregg, J.W.; Jones, C.G.; Dawson, T.E. Urbanization effects on tree growth in the vicinity of New York City. Nature 2003, 424, 183–187. [Google Scholar] [CrossRef] [PubMed]
- Calfapietra, C.; Fares, S.; Manes, F.; Morani, A.; Sgrigna, G.; Loreto, F. Role of Biogenic Volatile Organic Compounds (BVOC) emitted by urban trees on ozone concentration in cities: A review. Environ. Pollut. 2013, 183, 71–80. [Google Scholar] [CrossRef] [PubMed]
- Manes, F.; Silli, V.; Salvatori, E.; Incerti, G.; Galante, G.; Fusaro, L.; Perrino, C. Urban ecosystem services: Tree diversity and stability of pm10 removal in the metropolitan area of rome. Ann. Bot. 2014, 4, 19–26. [Google Scholar] [CrossRef]
- Valavanidis, A.; Vlachogianni, T.; Fiotakis, K.; Loridas, S. Pulmonary Oxidative Stress, Inflammation and Cancer: Respirable Particulate Matter, Fibrous Dusts and Ozone as Major Causes of Lung Carcinogenesis through Reactive Oxygen Species Mechanisms. Int. J. Environ. Res. Public Health 2013, 10, 3886–3907. [Google Scholar] [CrossRef] [PubMed]
- Grote, R.; Samson, R.; Alonso, R.; Amorim, J.H.; Cariñanos, P.; Churkina, G.; Fares, S.; Thiec, D.L.; Niinemets, Ü.; Mikkelsen, T.N.; et al. Functional traits of urban trees: Air pollution mitigation potential. Front. Ecol. Environ. 2016, 14, 543–550. [Google Scholar] [CrossRef]
- Blanusa, T.; Fantozzi, F.; Monaci, F.; Bargagli, R. Leaf trapping and retention of particles by holm oak and other common tree species in Mediterranean urban environments. Urban For. Urban Green. 2015, 14, 1095–1101. [Google Scholar] [CrossRef]
- Escobedo, F.J.; Kroeger, T.; Wagner, J.E. Urban forests and pollution mitigation: Analyzing ecosystem services and disservices. Environ. Pollut. 2011, 159, 2078–2087. [Google Scholar] [CrossRef] [PubMed]
- Churkina, G.; Kuik, F.; Bonn, B.; Lauer, A.; Grote, R.; Tomiak, K.; Butler, T.M. Effect of VOC Emissions from Vegetation on Air Quality in Berlin during a Heatwave. Environ. Sci. Technol. 2017, 51, 6120–6130. [Google Scholar] [CrossRef] [PubMed]
- Churkina, G.; Grote, R.; Butler, T.M.; Lawrence, M. Natural selection? Picking the right trees for urban greening. Environ. Sci. Policy 2015, 47, 12–17. [Google Scholar] [CrossRef]
- Williams, N.S.G.; Hahs, A.K.; Vesk, P.A. Urbanisation, plant traits and the composition of urban floras. Perspect. Plant Ecol. Evol. Syst. 2015, 17, 78–86. [Google Scholar] [CrossRef]
- Lyytimäki, J.; Sipilä, M. Hopping on one leg—The challenge of ecosystem disservices for urban green management. Urban For. Urban Green. 2009, 8, 309–315. [Google Scholar] [CrossRef]
- Manes, F.; Salvatori, E.; Torre, G.L.; Villari, P.; Vitale, M.; Biscontini, D.; Incerti, G. Urban green and its relation with air pollution: Ecological studies in the Metropolitan area of Rome. Ital. J. Public Health 2012, 5. [Google Scholar] [CrossRef]
- Remme, R.P.; Edens, B.; Schröter, M.; Hein, L. Monetary accounting of ecosystem services: A test case for Limburg province, The Netherlands. Ecol. Econ. 2015, 112, 116–128. [Google Scholar] [CrossRef]


| PSVCs | Municipality of Rome | Latium Region |
|---|---|---|
| Evergreen oak woods | 407.2 | 51,542.4 |
| Deciduous oak woods | 11,746.9 | 210,418.7 |
| Mixed Broadleaved woods | 10.6 | 71,427.9 |
| Chestnut woods | 143.0 | 80,075.1 |
| Beech woods | 0.0 | 58,256.9 |
| Hygrophilous woods | 0.0 | 1665.9 |
| Mediterranean pine woods | 2410.8 | 3591.8 |
| Mountain Coniferous woods | 207.9 | 12,300.0 |
| Mediterranean maquis | 511.2 | 5829.2 |
| Total | 15,437.6 | 495,107.9 |
| PSVCs | Municipality of Rome | Latium Region |
|---|---|---|
| Evergreen oak woods | 2.43 ± 0.93 | 2.44 ± 0.82 |
| Deciduous oak woods | 2.09 ± 0.86 | 2.25 ± 0.74 |
| Mixed broadleaved woods | 2.01 ± 0.23 | 2.36 ± 0.65 |
| Chestnut woods | 1.84 ± 0.43 | 2.46 ± 0.69 |
| Beech woods | 2.30 ± 0.58 | |
| Hygrophilous woods | 1.70 ± 0.55 | |
| Mediterranean pine woods | 2.41 ± 0.80 | 1.99 ± 0.83 |
| Mountain coniferous woods | 1.67 ± 0.38 | 2.09 ± 0.66 |
| Mediterranean maquis and garigue | 2.43 ± 0.84 | 2.03 ± 0.74 |
| PSVCs (Municipality of Rome) | Mg | Mg∙ha−1 | Value (€∙106) |
| Evergreen oak woods | 14.80 | 0.0363 | 0.464 |
| Deciduous oak woods | 161.73 | 0.0138 | 5.071 |
| Mixed broadleaved woods | 0.08 | 0.0075 | 0.003 |
| Chestnut woods | 1.29 | 0.0090 | 0.040 |
| Beech woods | n.a | n.a. | n.a |
| Hygrophilous woods | n.a. | n.a. | n.a. |
| Mediterranean pine woods | 92.00 | 0.0382 | 2.885 |
| Mountain coniferous woods | 4.59 | 0.0221 | 0.144 |
| Mediterranean maquis | 19.34 | 0.0378 | 0.606 |
| Total | 293.83 | 0.0190 | 9.213 |
| PSVCs (Latium Region) | Mg | Mg∙ha−1 | Value (€∙106) |
| Evergreen oak woods | 1060.53 | 0.0206 | 33.254 |
| Deciduous oak woods | 1822.75 | 0.0087 | 57.154 |
| Mixed broadleaved woods | 523.68 | 0.0073 | 16.421 |
| Chestnut woods | 734.60 | 0.0092 | 23.034 |
| Beech woods | 351.18 | 0.0060 | 11.011 |
| Hygrophilous woods | 8.83 | 0.0053 | 0.277 |
| Mediterranean pine woods | 64.02 | 0.0178 | 2.007 |
| Mountain coniferous woods | 164.80 | 0.0134 | 5.167 |
| Mediterranean maquis | 99.31 | 0.0170 | 3.114 |
| Total | 4829.69 | 0.0098 | 151.440 |
| PSVCs (Municipality of Rome) | Mg | Mg∙ha−1 | Value (€∙106) |
| Evergreen oak woods | 9.86 | 0.0242 | 0.077 |
| Deciduous oak woods | 396.32 | 0.0337 | 3.091 |
| Mixed broadleaved woods | 0.29 | 0.0274 | 0.002 |
| Chestnut woods | 8.6 | 0.0601 | 0.067 |
| Beech woods | n.a. | n.a. | n.a. |
| Hygrophilous woods | n.a. | n.a. | n.a. |
| Mediterranean pine woods | 47.43 | 0.0197 | 0.370 |
| Mountain coniferous woods | 3.96 | 0.0190 | 0.031 |
| Mediterranean maquis | 18.68 | 0.0365 | 0.146 |
| Total | 485.14 | 0.0314 | 3.783 |
| PSVCs (Latium region) | Mg | Mg∙ha−1 | Value (€∙106) |
| Evergreen oak woods | 1238.25 | 0.0240 | 9.656 |
| Deciduous oak woods | 7068.85 | 0.0336 | 55.123 |
| Mixed broadleaved woods | 1675.61 | 0.0235 | 13.066 |
| Chestnut woods | 4737.02 | 0.0592 | 36.939 |
| Beech woods | 3322.55 | 0.0570 | 25.909 |
| Hygrophilous woods | 162.81 | 0.0977 | 1.270 |
| Mediterranean pine woods | 72.30 | 0.0201 | 0.564 |
| Mixed coniferous woods | 101.46 | 0.0082 | 0.791 |
| Mediterranean maquis | 218.77 | 0.0375 | 1.706 |
| Total | 18,589.34 | 0.0375 | 145.024 |
© 2017 by the authors. Licensee MDPI, Basel, Switzerland. This article is an open access article distributed under the terms and conditions of the Creative Commons Attribution (CC BY) license (http://creativecommons.org/licenses/by/4.0/).
Share and Cite
Fusaro, L.; Marando, F.; Sebastiani, A.; Capotorti, G.; Blasi, C.; Copiz, R.; Congedo, L.; Munafò, M.; Ciancarella, L.; Manes, F. Mapping and Assessment of PM10 and O3 Removal by Woody Vegetation at Urban and Regional Level. Remote Sens. 2017, 9, 791. https://doi.org/10.3390/rs9080791
Fusaro L, Marando F, Sebastiani A, Capotorti G, Blasi C, Copiz R, Congedo L, Munafò M, Ciancarella L, Manes F. Mapping and Assessment of PM10 and O3 Removal by Woody Vegetation at Urban and Regional Level. Remote Sensing. 2017; 9(8):791. https://doi.org/10.3390/rs9080791
Chicago/Turabian StyleFusaro, Lina, Federica Marando, Alessandro Sebastiani, Giulia Capotorti, Carlo Blasi, Riccardo Copiz, Luca Congedo, Michele Munafò, Luisella Ciancarella, and Fausto Manes. 2017. "Mapping and Assessment of PM10 and O3 Removal by Woody Vegetation at Urban and Regional Level" Remote Sensing 9, no. 8: 791. https://doi.org/10.3390/rs9080791