
Image Registration and Fusion of Visible and Infrared Integrated Camera for Medium-Altitude Unmanned Aerial Vehicle Remote Sensing

1
Unmanned Systems Research Institute, Beihang University, Beijing 100191, China
2
School of Mechanical Engineering and Automation, Beihang University, Beijing 100191, China
3
School of Electronic and Information Engineering, Beihang University, Beijing 100191, China
4
Collaborative Innovation Centre of Geospatial Technology, Wuhan 430000, China
*
Author to whom correspondence should be addressed.
Remote Sens. 2017, 9(5), 441; https://doi.org/10.3390/rs9050441
Submission received: 27 March 2017
/
Revised: 27 April 2017
/
Accepted: 28 April 2017
/
Published: 5 May 2017
(This article belongs to the Special Issue Learning to Understand Remote Sensing Images)
Abstract
:This study proposes a novel method for image registration and fusion via commonly used visible light and infrared integrated cameras mounted on medium-altitude unmanned aerial vehicles (UAVs).The innovation of image registration lies in three aspects. First, it reveals how complex perspective transformation can be converted to simple scale transformation and translation transformation between two sensor images under long-distance and parallel imaging conditions. Second, with the introduction of metadata, a scale calculation algorithm is designed according to spatial geometry, and a coarse translation estimation algorithm is presented based on coordinate transformation. Third, the problem of non-strictly aligned edges in precise translation estimation is solved via edge–distance field transformation. A searching algorithm based on particle swarm optimization is introduced to improve efficiency. Additionally, a new image fusion algorithm is designed based on a pulse coupled neural network and nonsubsampled contourlet transform to meet the special requirements of preserving color information, adding infrared brightness information, improving spatial resolution, and highlighting target areas for unmanned aerial vehicle (UAV) applications. A medium-altitude UAV is employed to collect datasets. The result is promising, especially in applications that involve other medium-altitude or high-altitude UAVs with similar system structures.
1. Introduction
1.1. Background
1.1.1. Medium-Altitude UAV and Multi-Sensor-Based Remote Sensing
Medium-altitude unmanned aerial vehicles (UAVs) are an important information acquisition platform in the integrated Earth observation network [1]. UAVs offer the advantages of flexibility and rapid response. Compared with manned aerial vehicles, medium-altitude UAVs can work in high-risk areas to accomplish detection missions. They are also capable of flying long distances and feature a wide detection range and an operation time that lasts longer than that of low-altitude UAVs. Medium-altitude UAVs play an irreplaceable role in normal observation, disaster monitoring, and battlefield detection applications.
Visible light cameras and infrared cameras are the most commonly used imaging devices in medium-altitude UAVs. Visible light imaging offers the advantages of intuitive impression, rich information, and high resolution, but it is susceptible to low-visibility atmospheric conditions. By contrast, infrared imaging is not significantly affected by atmospheric conditions, and it can identify hidden or disguised heat source targets. Given the complementarity of these two types of cameras, most UAVs are equipped with visible light and infrared integrated cameras.
1.1.2. Utility of Visible and Infrared Image Fusion
With the development of imaging sensors, image fusion has become a hot research topic in image processing, pattern recognition, and computer vision. Image fusion combines different sets of information from two or more images of a given scene acquired at different situations with one or multiple sensors [2]. In the past decade, visible and infrared image fusion was widely used in both military and civil applications. In the military, visible and infrared image fusion plays an increasingly important role in UAV autonomous navigation [3], target detection [4], environment perception [5], and military information monitoring [6]. In the civilian realm, many applications, including national environmental protection [7], agricultural remote sensing [8], wildlife multispecies remote sensing [9], safety surveillance [10], and saliency detection [11,12], significantly benefited from information enhancement after visible and infrared image fusion.
1.1.3. Problems of Visible and Infrared Image Registration and Fusion for UAV Applications
Registration and fusion are two of the most crucial technologies in the applications of image fusion mentioned.
Image registration [13] is the process of matching two or more images obtained at different times by different sensors (imaging equipment) or under different conditions (weather, illumination, position, and perspective); this technology has been widely used in computer vision, pattern recognition, medical image analysis, and remote sensing image analysis. Compared with homologous image registration, the registration of visible and infrared images involves certain difficulty and particularity. First, the remote sensing images of the same area obtained by different sensors show different resolutions, pixel values, spectral phases, and scene characteristics because of different imaging mechanisms. Second, the particularity of medium-altitude UAV imaging brings some adverse effects to image registration. Visible images may be degraded under long-distance imaging conditions because of atmospheric effects, which could reduce the number of extracted image features. Large motion between image frames could increase the time consumption of image search.
The purpose of image fusion is to process multi-source redundant data in space and time according to certain algorithms, obtain more accurate and more abundant information than any single dataset, and generate combination images with new space, spectrum, and time characteristics. Image fusion is not only a simple combination of data, but it also emphasizes the optimization of information to highlight useful and interesting information and eliminate or suppress irrelevant information. Despite the availability of many image fusion algorithms, improving the resulting image resolution and enhancing the saliency of interesting areas in images remain problematic.
1.2. Related Work
1.2.1. Image Registration
Popular registration methods usually depend on image information. These methods can be divided into the following two categories according to various similarity measures: intensity-based methods and feature-based methods. Intensity-based methods include gray information-based methods and transform domain-based methods.
Gray information-based methods measure similarity using the gray statistical information of an image itself. These algorithms are convenient to implement, but the application scope is narrow, and the computation is significantly large. The correlation method can match input images with similar scale and gray information based on gray information [14,15]. A novel and robust statistic as a similarity measure for robust image registration was proposed in [14]. The statistic is called the increment sign correlation because it is based on the average evaluation of the incremental tendency of brightness in adjacent pixels. Tsin and Kanade [15] extended the correlation technique to point set registration using a method called kernel correlation. Another classical registration algorithm is based on mutual information. Mutual information is obtained by calculating the entropy of two variables and their joint entropy, which can be used in image registration. On the basis of traditional mutual information registration, Zhuang et al. [16] proposed a novel hybrid algorithm that combines the particle swarm optimization (PSO) algorithm and Powell search method to obtain improved performance in terms of time and precision. In [17], a novel infrared and visual image registration method based on phase grouping and mutual information of gradient orientation was presented. The visible and infrared registration method proposed in [18] combines a bilateral filter and cross-cumulative residual entropy.
Image registration methods based on the transform domain mostly use Fourier transform. They are limited by the invariance of the Fourier transform, which is only suitable for the images of corresponding definitions (such as rotation, translation, etc.) in Fourier transform. Pohitand Sharma [19] developed an algorithm based on Fourier slice theorem to measure the simultaneous rotation and translation of an object in a 2D plane. Niu H. et al. [20] proposed a novel method based on the combination of fractional Fourier transform (FRFT) and a conventional phase correlation technique. Compared with conventional fast Fourier transform-based methods, the proposed method employs called FRFT contains both spatial and frequency information. Li, Zhang, and Hu [21] proposed a registration scheme for multispectral systems using phase correlation and scale invariant feature matching. This scheme uses phase correlation method to calculate the parameters of a coarse-offset relationship between different band images and then detects the scale invariant feature transform (SIFT) points for image matching. In addition to the Fourier transform, a uniform space was used in a new registration method for non-rigid images proposed in [22]. The key point is normalized mapping, which transforms any image into an intermediate space. Under a uniform space, the anatomical feature points of different images are matched via rotation and scaling.
Feature-based methods are the most common category in image registration. These methods depend on image points [23,24,25,26], line segments [27,28], regions [29], and other features [30], and they show a wide range of applications. SIFT [23,24] is one of the most widely used features with satisfactory performance. Based on SIFT, several studies [25] conducted improved, extended, and in-depth research on visible and infrared image registration. An image registration method based on speeded up robust features was proposed in view of the slow speed of SIFT [26]. In [27], a new general registration method for images of varying nature was presented. Edge images are processed to extract straight linear segments, which are then grouped to form triangles. To solve the feature matching problem, wherein the interest points extracted from both images are not always identical, Han et al. [28] emphasized the geometric structure alignment of features (lines) instead of focusing on descriptor-based individual feature matching. In [29], Liu et al. proposed an edge-enhanced, maximally stable extremal region method in multi-spectral image registration. An image registration method based on visually salient (VS) features was introduced [30]. A VS feature detector based on a modified visual attention model was presented to extract VS points. This detector combines the information of infrared images and its negative image to overcome the contrast reverse problem between visible and infrared images, thereby facilitating the search for corresponding points on visible/infrared images.
Other new methods emerged in addition to these three methods, and they include diffusion map-based method [31], alignment metric-based method [32], hybrid image feature-based method [33], nonsubsampled contourlet transform (NSCT) and gradient mirroring-based method [34], and the random projection and sparse representation-based method [35]. Some of these studies achieved good results in visible and infrared image registration and they provide new ideas to solve the problem of multimodal image registration.
These studies achieved great successes in the area of image registration. However, most of them are based only on image information and attempt to establish correspondence between visible and infrared images, thereby establishing matching transformation between the two images. In fact, they explore two vital issues of homonymy feature detection and feature matching. Given the different spectra and imaging mechanisms, homonymy feature detection is a difficult problem for multimodal images. From the aerial perspective, the transformation between two sets of image features is required to meet perspective invariance, which increases the difficulty of image feature matching.
For UAV applications, image registration methods still depend on image information despite the rapid development of visible and infrared sensors. Rich metadata from imaging sensors and other equipment of UAV systems are insufficiently exploited.
1.2.2. Image Fusion
Image fusion can be conducted at three different levels, namely, the pixel layer, feature layer, and decision level [36]. This study mainly explores pixel layer-based fusion methods.
Image fusion methods based on pixel levels are traditionally divided into spatial domain methods and transform domain methods. Spatial domain-based methods operate directly on the gray values of images; they mainly include the gray weighted method, principal component analysis (PCA) method [37], color mapping method [38], contrast or gray adjustment method, Markov random field method [39], Bayesian optimization method [40], double modal neural network method [41], and pulse coupled neural network (PCNN) method [42]. In the transform domain fusion, the images should be transformed into the transform domain space before the fusion of the coefficients is conducted. This type of methods mainly include the Laplace pyramid transform-based method [43], wavelet transform-based method [44], ridgelet transform-based method [45], contourlet transform-based method [46], NSCT-based method [47], compressed sensing-based method [48], and sparse representation-based method [49].
In recent years, several scholars introduced effective methods for multi-modality image fusion. Zhang et al. [50] proposed a systematic review of sparse representation-based multi-sensor image fusion literature, which highlighted the pros and cons of each category of approaches. Han et al. [51] presented a saliency-aware fusion algorithm for integrating infrared and visible light images (or videos) to enhance the visualization of the latter. The algorithm involves saliency detection followed by biased fusion. The goal of saliency detection is to generate a saliency map for the infrared image to highlight the co-occurrence of high brightness values and motion. Markov random fields are used to combine these two sources of information. Liu et al. [52] introduced a novel method to fuse infrared and visible light images based on region segmentation. Region segmentation is used to determine important regions and background information in input images.
For UAV applications, visible light sensors can capture relatively abundant spectral information with clear texture and high spatial resolution, but in poor light conditions, image quality declines significantly. By contrast, infrared sensors can penetrate smoke and fog and perform effective detection under poor light conditions; however, the obtained image shows low contrast, fuzzy scene, and poor details. Based on the requirements of UAV applications, the fusion of visible and infrared images need to combine the two types of image feature data. This method can obtain a high spatial resolution of scene information and interesting target areas can be highlighted.
1.3. Present Work
This study aims to develop a method of visible and infrared image registration and fusion for medium-altitude UAV applications. The research scope is applicable to widely used visible light and infrared integrated cameras, which include two aspects of registration and fusion.
In image registration, our method attempts to solve the problem from the UAV system level instead of using image information alone. Three main problems are studied. The first problem is the transformation between two images under long distance aerial imaging with visible light and infrared integrated cameras. In addition to image information, the second problem is the use of the rich metadata of UAV systems to estimate the transformation between visible and infrared images. The third problem is the detection and matching of homonymy features in multimodal images to obtain precise image registration with the aid of metadata.
Based on image registration, image fusion for UAV applications should not only obtain high spatial resolution and extensive scene information and highlight interesting target areas. Thus, a new pixel layer-based image fusion method using PCNN and NSCT is examined in this study.
2. Methodology
2.1. UAV System with a Visible Light and Infrared Integrated Camera
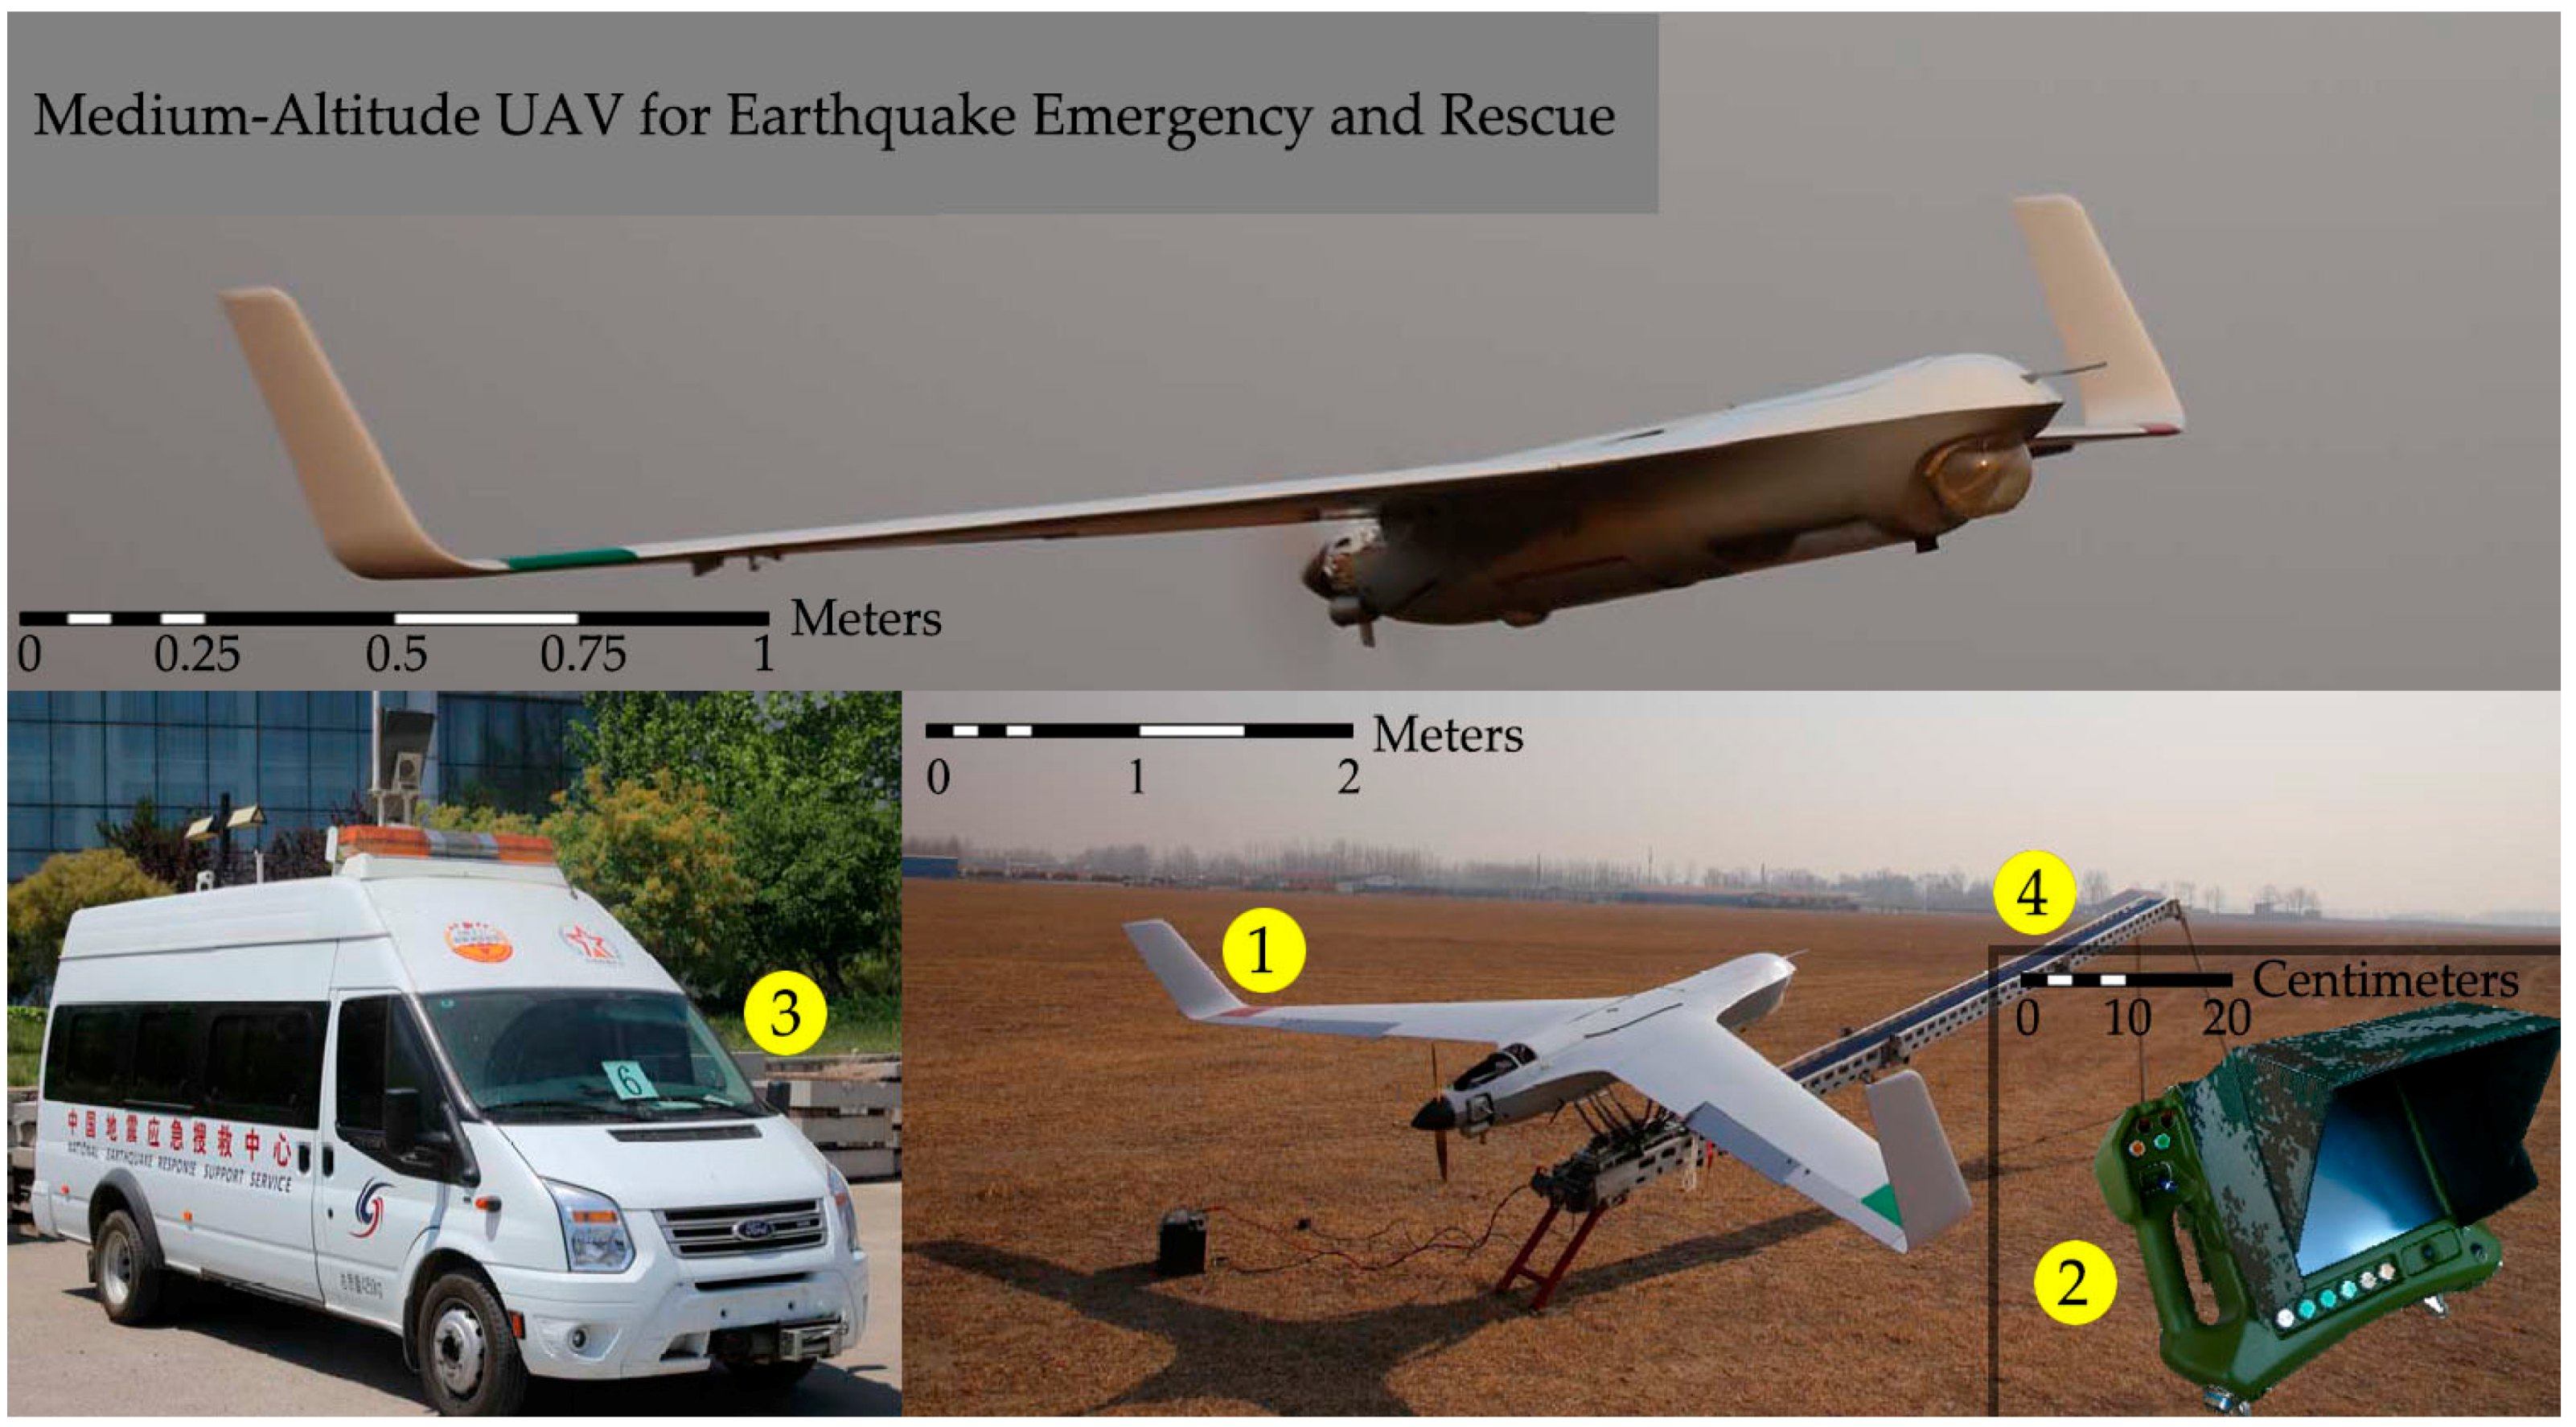
In this study, we employ a medium-altitude UAV, which is used in earthquake emergency and rescue to collect images of disaster areas effectively and accurately with the aid of imaging devices (Figure 1). The specific parameters are described in Table 1.
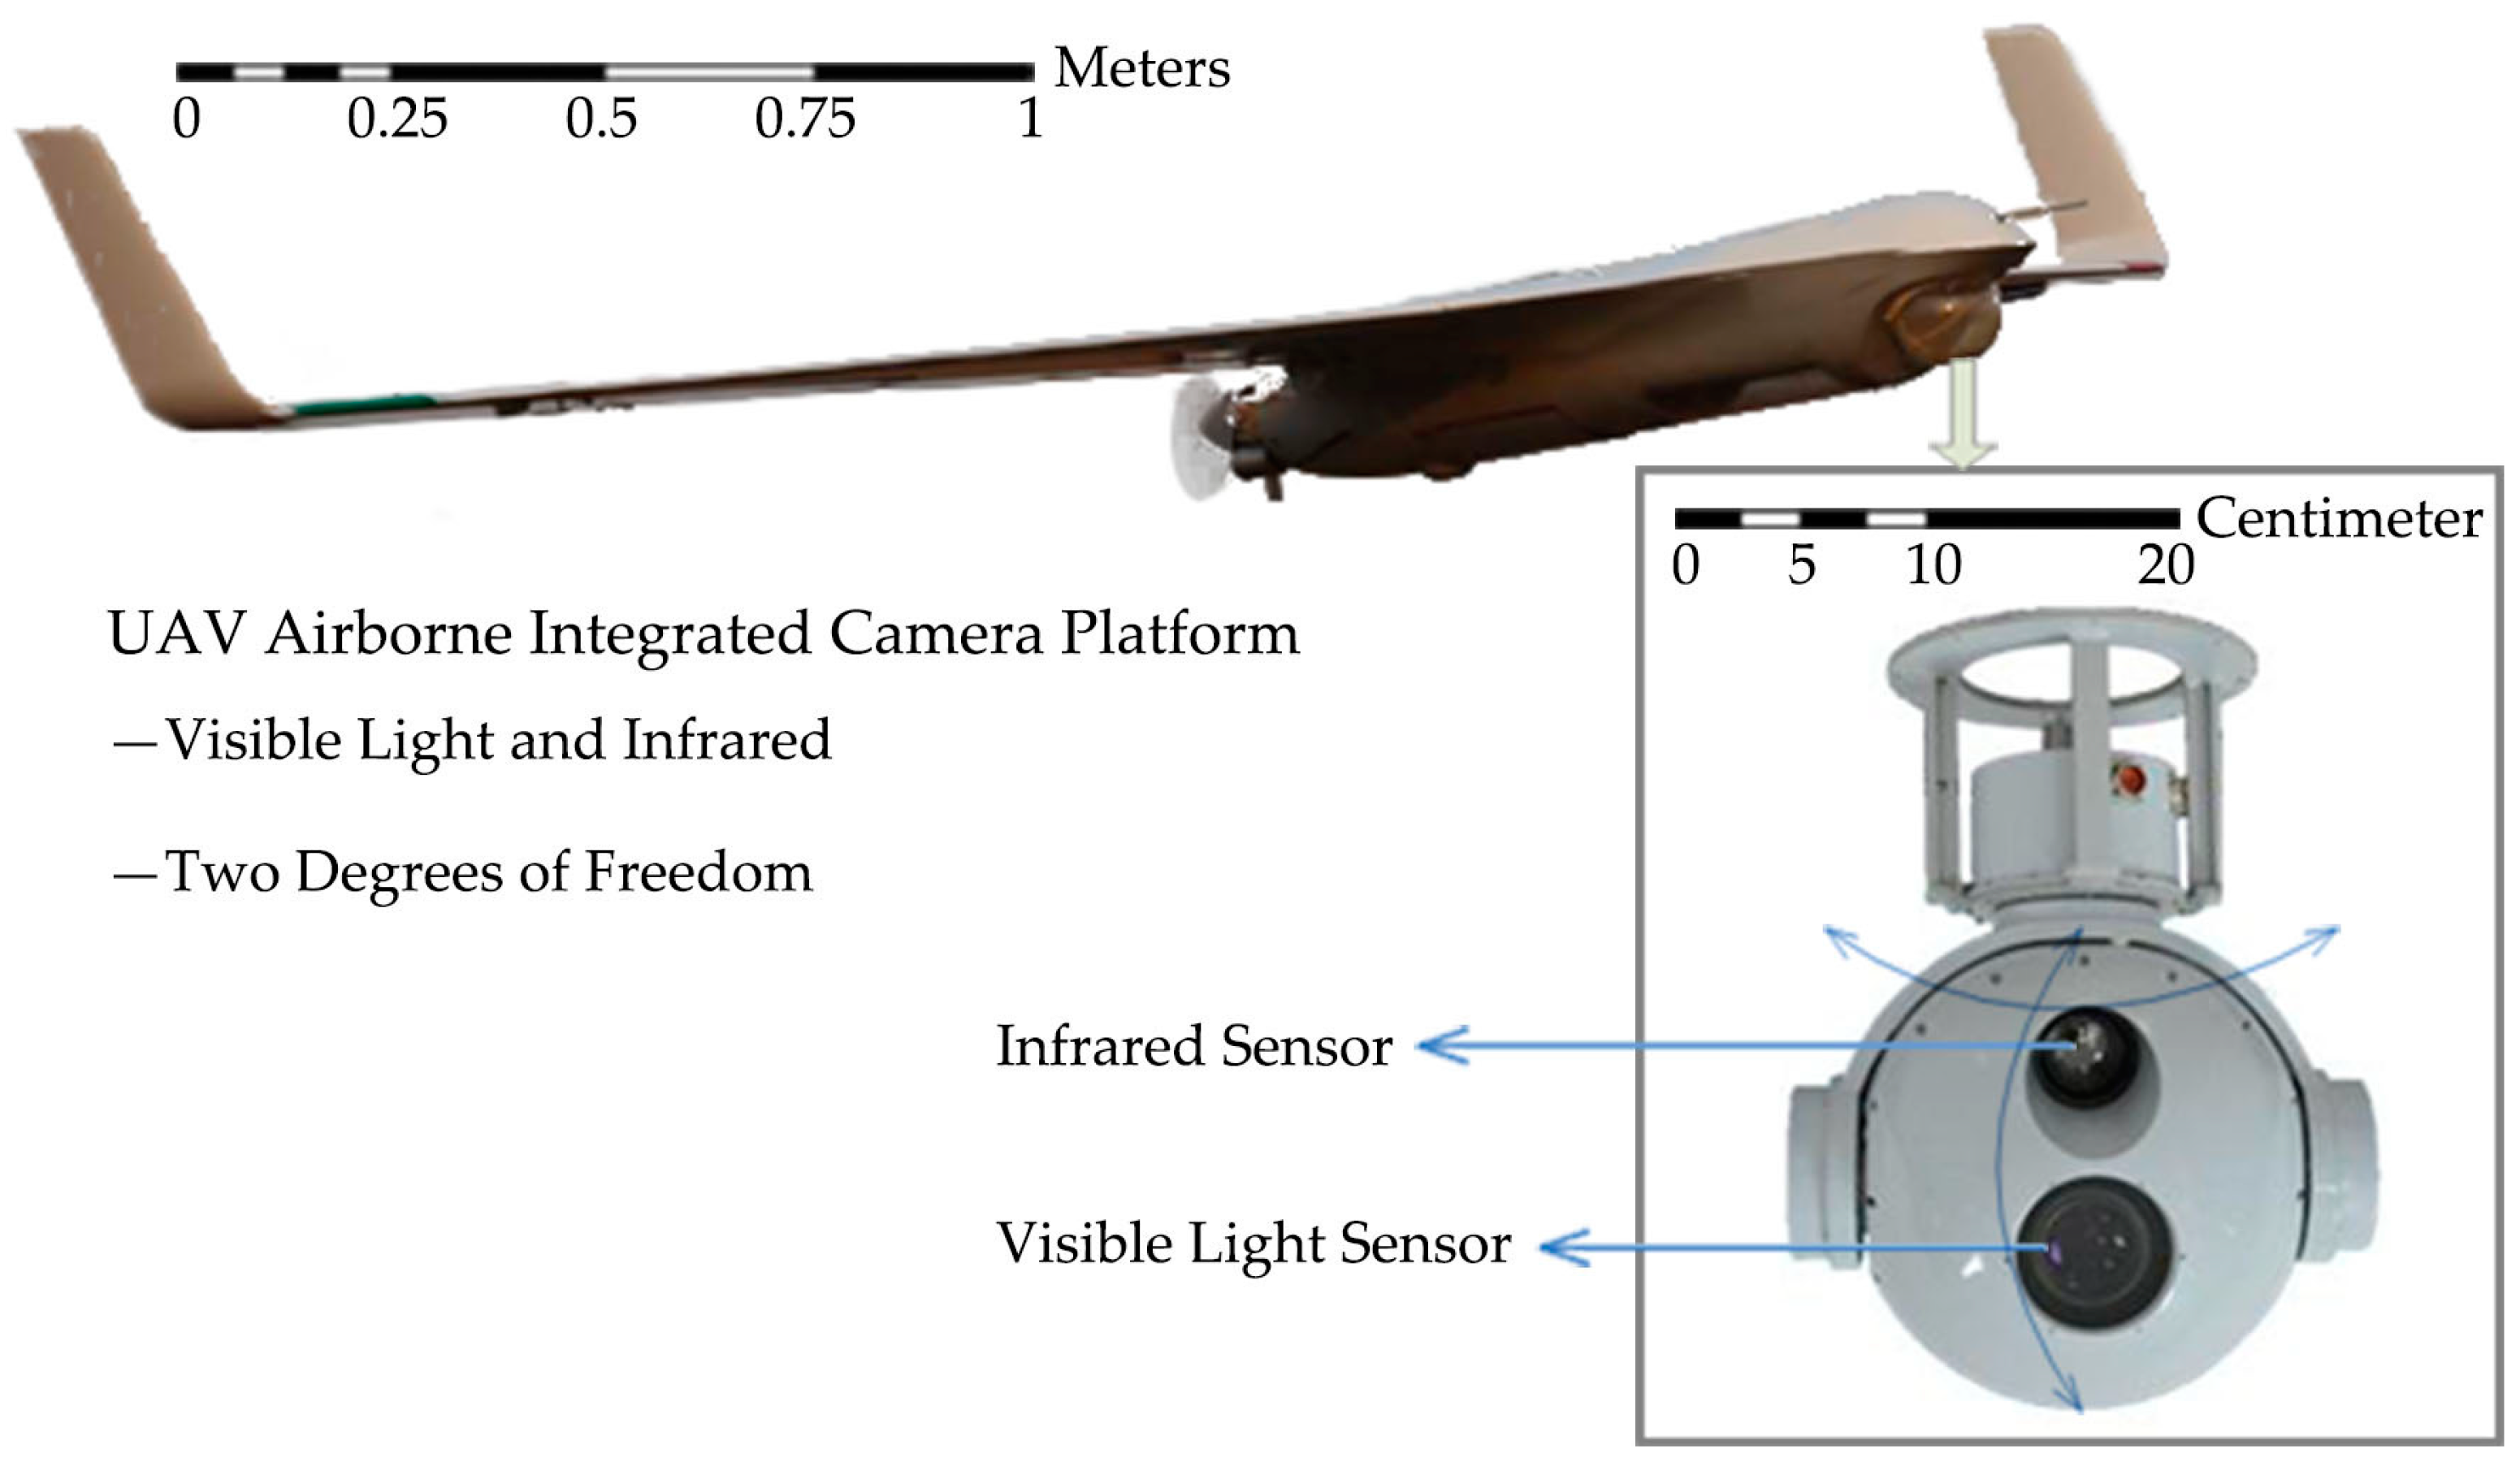
A visible light and infrared integrated camera platform is mounted on the front belly of the UAV, as shown in Figure 2. The two optical axes of the visible and infrared imaging sensors are parallel. The visible image resolution is 1392 × 1040, and the infrared image resolution is 640 × 512. The UAV features three degrees of freedom (DOF), and the imaging device features two DOF relative to the UAV body. Equipped with GPS (Global Position System), INS (Inertial Navigation System), and an altimeter, the UAV can measure position and orientation.
These types of visible light and infrared integrated cameras have been widely used for medium-altitude UAVs. Therefore, our research shows extensive application potential and practical value.
2.2. Scheme of Visibleand Infrared Image Registration and Fusion
2.2.1. Long-Distance Integrated Parallel Vision
According to the visible light and infrared integrated camera of a medium-altitude UAV, this study attempts to reveal the principle of integrated parallel vision. Most medium-altitude UAV systems are mounted with visible light and infrared integrated cameras, which integrate two types of sensors, as shown in Figure 2. In the integrated structure, the optical axes of the visible sensor and infrared sensor are parallel to each other, and the imaging model can be approximated as a pinhole model [53] under the condition of long-distance imaging over thousands of meters.
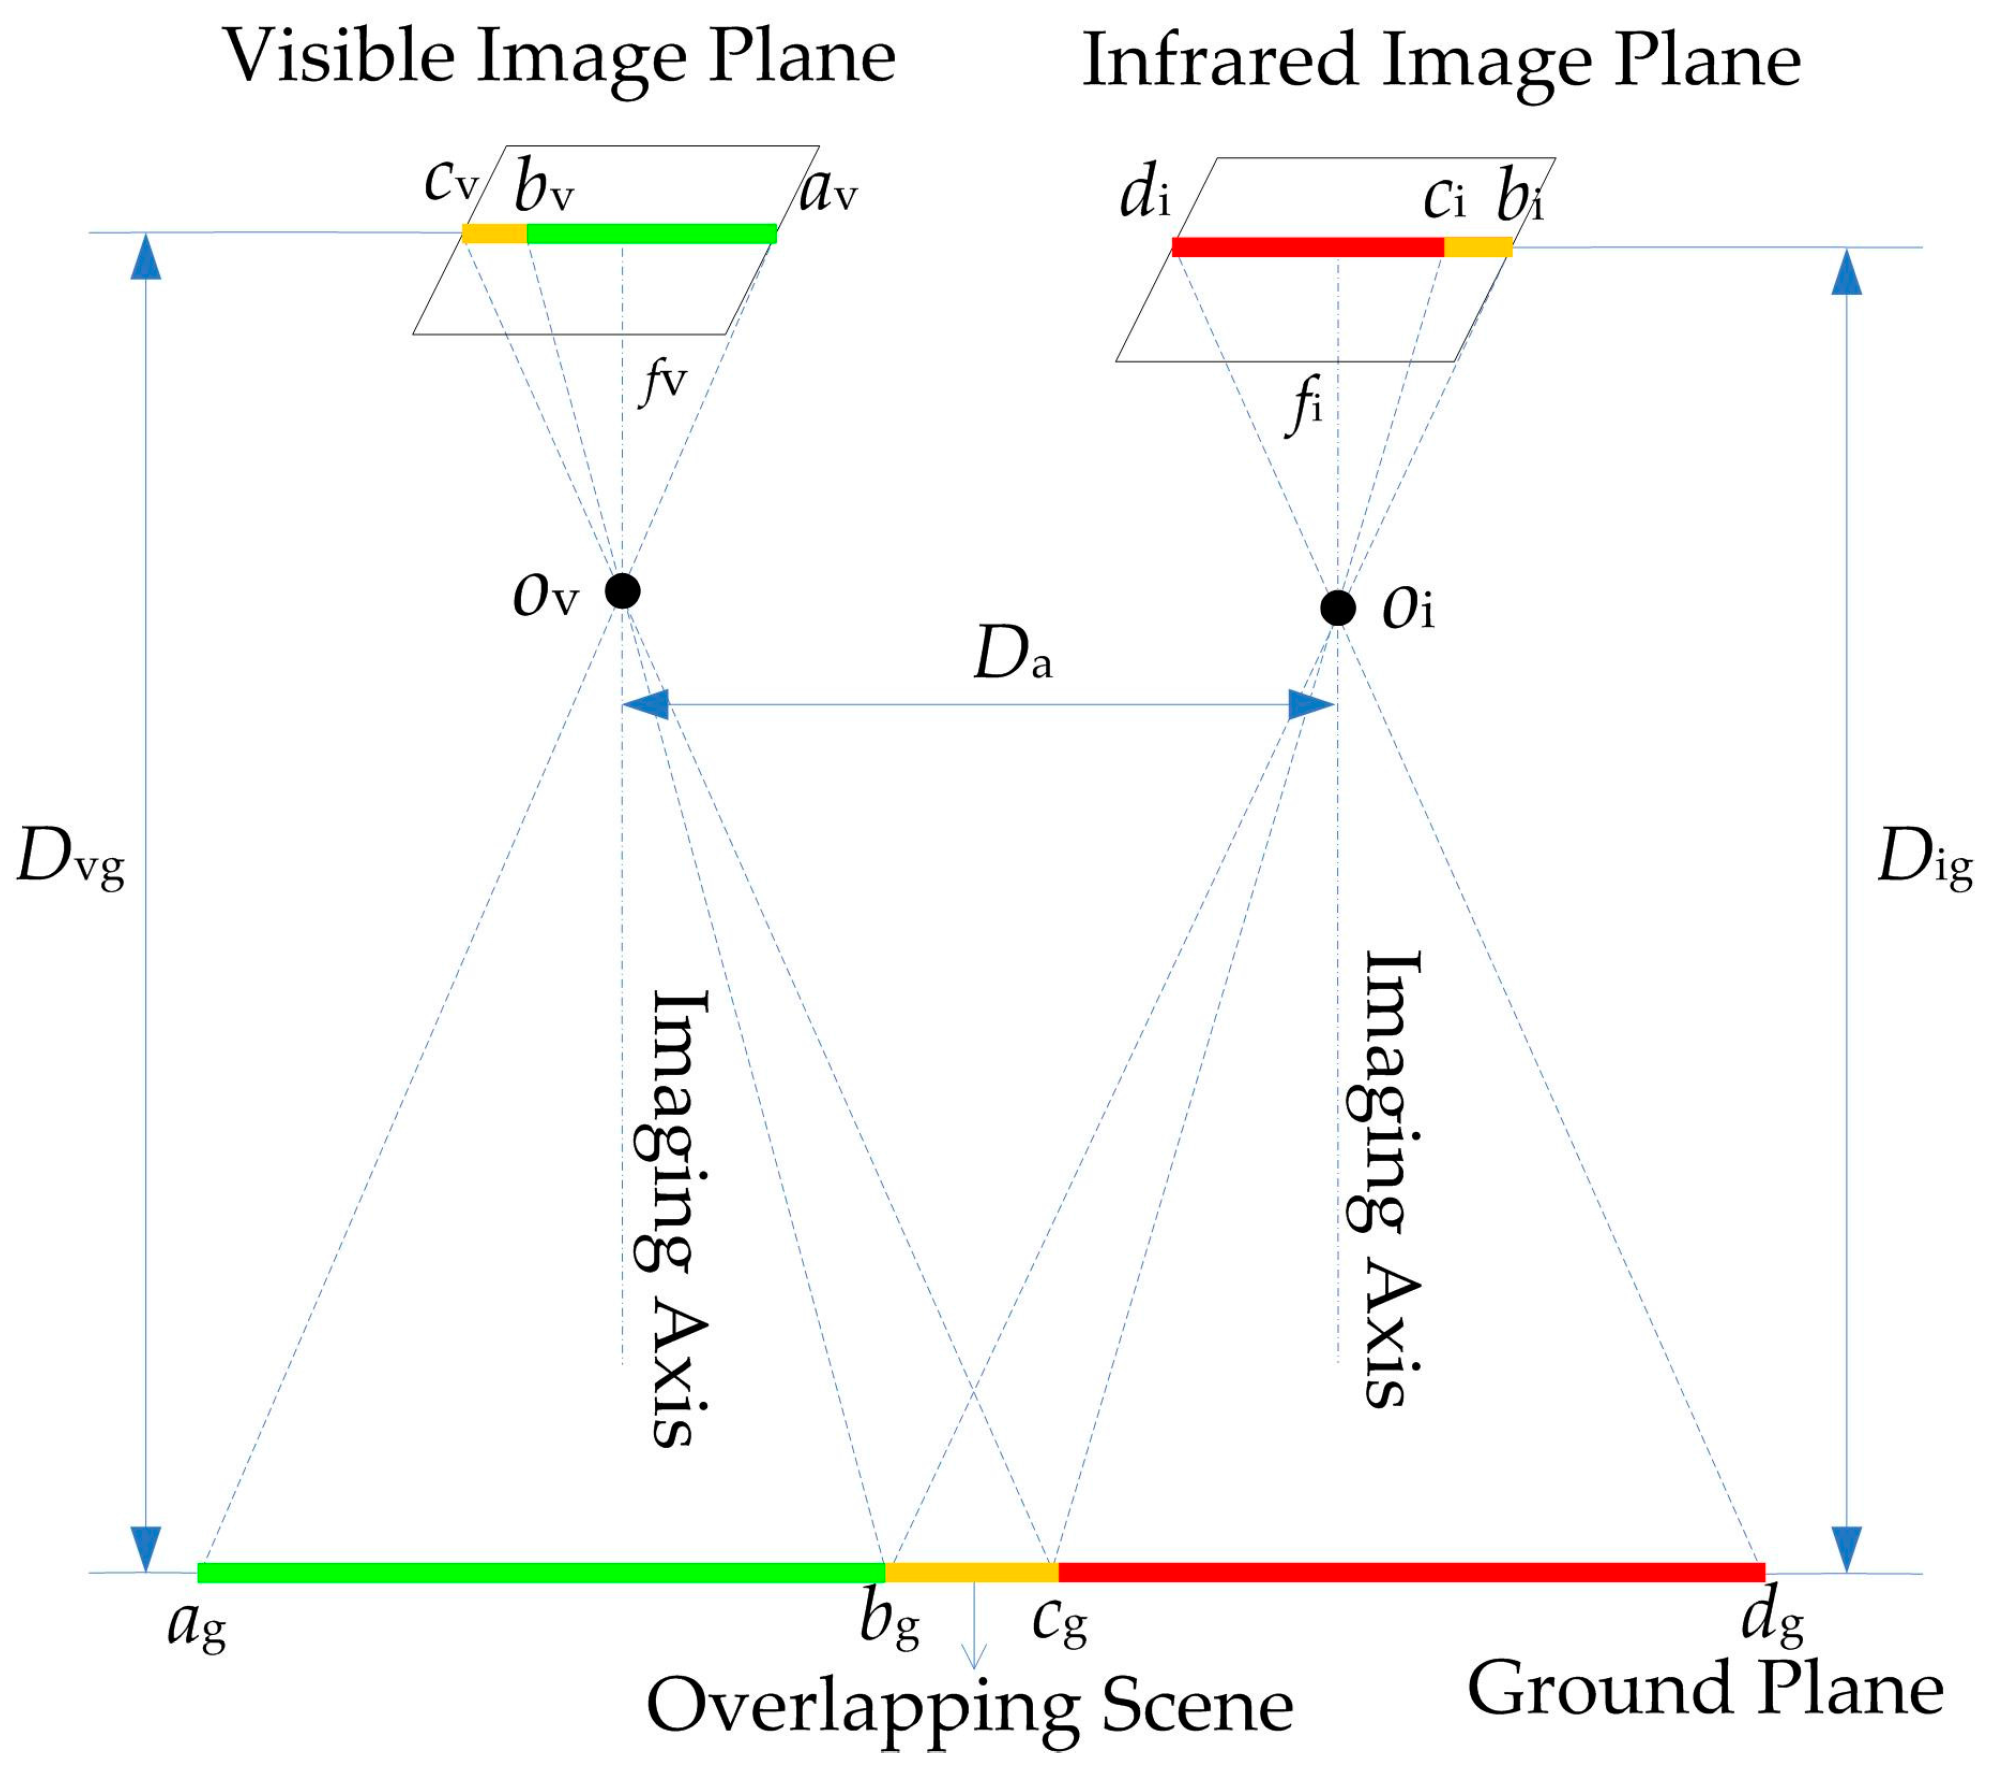
Figure 3 shows that the image planes of the two sensors are parallel to each other and the two optical axes are also parallel. With camera rotation, the two sensors always point in the same direction and they have a common field of view (FOV), which is reflected as an overlapping area in the two images. In aerial images, this transformation between two image planes should be described using a perspective transformation. However, under long-distance imaging conditions, only scale transformation and translation transformation exist between the visible and infrared images obtained from the integrated camera at the same moment.
The assumption is that the visible and infrared image planes are parallel to the ground, similar to the imaging relationship principle. Line represents the FOV of the two sensors, and line is the common FOV. and are the focal lengths of the two sensors. and are the two foci. is the distance between two imaging axes. and denote the distances from the image plane to the ground. Based on the pinhole imaging principle, Equations (1) and (2) are obtained according to triangle similarity.
and are approximately equal under long-distance imaging conditions. could be introduced to represent the distance from the image plane to the ground in Equation (3).
Then, Equation (4) can be inferred as
where k is a constant. This equation proves that the overlapping regions of and have the same direction and scale size. Hence, only translation transformation and scale transformation exist between the two image planes.
According to the above analysis, a complex perspective transformation of image registration could be converted to scale and translation transformation under long-distance integrated parallel vision. This principle is applicable to all of the visible light and infrared integrated cameras of medium-altitude UAVs. This equation breaks the conventional problem of perspective transformation through a direct solution via image feature detection and matching, which is difficult in most cases and sometimes impossible due to the different imaging mechanisms of multimodal images.
2.2.2. Visibleand Infrared Image Registration
According to the long-distance integrated parallel vision in Section 2.2.1, only scale transformationand translation transformation exist between the visible image and infrared image. The transformation from the infrared image to the visible image can be expressed as Equation (5)
where denotes a visible image and denotes an infrared image. is the transformation matrix from the infrared image to the visible image; it is composed of two parts, namely, the scale matrix and translation matrix , which are defined in Equations (6) and (7).
where , , , and are transformation parameters. The translation matrix is solved in two steps of Equation (8) to improve efficiency and accuracy.
where is the coarse registration matrix from the visible image to the infrared image based on metadata and is the precise registration matrix based on the image matching method.
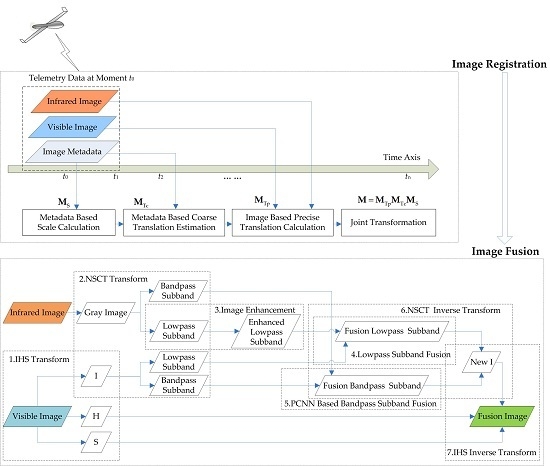
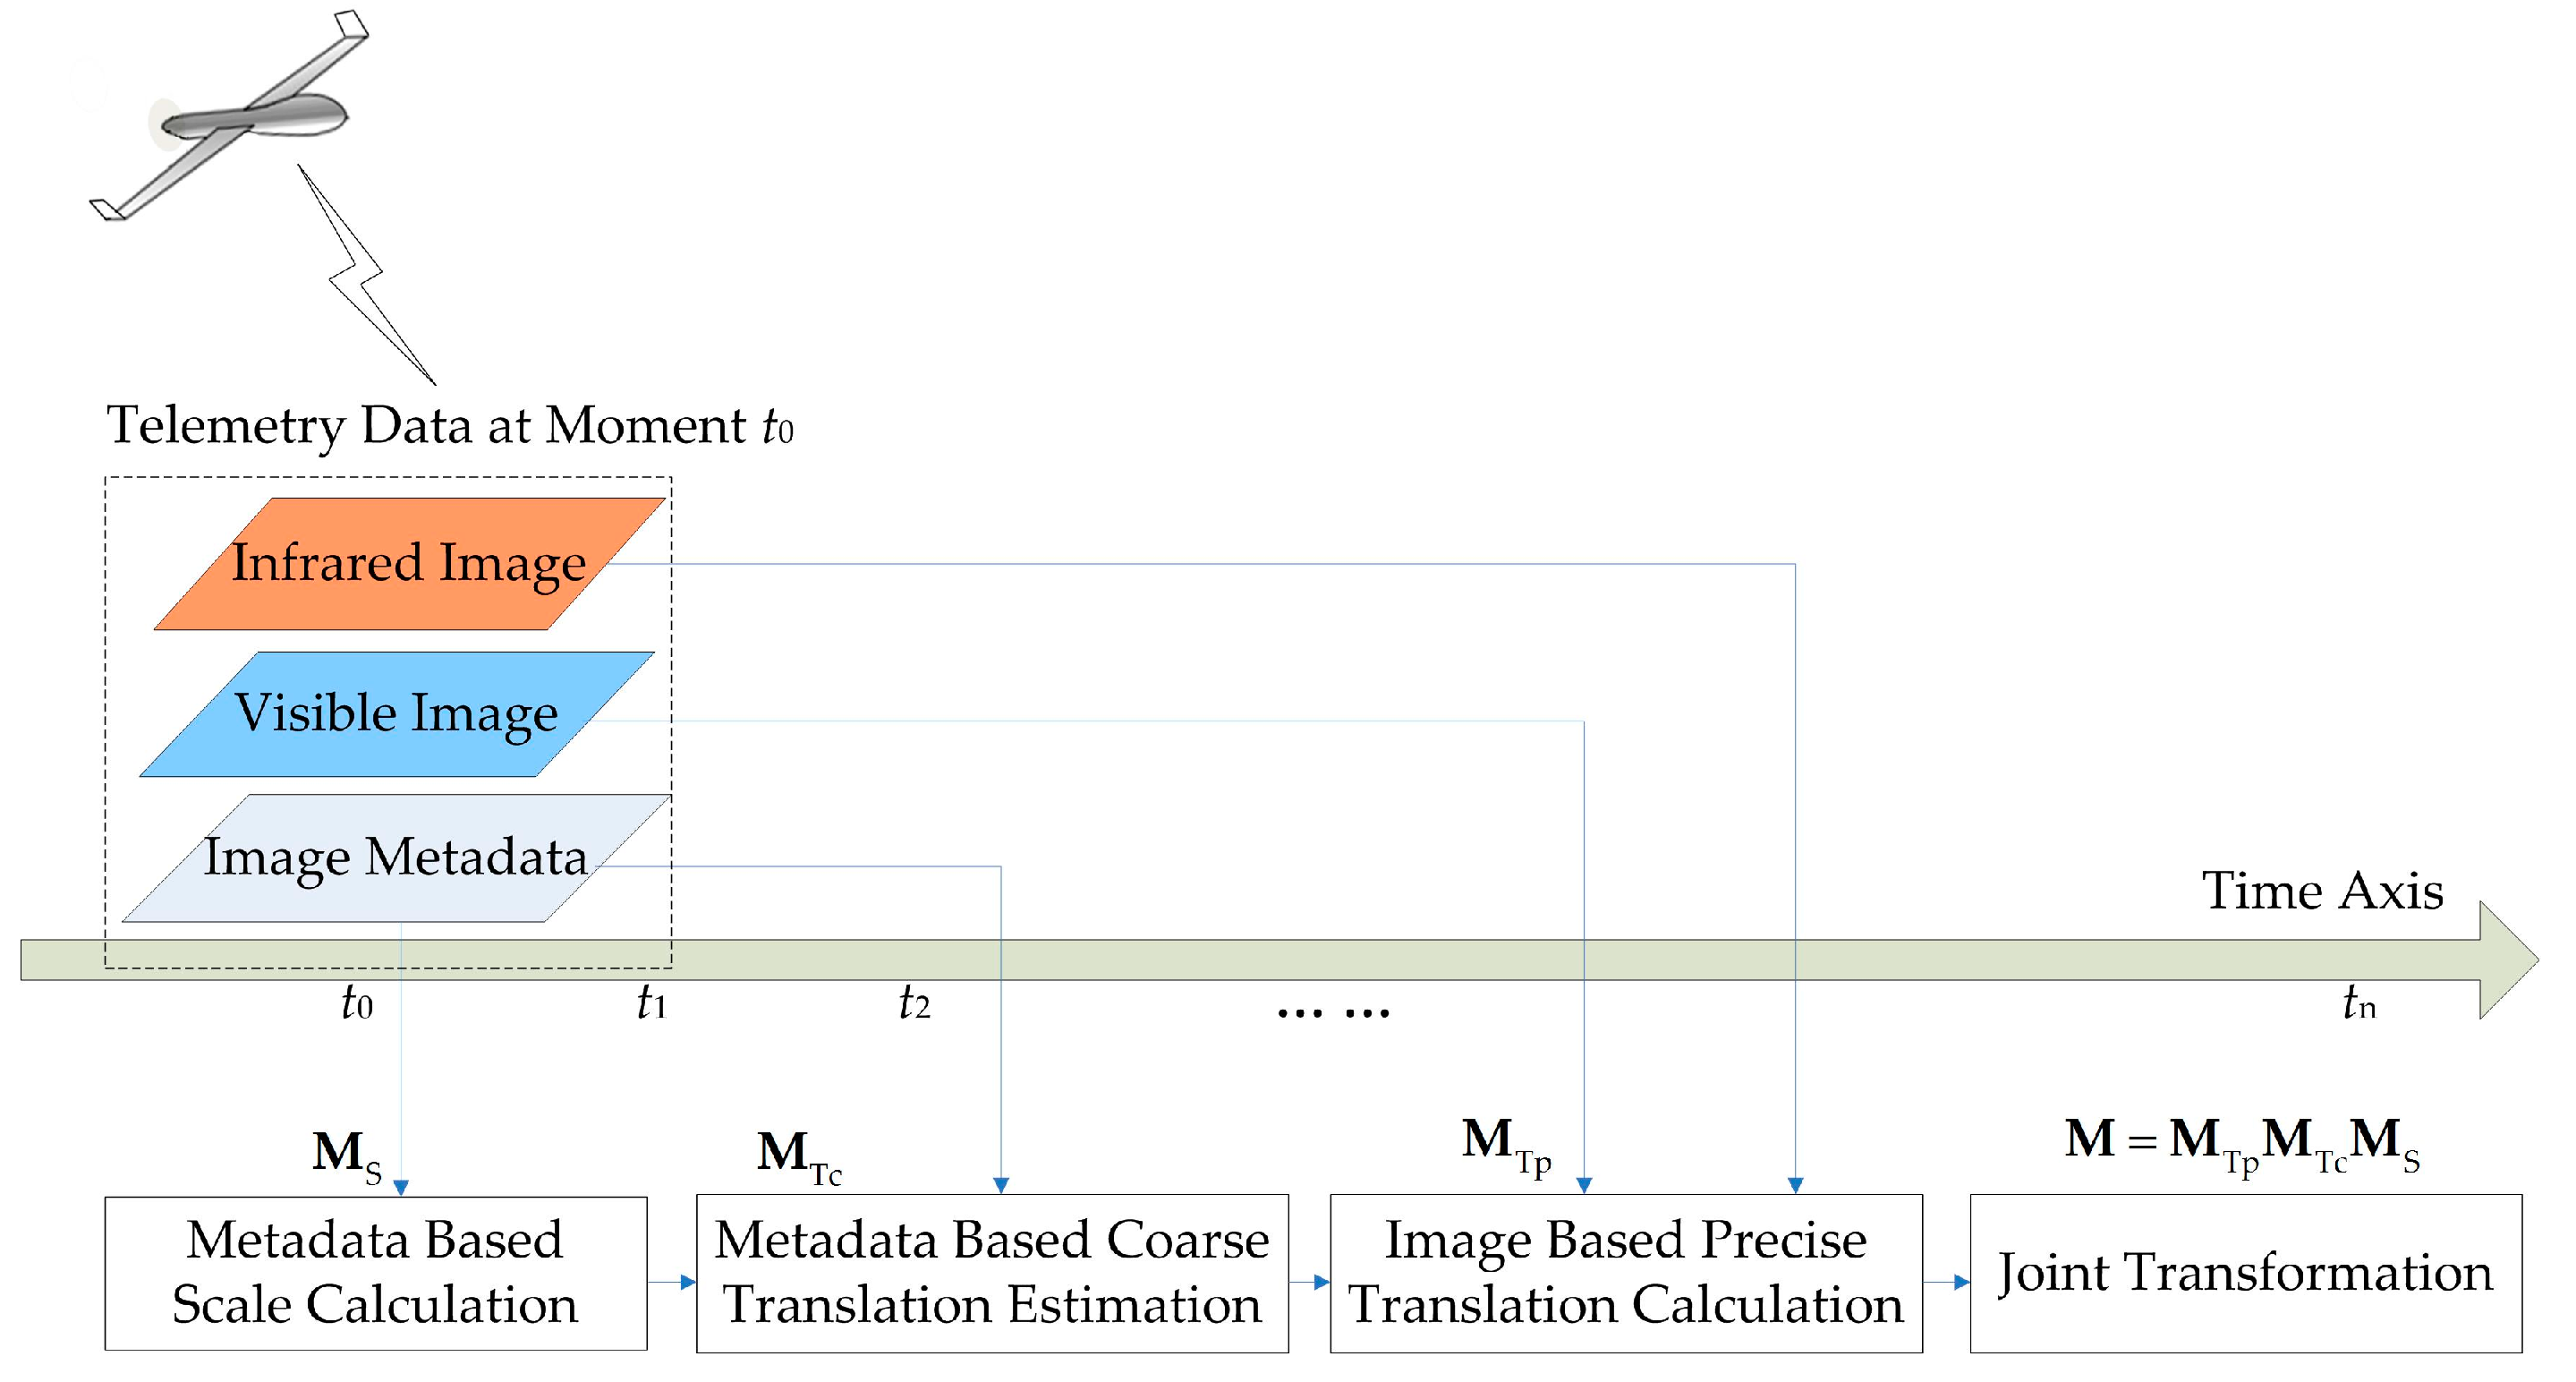
Accordingly, the problem of visible and infrared image registration can be decomposed into scale calculation, coarse translation estimation, and precise translation estimation. The overall solution process is shown in Figure 4.
Scale calculation is based on spatial geometry using pixel size and the focal length of two sensors. Translation calculation is divided into metadata-based coarse translation estimation and image-based precise translation estimation. In coarse translation estimation, the transformation from the image plane to the ground plane is established according to the theory of photogrammetry and coordinate transformation. We then attempt to detect the same name points of two images in the ground coordinate system through geographical information and obtain the translation from the infrared image center to the visible image center. Precise translation estimation is based on image features. Edge features are selected for good structure expression in multimodal images to ensure the accuracy and computation efficiency in registration.
2.2.3. Visible and Infrared Image Fusion
To meet the four requirements of UAV image fusion, namely, preserving color information, adding infrared brightness information, improving spatial resolution, and highlighting target areas, this study presents a new image fusion method based on NSCT and PCNN. The main features of the method include the following:
- The IHS transform is used to extract H and S to preserve the color information, and the NSCT multi-scale decomposition is designed to resolve the declining resolution of fusion images caused by the direct substitution of the I channel.
- The lowpass sub-band of the infrared image obtained via NSCT decomposition is processed by gray stretch to enhance the contrast between the target and the background and highlight the interesting areas.
- In view of the PCNN neuron with synchronous pulse and global coupling characteristics, which can realize automatic information transmission and fusion, an algorithm of visible and infrared bandpass sub-band fusion-based PCNN model is proposed.
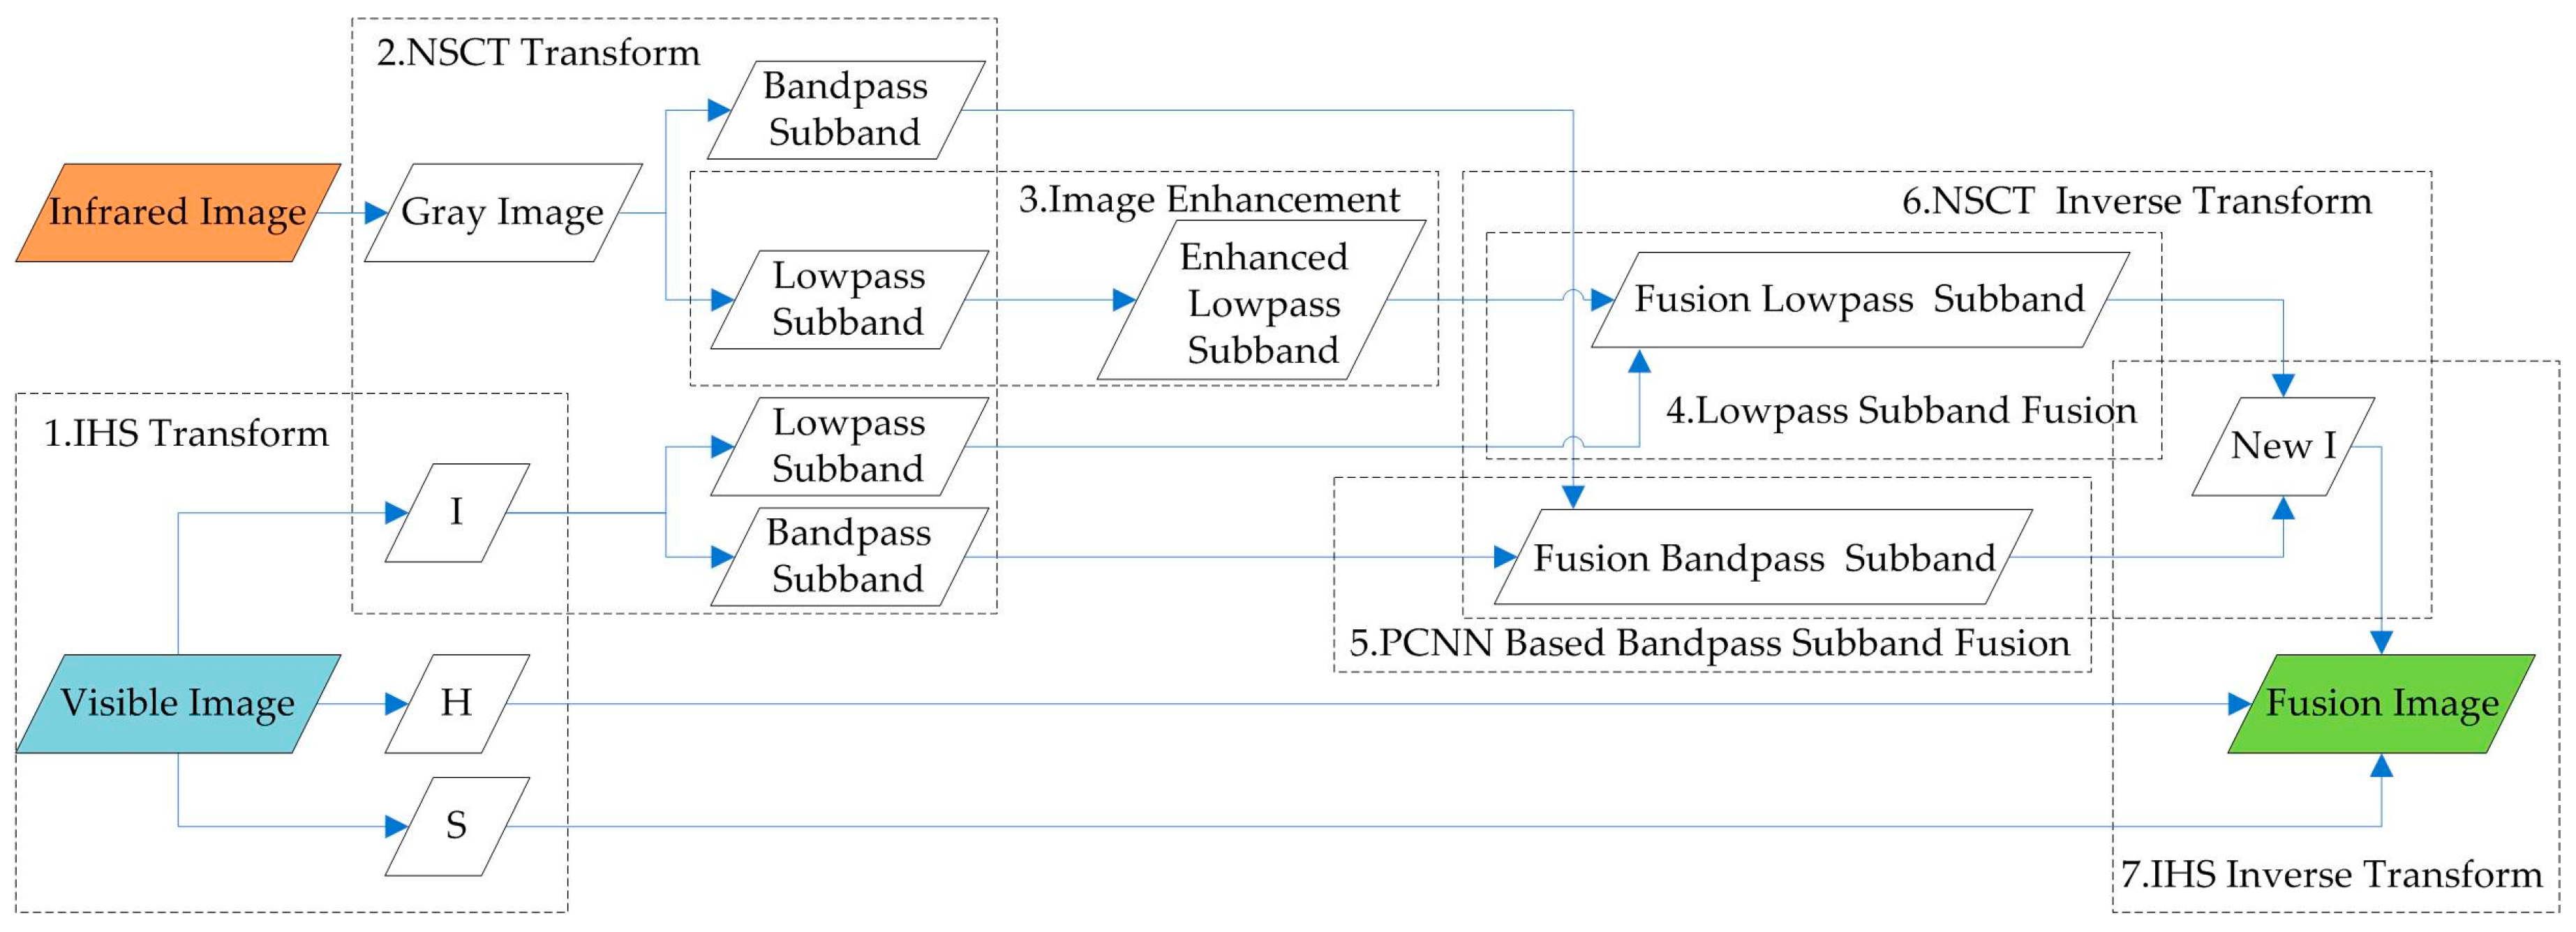
The process of visible and infrared image fusion based on PCNN and NSCT is shown in Figure 5.
The fusion algorithm is implemented in seven steps: (1) IHS transform of visible image; (2) NSCT transform of infrared image and I channel of visible image; (3) enhancement of lowpass subband of infrared image; (4) lowpass subband fusion; (5) bandpass subband fusion; (6) NSCT inverse transform using fusion lowpass subband and fusion bandpass subband; and (7) IHS inverse transform using H channel, S channel, and new I channel.
2.3. Metadata-Based Scale Calculation
2.3.1. Metadata
Metadata represents a type of telemetry data produced simultaneously with images in a UAV system. The most useful parameters are listed in Table 2. The parameter of terrain height is acquired from the geographic information system installed in a ground or airborne computer. Camera installation translations are measured with special equipment before flight. Other parameters come from airborne position and orientation sensors, such as GPS, INS, and altimeter.
2.3.2. Spatial Geometry-Based Scale Calculation
For image matching, one image should be scaled to the other. According to spatial geometry, the scale transformation is only related to the pixel size and focal length, which can be expressed as Equation (9)
where and denote the pixel sizes of the infrared sensor and visible light sensor, respectively; and and represent the two focal lengths. Using , the infrared image could be transformed to the scale-transformed image , which is on the same plane of the visible image , by employing Equation (10)
2.4. Metadata-Based Coarse Translation Estimation
Based on the theory of coordinate transformation [54,55], this section proposes a method for estimating the transformation between the visible image and the infrared image using image metadata. This estimation is coarse, but it could eliminate the global motion between the frames, reduce the matching range of image registration, and greatly improve the efficiency.
2.4.1. Five Coordinate Systems
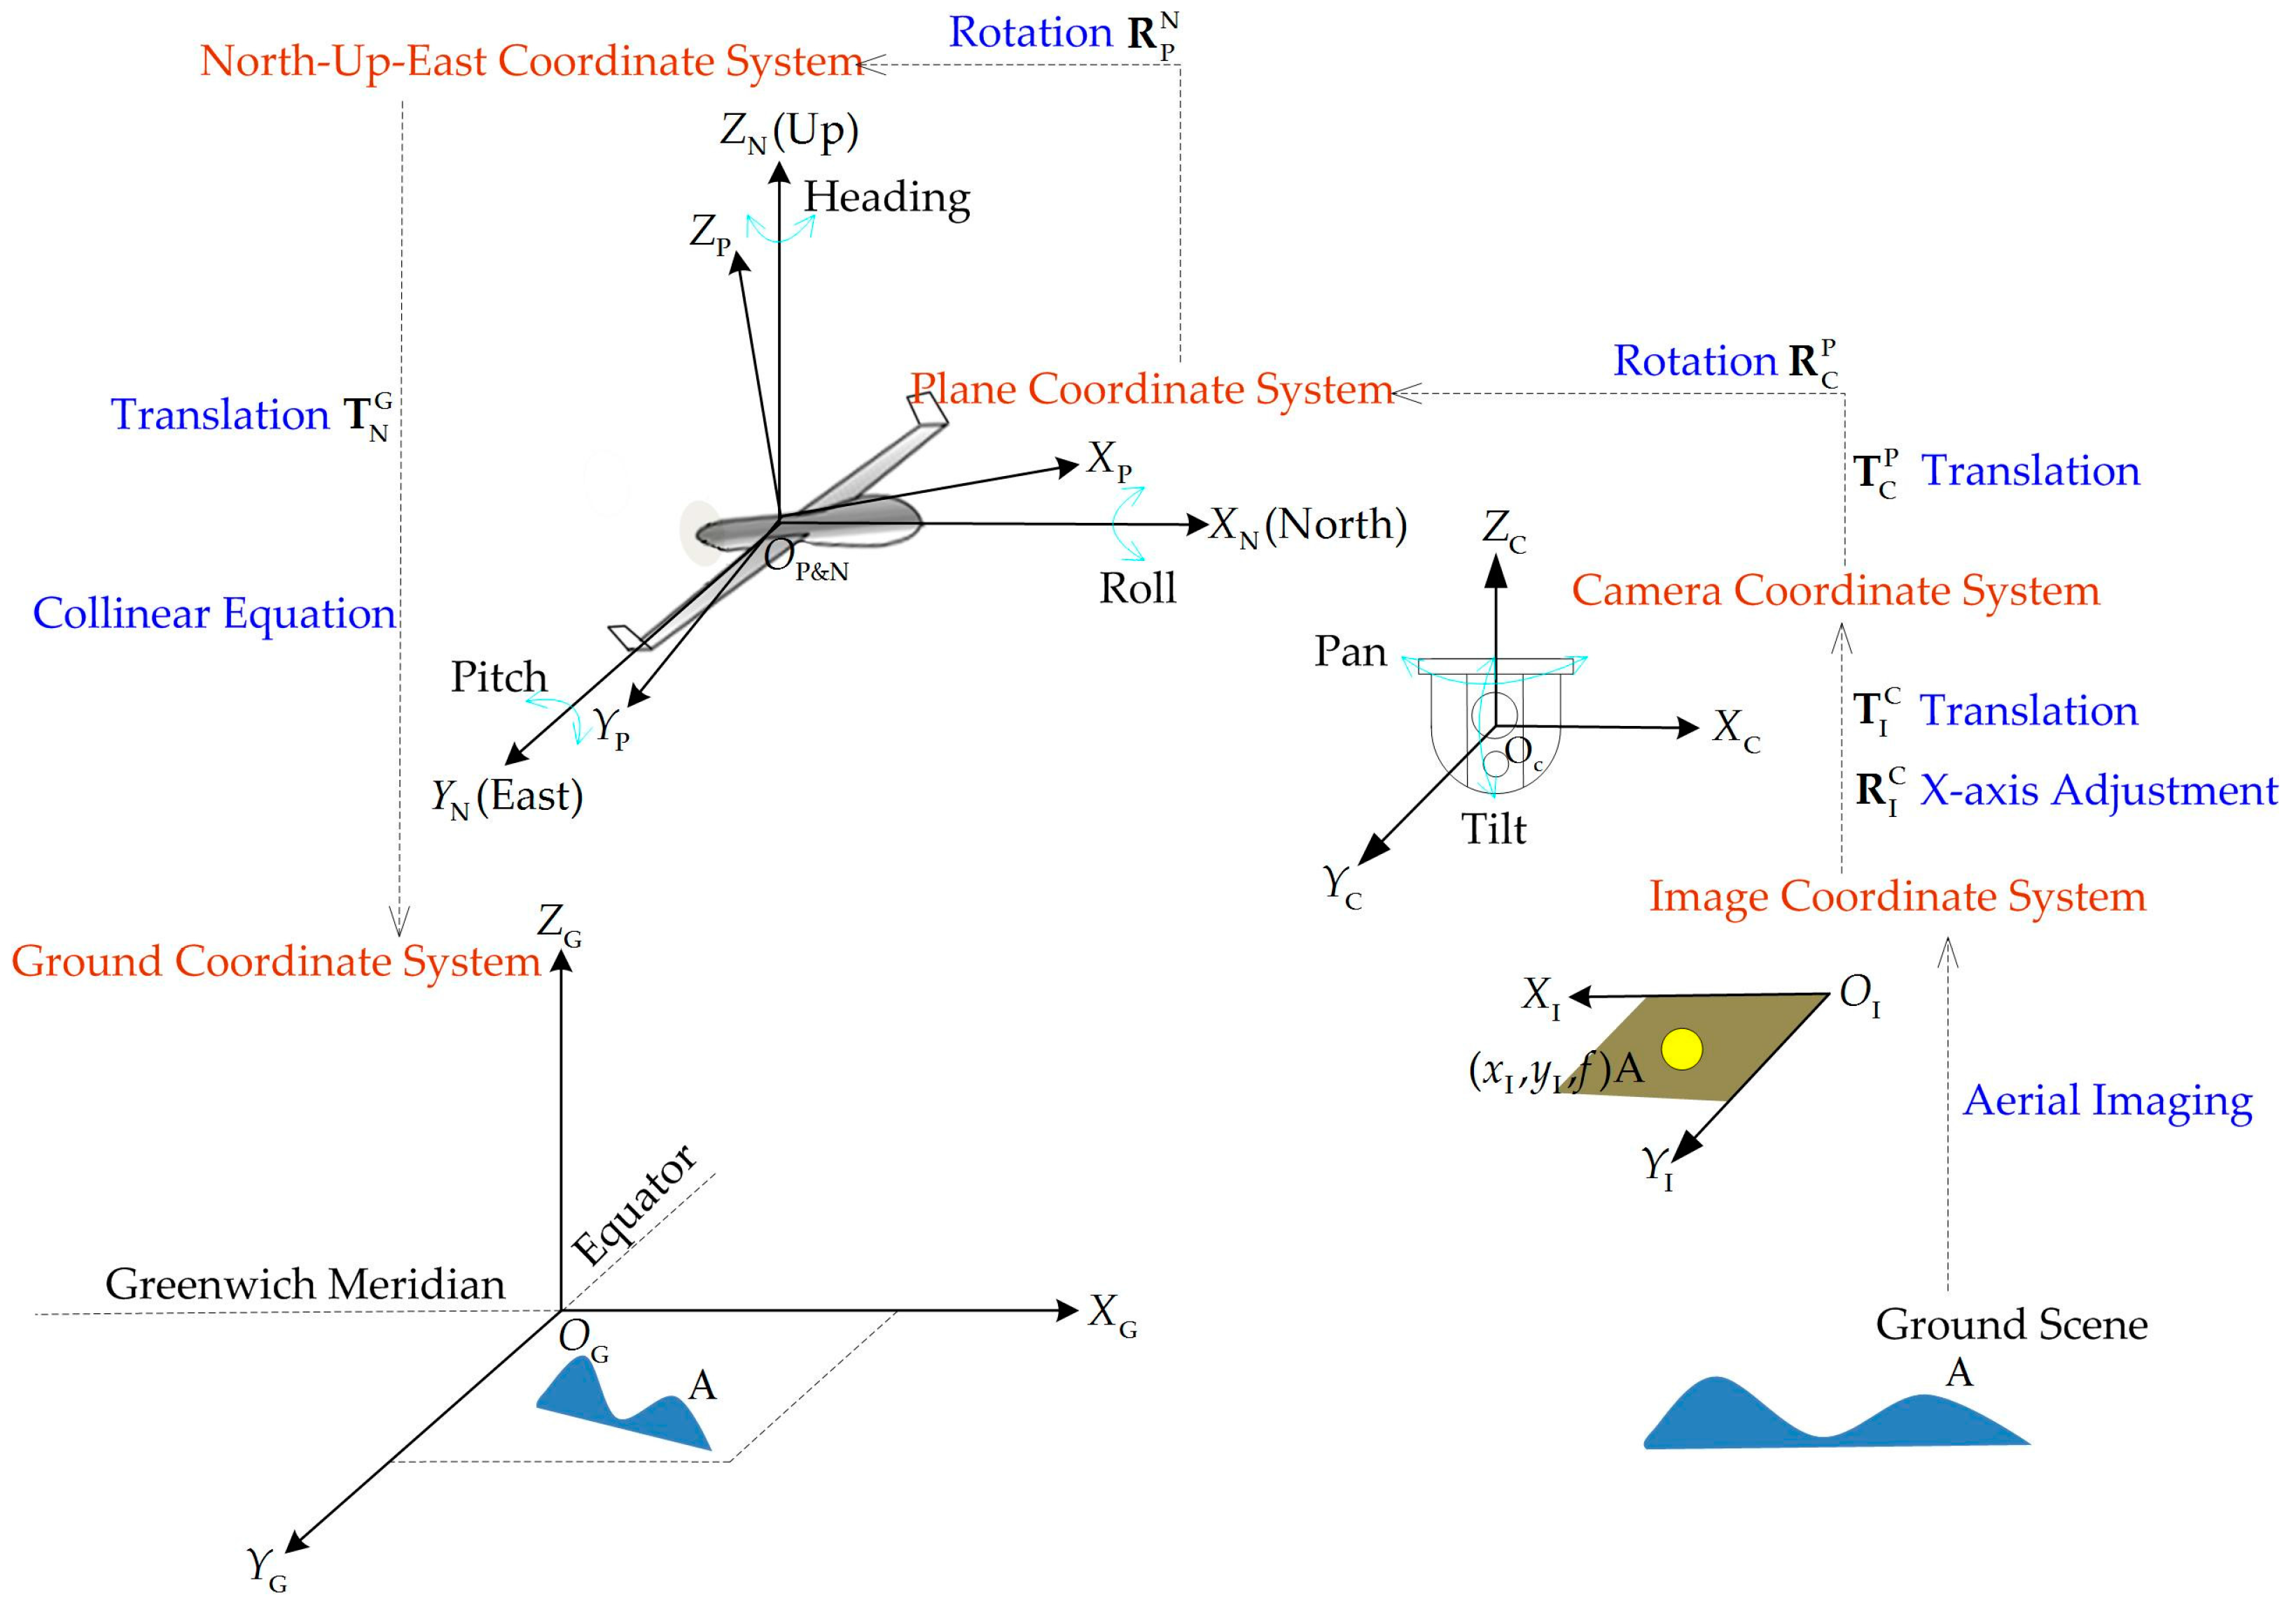
Coordinate transformation is the key aspect in the whole process of coarse translation estimation. The following five coordinate systems are used as basis, as shown in Figure 6.
● Image Coordinate System (ICS)
ICS is defined as a rectangular coordinate system, which is related to pixels. The top left corner of the image is considered the coordinate system origin. The values of are related to the physical size of the row u and column v of the image. The relationship is established by pixel size s. According to different calculation modes, the value of could be set as the focal length of camera f or −f.
● Camera Coordinate System (CCS)
CCS is the image coordinate system represented by physical units with respect to the center of the image as the origin of the coordinate system, in which axis and axis are parallel to axis and the axis . Axis is upward along the optical axis direction. In this system, the unit is generally in meters.
● Plane Coordinate System (PCS)
The origin of the PCS is the center of the GPS device. In PCS, the direction of the axis is positive when it points to the head of the plane, axis is perpendicular to axis on the body plane, and is positive when it points upward.
● North–East–Up Coordinate System (NCS)
The origin of the NCS is coincident with the origin of the PCS. The direction of axis is positive when it points north, the direction of axis is positive when it points to the east, and axis points up.
● Ground Coordinate System (GCS)
The Gauss–Kruger surface projection is used in the GCS. The coordinate system is the plane rectangular coordinate system in which national mapping involves the use of Gauss–Kruger or to project and is the absolute altitude. The system consists of a rectangular space and a left-handed coordinate system.
2.4.2. Metadata-Based Coordinate Transformation
Based on the five coordinate systems, the transformation from image in the ICS to image in the GCS should be implemented according to the coordinate system transformation. The process is as follows: ICS → CCS → PCS → NCS → GCS. The transformations between the above coordinate systems present translations and rotations, which can be expressed as Equations (11) and (12), respectively.
where and are translation parameters; and , and are the three rotation parameters of the X, Y, and Z axes.
The coordinate transformations in our UAV system are listed in Table 3. They can be calculated with Equations (11) and (12) using relevant metadata.
Assuming that any ground point in the ICS, NCS, and GCS could be denoted as , , and , respectively, and the imaging center in the ICS, NCS, and GCS are denoted as , , and , respectively, the values can be computed via coordinate transformation. Given that the NCS is parallel to the GCS, we can obtain the following formula using the collinear equation according to the central projection model shown in Equation (13).
Then, we can obtain any point transformation from the ICS to the GCS via Equations (14) and (15).
where , , and . is a coefficient and could be eliminated during computation. represents the transformation from image in the ICS to image in the GCS.
2.4.3. Coordinate Transformation-Based Coarse Translation Estimation
Given the same mode of center projection, the coordinate transformation is applicable to both the visible image and infrared image. According to the inverse process of Equation (16), we can conveniently obtain the corresponding pixel positions in the visible image and infrared image of any point in the GCS. The overlapping image of the two sensors in the GCS could be denoted as , and the corresponding visible image and infrared image in the ICS are denoted as and , respectively. The following equation could then be established as Equation (16):
where and represent the transform from the GCS to the ICS of the two sensors; they show different expressions because of the different parameters of the two sensors. Accordingly, the coarse translation estimation from the scale-transformed infrared image to the visible image can be calculated using Equation (17).
Based on the scale calculation in Section 2.3.2, can be considered as the translation from the center of the infrared scale-transformed image to the center of the original visible image .
2.5. Image-Based Precise Translation Estimation
2.5.1. Edge Detection of Visible and Infrared Images
According to current studies, line and edge are robust features for the good representation of scene structure information, and they are widely applied to scene registration and modeling. As described in a study on video analysis [56], line features play an important role in fast 3D camera modeling. In the present study, edge features are used in visible and infrared image registration. The Canny operator [57] is one of the most popular edge detection algorithms. As the scene and illumination of visible and infrared images change frequently, the high and low thresholds of the Canny operator often change thereby leading to poor self-adaptation. In many cases, the conventional Canny operator cannot obtain a satisfying detection result. In the present work, a self-adaptive threshold Canny operator is used to detect enough real edges and avoid disconnected or false edges in detection [58].
2.5.2. Edge Distance Field Transformation of Visible Image
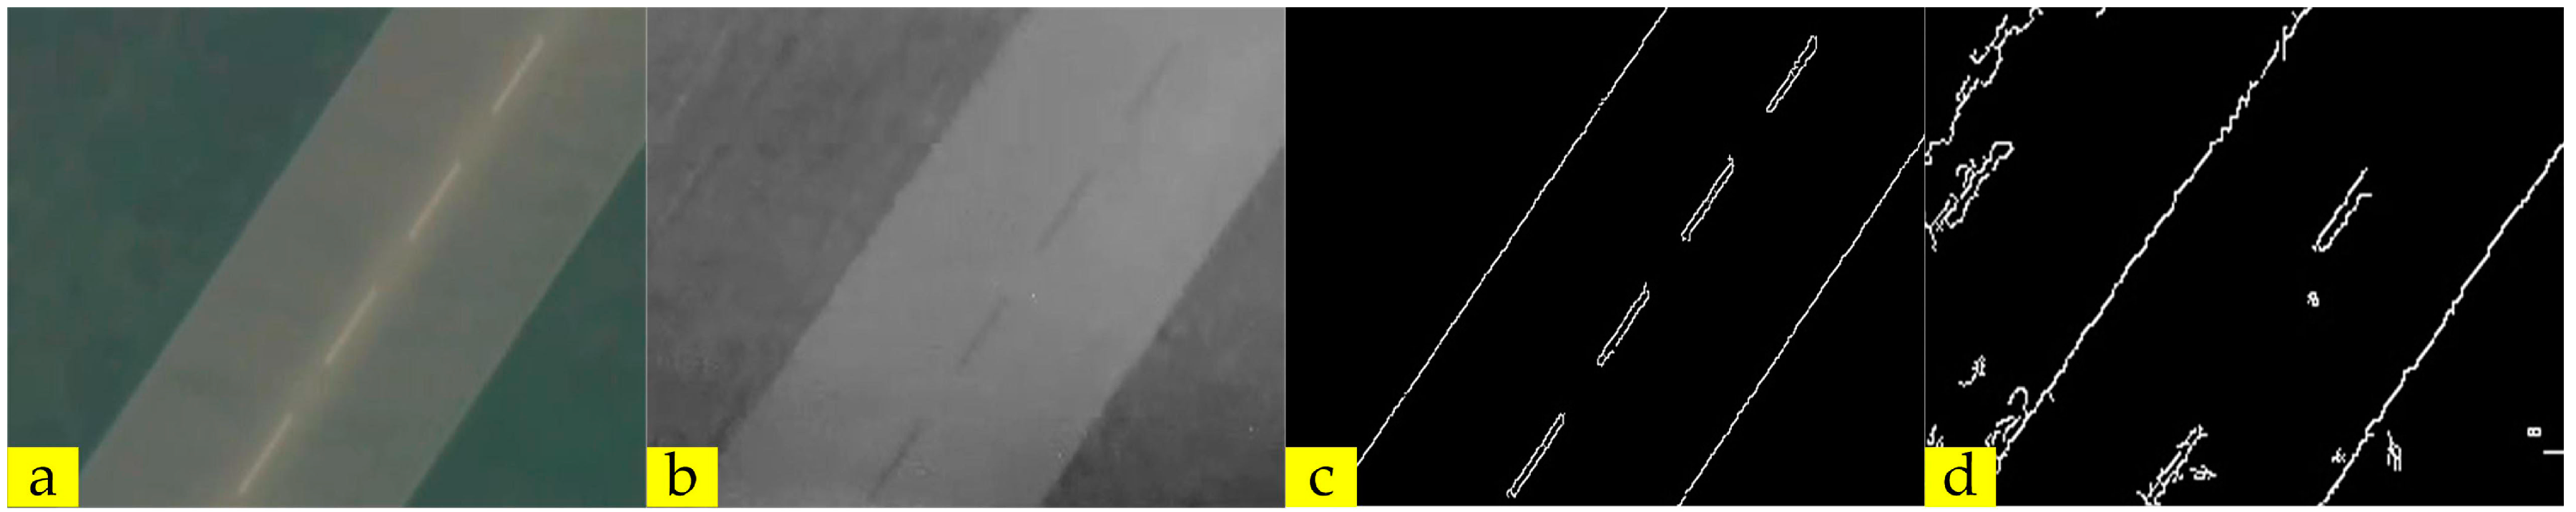
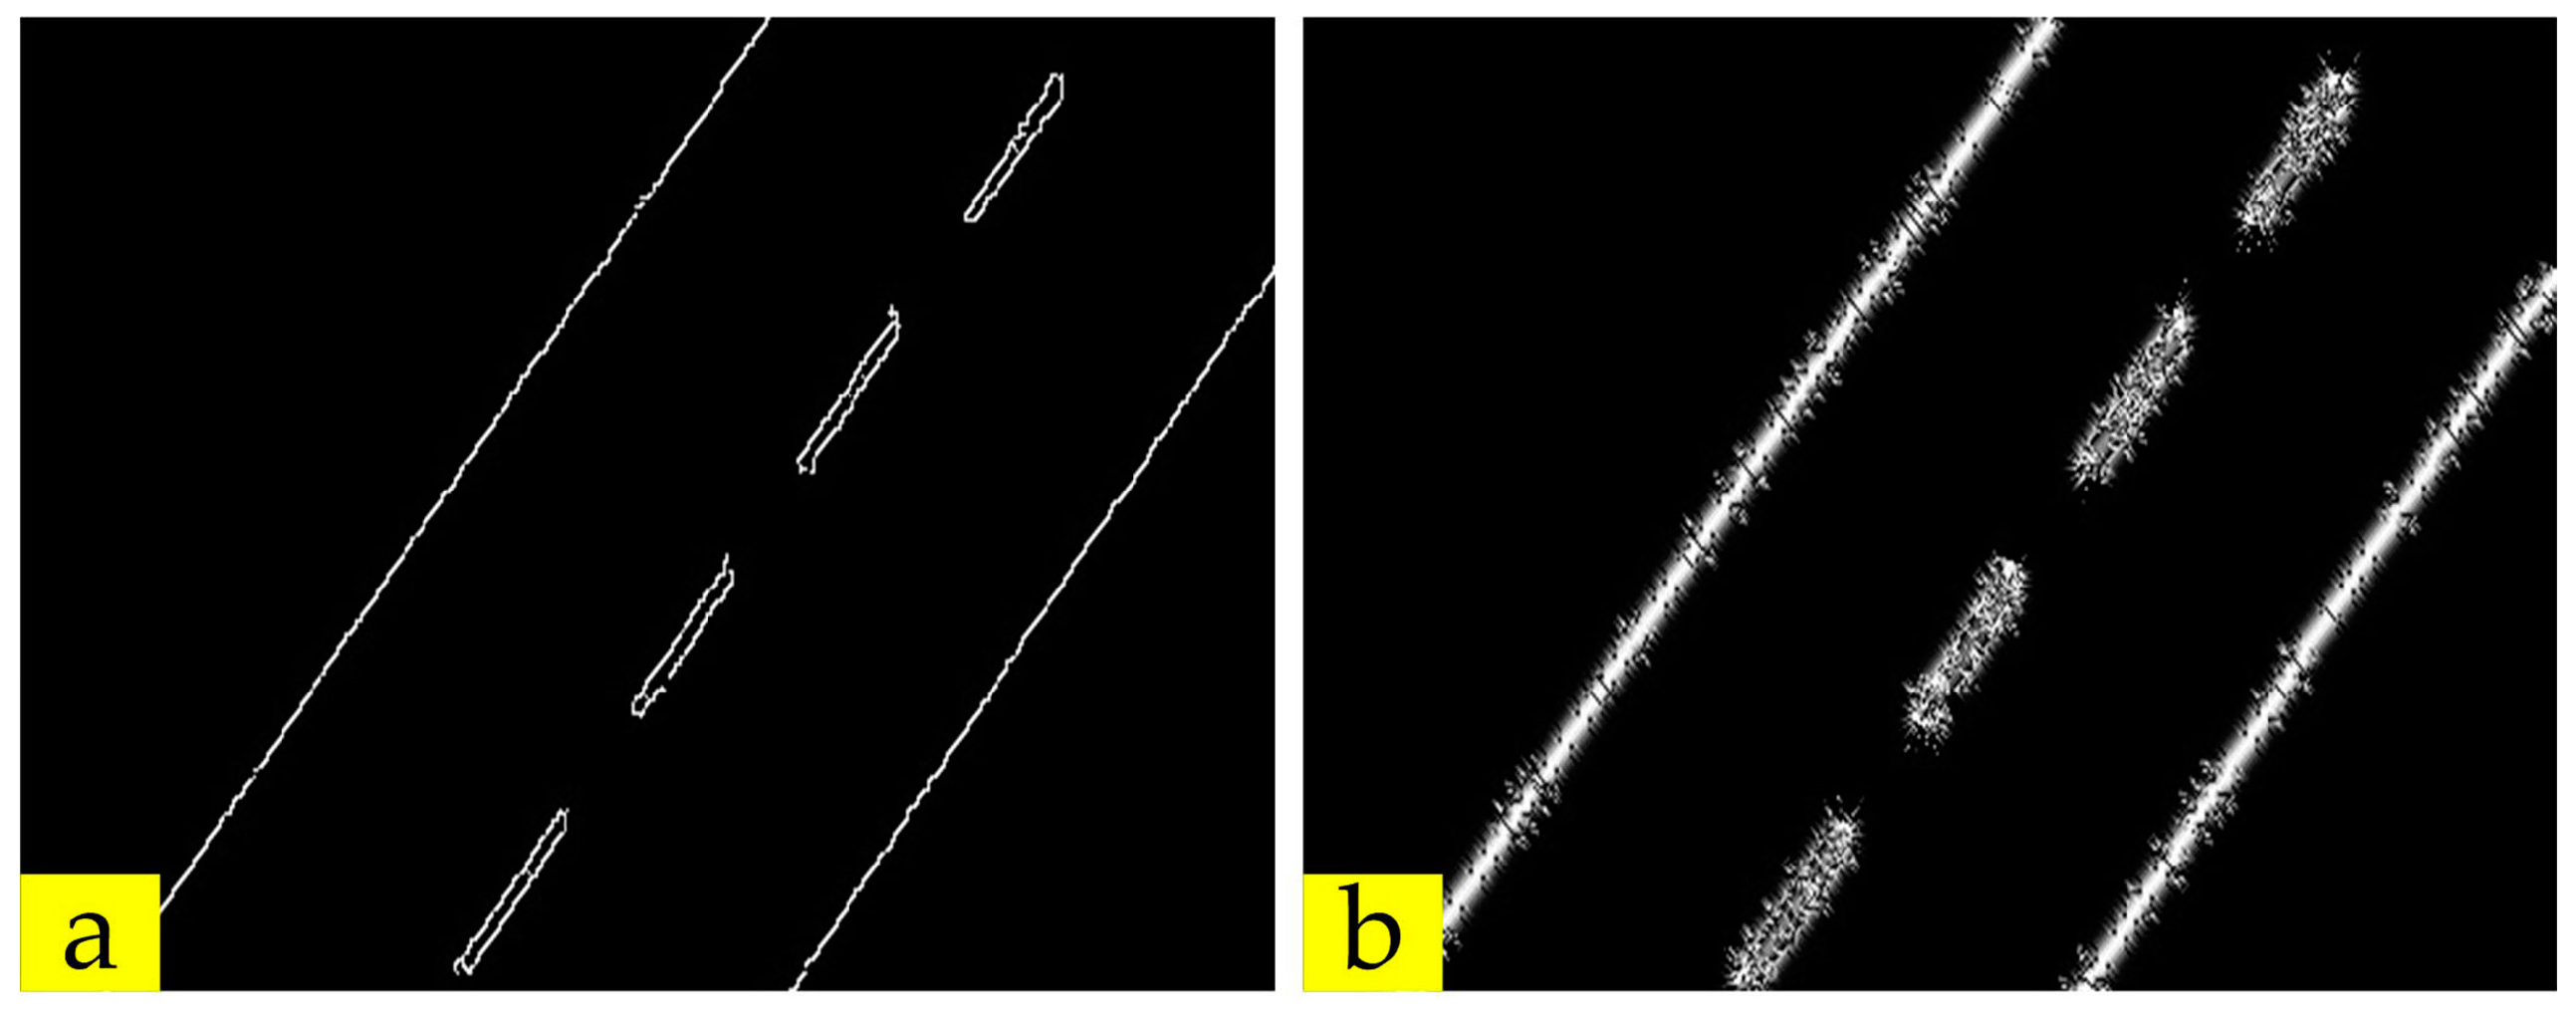
As a result of different imaging mechanisms, the edge features of visible and infrared images show different characteristics. In the visible image, the edges appear relatively smooth, complete, and less noisy. In the infrared image, the edges appear to be incomplete, rough, and noisy, as shown in Figure 7. This characteristic indicates that the edges of the visible and infrared images are roughly the same. However, some details are slightly biased, and they could be defined as the non-strictly aligned characteristics of edges.
To adapt to the non-strictly aligned characteristics of edges, this study proposes a new registration method based on a Gaussian distance field. This method can extend the edge range with a certain weight and convert the conventional edge-to-edge registration to the edge-to-field registration, which is effective for non-strict matching.
Using the edge detection algorithm of Section 2.4.1, we can extract the edge feature image from the original visible image , with the edge pixel value being 255 and the non-edge pixel value being 0. In the edge feature image, the distance transformation of a point is defined as the distance from the nearest edge point to the point itself, as shown in Equation (18).
where represents the distance between two points of in the distance field map of the visible image and in the visible edge image . Given that the points away from the edge exert little effect on edge registration, distance transformation should only be performed in an edge-centered band region. Specifically, the band threshold is set to , and the distance transformation values of all pixels larger than are set to via Equation (19).
In image matching, can be used to measure the similarity of the point in the infrared image and the point in the visible image. A small value equates to great matching probability, which could be expressed with a Gaussian model shown in Equation (20):
where represents the matching probability. Standard deviation is set to . In this paper, , which could be different in specific situations. Based on Equation (20), the distance field map of the visible image is established, as shown in Figure 8.
2.5.3. Non-Strict Registration Based on the Edge Distance Field
Similarity for Registration
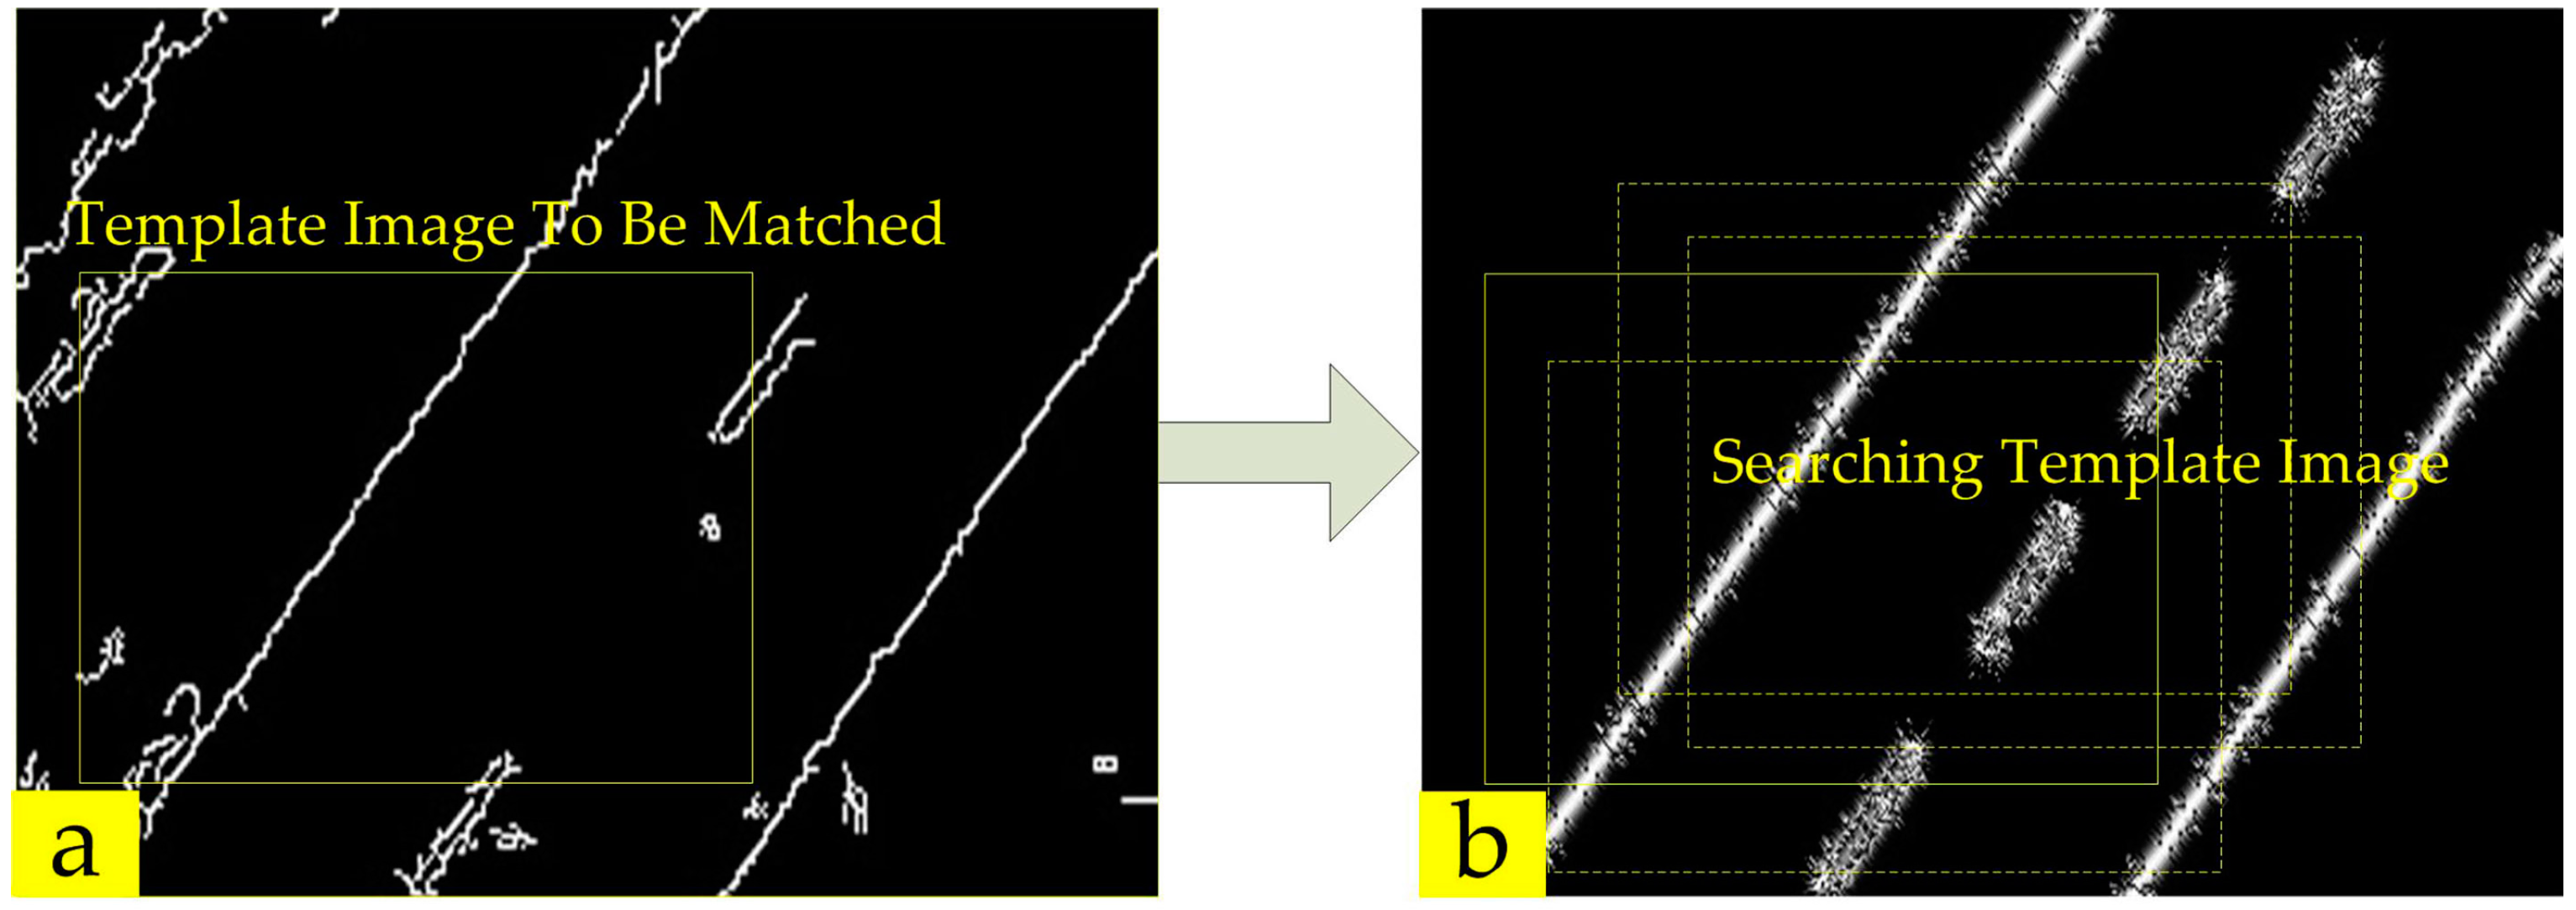
Assuming that the template image to be registered is extracted from the infrared edge image , then the similarity between and the corresponding template image from the visible distance field map can be expressed using Equation (21):
where is any point in , and is the function of the distance field transformation [59].
Infrared Template Image Extraction
Given that the edge distribution of the infrared image is unknown, the infrared template image should be automatically extracted for matching. The position of can be calculated using Equation (22):
where N is the number of edge pixels in the infrared edge map and (x, y) is any edge point.
As shown in Figure 9, the width and height of are defined as w and h, respectively. On the x-axis, the edge pixels of the interval occupy a certain proportion of the total pixels of . The edge pixels of the interval account for the same proportion on the y-axis.
Searching Algorithm Based on Particle Swarm Optimization
As shown in Figure 9, a searching algorithm is used to find the best matching position in the distance field map of visible edge according to the similarity of the template image and the template image extracted from . The time-consuming performance of the algorithm relative to conventional window searching should be improved, and the occasional accuracy deviation of the metadata attributed to the large motion of the UAV body or camera should be addressed. A novel searching algorithm with a time-varying inertia weight is proposed based on particle swarm optimization (PSO) [60,61].
PSO is a relatively new population-based evolutionary computation technique. This approach uses M particles to construct a group of particles and search for the optimal solution via iteration in the D dimensional space. Each particle comprises several parameters, including current position, velocity, and the best position found by the particles. For a D dimensional search space, these parameters are represented with D dimensional vectors. The position and velocity of the k particle are presented in Equation (23):
At the n iteration step, the position and velocity of particle i are updated according to Equation (24).
where is the inertia weight; r1 and r2 are two distinct random values between 0 and 1; c1 and c2 are the acceleration constants known as cognitive and social scaling parameters, respectively; is the best previous position of the particle itself; and denotes the best previous position of all particles of the swarm. A large value of facilitates global exploration with increased diversity, whereas a small value promotes local exploitation [62].
In terms of image registration, is the center of image , and is the searching result serving as the best matching position of image and image . As a result of the complex motion of medium-altitude UAVs and cameras, the translational motion between the visible image and the infrared image presents a certain vibration, which requires the search algorithm to automatically adjust the inertia weight . A time-varying is then proposed in Equation (25):
where t represents the time of image capture. The first item is the constant inertia weight, which denotes the confirmed global and local searching ability. The second item is the stochastic inertia weight. This item could allow the algorithm to jump out of local optimization to maintain diversity and global exploration; r is a distinct random value between 0 and 1. The third item is the motion adaptive inertia weight to balance global searching and local searching according to the translation motion between the visible image and the infrared image. and are the two best previous positions of all particles of the swarm at moments t − 1 and t − 2, respectively. and are the row and column of the visible image, respectively. In this study, = 0.5, and = 0.2.
As the result of the searching algorithm, is the best position at which the similarity of image and image is the highest. The precise translation from scale and the coarse translation-transformed infrared image to the visible image can then be expressed as Equation (26).
2.6. PCNN- and NSCT-Based Visibleand Infrared Image Fusion
2.6.1. Simplified PCNN Model
PCNN is a type of feedback network used to explain the characteristics of the neurons in the visual cortex of a cat. As a result of synchronous pulse and global coupling, PCNN neurons can realize automatic information transmission and achieve good results in the field of image fusion. PCNN is connected by a number of neurons, and each neuron corresponds to a pixel of the image. Owing to the complexity of the original PCNN model, a simplified PCNN model [63] is adopted in this study. The mathematical equation is described in Equation (27).
where denotes the iteration times. , , and represent the feedback input, link input, and output of the neuron in the iteration, respectively. , , and are the external input signal, internal activity term, and output of variable threshold function, respectively. , , , , and are the link strength, link weight coefficient matrix, threshold magnification factor, link input, and time decay constant, respectively.
2.6.2. NSCT-Based Image Decomposition
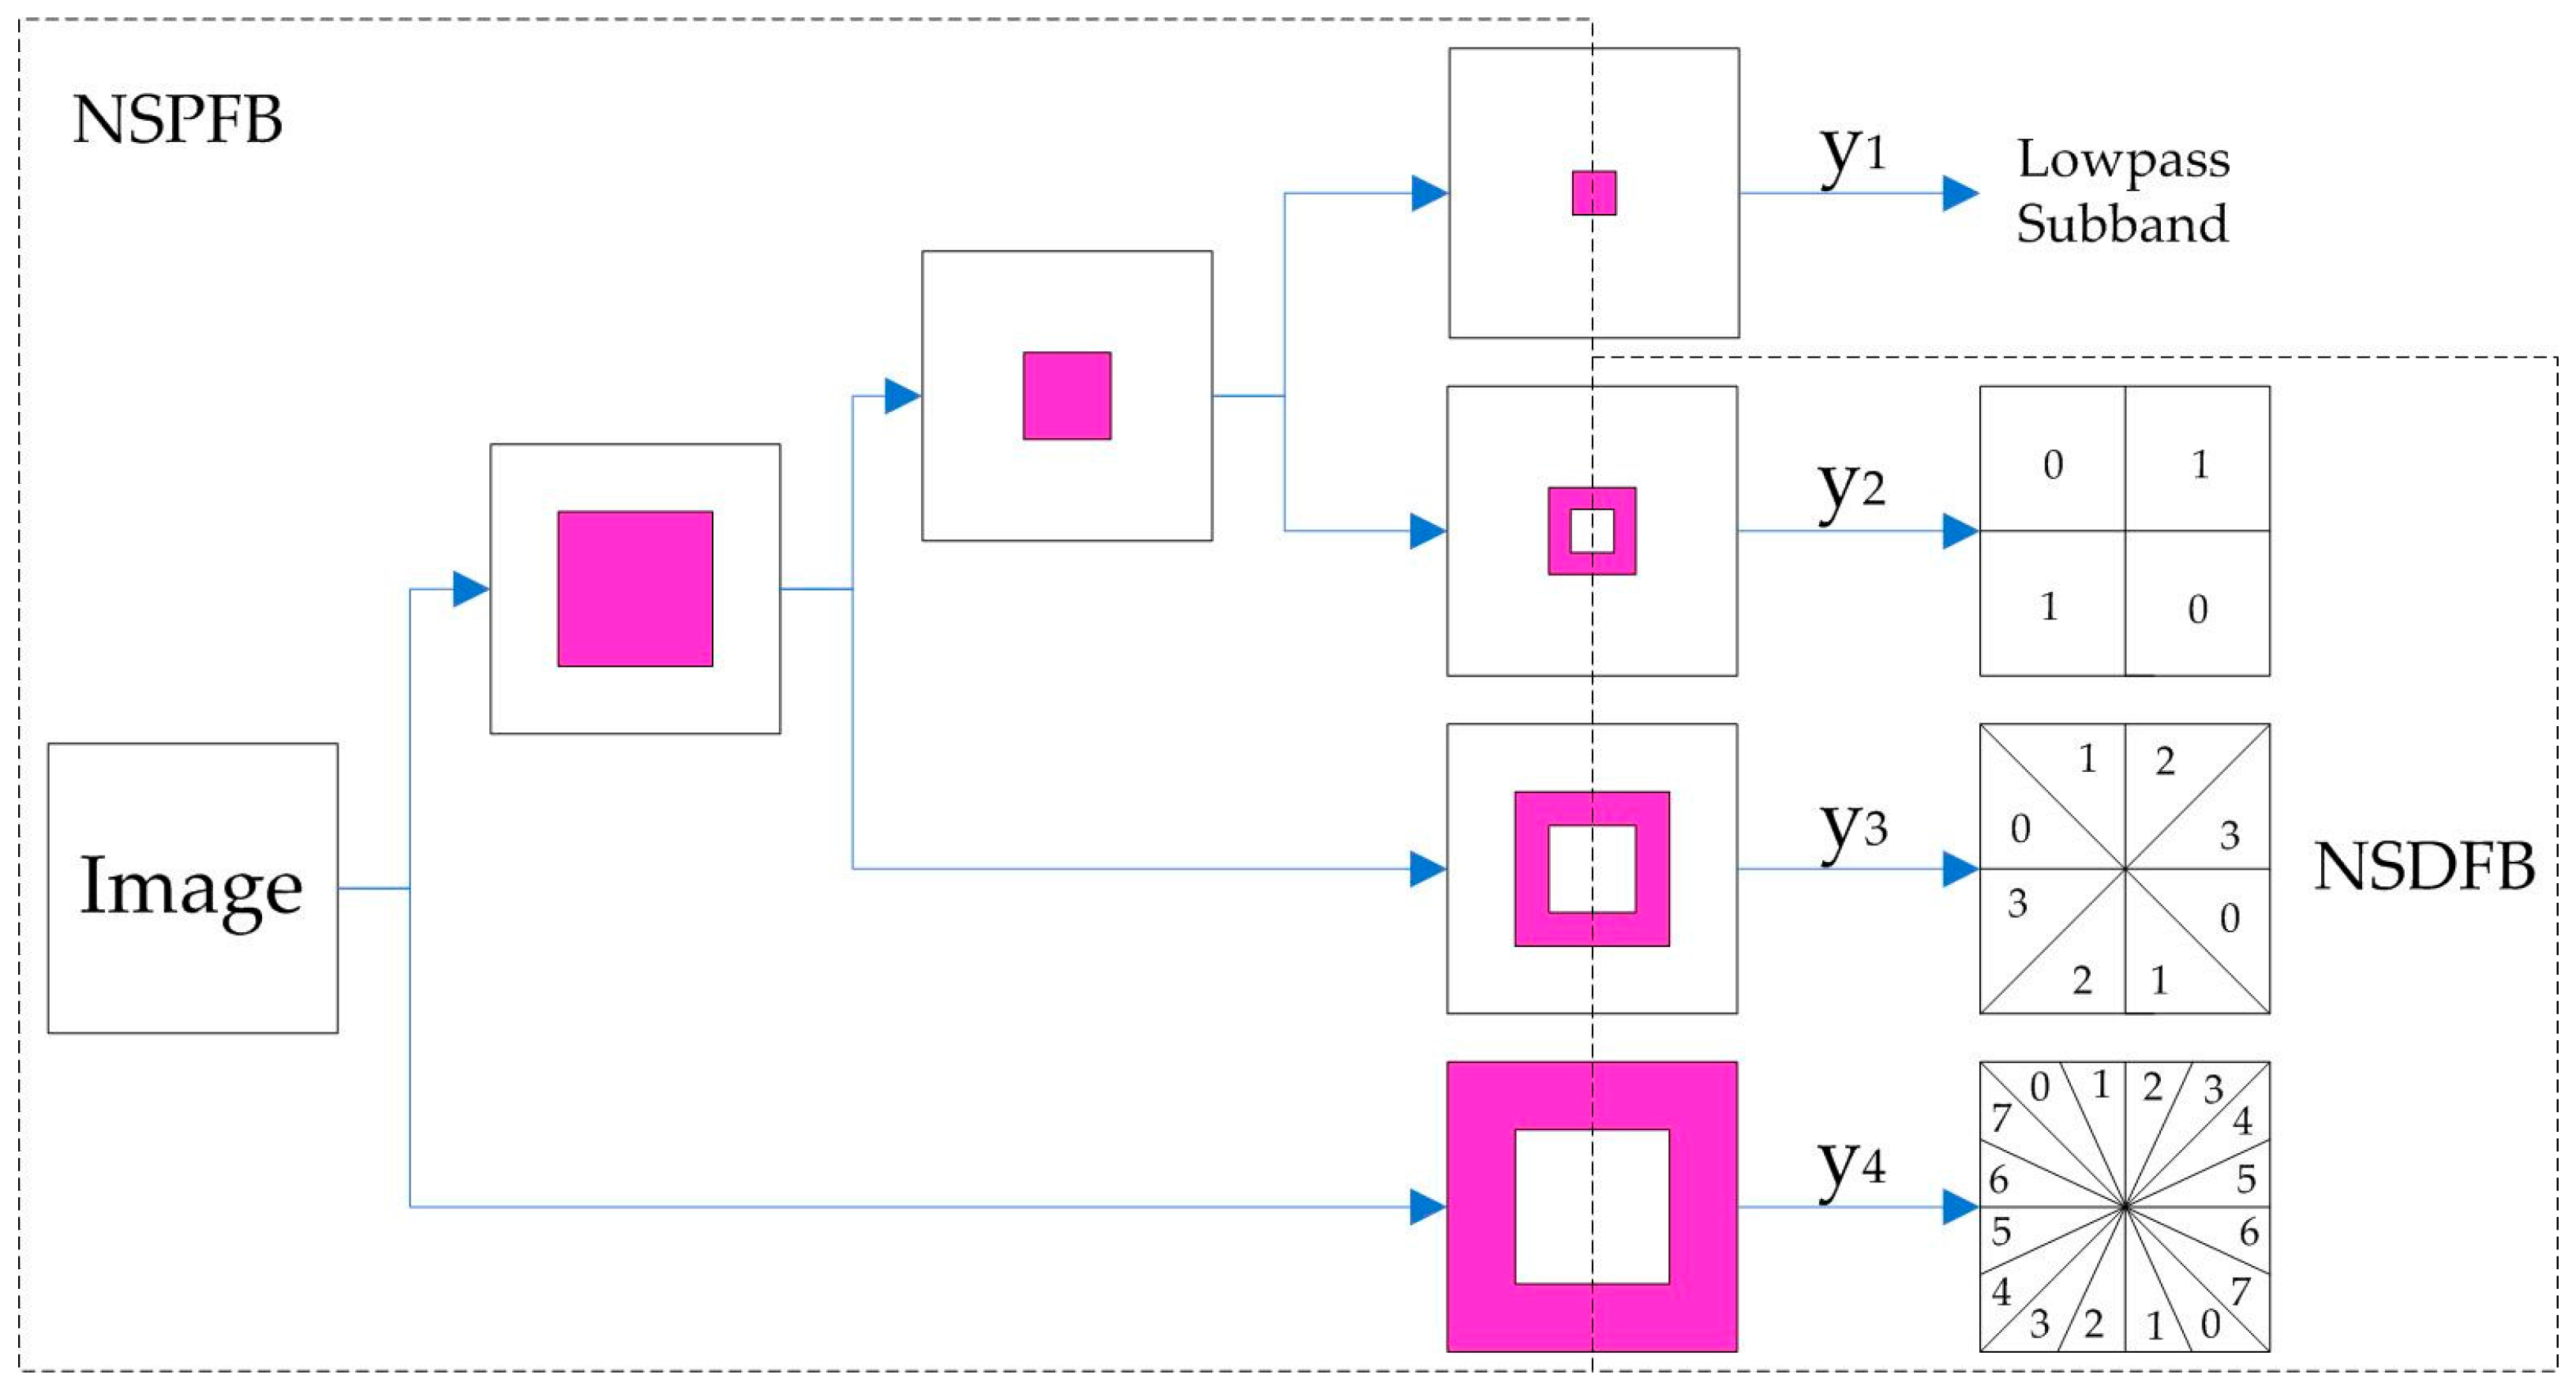
Nonsubsampled contourlet transformation (NSCT) is developed based on contourlet transformation. NSCT consists of two parts, namely, nonsubsampled pyramid filter banks (NSPFBs) and nonsubsampled directional filter banks (NSDFBs). NSPFBs enable NSCT to acquire multiscale characteristics. Through decomposition, the image can produce a lowpass subband and a bandpass subband, and then each decomposition level is iterated on the lowpass subband. A nonsubsampled directional filter bank (NSDFB) is a set of two channel nonsampled filter banks based on the sector directional filter bank designed by Bamberger and Smit [64]. NSDFB can be used to carry out the level direction decomposition of the bandpass subband gained by the NSPFB and obtain the direction subband images with the same size as the original image. Three levels of NSCT transform are shown in Figure 10. The number of subbands in each direction increases by up to two times.
2.6.3. Fusion Algorithm
Based on PCNN and NSCT, the scheme of the visible and infrared image fusion algorithm is introduced in Section 2.2.3. The specific steps of the method are as follows.
1. IHS transform of visible image.
The IHS transform is used to preserve the color information of visible images, which could convert an image from the RGB color space to the IHS color space with the aid of Equations (28)–(30):
where denotes intensity, denotes hue, and denotes saturation. and are preserved for finial IHS inverse transform, and is used to fuse with the infrared image.
2. NSCT transform of infrared image and I channel of visible image.
As the infrared sensor and visible light sensor can zoom individually, the spatial resolution of the infrared image may be lower than that of the visible light image. Thus, the method of directly replacing the I channel of the visible image with the infrared image may cause the spatial resolution of the fusion image to decline. The NSCT multi-scale decomposition is used to solve this problem. The gray image (8 bit) of the infrared image and the I channel (8 bit) of the visible image are decomposed by three levels through the NSCT transform. One image can be decomposed into one lowpass sub-band and some bandpass subbands. The lowpass represents the outline of the original image, and the bandpass sub-bands represent the edges and textures of the image.
3. Enhancement of lowpass subband of infrared image
Based on NSCT transform, the lowpass subband of the infrared image is processed via histogram equalization to enhance the contrast between the target and the background and to highlight the interesting areas.
4. Lowpass subband fusion
During the lowpass sub-band fusion of the visible light and infrared image, the coefficients are selected according to the principle of the maximum absolute value.
5. Bandpass sub-band fusion
The bandpass sub-band fusion of the visible light and infrared image is based on PCNN. The method chooses the regional energy that can reflect the local phase characteristics of the image as the link strength of the neuron. Assuming that is the center of the region size of , the regional energy is expressed as Equation (31):
where represents the bandpass subband coefficient of the kth level at of the image.
6. NSCT inverse transform using fusion lowpass subband and fusion bandpass sub-band
New fusion lowpass sub-band and bandpass subbands are generated based on Equations (4) and (5). Then, a new I channel can be obtained according to the NSCT inverse transform.
7. IHS inverse transform using H channel, S channel, and new I channel
Using the new I channel and the preserved H channel and S channel, the fusion image of the RGB color space can be calculated with Equations (32)–(34):
3. Result and Discussion
3.1. Study Area and Dataset
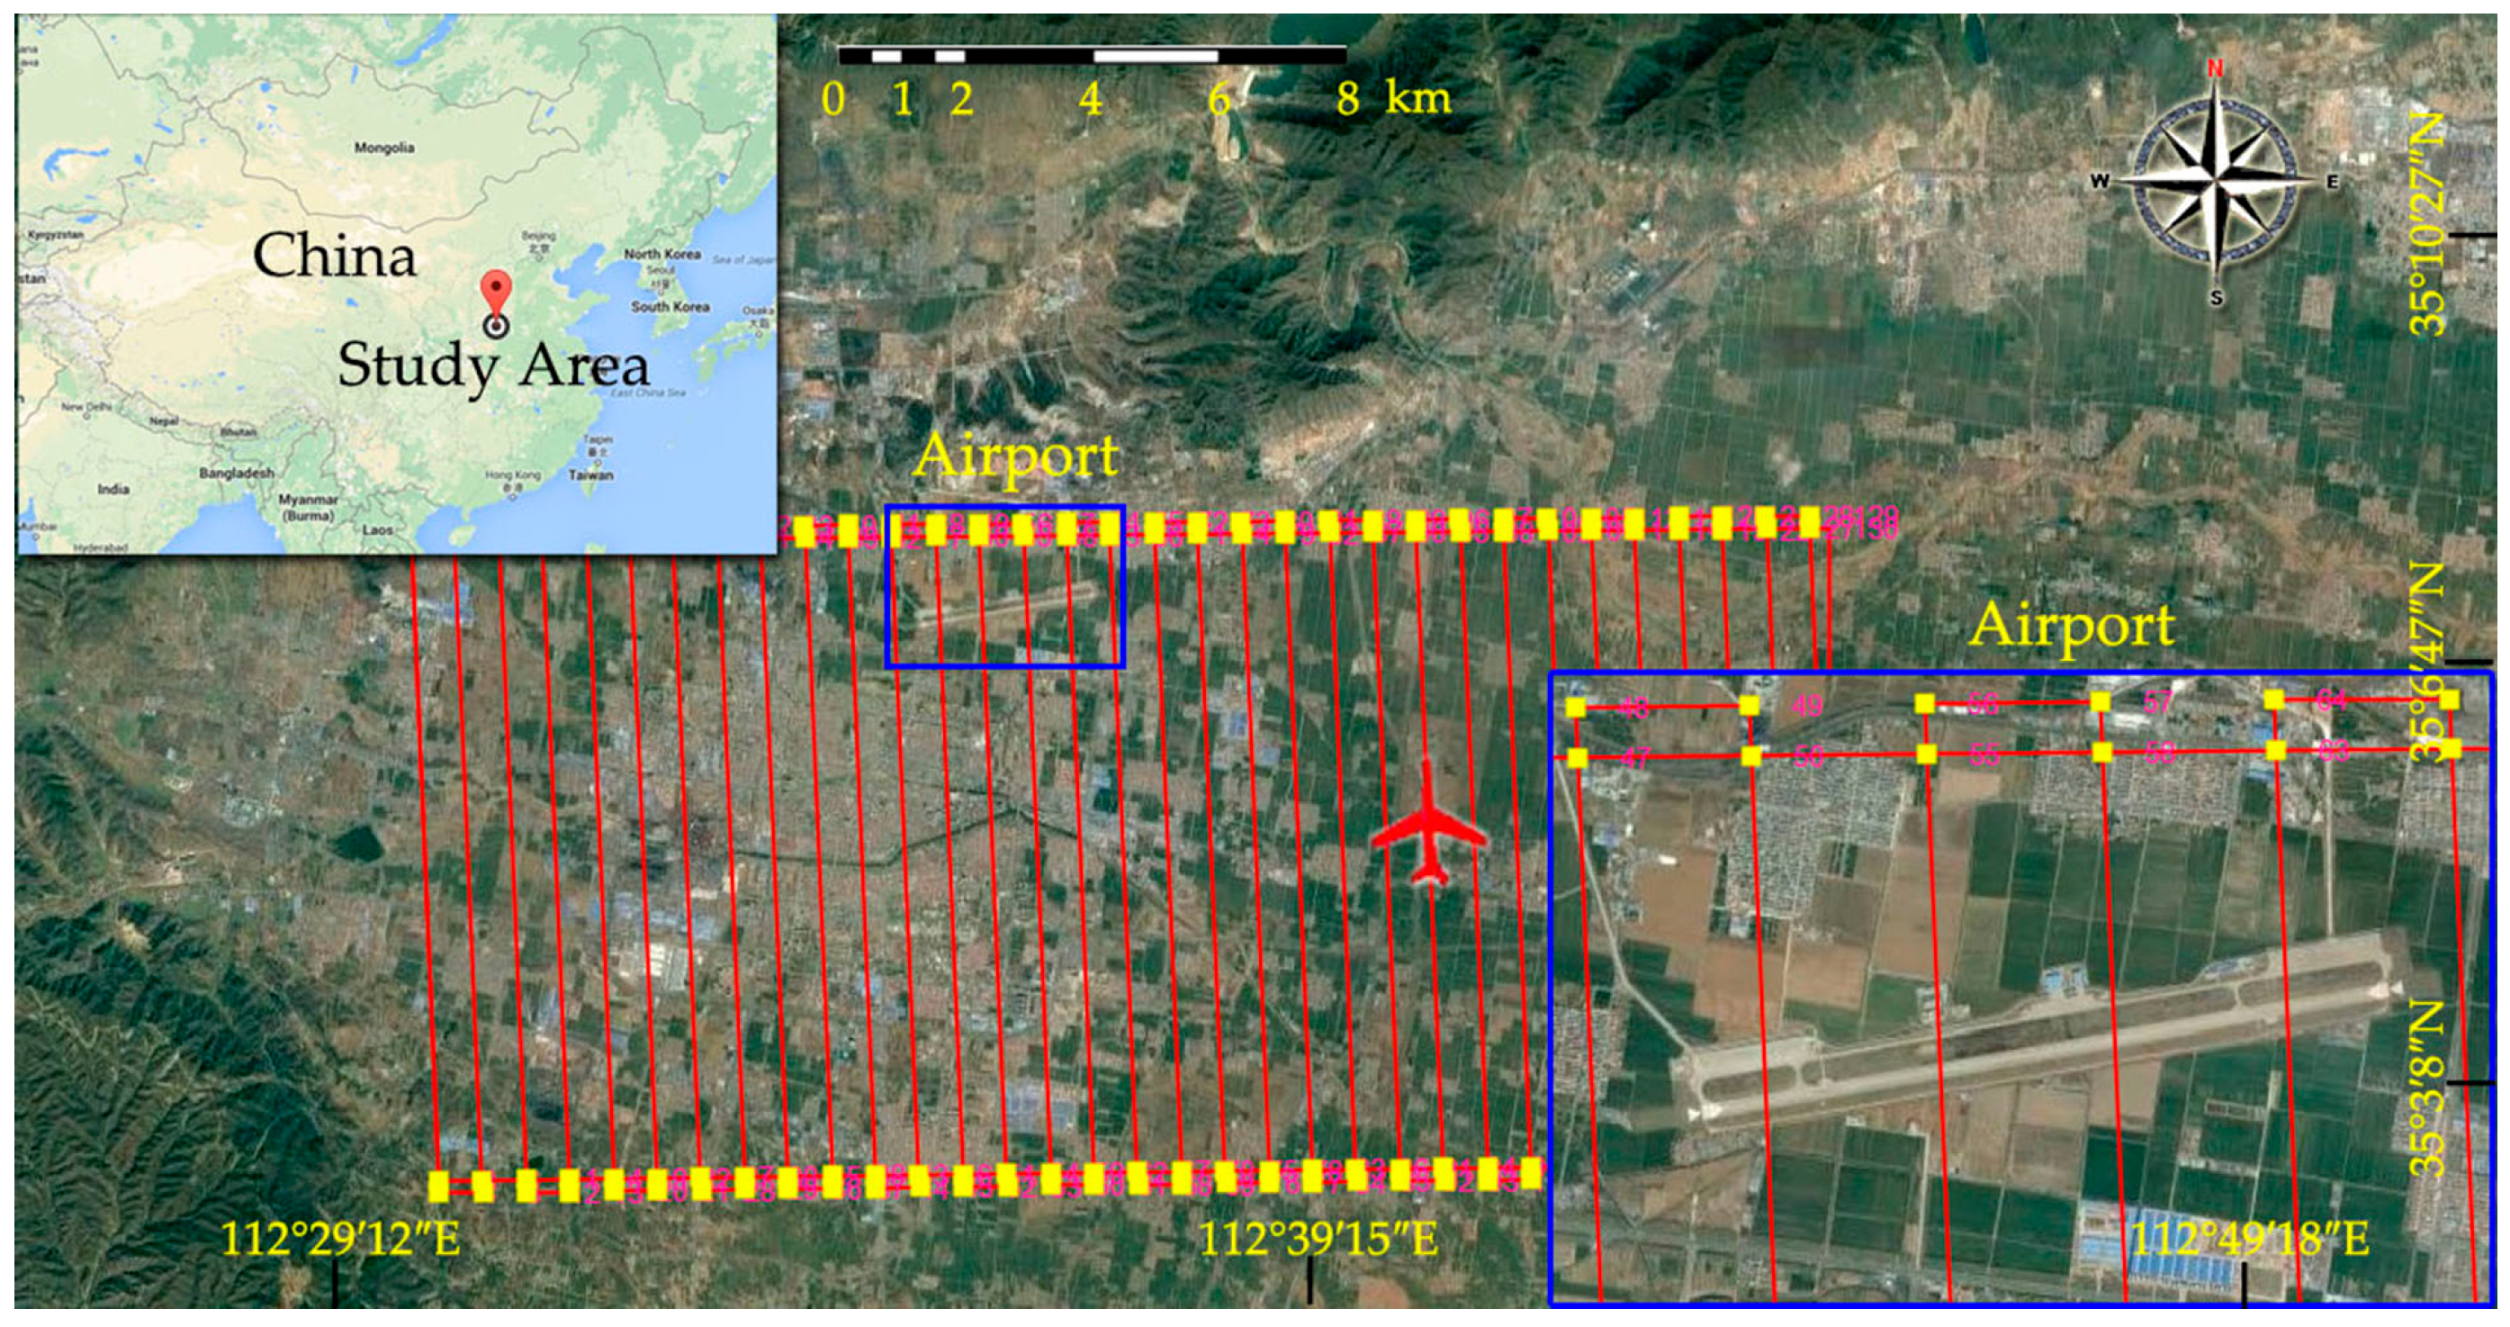
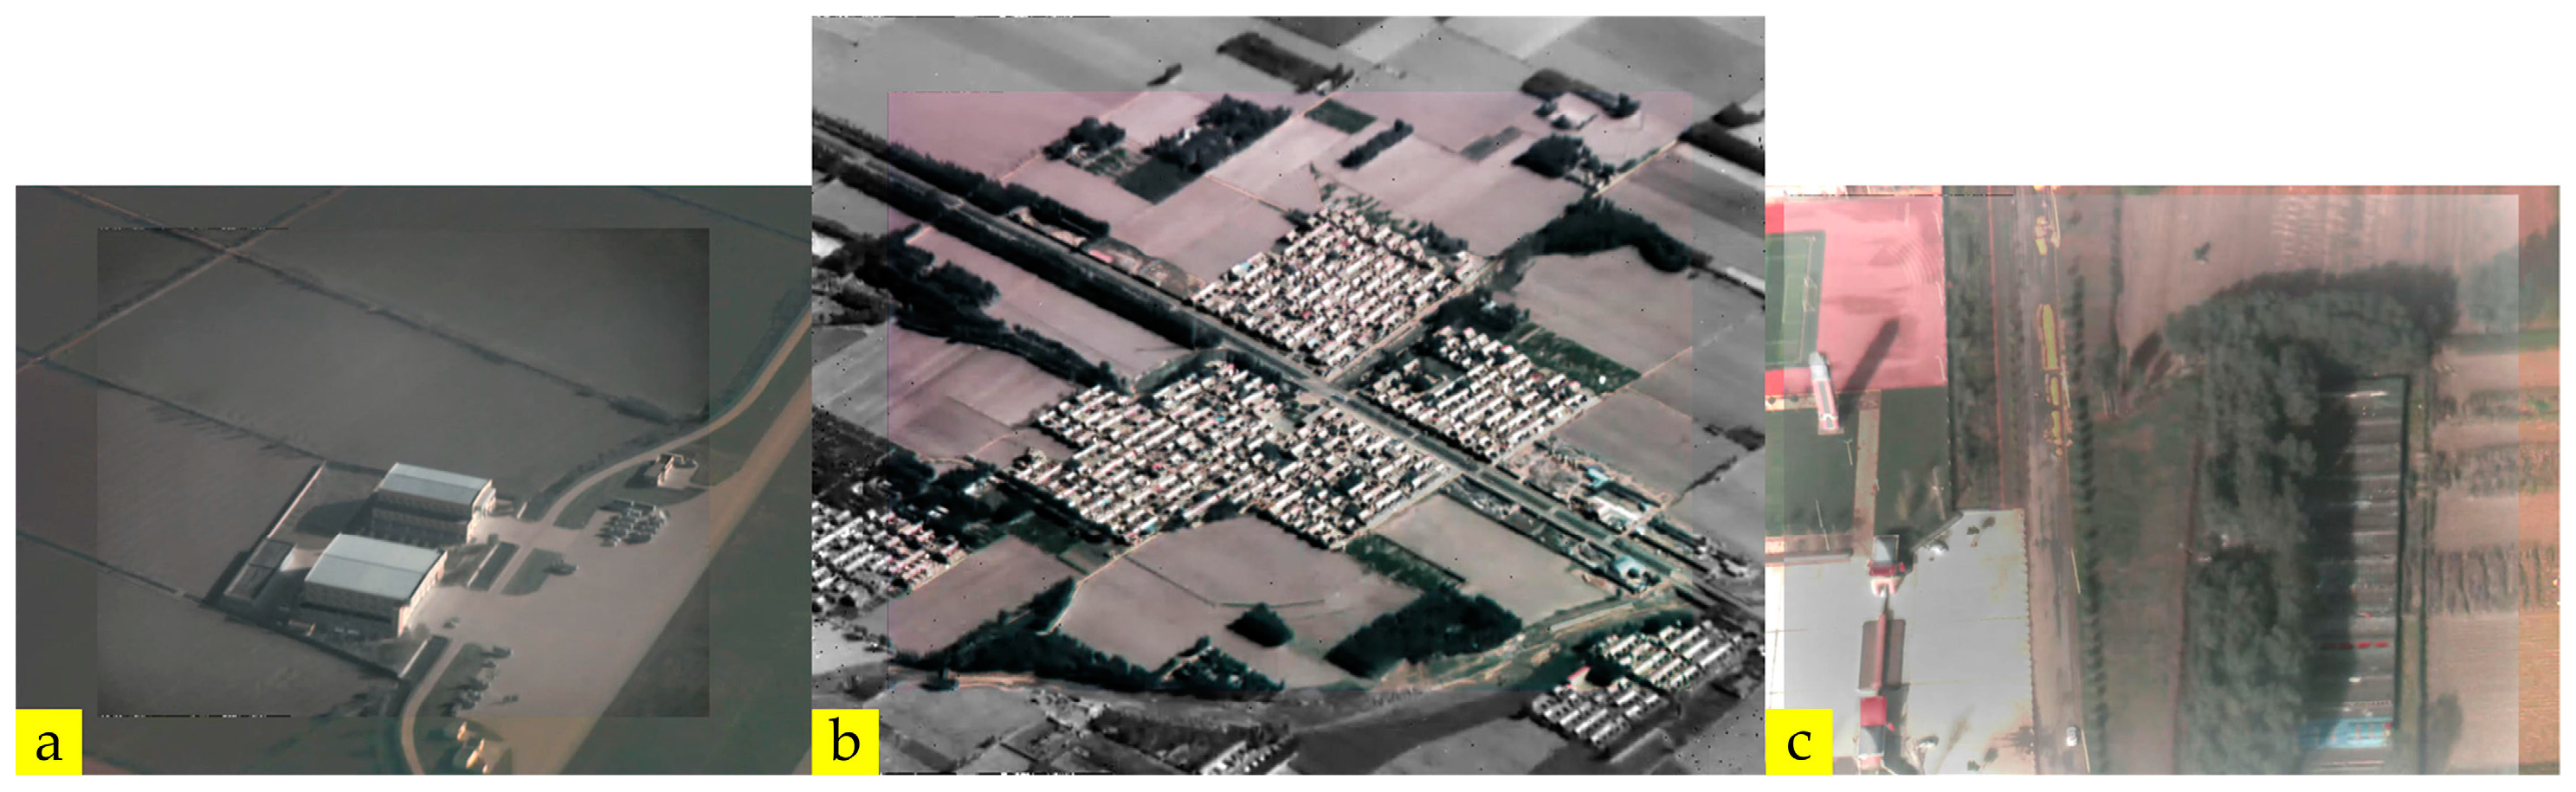
The study area is located inland in Eastern China, as shown in Figure 11. The main types of landforms include cities, villages, and open fields. After performing a number of flights, a database that includes one hundred hours of visible light and infrared videos and metadata was established.
3.2. Spatial Geometry-Based Scale Calculation
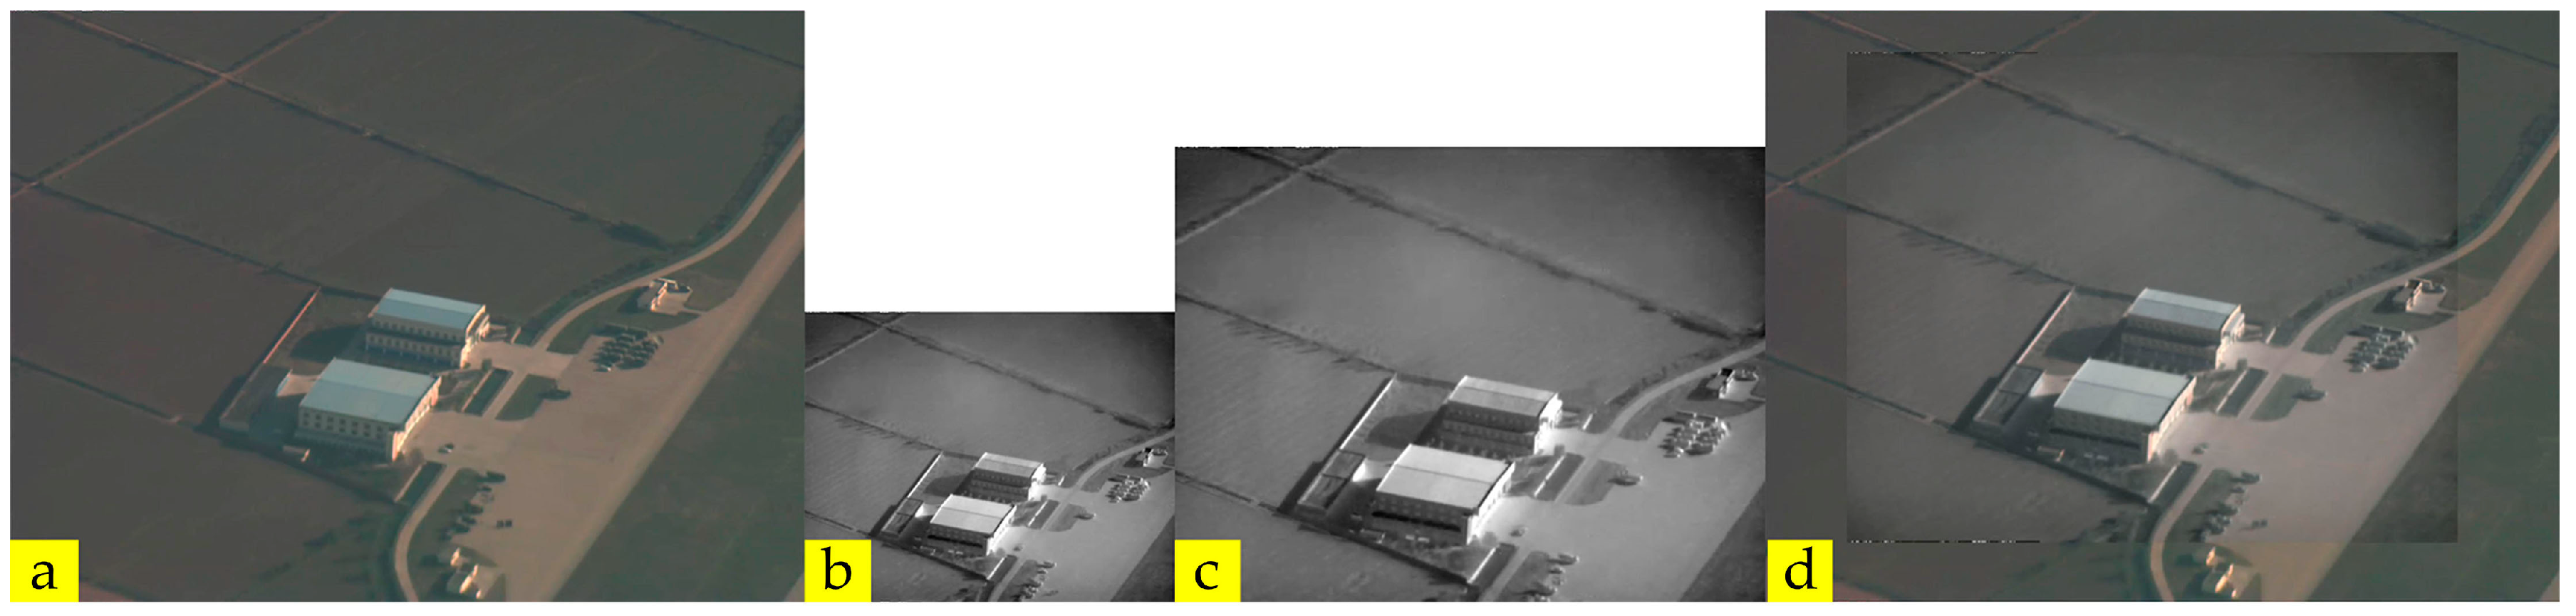
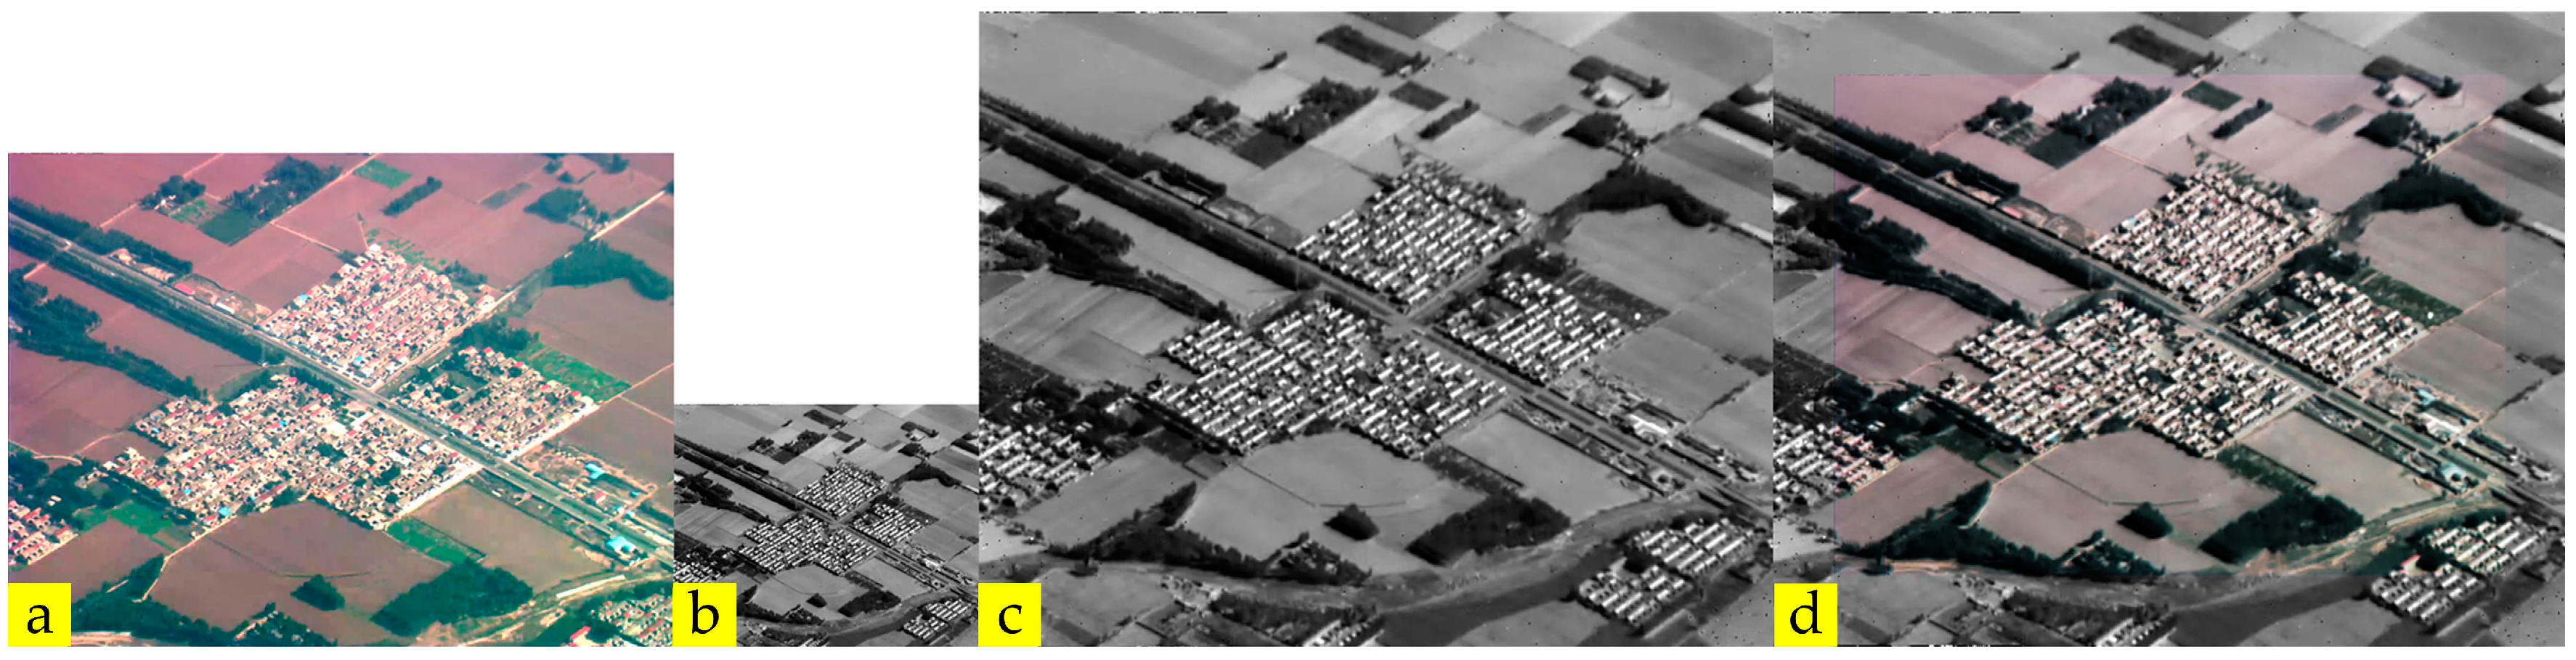
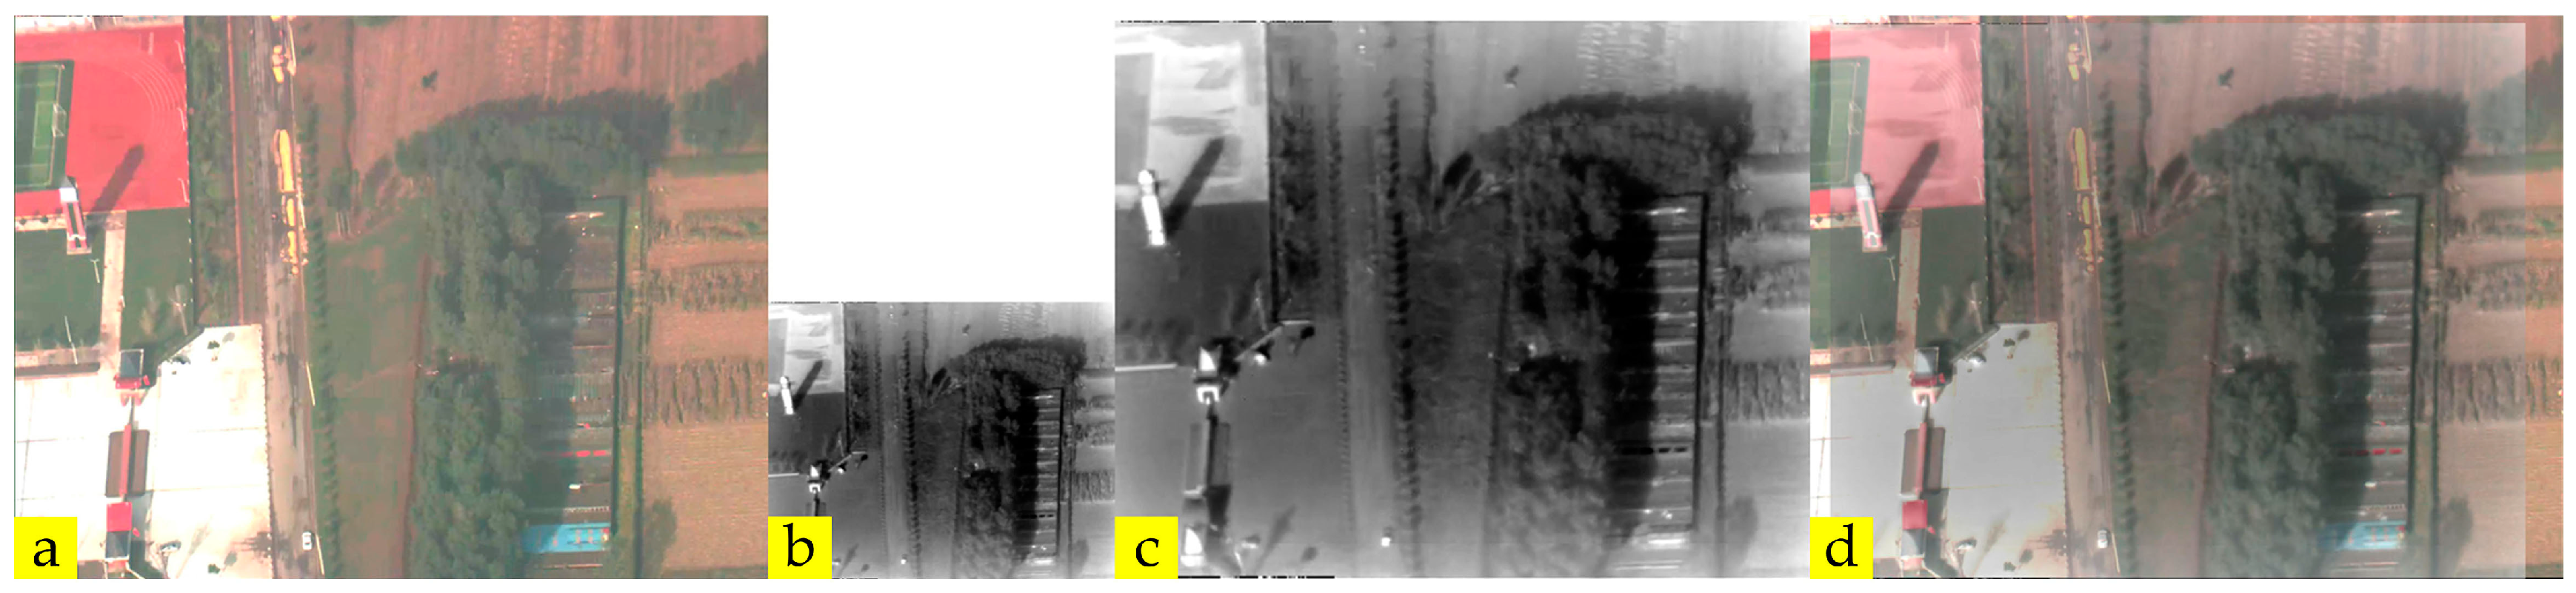
According to Section 2.3.2, the scale transformation from the infrared image to the visible image is determined by pixel size and focal length of the two sensors. In the visible light and infrared integrated camera, the focal length of the visible light sensor can be varied continuously in a certain range, whereas the focal length of the infrared sensor has only two fixed values of 540 mm and 135 mm. In this section, three experiments with different focal lengthsare designed to test the performance of the spatial geometry-based scale calculation. The source data are shown in Table 4, and the results are shown in Table 5 and Figure 12, Figure 13 and Figure 14.
In Figure 12, Figure 13 and Figure 14, Figure 12c, Figure 13c and Figure 14c are the scale-transformed result of Figure 12b, Figure 13b and Figure 14b, respectively, which could be obtained with Equation (10) in Section 2.3.2. Based on the artificial registration of Figure 12a, Figure 13a, Figure 14a and Figure 12c, Figure 13c, Figure 14c, the fusion images of Figure 12d, Figure 13d, Figure 14d are obtained with Equation (35), with and , which represent R, G, and B channels of the visible image and infrared image and with representing the responding channel of the fusion image.
According to the fusion results, the two images maintain consistency in shape and size, as indicated by the clarity and lack of aliasing in the overlapping pixels. This result proves the validity of the spatial geometry-based scale calculation.
3.3. Coordinate Transformation-Based Coarse Translation Estimation
After scale calculation, the infrared image is converted to the same plane of the visible image. According to Section 2.4, coarse translation estimation can calculate the translation from the infrared scale-transformed image to the original visible image . Then, the infrared image after coarse translation transformation can be obtained with Equation (36).
Figure 15 shows the fusion image of the coarse translation-transformed infrared image and the original visible image obtained with Equation (36).
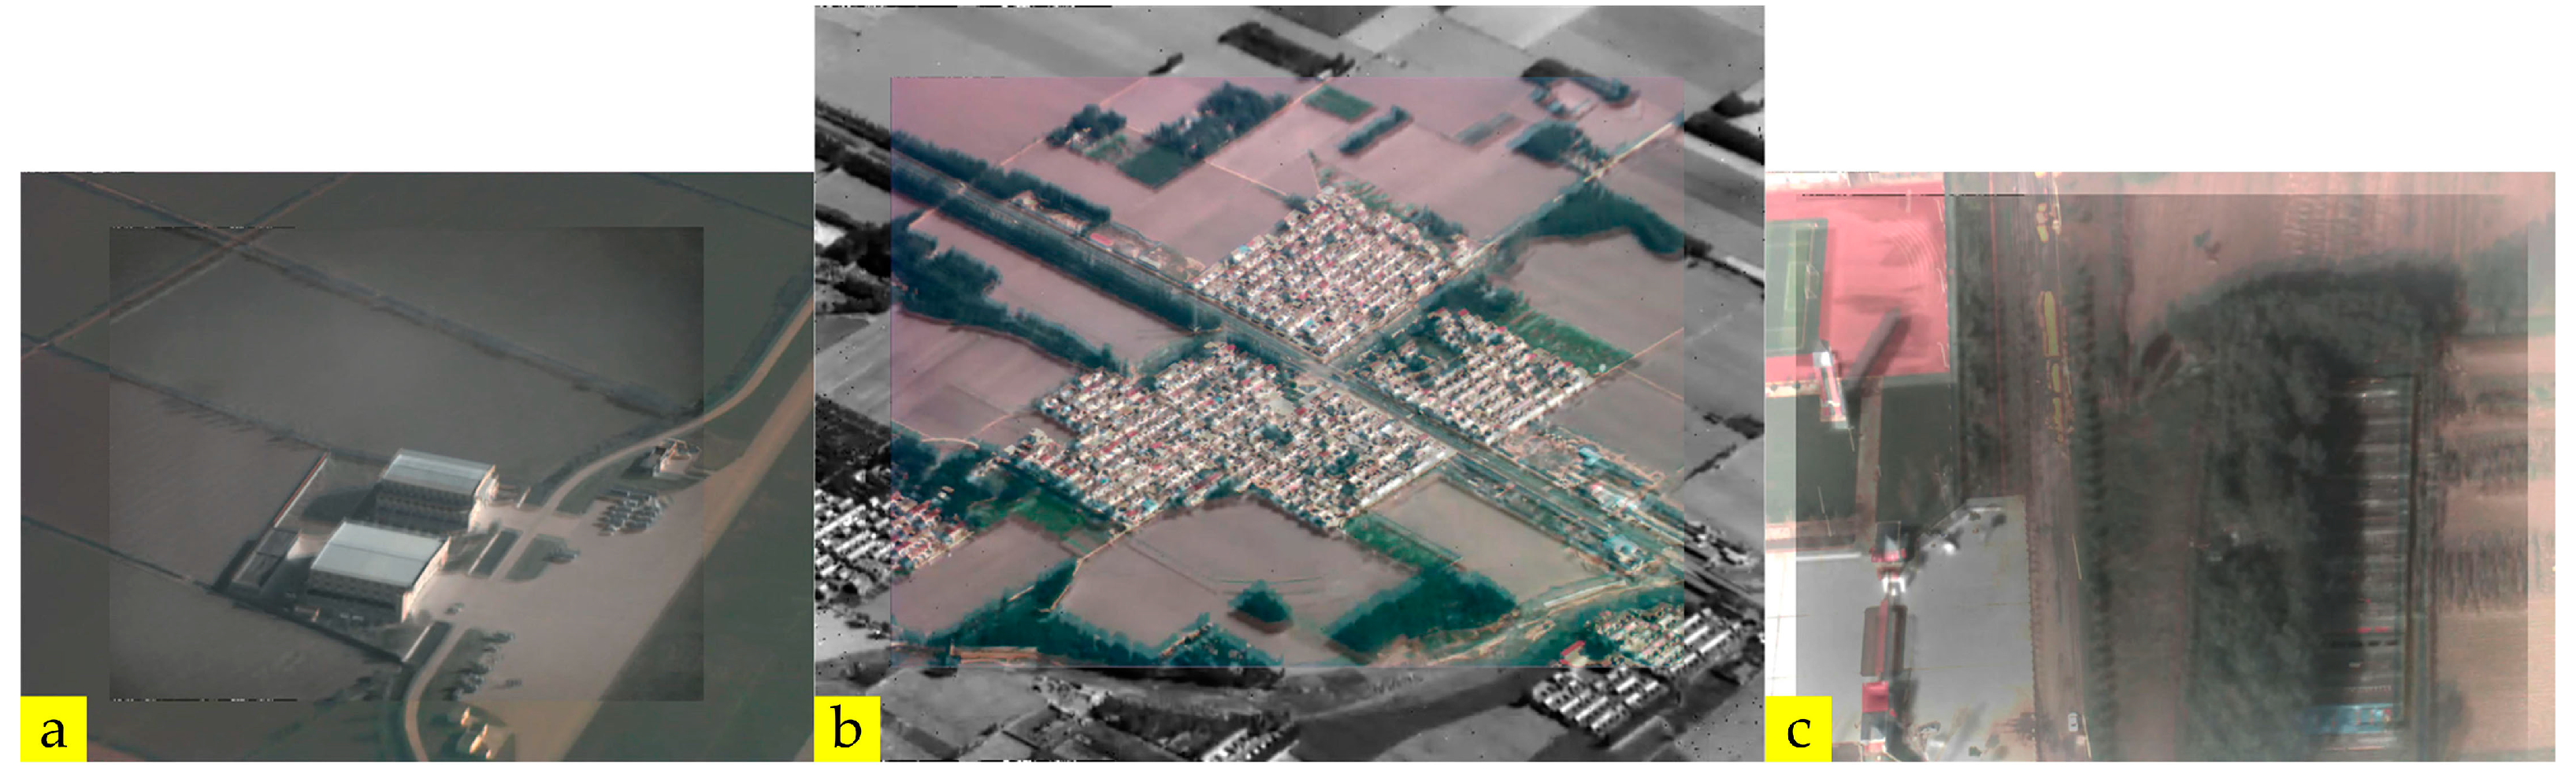
3.4. Image Edge-Based Translation Estimation
Precise translation estimation is performed based on image edge features to achieve an accurate registration. In such estimation, the coarse translation-transformed infrared image is converted to the precise translation-transformed image with Equation (37).
where can be obtained following the description in Section 2.5.
Figure 16 shows the fusion image of the precise translation-transformed infrared image and the original visible image obtained with Equation (37).
Comparing Figure 15 and Figure 16 indicates that the fusion image based on precise translation is better than the fusion image based on coarse translation because of its clear edges in the overlapping region and absence of aliasing. As indicated in Table 7, image registration accuracy is significantly improved.
3.5. PCNN- and NSCT-Based Image Fusion
3.5.1. Fusion of Visible Image and Low Spatial Infrared Image
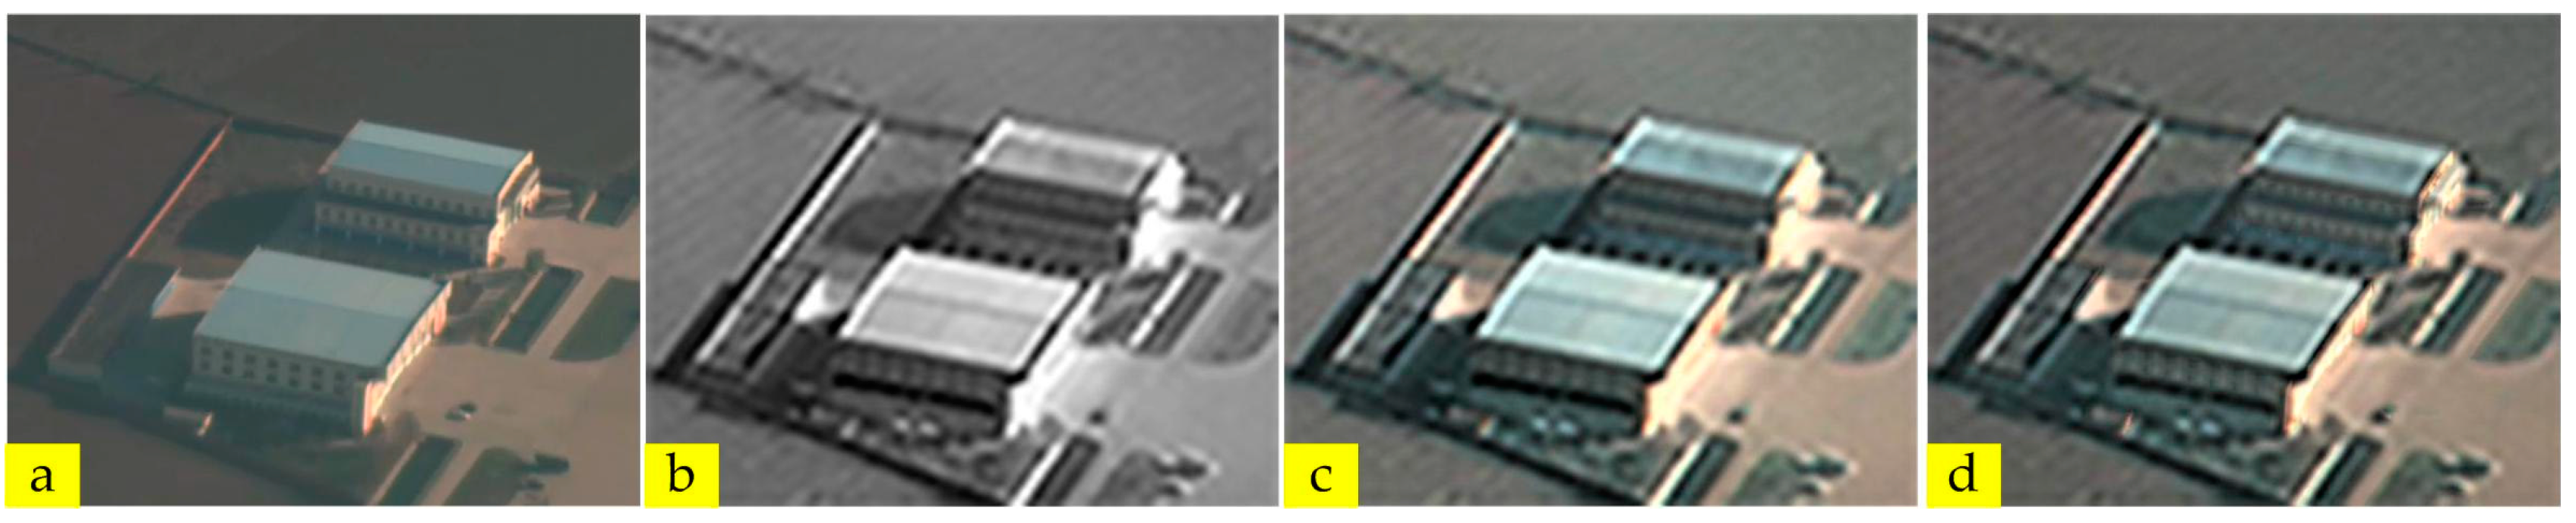
When the spatial resolution of the infrared image (Figure 17b) is low, the method of directly replacing the I channel of the visible image (Figure 17a) with the infrared image causes the spatial resolution of the fusion image to decline (Figure 17c). The proposed NSCT- and PCNN-based method can generate a fusion image with satisfactory spatial resolution (Figure 17d). As shown in Figure 17, the spatial resolution of Figure 17 dis higher than that of Figure 17c.
3.5.2. Fusion of Interesting Areas
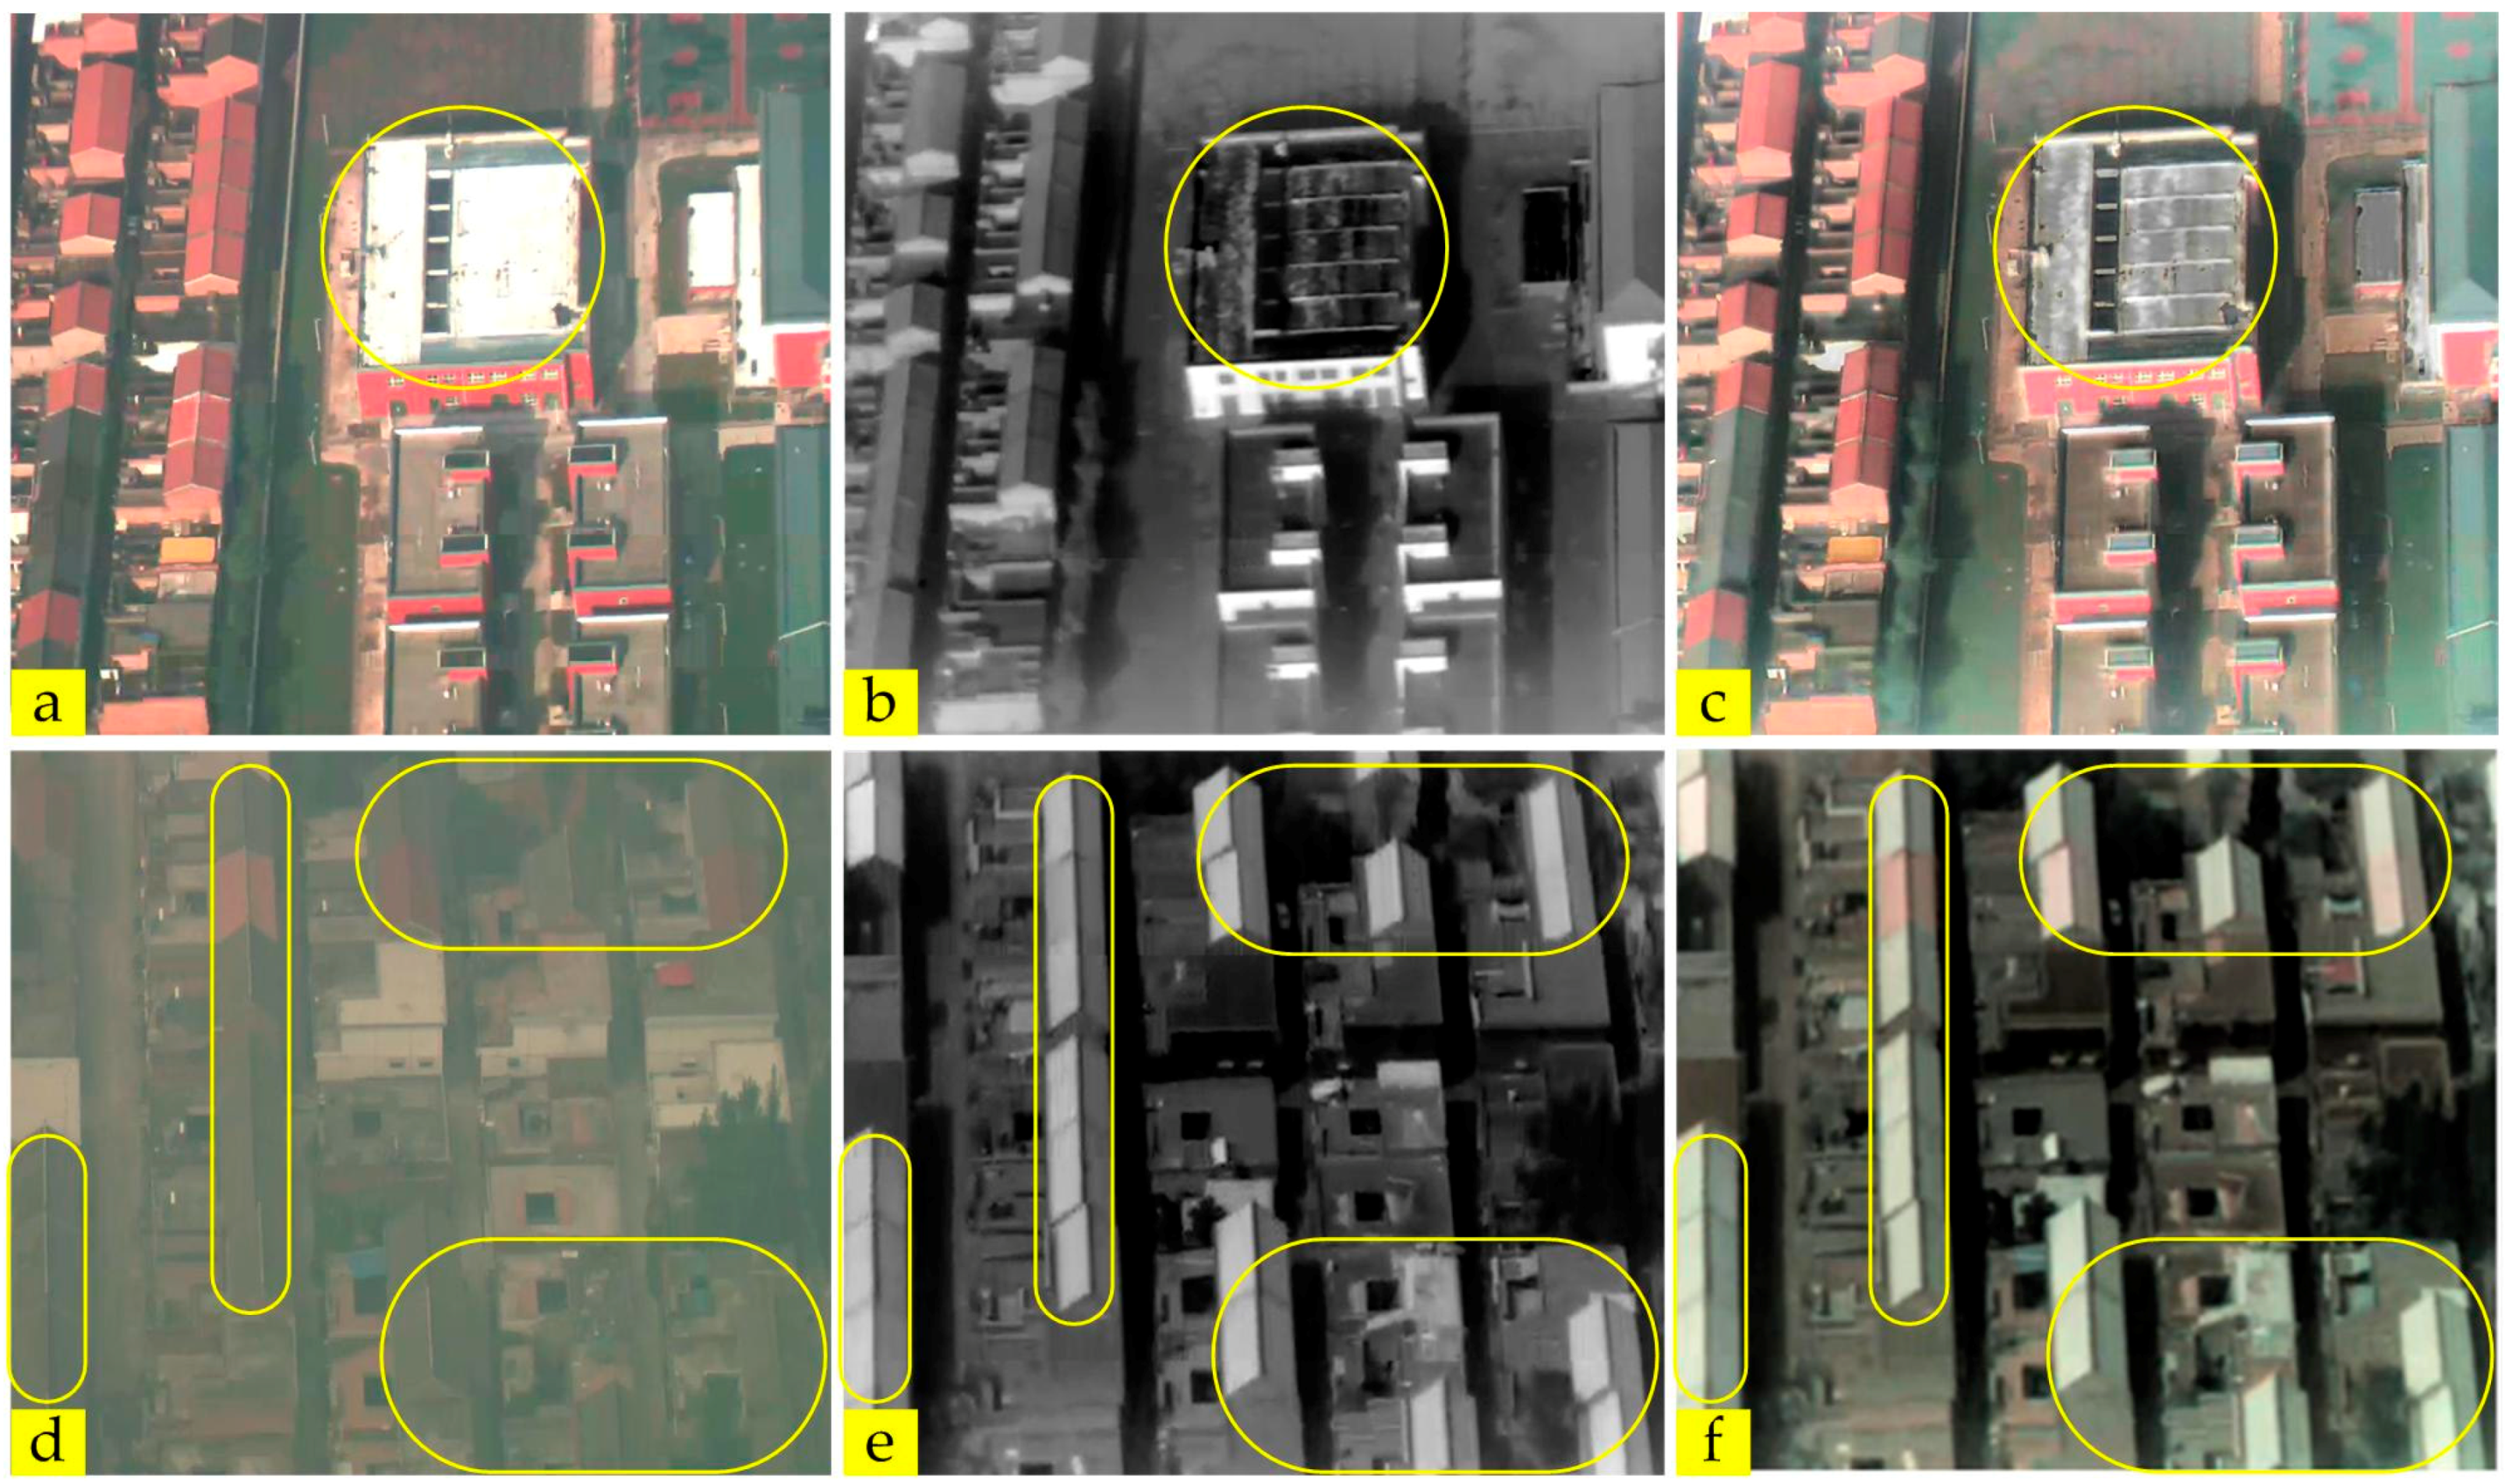
Another important purpose of image fusion is to highlight target information. Figure 18 shows the saliency analysis between the original image and the fusion image in two scenes. Figure 18a,b,d,e shows the original images. Figure 18c,f shows the fusion results of the proposed method. The yellow frame area represents the low salient areas in the visible image. The fusion results show that these areas become increasingly salient.
3.6. Performance Analysis
3.6.1. Performance Analysis of Image Registration
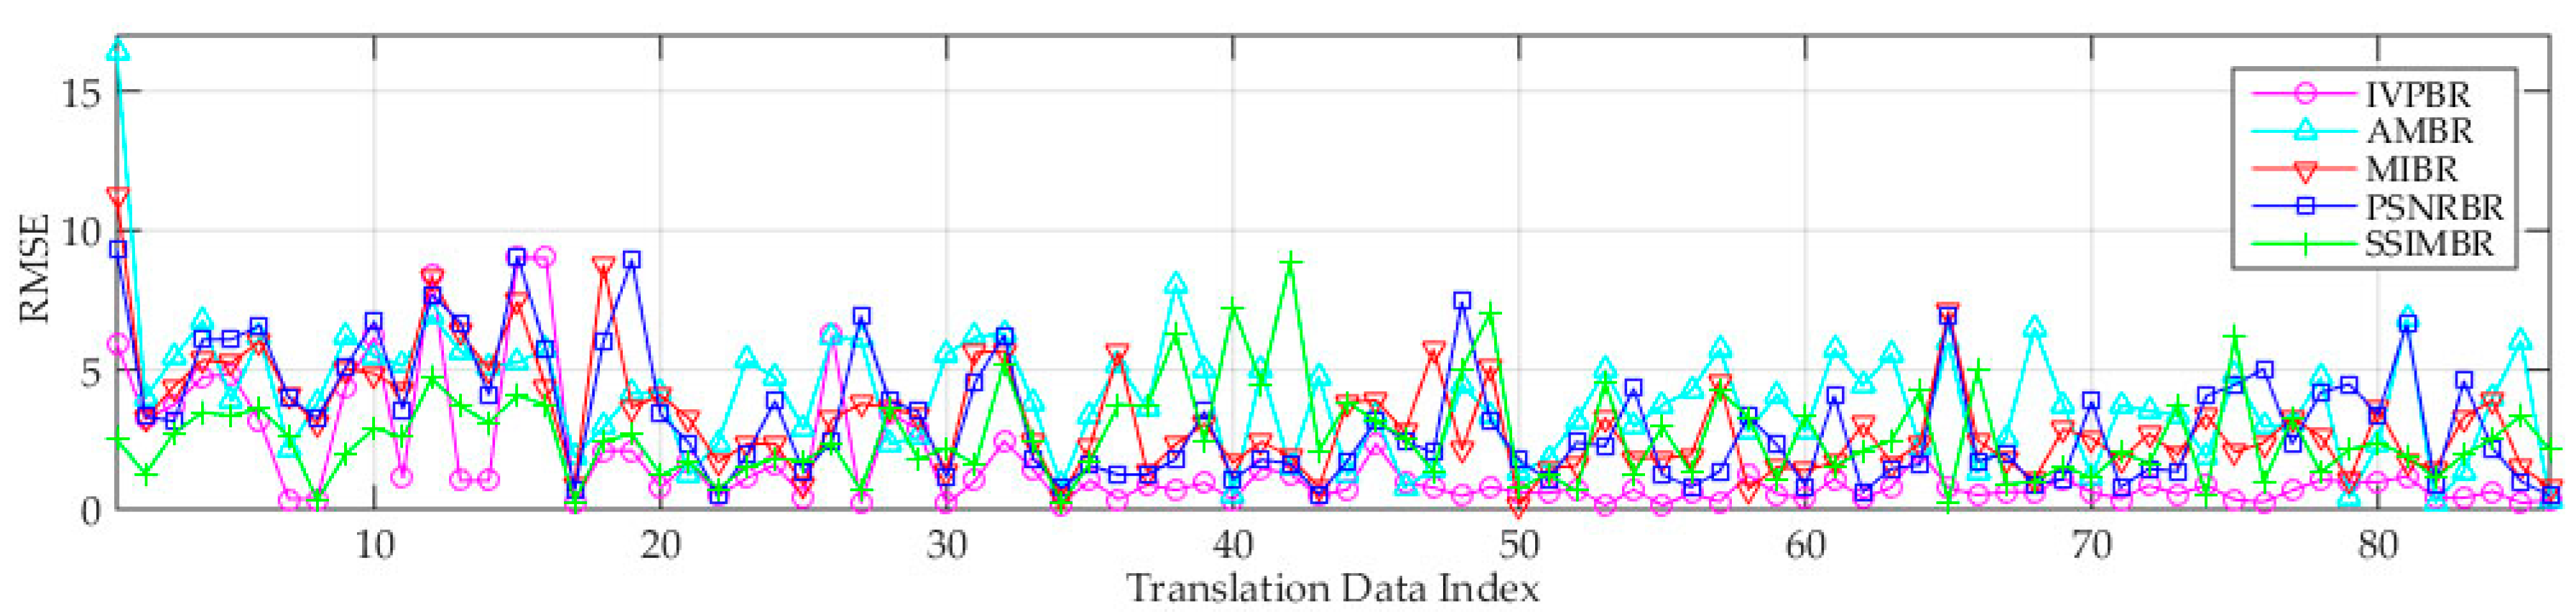
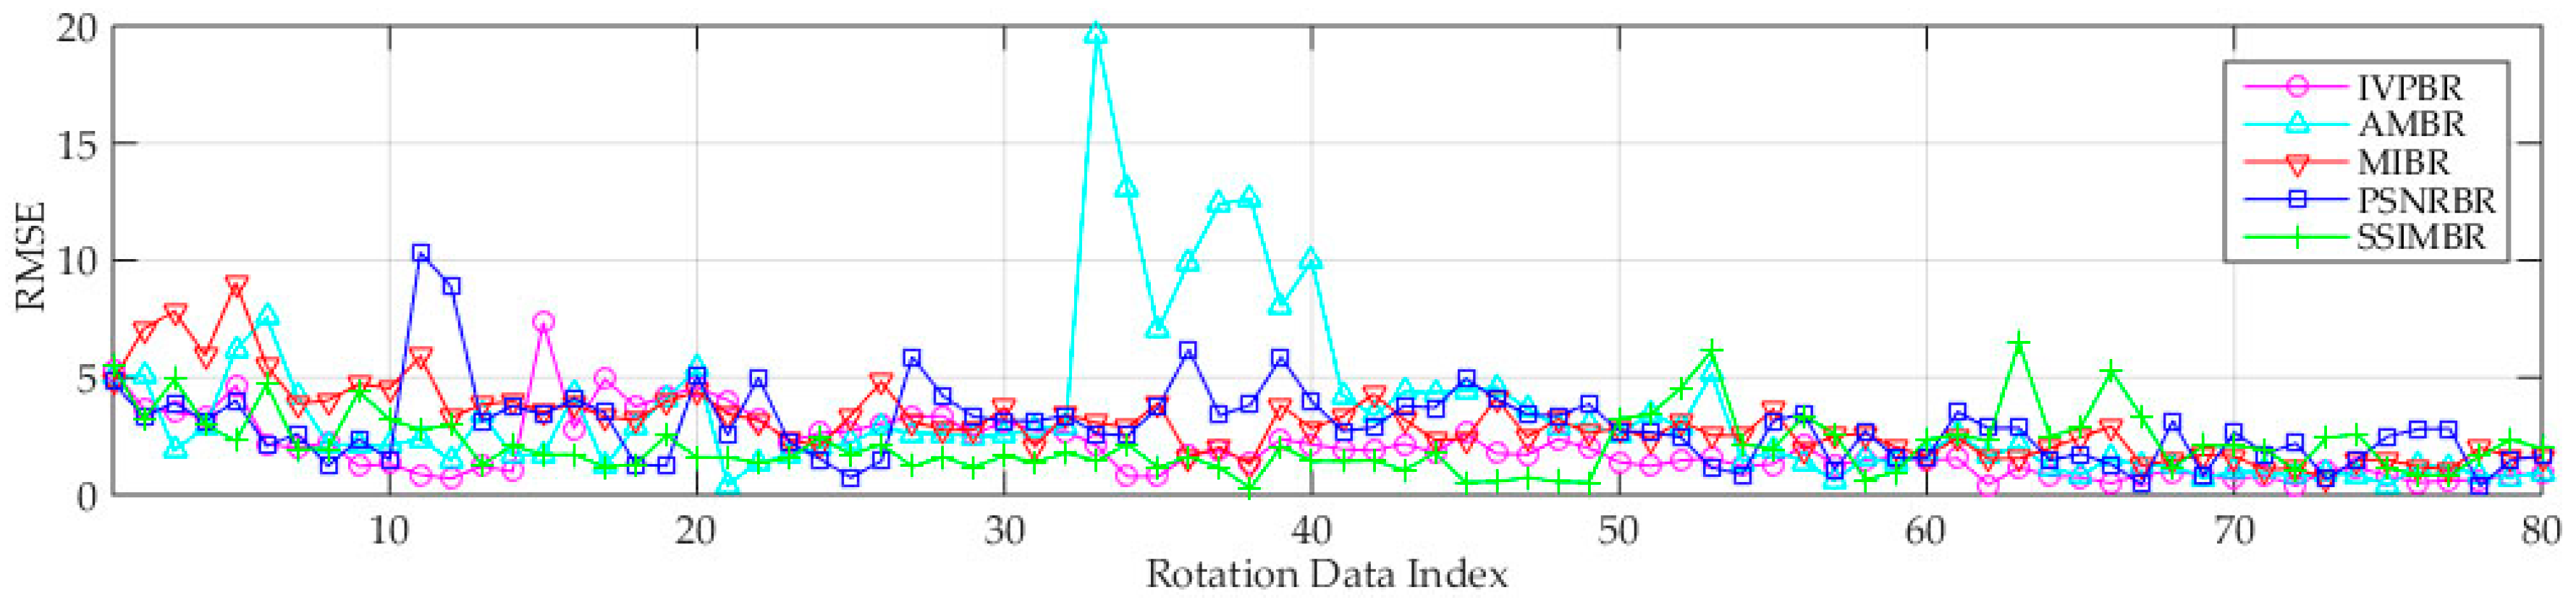
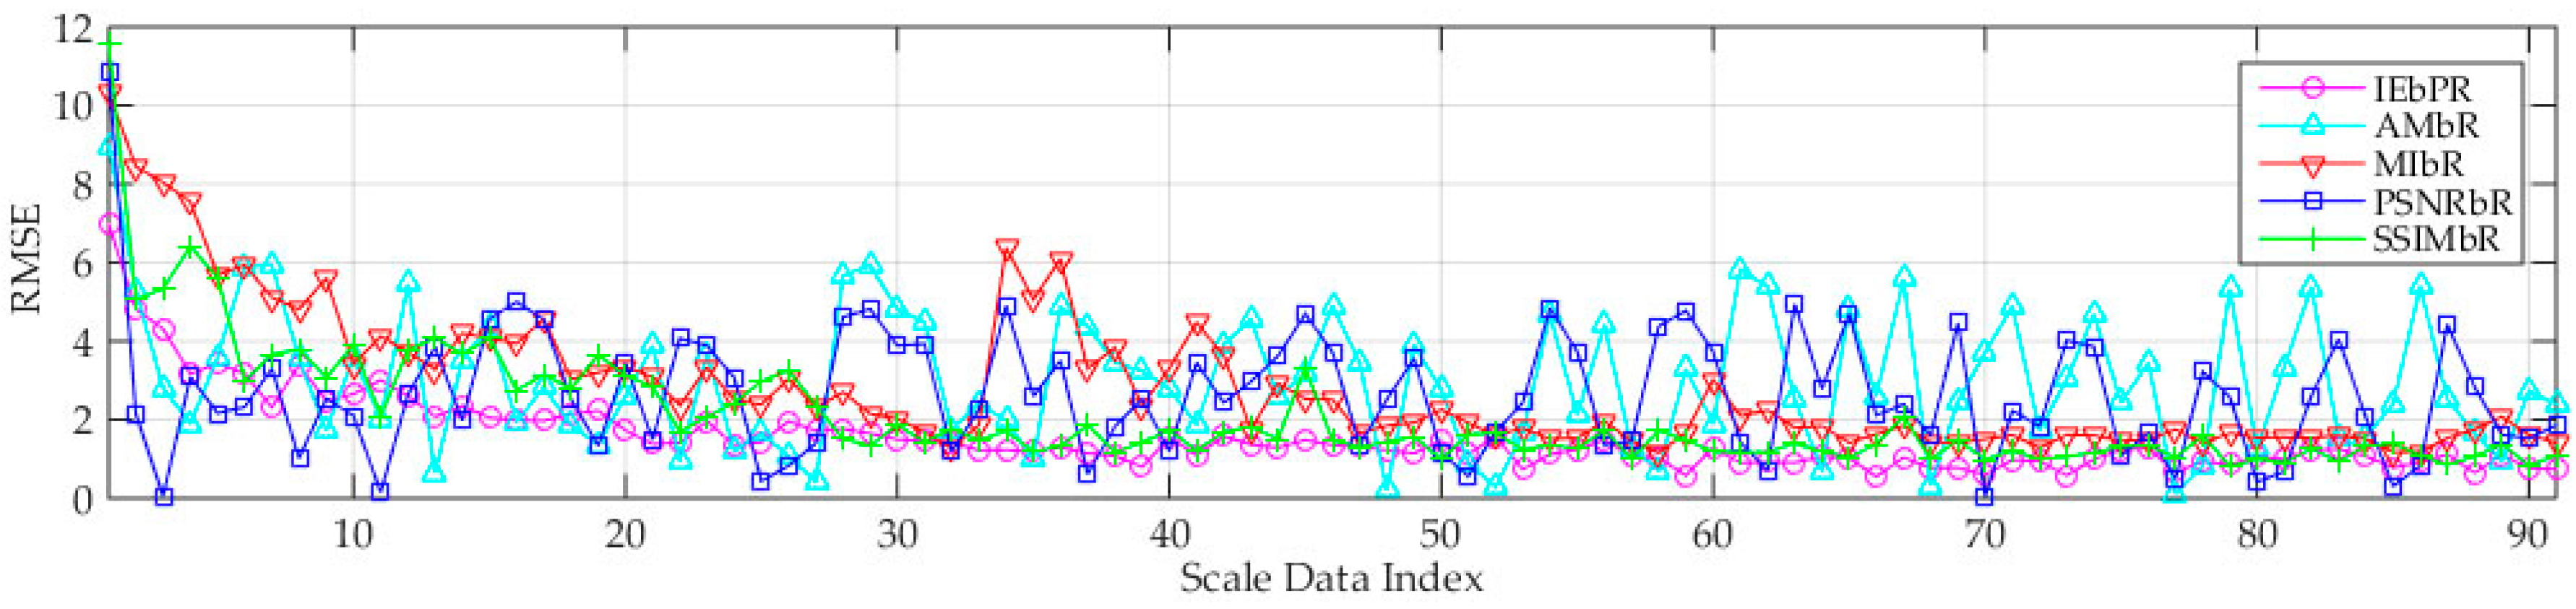
In the performance test experiments, we choose 257 groups of images and corresponding metadata with three typical types of motions: translation, rotation, and scale. Based on the result of the scale transformation, we tested the performance of the five methods: the proposed method of integrated parallel vision-based registration (IPVBR), alignment metric-based registration (AMBR) [32], mutual information-based registration (MIBR) [16], peak signal-to-noise ratio-based registration (PSNRBR), and structural similarity-based registration (SSIMBR). PSNRBR and SSIMBR are two registration methods that use PSNR and SSIM as the similarity standard [65].
Under each motion condition, the values of root mean square error (RMSE) are calculated using Equation (38):
where the measurement error denotes the pixel distance from the corresponding calculated matching point to the actual matching point in the visible image. The error analysis results of the three experiments are shown in Figure 19, Figure 20 and Figure 21.
The average RMSE values of the five methods in the three experiments are shown in Table 8.
As shown in Figure 19, Figure 20 and Figure 21, the RMSE curve of IPVBR remains stable and low. The four other curves present different performances. The curve of SSIMBR presents good performance in Experiments 2 and 3, but it shows high vibration in Experiment 1. The curve of PSNRBR always maintains a certain vibration in Experiments1 and 3. The curve of AMBR indicates some high errors in Experiment 2 and presents high vibrations in Experiments 1 and 3. The curve of MIBR shows no good or bad performance. As shown in Table 8, the proposed IPVBR achieves the minimum average RMSE in the three experiments. SSIMBP also has a low average RMSE, along with IPVBR.
Three points can be concluded from these three experiments.
- Compared with the four other methods, the proposed IPVBR presents a stable and low MSER. This result shows the high stability and precision of the proposed method.
- SSIMBP is better than PSNRBP, which indicates that structure information is more reliable than pixel information for multimodal image registration.
- The two representative conventional methods of AMBR and MIBR fail to achieve good results under the three motion conditions for medium-altitude UAV applications.
Three experiments are conducted based on the fact that all five algorithms can obtain nearly correct results. In some cases, the compared image-based algorithms fail to solve the perspective transform, and the proposed edge feature extraction and matching method is effective in translation calculation. At this point, the result reflects the obvious advantages of the proposed method.
3.6.2. Performance Analysis of Image Fusion
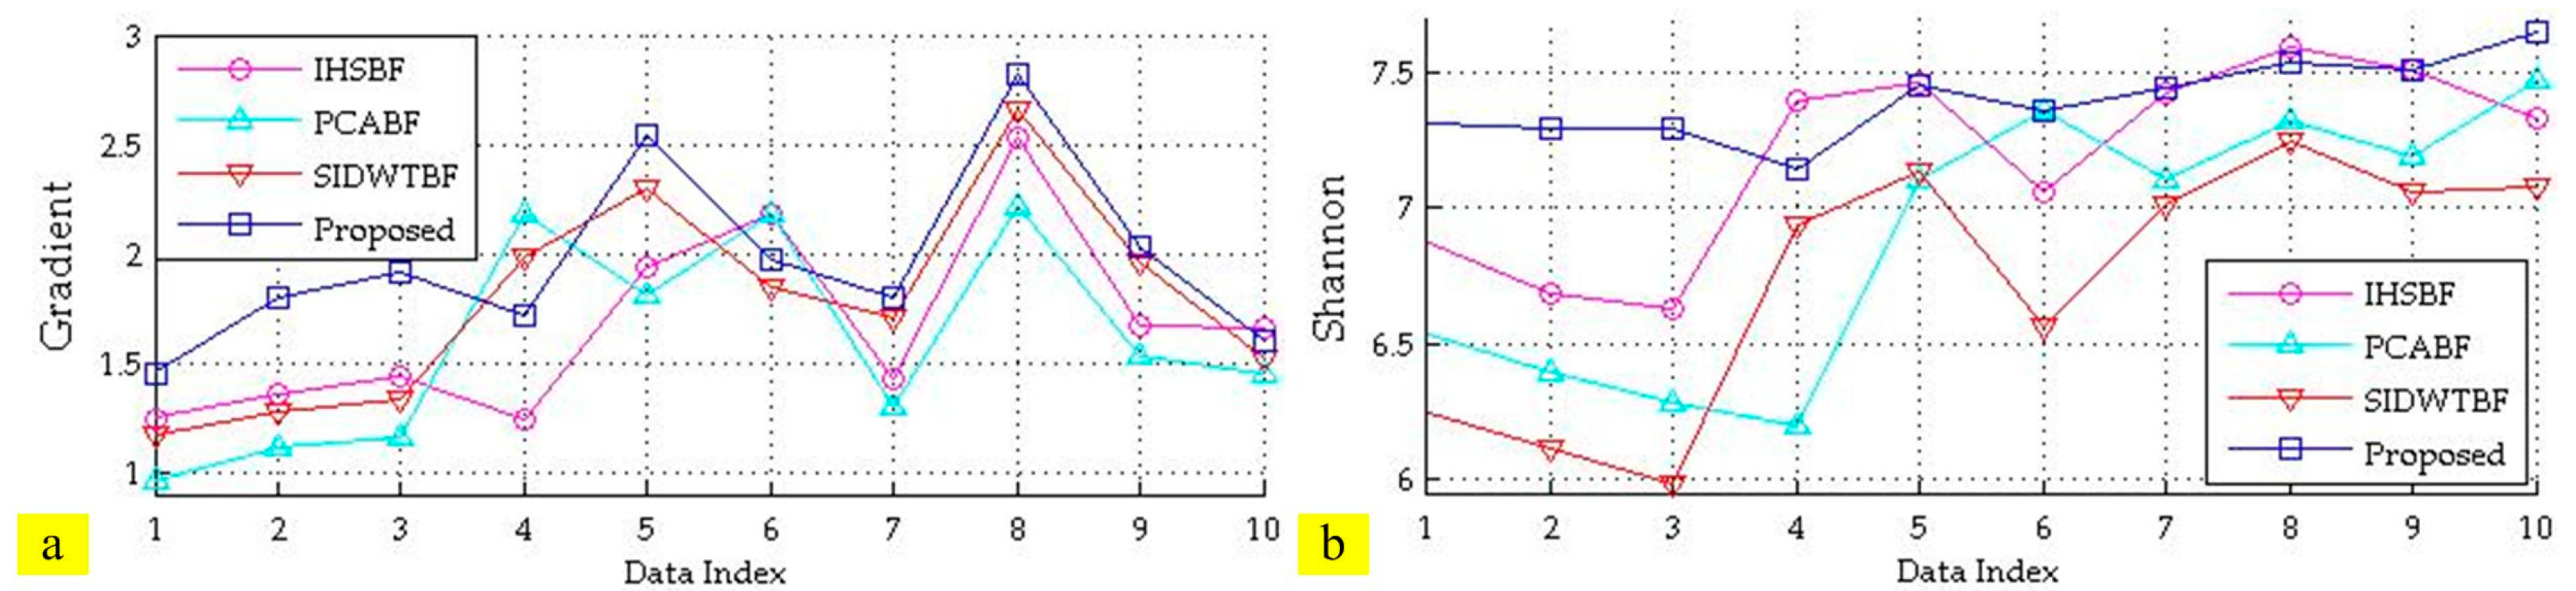
To analyze the performance, this study introduces three other methods: IHS transform-based fusion (IHSBF), PCA-based fusion (PCABF) [66], and SIDWT-based fusion (SIDWTBF) [67]. These methods are compared with the proposed method in the experiment.
Using 10 sets of visible and infrared images of different scenes as the experiment data, we select the average gradient (Equation (39)) and Shannon value (Equation (40)) as the evaluation indexes of the four methods. The average gradient can sensitively reflect the ability of the image to express the smallest details and can be used to evaluate the clarity of the image. A high average gradient equates to a clear image. A high Shannon value equates to a large amount of information in the image:
where denotes the pixel value at and denotes the image resolution.
where represents a sample in the image and represents the probability of the sample.
The average gradient and Shannon results are shown in Figure 22, and the average values of the four image fusion methods are listed in Table 9.
As shown in Figure 22a,b, the two group curves of our method are high and stable. Table 9 shows that the average values of our method are higher than those of the other three methods. The results also show that the fusion image obtained by our method has higher contrast, better details, and more information than the images obtained with the other methods.
4. Conclusions
Visible and infrared image registration is a difficult problem in medium-altitude UAVs because of different imaging mechanisms, poor image quality, and large amounts of motion in videos. For the special requirements of UAV applications, an appropriate image fusion method becomes a key technology.
This study proposed a novel image registration method that uses both metadata and image based on the imaging characteristic analysis of the most common visible light and infrared integrated camera. The main contributions of this work are reflected in three aspects. First, we reveal the principle of long-distance integrated parallel vision, which provides the theoretical foundation of the conversion from a perspective transformation to scale and translation transformations. Second, two new algorithms for scale calculation and coarse translation estimation are presented using the image metadata of the UAV system according to spatial geometry and coordinate transformation. Third, an edge distance field-based registration is proposed in precise translation estimation to solve the non-strict edge alignment of the visible image and infrared image. A searching algorithm based on PSO is also put forward to improve efficiency. In image fusion, this study designs a new method based on PCNN and NSCT. This method can meet the four requirements of preserving color information, adding infrared brightness information, improving spatial resolution, and highlighting target areas for UAV applications.
A medium-altitude UAV is employed to collect experimental data, including three typical groups of translation, rotation, and scale. Results show that the proposed method achieves encouraging performance in image registration and fusion. These results can be applied to other medium-altitude or high-altitude UAVs with a similar system structure. However, future work should focus on analysis and experiments, such as the improved transformation of edge distance field and real time optimization of image fusion.
Acknowledgments
This work was supported by the National Key Research and Development Project (No. 2016YFB1200100) and the National Natural Science Foundation of China (No. 61601014).
Author Contributions
Hongguang Li wrote the program and the manuscript. Wenrui Ding and Xianbin Cao revised the paper. Chunlei Liu performed the experiments and analyzed the data.
Conflicts of Interest
The authors declare no conflict of interest.
References
- Deren, L.I. On space-air-ground integrated earth observation network. J. Geo-Inf. Sci. 2012, 14, 419–425. [Google Scholar]
- Zhao, J.; Zhou, Q.; Chen, Y.; Feng, H.; Xu, Z.; Li, Q. Fusion of visible and infrared images using saliency analysis and detail preserving based image decomposition. Infrared Phys. Technol. 2013, 56, 93–99. [Google Scholar] [CrossRef]
- Zhou, D.; Zhong, Z.; Zhang, D.; Shen, L.; Yan, C. Autonomous landing of a helicopter UAV with a ground-based multisensory fusion system. In Proceedings of the International Conference on Machine Vision, Koto-ku, Japan, 18–22 May 2015. [Google Scholar]
- Ulusoy, I.; Yuruk, H. New method for the fusion of complementary information from infrared and visual images for object detection. IET Image Process. 2011, 5, 36–48. [Google Scholar] [CrossRef]
- Niu, Y.F.; Xu, S.T.; Hu, W.D. Fusion of infrared and visible image based on target regions for environment perception. Appl. Mech. Mater. 2011, 128–129, 589–593. [Google Scholar] [CrossRef]
- Pulpea, B.G. Aspects regarding the development of pyrotechnic obscurant systems for visible and infrared protection of military vehicles. In Proceedings of the International Conference Knowledge-Based Organization, Land Forces Academy, Sibiu, Romania, 11–13 June 2015; pp. 731–736. [Google Scholar]
- Teng, H.; Viscarra Rossel, R.A.; Shi, Z.; Behrens, T.; Chappell, A.; Bui, E. Assimilating satellite imagery and visible-near infrared spectroscopy to model and map soil loss by water erosion in australia. Environ. Model. Softw. 2016, 77, 156–167. [Google Scholar] [CrossRef]
- Peña, J.M.; Torres-Sánchez, J.; Serrano-Pérez, A.; de Castro, A.I.; López-Granados, F. Quantifying efficacy and limits of unmanned aerial vehicle (UAV) technology for weed seedling detection as affected by sensor resolution. Sensors 2015, 15, 5609–5626. [Google Scholar] [CrossRef] [PubMed]
- Chrétien, L.P.; Théau, J.; Ménard, P. Visible and thermal infrared remote sensing for the detection of white-tailed deer using an unmanned aerial system. Wildl. Soc. Bull. 2016, 40, 181–191. [Google Scholar] [CrossRef]
- Zhao, B.; Li, Z.; Liu, M.; Cao, W.; Liu, H. Infrared and visible imagery fusion based on region saliency detection for 24-h-surveillance systems. In Proceedings of the IEEE International Conference on Robotics and Biomimetics, Shenzhen, China, 12–14 December 2013; pp. 1083–1088. [Google Scholar]
- Wang, Q.; Yan, P.; Yuan, Y.; Li, X. Multi-spectral saliency detection. Pattern Recognit. Lett. 2013, 34, 34–41. [Google Scholar] [CrossRef]
- Wang, Q.; Zhu, G.; Yuan, Y. Multi-spectral dataset and its application in saliency detection. Comput. Vis. Image Underst. 2013, 117, 1748–1754. [Google Scholar] [CrossRef]
- Berenstein, R.; Hočevar, M.; Godeša, T.; Edan, Y.; Benshahar, O. Distance-dependent multimodal image registration for agriculture tasks. Sensors 2014, 15, 20845–20862. [Google Scholar] [CrossRef] [PubMed]
- Kaneko, S.I.; Murase, I.; Igarashi, S. Robust image registration by increment sign correlation. Pattern Recognit. 2010, 35, 2223–2234. [Google Scholar] [CrossRef]
- Tsin, Y.; Kanade, T. A correlation-based approach to robust point set registration. In Proceedings of the Computer Vision—ECCV 2004, European Conference on Computer Vision, Prague, Czech Republic, 11–14 May 2004; pp. 558–569. [Google Scholar]
- Zhuang, Y.; Gao, K.; Miu, X.; Han, L.; Gong, X. Infrared and visual image registration based on mutual information with a combined particle swarm optimization—Powell search algorithm. Optik—Int. J. Light Electron Opt. 2016, 127, 188–191. [Google Scholar] [CrossRef]
- Zhang, Z.; Yang, G.; Chen, D.; Li, J.; Yang, W. Registration of infrared and visual images based on phase grouping and mutual information of gradient orientation. In Proceedings of the SPIE Photonics Europe, Brussels, Belgium, 4–7 April 2016. [Google Scholar]
- Li, C.; Chen, Q. Ir and visible images registration method based on cross cumulative residual entropy. Proc. SPIE—Int. Soc. Opt. Eng. 2013, 8704, 145–223. [Google Scholar]
- Pohit, M.; Sharma, J. Image registration under translation and rotation in two-dimensional planes using fourier slice theorem. Appl. Opt. 2015, 54, 4514–4519. [Google Scholar] [CrossRef] [PubMed]
- Niu, H.; Chen, E.; Qi, L.; Guo, X. Image registration based on fractional fourier transform. Optik—Int. J. Light Electron Opt. 2015, 126, 3889–3893. [Google Scholar] [CrossRef]
- Li, H.; Zhang, A.; Hu, S. A registration scheme for multispectral systems using phase correlation and scale invariant feature matching. J. Sens. 2016, 2016, 1–9. [Google Scholar] [CrossRef]
- Wang, Q.; Zou, C.; Yuan, Y.; Lu, H.; Yan, P. Image registration by normalized mapping. Neurocomputing 2013, 101, 181–189. [Google Scholar] [CrossRef]
- Lowe, D.G. Object recognition from local scale-invariant features. In Proceedings of the IEEE International Conference on Computer Vision, Kerkyra, Greece, 20–27 September 1999; p. 1150. [Google Scholar]
- Lowe, D.G.; Lowe, D.G. Distinctive image features from scale-invariant keypoints. Int. J. Comput. Vis. 2004, 60, 91–110. [Google Scholar] [CrossRef]
- Huang, Q.; Yang, J.; Wang, C.; Chen, J.; Meng, Y. Improved registration method for infrared and visible remote sensing image using nsct and sift. In Proceedings of the Geoscience and Remote Sensing Symposium, Munich, Germany, 22–27 July 2012; pp. 2360–2363. [Google Scholar]
- Li, D. An Infrared and Visible Image Registration Based on Surf. 2012, 19–25. Available online: https://datahub.io/dataset/an-infrared-and-visible-image-registration-based-on-surf (accessed on 5 May 2017).
- Coiras, E.; Santamaria, J.; Miravet, C. Segment-based registration technique for visual-infrared images. Opt. Eng. 2000, 39, 202–207. [Google Scholar] [CrossRef]
- Han, J.; Pauwels, E.; Zeeuw, P.D. Visible and Infrared Image Registration Employing Line-Based Geometric Analysis; Springer: Berlin/Heidelberg, Germany, 2012; pp. 114–125. [Google Scholar]
- Liu, L.; Tuo, H.Y.; Xu, T.; Jing, Z.L. Multi-spectral image registration and evaluation based on edge-enhanced mser. Imaging Sci. J. 2014, 62, 228–235. [Google Scholar] [CrossRef]
- Qin, H. Visible and infrared image registration based on visual salient features. J. Electron. Imaging 2015, 24, 053017. [Google Scholar]
- Piella, G. Diffusion maps for multimodal registration. Sensors 2014, 14, 10562–10577. [Google Scholar] [CrossRef] [PubMed]
- Xia, Y.J.; Yin, J.Q.; Chen, R. An automatic registration method for multi-modal images based on alignment metric. Appl. Mech. Mater. 2012, 182–183, 1308–1312. [Google Scholar] [CrossRef]
- Han, J.; Pauwels, E.J.; Zeeuw, P.D. Visible and infrared image registration in man-made environments employing hybrid visual features. Pattern Recognit. Lett. 2013, 34, 42–51. [Google Scholar] [CrossRef]
- Huang, Q.; Yang, J.; Chen, J.; Gao, Q.; Song, Z. Visible and infrared image registration algorithm based on nsct and gradient mirroring. Proc. SPIE—Multispectr. Hyperspectr. Ultraspectr. Remote Sens. Technol. Tech. Appl. 2014. [Google Scholar] [CrossRef]
- Wang, R.; Du, L. Infrared and visible image fusion based on random projection and sparse representation. Int. J. Remote Sens. 2014, 35, 1640–1652. [Google Scholar] [CrossRef]
- Pohl, C.; Genderen, J.L.V. Review article multisensor image fusion in remote sensing: Concepts, methods and applications. Int. J. Remote Sens. 1998, 19, 823–854. [Google Scholar] [CrossRef]
- Nawaz, Q.; Bin, X.; Weisheng, L.; Jiao, D.; Hamid, I. Multi-modal medical image fusion using RGB-principal component analysis. J. Med. Imaging Health Inf. 2016, 6, 1349–1356. [Google Scholar] [CrossRef]
- Toet, A.; Walraven, J. New false color mapping for image fusion. Opt. Eng. 1996, 35, 650–658. [Google Scholar] [CrossRef]
- Kadar, I. Quick markov random field image fusion. Proc. SPIE—Int. Soc. Opt. Eng. 1998, 3374, 302–308. [Google Scholar]
- Sharma, R.K.; Leen, T.K.; Pavel, M. Bayesian sensor image fusion using local linear generative models. Opt. Eng. 2002, 40, 1364–1376. [Google Scholar]
- Zhang, Z.L.; Sun, S.H.; Zheng, F.C. Image fusion based on median filters and sofm neural networks: A three-step scheme. Signal Process. 2001, 81, 1325–1330. [Google Scholar] [CrossRef]
- Zhang, Y.X.; Chen, L.; Zhao, Z. A novel pulse coupled neural network based method for multi-focus image fusion. Int. J. Signal Process. Image Process. Pattern Recognit. 2014, 12, 357–366. [Google Scholar] [CrossRef]
- Guan, W.; Li, L.; Jin, W.; Qiu, S.; Zou, Y. Research on hdr image fusion algorithm based on laplace pyramid weight transform with extreme low-light CMOS. In Proceedings of the Applied Optics and Photonics China, Beijing, China, 5–7 May 2015; p. 967524. [Google Scholar]
- Li, H.; Manjunath, B.S.; Mitra, S.K. Multisensor image fusion using the wavelet transform. Graph. Models Image Process. 1995, 57, 235–245. [Google Scholar] [CrossRef]
- Chen, T.; Zhang, J.; Zhang, Y. In Remote sensing image fusion based on ridgelet transform. In Proceedings of the 2005 IEEE International Geoscience and Remote Sensing Symposium, Seoul, South Korea, 25–29 July 2005; pp. 1150–1153. [Google Scholar]
- Lutz, A.; Giansiracusa, M.; Messer, N.; Ezekiel, S.; Blasch, E.; Alford, M. Optimal multi-focus contourlet-based image fusion algorithm selection. In Proceedings of the SPIE Defense + Security, Baltimore, MD, USA, 17–21 April 2016; p. 98410E. [Google Scholar]
- Zhang, Q.; Guo, B.L. Multifocus image fusion using the nonsubsampled contourlet transform. Signal Process. 2009, 89, 1334–1346. [Google Scholar] [CrossRef]
- Han, J.; Loffeld, O.; Hartmann, K.; Wang, R. Multi image fusion based on compressive sensing. In Proceedings of the International Conference on Audio Language and Image Processing, Shanghai, China, 23–25 November 2010; pp. 1463–1469. [Google Scholar]
- Wei, Q.; Bioucas-Dias, J.; Dobigeon, N.; Tourneret, J.Y. Hyperspectral and multispectral image fusion based on a sparse representation. IEEE Trans. Geosci. Remote Sens. 2014, 53, 3658–3668. [Google Scholar] [CrossRef]
- Zhang, Q.; Liu, Y.; Blum, R.S.; Han, J.; Tao, D. Sparse Representation Based Multi-Sensor Image Fusion: A Review. Available online: https://arxiv.org/abs/1702.03515 (accessed on 4 May 2017).
- Han, J.; Pauwels, E.J.; De Zeeuw, P. Fast saliency-aware multi-modality image fusion. Neurocomputing 2013, 111, 70–80. [Google Scholar] [CrossRef]
- Liu, K.; Guo, L.; Li, H.; Chen, J. Fusion of infrared and visible light images based on region segmentation. Chin. J. Aeronaut. 2009, 22, 75–80. [Google Scholar]
- Sturm, P. Pinhole Camera Model; Springer: Washington, DC, USA, 2014; pp. 300–321. [Google Scholar]
- Hartley, R.; Zisserman, A. Multiple view geometry in computer vision. Kybernetes 2001, 30, 1865–1872. [Google Scholar]
- Li, H.; Li, X.; Ding, W.; Huang, Y. Metadata-assisted global motion estimation for medium-altitude unmanned aerial vehicle video applications. Remote Sens. 2015, 7, 12606–12634. [Google Scholar] [CrossRef]
- Han, J.; Farin, D.; De With, P. Broadcast court-net sports video analysis using fast 3-d camera modeling. IEEE Trans. Circuits Syst. Video Technol. 2008, 18, 1628–1638. [Google Scholar]
- Canny, J. A computational approach to edge detection. IEEE Trans. Pattern Anal. Mach. Intell. 1986, 8, 679–698. [Google Scholar] [CrossRef] [PubMed]
- Jie, G.; Ning, L. An improved adaptive threshold canny edge detection algorithm. In Proceedings of the International Conference on Computer Science and Electronics Engineering, Colchester, UK, 28–30 September 2012; pp. 164–168. [Google Scholar]
- Li, Z.; Zhu, X. Matching Multi—Sensor Images Based on Edge Similarity. J. Spacecr. TTC Technol. 2011, 30, 37–41. [Google Scholar]
- Kennedy, J.; Eberhart, R. Particle swarm optimization. In Proceedings of the IEEE International Conference on Neural Networks, Perth, Australia, 27 November–1 December 1995; Volume 1944, pp. 1942–1948. [Google Scholar]
- Song, Y.; Eberhart, R. A modified particle swarm optimizer. In Proceedings of the 1998 IEEE International Conference on Evolutionary Computation Proceedings, Anchorage, AK, USA, 4–9 May 1998. [Google Scholar]
- Arasomwan, M.A.; Adewumi, A.O. On the performance of linear decreasing inertia weight particle swarm optimization for global optimization. Sci. World J. 2013, 78, 1648–1653. [Google Scholar] [CrossRef] [PubMed]
- Kuntimad, G.; Ranganath, H.S. Perfect image segmentation using pulse coupled neural networks. IEEE Trans. Neural Netw. 1999, 10, 591. [Google Scholar] [CrossRef] [PubMed]
- Bamberger, R.H.; Smith, M.J.T. A filter bank for the directional decomposition of images: Theory and design. IEEE Trans. Signal Process. 1992, 40, 882–893. [Google Scholar] [CrossRef]
- Hore, A.; Ziou, D. Image quality metrics: PSNR vs. SSIM. In Proceedings of the 2010 20th International Conference on Pattern Recognition (ICPR), Istanbul, Turkey, 23–26 August 2010; pp. 2366–2369. [Google Scholar]
- He, C.; Liu, Q.; Li, H.; Wang, H. Multimodal medical image fusion based on IHS and PCA. Procedia Eng. 2010, 7, 280–285. [Google Scholar] [CrossRef]
- Xin, W.; Wei, Y.L.; Fu, L. A new multi-source image sequence fusion algorithm based on sidwt. In Proceedings of the Seventh International Conference on Image and Graphics, Qingdao, China, 26–28 July 2013; pp. 568–571. [Google Scholar]
Figure 1.
UAV system for earthquake emergency and rescue including: (1) unmanned aerial vehicle (UAV); (2) ground control system; (3) information processing center; and (4) launcher.
Figure 1.
UAV system for earthquake emergency and rescue including: (1) unmanned aerial vehicle (UAV); (2) ground control system; (3) information processing center; and (4) launcher.

Figure 2.
UAV airborne visible light and infrared integrated camera platform with two degrees of freedom.
Figure 2.
UAV airborne visible light and infrared integrated camera platform with two degrees of freedom.

Figure 3.
Visible light and infrared integrated camera, in which the two imaging axes are parallel to each other.
Figure 3.
Visible light and infrared integrated camera, in which the two imaging axes are parallel to each other.

Figure 4.
Process of visible and infrared image registration, including scale calculation, coarse translation estimation, and precise translation estimation.
Figure 4.
Process of visible and infrared image registration, including scale calculation, coarse translation estimation, and precise translation estimation.

Figure 5.
Process of visible and infrared image fusion based on PCNN and NSCT.

Figure 6.
Five coordinate systems of coarse translation estimation.

Figure 7.
Non-strictly aligned characteristics of edges: (a) original visible image; (b) original infrared image; (c) visible edge image; and (d) infrared edge image.
Figure 7.
Non-strictly aligned characteristics of edges: (a) original visible image; (b) original infrared image; (c) visible edge image; and (d) infrared edge image.

Figure 8.
Edge distance field transformation based on Gaussian: (a) visible edge image; and (b) distance field map of visible edge.
Figure 8.
Edge distance field transformation based on Gaussian: (a) visible edge image; and (b) distance field map of visible edge.

Figure 9.
Infrared template image extraction and template image searching in the distance field map of visible edge: (a) infrared edge image; and (b) distance field map of visible edge.
Figure 9.
Infrared template image extraction and template image searching in the distance field map of visible edge: (a) infrared edge image; and (b) distance field map of visible edge.

Figure 10.
NSPFB and NSDFB of NSCT transform. The left-hand portion is the image decomposition based on NSPFB. The right-hand portion shows the decomposition of each subband in different directions based on NSDFB.
Figure 10.
NSPFB and NSDFB of NSCT transform. The left-hand portion is the image decomposition based on NSPFB. The right-hand portion shows the decomposition of each subband in different directions based on NSDFB.

Figure 11.
Study area and flight course covering about 300 km2 in Eastern China.

Figure 12.
First experiment of scale calculation: (a) original image; (b) original infrared image; (c) scale-transformed result of image (b); and (d) fusion image of images (a) and (c).
Figure 12.
First experiment of scale calculation: (a) original image; (b) original infrared image; (c) scale-transformed result of image (b); and (d) fusion image of images (a) and (c).

Figure 13.
Second experiment of scale calculation. (a) Original image; (b) original infrared image; (c) scale-transformed result of image (b); and (d) fusion image of images (a) and (c).
Figure 13.
Second experiment of scale calculation. (a) Original image; (b) original infrared image; (c) scale-transformed result of image (b); and (d) fusion image of images (a) and (c).

Figure 14.
Third experiment of scale calculation: (a) original image; (b) original infrared image; (c) scale-transformed result of image (b); and (d) fusion image of images (a) and (c).
Figure 14.
Third experiment of scale calculation: (a) original image; (b) original infrared image; (c) scale-transformed result of image (b); and (d) fusion image of images (a) and (c).

Figure 15.
Fusion image of coarse translation-transformed infrared image and original visible image: (a) first experiment image; (b) second experiment image; and (c) third experiment image.
Figure 15.
Fusion image of coarse translation-transformed infrared image and original visible image: (a) first experiment image; (b) second experiment image; and (c) third experiment image.

Figure 16.
Fusion image of the precise translation-transformed infrared image and the original visible image: (a) first experiment image; (b) second experiment image; and (c) third experiment image.
Figure 16.
Fusion image of the precise translation-transformed infrared image and the original visible image: (a) first experiment image; (b) second experiment image; and (c) third experiment image.

Figure 17.
Fusion of visible image and low spatial infrared image: (a) Visible image; (b) infrared image; (c) fusion image based on IHS; and (d) fusion image based on the proposed method.
Figure 17.
Fusion of visible image and low spatial infrared image: (a) Visible image; (b) infrared image; (c) fusion image based on IHS; and (d) fusion image based on the proposed method.

Figure 18.
Fusion of interesting areas in two scenes: (a,b,d,e) original image; and (c,f) fusion image based on the proposed method.
Figure 18.
Fusion of interesting areas in two scenes: (a,b,d,e) original image; and (c,f) fusion image based on the proposed method.

Figure 19.
Performance analysis of the first experiment under translation conditions.

Figure 20.
Performance analysis of the second experiment under rotation conditions.

Figure 21.
Performance analysis of the third experiment under scale conditions.

Figure 22.
Average gradient and Shannon values of the four image fusion methods: (a) average gradient; and (b) Shannon value.
Figure 22.
Average gradient and Shannon values of the four image fusion methods: (a) average gradient; and (b) Shannon value.


Table 1.
Main parameters of employed medium-altitude UAV.
| Item | Description |
|---|---|
| Wing Span | 4.0 m |
| Length | 1.85 m |
| Height | 0.7 m |
| Service Ceiling | 5000 m |
| Maximum Payload | 5 kg |
| Maximum Takeoff Weight | 35 kg |
| Flight Speed | 80–140 km h−1 |
| Control Radius | 60 km |
| Endurance | 5 h |
| ImagingDevice | VisibleLight and Infrared |
| Control Mode | Remote, Program or Autonomous |
| Takeoff Mode | Catapulted Launching |
| Recovery | Parachute |
| Engine | Piston Engine |
| Navigation Mode | BD2/GPS and INS |
Table 2.
Useful metadata.
| Name | Notation | Source | Description | Accuracy |
|---|---|---|---|---|
| Longitude | GPS | Unit: ° | 2.5 m | |
| Latitude | GPS | Unit: ° | 2.5 m | |
| Altitude | Altimeter | Unit: m | 0.1 m | |
| Terrain Height | GIS | Unit: m | 1.0 m | |
| Vehicle Heading | INS | Unit: ° | 1° | |
| Vehicle Roll | INS | Unit: ° | 0.2° | |
| Vehicle Pitch | INS | Unit: ° | 0.2° | |
| Camera Installation Translation | Measuring Equipment | Unit: m | 0.01 m | |
| Camera Pan | Camera | Unit: ° | 0.2° | |
| Camera Tilt | Camera | Unit: ° | 0.2° | |
| Resolution | Camera | u: Image Row v: Image Column | — | |
| Focal Length | Camera | Unit: m | — | |
| Pixel Size | Camera | Unit: m | — |
Table 3.
Coordinate transformations and relevant metadata.
| Transformation | Notation | Description | Relevant Metadata |
|---|---|---|---|
| ICS to CCS | Direction rotation of coordinate axis | None | |
| Translation of coordinate system center | |||
| CCS to PCS | Translation of installation error | ||
| Rotation of two angles | , | ||
| PCS to NCS | Rotation of three angles | , , | |
| NCS to GCS | Translation of coordinate system center | , , , |
Table 4.
Source data for scale calculation.
| Item | Resolution | Focal Length (mm) | Pixel Size (μm) | ||||||
|---|---|---|---|---|---|---|---|---|---|
| Group ID | 1 | 2 | 3 | 1 | 2 | 3 | 1 | 2 | 3 |
| Visible image | 1392 × 1040 | 172 | 65.4 | 50.4 | 4.65 | ||||
| Infrared image | 720 × 576 | 540 | 135 | 135 | 25 | ||||
Table 5.
Infrared image after scale transformation.
| Group ID | 1 | 2 | 3 |
|---|---|---|---|
| Result image resolution | 1042 × 834 | 1666 × 1333 | 1284 × 1027 |
Table 6.
Results of coarse translation estimation.
| Image Sequence | Translation | ||
|---|---|---|---|
| Group ID | 1 | 2 | 3 |
| Actual Translation | (−31,−29) | (−6,−15) | (−21,11) |
| Translation Estimation | (−36,−37) | (−20,−10) | (−8,2) |
| Error | 9.43 | 14.87 | 15.81 |
Table 7.
Results of precise translation estimation.
| Image Sequence | Translation | ||
|---|---|---|---|
| Group ID | 1 | 2 | 3 |
| Actual Translation | (−31,−29) | (−6,−15) | (−21,11) |
| Translation Estimation | (−30,−27) | (−8,−13) | (−20,9) |
| Error | 2.24 | 2.83 | 2.24 |
Table 8.
Average RMSE of the five methods.
| Index | Test Data (Frame Number) | AMBR (RMSE) | MIBR (RMSE) | PSNRBR (RMSE) | SSIMBR (RMSE) | Propose IVPBR (RMSE) |
|---|---|---|---|---|---|---|
| 1 | Translation (86) | 3.98 | 3.19 | 3.24 | 2.63 | 1.55 |
| 2 | Rotation (80) | 3.37 | 3.04 | 2.97 | 2.16 | 2.01 |
| 3 | Scale (91) | 3.00 | 2.61 | 2.94 | 1.90 | 1.54 |
| Average RMSE | 3.45 | 2.95 | 3.05 | 2.23 | 1.70 | |
Table 9.
Average gradient and Shannon value of the four methods.
| Index | Evaluation Index | IHSBF | PCABF | SIDWTBF | Proposed |
|---|---|---|---|---|---|
| 1 | Average Gradient | 1.67 | 1.59 | 1.78 | 1.97 |
| 2 | Shannon | 7.20 | 6.90 | 6.74 | 7.40 |
© 2017 by the authors. Licensee MDPI, Basel, Switzerland. This article is an open access article distributed under the terms and conditions of the Creative Commons Attribution (CC BY) license (http://creativecommons.org/licenses/by/4.0/).
Share and Cite
MDPI and ACS Style
Li, H.; Ding, W.; Cao, X.; Liu, C. Image Registration and Fusion of Visible and Infrared Integrated Camera for Medium-Altitude Unmanned Aerial Vehicle Remote Sensing. Remote Sens. 2017, 9, 441. https://doi.org/10.3390/rs9050441
AMA Style
Li H, Ding W, Cao X, Liu C. Image Registration and Fusion of Visible and Infrared Integrated Camera for Medium-Altitude Unmanned Aerial Vehicle Remote Sensing. Remote Sensing. 2017; 9(5):441. https://doi.org/10.3390/rs9050441
Chicago/Turabian StyleLi, Hongguang, Wenrui Ding, Xianbin Cao, and Chunlei Liu. 2017. "Image Registration and Fusion of Visible and Infrared Integrated Camera for Medium-Altitude Unmanned Aerial Vehicle Remote Sensing" Remote Sensing 9, no. 5: 441. https://doi.org/10.3390/rs9050441
Note that from the first issue of 2016, this journal uses article numbers instead of page numbers. See further details here.