Article

Combining Multispectral Imagery with in situ Topographic Data Reveals Complex Water Level Variation in China’s Largest Freshwater Lake

1
Key Laboratory of Watershed Geographic Sciences, Nanjing Institute of Geography and Limnology, Chinese Academy of Sciences, Nanjing 21008, China
2
State Key Laboratory of Lake Science and Environment, Nanjing Institute of Geography and Limnology, Chinese Academy of Sciences, Nanjing 21008, China
*
Author to whom correspondence should be addressed.
Remote Sens. 2015, 7(10), 13466-13484; https://doi.org/10.3390/rs71013466
Submission received: 27 May 2015 / Revised: 1 October 2015 / Accepted: 10 October 2015 / Published: 15 October 2015
(This article belongs to the Special Issue Remote Sensing in Flood Monitoring and Management)

Abstract

:
Lake level variation is an important hydrological indicator of water balance, biodiversity and climate change in drainage basins. This paper illustrates the use of moderate-resolution imaging spectroadiometer (MODIS) data to characterize complex water level variation in Poyang Lake, the largest freshwater lake in China. MODIS data were used in conjunction with in situ topographic data, otherwise known as the land-water contact method, to investigate the potential of this hybrid water level spatiotemporal variability measurement technique. An error analysis was conducted to assess the derived water level relative to gauge data. Validation results demonstrated that the land-water contact method can satisfactorily capture spatial patterns and seasonal variations in water level fluctuations. The correlation coefficient ranged from 0.684 to 0.835, the root-mean-square-error from 0.79 m–1.09 m, and the mean absolute bias error from 0.65 m to 0.86 m for five main gauge stations surrounding the lake. Additionally, seasonal and interannual variations in the lake’s water level were revealed in the MODIS-based results. These results indicate that the land-water contact method has the potential to be applied in mapping water level changes in Poyang Lake. This study not only provides a foundation for basic hydrological and ecological studies, but is also valuable for the conservation and management of water resources over gauge-sparse regions in Poyang Lake.

Graphical Abstract

1. Introduction

Freshwater lakes are valuable resources for humans and have important regional ecological and environmental functions, such as climate regulation, flood/drought control and the provision of wildlife habitats [1,2,3]. Lake level variation is not only an important indicator of the water balance in drainage basins but it is also a useful indicator of climate change [4,5]. For this reason, detailed water level mapping is of fundamental importance to hydrological studies in aquatic environments. Traditionally, measuring water level has relied on in situ gauge stations [6], but this method is labor intensive and does not provide continuous spatial data across large areas [7,8]. Since the 1990s, the growing availability of satellite remote sensing data has increased opportunities for monitoring large rivers from space [9,10,11,12,13].
There are several accepted methods for retrieving water levels using various remote sensing data, each of which has its strengths and weaknesses. Radar altimetry is a promising technique for directly detecting water level [14,15,16], but the application of this technique to monitor inland waters has several limitations [17,18]. For one thing, it is difficult to analyze altimetry waveforms over a complex, varying surface [19,20]. For another, altimetry is a profiling technique, not an imaging technique; it can only provide a limited footprint of a lake and is unable to depict overall spatial distribution on a regional scale [21,22]. Moreover, there is an indirect method that uses the water level/area relationship to estimate the water level [23,24]. However, the derived relationships between water level and area are essentially empirical, and the transferability from one hydro-geomorphological setting to another has not been proven. More recently, several studies have used space-borne radar interferometry to detect water level variations over large lakes, rivers and floodplains [25,26,27,28]. This technique provides a measure of relative but not absolute changes in water level [29]. Although the upcoming Surface Water and Ocean Topography (SWOT) mission will be able to provide surface elevation data at a high spatial resolution [9,30], the mission is still being planned.
Water level can also be estimated using the land-water contact method, which uses satellite imagery in combination with high-resolution in situ topographic maps to derive water levels [8]. Several studies have attempted to monitor water level variation by combining the changing land-water contact with in situ topographic data. For example, Matgen et al. [31] retrieved water level maps combining SAR-derive inundation areas with high-precision topographic data and a root mean squared error of 41 cm was obtained. Raclot [32] used this method to extract water levels from aerial photographs on floodplains, which have been shown to be sufficiently precise (mean ±15 cm). More recently, Schumann et al. [33] compared water level derived from water boundaries and different topographic data (LiDAR, topographic contours and SRTM) and demonstrated that water level mapping with low-precision surface elevation data is hardly possible, as the accuracy of the resulting map depends too much on DEM uncertainties and errors both in the horizontal and vertical directions [34]. However, most previous studies primarily focused on small lakes or reservoirs and were limited by the measurement frequency or time span. No studies have addressed the potential of this method to monitor the water levels over a large, complex lake. Satellite observations provide sub-daily water levels, but these data can be inaccurate due to spatiotemporal sampling errors as well as instrument and algorithm errors [10]. Error assessments of the different temporal and spatial data must be conducted to help identify and draw upon the best available information from these different spatial water level datasets. Poyang Lake, the largest freshwater lake in China, which undergoes significant changes in seasonal water level and has a complex benthic topography, presents such a challenging case.
Poyang Lake is one of the most internationally important wetlands in terms of the provision of habitats for migratory birds [35]. In recent years, however, Poyang Lake has undergone remarkable declines in lake size. The changes have greatly affected the spatial availability of freshwater resources, resulting in significant hydrological, biological, ecological and economic consequences in the region [36,37,38]. These changes are receiving increasing international attention. For this reason, effective management of water levels for flood/drought prevention, water quality and water safety purposes have become a priority in Poyang Lake. Water level variations and surface gradients in the lake are critical to understand the hydraulic behavior of the large wetland systems [39] and very important for lake ecological conservation and water resource management and utilization [40,41]. However, like many large lakes, the water level gauge stations in Poyang Lake are sparsely distributed, resulting in poor spatial water level data for the large lake [42].
This study proposes an alternative water level measurement technique that uses remote sensing observations in combination with ground topographic data, called the land-water contact method. The goals of this study are as follows: (1) to evaluate the accuracy and efficiency of the land-water contact method for estimating water levels in a large lake and (2) to reveal complex spatiotemporal variations in water levels within the Poyang Lake region. This study is organized as follows: Section 2 describes the study area and satellite dataset used; Section 3 states the methodologies used to delineate the land-water contact, estimate water levels and analyze water level variation; Section 4 presents and discusses spatial patterns and temporal variations in the change rate of the lake’s water level; Section 5 concludes the study. Our findings are valuable for the conservation and management of water resources over gauge-sparse regions.

2. Study Area and Data

2.1. Study Area

Poyang Lake is located in the middle reach of the Yangtze River (28°22′–29°45′N, 115°47′–116°45′E) (Figure 1). It is the primary component of the Poyang Lake wetland, which has been included in the first batch of the Ramsar Convention List of Wetlands of International Importance [35]. Poyang Lake runs 173 km from north to south, has a lakeshore circumference of 1200 km and has an average water depth of 8.4 m [43]. As shown in Figure 1, water from the Xiuhe, Ganjiang, Fuhe, Xinjiang and Raohe rivers flows into the Yangtze River through this lake [44]. The five tributaries split at their mouths and form estuary delta zones along the southwestern edge of the lake. There is a marked difference in the benthic topography of the different lake regions. The northern region is a narrow and deep channel, which exchanges water with the Yangtze River via the Hukou. In contrast, the southern region is relatively wide but shallow. The benthic topography elevation generally decreases from the south (>16 m) to the north (<12 m) [43].
Poyang Lake has a subtropical climate, with an annual mean temperature of 17 ºC and 240–330 days free of frost [43]. The seasonality of precipitation in the five tributary catchments induces significant variations in water flows into the lake throughout the year. In addition to the five main tributaries that drain into the lake, Poyang Lake also receives seasonal reverse-flow from the Yangtze River, which greatly contributes to the complexity of water level variations [45]. In high-water seasons (April–September), the five tributaries flood due to concentrated rainfall. Water levels in the lake reach a peak with the blocking effect of the Yangtze River, and the lake area can exceed over 3000 km2 [36]. In low-water seasons (October–March), the lake recedes into shallow depressions and channels. During this time, the lake may lose as much as 90% of its water, and the water surface shrinks to less than 1000 km2 [43,46].
Figure 1. Geographical location of Poyang Lake in China. The channel water surface profile from north to south is indicated by the red line.
Remotesensing 07 13466 g001

2.2. Data Acquisition and Pre-Processing

Daily MODIS Level-1B data (MOD02_QKM and MOD02_HKM) from 2000–2012 were acquired from the NASA Goddard Space Flight Center (GSFC) (http://ladsweb.nascom.nasa.gov). A total of 466 cloud-free images were used in this study. The MOD02_QKM and MOD02_HKM datasets contain Level-1B calibrated and geo-located radiances for the visible and near infrared (NIR) bands. MOD02_HKM was extracted for digital number (DN) values in the green band (0.54–0.57 μm) at a 500 m resolution, and MOD02_QKM was extracted for DN values in the NIR band (0.84–0.88 μm) at a 250 m resolution. The MODIS green band was resampled to 250 m resolution to match the resolution of the MODIS NIR band. All of the acquired MODIS images were projected in coordinates of Universal Transverse Mercator (UTM) projection with a World Geodetic System (WGS-84) datum, as was the Digital Elevation Model (DEM) data.
Poyang Lake bathymetric data for 1998 and 2011 were obtained from the Hydrological Bureau of Jiangxi Province, China. The data have a horizontal scale of 1:10000 and a vertical accuracy of 0.1 m [47]. A comparison analysis confirmed that the lake’s boundary and bathymetry remained stable between 1998 and 2011. The 2011 data were used because they were more recent. The bathymetric data were converted into a DEM with a spatial resolution of 5 m to be combined with the satellite imagery data. First, a linear interpolation was adopted between the surveyed points and lines in the bathymetric data to generate a Triangular Irregular Network (TIN), which is able to preserve the heterogeneity of sampling details [48,49]. Then, the TIN was converted to a raster DEM with a UTM projection and a WGS-84 datum. However, DEMs are representations of topography with inherent errors that constitute uncertainty [50]. In this study, therefore, the precision of the derived DEM was evaluated by comparison of the interpolated elevation to the 24 GPS measurements, with an average root mean square error (RMSE) of 0.12 m and bias of 0.08 m. In addition, in situ daily water level data were obtained from five gauge stations (Hukou, Xingzi, Duchang, Tangyin and Kangshan) (denoted with black triangles in Figure 1). The data were available to validate the estimated lake water level for the period from 2000–2004 and were provided by the Hydrological Bureau of the Yangtze River Water Resources Commission of China. The gauge measures are based on the Wusong elevation system, which differs from that used for the bathymetric data (the 1985-Huanghai elevation system). A constant of 1.836 m was added to the bathymetric data to reduce the difference between the systems.

3. Methodology

3.1. Water Body Delineation

To determine the lake’s level, water body boundaries were first delineated. Water body is one of the most discernible features from satellite images due to its special spectral characteristics. It can be extracted with a single-band or a multi-band index [51,52]. Because electromagnetic energy is strongly absorbed by water in the near-infrared (NIR) wavelength, a combination of the green and near-infrared bands can differentiate water surfaces from most terrestrial features. In this study, we used the normalized difference water index (NDWI) for the delineation [52]. This index has been demonstrated to be efficient and is widely accepted in the automated detection of water surfaces [52,53]. The index can be described as follows:
N D W I = D N G r e e n D N N I R D N G r e e n + D N N I R
where DNNIR and DNGreen indicate the digital number (DN) values in the NIR and green bands of remote sensing imagery, respectively. Using equation (1), the MODIS DN values were transformed to NDWI in this study. An NDWI threshold between water surfaces and non-water features was determined using the generated NDWI histogram. Then, an optimal threshold value was determined to separate water from land [54,55]. The delineated water surface has an overall accuracy of 96.1%, which was evaluated with 30-m Landsat data in our previous study [38].

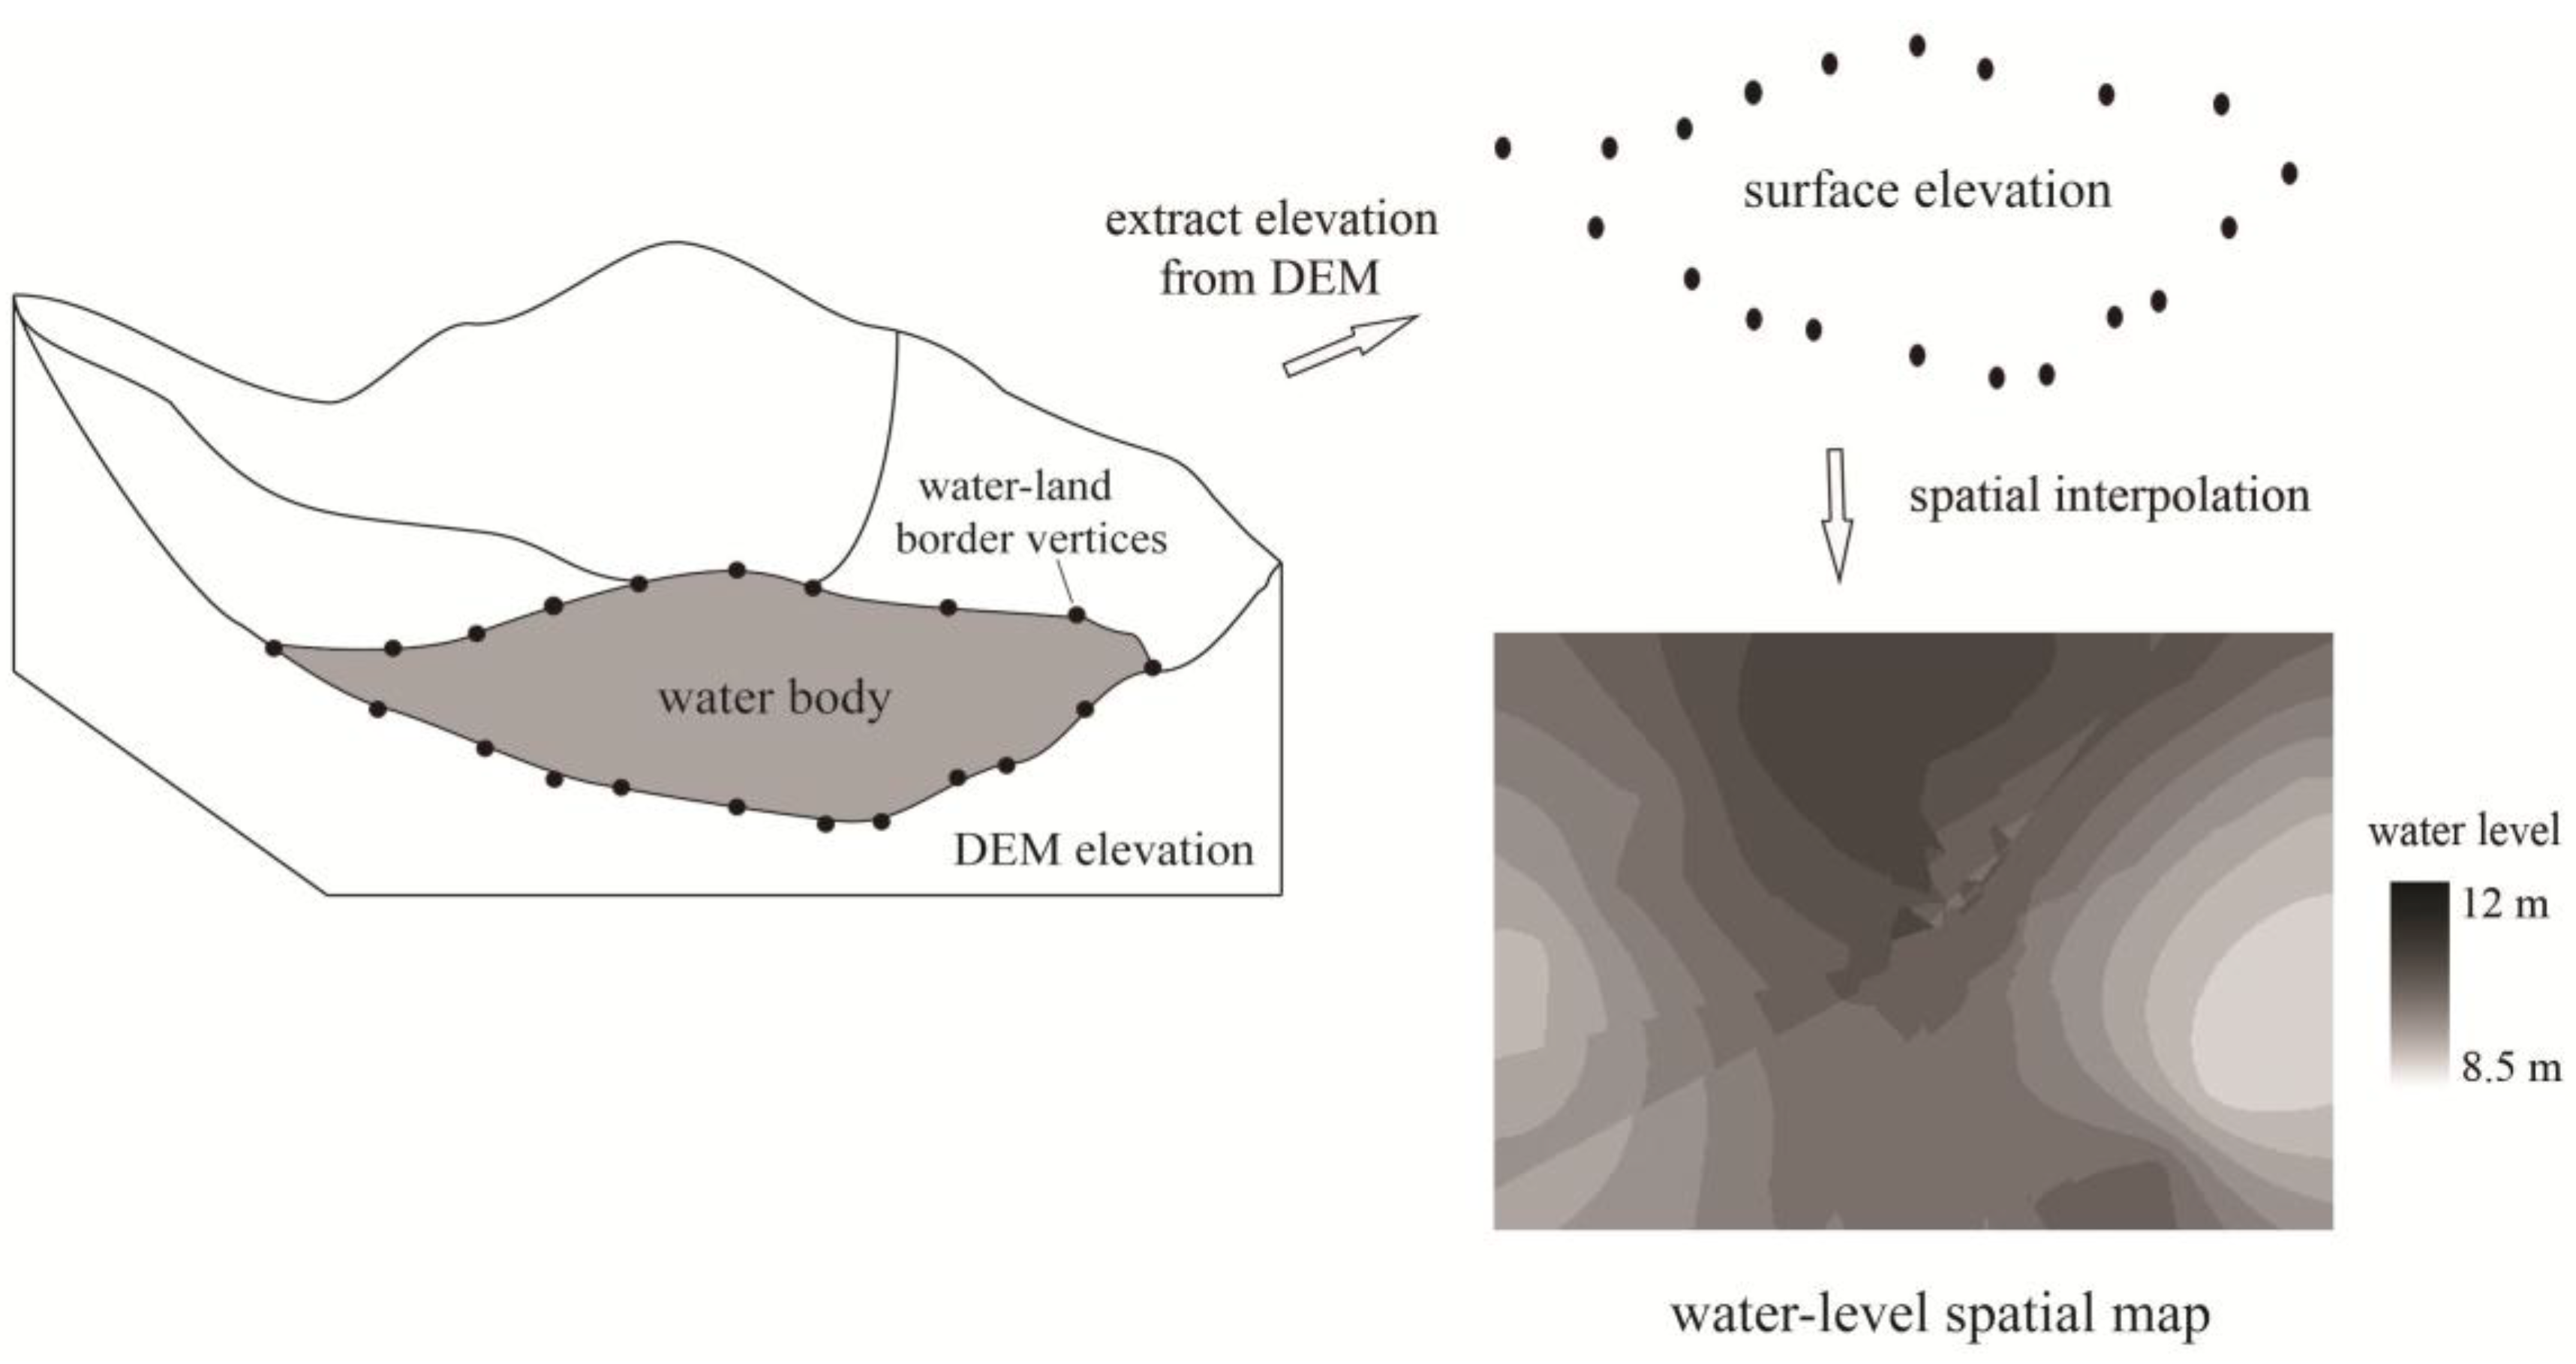
3.2. Water Level Mapping

Once the water body is extracted from the satellite images, the water boundaries are used to derive the water level. This principle relies on integrating the position of the land-water contact with a database of bottom topographic points [31]. Each water surface has a contact line with the land at a corresponding water level. Thus, the challenge is to assign topographic values to the pixels corresponding to the water’s edge. The process can be described as follows (Figure 2). First, the water bodies derived from satellite images are transformed into water polygons that have an ArcGIS shapefile format. Next, the water polygons are used to generate vertices where points form the outer edge of the land-water contact pixel. Then, the height values along those land-water borders are extracted from the matched bottom topographic data. Finally, it is possible to contrast the spatial distribution of the water level using Ordinary Kriging algorithm for spatial interpolation from the height values of the land-water borders. Ordinary Kriging is a linear spatial interpolation estimator Z ^ ( x 0 ) used to find the best linear unbiased estimate of a second-order stationary random field with an unknown constant mean as follows [56,57]:
Z ^ ( x 0 ) = i = 1 n λ i Z ( x i )
where Z ^ ( x 0 ) is a kriging estimate at location x 0 ; Z(xi) is the sampled valued at location xi ; and λ i is the weighting factor for Z(xi); and n is the number of measurements used in the estimate. This method employs a semivariogram to estimate spatial correlations and also describes the weights used in the interpolation. It is calculated based on a semivariogram sample with distance, observation value and data samples, as shown in following formula [57]:
γ ^ ( h ) = 1 2 N ( h ) i = 1 N ( h ) [ z ( x i ) z ( x i + h ) ] 2
where γ ^ ( h ) is the estimated semivariance for the distance h, and N(h) is the number of measured point pairs within that distance interval h. z ( x i ) and z ( x i + h ) are sample value at two points separated by the distance interval h. For data analysis, the variogram analysis, model fitting, kriging interpolation and surface output were performed using ArcGIS 9.3. The water level derived method is fully described by Raclot et al. (2006) [32].

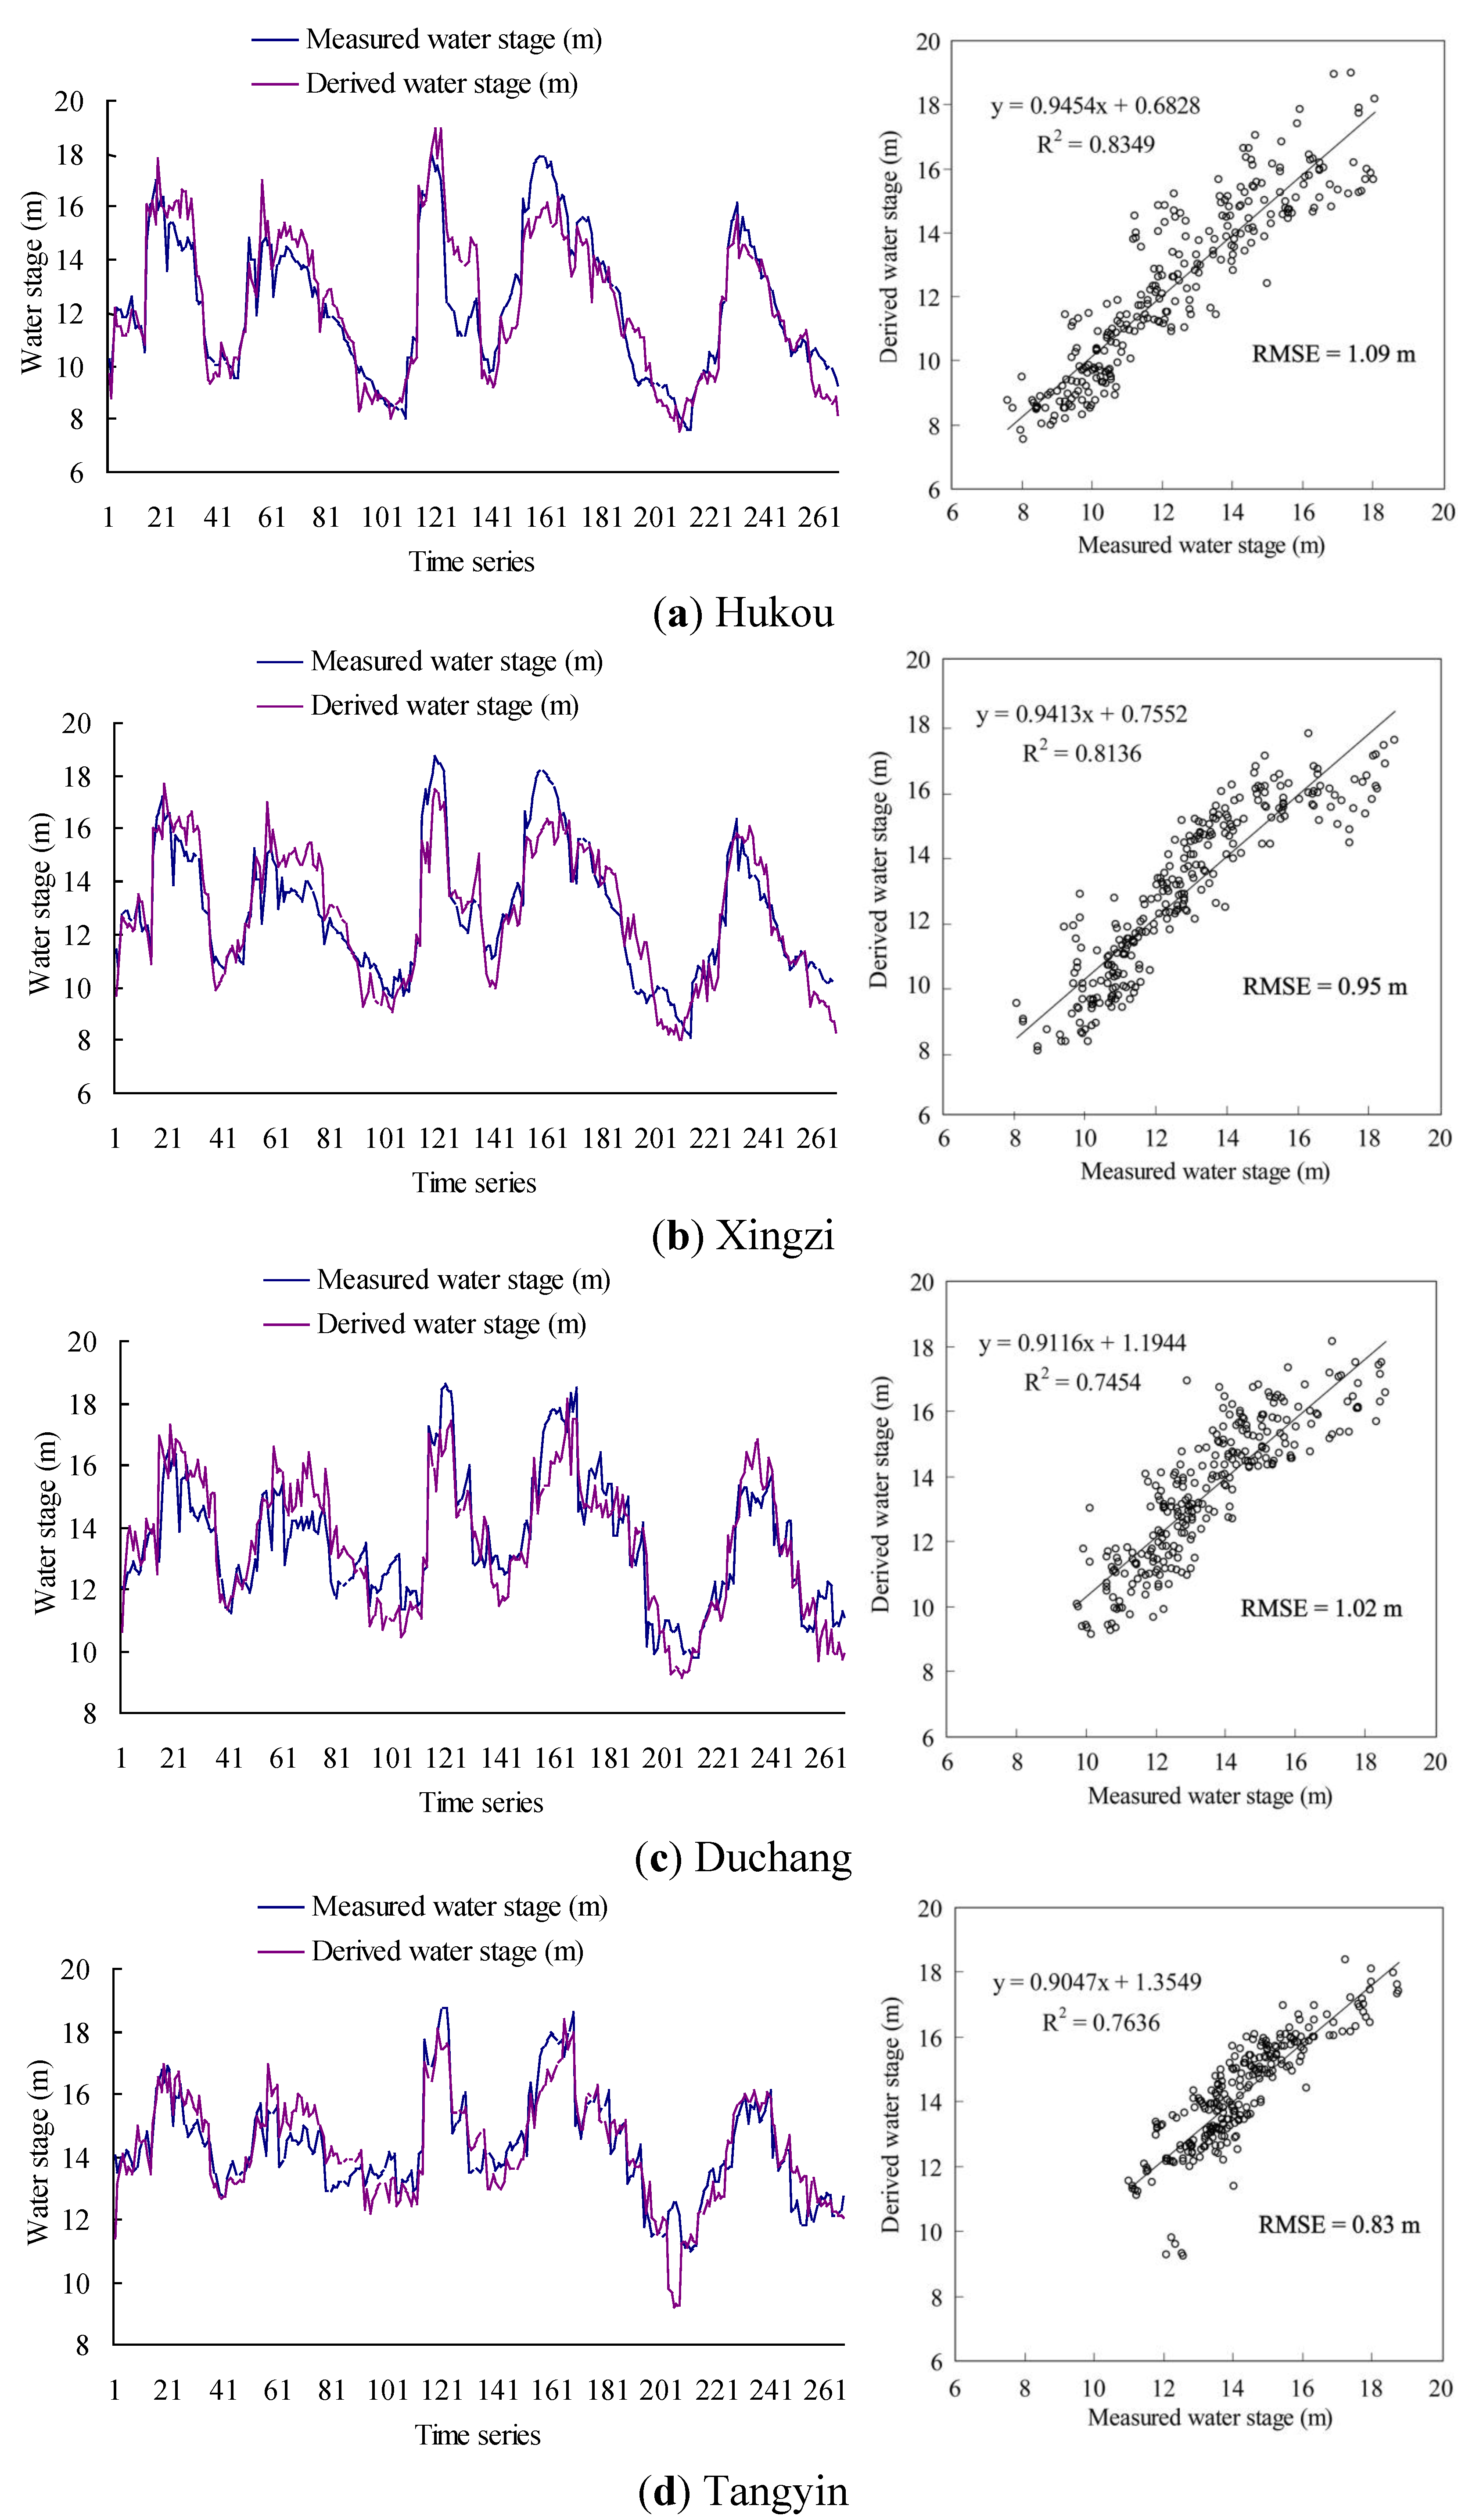
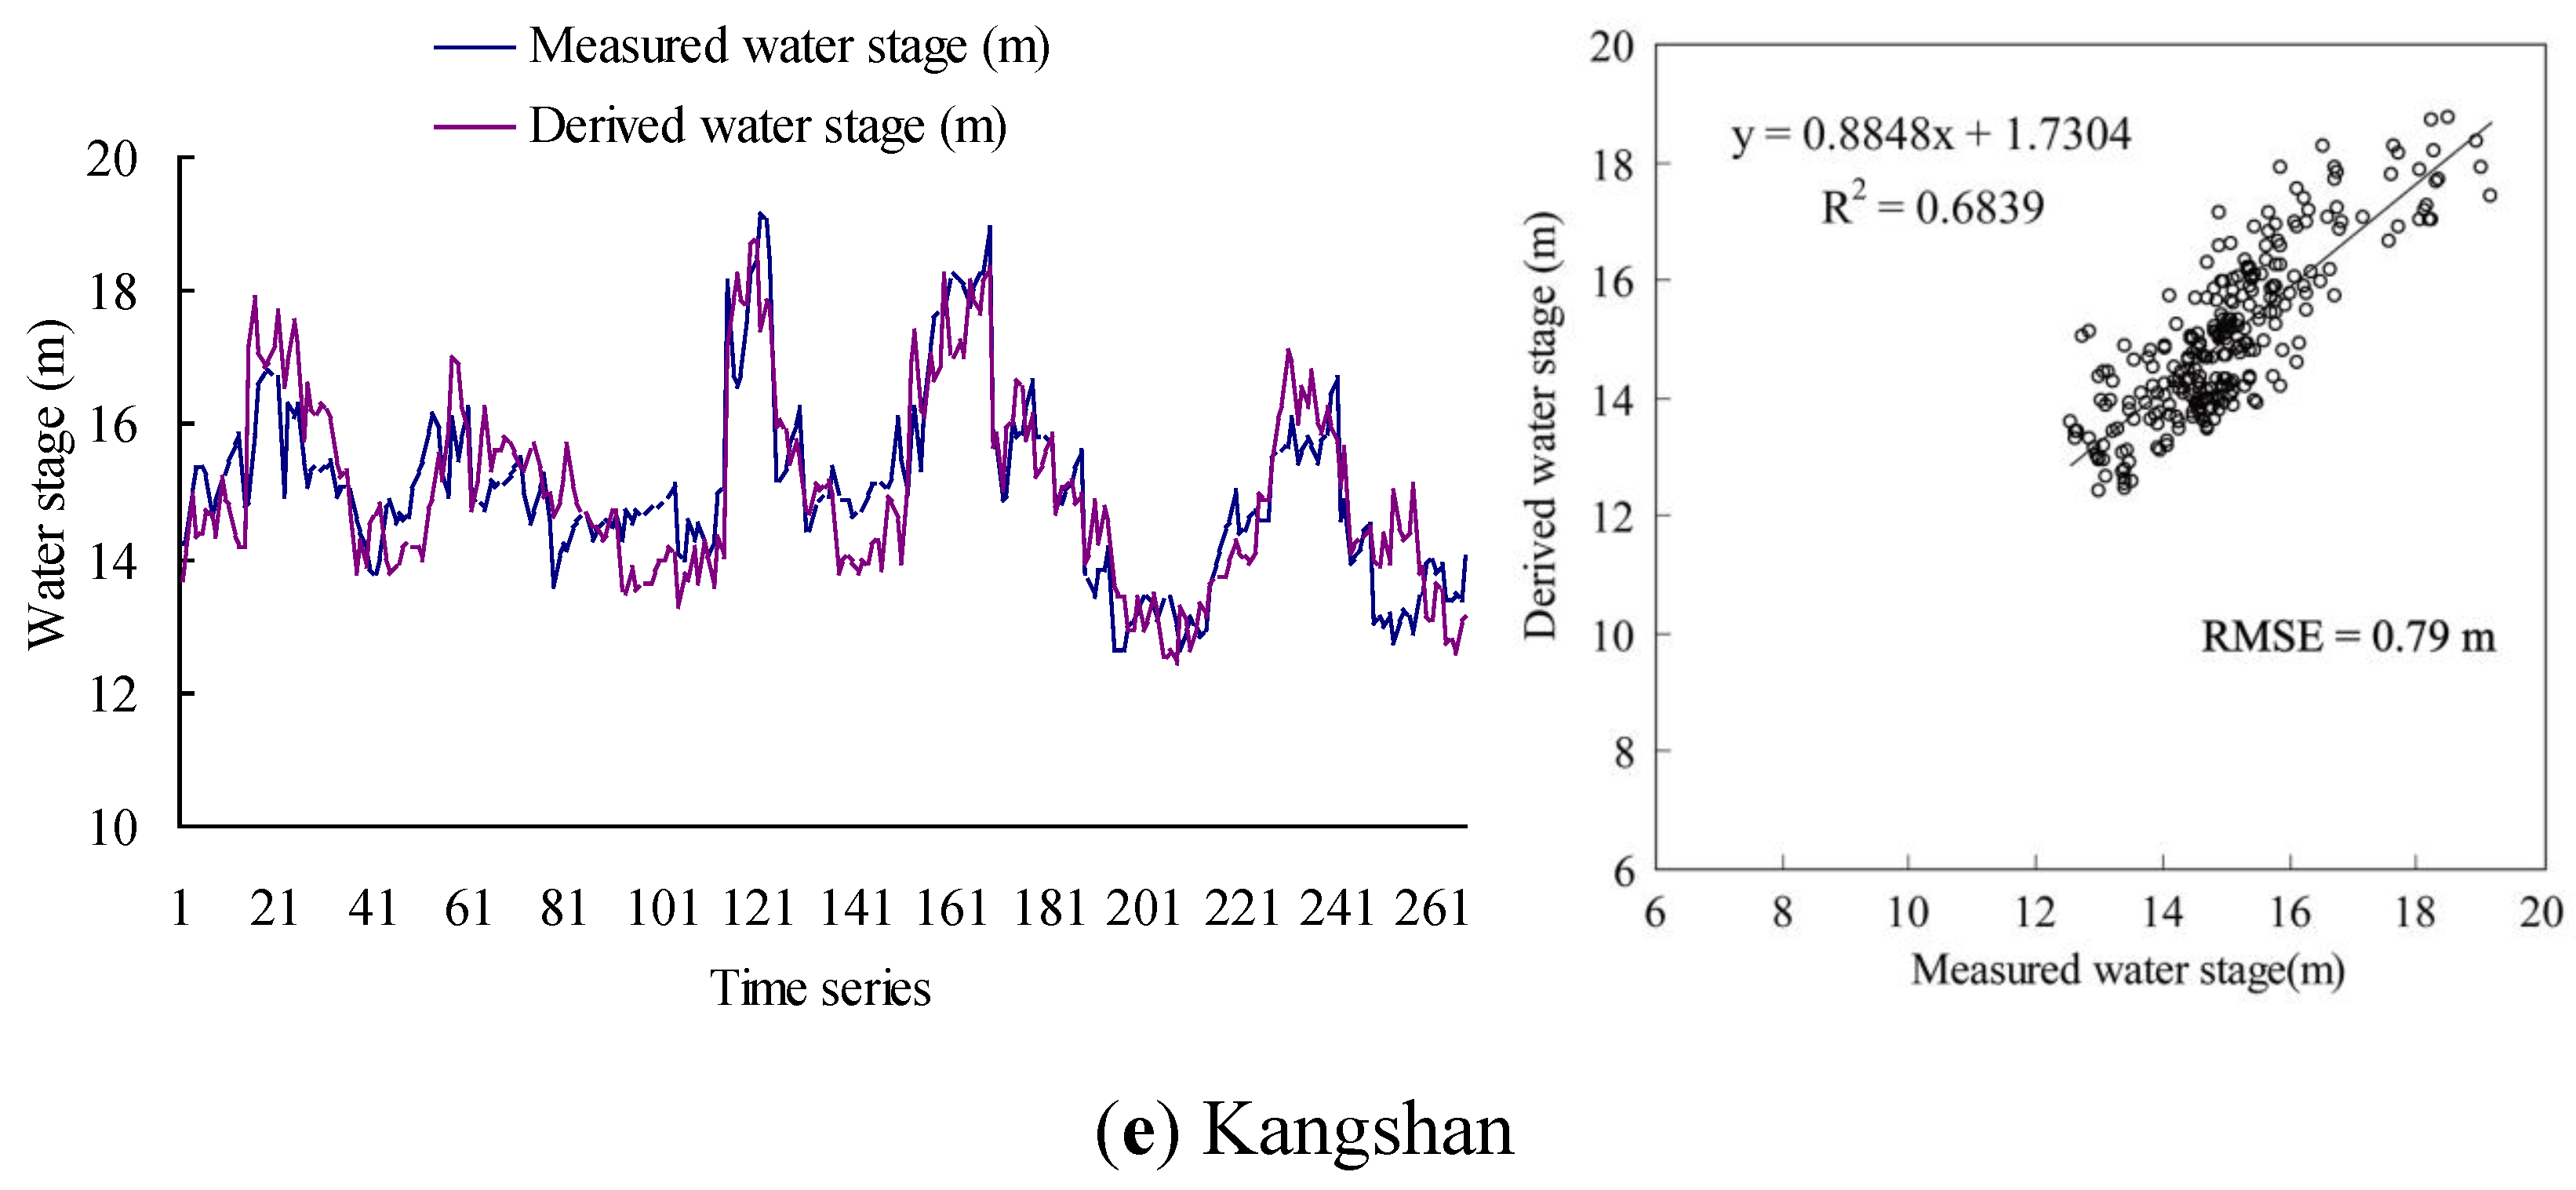
3.3. Water Level Validation

Satellite-derived water level values were validated through a comparison with in situ gauge measures from the same date. At each gauge station, the coefficient of determination (R2) was used to evaluate the consistency between in situ measures and satellite-derived water levels. Furthermore, to examine error distributions and statistical goodness of fit, the root mean square error (RMSE) and mean absolute bias error (MABE) were adopted, as described below:
R M S E = i = 1 n ( S i M i ) 2 N
M A B E = i = 1 n | S i M i | N
where S is the satellite-derived lake level, M is the gauge station measure, N is the total number of observations, and i represents the order in the sequence.
Figure 2. A sketch of the methodology used to derive the water level.
Remotesensing 07 13466 g002

4. Results and Discussion

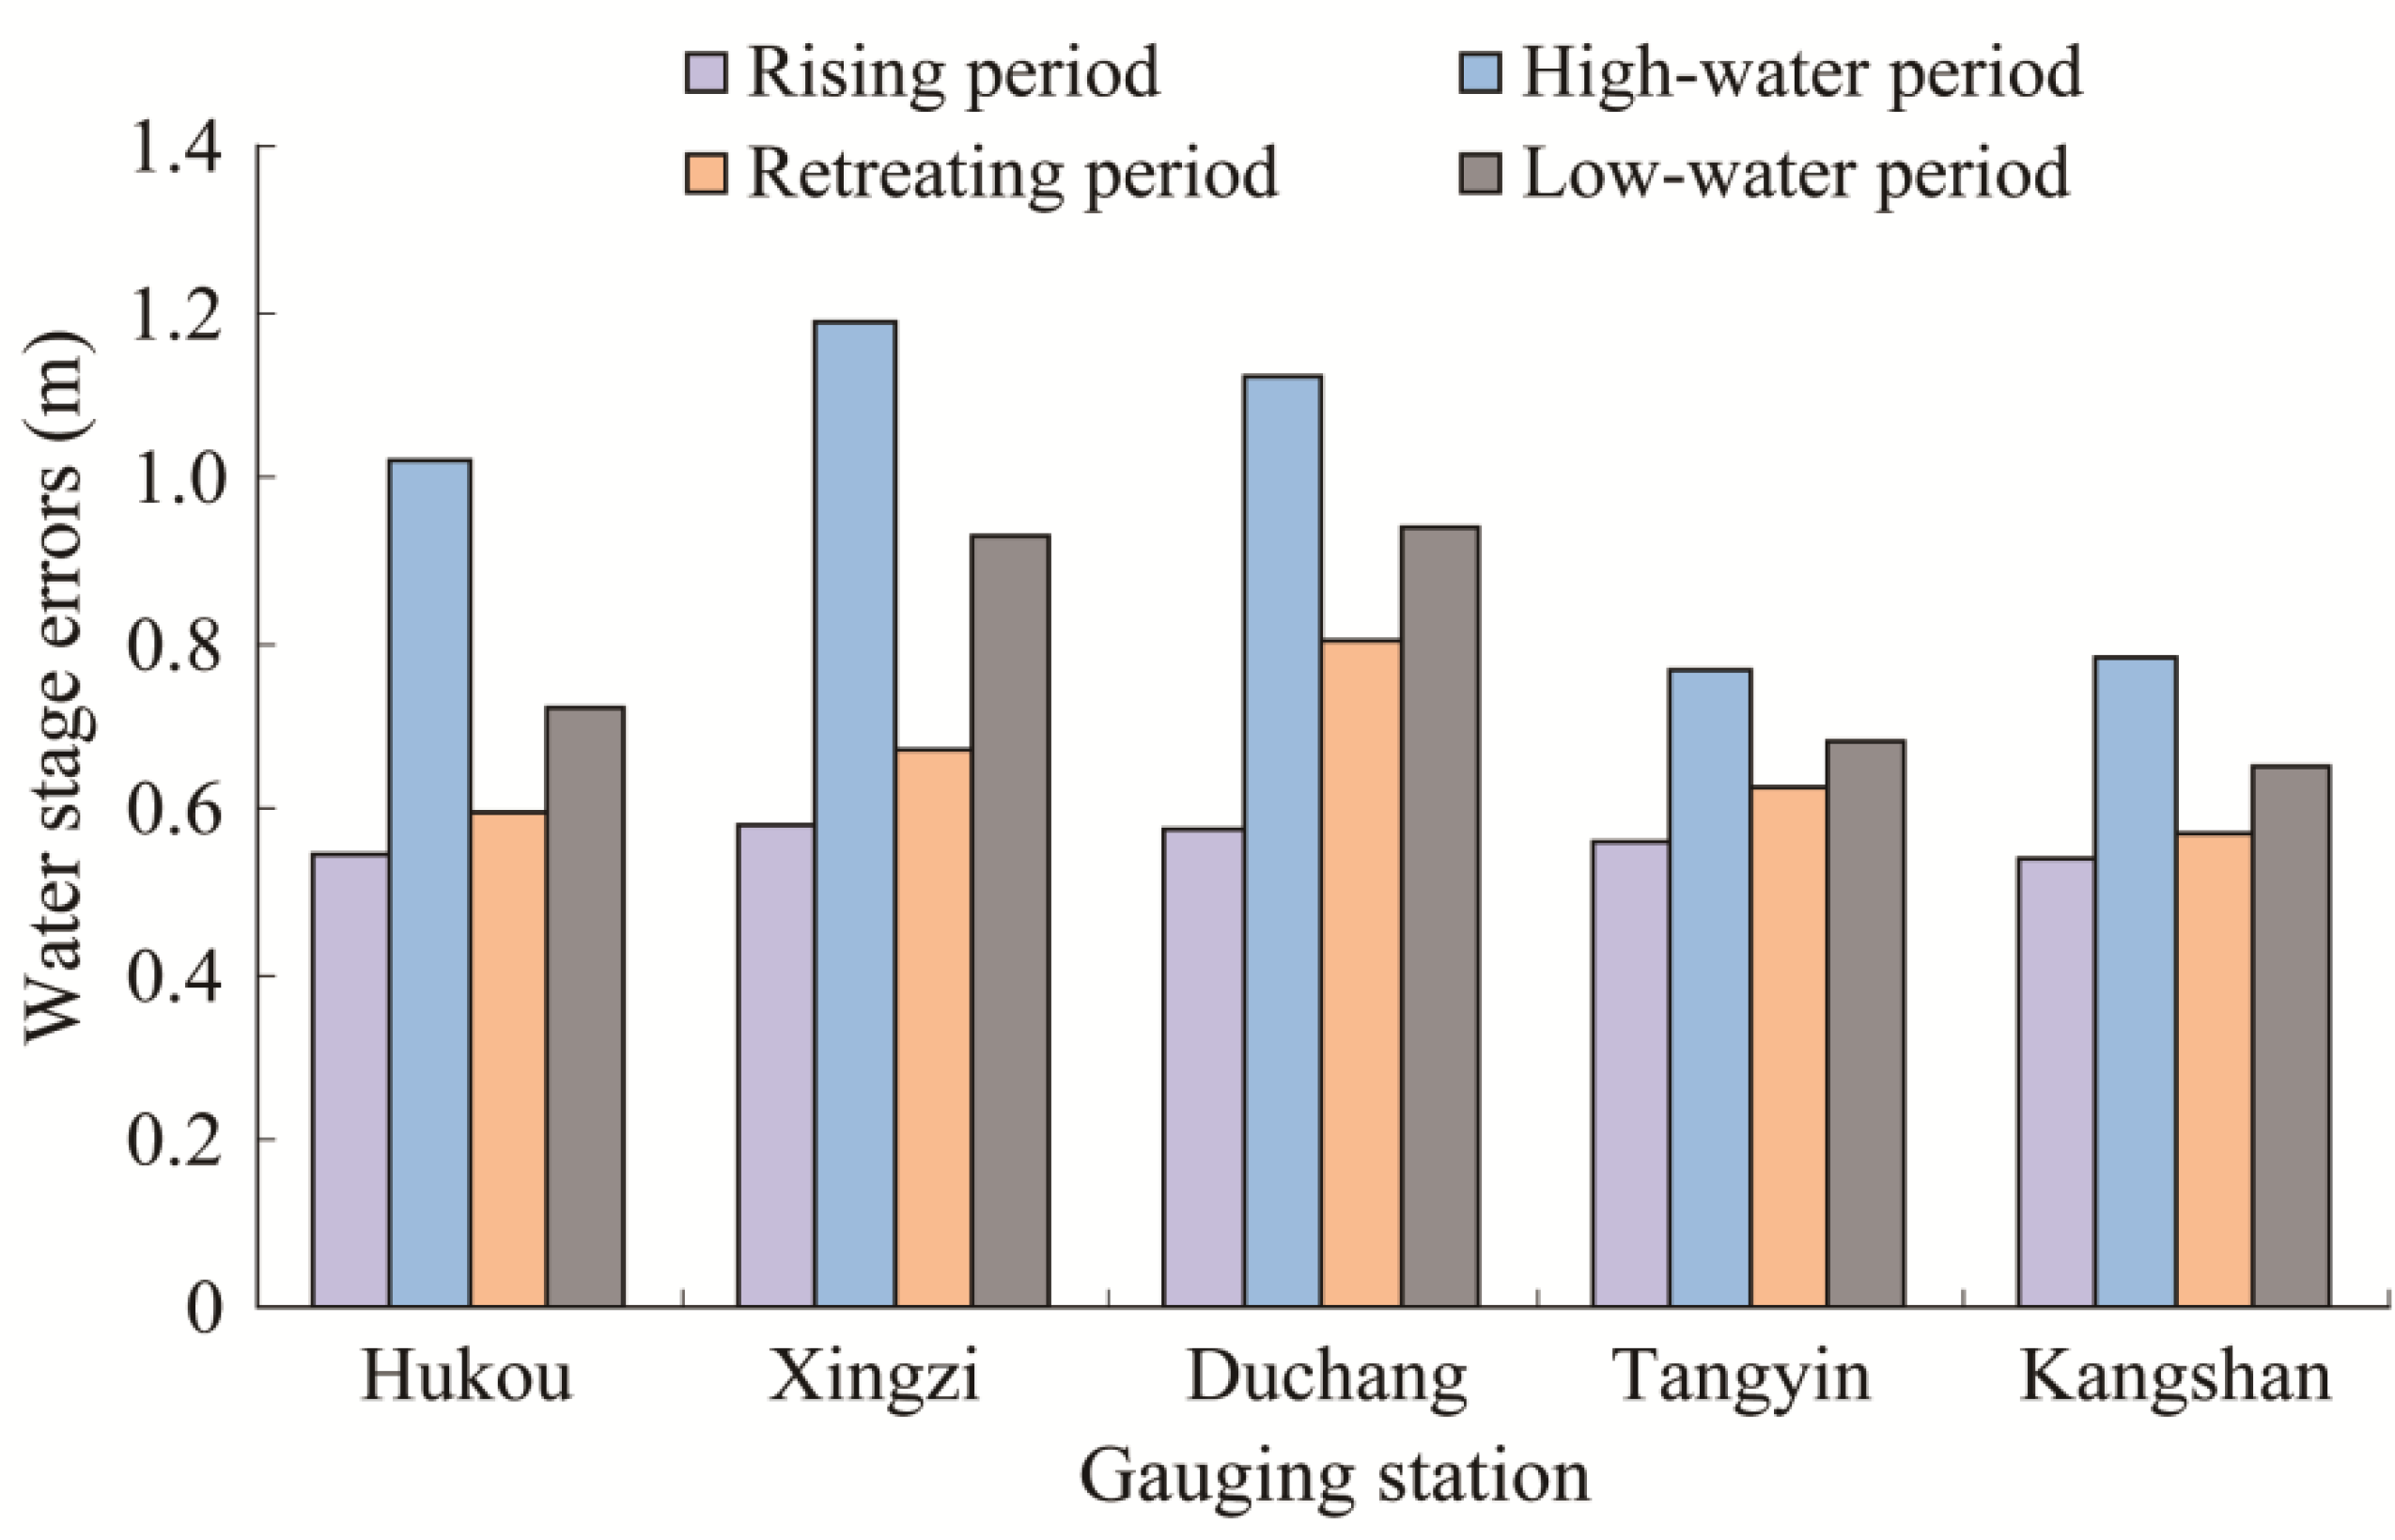
4.1. Accuracy Assessment of Satellite-Derived Water Levels

For satellite-derived water levels at all the gauging stations, comparisons with in situ measurements are shown in Figure 3. The derived results were highly correlated with the in situ measurements at Hukou, Xingzi and Duchang stations, which are located at the north of the lake. The root RMSE and MABE values were 1.09 m and 0.83 m for Hukou, 0.95 m and 0.86 m for Xingzi, and 1.02 m and 0.84 m for Duchang, respectively. The R2 values were relatively lower for Tangyin (R2 = 0.764) and Kangshan (R2 = 0.684). The corresponding RMSE and MABE values were 0.83 m and 0.63m for Tangyin and 0.79 m and 0.65 m for Kangshan, respectively.
Figure 4 depicts the errors of derived water levels at five stations during different water regimes. The mean error was less than 0.8 m during the rising water period (March–May) and the retreating period (September–November). However, the mean error was comparatively large during the high-water (June–August) and low-water periods (December and February). Particularly, the mean error during the high-water period exceeded 1 m at the northern stations (Figure 4). Overall, the mean error was within 10% of the maximum variability of the lake. Inferentially, although the water levels extracted from the MODIS data have relatively large errors during the high-water period, they still reflect overall water level variation patterns. This suggests that the land-water contact method may reveal water level variability in large lakes.
Figure 3. Comparison of derived water level and gauge-observed values at (a) Hukou station, (b) Xingzi station, (c) Duchang station, (d) Tangyin station, and (e) Kangshan station. The number of measurements N is 268.
Remotesensing 07 13466 g003aRemotesensing 07 13466 g003b
Figure 4. Mean absolute bias error of water level between MODIS-derived and gauge station measurements during different water regimes.
Remotesensing 07 13466 g004
The errors may stem from several possible sources associated with the application of the land-water contact method in a large lake. First, the accuracy of the derived water levels depends on the geometric precision of the satellite imagery, as well as on the accuracy of the water body delineation method. It is difficult to precisely link in situ water level measurements with satellite image pixels. Second, the errors of the derived water levels are associated with uncertainties related to the constructed DEM. We used a Monte Carlo simulation method [50] to evaluate how DEM errors impact the derived water levels. The results showed that both DEM grid size and vertical accuracy could have effect on the derived water level. Third, the errors in water body boundaries delineated from remote sensing data may be attributable to the limited spatial resolution of the satellite image. During the low-water seasons, Poyang Lake is separated into hundreds of smaller water bodies. Some water bodies are too small to be accurately delineated as water, and mixed pixels emerge with relatively high frequency. As a result, the mean absolute bias error (MABE) for derived water level was generally higher than that for the rising and retreating water periods (see in Figure 4). During the high-water seasons, the lake appears as one water body, and almost all parts of the lake connect as a whole. In this case, the land-water contact line is only located on the lake bank, but the lake bank is very steep, especially in the northern part, requiring a fine-resolution image to precisely capture water level. During the rising and retreating seasons, the problems associated with these errors are not as important as in the other two periods, and as a result, the derived water level has a lower MABE (Figure 4). Certainly, other factors can also affect the derived water-level, including the accuracy of the lake bathymetric data, the spatial interpolation method and the fluctuation of the lake waves. Particularly, topographic effects may be significant. As shown in Figure 4 and Figure 5, the errors in derived water levels differ between the five stations, an issue that is attributable to topographic variability from north to south. For example, the lake bank is relatively steeper in the north than in the south, resulting in relatively large errors in the north. Although the land-water contact method has proved to be effective, the associated errors deserve further investigation.

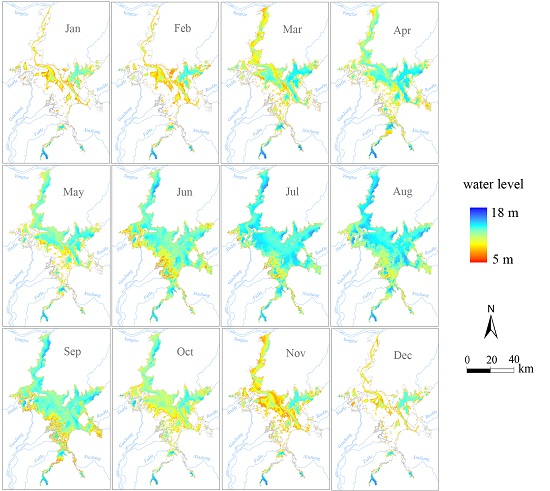
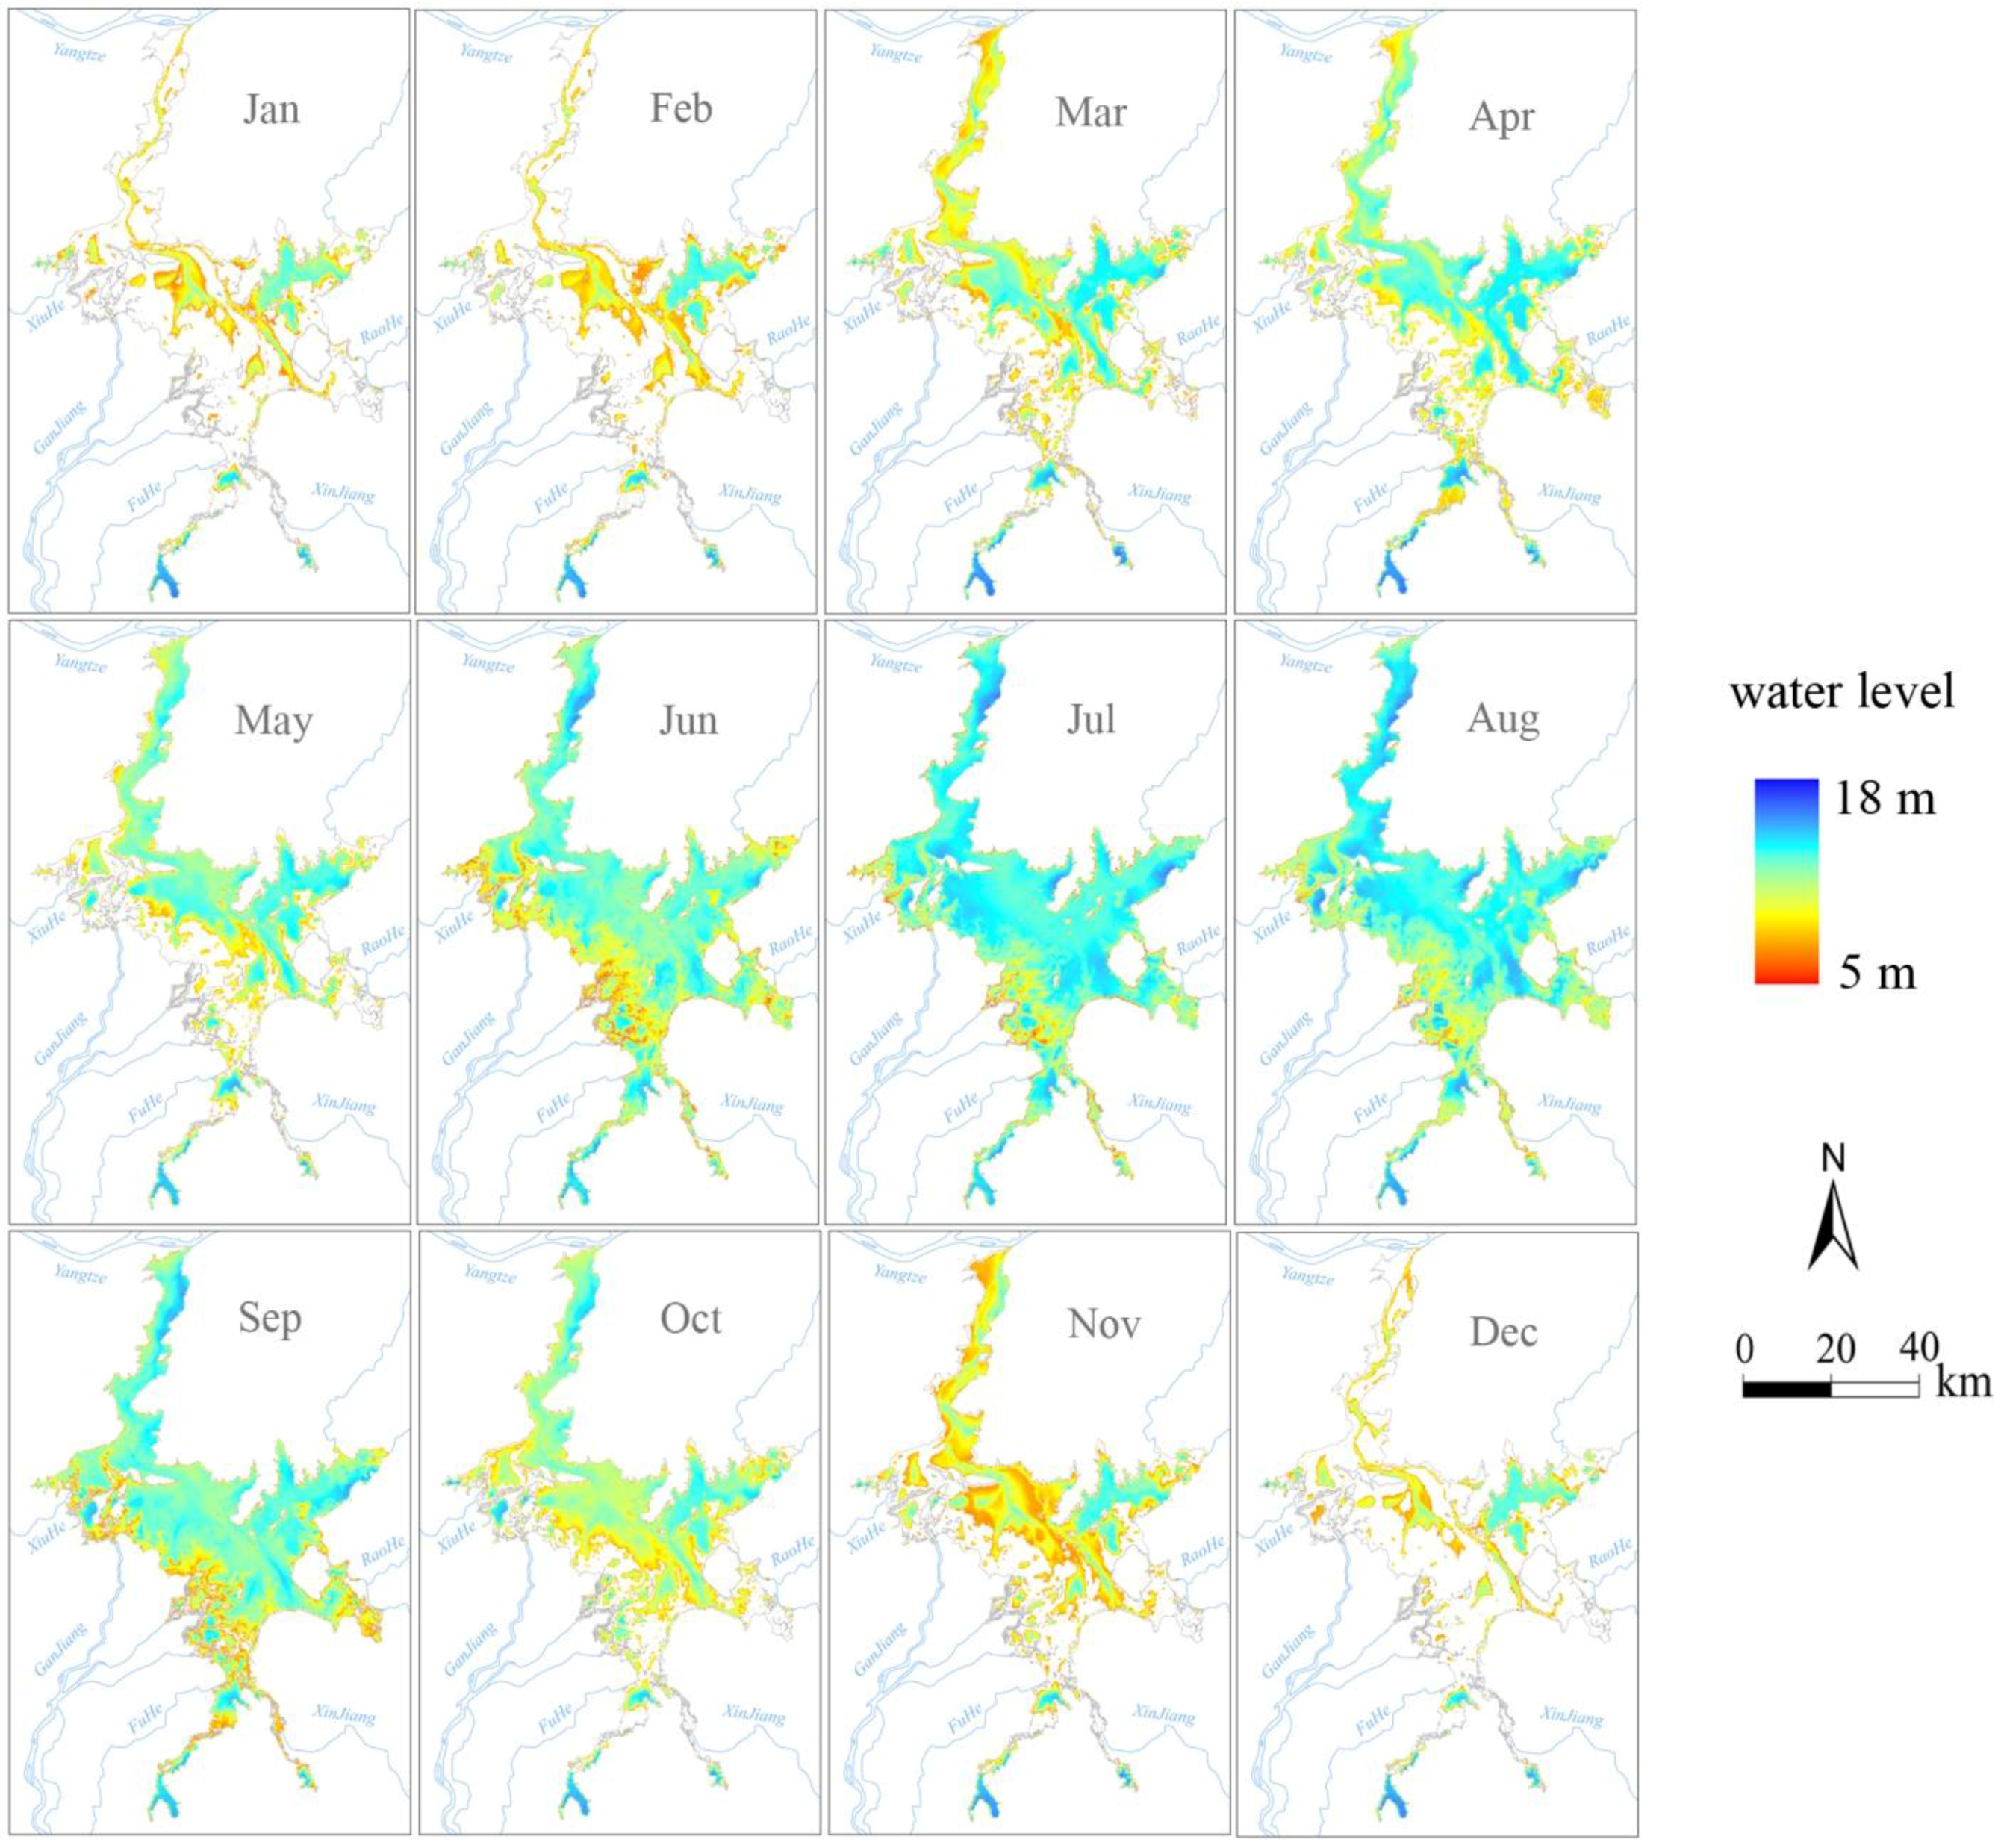
4.2. The Seasonal Water-Level Distribution Pattern

Based on the derived daily water level maps, a monthly mean water level distribution map was generated using average daily values for each month within each cell. Figure 5 shows seasonal spatial variations in water levels for the study period (2000–2012). As an ephemeral lake, Poyang Lake exhibits seasonally varying water covers [43]. During the low-water periods, the lake bottom may be bare ground covered by mud or grass. Therefore, for better visualization, the data of these cells with no water cover have thus been excluded to map the spatial patterns of lake water levels. These values are also listed in Table 1. Lake water levels were generally higher in the southern sections of the main lake, especially during the low-water, rising water and retreating water periods. During the high-water period, water levels became nearly the same throughout the lake. Likewise, the overall monthly mean of water level appeared to have a distinct seasonality (Figure 5, Table 1). The monthly mean during the high-water period was more than 50% higher than that of the low-water period for the entire lake region. With the exception of the lake depressions and several artificial lakes (such as Jinxi Hu, Qinglan Hu and Chenjia Hu), only the main channel was inundated during the low-water period, and this meandered narrowly and exhibited decreased water levels from south (~12 m) to north (~9 m). During the water rising period, water levels gradually increased from north to south, a pattern that was especially dominant in the lake’s main body and nearby Tangyin Island. In this period, water levels across the entire lake exhibited the highest spatial variability in March (SD = 3.94 m) and April (SD = 3.87 m). In contrast, water levels were highest across the lake in July (mean value = 13.58 m), and spatial variability decreased to a minimum, suggesting a flat lake surface in the high-water period (i.e., SD = 2.48 m in July and SD = 2.50 m in August). After that, the water level decreased slowly from south to north, with water levels dropping first in the south and a water level gradient reappearing in the main lake body of the lake. Notably, artificial lakes lying in the southern regions did not change throughout the years. This is primarily because they are disconnected lateral lakes and exist independently of the hydrological influence of Poyang Lake in order to control flooding and facilitate their management [36].
Figure 5. Mean seasonal distribution and variation of water levels during each climatological month between 2000 and 2012. The cells with the inundation frequency of <50% in each calendar month were excluded.
Remotesensing 07 13466 g005
Table 1. Mean value and standard deviation of water levels (unit: m) during each month between 2000 and 2012; these values reveal the inter-seasonal variability of water level.
MonthJanFebMarAprMayJunJulAugSepOctNovDec
Mean6.356.217.888.638.7711.8913.5812.5111.168.536.516.11
Standard Deviation3.503.293.943.873.752.582.482.503.083.713.283.46
To examine the regional differences in annual water level variations, the spatial variation of annual mean water levels was generated (Figure 6). The darker blue color indicates high variation amplitude, and the darker red color indicates low variation amplitude in a cell. Overall, the lake depressions (mainly lying to the east of the main lake body), and the southern artificial lakes exhibited the lowest variation amplitude (0–2 m). Likewise, the variations were small at the entrances to the five rivers because of the hydraulic connectivity between the lake and the rivers. In addition, the main channel of the lake exhibited relatively high variation amplitudes, with differences ranging from 2 m–6 m. On both sides of the lake channel, the variation amplitude increased to 6–8 m. In the estuary delta zones, the magnitude of variation was highest, reaching up to 12–13 m in some regions. This was the most obviously appreciable in the Wucheng National Nature Reserve and Nanji Wetland Nature Reserve, which lie in the southwest of Poyang Lake. Indeed, the high variation amplitude was closely related to the lake inundation or exposure, which is valuable knowledge that may support efforts to increase biodiversity in these regions.
Figure 6. Mean water level variation amplitude (unit: m) between high-water and low-water periods during a year. The darker blue color indicates a higher amplitude of variation, and the darker red color indicates a lower amplitude of variation in a cell.
Remotesensing 07 13466 g006

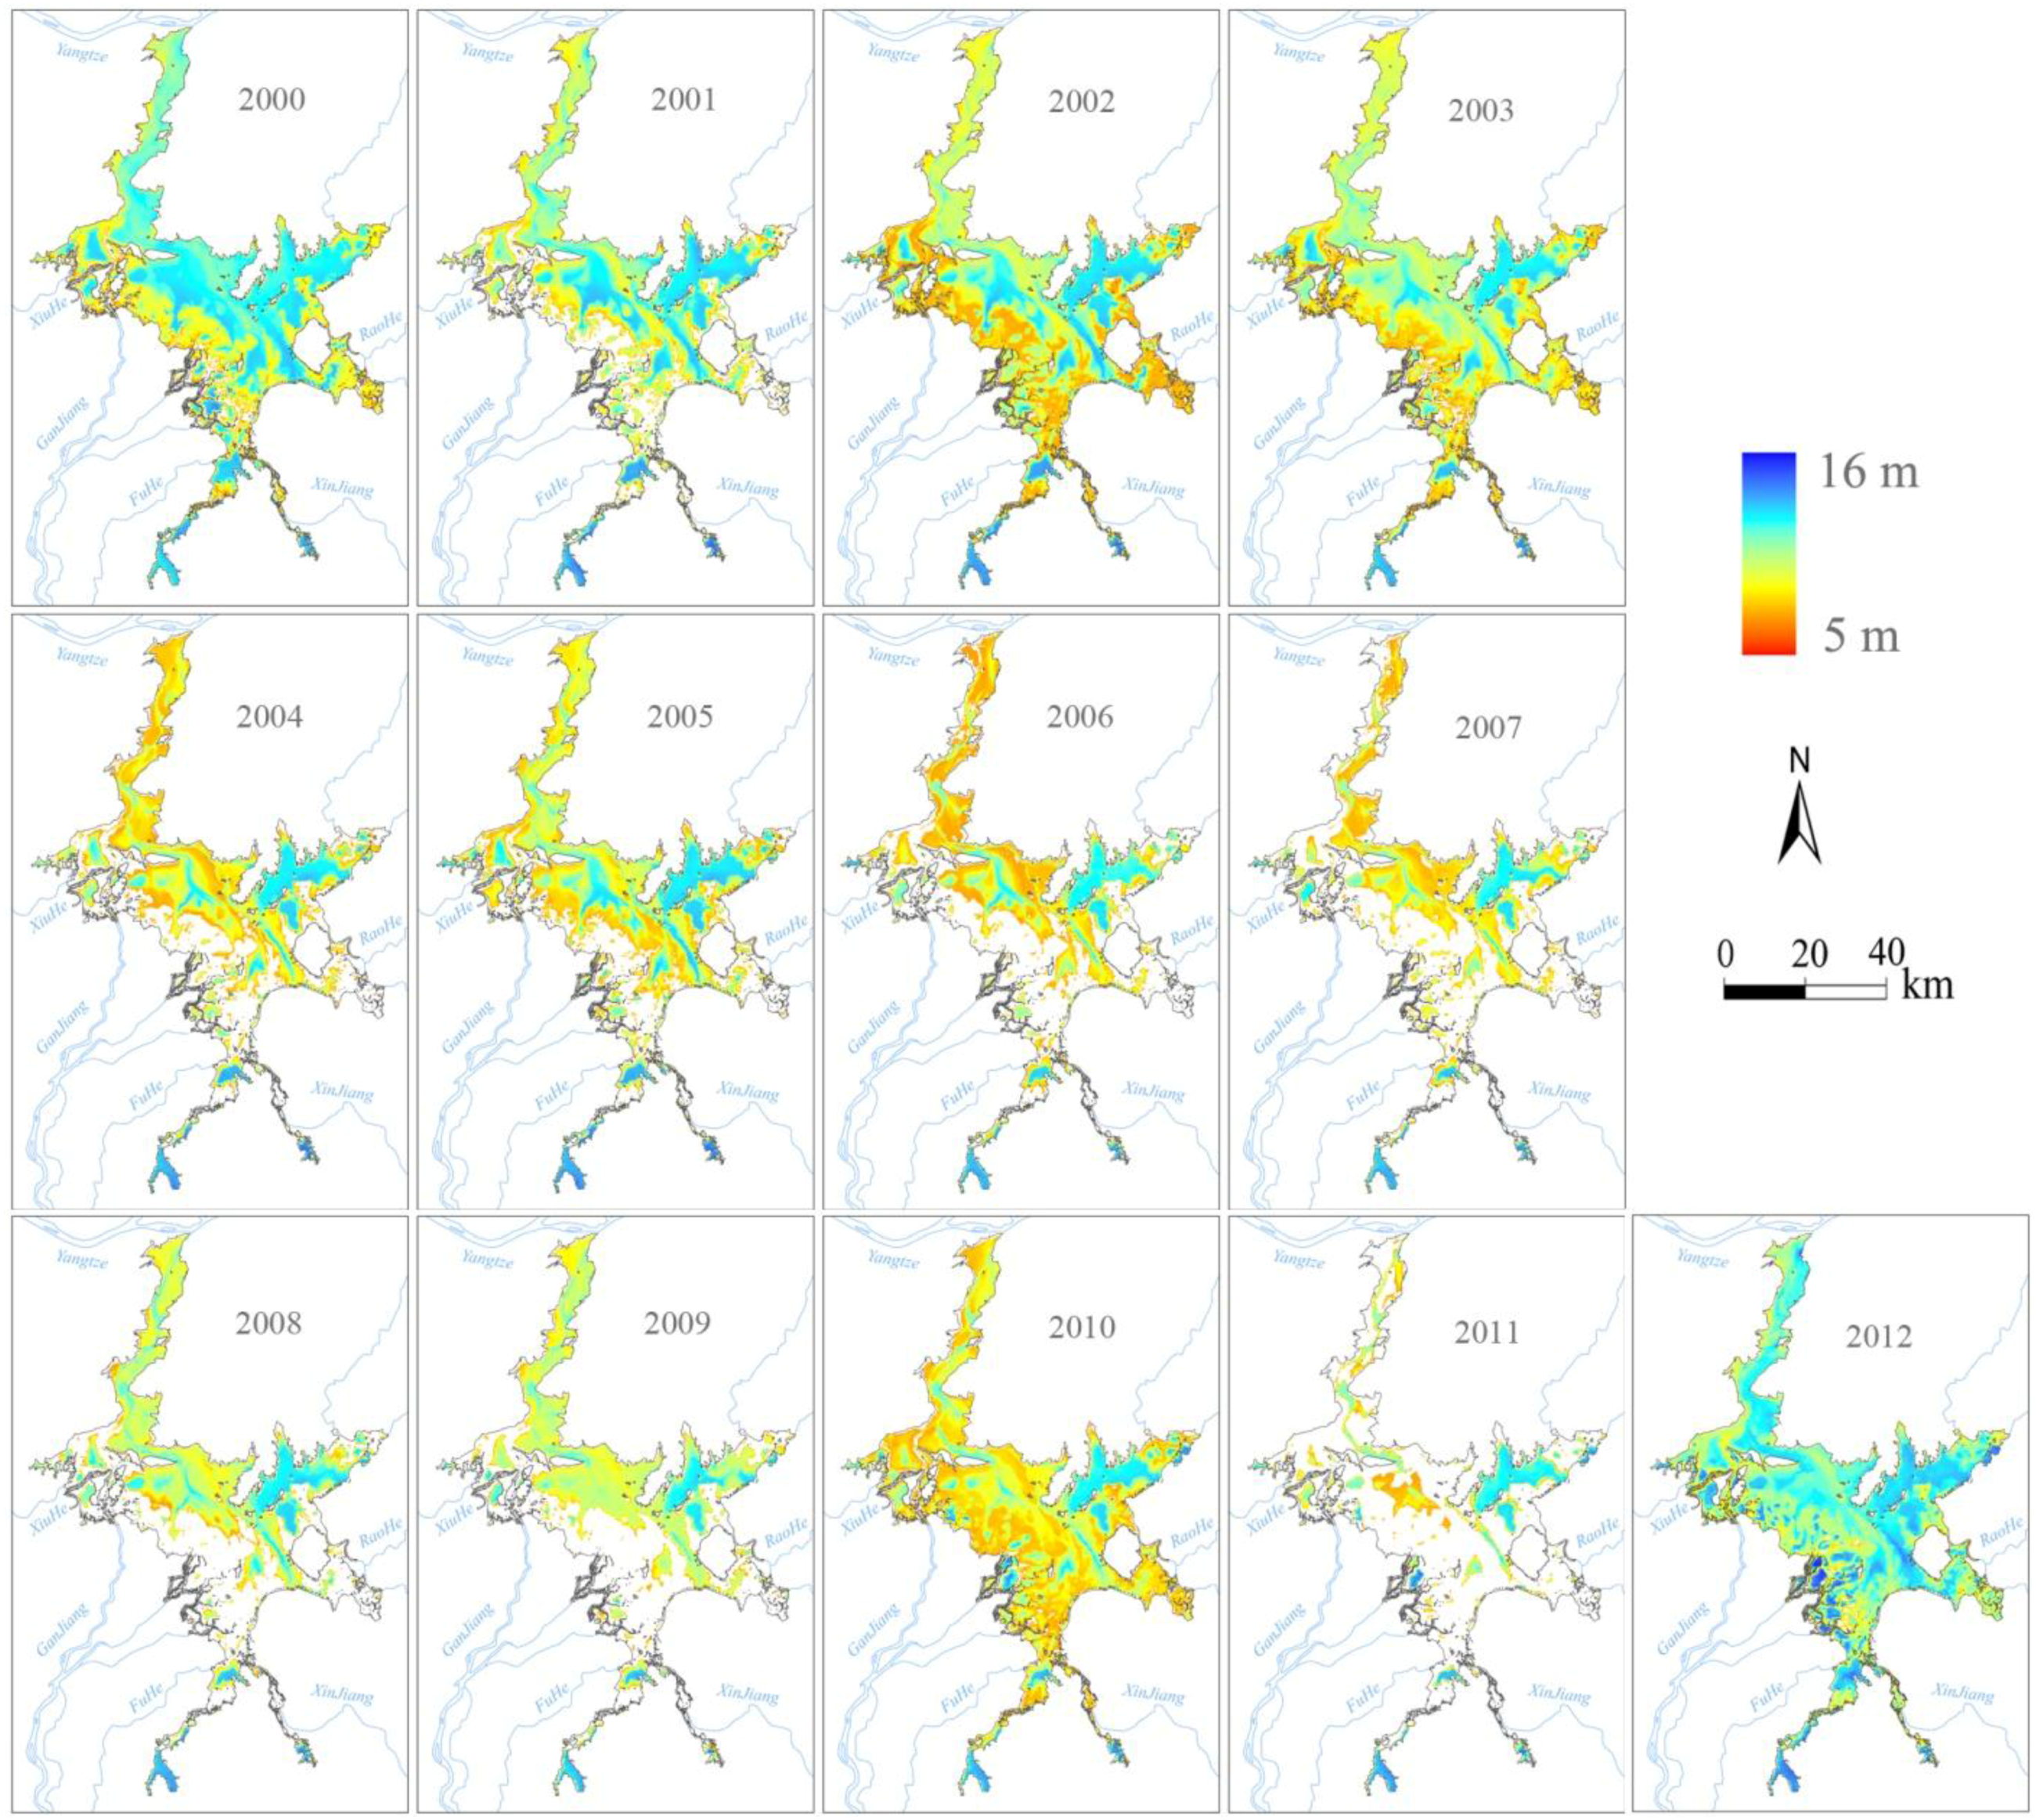
4.3. Inter-Annual Spatial Variability of Water Levels

In addition to the seasonality of water level, the most striking result of this analysis was the inter-annual variability observed in Poyang Lake (Figure 7). Generally, annual mean water levels in the estuary delta zones were lower than those in the northern lake body. This phenomenon was likely controlled by the lake’s bathymetry (i.e., the lake bottom in the south is higher than that in the north). Because water in Poyang Lake normally flows from south to north, the south estuary delta zones may only fill when the northern lake body is at capacity. This may result in relatively low water levels in the southern parts throughout the year. Likewise, significant inter-annual variability was observed throughout the study period, as shown in Figure 7. Before 2003, mean water level in this lake was high and relatively stable. However, during 2003–2011, with the exception of 2010, mean water level in the lake was significantly depressed. The decrease was greatest in 2011, suggesting that the lake and its basin experienced a severe drought in 2011. Indeed, it was reported that Poyang Lake had experienced its worst drought since 2003 [37]. An exceptional decrease in water levels can result in scarcity of water throughout the region, which may directly impact the lake’s ecosystems. In addition, it is evident that comparatively high water levels appeared again in 2012. Mean water level values were generally high throughout the lake, indicating a high water year. This result was consistent with a news report indicating that Poyang Lake rose above the alert water level in 2012 [58].
Figure 7. Inter-annual mean water level distribution of Poyang Lake from 2000–2012. The water level distribution map was generated with 10-month data because of availability of MODIS images in 2000. The cells with the inundation frequency of <50% in each calendar year were excluded.
Remotesensing 07 13466 g007

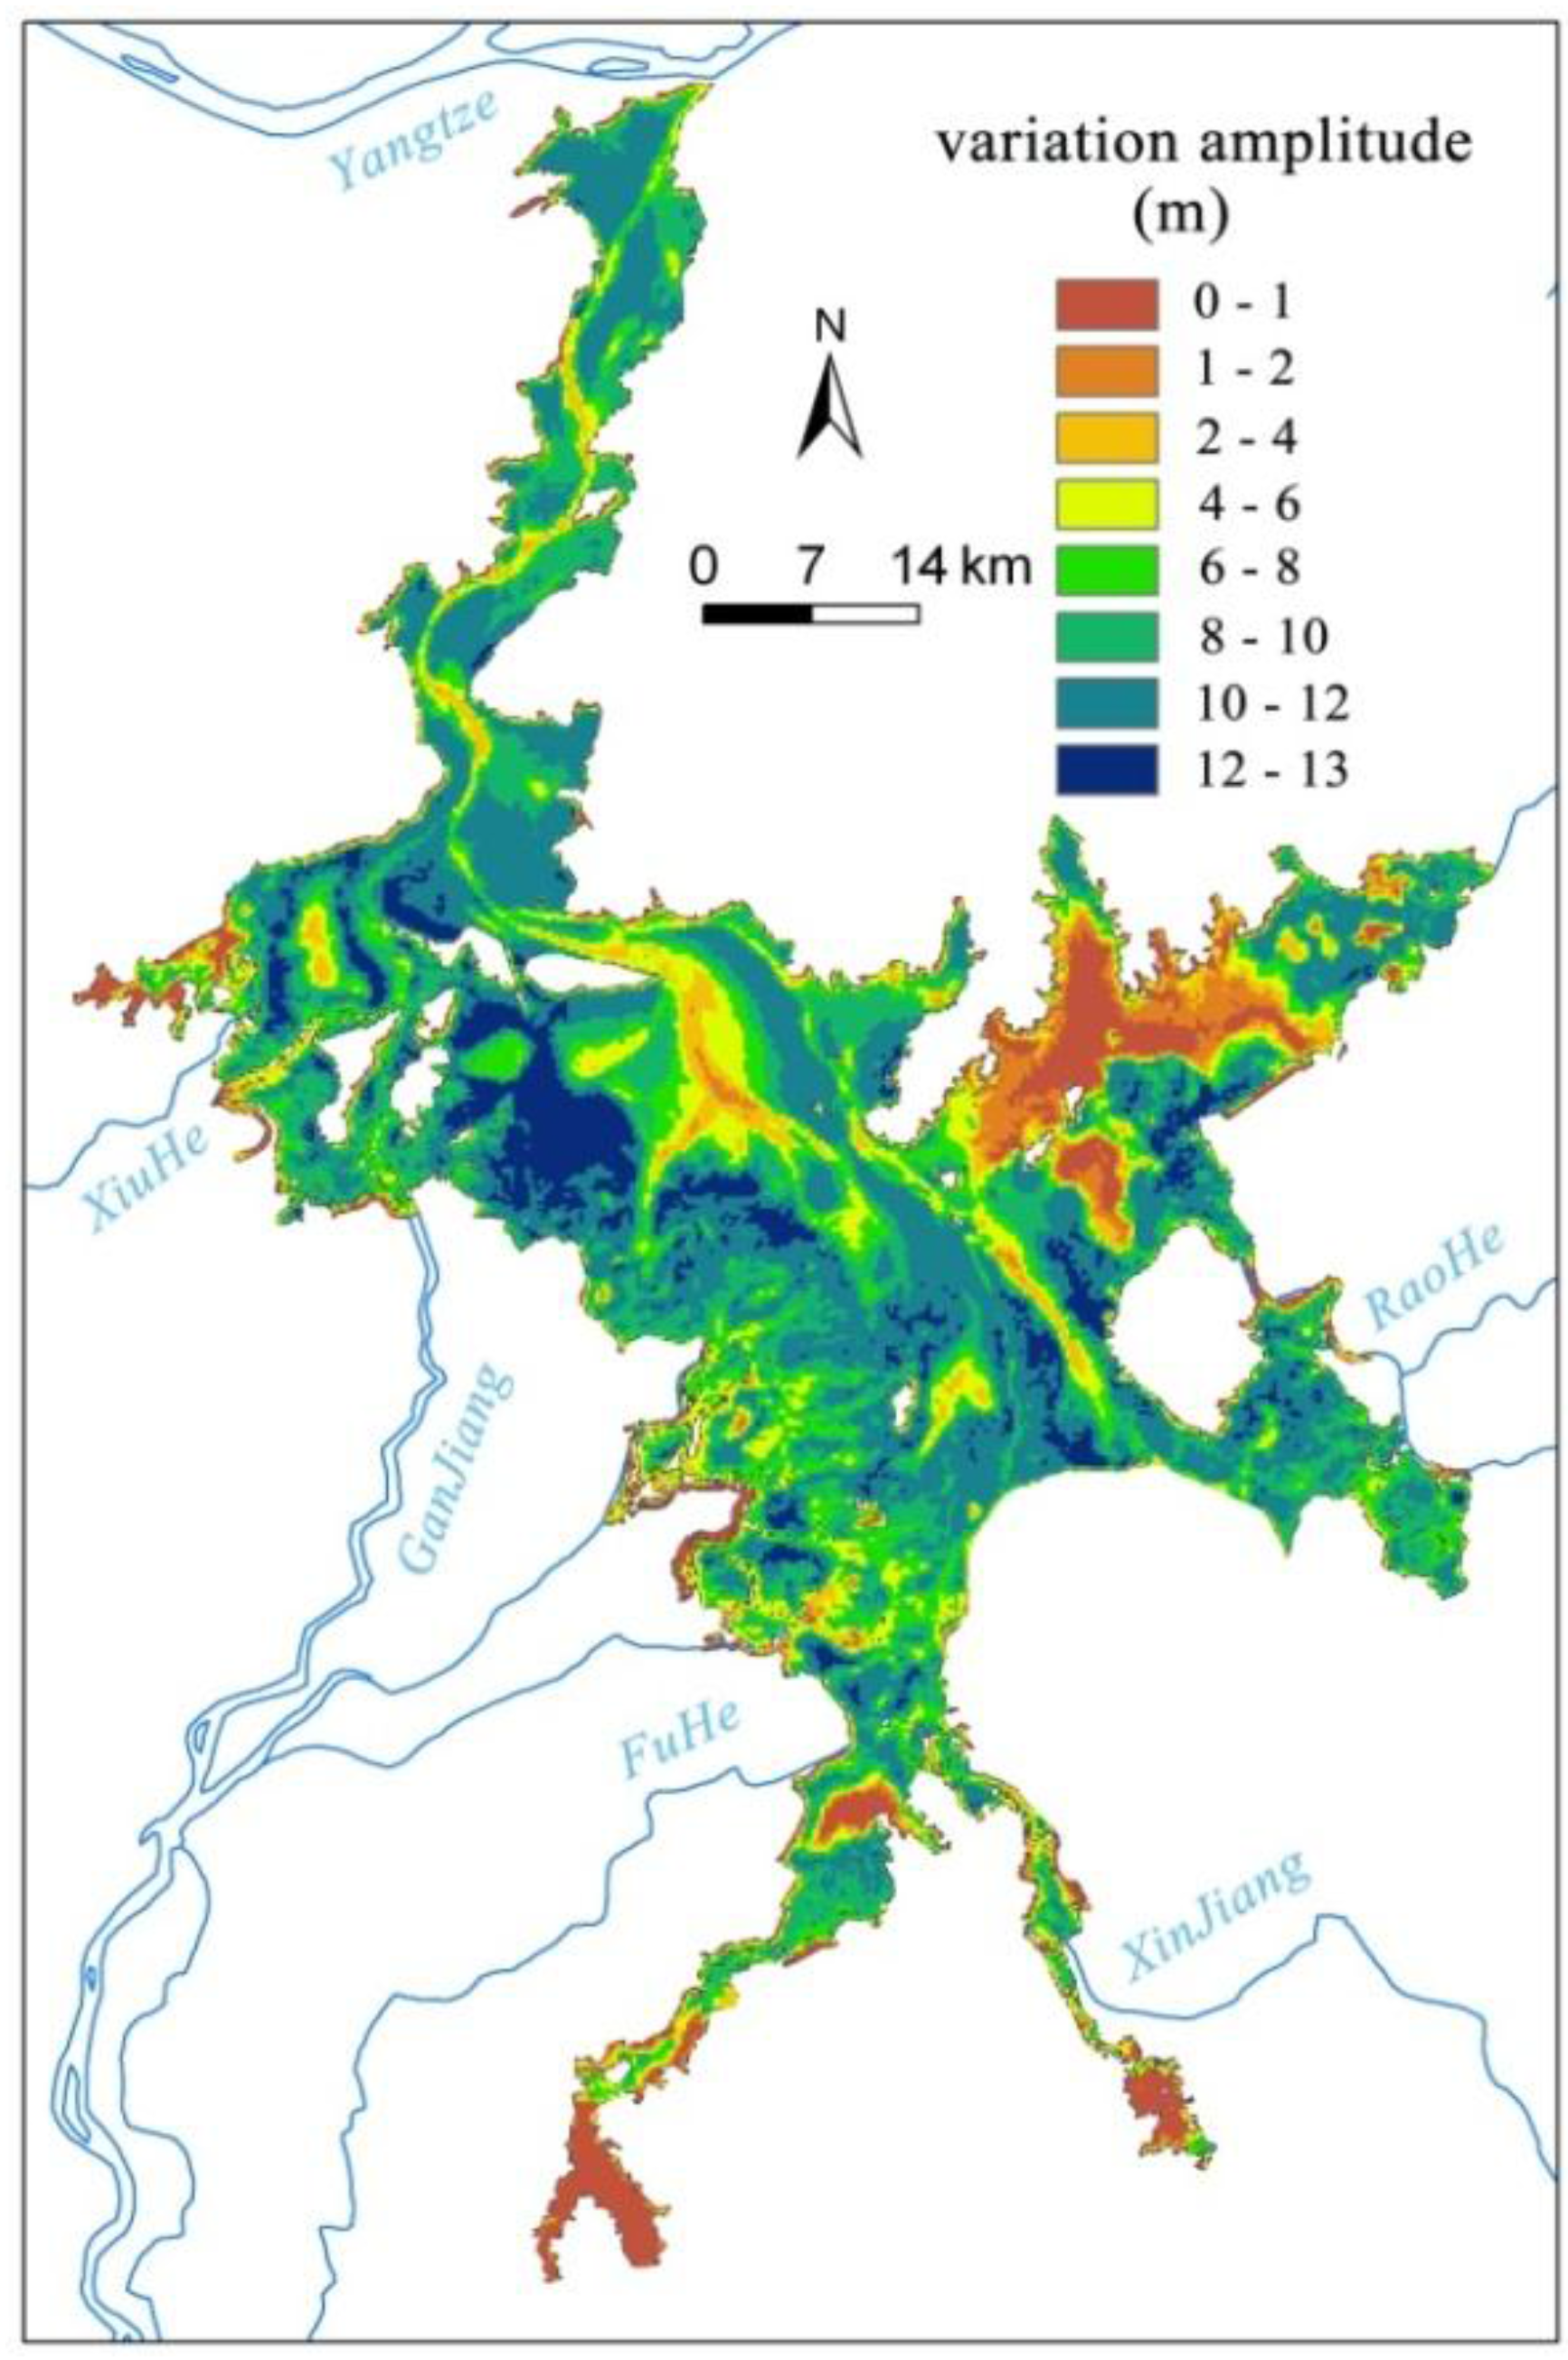
4.4. Water Level Gradient Variability within Poyang Lake

Water level gradient variability is the most important determinant of distribution patterns of plant species in Poyang Lake [39]. To investigate the water level gradient variability during the study period (2000–2012), a spatial analysis that identified space-time water level variability was performed on a distance-time cross section along the main lake channel. The main channel is illustrated as a red line in Figure 1. The water level along this profile was first extracted from the water level distribution maps at a sample interval of 1 km. Then, the extracted values were interpolated to a spatially-averaged water level evolution map from January–December. Figure 8 shows variation patterns of spatially-averaged water levels for three typical water years.
Figure 8. Spatially-averaged water level variation patterns along the north-south profile during different typical years ((a) high-water year (2012); (b) low-water year (2011); (c) multi-year mean). Contour lines show the water height above sea level. The value of the ordinate axis is the profile distance from north to south.
Remotesensing 07 13466 g008
Figure 8a–c represents a typical high-water, a low-water, and multi-year averaged water year (2000–2012), respectively. The distance between the contour lines indicates how much the water level changed over a horizontal distance. The closer the contour lines are to each other, the steeper the water gradients are. The variation pattern for the multi-year average water level depicts two major water regimes (Figure 8c). The first encompassed the dry seasons (January–May and October–December) and the second encompassed the wet seasons (June–September). During the dry seasons, water level gradients were relatively high from north to south. During the wet seasons, water levels were basically the same from south to north. During the high-water year (2012), evenly spaced contour lines suggested a mild water gradient throughout the year. Relatively low water levels appeared in January–May (8–9 m) and November–December (10 m) in the southern region of the lake. In these two periods, the lake formed a narrow water channel with a comparatively high water level gradient (8–9 cm/km) in the south at 128 km. In contrast, during the low-water year (2011), the lake’s mean water level was much lower than throughout 2012, and a large gradient emerged from south to north. The water gradient even reached 30 cm/km, not only in the dry season but also in the wet season. In the wet season (June–September), there was also a large gradient at the southern end of the lake, nearly 128 km from the Hukou station. In the dry season, the large gradient shifted northwards close to 96 km, and a small gradient appeared in the northern section of the lake.

5. Conclusions

This study investigated spatiotemporal variations in water levels across the largest freshwater lake in China using MODIS data collected from 2000–2012. The land-water contact method was applied to derive water levels from both MODIS data and in situ topographic data. This was the first time the MODIS images have been used together with lake bathymetric data to study water levels in a large lake. Validation using gauge data showed that the land-water contact method satisfactorily captured the spatial patterns and seasonal variations of Poyang Lake’s water level fluctuations. R2 ranged from 0.684–0.835, RMSE from 0.79 m–1.09 m, and MABE from 0.65 m–0.86 m at the five gauge stations surrounding the lake. Spatially, errors in the derived water levels were higher at northern stations compared to southern stations. Temporally, errors in the high-water and low-water periods were higher than those found in the rising and retreating water periods. Overall, the errors were within 10% of the maximum variability of the lake, yielding a high degree of confidence that this method reveals complex changes in the lake’s water level. Despite the errors associated with the limited resolution of the MODIS data and complex lake bathymetry over the study region, this study demonstrated the capacity of these data to reveal seasonality and inter-annual trends in the lake’s water level. The assessment provides valuable information for ongoing efforts to improve the land-water contact method using MODIS data for large, complex lakes.
In addition, spatiotemporal changes within the lake were investigated using derived water levels. Temporally, water levels increased over 50% from low-water period to the high-water period across the entire lake region. Spatially, the variation amplitude of water level was relatively low in the inlets of the five tributary rivers throughout year. In contrast, the variation amplitude was relatively high along the main channel of the lake. On both sides of the lake channel, the variation amplitude was between 6 and 8 m, with higher values occurring in the north. The variation amplitude exhibited the highest values in the estuary delta zones. At the inter-annual scale, the water levels were high and remained relatively stable before 2003. From 2003–2011, lake water levels were significantly depressed. This decrease was most striking in 2011, suggesting that the lake experienced a severe drought in 2011.
Our analysis indicated that the land-water contact method had the potential to be applied in mapping water level changes in large lakes. The produced map could supply unprecedented spatial patterns of lake water levels throughout Poyang Lake. The results also provide a data foundation for hydrological and ecological studies, which are valuable for water resources management and ecological conservation over gauge-sparse regions in the large lake.

Acknowledgments

This work was supported by the State Key Program of National Natural Science of China (41430855), National Natural Science Foundation of China (41401506), Natural Science Foundation of Jiangsu Province, China (BK20131056), the 973 Program of the National Basic Research Program of China (2012CB417003), and Key Program of Nanjing Institute of Geography and Limnology of the Chinese Academy of Sciences (NIGLAS2012135001). We thank Miss H Ji for pre-processing of satellite data, and Professor Y Chen for providing bottom topographic data. We are grateful to Professor David Shankman of University of Oklahoma, USA for his constructive suggestions to improve this manuscript.

Author Contributions

Guiping Wu carried out data processing, data analysis and wrote the paper. Yuanbo Liu proposed the main idea, offered guidance to complete the work and made revisions to the manuscript.

Conflicts of Interest

The authors declare no conflicts of interest.

References

  1. Beeton, A.M. Large freshwater lakes: Present state, trends, and future. Environ. Conserv. 2002. [Google Scholar] [CrossRef]
  2. Tiner, R.W. Search of Swampland: A Wetland Sourcebook and Field Guide; Rutgers University Press: New Brunswick, NJ, USA, 2005. [Google Scholar]
  3. Williamson, C.E.; Saros, J.E.; Vincent, W.F.; Smol, J.P. Lakes and reservoirs as sentinels, integrators, and regulators of climate change. Limnol. Oceanogr. 2009, 54, 2273–2282. [Google Scholar] [CrossRef]
  4. Vincent, W.F. Effects of climate change on lakes. In Encyclopedia of Inland Waters; Likens, G.E., Ed.; Academic Press, Elsevier: Oxford, UK, 2009; pp. 55–60. [Google Scholar]
  5. Vassiljev, J.; Harrison, S.P.; Haxeltine, A. Recent lake-level and outflow variations at Lake Viljandi, Estonia: Validation of a coupled lake-catchment modelling scheme for climate change studies. J. Hydrol. 1995, 170, 63–77. [Google Scholar] [CrossRef]
  6. Kennedy, T.A. Levels at Gauging Stations: U.S. Geological Survey Techniques and Methods 3-A19; 2010. Available online: http://pubs.usgs.gov/tm/tm3A19/ (accessed on 9 January 2013).
  7. Alsdorf, D.E.; Lettenmaier, D.P. Tracking fresh water from space. Science. 2003, 301, 1491–1494. [Google Scholar] [CrossRef] [PubMed]
  8. Smith, L.C. Satellite remote sensing of river inundation area, stage, and discharge: A review. Hydrol. Process. 1997, 11, 1427–1439. [Google Scholar] [CrossRef]
  9. Alsdorf, D.E.; Rodriguez, E.; Letternmaier, D.P. Measuring surface water from space. Rev. Geophys. 2007. [Google Scholar] [CrossRef]
  10. Schumann, G.; Pappenberger, F.; Matgen, P. Estimating uncertainty associated with water stages from a single SAR image. Adv. Water Resour. 2008, 31, 1038–1047. [Google Scholar] [CrossRef]
  11. Jean-François, C.; Sylvain, B.; Adalbert, A.; Muriel, B.N.; Mélanie, B. Global surveys of reservoirs and lakes from satellites and regional application to the Syrdarya river basin. Environ. Res. Lett. 2015. [Google Scholar] [CrossRef]
  12. Schumann, G.; Bates, P.D.; Horritt, M.S.; Matgen, P.; Pappenberger, F. Progress in integration of remote sensing-derived flood extent and stage data and hydraulic models. Rev. Geophys. 2009. [Google Scholar] [CrossRef]
  13. Musa, Z.N.; Popescu, I.; Mynett, A. A review of applications of satellite SAR, optical, altimetry and DEM data for surface water modeling, mapping and parameter estimation. Hydrol. Earth. Syst. Sci. Discuss. 2015, 12, 4857–4878. [Google Scholar] [CrossRef]
  14. Frappart, F.; Calmant, S.; Cauhope, M.; Seyler, F.; Cazenave, A. Preliminary results of ENVISAT RA-2 derived water levels validation over the Amazon basin. Remote Sens. Environ. 2006, 100, 252–264. [Google Scholar] [CrossRef] [Green Version]
  15. Wang, X.; Gong, P.; Zhao, Y.; Xu, Y.; Cheng, X.; Niu, Z.; Luo, Z.; Huang, H.; Sun, F.; Li, X. Water-level changes in China’s large lakes determined from ICESat/GLAS data. Remote Sens. Environ. 2013, 132, 131–144. [Google Scholar] [CrossRef]
  16. Arsen, A.; Crétaux, J-F.; Abarca-Del-Rio, R. Use of SARAL/AltiKa over mountainous lakes, intercomparison with Envisat mission. Mar. Geod. 2015, 38, 534–548. [Google Scholar] [CrossRef]
  17. Sulistioadi, Y.B.; Tseng, K.-H.; Shum, C.K.; Hidayat, H.; Sumaryono, M.; Suhardiman, A.; Setiawan, F.; Sunarso, S. Satellite radar altimetry for monitoring small rivers and lakes in Indonesia. Hydrol. Earth Syst. Sci. 2015, 19, 341–359. [Google Scholar] [CrossRef]
  18. Ričko, M.; Birkett, C.M.; Carton, J.A.; Crétaux, J.E. Intercomparison and validation of continental water level products derived from satellite radar altimetry. J. Appl. Remote. Sens. 2012, 6, 1–23. [Google Scholar] [CrossRef]
  19. Crétaux, J.F.; Stéphane, C.; Romanovski, V.; Shabunin, A.; Lyard, F.; Bergé Nguyen, M.; Cazenave, A.; Hernandez, Fabrice.; Perosanz, F. An absolute calibration site for radar altimeters in the continental domain: Lake Issykkul in Central Asia. J. Geod. 2009, 83, 723–735. [Google Scholar] [CrossRef]
  20. Yi, Y.C.; Kouraev, A.V.; Shum, C.K.; Vuglinsky, V.S.; Crétaux, J-F.; Calmant, S. The performance of altimeter waveform retrackers at Lake Baikal. Terr. Atmos. Ocean. Sci. 2013, 24, 513–519. [Google Scholar] [CrossRef]
  21. Frappart, F.; Papa, F.; Famiglietti, J.S.; Prigent, C.; Rossow, W.B.; Seyler, F. Interannual variations of river water storage from a multiple satellite approach: A case study for the Rio Negro River basin. J. Geophys. Res. 2008. [Google Scholar] [CrossRef]
  22. Baup, F.; Frappart, F.; Maubant, J. Combining high-resolution satellite images and altimetry to estimate the volume of small lakes. Hydrol. Earth Syst. Sci. 2014, 18, 2007–2020. [Google Scholar] [CrossRef]
  23. Pan, F.F.; Nichols, J. Remote sensing of river stage using the cross-sectional inundation area-river stage relationship (IARSR) constructed from digital elevation model data. Hydrol. Process. 2013, 27, 3596–3606. [Google Scholar] [CrossRef]
  24. Al-khudhairy, D.H.A.; Leemhuis, C.; Hoffman, V.; Calaon, R.; Shepherd, I.M.; Thompson, J.R.; Gavin, H.; Gasca-Tucker, D.L. Monitoring wetland ditch water levels in the North Kent Marshes using Landsat TM imagery and ground-based measurements. Hydrol. Sci. J. 2001, 46, 585–597. [Google Scholar] [CrossRef]
  25. Bates, P.D.; Neal, J.C.; Alsdorf, D.; Schumann, G. Observing global surface water flood dynamics. Surv. Geophys. 2014, 35, 839–852. [Google Scholar] [CrossRef]
  26. Wdowinski, S.; Kim, S.W.; Amelung, F.; Dixon, T.H.; Miralles-Wilhelm, F.; Sonenshein, R. Space-based detection of wetland’s detection of wetland’s surface water level changes from L-band SAR interferometry. Remote Sens. Environ. 2008, 112, 681–696. [Google Scholar] [CrossRef]
  27. Alsdorf, D.E.; Melack, J.M.; Dunne, T.; Mertes, A.K.; Hess, L.L.; Smith, L.C. Interferometric radar measurements of water level changes on the Amazon floodplain. Nature 2000, 404, 174–177. [Google Scholar] [CrossRef] [PubMed]
  28. Alsdorf, D.E.; Birkett, C.M. Water level changes in a large Amazon Lake measured with spaceborne radar interferometry and alimetry. Geophys. Res. Lett. 2001, 28, 2671–2674. [Google Scholar] [CrossRef]
  29. Hong, S.H.; Wdowinski, S. Multitemporal multitrack monitoring of wetland water levels in the Florida Everglades using ALOS PALSAR data with interferometric processing. IEEE Geosci. Remote Sens. Lett. 2014, 11, 1355–1359. [Google Scholar] [CrossRef]
  30. Durand, M.; Rodriguez, E.; Alsdorf, D.E.; Trigg, M. Estimating river depth from remote sensing swath interferometry measurements of river height, slope, and width. IEEE. J. Sel. Top. Appl. Earth Obs. Remote Sens. 2010, 3, 20–31. [Google Scholar] [CrossRef]
  31. Matgen, P.; Schumann, G.; Henry, J.-B.; Hoffmann, L.; Pfister, L. Integration of SAR-derived inundation areas, high precision topographic data and a river flow model toward real-time flood management. Int. J. Appl. Earth. Obs. Geoinf. 2007, 9, 247–263. [Google Scholar] [CrossRef]
  32. Raclot, D. Remote sensing of water levels on floodplains: a spatial approach guided by hydraulic functioning. Int. J. Remote Sens. 2006, 27, 2553–2574. [Google Scholar] [CrossRef]
  33. Schumann, G.; Matgen, P.; Cutler, M.E.J.; Black, A.; Hoffmann, L.; Pfister, L. Comparison of remotely sensed water stages from LiDAR, topographic contours and SRTM. ISPRS J. Photogramm. Remote Sens. 2008, 63, 283–296. [Google Scholar] [CrossRef]
  34. Zwenzner, H.; Voigt, S. Improved estimation of flood parameters by combining space based SAR data with very high resolution digital elevation data. Hydrol. Earth Syst. Sci. 2009, 13, 567–576. [Google Scholar] [CrossRef]
  35. Finlayson, M.; Harris, J.; McCartney, M.; Lew, Y.; Zhang, C. Report on Ramsar Visit to Poyang Lake Ramsar Site, PR China, Report Prepared on behalf of the Secretariat of the Ramsar Convention. 2010.
  36. Shankman, D.; Keim, B.D.; Song, J. Flood frequency in China’s Poyang Lake region: Trends and teleconnections. Int. J. Climatol. 2006, 26, 1255–1266. [Google Scholar] [CrossRef]
  37. Liu, Y.; Wu, G.; Zhao, X. Recent declines in China’s largest freshwater lake: Trend or regime shift? Environ. Res. Lett. 2013. [Google Scholar] [CrossRef]
  38. Wu, G.P.; Liu, Y.B. Satellite-based detection of water surface variation in China’s largest freshwater lake in response to hydro-climatic drought. Int. J. Remote Sens. 2014, 35, 4511–4558. [Google Scholar] [CrossRef]
  39. Zhang, M.; Ni, L.; Xu, J.; He, L.; Fu, H.; Liu, Z. Annual dynamics of the wetland plants community in Poyang Lake in response to water-level variations. Res. Environ. Sci. 2013, 26, 1057–1063. (In Chinese) [Google Scholar]
  40. Decharme, B.; Douville, H.; Prigent, C.; Papa, F.; Aires, F. A new river flooding scheme for global climate applications: Off-line validation over South Amercia. J. Geophys. Res. 2008, 113. [Google Scholar] [CrossRef]
  41. Paillisson, J.M.; Marion, L. Water level fluctuations for managing excessive plant biomass in shallow lakes. Ecol. Eng. 2011, 37, 241–247. [Google Scholar] [CrossRef]
  42. Guo, H.; Hu, Q.; Zhang, Q.; Feng, S. Effects of the Three Gorges Dam on Yangtze River flow and river interaction with Poyang Lake, China: 2003–2008. J. Hydrol. 2012, 416, 19–27. [Google Scholar] [CrossRef]
  43. Wu, G.; Liu, Y. Capturing variations in inundation with satellite remote sensing in a morphologically complex, large lake. J. Hydrol. 2015, 523, 14–23. [Google Scholar] [CrossRef]
  44. Zhang, Q.; Ye, X.; Werner, A.D.; Li, Y.; Yao, J.; Li, X.; Xu, C. An investigation of enhanced recessions in Poyang Lake: Comparison of Yangtze River and local catchment impacts. J. Hydrol. 2014, 517, 425–434. [Google Scholar] [CrossRef]
  45. Hui, F.; Xu, B.; Huang, H.; Yu, Q.; Gong, P. Modelling spatial-temporal change of Poyang Lake using multitemporal Landsat imagery. Int. J. Remote Sens. 2008, 29, 5767–5784. [Google Scholar] [CrossRef]
  46. Feng, L.; Hu, C.; Chen, X.; Cai, X.; Tian, L.; Gan, W. Assessment of inundation changes of Poyang Lake using MODIS observations between 2000 and 2010. Remote Sens. Environ. 2012, 121, 80–92. [Google Scholar] [CrossRef]
  47. Qi, S.; Zhang, X.; Wang, D.; Zhu, J.; Fang, C. Study of morphologic change in Poyang Lake basin caused by sand dredging using multi-temporal Landsat images and DEMs. Int. Arch. Photogramm. Remote Sens. Spat. Inf. Sci. 2014, XL-1, 355–362. [Google Scholar] [CrossRef]
  48. Wise, S.M. Effect of differing DEM creation methods on the results from a hydrological model. Comput. Geosci. 2007, 33, 1351–1365. [Google Scholar] [CrossRef]
  49. Axelsson, P. DEM generation from laser scanner data using adaptive TIN models. Int. Arch. Photogram. Remote Sens. 2000, 33, 111–118. [Google Scholar]
  50. Wechsler, S.P.; Charles, N.K. Quantifying DEM uncertainty and its effect on topographic parameters. Photogramm. Eng. Remote Sens. 2006, 72, 1081–1090. [Google Scholar] [CrossRef]
  51. Goward, S.N.; Markham, B.; Dye, D.G.; Dulaney, W.; Yang, J. Normalized difference vegetation index measurements from the advanced very high resolution radiometer. Remote Sens. Environ. 1991, 35, 257–277. [Google Scholar] [CrossRef]
  52. McFeeters, S.K. The use of the normalized difference water index (NDWI) in the delineation of open water features. Int. J. Remote Sens. 1996, 17, 1425–1432. [Google Scholar] [CrossRef]
  53. Jain, S.K.; Singh, R.D.; Jain, M.K.; Lohani, A.K. Delineation of flood-prone areas using remote sensing techniques. Water Resour. Manag. 2005, 19, 333–347. [Google Scholar] [CrossRef]
  54. Bryant, R.G. Application of AVHRR to monitoring a climatically sensitive playa. Case study: Chottel Djerid, southern Tunisia. Earth Surf. Proc. Land. 1999, 24, 283–302. [Google Scholar] [CrossRef]
  55. Liu, Y.; Song, P.; Peng, J.; Ye, C. A physical explanation of the variation in threshold for delineating terrestrial water surface from multi-temporal images: Effects of radiometric correction. Int. J. Remote Sens. 2012, 33, 5862–5875. [Google Scholar] [CrossRef]
  56. Li, J.; Heap, A.D. A Review of Spatial Interpolation Methods for Environmental Scientists; Geoscience Australia: Canberra, ACT, Australia, 2008.
  57. Goovaerts, P. Geostatistics for Natural Resources Evaluation; Oxford University Press: New York, NY, USA, 1997. [Google Scholar]
  58. Poyang Lake rises higher than alert level. Available online: http://www.chinadaily.com.cn/photo/2012-08/13/content_15670620_2.htm (accessed on 12 May 2015).

