Article

Performance of High Resolution Satellite Rainfall Products over Data Scarce Parts of Eastern Ethiopia

1
Department for Geology, Technische Universität Bergakademie Freiberg, Freiberg, 09599 Gustav-Zeuner-Str. 12, Germany
2
Water and Land Resource Centre, P.O.Box 3880, Addis Ababa, Ethiopia
3
Department of Earth and Environment, Florida International University, Miami, FL 33199, USA
*
Author to whom correspondence should be addressed.
Remote Sens. 2015, 7(9), 11639-11663; https://doi.org/10.3390/rs70911639
Submission received: 7 April 2015 / Revised: 24 August 2015 / Accepted: 7 September 2015 / Published: 11 September 2015
(This article belongs to the Special Issue Remote Sensing of Water Resources)

Abstract

:
Accurate estimation of rainfall in mountainous areas is necessary for various water resource-related applications. Though rain gauges accurately measure rainfall, they are rarely found in mountainous regions and satellite rainfall data can be used as an alternative source over these regions. This study evaluated the performance of three high-resolution satellite rainfall products, the Tropical Rainfall Measuring Mission (TRMM 3B42), the Global Satellite Mapping of Precipitation (GSMaP_MVK+), and the Precipitation Estimation from Remotely-Sensed Information using Artificial Neural Networks (PERSIANN) at daily, monthly, and seasonal time scales against rain gauge records over data-scarce parts of Eastern Ethiopia. TRMM 3B42 rain products show relatively better performance at the three time scales, while PERSIANN did much better than GSMaP. At the daily time scale, TRMM correctly detected 88% of the rainfall from the rain gauge. The correlation at the monthly time scale also revealed that the TRMM has captured the observed rainfall better than the other two. For Belg (short rain) and Kiremt (long rain) seasons, the TRMM did better than the others by far. However, during Bega (dry) season, PERSIANN showed a relatively good estimate. At all-time scales, noticing the bias, TRMM tends to overestimate, while PERSIANN and GSMaP tend to underestimate the rainfall. The overall result suggests that monthly and seasonal TRMM rainfall performed better than daily rainfall. It has also been found that both GSMaP and PERSIANN performed better in relatively flat areas than mountainous areas. Before the practical use of TRMM, the RMSE value needs to be improved by considering the topography of the study area or adjusting the bias.

Graphical Abstract

1. Introduction

Accurate estimations of rainfall on fine spatial and temporal resolutions are vital for several water resource-related applications, such as agricultural water use, water resource management for human consumption, and industrial use, and understanding the ecosystems [1,2,3]. Moreover, accurate monitoring and prediction of rainfall would help reduce property damages and lives loss that may occur from flooding [4]. Hence, for a better understanding of the impact of rainfall on the environment, it is crucial that one use good spatial and high temporal resolution rainfall measurements. This is particularly the case in complex mountainous regions where there are insufficient rain gauge stations available and rainfall is characterized by complex patterns [5,6].
Rainfall measurement is usually accomplished using rain gauge stations [7,8]. However, there are small numbers of stations available [9], especially in mountainous regions of Ethiopia. In mountainous regions, rainfall is extremely variable [10] and changes in rainfall distribution can occur over short distances and within short periods of time [11]. The hydrological regime in these areas are extremely variable which is characterized by short duration and high intensity rainfall events [12,13]. Since the study area is known for its undulating topography, the number of ground-based rain gauge stations are very limited. Therefore, rainfall observation with high spatial and temporal resolution is extremely important to understand the hydrologic processes in these areas [14,15,16,17].
Despite the fact that rain gauges provide highly accurate local information [9,18], they are usually limited to characterize rainfall at the point of measurement [4,19,20,21]. Rain gauge station installations over most parts of Ethiopia are restricted along the main road networks and fail to provide timely rainfall information and reliable data. This is related with the high cost of installation and maintenance. Ground stations are too scarce and unevenly distributed to achieve accurate analysis of rainfall patterns in space and time. However, adequate representation of rainfall requires closely-spaced observations [22,23]. Therefore, the use of satellite-based rainfall products is expected to overcome these limitations.
The promising advancement of high-accuracy, remotely-sensed rainfall data provide vital information with very limited delay [24]. However, these data need to be checked for accuracy using ground stations [25]. It is vital to the users to understand the uncertainties associated with the satellite rainfall processing algorithms and physical constraints of the sensors. Two of the most widely used electromagnetic spectrum channels of satellite rainfall estimations are the passive microwave (PMW) and thermal infrared (IR) sensors [1,22]. TIR sensor only use top cloud temperature information from satellites to associate with depth of rainfall while PM sensors directly gather information about rainfall rather than cloud [26]. Therefore, the users of satellite-retrieved rainfall products can account for their limitations in accuracy.
Currently, several high-resolution satellite rainfall products have emerged and studied to assess their usefulness. TRMM (Tropical Rainfall Measuring Mission) is one of the satellite rainfall products which is subjected for validation by several researchers with observation from rain gauge stations [3,27,28,29]. Krakauer et al. [5] evaluated several satellite rainfall products (TRMM [30], GSMaP [31], CMORPH [1], PERSIANN [32,33], and APHRODITE [34]) and they found that TRMM better characterized rainfall measurements with little mean bias and reasonable skill in mountain regions of Nepal.
Shrestha et al. [35] validated GSMaP_MVK+ (Global Satellite Mapping of Precipitation) satellite rainfall products with rain gauge measurements over the Nepal Himalayas at the daily time scale. They reported that the performance of GSMaP deteriorates with an increase in altitude while its performance gets better in flatter terrain. Abushandi and Merkel [36] also did a comparison between GSMaP_MVK+ and rain gauge records over the Wadi Dhuliel arid catchment in Jordan and found that GSMaP performs well at monthly and annual time scales. Hirpa et al. [37] evaluated three high-resolution rainfall products (3B42RT, PERSIANN, and CMORPH) over complex terrain at annual time scales and found that 3B42RT and CMORPH give similar rainfall fields.
The success of any satellite-based rainfall product depends greatly on the quantitative understanding of its performance for various seasons and regions [38]. According to Kummerow et al. [39], adequate validation of satellite based rainfall products on a regional basis are needed instead of using global approaches. In this study, three satellite rainfall products (TRMM 3B42, PERSIANN, and GSMaP_MVK+) at daily time scales were used for comparison with daily rain gauge measurements. TRMM 3B42 and PERSIANN are available at 0.25° × 0.25° spatial resolution while GSMaP is available at 0.1° × 0.1° resolution.
The spatial distribution of rain gauge stations, particularly throughout rural Ethiopia, is uneven, and generally biased towards places where people and infrastructure exist, with most of the stations located in towns and installed along the main transport corridors. Hence, the use of satellite rainfall products has made them the best alternatives in data-scarce regions of Ethiopia. However, few studies have been carried out to evaluate satellite-based rainfall products at various spatial and temporal scales. For example, Hirpa et al. [37] compared three high-resolution satellite rainfall products with rain gauge data over very complex topography in Ethiopia, but their evaluation was limited only to the mean annual temporal scale. Similarly, Romilly and Gebremichael [40] assessed three high-resolution satellite rainfall products across Ethiopia only at seasonal time scale.
The study area provides groundwater for agriculture, domestic, as well as industrial uses for the nearby cities, such as Harar, Haramaya, and Awoday, as well as for the surrounding communities, and rainfall is the only source of groundwater recharge. Hence, accurate estimation of rainfall over the study area watershed is critically important. Therefore, the main objective of this study was to evaluate the performance of TRMM, PERSIANN, and GSMaP on daily, monthly, and seasonal time scales at the watershed scale over the eastern highland of Ethiopia.

2. Study Area

The study area is located in the eastern highlands of Ethiopia. It is found on the upper northern part of the Wabi Shebele River basin. It is situated at 9.19°N–9.51°N latitudes and 41.91°E–42.13°E longitudes (Figure 1). The study area consists of a vast depression area bounded by adjacent highlands with complex land cover. The surrounding mountains are characterized by gentle to steep slopes covered with scattered bushes. The elevation of the area ranges from 3306 m above sea level at extreme southern part to 1175 m above sea level near to the central depressed area and eastern part.
Figure 1. Rain gauge stations distribution over selected 0.25° grid cells in the study area.
Remotesensing 07 11639 g001
The climate is semi-arid with a high degree of spatial rainfall variability with annual average rainfall of 743 mm. Rainfall is bimodal, rainfall occurs in May and August, the highest peak in August is 139.5 mm and the secondary peak in May is 99.2 mm. January is the driest month, with 8.5 mm rainfall. The elevation of the study area has created moderate temperature with an average temperature of 16.4 °C, and varies from 12.6 °C in December to 19.0 °C in June. Figure 2 shows the annual climatic change of the study area. The mean annual temperature between 1970 and 2010 ranges from 12.4 °C to 19.8 °C, while annual rainfall during same period ranges from 469 mm to 1104 mm.
Figure 2. The mean monthly rainfall and temperature of the study area (1970–2010).
Remotesensing 07 11639 g002
Seasons and rainfall regimes in Ethiopia are categorized based on mean annual and mean monthly rainfall distribution. According to Diro et al. [41], there are three main rainfall regimes in the country, locally known as “Kiremt”, “Belg”, and “Bega”. The “Kiremt” season is the main rainy season which lasts from June to September, the “Belg” season has light rain and lasts from February to May, and the “Bega” season is the dry season which lasts from October to January [42,43,44]. The three rainfall regimes are defined as:
(1)
Region A (bi-modal type-I): the area is characterized by quasi-double maxima rainfall pattern, secondary peak in April and maximum peak in August. It includes the central and most of the eastern half of the country. The two rainy periods are known as “Kiremt” or summer and “Belg” or autumn. The short dry period is known as “Bega” or winter,
(2)
Region B (mono-modal): the area is dominated by a single maxima rainfall pattern. However, the wet period tends to decline from ten months in the southwest to about four months in the northern part of the region.
(3)
Region C (bi-modal type-II): the area is dominated by a double maxima rainfall pattern with peak during April and October. This regime includes the southern and the south-eastern parts of Ethiopia.

3. Data and Methods

3.1. Ground Rainfall Data

Daily rainfall data for nine meteorological stations were obtained from the National Meteorological Agency of Ethiopia (NMA) for the eastern region of Ethiopia. Selection of the study area is based on the condition where rainfall stations to be evaluated were having a relatively high numbers of ground observations at daily time scales during the time period of 2003–2006. For the comparison of satellite rainfall products with rain gauge measurements, at least one ground station should be located in each satellite grid cells (0.25° × 0.25°). For this study, five grid cells at the satellite rain datasets spatial resolution of 0.25 degree have a total of nine rain gauges available. Finally, daily rainfall at each grid cell is obtained from the average of available gauges located inside that cell.

3.2. Satellite Rainfall Data

In this study the performance of three high-resolution satellite rainfall products, the Tropical Rainfall Measuring Mission (TRMM 3B42), the Global Satellite Mapping of Precipitation (GSMaP_MVK+), and the Precipitation Estimation from Remotely-Sensed Information using Artificial Neural Networks (PERSIANN) were evaluated. All three rain datasets applied here are the PMW/IR blended rain products differing in the techniques of calibrating IR-based rain with PMW based rain retrievals.
The TRMM is a joint collaboration between NASA and the Japan Aerospace Exploration Agency (JAXA) designed to monitor and study tropical rainfall. TRMM satellite was launched in November 1997 [39]. The TRMM microwave imager (TMI), the precipitation radar (PR), and a visible and infrared scanner (VIRS) radiometer provides a unique platform for rainfall measurement [30]. The passive estimates from TMI (operates at 10, 18, 22, 37, and 85 GHz) is not a direct estimate of rainfall since the radiometer responds to integrated liquid water, not the raindrops. The precipitation radar (PR) is a more direct measure of rainfall; however, since it operates at a single frequency (13.8 GHz), the estimates of rain rate requires a careful interpretation [30,39]. The discrete sampling characteristics of TRMM rain rate measurements are one of the limitations of the product. In this study, the TRMM satellite product used for comparison with rain gauge data is the TRMM 3B42 version 7. The product estimates the rainfall in four steps: (1) the microwave estimates are calibrated and combined; (2) IR precipitation estimates are created using the microwave estimates for calibration; (3) microwave and IR estimates are combined to fill the gaps; and (4) the data are rescaled to monthly totals whereby gauge observations are also used indirectly to remove bias [22]. The newest product (TRMM 3B42 V7) has made several important changes, such as a new IR brightness temperature data set, additional satellite input, uniformly reprocessed input data with latest algorithm, and additional output fields [45]. A near-real-time (3B42RT) version is available with a time lag of about 6 h. It is just a product at the third step above that does not contain gauge information. The product has been available since 1998. More information about the TRMM products is given at Huffman et al. [22] and Huffman and Bolvin [45]. The TRMM 3B42 rainfall data set is available at daily temporal resolution and with spatial resolution of 0.25° × 0.25°. The entire TRMM data has been made available in ASCII text format and can be downloaded from the TRMM webpage [46].
The PERSIANN data set is an automated system for Precipitation Estimation from Remotely-Sensed Information based on Artificial Neural Networks to estimate rainfall based on both infrared and daytime visible imagery measurements from geostationary meteorological satellite [32,33]. The system uses grid infrared images from global geosynchronous satellites (GOES-8, GOES-10, GMS-5, Metsat-6, and Metsat-7) provided by CPC, NOAA. Model parameters are regularly updated using rainfall estimates from low-orbital satellites, including TRMM, NOAA −15, −16, −17, and DMSP (Defense Meteorological Satellite Program) F13, F14, and F15 (more details can be found in [47]). This technique provides rainfall data at temporal resolution of 24 h and spatial resolution of 0.25° × 0.25°. The data are available for March 2000 until now in binary file format and can be easily downloaded from [48].
Supported by the Japan Aerospace Exploration Agency (JAXA) and Japan Science and Technology Agency (JST), GSMaP seeks to produce a high-precision and high-resolution rainfall data using both passive microwave (PMW) and infrared (IR) sensors [35]. The data are archived by the temporal interpolation of passive microwave retrievals using a PMW-IR blended algorithm [1] and a Kalman filter [49] using IR information. GSMaP retrieves rainfall data from polar orbiting satellites with cloud motion vectors using infrared images [36]. PMW imagers compute the rate of rainfall by the algorithm of the GSMaP project [31] using various attributes from TRMM data. Among several GSMaP versions currently available, GSMaP_MVK+ uses the most satellite input streams at a high spatial resolution of 0.1° × 0.1° and hourly temporal resolution with only a 4 h delay. This makes it the most attractive in this study. The daily GSMaP_MVK+ rainfall data were downloaded from the JAXA ftp server [50].
The historical daily rainfall data from nine stations were provided by the NMA. Rain gauge stations names along with altitude (m), latitude and longitude, annual rainfall amount, and length of records are presented in Table 1.
Table 1. List of rain gauge stations over the study area.
St NoStation NameStation Abb.Latitude (° N)Longitude (° E)Altitude (m)Annual Rainfall (mm)Length of Record (Year)
1BisidimoBs9.1242.271340691.330
2CombolchaCm9.4342.101925927.040
3DengegoDn9.4741.922350757.929
4FedisFd9.1342.051620659.240
5GirawaGr9.1341.832380929.820
6HaramayaHm9.4242.042125739.940
7HararHr9.3142.092100818.215
8KersaKr9.4541.872000736.115
9KulubiKl9.4241.702000954.130

3.3. Data Analysis

To check the consistency and reliability of rainfall data from ground station, the daily rainfall data used in the comparison of the study are first checked using a double mass curve technique and correlation coefficient. The quality, availability, and the length of rainfall data records are vital for comparison purposes [51]. However, measurement of the rainfall is prone to systematic and random errors [52,53]. Lengthy records and dense networks, therefore, are used in order to overcome these limitations together with the methods that are used to fill the gaps and to verify the consistency of the rainfall data. Missing values presented in the data were filled with data from the nearest neighboring stations.
The three high-resolution satellite rainfall products and ground gauge rainfall were used for the analysis. Since the GSMaP satellite precipitation product has finer spatial resolution of 0.1° × 0.1°, it was up-scaled by aggregation and averaging GSMaP rainfall estimates of nine neighboring tiles to achieve a pixel size of 0.25° × 0.25° to match with the spatial resolution of the TRMM and PERSIANN rainfall products. In order to ensure a uniform comparison of satellite rainfall with rain gauge, the length of record confined to the date to the period from 2003 to 2006, which is based on the accusation period of GSMaP.
Therefore, the comparison was limited to only those grid cells that have point rainfall measurement. Hence, nine rain gauge stations were overlaid on five grid cells as shown in Figure 1, above. In order to understand at which time scale the satellite estimates have satisfactory matches, the daily datasets from satellites and ground stations were organized to monthly and seasonal time scales. Hence, pair-wise comparisons between satellite products and rain gauges have been undertaken on daily, monthly, and seasonal time bases.

3.4. Performance Indices

To evaluate the performance of satellite rainfall products, three categorical statistical indices were used, the probability of detection (POD), false alarm ratio (FAR), and equitable threat score (ETS) [54,55,56]. POD measures the rain events that were correctly detected by the satellite; FAR measures the rain events that were incorrectly detected; and ETS measures how well the satellite observations correspond to the ground measurements. The ideal values of POD, FAR, and ETS range from 0 to 1, with 1 being a perfect measure for POD and ETS while 0 for FAR [21,57,58,59]. Every grid cell is classified as a hit (H) when a rainfall recorded by both satellite and rain gauge; miss (M) when rain observed by only the rain gauge; and false alarm (F) when rain is documented only by satellite. To define whether there is rain or no rain pixels, a threshold value 1.0 mm/day was adopted [21,58,60,61]. The categorical statistical indices are given below:
P O D = H H + M
F A R = F H + F
E T S = H H e ( H + M + F ) H e
where He stands for hits that could occur by chance: He = ((H + M) (H + F)/N) and N is the total number of estimates.
In addition to the categorical statistics indices, three continuous evaluation statistics were used to compute the error values namely: correlation, bias, and Root-mean square error (RMSE). These statistical analyses provide a more complete picture of the rainfall observations, as well as performance of satellite rainfall in reproducing the rainfall measured by rain gauges. The correlation is used to assess the degree of agreement between the rain gauge measurements and satellite observations. RMSE is a measure of the differences between satellite observation and the actual values measured by rain gauge, i.e., measure the average error magnitude and bias is used to measure the average difference between rain gauge measurements and satellite observations. Bias can be positive or negative; a positive bias means overestimation of rainfall while a negative bias means underestimation of rainfall.

3.5. Uncertainties of Validation

The uncertainties and errors introduced in the validation process can originate from various sources. Some of them include are the sensor design and algorithms used in rainfall estimate derivation, quality of the ground truth data used for calibration, temporal and spatial rainfall aggregation methods, and others, including assumptions used in the algorithms. Aggregation of a 3-h rainfall into daily and monthly scales have its own contribution to the errors introduced since we do not have knowledge of the rainfall amount within the 3 h, especially in areas where temporal variability of precipitation is high. Aggregation of this over daily and monthly scales will further propagate the errors.
Comparison of a snapshot or instantaneous satellite rainfall estimate to aggregated rain gauge data can be tricky. It is also very difficult to validate the quality of observed rainfall data since rainfall recording itself is subject to various sources of errors from gauge placement and height to interference by surrounding objects. Comparison of a grid rainfall to a rain gauge data that are not uniformly distributed or with poor spatial coverage or located in highly rugged areas where the effect of topography can be substantial are all sources of uncertainties in the validation of satellite rainfall products.
Rainfall products based on IR data and cloud top brightness temperature without considering height of clouds to the ground or altitude of the land surface can introduce errors since these algorithms ignore potential evaporation of rainfall below the cloud base, leading to errors in retrieval accuracy in high altitude areas. Errors from computing algorithms included in the types of clouds which may not produce rainfall. Clouds like cirrus clouds which do not form rainfall in the convective systems, are included in the IR-based precipitation estimates. Similarly, ice and cold air in the IR estimates can introduce errors in the estimation.

4. Results and Discussion

4.1. Rain Gauge Data Analysis

In the same hydrological area, rainfall measurements are normally consistent to totals at nearby stations [62]. The rainfall data collected from NMA cannot be used directly for hydrological analysis since it has many gaps and inconsistent values. Therefore, inspection of the reliability of the data is essential to make them usable for various studies [63]. In this study, to check the homogeneity between the rain gauges, daily and monthly correlation coefficients were used (Table 2 and Table 3). In principle, good correlations are expected with stations nearby [62]. At daily time scales, the nearby stations, such as Harar and Haramaya, showed better correlation (0.56) than stations located far apart, such as Combolcha and Bisidimi (0.18). From the result, rainfall at most of the stations has shown strong correlation at monthly and annual time scales with an average correlation coefficient of 0.93 and 1, respectively. At daily time scales, an average correlation value of 0.64 was recorded. The monthly correlation coefficients for rainfall amount at different stations vary from 0.83 to 0.99, which indicate that nearly all the rain gauge stations considered in the study area are homogenous.
To check the consistency of observation from rain gauges, the pattern of data from the other nearby rain gauge stations in the study area was used [64]. Usually the relationship between the two records is a fixed ratio and the double-mass curve was used to detect the break point between the two data. Therefore, a double-mass curve technique was applied to check the consistency of the data and the results showing that there is no change in the slope of the curves for all meteorological stations located in the study area. Therefore, the records should be treated as good, consistent data.
Table 2. Daily correlation coefficients between the stations.
Correlation Coefficient
HaramayaHararFedisDengegoCombolchaKersaKulubiBisidimoGirawa
Haramaya1.00
Harar0.561.00
Fedis0.300.271.00
Dengego0.490.410.261.00
Combolcha0.270.400.220.261.00
Kersa0.510.460.450.490.261.00
Kulubi0.440.390.240.370.180.501.00
Bisidimo0.470.480.240.350.180.410.331.00
Girawa0.510.500.360.420.340.460.230.351.00
Table 3. Monthly correlation coefficients between the stations.
Correlation Coefficient
HaramayaHararFedisDengegoCombolchaKersaKulubiBisidimoGirawa
Haramaya1.00
Harar0.941.00
Fedis0.930.951.00
Dengego0.980.910.861.00
Combolcha0.950.950.940.931.00
Kersa0.910.880.830.940.851.00
Kulubi0.950.910.840.990.910.941.00
Bisidimo0.960.980.970.930.970.880.911.00
Girawa0.960.970.910.980.960.930.970.971.00

4.2. Comparison of Satellite with Gauge Rainfall Data

Rain gauge measurements are usually limited by their spatial coverage. Satellite rainfall products provide good spatial and temporal coverage. However, problems associated with calibration, sensors design, algorithms, and others indicated in Section 3.5, limits their ability to capture rainfall accurately. Hence, this study focused on the performance evaluation of three satellite rainfall products (TRMM, PERSIANN, and GSMaP) with rain gauge stations over data-scarce complex terrain regions of Eastern Ethiopia. The performance evaluation was carried out based on correlation, bias, RMSE, POD, FAR, and ETS at daily, monthly, and seasonal time scales.

4.2.1. Comparison of Daily Rainfall

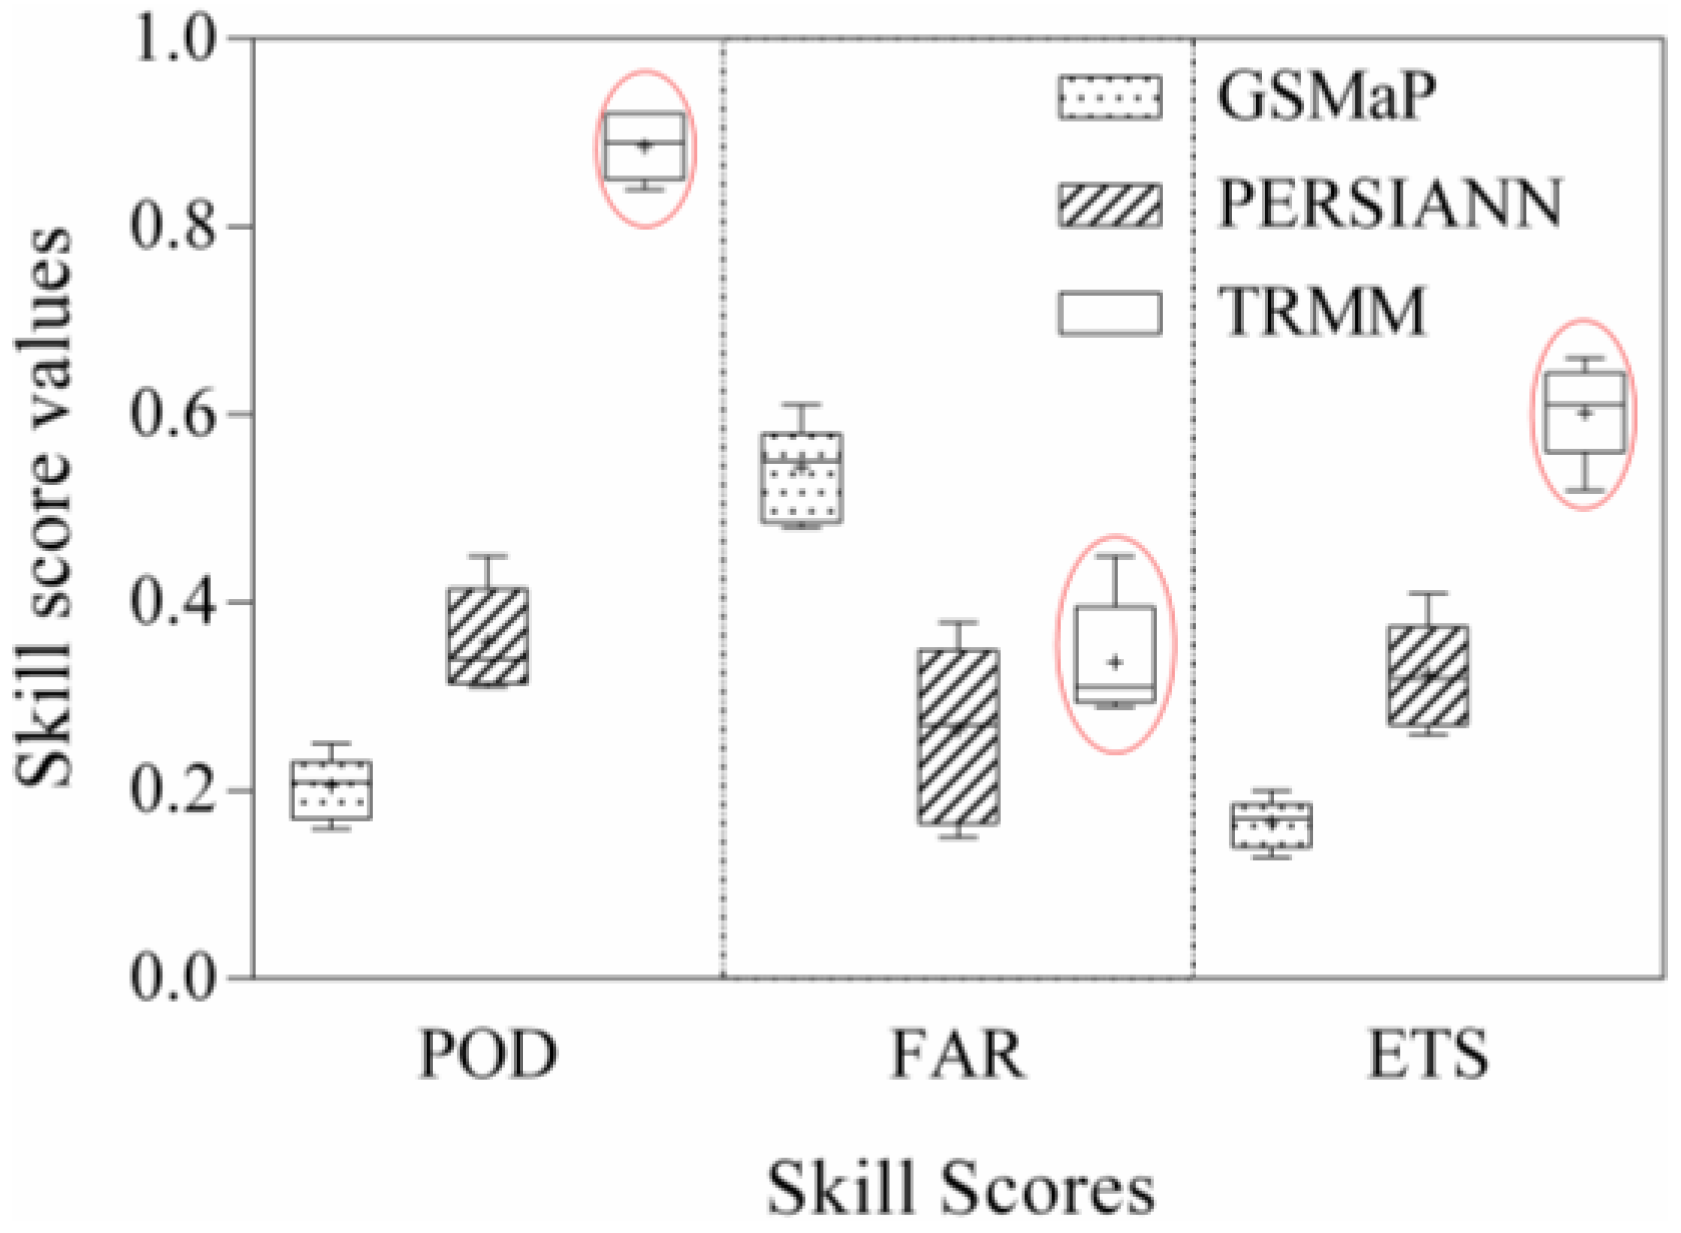
The daily comparison of satellite rainfall with 0.25 degree aggregated rain gauge observation is shown in Figure 3. Higher POD and ETS, and lower FAR, values are desirable for performance evaluation. In all stations, the TRMM has scored higher POD and ETS, with an average values of 0.89 and 0.61, respectively, while GSMaP and PERSIANN have scored lower POD and ETS values, 0.20 (0.16) and 0.36 (0.32), respectively. The POD result showed that more than 89% of the observed rainfall events from the rain gauge measurements were correctly detected by the TRMM, while GSMaP and PERSIANN correctly detected 20% and 36%, respectively, of the rainfall from the rain gauge over data scarce mountainous region of Eastern Ethiopia.
Figure 3. Performance comparison of satellite rainfall products with rain gauge data.
Remotesensing 07 11639 g003
The possible reason why GSMaP and PERSIANN registered low POD and ETS values can be related with the performance of the satellite sensors used to measure rainfall events by the two products. The performance of satellite products depend on the sensors they used to measure the rainfall. Those satellite products based on microwave sensors for measuring rainfall have better performance than those depend on infrared sensors [1,65,66]. Generally, the categorical statistical analysis result implies that the TRMM satellite product commanded a more accurate estimation of detecting rainfall from rain gauges, although its FAR value (0.34) is lower than that of the GSMaP (0.54) and higher than that of the PERSIANN (0.26).
The overall performance of the TRMM, GSMaP, and PERSIANN at daily time scales is summarized in Table 4. Of the three satellite rainfall, TRMM overestimates rainfall from rain gauge, which is consistent with its positive bias of 1.32 mm, while GSMaP and PERSIANN underestimate rainfall from rain gauge, which is related with their negative bias values of −1.44 and −1.20 mm, respectively. Looking at the correlations, the TRMM much better correlated with the rainfall from the rain gauge, with a value of 0.70, while the GSMaP and PERSIANN have shown poor correspondence with the rain gauge, with values of 0.03 and 0.30, respectively. The RMSE result revealed very similar error values between the TRMM, GSMaP, and PERSIANN with the rain gauge, with values of 2.78, 2.88, and 2.77 mm, respectively. Generally, the correlation result showed a better correspondence between the TRMM and rain gauges than GSMaP and PERSIANN.
Table 4. Daily average rainfall comparison between rain gauge and satellite rainfall products.
ProductGSMaPPERSIANNTRMM
POD0.200.360.89
FAR0.540.260.34
ETS0.160.320.61
Correlation0.030.300.70
RMSE2.882.772.78
Bias−1.44−1.201.32
Mean0.81.03.5
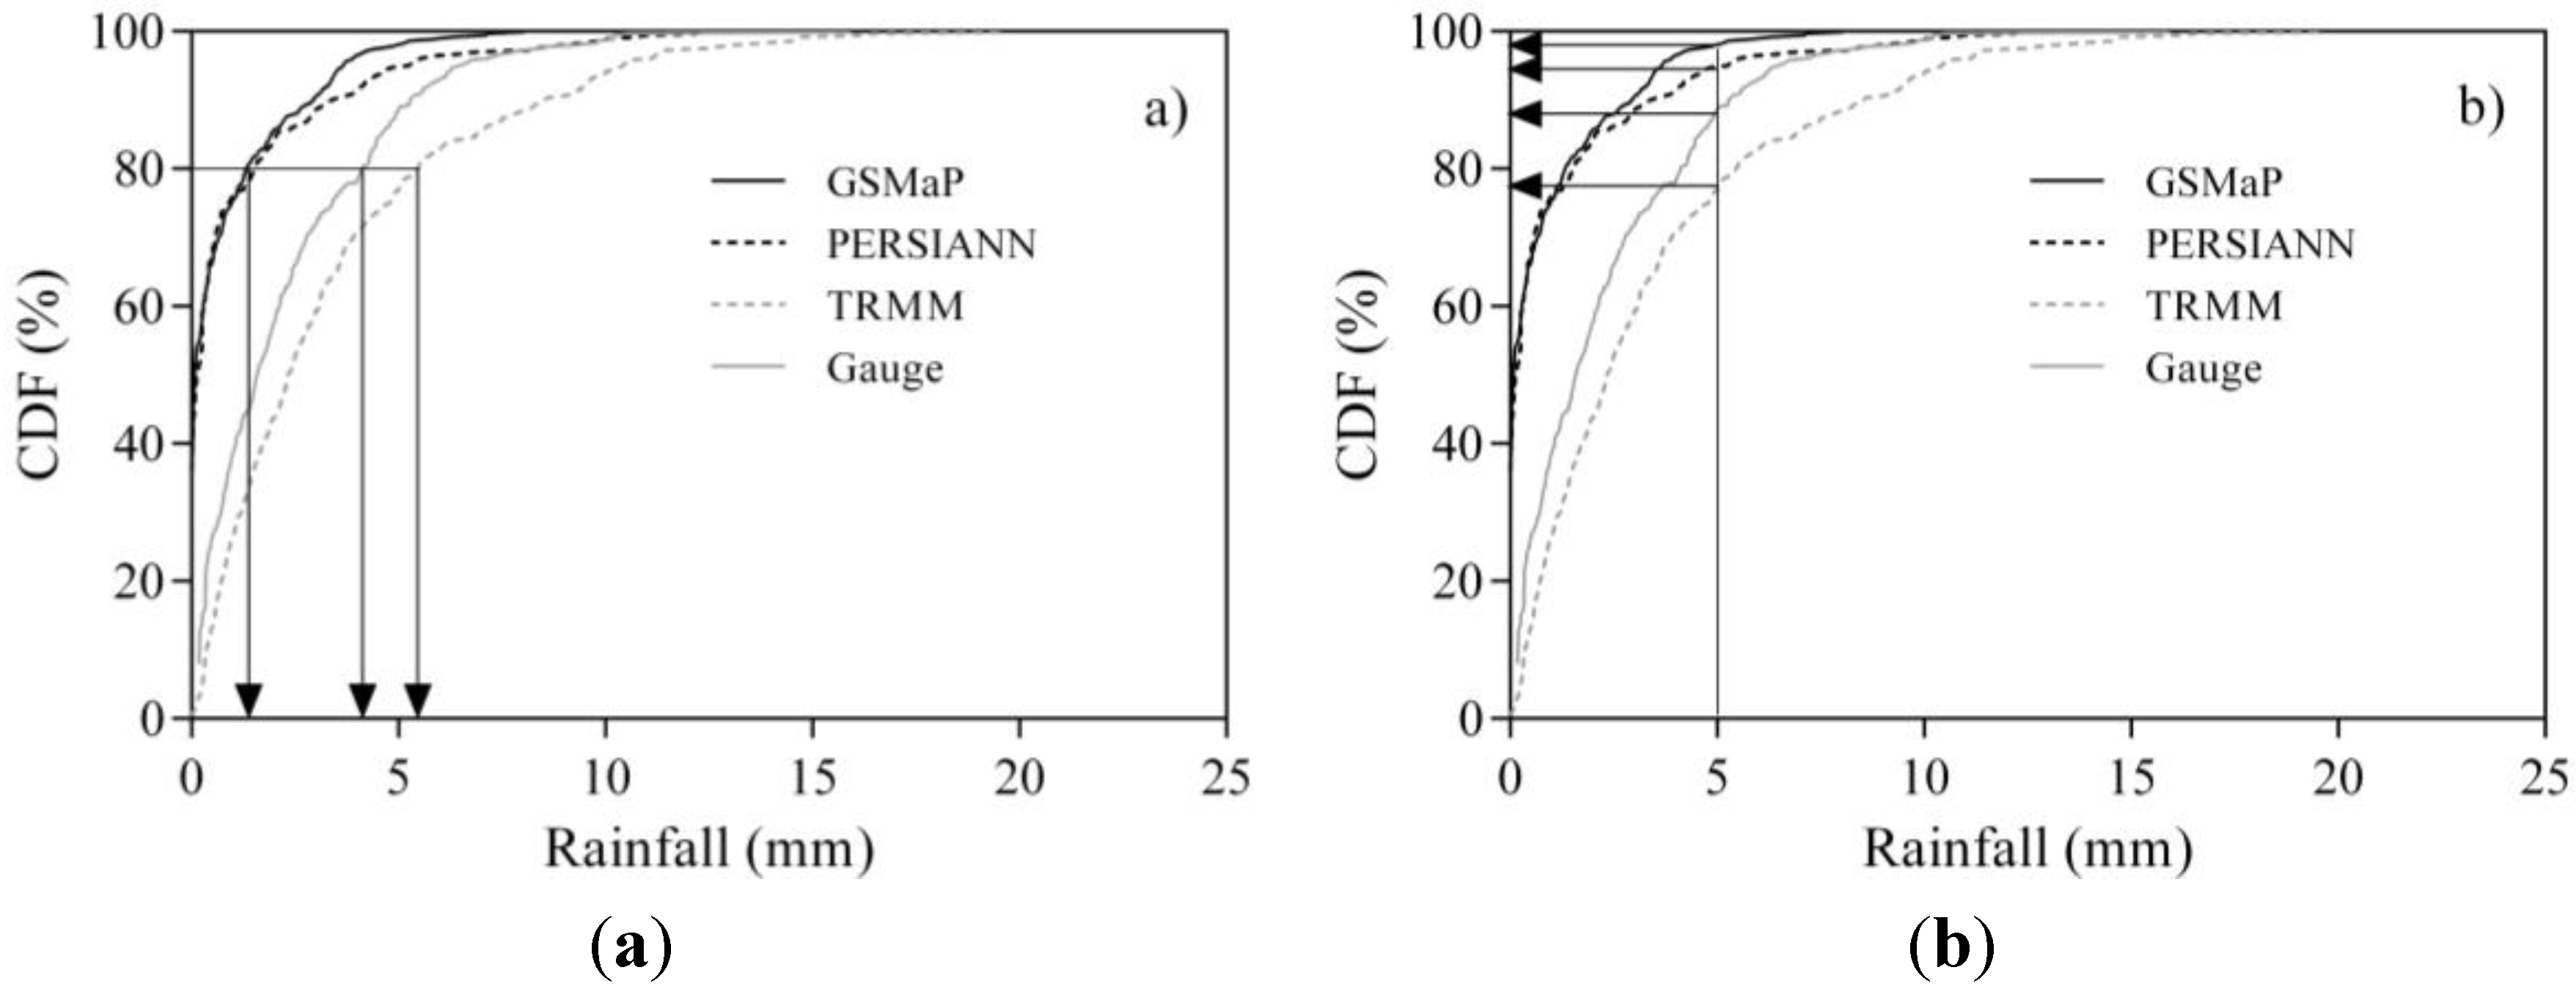
Figure 4a,b show the cumulative distribution function (CDF) of daily rainfall between the satellite products and rain gauges. CDF is used to measure the number of observations that lie above or below a particular value in a data set. In other words, this is an indication of how often the satellite rainfall observations are well below or above the rainfall from rain gauges. The result showed that the TRMM CDF is well above the rainfall from the rain gauges and it is the closest of all the three products. However, both the GSMaP and PERSIANN CDF are sufficiently below the rain gauge at any point in the graph. For example, Figure 4a, at 80% frequency level, the rainfall value from the rain gauge was 3.62 mm and the TRMM was 5.29 mm, means 1.67 mm more than the rain gauge, and the rainfall from the GSMaP and PERSIANN were 1.35 and 1.72 mm, respectively, which is 2.27 and 1.90 mm well below the rain gauge. This result showed an overestimation of rainfall from rain gauge by the TRMM and underestimation by both the GSMaP and PERSIANN. As shown in Figure 4b, 98% of GSMaP and 95% of PERSIANN rainfall records are less than 5 mm while 88.5% of TRMM is below 5 mm. This indicates that the TRMM record is close to the rain gauge values.
Figure 4. Cumulative distribution function (CDF) of daily rainfall of rain gauge, GSMaP, TRMM and PERSIANN: (a) rainfall at 80% frequency, and (b) frequency for 5mm of rainfall.
Remotesensing 07 11639 g004
Daily rainfall comparisons of the three satellite rainfall products with rain gauge stations at each grid is shown in Table 5. The result showed that TRMM performed better than all the other satellite rainfall products. In terms of probability of detection (POD) of rainfall, it can be seen that GSMaP has the lowest POD at all grid cells while TRMM has higher POD value. Bias results showed that both GSMaP and PERSIANN underestimate rainfall from rain gauge while TRMM overestimate the rainfall. TRMM also has reasonably low RMSE and bias values. Overall, the performance of grid cell “Kl” is better than the remaining four grid cells, having a higher POD (0.92) and ETS (0.35) values.
Table 5. Daily comparison of rain gauge and satellite rainfall products at each grid cell.
StationsProductPODFARETSCorrelationRMSEBiasMean Rainfall
HmHrCmGSMaP0.200.250.020.043.00−1.420.76
PERSIANN0.330.080.130.272.91−1.240.94
TRMM0.890.530.240.593.501.643.82
FdBsGSMaP0.240.220.010.083.19−1.210.78
PERSIANN0.380.130.150.313.02−0.921.07
TRMM0.830.350.310.503.571.043.04
KrDnGSMaP0.160.230.030.073.28−1.250.72
PERSIANN0.300.160.080.093.30−0.980.99
TRMM0.900.690.120.453.911.783.75
KlGSMaP0.160.230.030.034.12−1.850.72
PERSIANN0.290.170.060.273.87−1.551.01
TRMM0.920.400.350.523.800.923.48
GrGSMaP0.210.210.000.074.57−1.960.78
PERSIANN0.420.100.200.234.36−1.651.12
TRMM0.850.390.290.533.850.333.07

4.2.2. Monthly Comparison of Rainfall

The monthly comparison between rain gauge and three satellite rainfall products is shown in Table 6. The correlation of the TRMM, GSMaP, and PERSIANN are 0.94, 0.07, and 0.46, respectively. The high correlation obtained from the TRMM revealed better correspondence of the product with rain gauges, while GSMaP and PERSIANN showed poor association with rain gauges. The higher values the RMSE were registered by both GSMaP and PERSIANN, values of 65.72 and 56.03 mm, respectively, indicating relative large errors associated with these two datasets over a complex topographical region. The negative bias values by both the GSMaP and PERSIANN, values of −43.87 and −36.16 mm, respectively, indicated that underestimation of rainfall, while a positive bias value by the TRMM, value of 39.98 mm, showed an overestimation of the product in the study area at a monthly time scale.
Table 6. Monthly average rainfall comparison between rain gauge and satellite products.
ProductGSMaPPERSIANNTRMM
POD0.380.381.00
FAR0.250.000.27
ETS0.330.380.73
Correlation0.070.460.94
RMSE65.7256.0345.69
Bias−43.87−36.1639.98
Mean22.930.6106.8
The continuous statistical analysis indicated the potential use of the TRMM rainfall product over data-scarce highlands of Eastern Ethiopia. Krakauer et al. [5] found that the TRMM rainfall product describes the rainfall from rain gauges better than GSMaP and PERSIANN with little bias and reasonable skill over mountain regions of Nepal. This may be associated with the poor performance of GSMaP and PERSIANN products over highland areas. Shrestha et al. [35] tested the potential use of GSMaP over highly rugged topography of the Himalayas and found that the performance of GSMaP deteriorates with an increase in altitude. Similarly, Romilly and Gebremichael [40] found that PERSIANN underestimated rainfall from the rain gauges over the high elevation areas of the Blue Nile basin of Ethiopia. Hirpa et al. [37] also found a significant underestimation of rainfall from rain gauges by PERSIANN in high-elevation areas over a complex topography of Ethiopia. This is similar to our finding that GSMaP and PERSIANN significantly underestimated rainfall estimates at high altitudes than in relatively less mountainous areas.
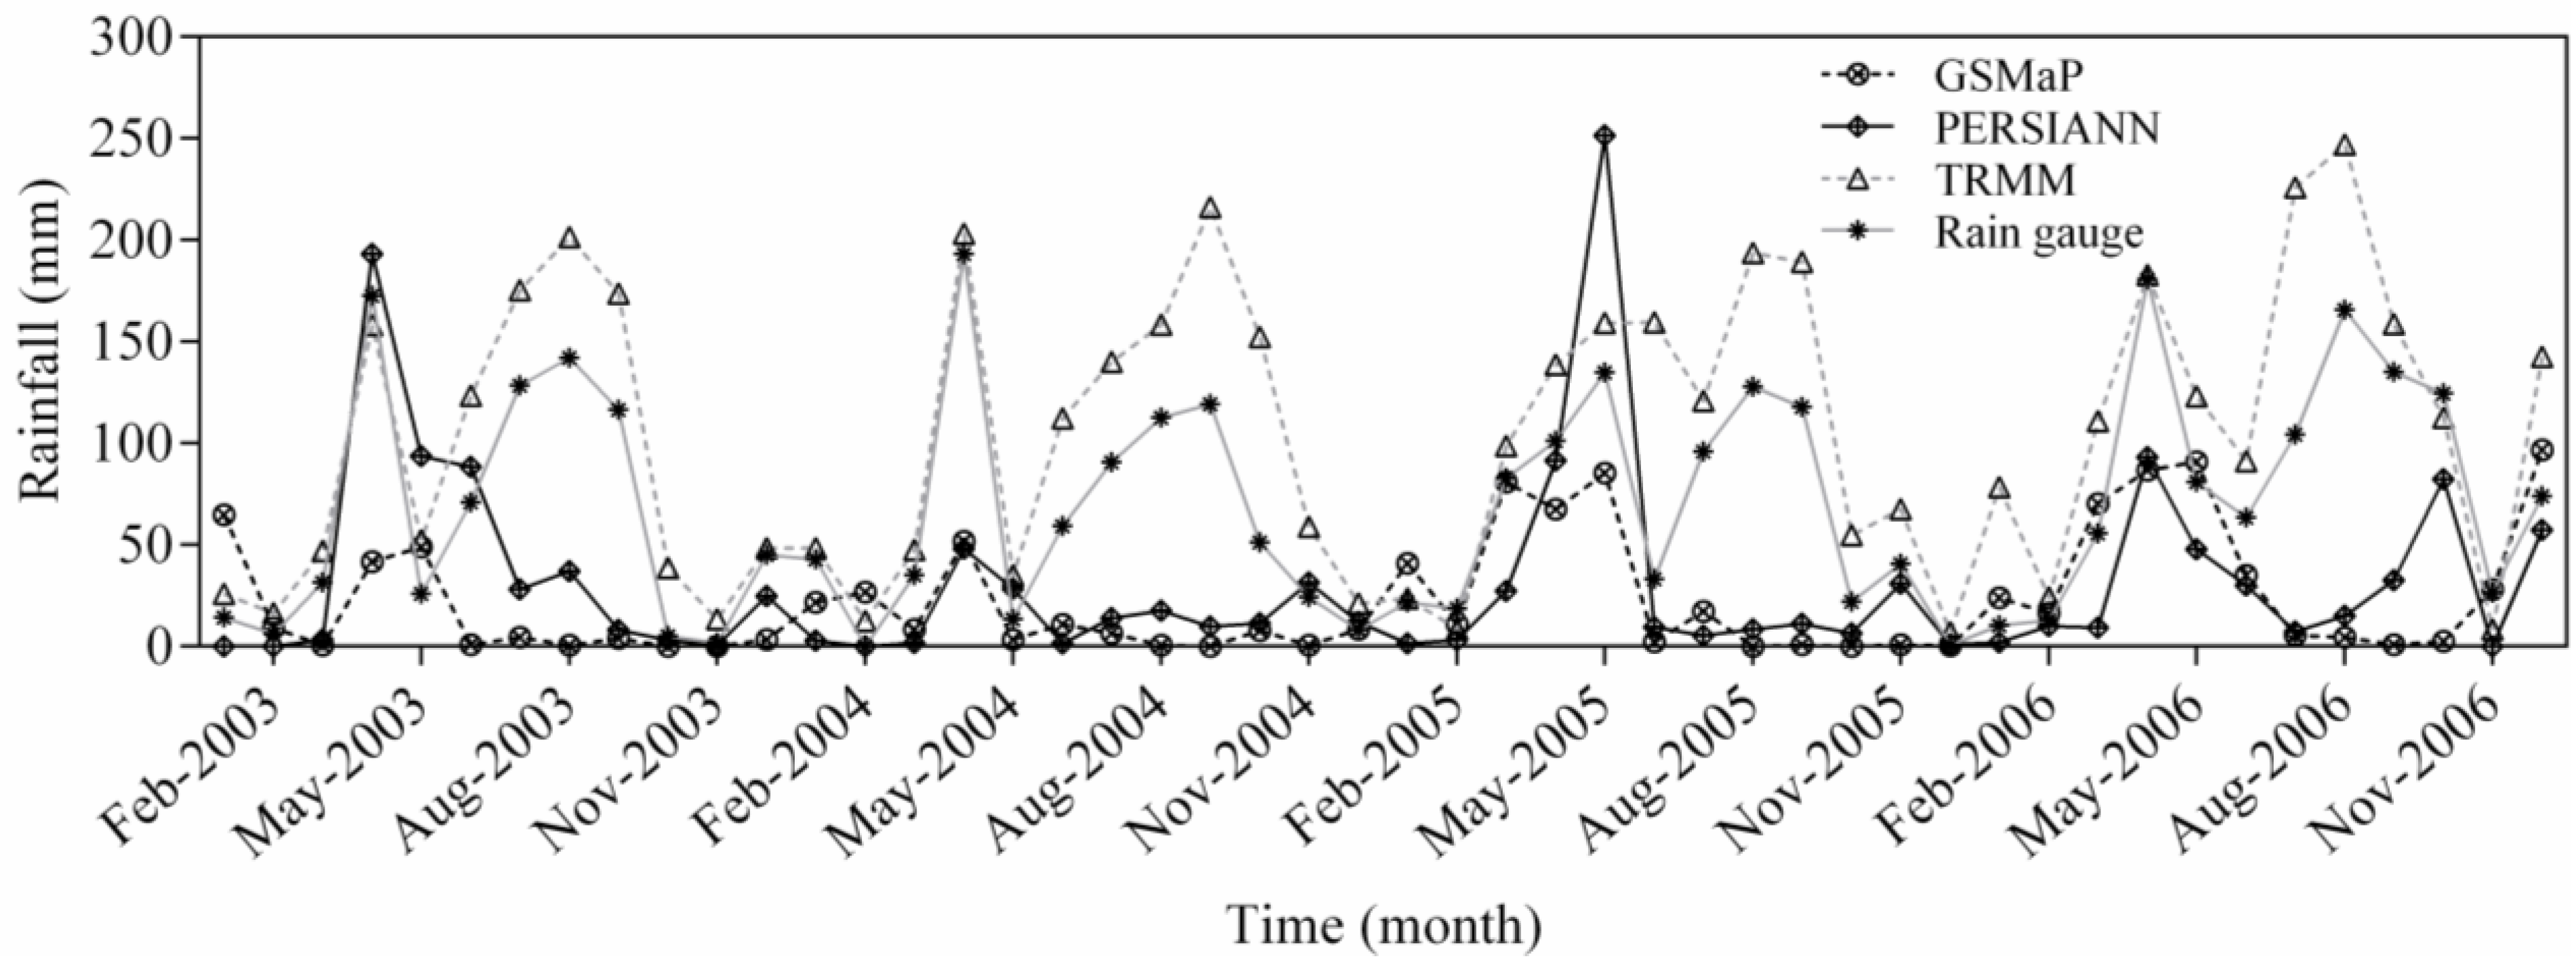
Comparisons between monthly time series of rainfall observed by the three satellite rainfall products and rain gauge measurements during the time period of 2003–2006 is shown in Figure 5. The time series of the TRMM monthly rainfall observations are found to be matching with the rainfall from the rain gauges, tracking of rainfall simultaneously, but most of the time the TRMM overestimates rain gauge records, while GSMaP and PERSIANN significantly underestimate the rainfall from rain gauges. The result showed the significantly poor ability of these two satellite rainfall products to capture the magnitude and pattern of rainfall from rain gauge records. Overall, TRMM detected most of the rain events with reference to rain gauge data.
Figure 5. Time series of monthly rainfall (2003–2006) from GSMaP, PERSIANN, and TRMM averaged over selected grid cells with rain gauge data.
Remotesensing 07 11639 g005
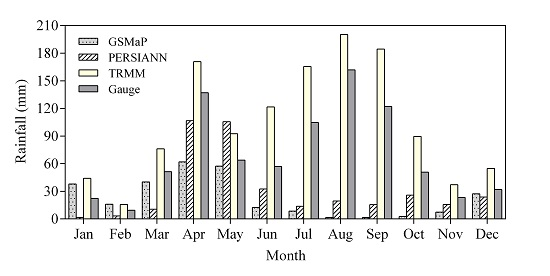
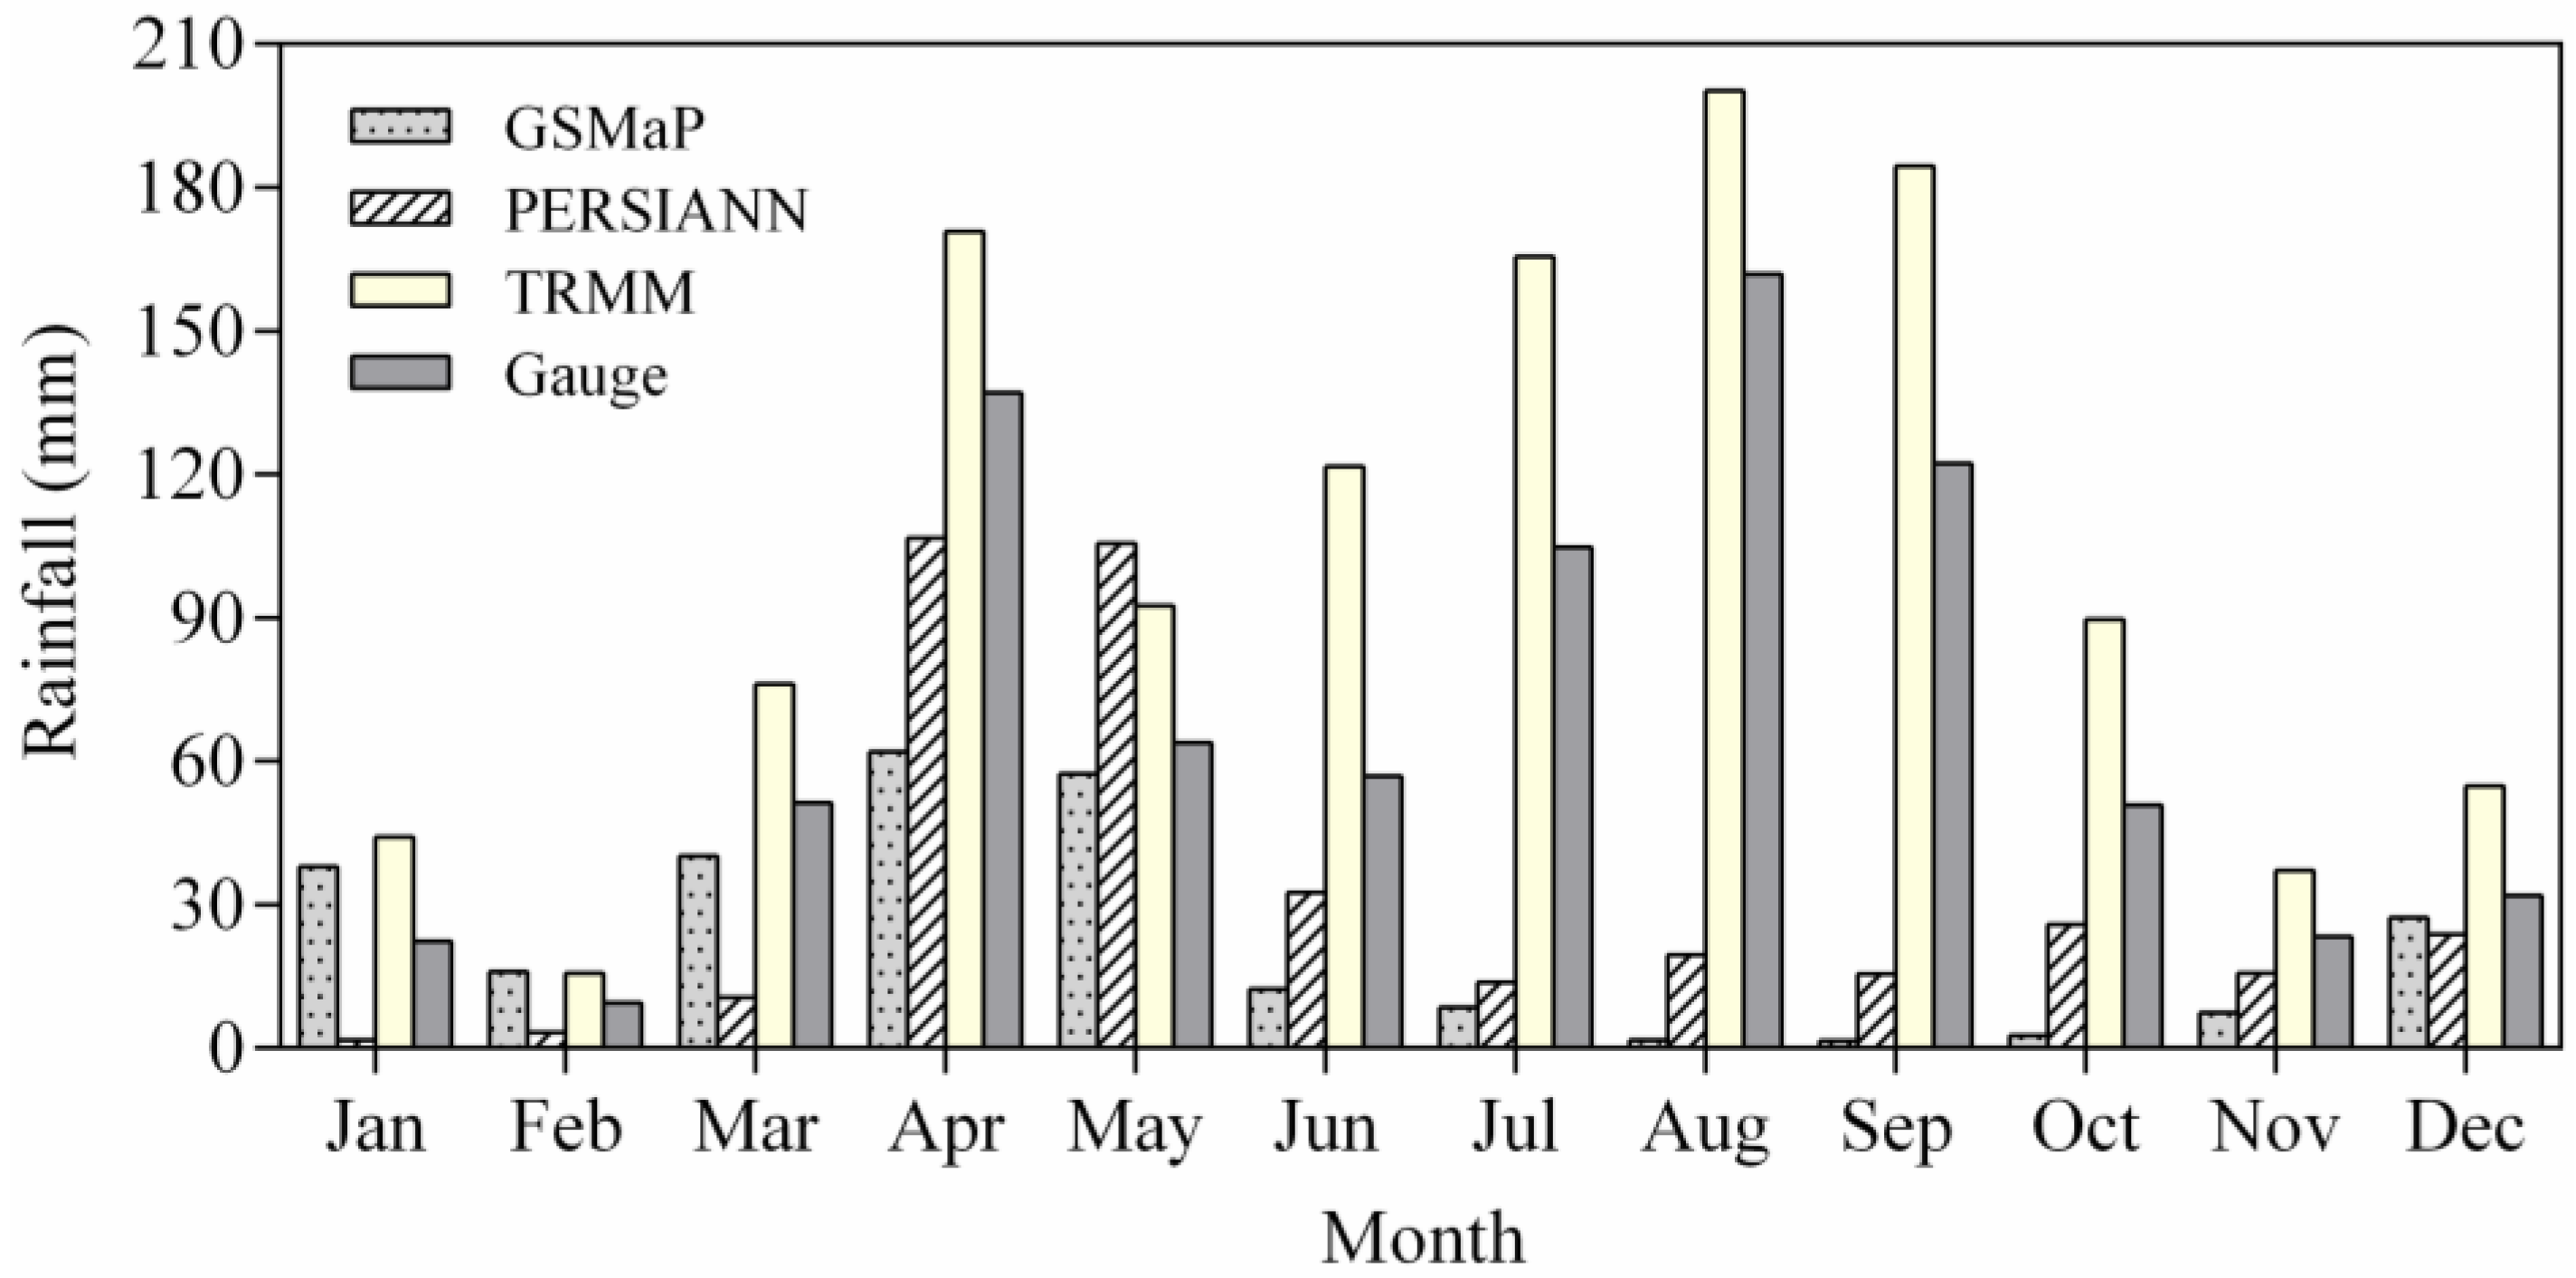
The mean monthly rainfall pattern of the three satellite rainfall products and rain gauge stations are shown in Figure 6. The result revealed that the mean monthly rainfall obtained from the TRMM product has tracked a similar pattern of rainfall from the rain gauge stations with a maximum peak in August. During this month, the difference between the TRMM and rain gauges was 38.3 mm while the GSMaP and PERSIANN were noted large difference, values of −160.3 and −142.4 mm, respectively. The secondary peak of rainfall was in April; in this month, the differences in rainfall measurement between the TRMM, GSMaP, and PERSIANN with that of rainfall from the rain gauges were 33.7, −75.1, and −30.5 mm, respectively. This result clearly showed that an overestimation of rainfall from the rain gauges by the TRMM with an average value of 34.7 mm, while GSMaP and PERSIANN underestimate by an average values of −46.8 and −38.5 mm, respectively. As shown in Figure 6, the TRMM has the best agreement with rain gauge measurements, although, it overestimates the rain gauge records.
Despite a relatively better spatial resolution compared to TRMM, the underestimation by GSMaP and PERSIANN (Figure 6) is much higher during the heavy rainy season (June–September) than the dry season (October–January).
Figure 6. Monthly average rainfall (2003–2006) from GSMaP, PERSIANN, and TRMM averaged over selected grid cells with rain gauge data.
Remotesensing 07 11639 g006
The grid comparison is also carried out at monthly time step for TRMM, GSMaP, and PERSIANN. The bias results of GSMaP and PERSIANN clearly showed underestimation of the rainfall while TRMM overestimate rainfall from rain gauges. TRMM has the lowest RMSE values compared with other satellite products. The correlation coefficient for TRMM satellite product is higher than the other two products. At all grids, TRMM detected rainfall from rain gauges better than the other two products. However, having higher POD (1.00), ETS (0.67), and correlation (0.92), TRMM 3B42 at grid cell “FdBs”, where terrain is relatively flat and has good rain gauge distribution, shows better approximate monthly rainfall from rain gauges compared to two of the remaining satellite products (Table 7). The result in Table 7 shows that the aggregation of daily TRMM values to monthly estimates reduces the discrepancy between the TRMM estimates and rainfall gauge. This is because that, unlike the other two satellite rainfall products, the TRMM 3B42 rain product is calibrated with surface rain gauges.
Table 7. Monthly comparison of rain gauge and satellite rainfall products at each grid cell.
StationsProductPODFARETSCorrelationRMSEBiasMean Rainfall
HmHrCmGSMaP0.380.50−0.050.0964.50−42.9023.1
PERSIANN0.250.000.100.5354.44−37.5028.6
TRMM1.000.750.180.8757.9150.20116.2
FdBsGSMaP0.380.250.050.2156.62−36.8023.9
PERSIANN0.380.000.170.6144.57−28.1032.6
TRMM1.000.250.670.9240.1431.7092.4
KrDnGSMaP0.440.330.04−0.1865.08−38.2021.8
PERSIANN0.220.000.070.1660.06−30.1030.0
TRMM1.000.670.270.9757.6054.00114.0
KlGSMaP0.300.50−0.040.1080.54−56.6021.8
PERSIANN0.300.000.070.4669.53−47.7030.7
TRMM0.900.500.250.9041.8027.50105.9
GrGSMaP0.400.000.100.1083.90−59.3023.8
PERSIANN0.300.000.070.3972.88−49.1034.0
TRMM0.900.000.600.9324.4310.3093.4

4.2.3. Topographic Effect

In order to evaluate the orographic effect on the performance of the satellite-based rainfall products, validation statistics from stations located at different altitudes were used. Based on the statistical analysis and comparisons of the three rainfall products with rain gauge data, it is shown that GSMaP and PERSIANN perform relatively better in low altitude than high altitude areas (Table 7). The stations Fd and Bs have elevations of 1620 and 1340 m amsl, respectively, and and Kr and Dn stations are located at an elevation of 2000 and 2350 m amsl, respectively. As depicted in Table 7, the GSMaP and PERSIANN performed better at Fd and Bs stations than the Kr and Dn stations.

4.2.4. Seasonal Comparison of Rainfall

According to NMSA and Diro et al. [41,43], the study area is characterized by three distinct rainfall seasons: Kiremt (Jun–Sept), Belg (Feb–May), and Bega (Oct–Jan). Rainfall occurred in most parts of the country during Kiremt season, which contributes towards the rainfall pattern in the wet season [42,44]. The Belg is considered as minor rainy season for most parts of the country, while the Bega season is considered as dry season. The climate of the country is mainly controlled by the seasonal migration of the Inter-tropical Convergence Zone (ITCZ) and associated atmospheric circulation as well as by its complex topography [43].
The seasonal rainfall comparison between the rain gauge and the three satellite rainfall is shown in Table 8. The positive bias showed that the TRMM overestimates rainfall from the rain gauge during Belg, Bega, and Kiremt seasons, with values of 20.58, 30.65, and 68.70 mm, respectively, while the negative biases scored by both the GSMaP and PERSIANN at all seasons showed that underestimation of rainfall from rain gauges. The TRMM rainfall has a low positive bias compared with high negative biases recorded by both GSMaP and PERSIANN during Kiremt season. However, during Bega season, the TRMM had a high positive bias (30.65 mm) compared with low negative biases registered by both GSMaP and PERSIANN, with values of −11.45 and −13.35 mm, respectively. This could be associated with a high evaporation rate during the Bega Season. Ebert et al. [55] compared rainfall from satellite observations and numerical models over the US and found strong overestimation during the summer (dry) season in mountainous regions of western coastal Mexico. They concluded that this could be related with evaporation of rainfall before reaching to the ground surface.
Table 8. Statistical comparison of seasonal rainfall between rain gauge and satellites.
SeasonStatisticsGSMaPPERSIANNTRMM
Belg (Feb–May)POD1.000.671.00
FAR0.000.000.00
ETS1.000.671.00
Correlation0.780.800.98
RMSE45.9035.3822.87
Bias−25.30−13.6020.58
Mean rainfall43.655.489.5
Bega (Oct–Jan)POD0.000.001.00
FAR0.000.001.00
ETS0.140.000.00
Correlation−0.580.720.98
RMSE26.2815.8331.79
Bias−11.45−13.3530.65
Mean rainfall19.017.161.1
Kiremt (Jun–Sept)POD0.000.251.00
FAR1.000.000.00
ETS0.000.000.00
Correlation−0.95−0.790.99
RMSE100.7988.9868.77
Bias−94.90−81.5368.70
Mean rainfall6.119.4169.7
The RMSE results also showed that the TRMM has a relatively small error in measuring the rainfall from the rain gauges during Belg and Kiremt seasons, with values of 22.87 and 68.77 mm, respectively, compared with high RMSE values registered by both GSMaP and PERSIANN during the same seasons. However, during Bega season, PERSIANN has a low RMSE (15.83 mm) while the TRMM and GSMaP have scored RMSE values of 31.79 and 26.28 mm, respectively. The TRMM better represented the rainfall from the rain gauge at all seasons (Belg, Bega and Kiremt), with values of 98%, 98%, and 99%, respectively. Both the GSMaP and PERSIANN correlated negatively with the rain gauge during Kiremt season, with values of −0.95 and −0.79, respectively. In general, the TRMM nicely represented rainfall from the rain gauge during Belg and Kiremt seasons. The higher bias during the dry season (Bega) compared to the wet season (Kirmet) can be related to a higher evaporation of the rainfall before it reaches the land surface. Hence, evaporation from surface rain gauges during the dry season could lead to underestimation of rainfall from rain gauges.
To understand the seasonal performance of all the three satellite-based rainfall products, the monthly data has been grouped for that of Belg, Kiremt, and Bega seasons and each set of data has been put together and plotted as shown in Figure 7. At all seasons, the TRMM overestimates the amount of rainfall from rain gauge, while both GSMaP and PERSIANN underestimate. The seasonal rainfall trend showed that the TRMM has followed similar pattern with the rain gauge data, the largest peak during Kiremt (long rain) and the secondary peak during Belg (short rain), and the dry spell during Bega (dry spell), seasons, whereas, the GSMaP and PERSIANN have showed the lowest rainfall values during Kiremt (long rain) season compared with the amount they observed for the remaining two seasons. The amount is very small compared with Bega (dry) and Belg (short rain) seasons rainfall of both products. Kiremt season is the main rain season in Ethiopia, the difference between TRMM and rain gauge was 62.8 mm, whereas, between GSMaP and PERSIANN with rain gauge were −99.2 and −84.9 mm, respectively. The result revealed that the TRMM product has a better advantage than GSMaP and PERSIANN over the study area.
Figure 7. Averaged seasonal rainfall GSMaP_MVK+, PERSIANN, and TRMM 3B42 averaged over selected grid cells with rain gauge data.
Remotesensing 07 11639 g007
In general, the quality of rainfall data from the TRMM at monthly and seasonal time scales is much better than at daily time scale compared with GSMaP and PERSIANN satellite rainfall products. This is because with the increase in time length, the probability of fit between the satellite based rainfall products and rain gauge data become increase. Therefore, the high correlation results from monthly and seasonal time scales are more encouraging to the use of TRMM data over data scarce eastern region of Ethiopia. The research conducted in Bali, Indonesia revealed that the TRMM product showed a good agreement with rain gauge datasets on monthly to seasonal time scales, whereas a very poor correlation was resulted between daily data from TRMM and rain gauges [67].
Table 9, Table 10 and Table 11 show the seasonal comparison of rainfall between rain gauges and three satellite rainfall products. At Belg and Bega seasons, TRMM outclass both GSMaP and PERSIANN in both detection as well as correlation of rainfall from rain gauges. During Belg and Bega seasons, “Kl”, and “FdBs” grid cells perform better than the remaining grid cells in terms of POD, FAR, ETS, and correlation coefficient. Looking to Kiremet season rainfall comparison, TRMM performance is poor in terms of FAR and ETS, however, it showed higher POD, and correlation. GSMaP and PERSIANN rainfall products showed negative correlation with rain gauge measurement. Both also have low POD and ETS values. This result shows that satellite rainfall products cannot accurately measure high rainfall rates.
Table 9. Belg season rainfall comparison between rain gauge and satellite rainfall products.
StationsProductPODFARETSCorrelationRMSEBiasMean Rainfall
HmHrCmGSMaP0.500.500.000.7029.77−21.7023.7
PERSIANN0.500.000.330.9510.98−3.6541.7
TRMM1.001.000.000.8237.7234.1079.4
FdBsGSMaP0.500.000.330.5929.69−19.9024.9
PERSIANN0.500.000.330.8123.33−12.1043.8
TRMM1.000.500.331.0021.9421.0065.8
KrDnGSMaP0.670.000.33−0.2024.13−10.5022.0
PERSIANN0.330.000.110.0337.71−10.1043.2
TRMM1.001.000.000.8852.8050.6083.2
KlGSMaP1.000.001.000.7076.72−46.3041.0
PERSIANN0.670.000.330.6462.01−38.0059.0
TRMM1.000.001.000.9913.902.9390.2
GrGSMaP1.000.001.000.7857.66−8.3747.7
PERSIANN0.670.000.330.6952.04−31.1058.2
TRMM1.000.001.000.9618.279.8786.4
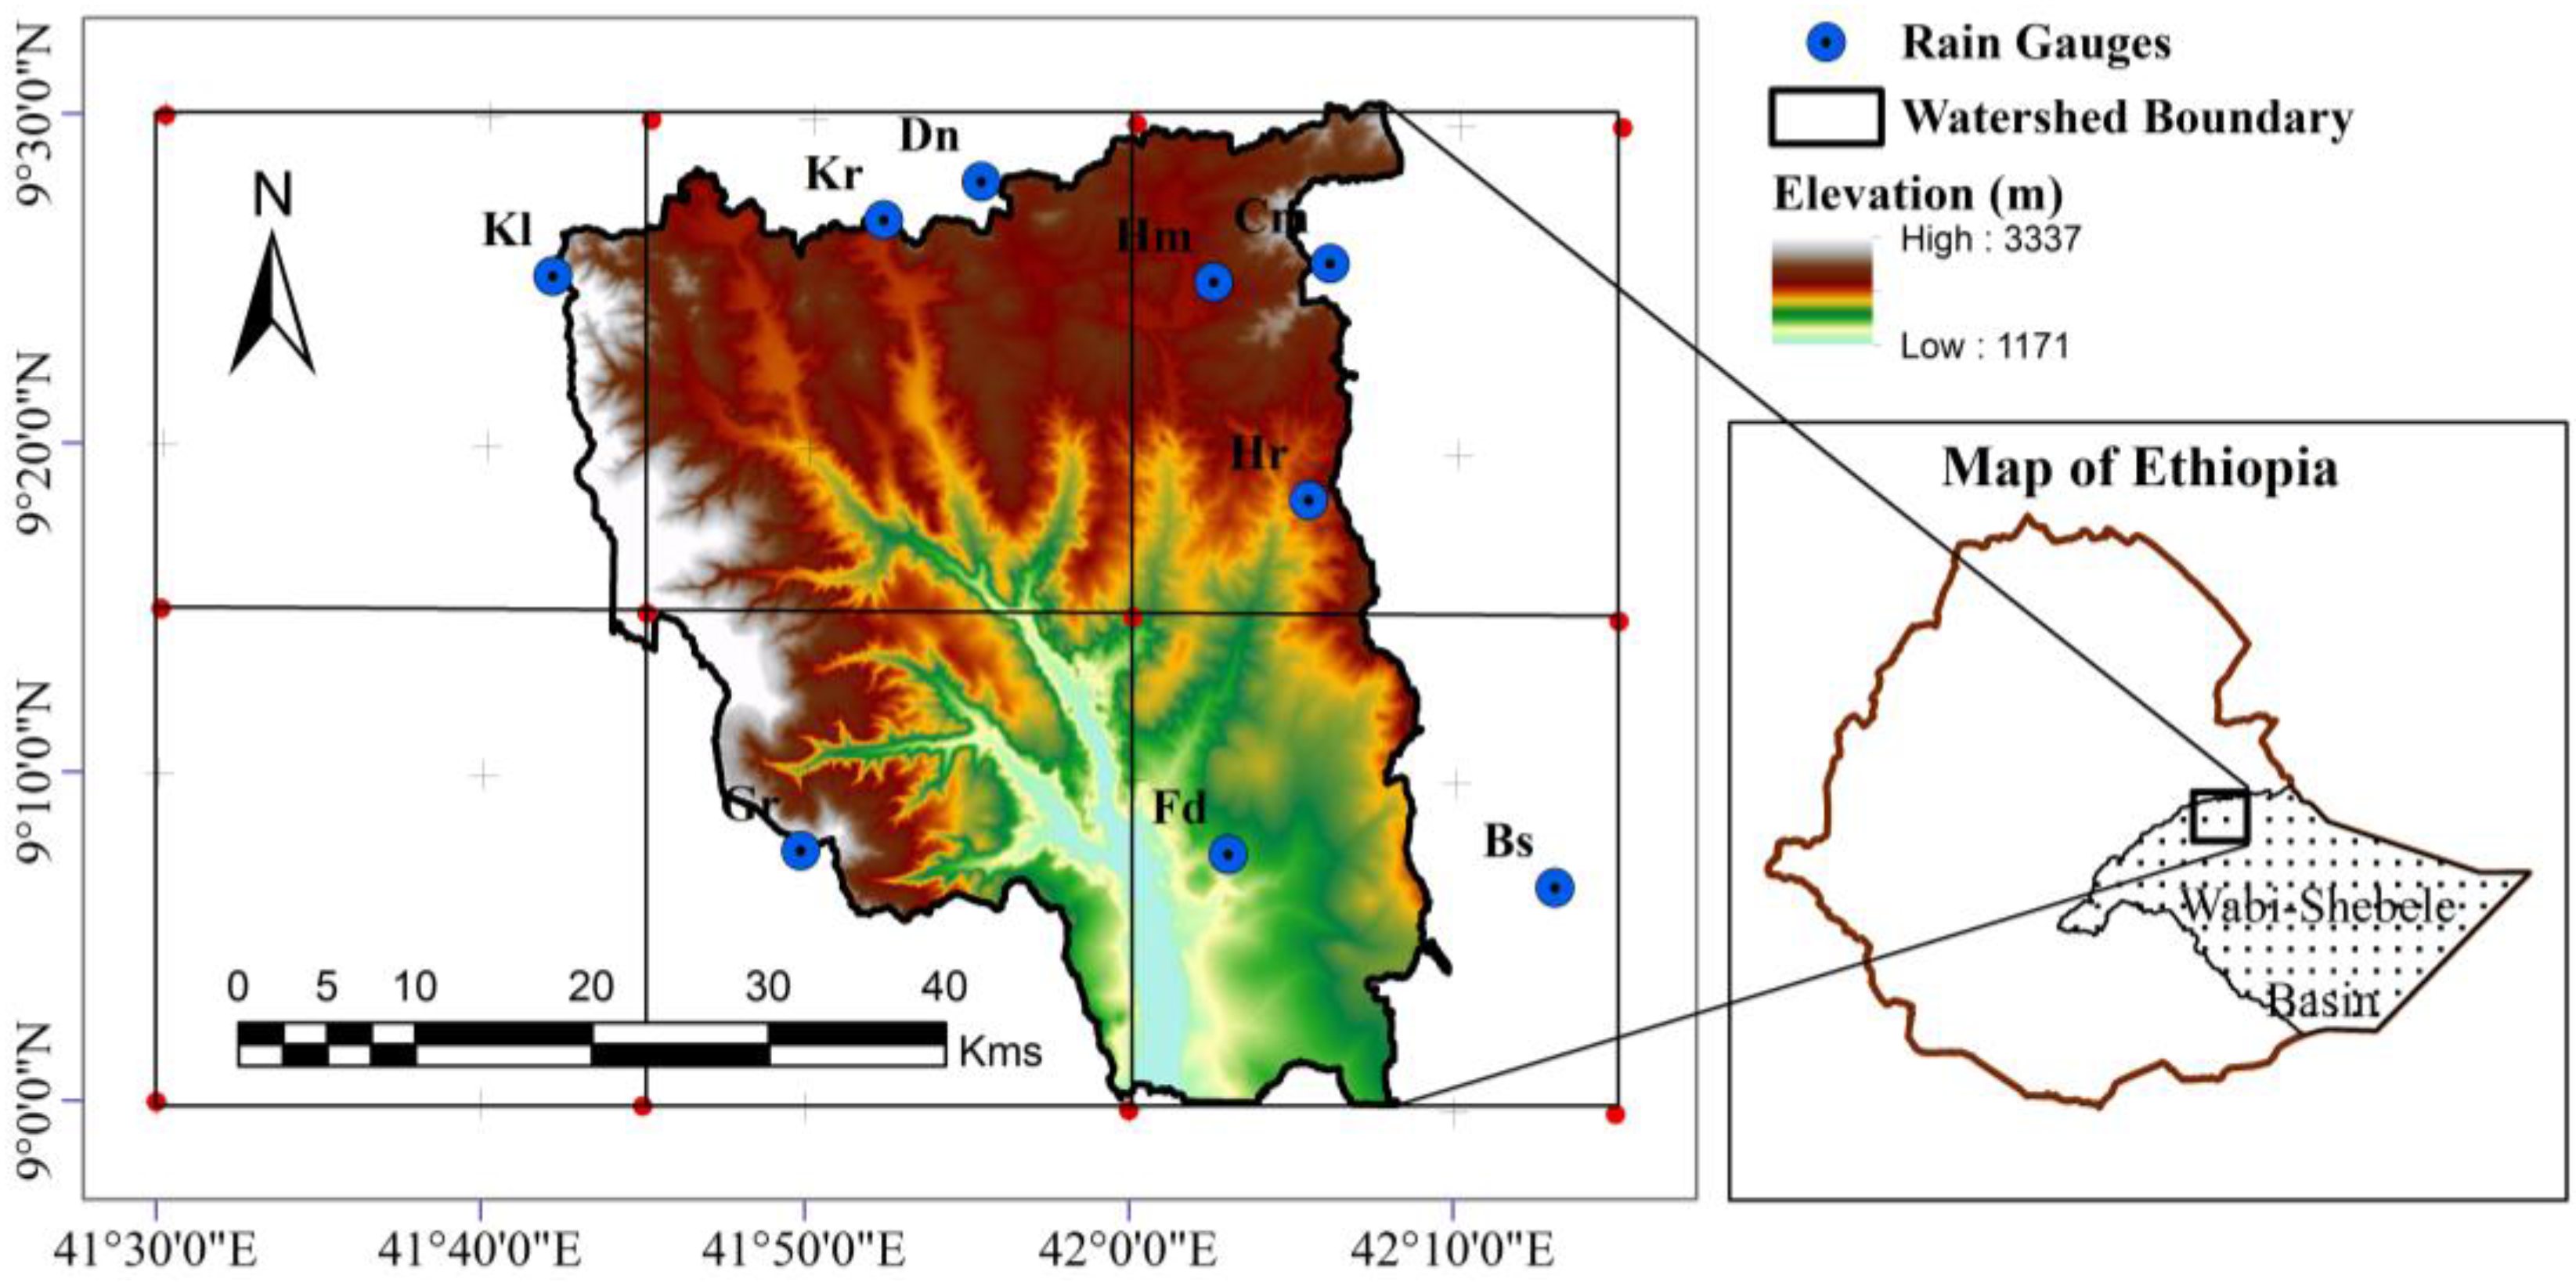
Rainfall is expected to vary spatially with altitude. The orographic effect is one good climatic reason why, at some grid cells, the correlation coefficient is low. The result showed that the rate of rainfall decrease towards the low lands of the study areas. For example, Girawa, at an altitude of 2380 m, has an annual rainfall of 930 mm, while Bisidimo, 1340 m altitude, has an annual rainfall of 691 mm (see Table 1). Hence, it can be seen that the correlation coefficient at those grid cells having low altitude (Bisidimo and Fedis) is low. Furthermore, PERSIANN and GSMaP underestimate rainfall from rain gauge.
Table 10. Bega season rainfall comparison between rain gauge and satellite rainfall products.
StationsProductPODFARETSCorrelationRMSEBiasMean Rainfall
HmHrCmGSMaP0.001.00−0.23−0.9178.69−57.3015.4
PERSIANN0.000.000.000.1272.98−60.3012.5
TRMM1.001.000.000.9578.4877.30150.0
FdBsGSMaP0.001.00−0.23−0.9365.26−50.2013.8
PERSIANN0.330.000.110.4053.01−44.4019.6
TRMM1.000.001.000.8858.9950.90114.9
KrDnGSMaP0.001.00−0.23−0.8583.70−2.8515.7
PERSIANN0.000.000.000.1974.78−15.2014.2
TRMM1.001.000.000.9968.8051.50140.3
KlGSMaP0.001.00−0.23−0.6526.52−14.3019.5
PERSIANN0.000.000.000.9518.85−18.7015.1
TRMM0.671.00−0.140.5424.8515.6049.3
GrGSMaP0.330.000.11−0.3933.39−24.4017.0
PERSIANN0.000.000.000.4328.15−24.6016.7
TRMM0.670.000.330.8411.582.7538.6
Table 11. Kiremt season rainfall comparison between rain gauge and satellite rainfall products.
StationsProductPODFARETSCorrelationRMSEBiasMean Rainfall
HmHrCmGSMaP0.330.000.11−0.4773.84−60.4017.7
PERSIANN0.330.000.11−0.1465.07−52.9025.1
TRMM1.001.000.000.9264.7959.00137.0
FdBsGSMaP0.330.000.11−0.4468.12−54.6018.6
PERSIANN0.330.000.11−0.0656.02−43.9029.4
TRMM1.001.000.000.9741.1036.30109.5
KrDnGSMaP0.330.000.11−0.8081.61−8.6016.6
PERSIANN0.330.000.11−0.4773.02−2.4025.8
TRMM1.001.000.000.9962.7242.90138.1
KlGSMaP0.000.000.00−0.77113.45−109.004.8
PERSIANN0.250.000.00−0.69101.50−96.0018.1
TRMM1.001.000.000.9866.5764.10178.2
GrGSMaP0.000.000.00−0.87129.15−42.406.7
PERSIANN0.250.000.00−0.67111.52−14.1027.0
TRMM1.001.000.000.9936.3660.30155.1

5. Conclusions

This paper compared the performance of three high-resolution satellite rainfall products (TRMM, PERSIANN, and GSMaP) with rain gauge stations over the data-scarce complex terrain of Eastern Ethiopia. With the advancement of satellite-based rainfall products in real-time over the Internet, there is a growing need for the use of high spatial and temporal resolution rainfall estimates in various hydrological related problems. Recently, these data are subjected for comparison with rain gauge data by several authors in different regions and climatic conditions to assess the strengths and limitations in order to understand and use them correctly. However, most studies in Ethiopia have been done using coarse-resolution satellite rainfall products at a basin scale. Therefore, this study specifically focused on the use of fine-resolution satellite rainfall products at a watershed level.
Results so far confirm that the TRMM 3B42 satellite rainfall had better performance in representing rainfall from rain gauges at daily, monthly, and seasonal time scales than PERSIANN and GSMaP. TRMM overestimates rainfall from rain gauges, which is consistent with its positive bias of 1.32 mm, while GSMaP and PERSIANN underestimate rainfall from rain gauges, which is related with their negative bias values of −1.44 and −1.20 mm, respectively. At daily time scales, TRMM correctly detected 88% of the rainfall from rain gauges. One possible reason for the better performance could be that TRMM 3B42 is calibrated with gauge data compared to PERSIANN and GSMaP products that used only remotely-sensed data. Therefore, TRMM products can provide viable alternative rainfall data that can be used for various water resource-related applications in the study area. The other two satellite products, GSMaP and PERSIANN, assessed in this study showed poor performance in reproducing rainfall events from rain gauge stations.
At all grids, TRMM detected rainfall from rain gauges better than the other two products. However, having higher POD (1.00), ETS (0.67), and correlation (0.92), TRMM 3B42 at grid cell “FdBs”, where terrain is relatively flat and has good rain gauge distribution, shows better approximate monthly rainfall from rain gauges compared to two of the remaining satellite products. The seasonal comparison shows that, during Bega (dry) season, the TRMM had a high positive bias (30.65 mm) compared with low negative biases registered by both GSMaP and PERSIANN, with values of −11.45 and −13.35 mm, respectively, which can be attributed to the high evaporation during the dry season. During the wet season, the difference between TRMM and rain gauges was 62.8 mm, whereas, between GSMaP and PERSIANN with rain gauges were −99.2 and −84.9 mm, respectively.
Despite GSMaP having higher spatial resolution, there is still much to work to improve the algorithms to use in mountainous regions, such as in Ethiopia, since the available rainfall data from existing ground rain gauge stations are not accurate due to missing data and a poor network of rain gauge stations. Overall, the performance of three rainfall products over relatively flat areas is better than in higher altitude.
Further comprehensive work is needed to make decisions about whether, and how, the TRMM data should be further processed so that it can be used in conjunction with the rain gauge observations. Particularly, the result from daily analysis suggests that TRMM products cannot be used without modifications. Thus, the results suggest that monthly and seasonal TRMM rainfall values are more suitable than daily TRMM rainfall in the study area. The reason associated with the limitation of TIR-based satellite rainfall products to provide direct information about depth of rainfall contributed for the poor performance of GSMaP and PERSIANN rainfall products. Hence, the local orographic effects may lead to underestimation of surface rainfall by both products.

Acknowledgments

This study is funded by the Engineering Capacity Building Program of Ethiopia (ECBP) of the Ministry of Education, Ethiopia. The authors acknowledge the support rendered by National Meteorological Agency (NMA).

Author Contributions

Shimelis Berhanu and Broder J. Merkel had the original idea for the study. Data acquisition was made by Tena Alamirew and Assefa M. Melesse. All the authors analyzed and carried out the interpretation. Shimelis Berhanu drafted the manuscript, which was revised by all authors. All authors read and approved the final manuscript.

Conflicts of Interest

The authors declare no conflict of interest.

References

  1. Joyce, R.J.; Janowiak, J.E.; Arkin, P.A.; Xie, P. Cmorph: A method that produces global precipitation estimates from passive microwave and infrared data at high spatial and temporal resolution. J. Hydrometeorol. 2004, 5, 487–503. [Google Scholar] [CrossRef]
  2. Mirshahi, B.; Onof, C.; Wheater, H. Spatialtemporal daily rainfall simulation for a semi-arid area in Iran: A preliminary evaluation of generalised linear models. In Proceedings of the 10th BHS National Hydrology Symposium: Sustainable Hydrology for the 21st Century, Exeter, UK, 15–17 September 2008; pp. 145–152.
  3. Yong, B.; Ren, L.-L.; Hong, Y.; Wang, J.-H.; Gourley, J.J.; Jiang, S.-H.; Chen, X.; Wang, W. Hydrologic evaluation of multisatellite precipitation analysis standard precipitation products in basins beyond its inclined latitude band: A case study in Laohahe basin, China. Water Resour. Res. 2010, 46, W07542. [Google Scholar] [CrossRef]
  4. Wong, W.F.J.; Chiu, L.S. Spatial and temporal analysis of rain gauge data and TRMM rainfall retrievals in Hong Kong. Geogr. Inf. Sci. 2008, 14, 105–112. [Google Scholar] [CrossRef]
  5. Krakauer, N.; Pradhanang, S.; Lakhankar, T.; Jha, A. Evaluating satellite products for precipitation estimation in mountain regions: A case study for Nepal. Remote Sens. 2013, 5, 4107–4123. [Google Scholar] [CrossRef]
  6. Sarangi, A.; Cox, C.; Madramootoo, C. Geostatistical methods for prediction of spatial variability of rainfall in a mountainous region. Trans. ASAE 2005, 48, 943–954. [Google Scholar] [CrossRef]
  7. Chokngamwong, R.; Chiu, L.S. Comparisons of Daily Thailand Rain Gauge with GPCC and TRMM Satellite Precipitation Measurements; George Mason University: Fairfax, VA, USA, 2004. [Google Scholar]
  8. Nair, S.; Srinivasan, G.; Nemani, R. Evaluation of multi-satellite TRMM derived rainfall estimates over a western state of India. J. Meteorol. Soc. Jpn. Ser. II 2009, 87, 927–939. [Google Scholar] [CrossRef]
  9. Villarini, G. Evaluation of the research-version TMPA rainfall estimate at its finest spatial and temporal scales over the Rome metropolitan area. J. Appl. Meteorol. Climatol. 2010, 49, 2591–2602. [Google Scholar] [CrossRef]
  10. Buytaert, W.; Celleri, R.; Willems, P.; Bièvre, B.D.; Wyseure, G. Spatial and temporal rainfall variability in mountainous areas: A case study from the south Ecuadorian Andes. J. Hydrol. 2006, 329, 413–421. [Google Scholar] [CrossRef] [Green Version]
  11. Anders, A.M.; Roe, G.H.; Hallet, B.; Montgomery, D.R.; Finnegan, N.J.; Putkonen, J. Spatial patterns of precipitation and topography in the Himalaya. Geol. Soc. Am. Spec. Pap. 2006, 398, 39–53. [Google Scholar]
  12. Hughes, D.A. Modelling semi-arid and arid hydrology and water resources: The southern Africa experience. In Hydrological Modelling in Arid and Semi-Arid Areas; Cambridge University Press: Cambrigde, UK, 2006; pp. 29–40. [Google Scholar]
  13. Pilgrim, D.H.; Chapman, T.G.; Doran, D.G. Problems of rainfall-runoff modelling in arid and semiarid regions. Hydrol. Sci. J. 1988, 33, 379–400. [Google Scholar] [CrossRef]
  14. Collier, C. On the propagation of uncertainty in weather radar estimates of rainfall through hydrological models. Meteorol. Appl. 2009, 16, 35–40. [Google Scholar] [CrossRef]
  15. Germann, U.; Berenguer, M.; Sempere-Torres, D.; Zappa, M. REAL-Ensemble radar precipitation estimation for hydrology in a mountainous region. Q. J. R. Meteorol. Soc. 2009, 135, 445–456. [Google Scholar] [CrossRef] [Green Version]
  16. Habib, E.; Aduvala, A.V.; Meselhe, E.A. Analysis of radar-rainfall error characteristics and implications for streamflow simulation uncertainty. Hydrol. Sci. J. 2008, 53, 568–587. [Google Scholar] [CrossRef]
  17. Villarini, G.; Krajewski, W.F.; Ciach, G.J.; Zimmerman, D.L. Product-error-driven generator of probable rainfall conditioned on WSR-88d precipitation estimates. Water Resour. Res. 2009, 45. [Google Scholar] [CrossRef]
  18. Yilmaz, M.T.; Houser, P.; Shrestha, R.; Anantharaj, V.G. Optimally merging precipitation to minimize land surface modeling errors. J. Appl. Meteorol. Climatol. 2009, 49, 415–423. [Google Scholar] [CrossRef]
  19. Collischonn, B.; Collischonn, W.; Tucci, C.E.M. Daily hydrological modeling in the Amazon basin using TRMM rainfall estimates. J. Hydrol. 2008, 360, 207–216. [Google Scholar] [CrossRef]
  20. Ghile, Y.; Schulze, R.; Brown, C. Evaluating the performance of ground-based and remotely sensed near real-time rainfall fields from a hydrological perspective. Hydrol. Sci. J. 2010, 55, 497–511. [Google Scholar] [CrossRef]
  21. Jiang, S.; Ren, L.; Yong, B.; Yang, X.; Shi, L. Evaluation of high-resolution satellite precipitation products with surface rain gauge observations from Laohahe basin in northern China. Water Sci. Eng. 2010, 3, 405–417. [Google Scholar]
  22. Huffman, G.J.; Bolvin, D.T.; Nelkin, E.J.; Wolff, D.B.; Adler, R.F.; Gu, G.; Hong, Y.; Bowman, K.P.; Stocker, E.F. The TRMM multi-satellite precipitation analysis (TMPA): Quasi-global, multi-year, combined-sensor precipitation estimates at fine scales. J. Hydrometeorol. 2007, 8, 38–55. [Google Scholar] [CrossRef]
  23. Negreiros, J.; Costa, A.; Painho, M. Evaluation of stochastic geographical matters: Morphologic geostatistics, conditional sequential simulation and geographical weighted regression. Trends Appl. Sci. Res. 2011, 6, 237–255. [Google Scholar] [CrossRef]
  24. Jia, S.; Zhu, W.; Lű, A.; Yan, T. A statistical spatial downscaling algorithm of TRMM precipitation based on NDVI and DEM in the Qaidam Basin of China. Remote Sens. Environ. 2011, 115, 3069–3079. [Google Scholar] [CrossRef]
  25. Adab, H.; Khazaei, A.; Sattari, F. Evaluation of geostatistical interpolation of rainfall by TRMM satellite data at the regional scale. Int. J. Agric. Crop Sci. 2013, 5, 132–137. [Google Scholar]
  26. Todd, M.C.; Kidd, C.; Kniveton, D.; Bellerby, T.J. A combined satellite infrared and passive microwave technique for estimation of small-scale rainfall. J. Atmos. Ocean. Technol. 2001, 18, 742–755. [Google Scholar] [CrossRef]
  27. Adeyewa, Z.D.; Nakamura, K. Validation of TRMM radar rainfall data over major climatic regions in Africa. J. Appl. Meteorol. 2003, 42, 331–347. [Google Scholar] [CrossRef]
  28. Bowman, K.P. Comparison of TRMM precipitation retrievals with rain gauge data from ocean buoys. J. Clim. 2005, 18, 178–190. [Google Scholar] [CrossRef]
  29. Junzhi, L.; A-Xing, Z.; Zheng, D. Evaluation of TRMM 3B42 precipitation product using rain gauge data in meichuan watershed, Poyang Lake basin, China. J. Res. Ecol. 2012, 3, 359–366. [Google Scholar] [CrossRef]
  30. Kummerow, C.; Barnes, W.; Kozu, T.; Shiue, J.; Simpson, J. The tropical rainfall measuring mission (TRMM) sensor package. J. Atmos. Ocean. Technol. 1998, 15, 809–817. [Google Scholar] [CrossRef]
  31. Kubota, T.; Shige, S.; Hashizume, H.; Aonashi, K.; Takahashi, N.; Seto, S.; Takayabu, Y.N.; Ushio, T.; Nakagawa, K.; Iwanami, K. Global precipitation map using satellite-borne microwave radiometers by the GSMaP project: Production and validation. IEEE Trans. Geosci. Remote Sens. 2007, 45, 2259–2275. [Google Scholar] [CrossRef]
  32. Hsu, K.-L.; Gao, X.; Sorooshian, S.; Gupta, H.V. Precipitation estimation from remotely sensed information using artificial neural networks. J. Appl. Meteorol. 1997, 36, 1176–1190. [Google Scholar] [CrossRef]
  33. Sorooshian, S.; Hsu, K.-L.; Gao, X.; Gupta, H.V.; Imam, B.; Braithwaite, D. Evaluation of persiann system satellite-based estimates of tropical rainfall. Bull. Am. Meteorol. Soc. 2000, 81, 2035–2046. [Google Scholar] [CrossRef]
  34. Yatagai, A.; Kamiguchi, K.; Arakawa, O.; Hamada, A.; Yasutomi, N.; Kitoh, A. Aphrodite: Constructing a long-term daily gridded precipitation dataset for Asia based on a dense network of rain gauges. Bull. Am. Meteorol. Soc. 2012, 93, 1401–1415. [Google Scholar] [CrossRef]
  35. Shrestha, M.; Takara, K.; Kubota, T.; Bajracharya, S. Verification of GSMaP rainfall estimates over the central Himalayas. J. Jpn. Soc. Civ. Eng. 2011, 67, I_37–I_42. [Google Scholar] [CrossRef]
  36. Abushandi, E.; Merkel, B. Rainfall estimation over the Wadi Dhuliel arid catchment, Jordan from GSMaP_MVK+. Hydrol. Earth Syst. Sci. Discuss. 2011, 8, 1665–1704. [Google Scholar] [CrossRef]
  37. Hirpa, F.A.; Gebremichael, M.; Hopson, T. Evaluation of high-resolution satellite precipitation products over very complex terrain in Ethiopia. J. Appl. Meteorol. Climatol. 2010, 49, 1044–1051. [Google Scholar] [CrossRef]
  38. Wang, J.; Wolff, D.B. Evaluation of TRMM rain estimates using ground measurements over central Florida. J. Appl. Meteorol. Climatol. 2012, 51, 926–940. [Google Scholar] [CrossRef]
  39. Kummerow, C.; Simpson, J.; Thiele, O.; Barnes, W.; Chang, A.T.C.; Stocker, E.; Adler, R.F.; Hou, A.; Kakar, R.; Wentz, F.; et al. The status of the tropical rainfall measuring mission (TRMM) after two years in orbit. J. Appl. Meteorol. 2000, 39, 1965–1982. [Google Scholar] [CrossRef]
  40. Romilly, T.G.; Gebremichael, M. Evaluation of satellite rainfall estimates over Ethiopian river basins. Hydrol. Earth Syst. Sci. 2011, 15, 1505–1514. [Google Scholar] [CrossRef]
  41. Diro, G.T.; Grimes, D.I.F.; Black, E.; O’Neill, A.; Pardo-Iguzquiza, E. Evaluation of reanalysis rainfall estimates over Ethiopia. Int. J. Climatol. 2009, 29, 67–78. [Google Scholar] [CrossRef]
  42. Cheung, W.H.; Senay, G.B.; Singh, A. Trends and spatial distribution of annual and seasonal rainfall in Ethiopia. Int. J. Climatol. 2008, 28, 1723–1734. [Google Scholar] [CrossRef]
  43. National Meteorology Service Agency. Climatic and Agroclimatic Resources of Ethiopia; NMSA: Addis Ababa, Ethiopia, 1996.
  44. Seleshi, Y.; Zanke, U. Recent changes in rainfall and rainy days in Ethiopia. Int. J. Climatol. 2004, 24, 973–983. [Google Scholar] [CrossRef]
  45. Huffman, G.J.; Bolvin, D.T. TRMM and Other Data Precipitation Data Set Documentation. Available online: http://ftp://meso-a.gsfc.nasa.gov/pub/trmmdocs/3B42_3B43_doc.pdf (accessed on 24 August 2015).
  46. The TRMM Webpage. Available online: http://disc2.nascom.nasa.gov/tovas/ (accessed on 16 May 2015).
  47. The PERSIANN System. Available online: http://chrs.web.uci.edu/research/satellite_precipitation/activities00.html (accessed on 30 August 2015).
  48. PERSIANN 0.25° Product Access Tools. Available online: http://chrs.web.uci.edu/persiann/data.html (accessed on 30 August 2015).
  49. Ushio, T.; Kachi, M. Kalman filtering applications for global satellite mapping of precipitation (gsmap). In Satellite Rainfall Applications for Surface Hydrology; Gebremichael, M., Hossain, F., Eds.; Springer: Dordrecht, The Netherlands, 2010; pp. 105–123. [Google Scholar]
  50. GSMaP_MVK+. Available online: http://sharaku.eorc.jaxa.jp/GSMaP_crest/gdac/doc/GSMaP_MVK+_e.html (accessed on 30 August 2015).
  51. Andermann, C.; Bonnet, S.; Gloaguen, R. Evaluation of precipitation data sets along the Himalayan front. Geochem. Geophys. Geosyst. 2011, 12, Q07023. [Google Scholar] [CrossRef]
  52. American Society of Civil Engineers (ASCE). Hydrology Handbook; American Society of Civil Engineers: New York, NY, USA, 1996. [Google Scholar]
  53. Vieux, B.E. Distributed hydrologic modeling. In Encyclopedia of GIS; Springer Science & Business Media: Berlin, Germany, 2008; pp. 250–254. [Google Scholar]
  54. Behrangi, A.; Hsu, K.-L.; Imam, B.; Sorooshian, S.; Huffman, G.J.; Kuligowski, R.J. PERSIANN-MSA: A precipitation estimation method from satellite-based multispectral analysis. J. Hydrometeorol. 2009, 10, 1414–1429. [Google Scholar] [CrossRef]
  55. Ebert, E.E.; Janowiak, J.E.; Kidd, C. Comparison of near-real-time precipitation estimates from satellite observations and numerical models. Bull. Am. Meteorol. Soc. 2007, 88, 47–64. [Google Scholar] [CrossRef]
  56. Scheel, M.L.M.; Rohrer, M.; Huggel, C.; Santos Villar, D.; Silvestre, E.; Huffman, G.J. Evaluation of TRMM multi-satellite precipitation analysis (TMPA) performance in the central andes region and its dependency on spatial and temporal resolution. Hydrol. Earth Syst. Sci. Discuss. 2010, 7, 8545–8586. [Google Scholar] [CrossRef]
  57. Khan, S.I.; Yang, H.; Wang, J.; Yilmaz, K.K.; Gourley, J.J.; Adler, R.F.; Brakenridge, G.R.; Policell, F.; Habib, S.; Irwin, D. Satellite remote sensing and hydrologic modeling for flood inundation mapping in Lake Victoria basin: Implications for hydrologic prediction in ungauged basins. IEEE Trans. Geosci. Remote Sens. 2011, 49, 85–95. [Google Scholar] [CrossRef]
  58. Moazami, S.; Golian, S.; Kavianpour, M.R.; Hong, Y. Comparison of persiann and v7 TRMM multi-satellite precipitation analysis (TMPA) products with rain gauge data over Iran. Int. J. Remote Sens. 2013, 34, 8156–8171. [Google Scholar] [CrossRef]
  59. Tobin, K.J.; Bennett, M.E. Adjusting satellite precipitation data to facilitate hydrologic modeling. J. Hydrometeorol. 2010, 11, 966–978. [Google Scholar] [CrossRef]
  60. Gao, Y.C.; Liu, M.F. Evaluation of high-resolution satellite precipitation products using rain gauge observations over the Tibetan Plateau. Hydrol. Earth Syst. Sci. 2013, 17, 837–849. [Google Scholar] [CrossRef]
  61. Tian, Y.; Peters-Lidard, C.D.; Adler, R.F.; Kubota, T.; Ushio, T. Evaluation of GSMaP precipitation estimates over the contiguous United States. J. Hydrometeorol. 2010, 11, 566–574. [Google Scholar] [CrossRef]
  62. Dahmen, E.R.; Hall, M.J. Screening of Hydrological Data: Tests for Stationarity and Relative Consistency; International Institute for Land Reclamation and Improvement: Wageningen, The Netherlands, 1990. [Google Scholar]
  63. McCuen, R.H. Hydrologic Analysis and Design, 2nd ed.; Prentice Hall: Upper Saddle River, NJ, USA, 1998. [Google Scholar]
  64. Wigbout, M. Limitations in the use of double-mass curves. J. Hydrol. 1973, 12, 132–138. [Google Scholar]
  65. Li, X.; Zhang, Q.; Xu, C.-Y. Assessing the performance of satellite-based precipitation products and its dependence on topography over Poyang Lake basin. Theor. Appl. Climatol. 2013, 115, 713–729. [Google Scholar] [CrossRef]
  66. Sapiano, M.R.P.; Arkin, P.A. An intercomparison and validation of high-resolution satellite precipitation estimates with 3-hourly gauge data. J. Hydrometeorol. 2009, 10, 149–166. [Google Scholar] [CrossRef]
  67. As-Syakur, A.R.; Tanaka, T.; Prasetia, R.; Swardika, I.K.; Kasa, I.W. Comparison of TRMM multisatellite precipitation analysis (TMPA) products and daily-monthly gauge data over Bali. Int. J. Remote Sens. 2011, 32, 8969–8982. [Google Scholar] [CrossRef]

