1. Introduction
About three decades ago, Normalized Difference Vegetation Index (NDVI) derived from NOAA/NASA Pathfinder Advanced Very High Resolution Radiometer (AVHRR) enabled observation of vegetation conditions at global and almost real-time scales unlike any time before. Owing to its constant spatial and temporal coverage of Earth’s surface, it became feasible to monitor global vegetation development on a relatively continuous and consistent basis. There are numerous examples of how Pathfinder AVHRR Land (PAL) NDVI has been used in various scientific fields such as earth sciences, ecology, climate change, socio-economics, epidemiological studies and more. Pathfinder NDVI has been used to estimate global and regional scale land primary productivity estimates [
1,
2], identify CO
2 fertilization effects in natural settings [
3], study vegetation condition and El Niño relationship [
4], perform climatic impact modeling for deforestation [
5] and epidemiological modeling for tropical diseases such as malaria [
6,
7].
PAL NDVI data sets were produced in several different temporal and spatial resolutions and cover from July 1981 until September 2001. Before discontinuation, PAL NDVI data sets were publicly available via NASA Goddard Space Flight Center (GSFC) Distributed Active Archive Center (DAAC), which is currently known as Goddard Earth Sciences Data and Information Services Center (GES DISC). At present, more than 20 years of rich Pathfinder NDVI data sets have been archived and removed from public access by the GSFC. Currently available NOAA-AVHRR NDVI data include Global Inventory Modeling and Mapping Studies (GIMMS) monthly NDVI from 1981 to 2002 [
8] and Land Long Term Data Record (LTDR) daily NDVI from 1981 to 1999 [
9].
Like any other satellite data, Pathfinder NDVI are not perfect. First of all, vegetation indices derived from surface reflectance data such as the Channel 1 (Red) and Channel 2 (near-infrared, NIR) of AVHRR are, in general, not sufficient to fully understand vegetation development because they cannot provide data on green leaf layers under the vegetation surface. Some common imperfection of the data is caused by satellite orbit drift, difference of degradation of the channels 1 and 2 of AVHRR itself and cloud contamination, therefore calibration changes were made throughout the product generations for improvement [
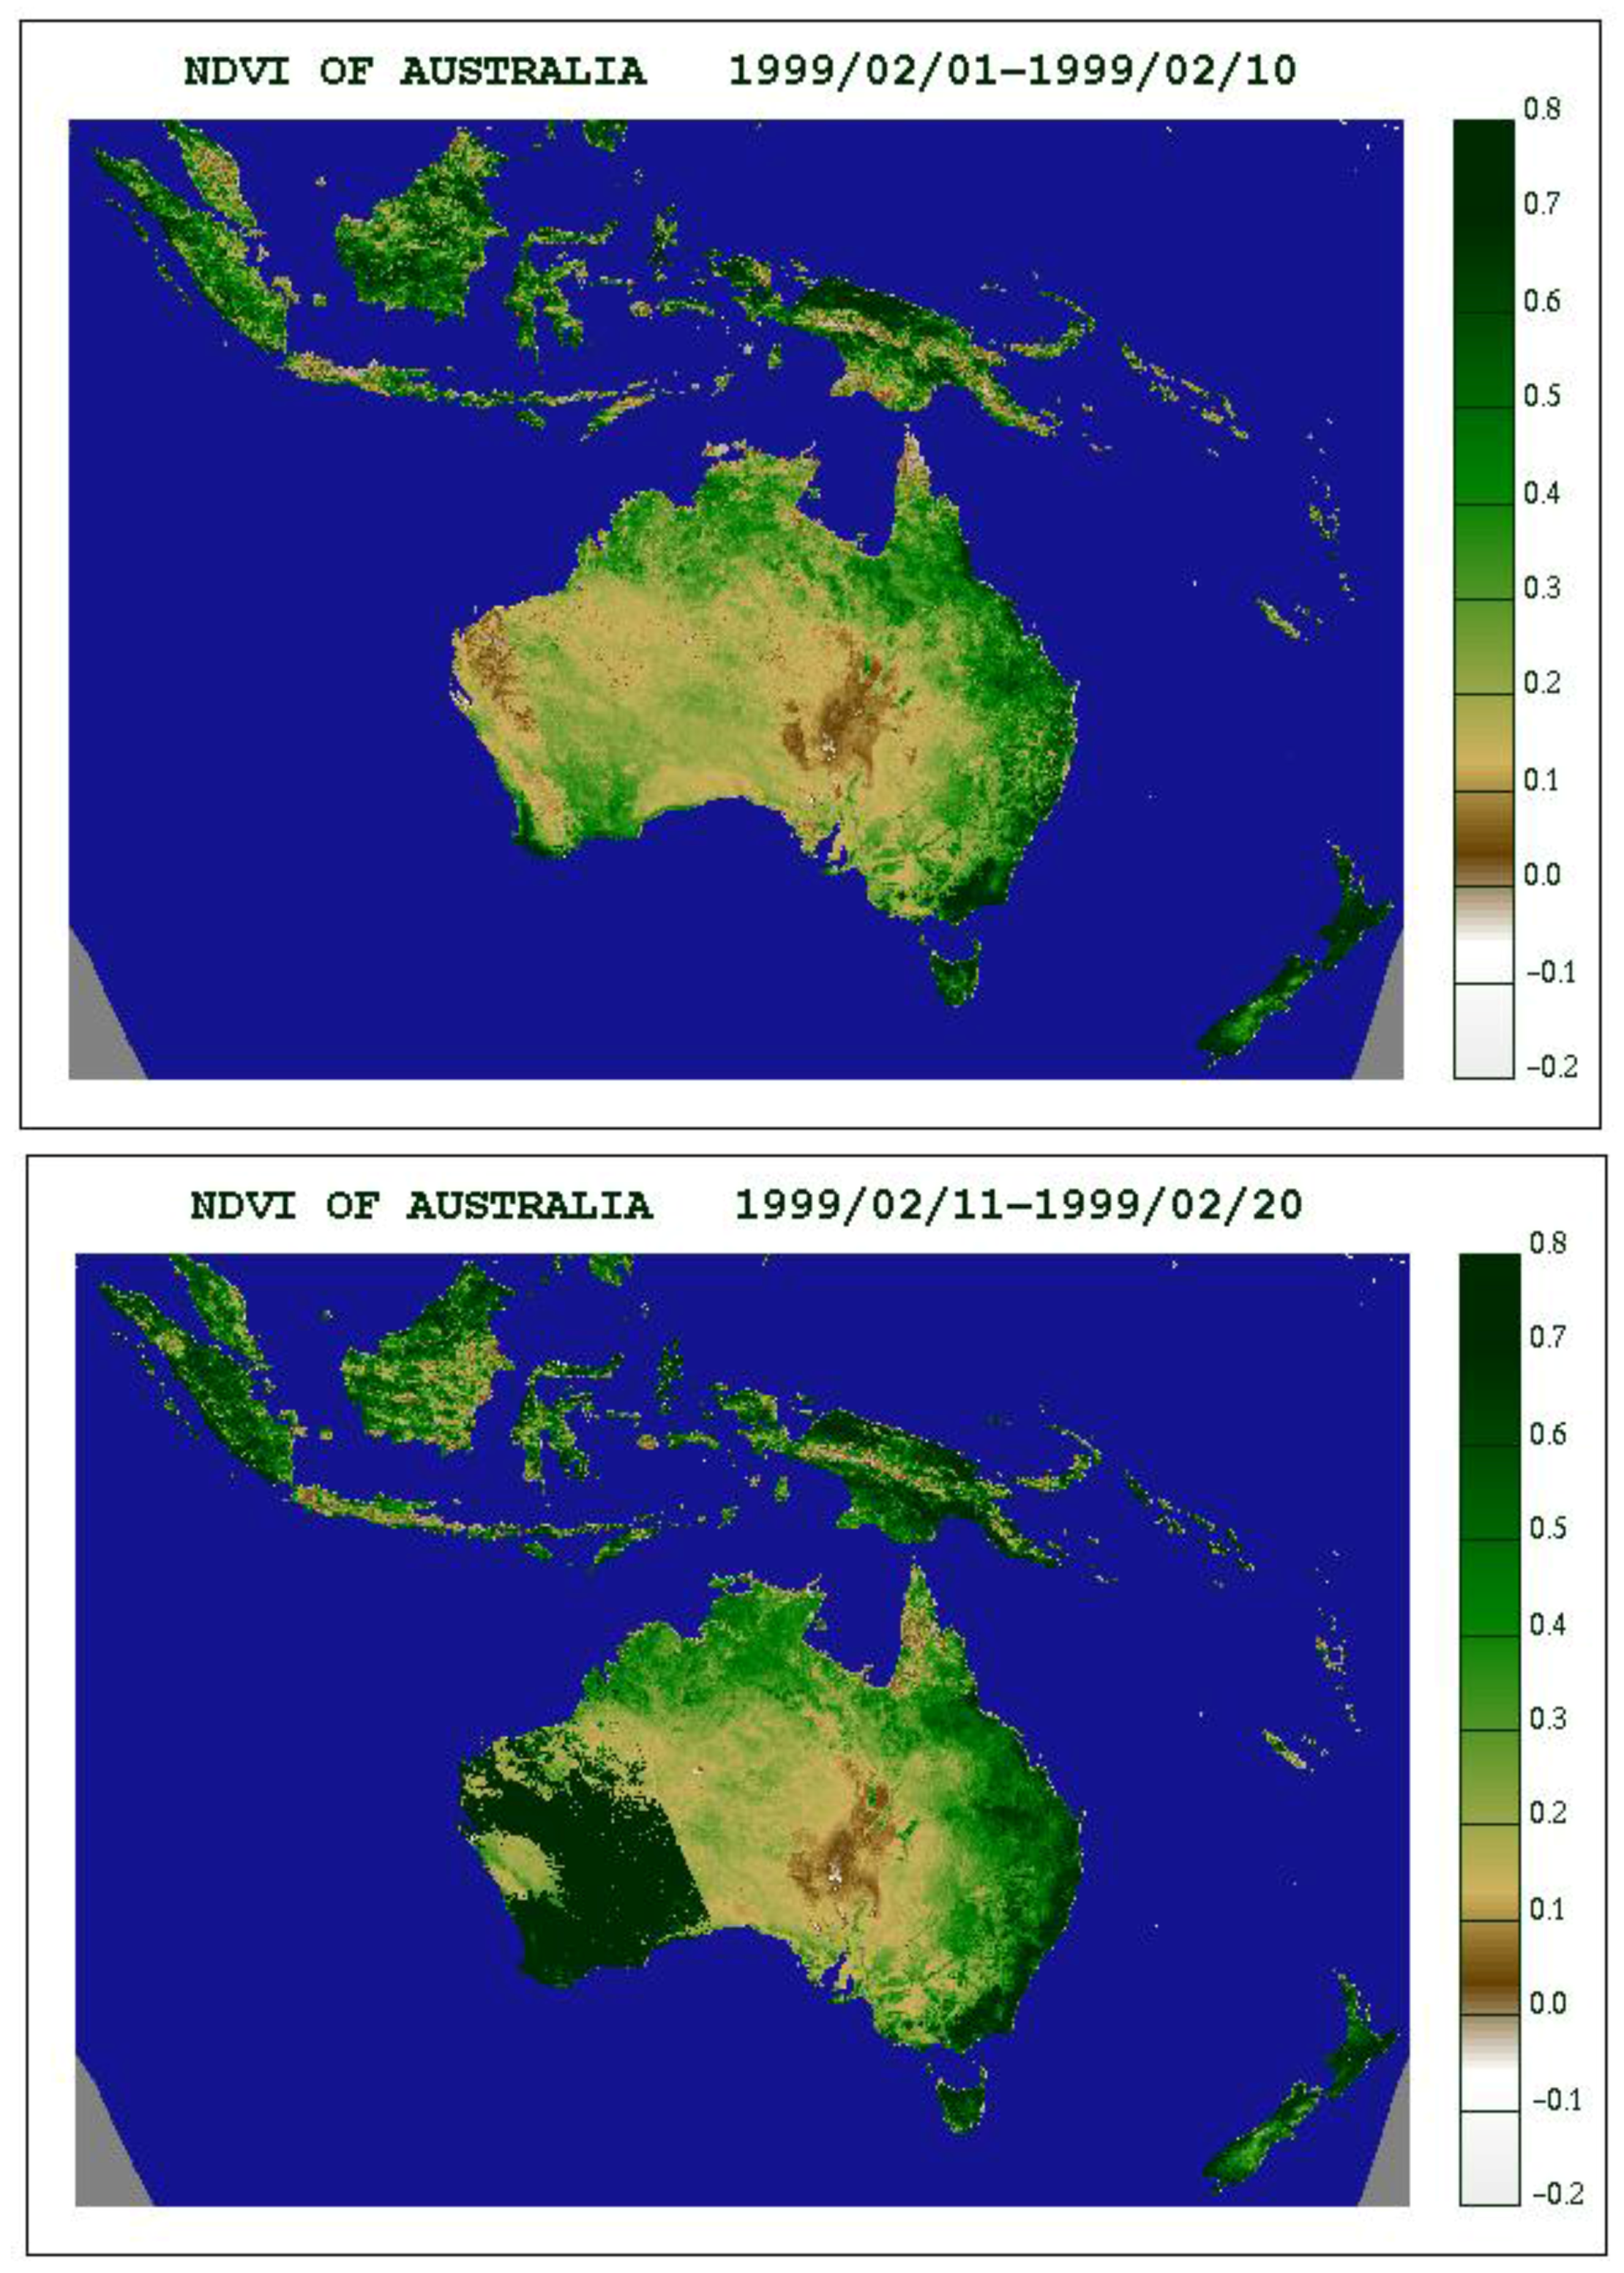
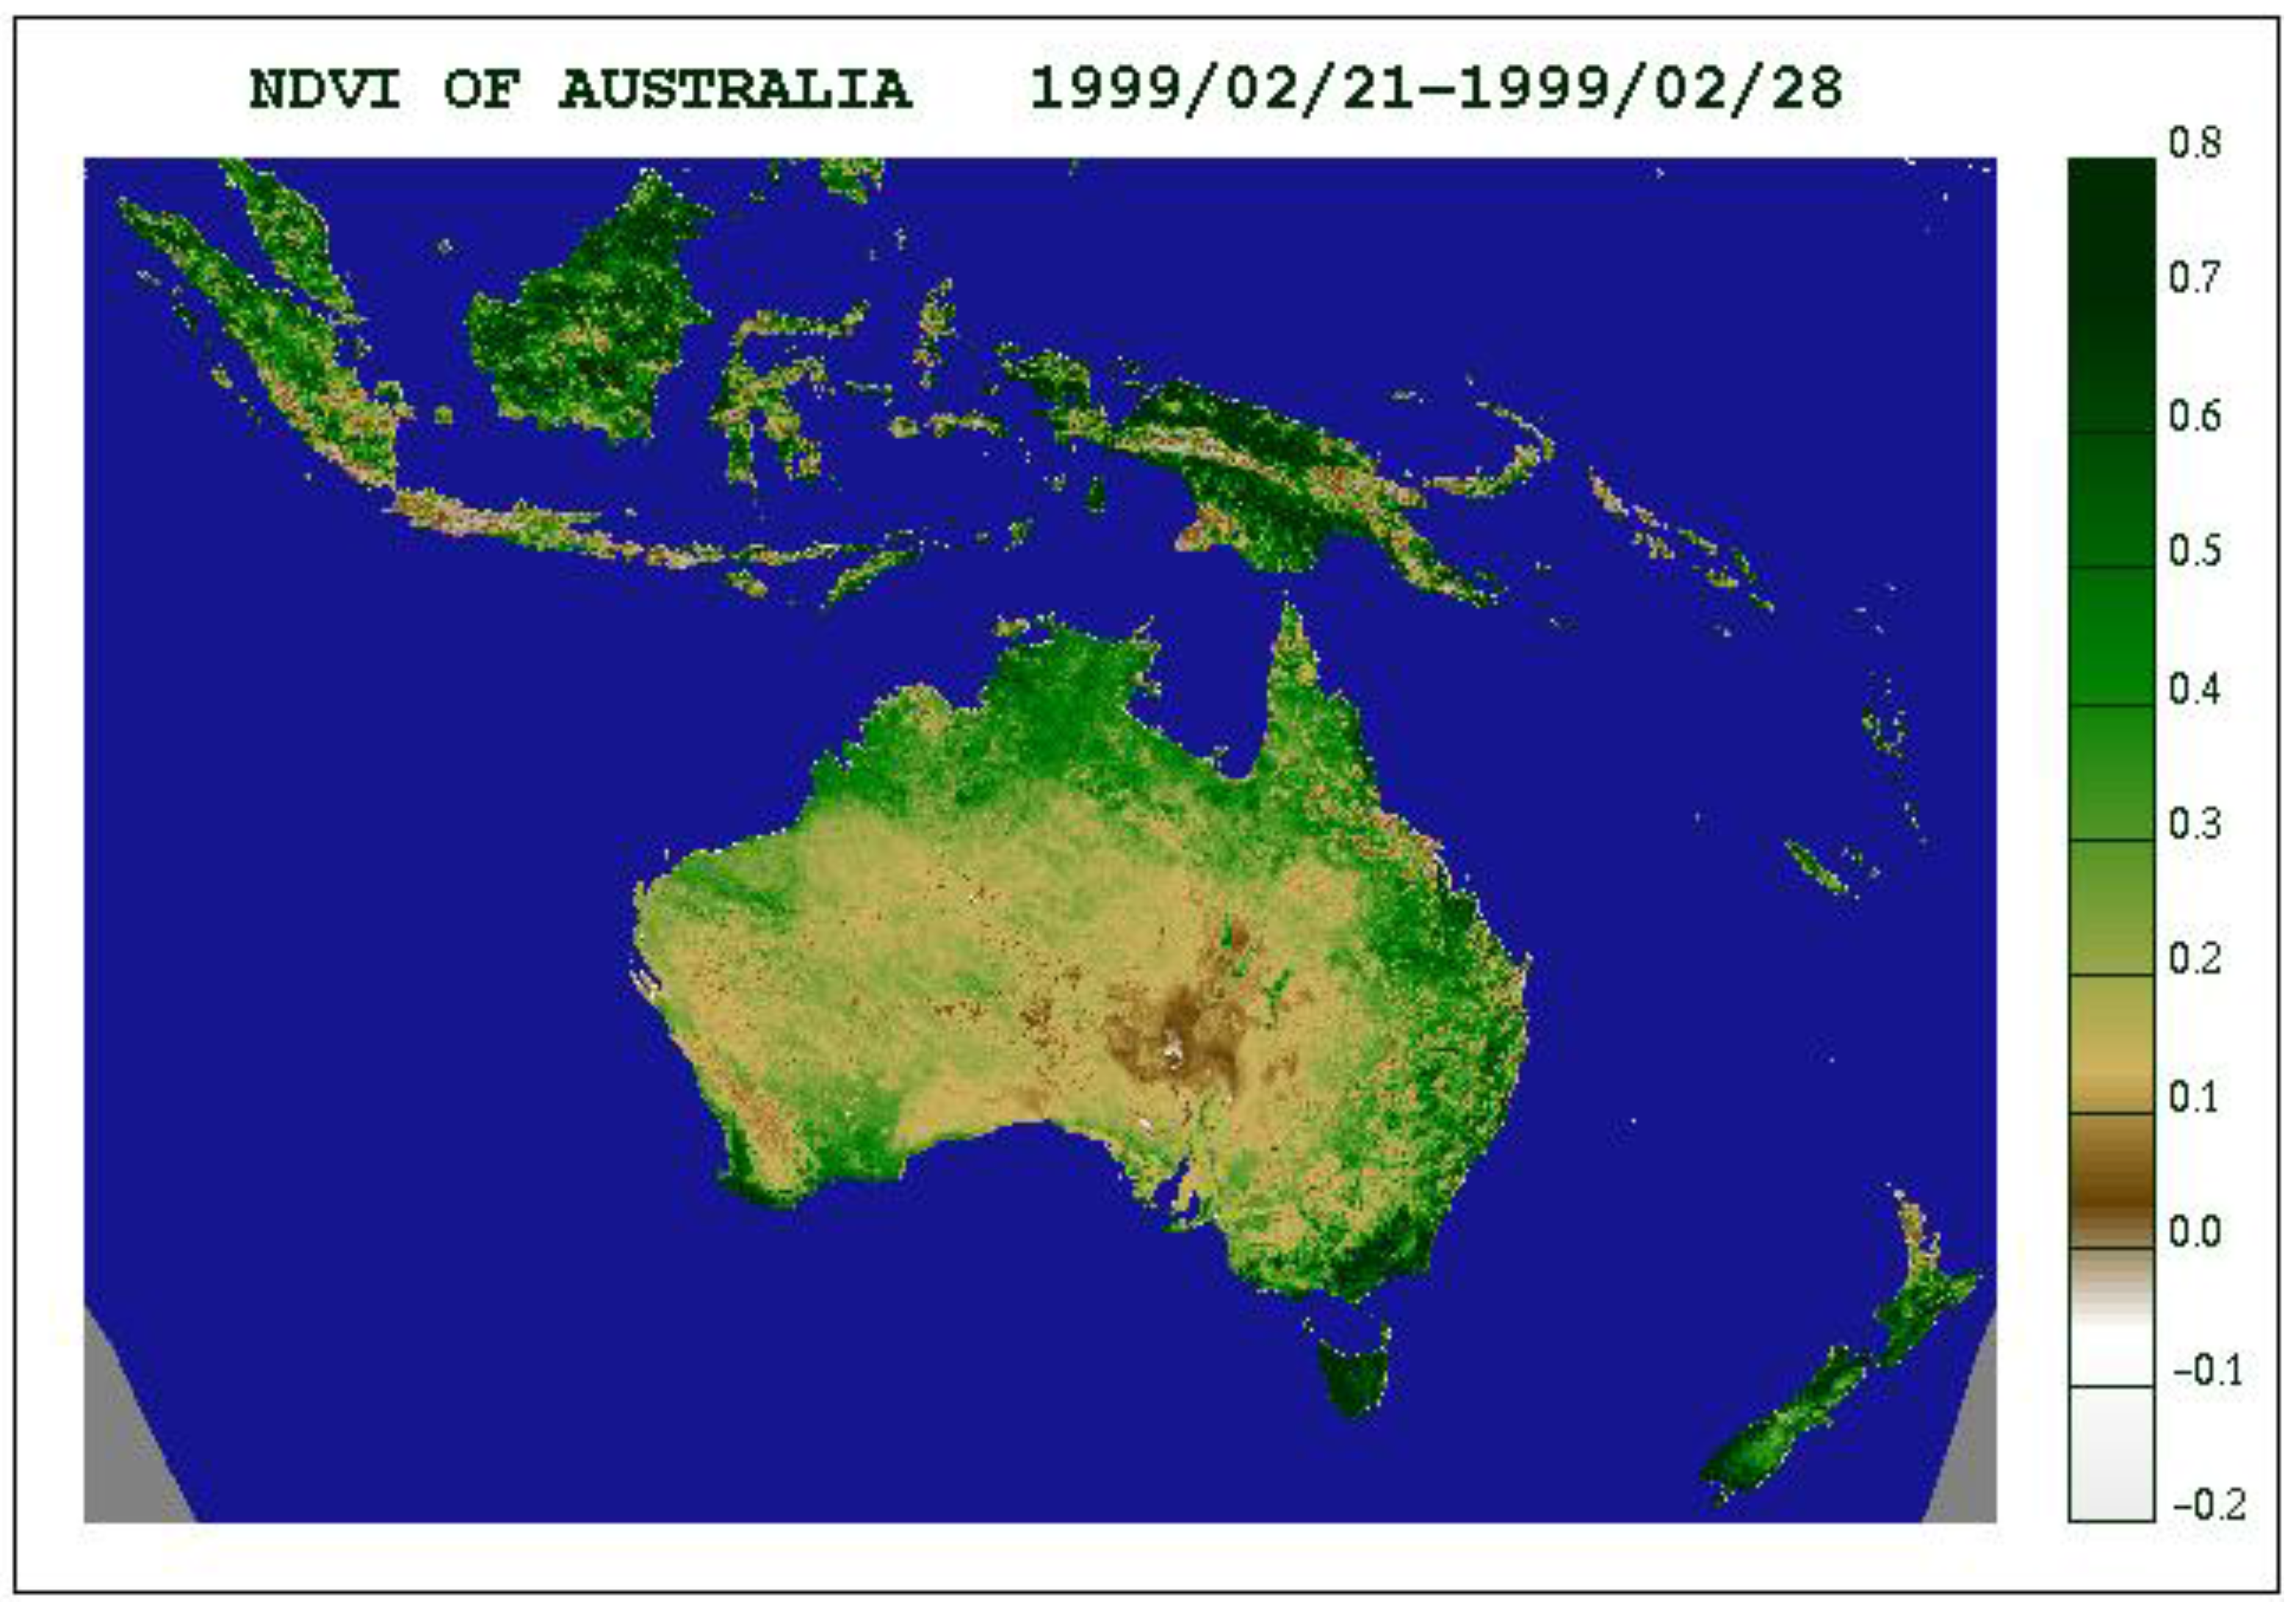
10]. Nevertheless, in the case of the second 10-day composite of February 1999 for Western Australia region, AVHRR’s observations resulted in PAL NDVI values completely out of the expected range, of which will be investigated in the following sections. The original NASA’s 10-day composite image files of PAL NDVI for February 1999 are presented in
Appendix A.
2. Data
Pathfinder NDVI (noted as ‘XVI’ in [
10]) was derived from two reflectance values; one in red range visible spectrum (Channel 1, wavelength of 0.58–0.68µm) and the other near-infrared (Channel 2, wavelength of 0.73–1.10 µm) of AVHRR. AVHRR is a passive scanning radiometer, onboard NOAA satellite series. NOAA satellites are near sun-synchronous polar orbiters, and the first satellite that was used to produce Pathfinder NDVI was NOAA-7, which was launched in June 1981. Pathfinder NDVI was defined as NDVI = (
R2 − R1)/(R1 + R2), where
R1 is Channel 1 reflectance and
R2 is Channel 2, based on the characteristic tendency of green leaves to absorb red radiance, Channel 1, and reflect near-infrared, Channel 2 [
11]. That is, more Channel 2 reflectance and less Channel 1 reflectance imply stronger green vegetation signs. The difference of the two channels reflectance was divided by the sum of the two channels to normalize the NDVI to have a range between −1 and 1.
The publically available 8 km × 8 km Pathfinder NDVI data sets were provided in two temporal resolutions, 10-day composites and monthly. The AVHRR onboard NOAA, a polar orbiter, could provide repetitive measurements of reflectance from the same location during a 10-day composite period owing to its twice daily earth scans with orbital period of 102 minutes and swath of about 2,700 km. The NDVI composites were computed for each cell, and re-computed when new data values became available within the same period [
10]. The NDVI value assigned to each cell in the composite image was the highest value for that location during the period of the composite.
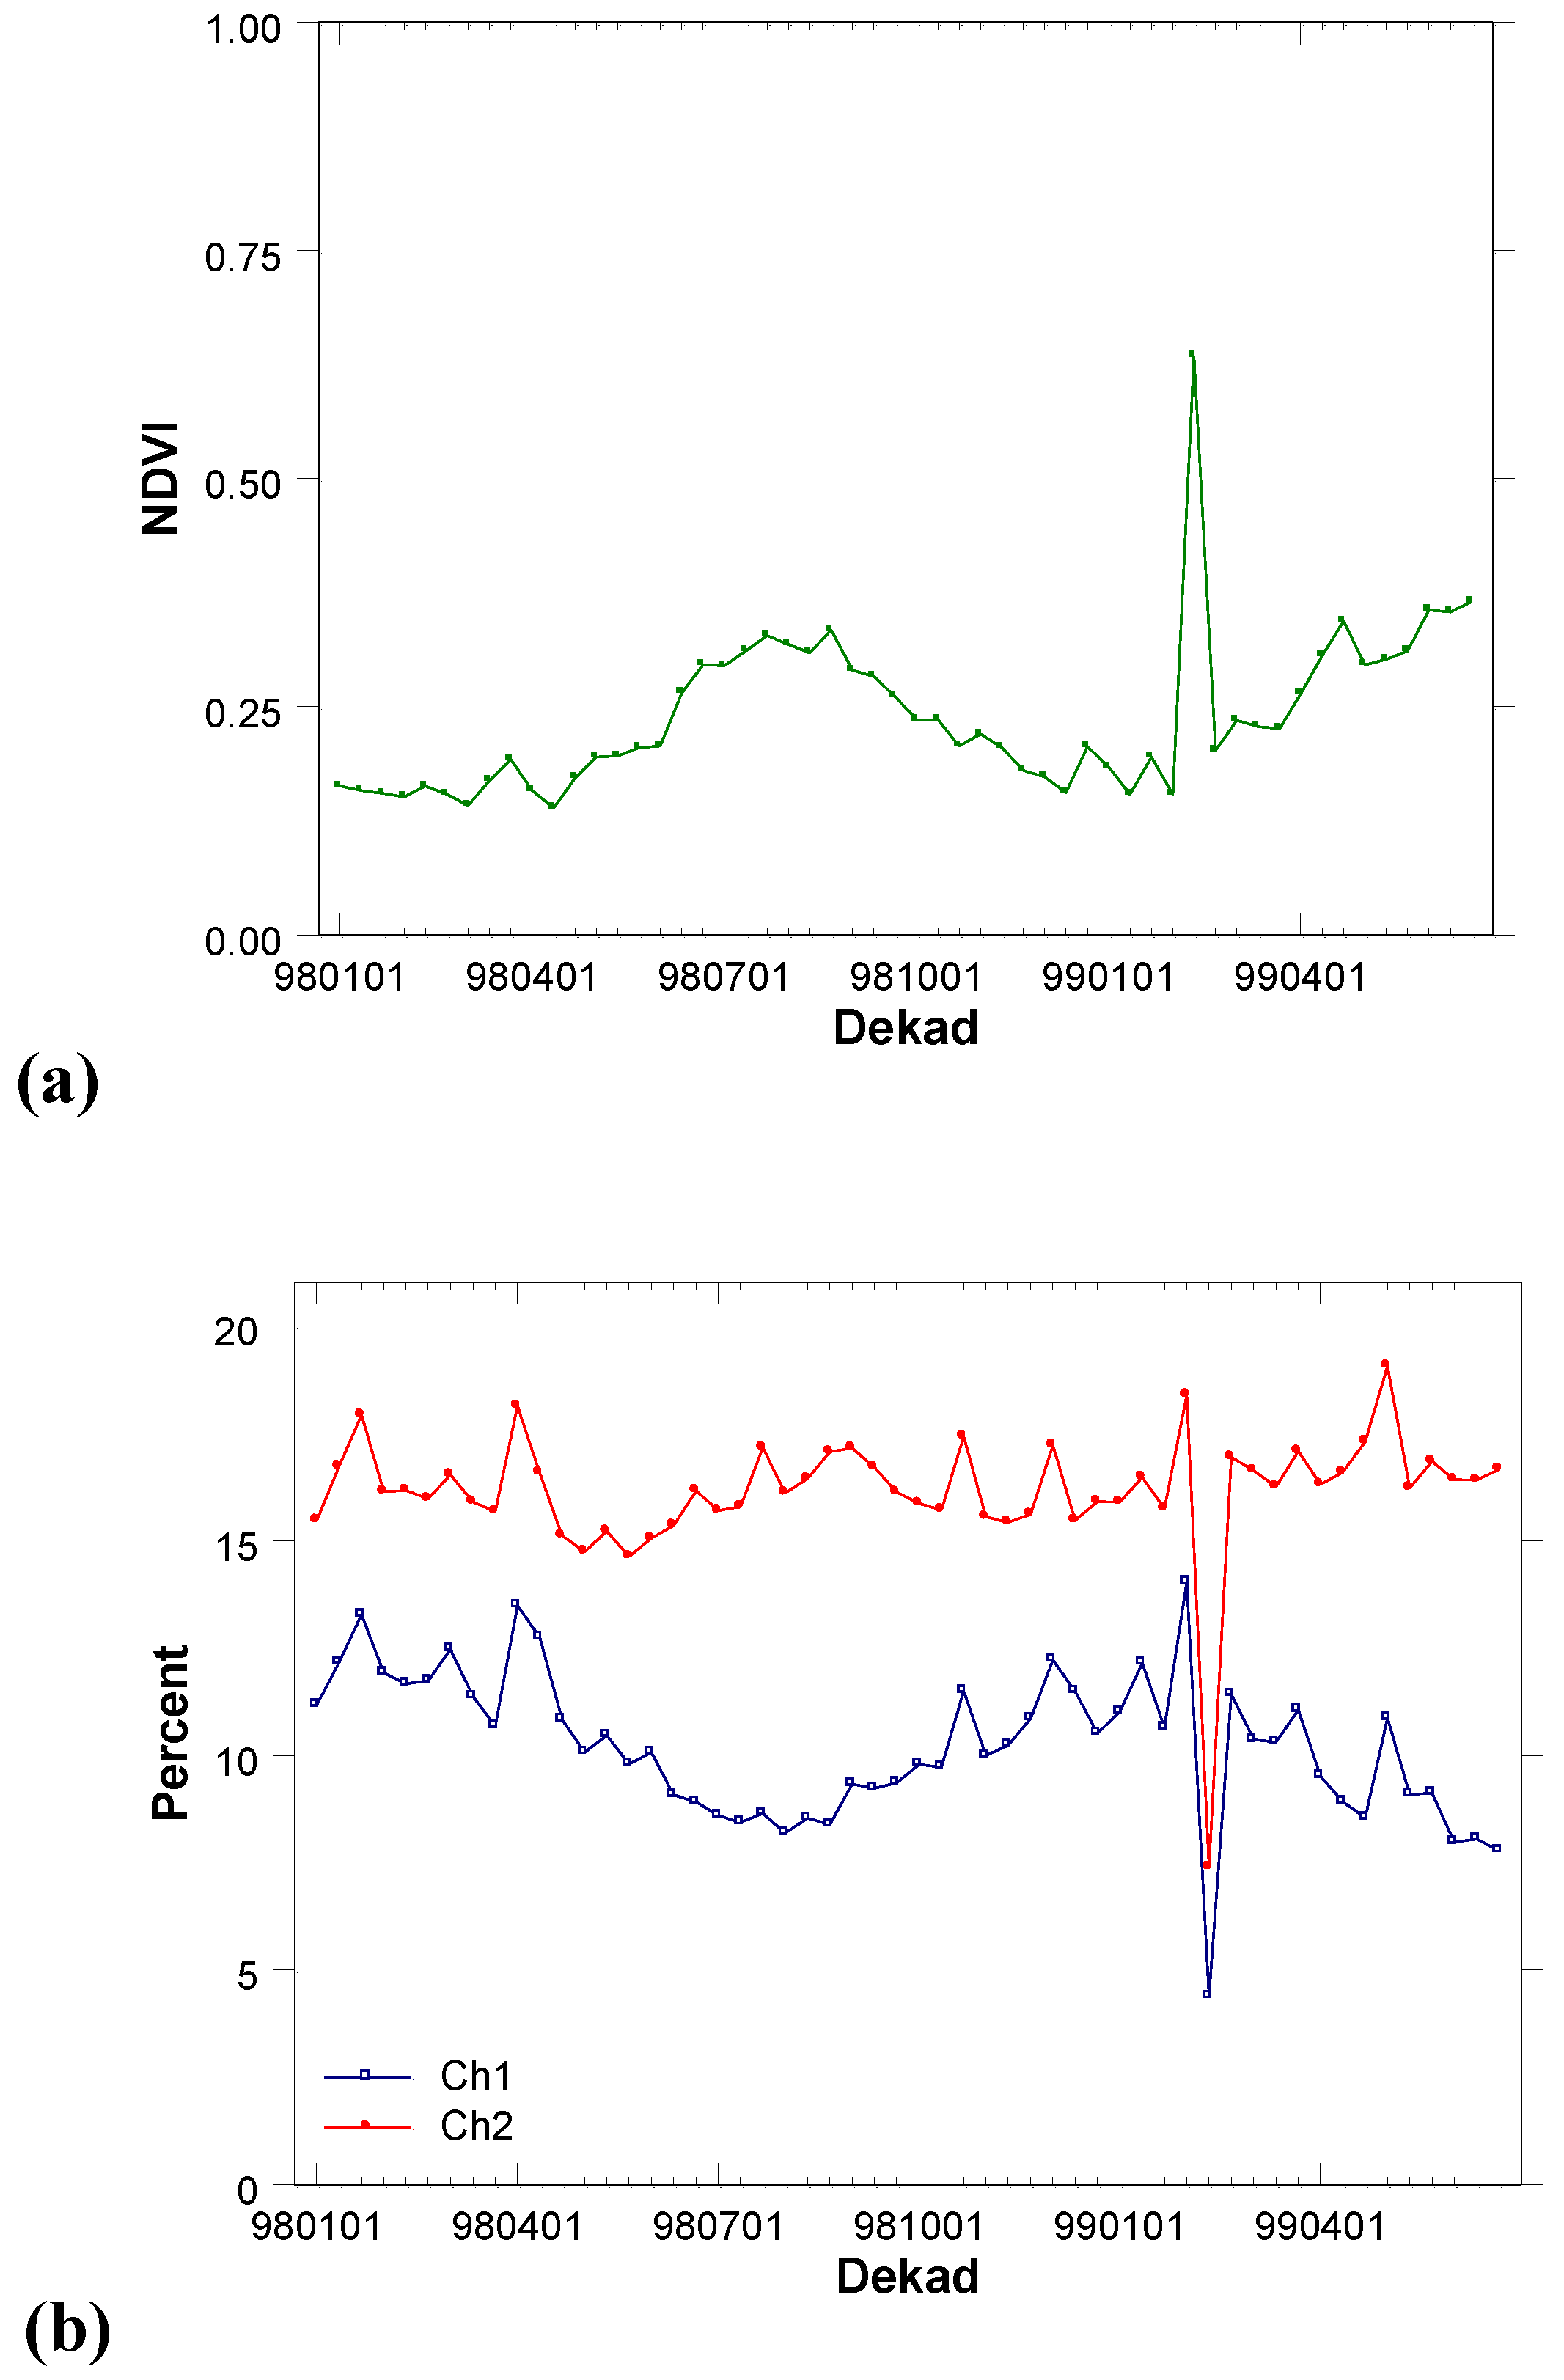
In February 1999, the second 10-day composite, a composite of data collected between February 11 and February 20, 1999, of Pathfinder NDVI values for a large number of cells belonging to the Western Australia region were unreasonably high, with the NDVI equal to 1. The usual expected NDVI would not be greater than 0.3 for most cells of the data set.
Figure 1(a) is a time series of Pathfinder NDVI average over the area in Western Australia with longitude range [110°E, 120°E] and latitude [20°S, 30°S]. Accordingly, the time series of Channel 1 and Channel 2 averages over the same area shows that there was unusually very low reflectance from the area during the same period (
Figure 1(b)). What happened?
Figure 1.
The Pathfinder 10-day composites averaged over the area with longitude range [110°E, 120°E] and latitude [20°S, 30°S] from January 1998 to June 1999. (a) NDVI, (b) AVHRR Channel 1 and Channel 2 reflectance in percent.
Figure 1.
The Pathfinder 10-day composites averaged over the area with longitude range [110°E, 120°E] and latitude [20°S, 30°S] from January 1998 to June 1999. (a) NDVI, (b) AVHRR Channel 1 and Channel 2 reflectance in percent.
3. Results and Discussion
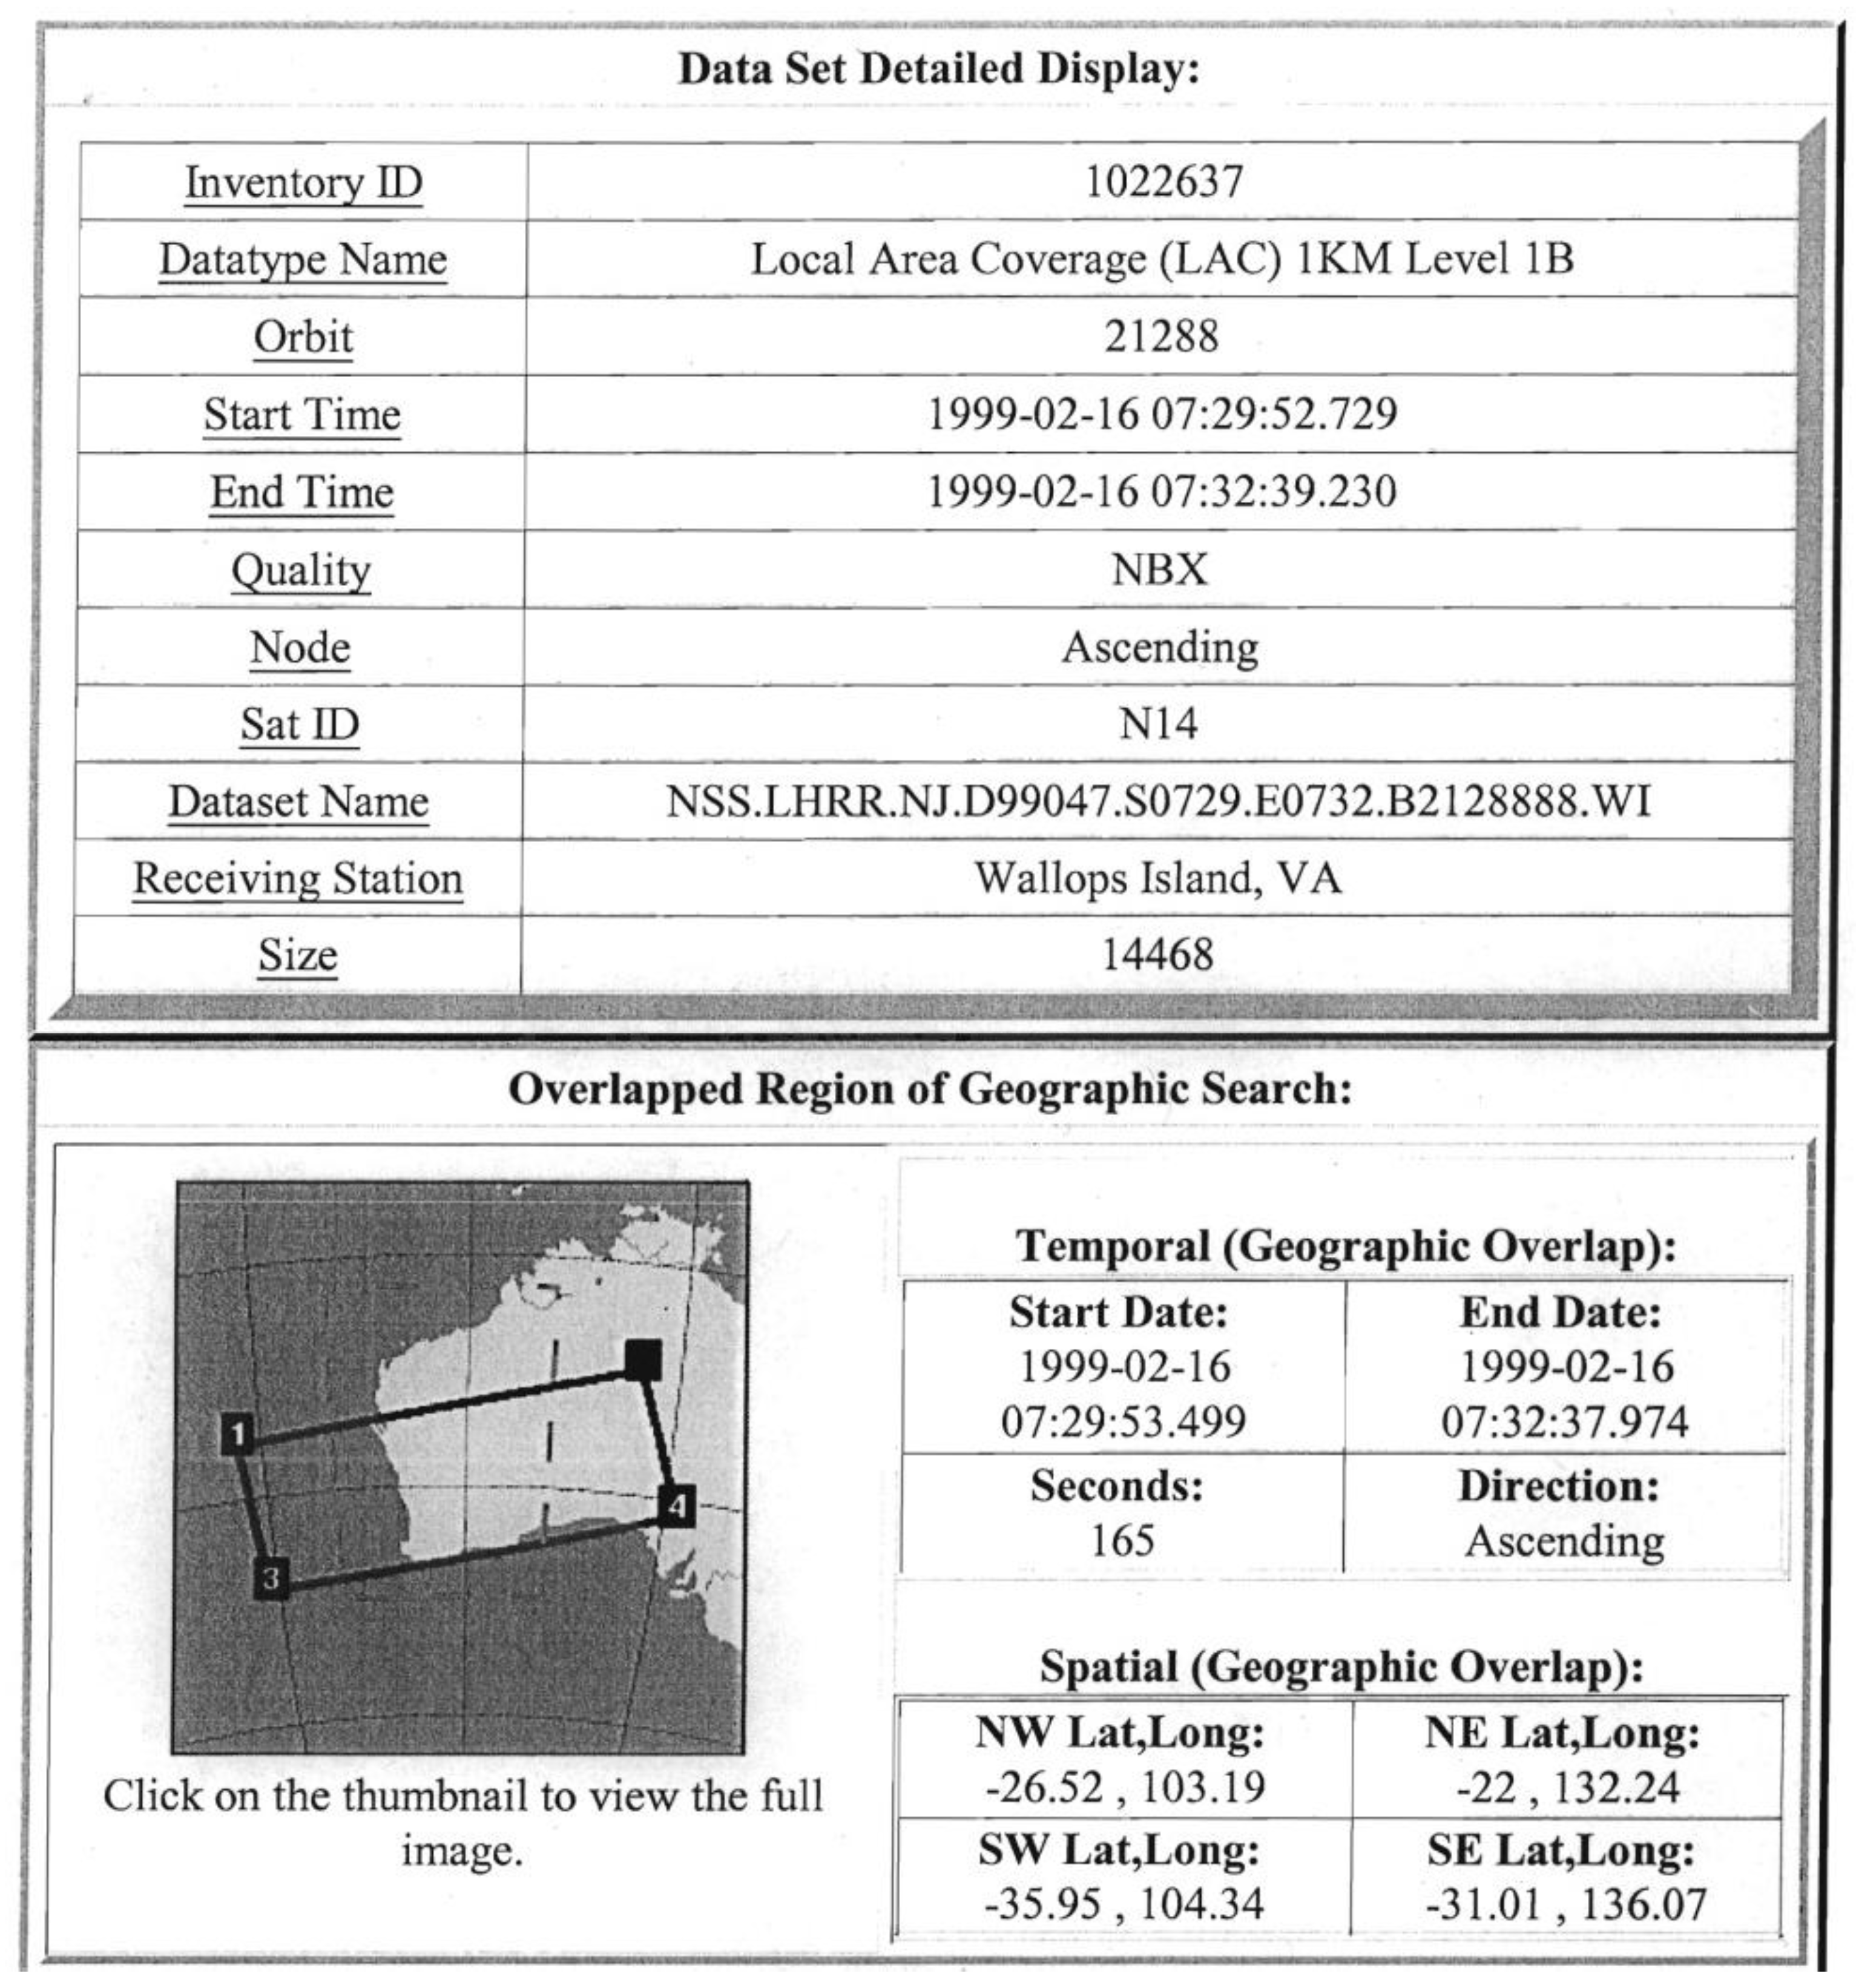
On February 16, 1999 between 07:27:20 UTC and 07:35:48 UTC, NOAA 14 was in ascending node covering a geographic region in Western Australia with four corners [NW, SW, SE, NE] = [(15.66°S, 101.48°E), (44.7°S, 105.05°E), (39.17°S, 140.61°E), (11.43°S, 128.72°E)] [
12]. Therefore, during that time period, the Western Australia region was in the above quadrilateral, and consequently under NOAA 14’s coverage. AVHRR Channel 1 has instantaneous field-of-view (IFOV) 1.39 milliradian and Channel 2 has 1.41. This allows the Channel 1 and Channel 2 detectors to have a ground resolution of approximately 1.17 km at the NOAA satellite nadir from its nominal orbit altitude of 833 km.
Appendix B presents a copy of a foot print data of NOAA 14 from 07:29:53 to 07:32:38 UTC on February 16, 1999, and
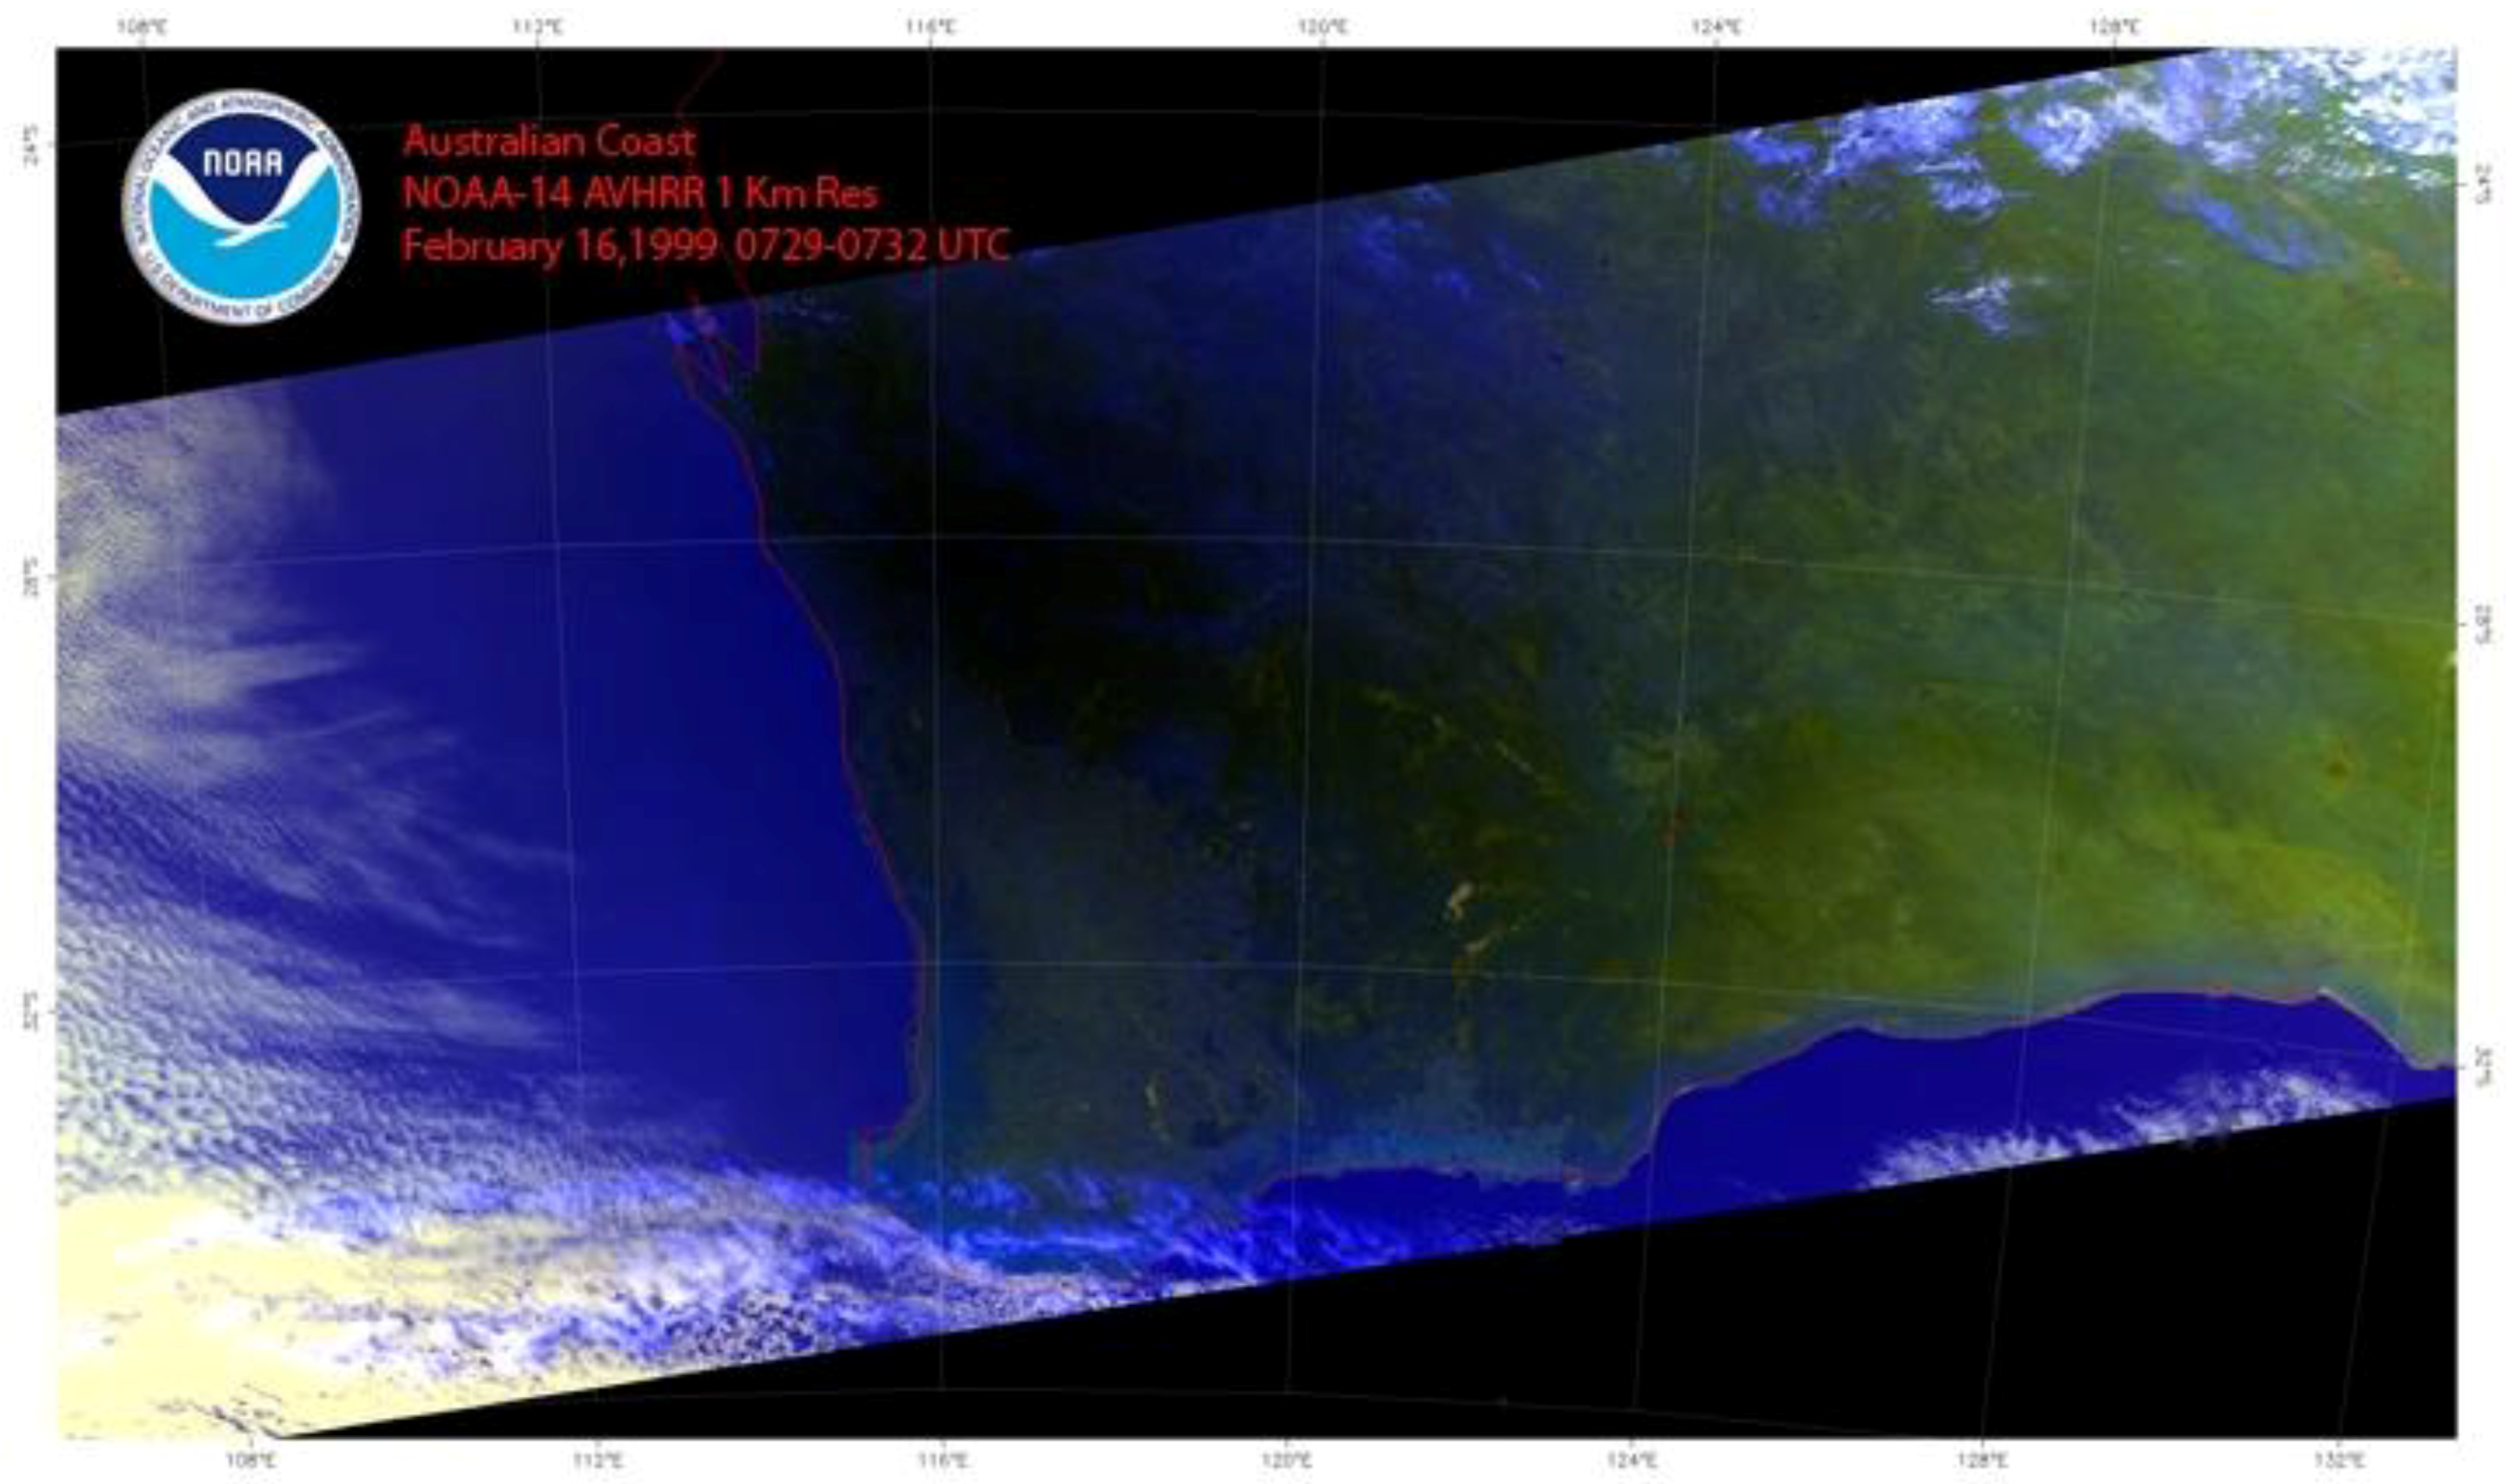
Appendix C presents the time stamped image data from NOAA 14 passing over the West Australian Coast from 07:29 to 07:32 UTC on February 16, 1999.
Table 1.
The center, northern and southern limits of the solar eclipse path between 07:25 UT and 07:40 UT on February 16, 1999.
Table 1.
The center, northern and southern limits of the solar eclipse path between 07:25 UT and 07:40 UT on February 16, 1999.
| UT | Northern Limit | Southern Limit | Center Line |
|---|
| Latitude (°S) | Longitude (°E) | Latitude (°S) | Longitude (°E) | Latitude (°S) | Longitude (°E) |
|---|
| 07:25 | 29.650 | 113.383 | 29.892 | 113.690 | 29.770 | 113.537 |
| 07:30 | 28.475 | 115.483 | 28.725 | 115.822 | 28.600 | 115.652 |
| 07:35 | 27.252 | 117.703 | 27.508 | 118.078 | 27.378 | 117.890 |
| 07:40 | 25.967 | 120.085 | 26.233 | 120.505 | 26.100 | 120.293 |
On the same day, the first solar eclipse of 1999, which was an annular eclipse, began about 1,000 km south of South Africa at 04:57 UTC and headed eastward slightly toward the north. The path of annularity crossed into Western Australia about 300 km north of Perth at 07:28 UTC with the path width 42 km and the duration of annularity 48 seconds [
13].
Table 1 shows the center, northern and southern limits of the eclipse path between 07:25 UTC and 07:40 UTC.
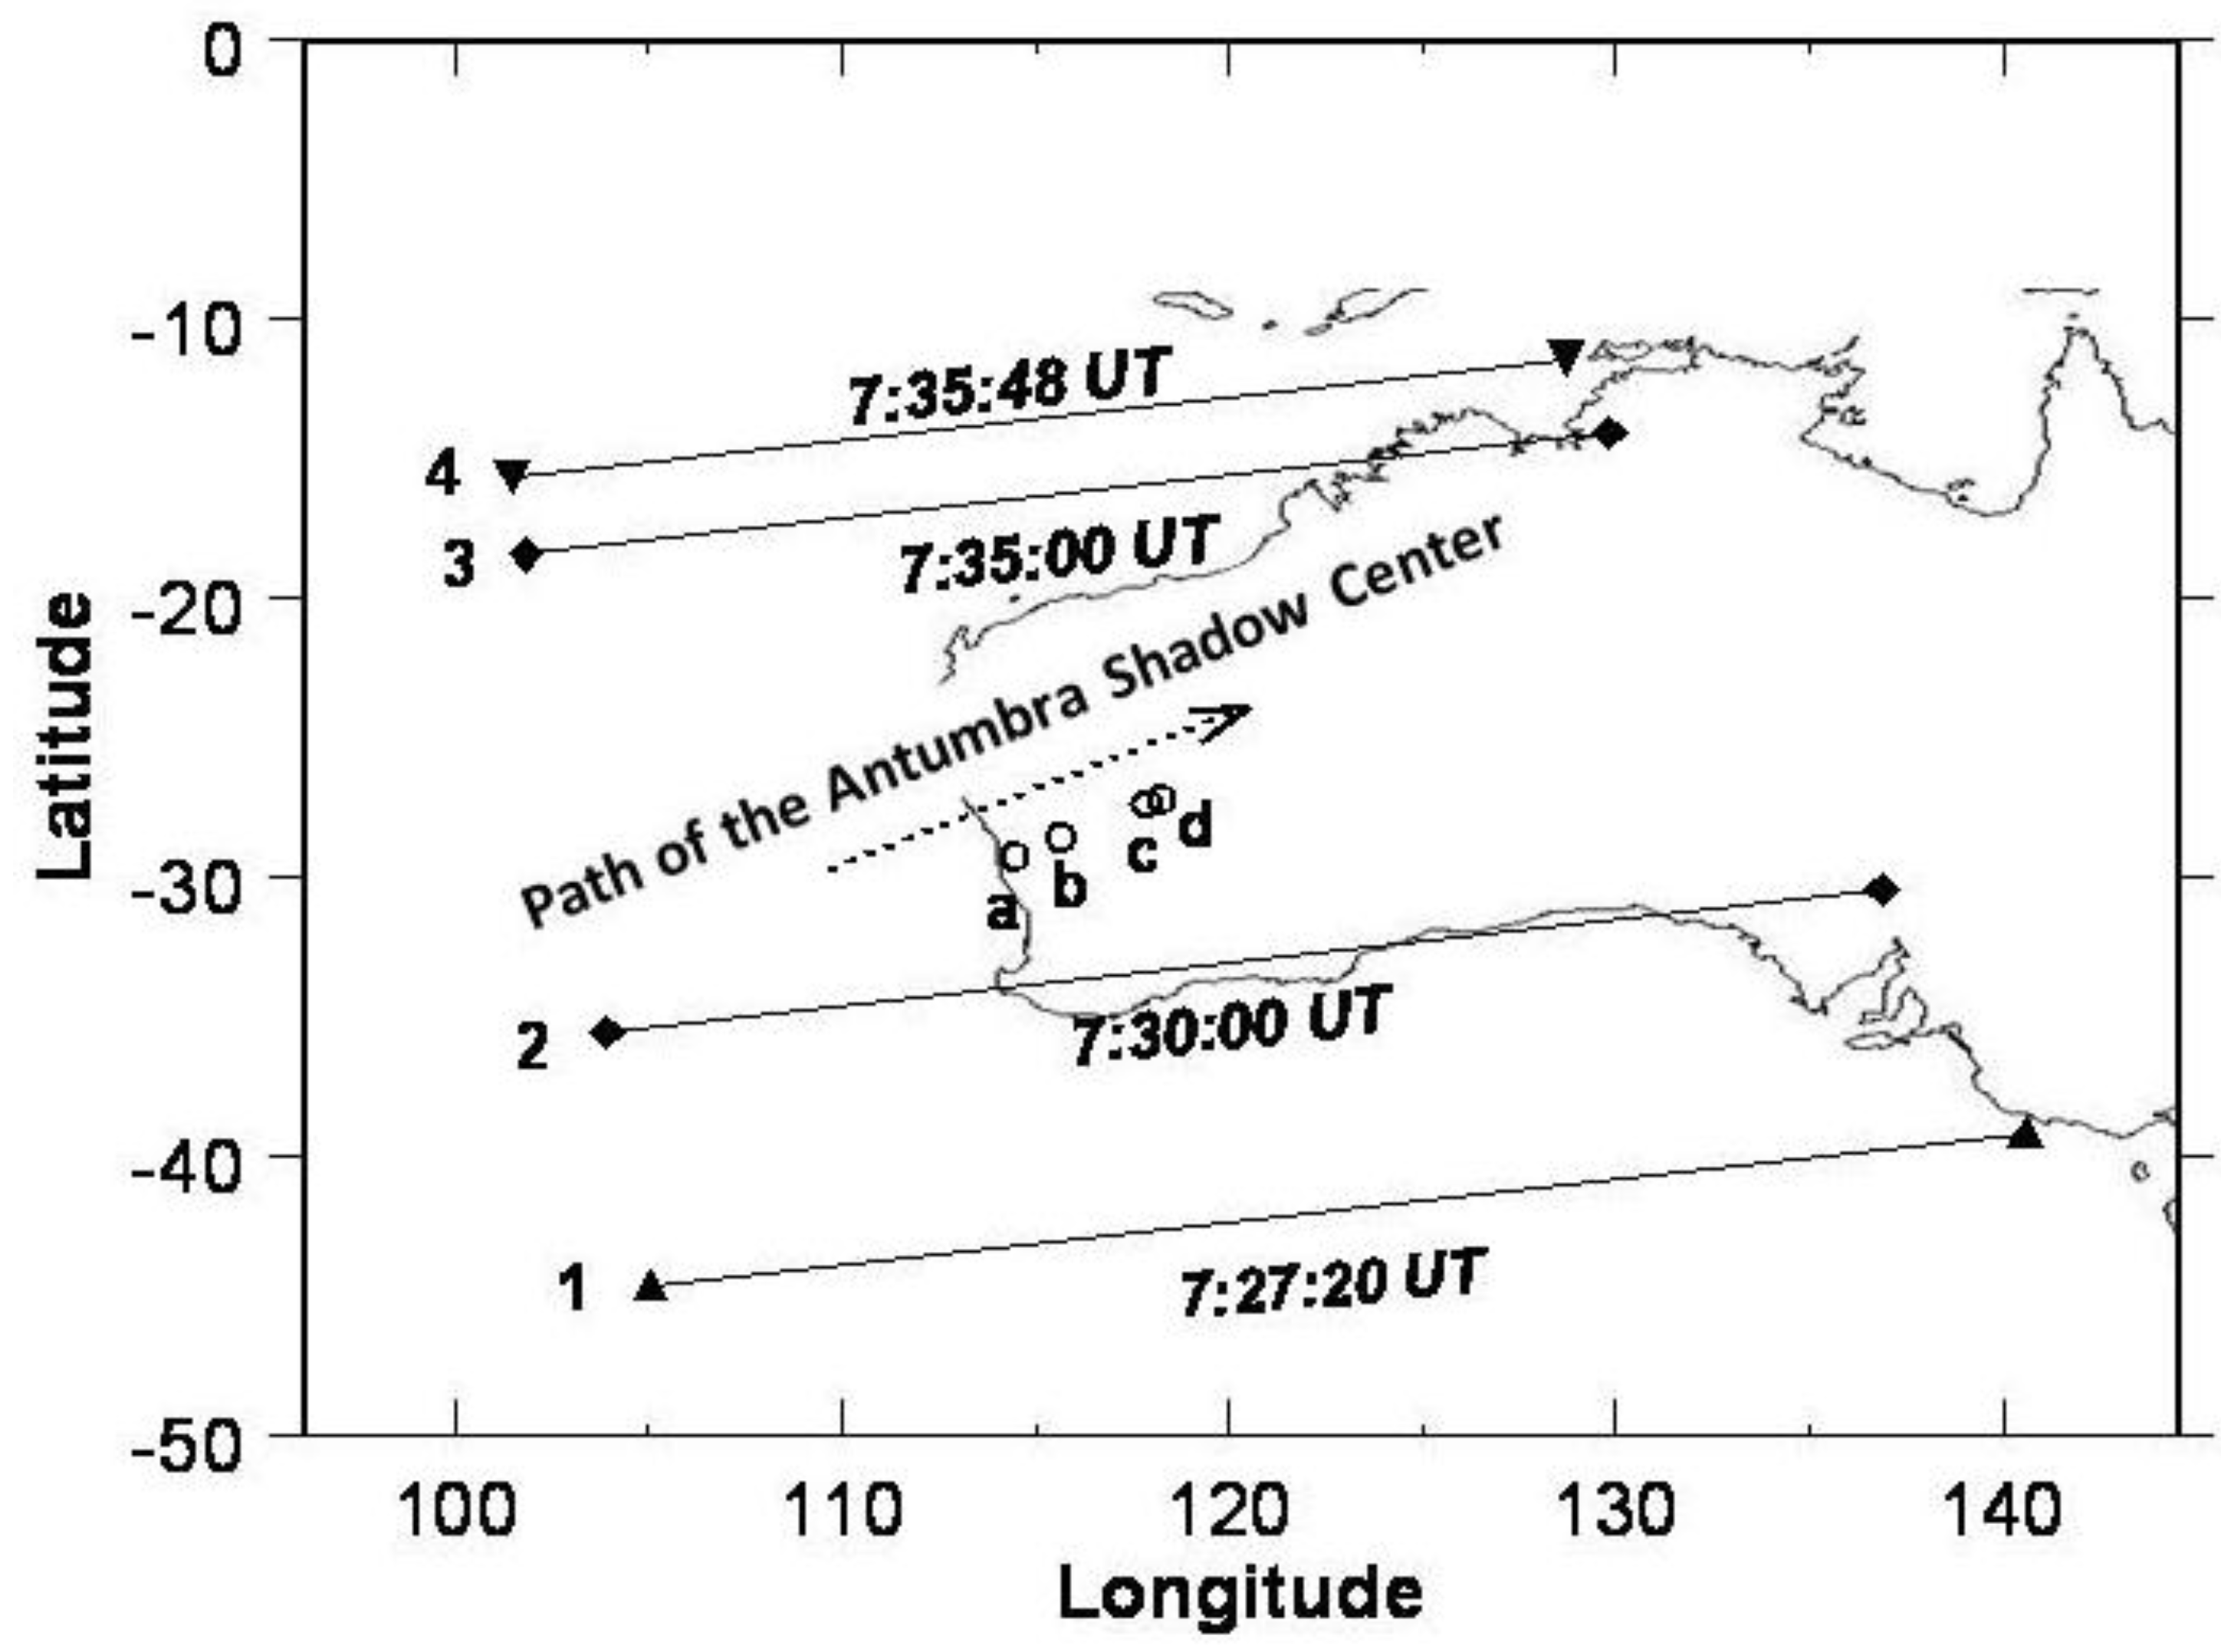
Figure 2 juxtaposes the foot print of NOAA 14 and the eclipse shadow passage over the coastline of Western Australia. The line segment denoted ‘1’ in
Figure 2 presents the instantaneous south boundary of the swath of the Channel 1 and Channel 2 detectors onboard NOAA 14 at 07:27:20 UTC; and ‘4’ the instantaneous north boundary of the swath at 07:35:48 UTC. The line segments denoted ‘2’ and ‘3’ are the approximate locations of the ground resolution cells at the given times. In
Figure 2 the circles denoted with the letters ‘a’ to ‘d’ present the center locations of the eclipse antumbral shadow path at the matching time, that is, ‘a’ at 07:27:20 UTC, ‘b’ 07:30:00 UTC, ‘c’ 07:35:00 UTC and ‘d’ 07:35:48 UTC.
The eclipse path was in the path of NOAA 14 when it was above Western Australia on February 16, 1999. AVHRR is a passive sensor, and the natural source of reflectance, sun light, for the sensor was not available throughout the eclipse antumbral shadow path on that day. Due to the eclipse, the lack of illumination resulted in a radiance for Channel 1 and 2 that was unusually low; and in many cells Channel 1 (visible spectrum) reflectance was “0”, which caused NDVI to become “1” regardless of what the Channel 2 values were.
Table 2 shows a number of cell values of the PAL NDVI 10-day composites for February 1999. Seeing NDVI = 1 in some cells, one might conclude that the high NDVI values were caused by high values of Channel 2 and low Channel 1, since NDVI = (
R2 − R1)/(R1 + R2), where
R1 is Channel 1 reflectance and
R2 is Channel 2 reflectance. However, those cells with abnormally high NDVI values during the second 10-day composite period had much lower Channel 2 reflectance than the ones in the other two adjacent composites.
Figure 2.
Instantaneous boundaries (1: south, 4: north) and approximate locations of ground resolution cells (2, 3) for the swath of ascending NOAA 14 at each time in UT; and path of the eclipse antumbra center in the same time order (a: 07:27:20, b: 07:30:00, c: 07:35:00 and d: 07:35:48) on February 16, 1999.
Table 2.
A small subset extracted from the original 10-day composites of PAL NDVI, Channel 1 and Channel 2 for February 1999 (19990201: from 1 February to 10, 19990211: 11 to 20 and 19990221: 21 to 28): Shaded values present abnormally high NDVI and corresponding Channel 1 and Channel 2 values.
Table 2.
A small subset extracted from the original 10-day composites of PAL NDVI, Channel 1 and Channel 2 for February 1999 (19990201: from 1 February to 10, 19990211: 11 to 20 and 19990221: 21 to 28): Shaded values present abnormally high NDVI and corresponding Channel 1 and Channel 2 values.
| Longitude | Latitude | 19990201 | 19990211 | 19990221 |
|---|
| NDVI | Ch1 | Ch2 | NDVI | Ch1 | Ch2 | NDVI | Ch1 | Ch2 |
|---|
| 114.54 | −25.86 | 0.168 | 16.588 | 23.604 | 1 | 0.000 | 0.528 | 0.184 | 11.854 | 17.246 |
| 114.62 | −25.86 | 0.192 | 15.134 | 22.332 | 1 | 0.000 | 0.956 | 0.168 | 13.052 | 18.574 |
| 114.7 | −25.86 | 0.168 | 18.098 | 25.700 | 1 | 0.000 | 1.174 | 0.152 | 12.626 | 17.314 |
| 114.78 | −25.86 | 0.176 | 18.148 | 26.012 | 1 | 0.000 | 1.174 | 0.144 | 11.892 | 16.030 |
| 114.86 | −25.86 | 0.144 | 8.974 | 12.136 | 1 | 0.000 | 1.176 | 0.176 | 8.704 | 12.594 |
| 114.94 | −25.86 | 0.192 | 15.482 | 23.172 | 0.232 | 7.656 | 12.432 | 0.144 | 11.142 | 14.990 |
| 113.01 | −25.93 | 0.136 | 16.204 | 21.306 | 0.160 | 10.288 | 14.362 | 0.200 | 8.594 | 12.946 |
| 113.09 | −25.93 | 0.152 | 16.000 | 21.756 | 1 | 0.000 | 0.916 | 0.128 | 10.644 | 13.834 |
| 113.17 | −25.93 | −0.064 | 37.912 | 33.708 | 1 | 0.000 | 0.488 | −0.064 | 16.880 | 14.874 |
| 113.25 | −25.93 | −1.016 | −0.018 | −0.018 | −1.016 | −0.018 | −0.018 | −1.016 | −0.018 | −0.018 |
| 113.33 | −25.93 | −1.016 | −0.018 | −0.018 | −1.016 | −0.018 | −0.018 | −1.016 | −0.018 | −0.018 |
| 113.41 | −25.93 | −1.016 | −0.018 | −0.018 | −1.016 | −0.018 | −0.018 | −1.016 | −0.018 | −0.018 |
| 113.49 | −25.93 | 0.104 | 17.110 | 21.344 | 1 | 0.000 | 1.352 | 0.224 | 9.956 | 15.704 |
| 113.57 | −25.93 | 0.160 | 13.154 | 18.424 | 1 | 0.000 | 0.712 | 0.176 | 12.054 | 17.488 |
The abnormally high NDVI values obtained on February 16, 1999, became the official NDVI 10-day composite values, partially due to a failure of strictly following the ‘updating rule’ for NDVI composite. Updating of the composites was to be performed cell by cell. The difference of Channel 2 and Channel 1 values for the new data was computed, and compared to the basic composite array. If the new difference was greater, then the NDVI value for the new data point was computed and replaced the previous NDVI [
10]. In the case of the second 10-day composite in February 1999, probably not (
R2 − R1), where
R1 is Channel 1 reflectance and
R2 is Channel 2 reflectance, was compared but the NDVI itself, (
R2 − R1)/(R1 + R2), was compared to select greater NDVI for a cell and caused such abnormality in the values. The abnormality of the NDVI 10-day composite from February 11 to 20 is more clearly shown in
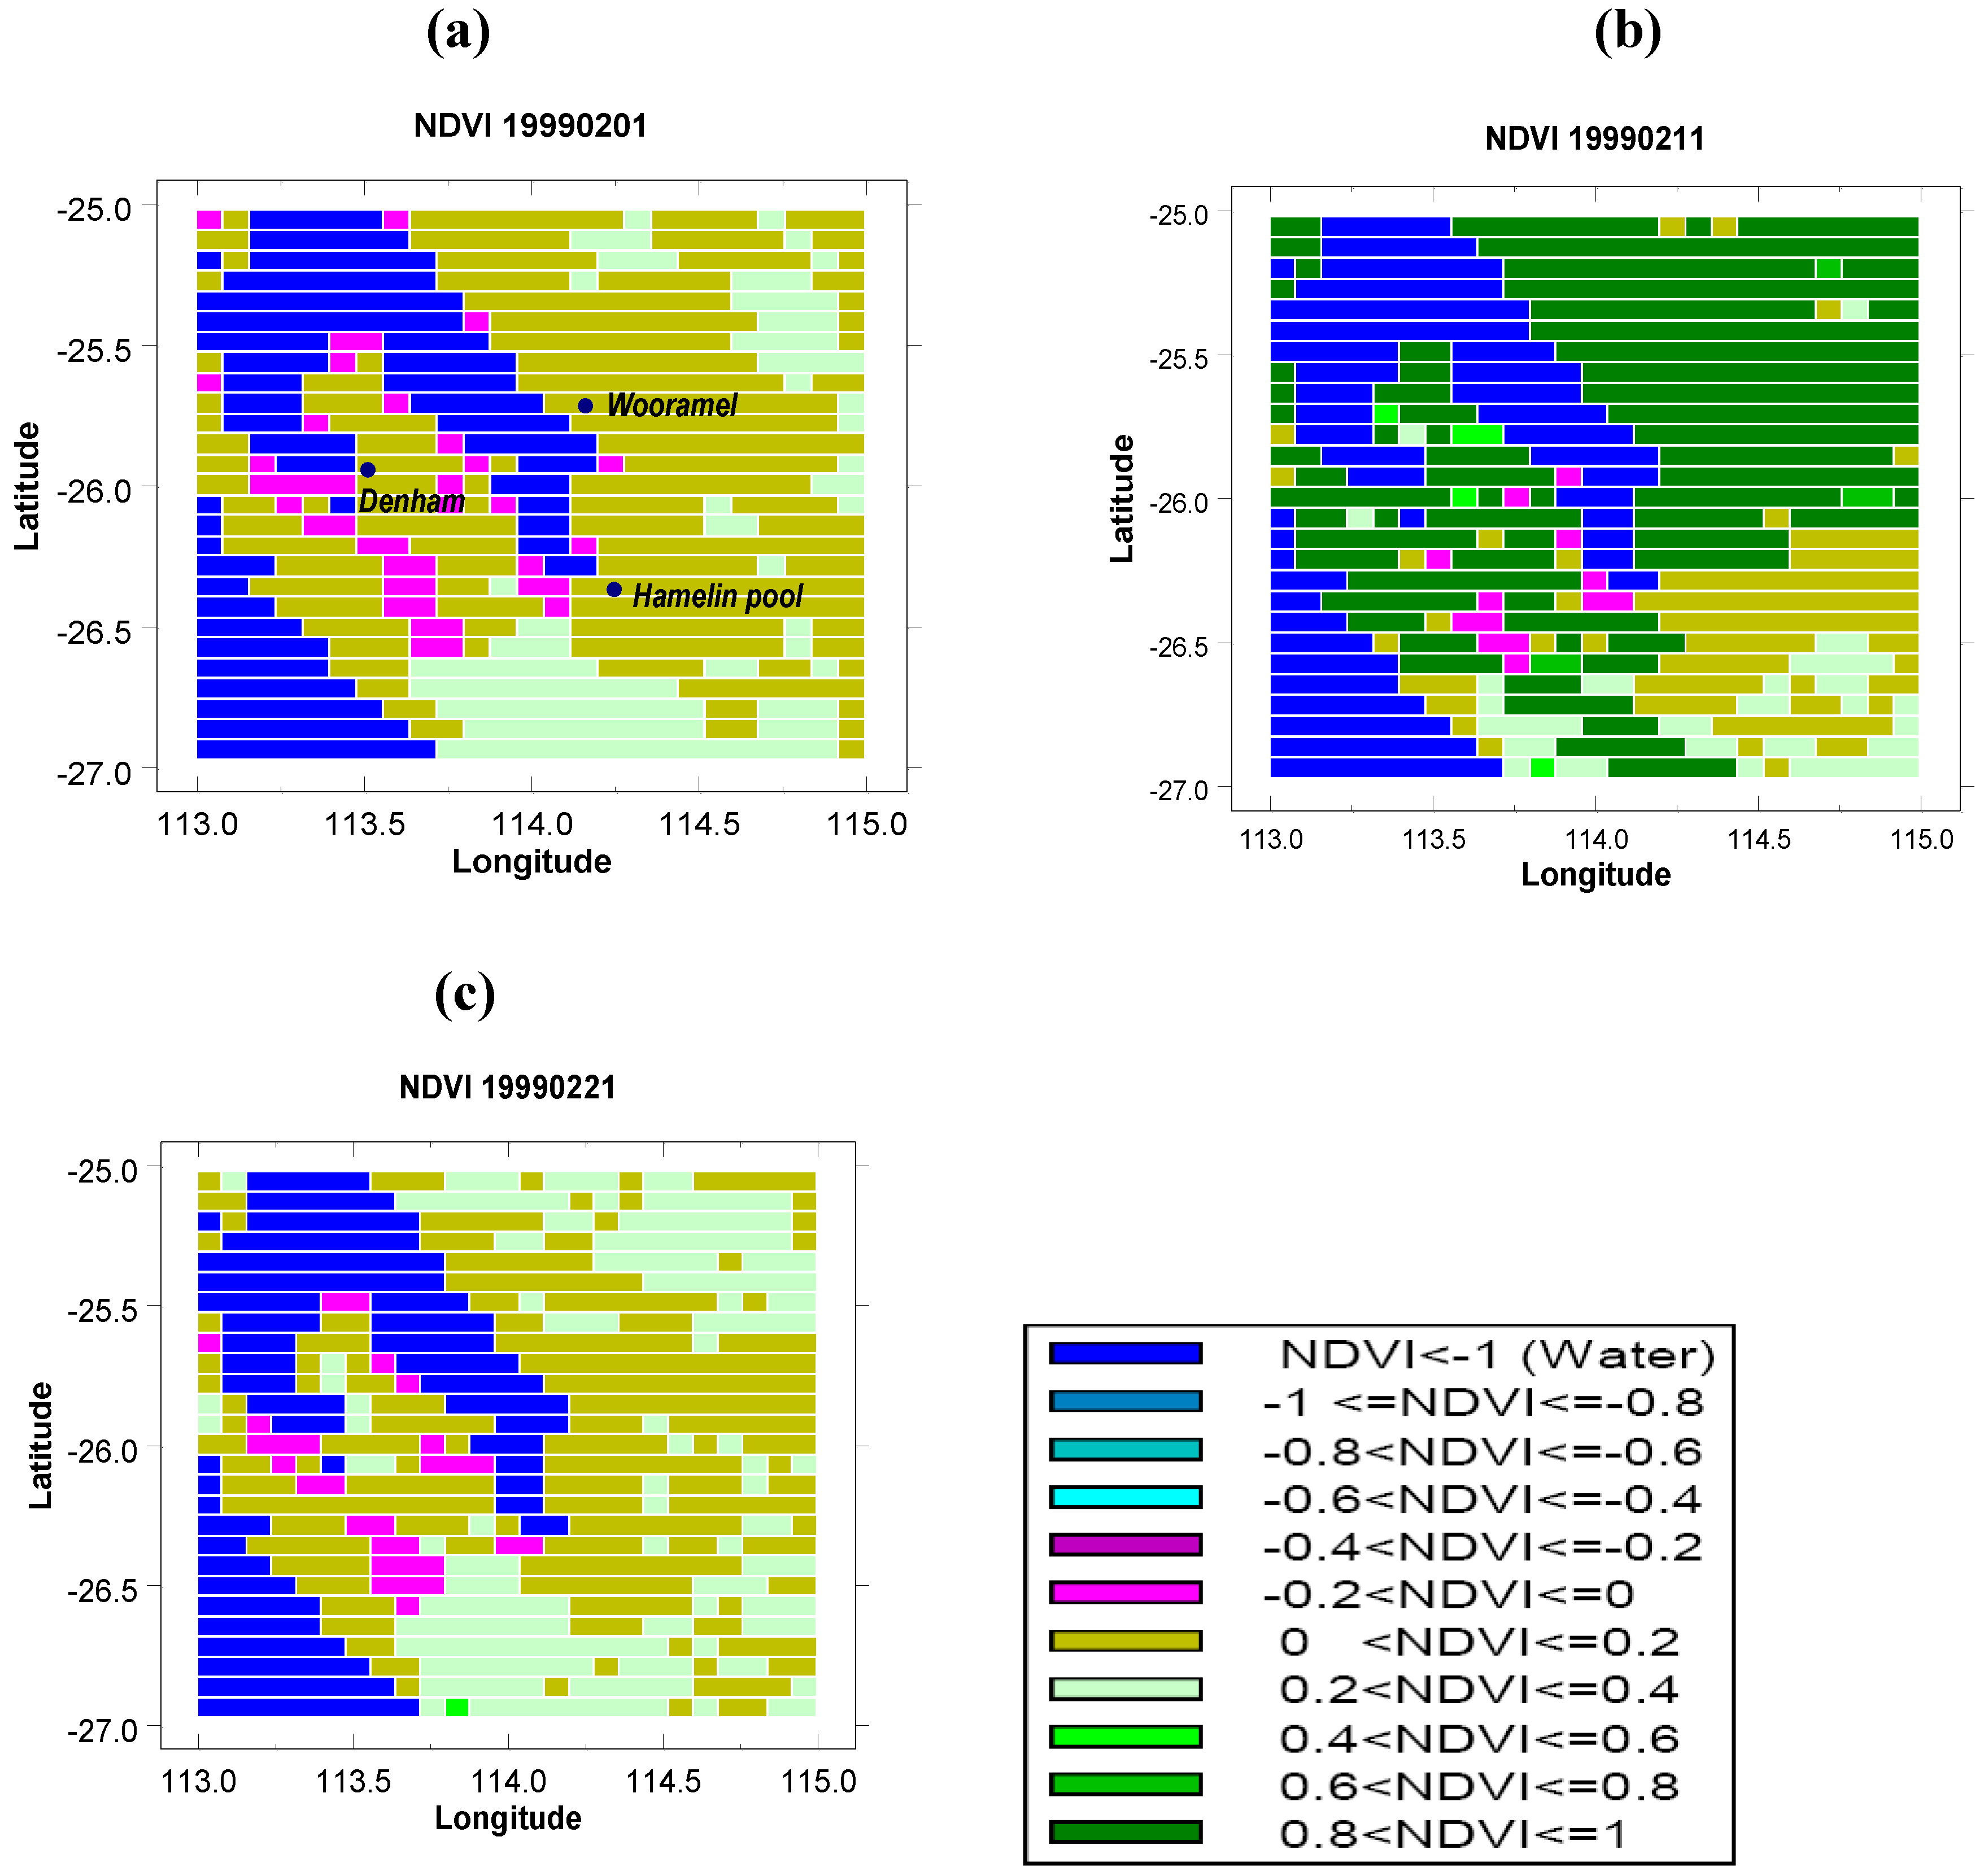
Figure 3 for a small portion of the affected area close to Shark Bay in Western Australia.
Figure 3b is the surface greenness plotted according to the NDVI second 10-day composite in February 1999, which shows an abrupt increase of the greenness from the previous 10-day composite, (a), then an abrupt decrease to the following, (c).
Figure 3.
Pathfinder NDVI in 8 km × 8 km resolution (approximately 0.8° Lon × 0.723° Lat) for the first, (a), second, (b) and last, (c) 10-day composites of February in 1999. The quadrilateral covers longitude range [113°E, 115°E] and latitude [25°S, 27°S]. The city locations shown in the plot (a) are approximate.
During the eclipse there were some cells of which reflectance in Channel 1 and Channel 2 were close to normal such as the cells with bolded, italicized text in
Table 2. It is not clear why those cells were not affected by the eclipse. However, possible explanations might be that those cells were somewhat far off eclipse’s antumbra at the moment when the sensor was directing to them, and some sun light was allowed, or the pixels were selected from other overpasses that were not under the eclipse condition.
The fact that the PAL NDVI became abnormally high for the 10-day composite from February 11 to 20 in 1999 for Western Australia was due to (1) the solar eclipse occurrence in the satellite path and (2) the NDVI composite updating rule, and (3) possible lack of quality control during the NDVI composite generation. The actual Channel 1 and Channel 2 data values for the composite from February 11 to 20 were not proper data sources for NDVI composite computation for the period. The abnormal data values could have been avoided by simply not using the data obtained during the eclipse in the generation of the composite.
More careful examination of the observed values of the AVHRR channels 1 and 2 during the second 10-day composite period in February 1999 is desired, perhaps with data in a higher spatial and temporal resolution to have a better understanding of eclipse impacts on remotely sensed data. In addition, further investigation on those ground cells not affected by the eclipse is suggested for it can provide valuable insights on how to efficiently screen out irregular data values obtained under an unusual condition such as an eclipse. It will be then possible to explore a range of quality control tests to see which are capable of eliminating the eclipse-affected values to avoid a production of incorrect data.


