


An Integrated Multi-Factor Coupling Approach for Marine Dynamic Disaster Assessment in China’s Coastal Waters
by
Lin Zhou
1,
Meng Sun
1,2,3,*,
Yueming Liu
4,
Yongzeng Yang
1,2,3,
Tianyun Su
1,2,5 and
Zhen Jia
1,5 1
First Institute of Oceanography, Ministry of Natural Resources, Qingdao 266061, China
2
Laboratory for Regional Oceanography and Numerical Modeling, Pilot National Laboratory for Marine Science and Technology, Qingdao 266071, China
3
Key Laboratory of Marine Science and Numerical Modeling (MASNUM), Ministry of Natural Resources, Qingdao 266061, China
4
State Key Laboratory of Resources and Environmental Information System, Institute of Geographical Sciences and Natural Resources Research, Chinese Academy of Sciences, Beijing 100101, China
5
National Engineering Laboratory for Integrated Aero-Space-Ground-Ocean Big Data Application Technology, Qingdao 266061, China
*
Author to whom correspondence should be addressed.
Remote Sens. 2023, 15(3), 838; https://doi.org/10.3390/rs15030838
Submission received: 4 December 2022
/
Revised: 22 January 2023
/
Accepted: 26 January 2023
/
Published: 2 February 2023
(This article belongs to the Special Issue Remote Sensing of Coastal Waters, Land Use/Cover, Lakes, Rivers and Watersheds II)
Abstract
:Marine dynamic disasters, such as storm surges and huge waves, can cause large economic and human losses. The assessment of marine dynamic disasters is, thus, important, but improvements to its reliability are needed. The current study improved and integrated the assessment from the perspective of multi-factor coupling. Using a weighted index system, a marine dynamic disaster assessment indicator system suitable for China’s coastal waters was established, and a method for calculating the weight of disaster indicators was proposed from the perspective of rapid assessment. To reduce the assessment deviation in coastal waters, a multi-factor coupling algorithm was proposed. This algorithm obtained amplitude variations of wave orbital motion in horizontal and vertical directions, which was used to evaluate the influence of background current and terrain slope on coastal ocean waves. Landsat 8 remote sensing images were used to carry out an object-oriented extraction of raft and cage aquaculture areas in China’s coastal waters. The aquaculture density was then used as the main basis for a vulnerability assessment. Finally, the whole assessment system was integrated and verified during a typical storm surge process in coastal waters around the Shandong Peninsula in China. The coupled variations were also added to the assessment process and increased the risk value by an average of 12% in the High Sea States of the case study.
1. Introduction
Marine disasters are caused by both natural and human factors. Storm surges, huge waves, sea ice, and tsunamis, which are classified as marine dynamic disasters, are mainly caused by the violent movement of ocean water and are characterized by a broad geographic influence and high disaster intensity [1]. Marine dynamic disasters are the main types of oceanic disasters and are also important research objects in the field of physical oceanography.
Storm surges and huge waves are among the most serious types of marine dynamic disasters, owing to their high frequency and the large economic losses and losses of human lives [2]. Storm surges refer to the abnormal rise of sea levels caused by the action of strong winds such as typhoons and extratropical cyclones that are related to severe atmospheric disturbances [3]. They are marine disasters that can destroy coastal dams and their ancillary facilities, eventually causing flooding and substantial losses in coastal and inland areas [4]. Huge waves refer to wave heights of 6 m or more, and they are caused by the violent fluctuation of the sea surface. Huge waves have a substantial effect on coastal dams, coastal engineering, and marine navigation.
In recent years, climate change has further intensified the frequency and destructive power of marine dynamic disasters, and they have become more unexpected, abnormal, and unpredictable [5]. To strengthen the early warning and risk assessment of marine dynamic disasters, researchers have carried out in-depth research on two main aspects: the dynamic mechanism and the comprehensive assessment capacity.
1.1. Research on the Dynamic Mechanism of Marine Dynamic Disasters
For many years, the mechanism, change regularity, and distribution characteristics of marine dynamic disasters have been the main research topics of physical oceanography for scholars from all over the world trying to draw deterministic conclusions from the perspective of the dynamic mechanism [6]. Initially, studies focused on ocean observation and theoretical research. In the middle of the twentieth century, with the development of information technology, ocean numerical models began to be created, attempting numerical simulation and prediction. With the rapid improvement of global computing power and parallel computing technology, marine numerical models then entered a period of rapid development. By the end of the twentieth century, a series of marine numerical models had been created, such as the HYbrid Coordinate Ocean Model (HYCOM) [7], Nucleus for European Modelling of the Ocean (NEMO) [8], Modular Ocean Model (MOM) [9], Regional Ocean Modeling System (ROMS) [10], Princeton Ocean Model (POM) [11], and the unstructured grid Finite Volume Community Ocean Model (FVCOM) [12]. Each of these ocean models has its own characteristics and can be applied to different areas (such as oceans, bays, and estuaries).
For storm surge research and forecasting, Heaps [13] began the early calculation of two-dimensional storm surges, and then numerical models such as POM began to focus on the research and development of three-dimensional hydrodynamics by using the σ coordinate as the vertical coordinate [14]. The storm surge numerical models gradually changed into multi-dimensional unstructured grids. As an unstructured grid model, FVCOM has developed rapidly [15] and gives better simulation results in the nearshore environment than some other models [16]. It is widely used in the operational forecasting system in China.
For ocean wave research and forecasting, two generations of numerical models have been successively developed through the contributions of Pierson [17], Mitsuyasu [18], and others. The Wave Model Development and Implementation (WAMDI) group proposed the third-generation wave model, WAve Model (WAM) [19]. Subsequently, ocean wave models such as WAVEWATCH [20], Simulating Waves Nearshore (SWAN), and Marine Science and Numerical Modeling (MASNUM) [21] have been developed and widely used.
With the rapid development of numerical models of storm surges and ocean waves, researchers have recognized that storm surges and huge waves are not two independent disaster-causing factors. Ignoring the interaction between the two factors leads to inaccuracies in both the simulation and the assessment. Therefore, the interaction process between storm surges and ocean waves has become a research focus. Longuet-Higgins [22] proposed the basic theory of wave–current interaction as early as 1962. Since then, Signell [23] and Janssen [24] have successively added calculation methods for factors such as bottom stress and wind stress to measure the relationship between storm surges and ocean waves. After Wolf [25] formally proposed the corresponding numerical research method for the interaction between storm surges and ocean waves, Mastenbroek [26] and Zhang [27] used this theory to conduct experiments confirming that the ocean waves can affect the tide level of storm surges through wind stress. Xie [28] comprehensively considered factors such as bottom stress and wind stress to conduct a more detailed study.
Studies on the interaction process between storm surges and ocean waves are, however, still lacking. The current research is biased towards the effect of ocean waves on storm surges because the enhancement process of ocean waves on storm surges is relatively intuitive and easy to accept. However, the reverse process, which is the enhancement of storm surges on ocean waves, is rarely studied. The risk assessments that consider the interaction between ocean waves and storm surges are rarer. To make the dynamic mechanism and risk assessment of marine dynamic disasters more accurate, it is necessary to add the coupled effect of ocean waves and storm surges as an assessment indicator.
1.2. Research on the Assessment of Marine Dynamic Disasters
The risk assessment of marine dynamic disasters is an important application of scientific research and has always received substantial attention. In the 1960s, Jelesnianski [29] began to evaluate the impact of storm surges through numerical calculations. In the early 1980s, William [30] published monographs that showed research on the risk assessment of widespread natural disasters and introduced the characteristics of nine natural disasters, including storm surges. Subsequently, a large number of studies on the assessment of storm surge disasters began to appear [31,32], and specific scenarios were applied according to the different characteristics of different study areas.
Previous research usually was based on the uncertainty of natural disasters. With the rapid development of forecasting models such as storm surge models, storm surge disaster assessment has been divided into several categories, including the analysis of typical return periods [33], the analysis of the maximum storm surge, and scenario simulation of storm surges. Research into nearshore floods based on storm surges and the evacuation system in nearshore areas has also taken place.
At present, single-factor risk assessment is relatively well studied, and some multi-factor comprehensive assessments have also developed a series of combined methods [34,35]. However, with the refinement of marine dynamic disaster risk assessment, the multi-factor coupling process between different types of disaster has received more attention in marine numerical models. To improve the results of the marine dynamic disaster assessment methods, it is necessary to propose and adopt a corresponding multi-factor coupled risk assessment model. At the same time, with the development of measures of the hazard intensity of a single factor, the coupling effect between different factors, which were originally insignificant under low-intensity disaster conditions, may be expressed more clearly.
In recent years, researchers have carried out studies on the vulnerability assessment of marine dynamic disaster-affected objectives [36,37] and published the assessment results. Generally, the research on marine dynamic disaster assessments without a vulnerability assessment is not sufficiently comprehensive and in-depth.
To summarize, the research on marine dynamic disasters, especially the in-depth research on storm surges and ocean waves, is of great importance for the prediction and risk assessment of marine dynamic disasters. Accordingly, the current study aims to carry out a risk assessment of marine dynamic disasters considering multi-factor coupling to refine the assessment results, integrate the risk assessment methods into an organic and comprehensive structure, and achieve an integrated framework for operational assessment. The current study also uses the data obtained by remote sensing as a vulnerability indicator to further improve the reliability and refinement of marine dynamic disaster comprehensive assessments.
2. Materials and Methods
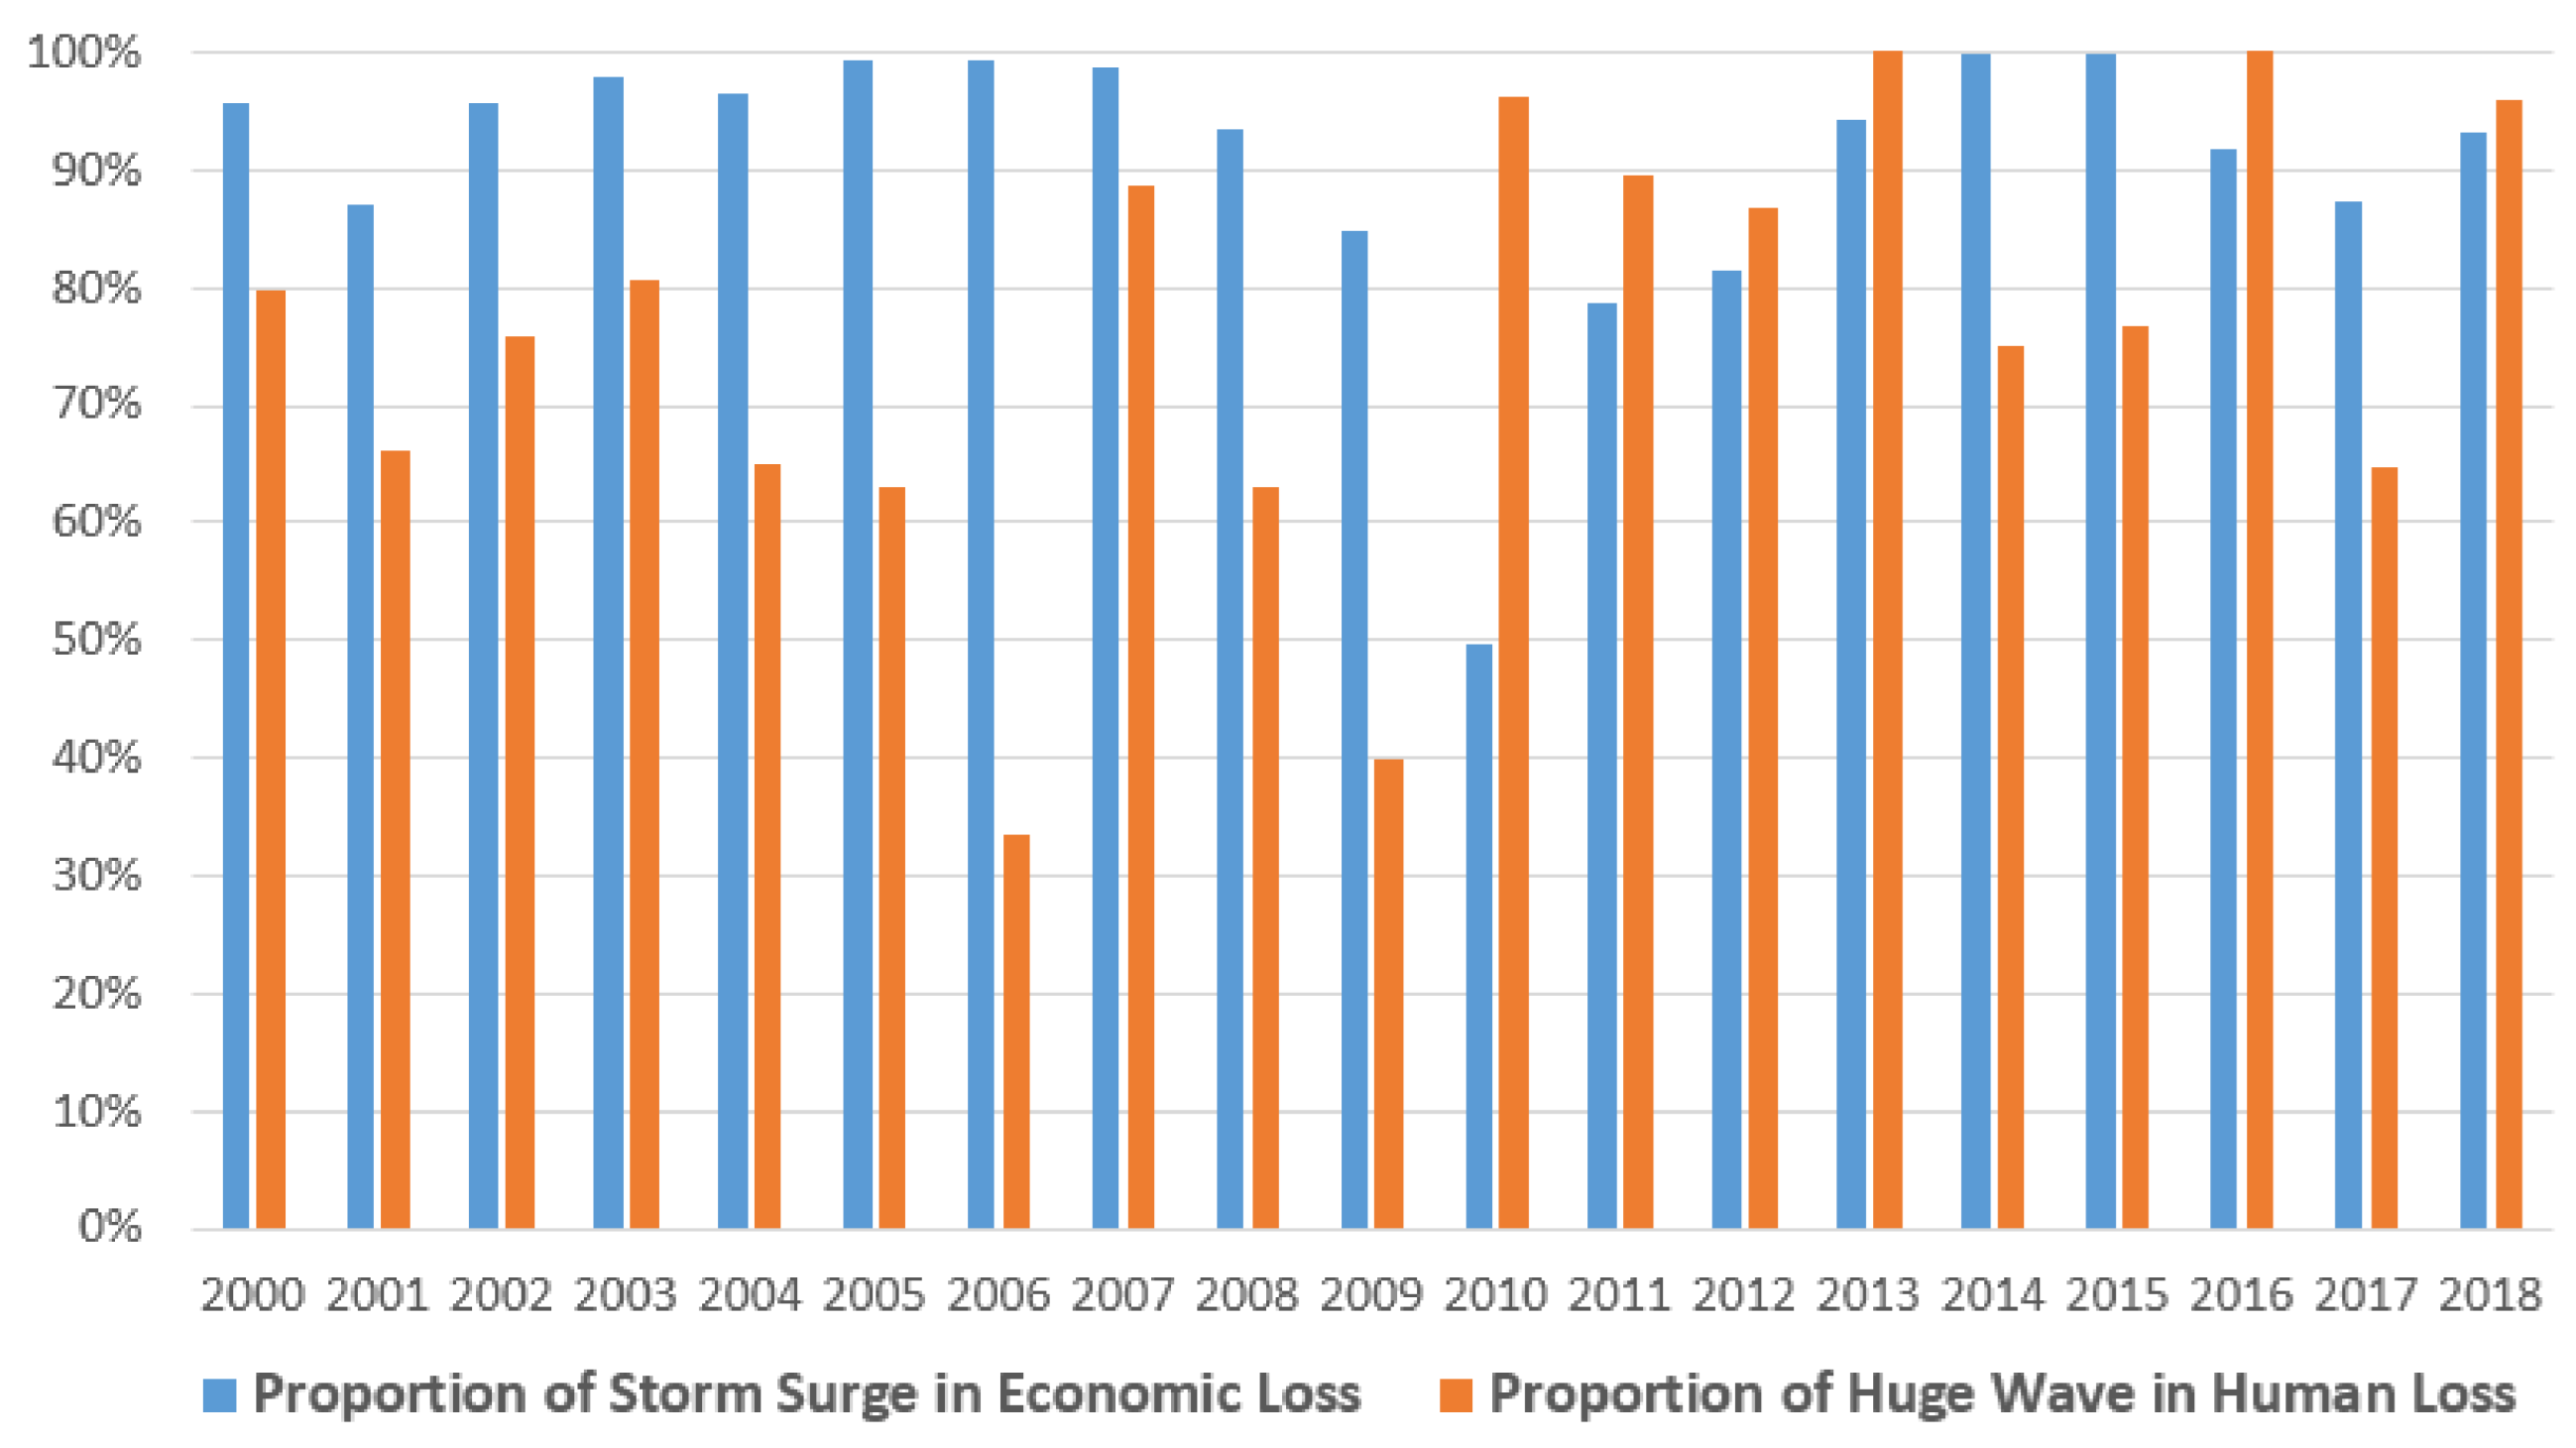
As mentioned above, marine dynamic disasters include storm surges, huge waves, sea ice, and tsunamis. Taking the statistics of marine disasters in China in 2018 as an example, it was found that among the various marine disasters, the types of disaster that caused the most direct economic losses were storm surges, accounting for approximately 93% of the total direct economic losses. The types of disaster that caused the most serious human losses were huge waves, accounting for approximately 96% of the total number of deaths (missing) [38]. Similarly, by analyzing China’s Marine Disaster Bulletin over the past 20 years and categorizing the marine dynamic disaster data (as shown in Figure 1), a similar conclusion could be drawn; that is, direct economic losses were mainly caused by storm surges, and human losses were mainly caused by huge waves. Therefore, the current study analyzed storm surges and huge waves as the main disasters, using China’s coastal area as an example.
2.1. Establishment of an Indicator System
At present, the main methods for the risk assessment of marine dynamic disasters can be divided into the following four categories.
- (1)
- Probability and statistics
The typical research process of the probability and statistics category is to use the statistical information from the existing disaster process to calculate and evaluate the typical return period of disasters such as storm surges.
- (2)
- Fuzzy information
Fuzzy mathematics and other methods are used to calculate future information based on a small amount of sample data, and information diffusion theory can be applied.
- (3)
- Scenario analysis
This method uses historical data and develops different scenarios to reconstruct the dataset of disasters.
- (4)
- Indicator system
By establishing an indicator system and using existing data or using subjective factors to calculate indicator weights, a final combination of indicators and weights can be set for the assessment.
Moreover, the indicator system is the most widely used method in marine dynamic disaster assessment because it is based on intuitive principles and is simple to operate. To ensure the reliability of the indicator system, as many influencing factors should be included as possible when the indicator system is established. Then, the indicator system can be further screened or controlled by weight according to different purposes. When calculating the weights, the indicator system approach can be roughly divided into subjective and objective methods.
Analysis of the four types of assessment methods mentioned above shows that the probability and statistics methods and the fuzzy information methods mainly analyze and process the independent historical data of certain research sites or research areas, and the basic research units are mainly administrative divisions. The results tend to be macroscopic assessments of various countries, provinces, cities, or disaster hot spots. The typical results are zoning maps of various types of assessment results, which only have a macro-assisted role in aiding the decision-making process. The scenario analysis methods are mainly used to test a single area or event repeatedly, and the assessment results are generated from the perspective of probability. Thus, it is difficult to realize real-time and dynamic assessment during the disaster process. After comparison, only the indicator system method was suitable for the data acquisition and practical requirements of this study. Using rasterized management of the data for each index and calculations between the grids for different indicators, the assessment results were able to be obtained quickly.
After choosing the indicator system method as the overall approach, the next step was to establish an indicator system. The selection of indicators needed to accurately describe certain features of the research object, and it needed to be organically combined through a series of indicators. The establishment of the indicator system was limited not only by objective conditions and research goals but also by the subjective views of the researchers involved.
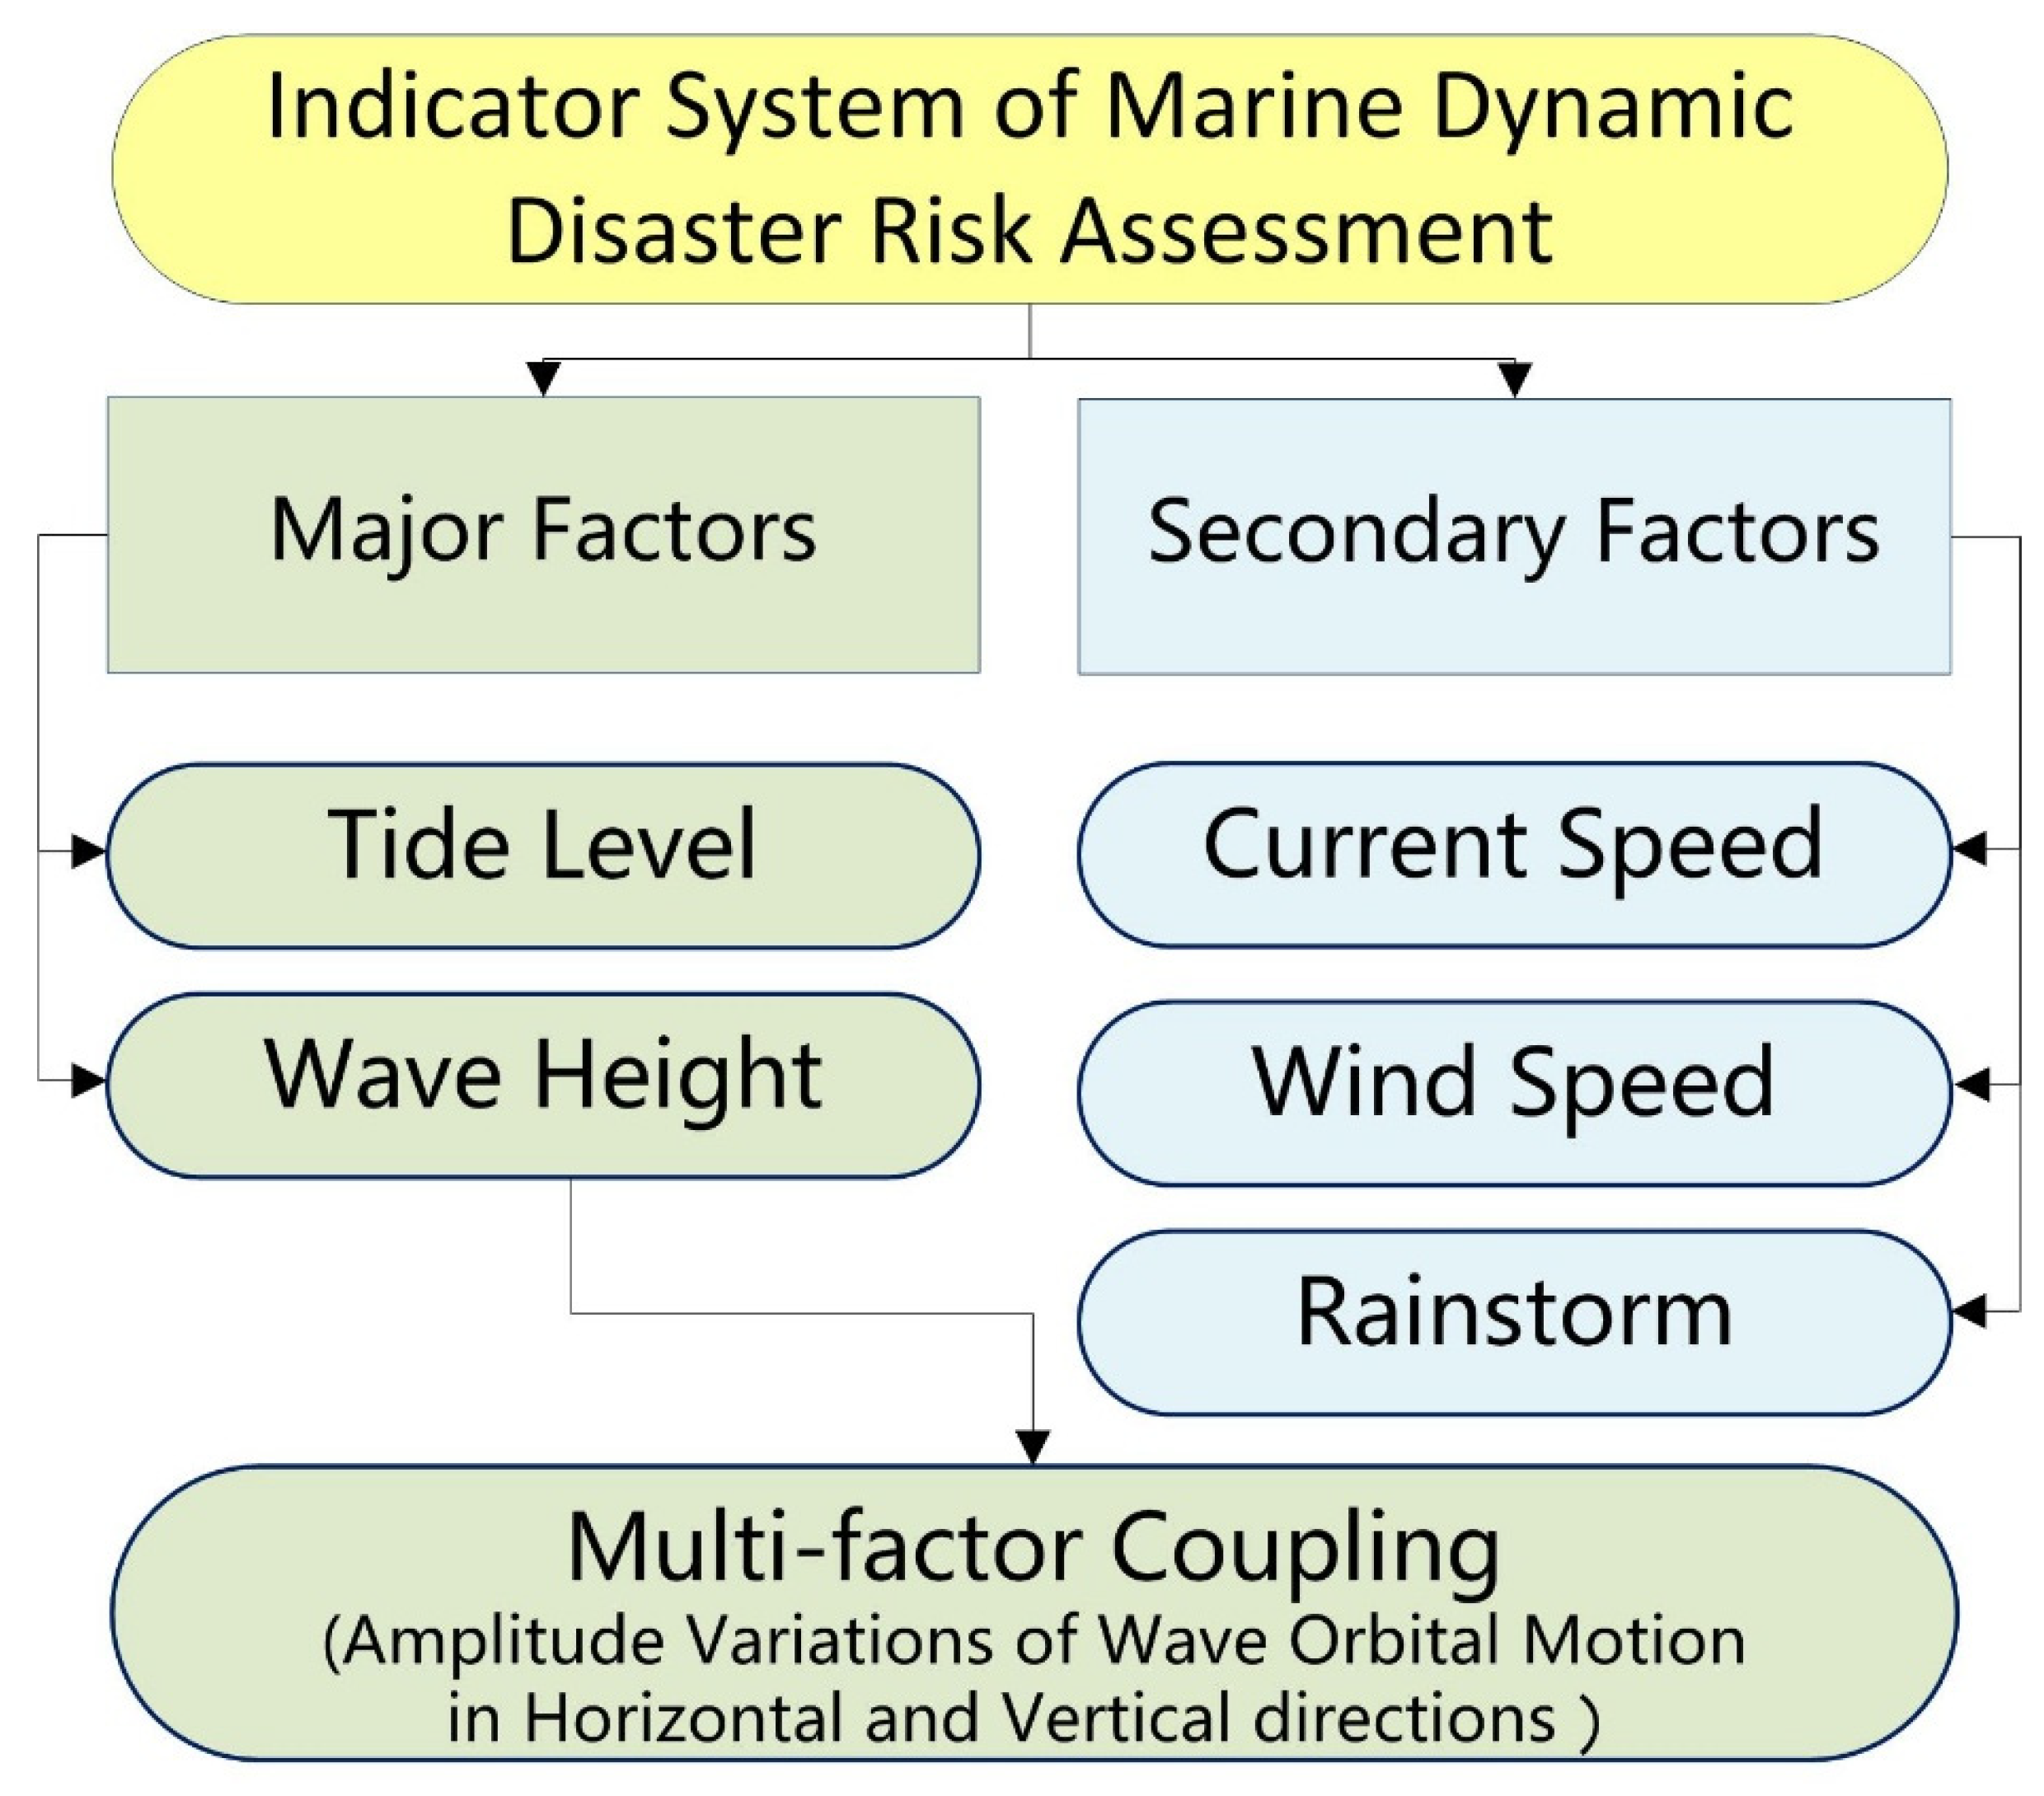
The establishment of the indicator system drew on previous research results. Qi [39] used nine indicators to evaluate storm surges: maximum wind speed, frequency of gusts, rainstorm intensity, rainstorm frequency, tropical cyclone frequency, maximum wave height, maximum storm surge increment, maximum tidal range, and sea level rising rate. Because some indicators were concepts of statistical significance, based on the actual data of marine dynamic disasters in China, and also on the real-time dynamic operational assessment framework of the entire study area, this paper adjusted the indicator system. The frequency-related statistical indicators were removed, and the multi-factor coupling indicators were added. The final assessment indicator system of this study is shown in Figure 2.
According to the overall goal of simplifying the assessment process and ensuring the operability of assessment, a total of six indicators were selected to constitute the marine dynamic disaster risk assessment indicator system. These indicators were divided into major factors and secondary factors according to their influence. The major indicators included tide level and wave height, which were two hazard factors that conformed both to people’s intuitive cognition and the statistical results in the China Marine Disaster Bulletin. As the multi-factor coupling indicator will finally affect the wave height indicator, the multi-factor coupling indicator can be treated as part of the wave height indicator, and shares the weight of the wave height indicator.
The application of the indicator system needed to have the following characteristics: be integrated with the numerical models, including the storm surge model and ocean wave model; take tropical cyclone events as forcing; simulate the typical storm surge process; calculate the data of tide level and wave height in the nearshore area; and, finally, calculate the data of the offshore multi-factor coupled effect.
2.2. Calculation of Indicator Weights
The indicator system method aimed to calculate the weight distribution of each indicator. Most of the commonly used objective class of assessment methods, such as principal component and factor analysis, needed more than two assessment indicators and used multiple sets of data to establish weight relationships. According to the analysis of the China Marine Disaster Bulletin in the current study, there were only two major hazard factors that could be indicators in the field of storm surges and ocean waves, and thus the above methods could not be applied. It was necessary to analyze the disaster loss data of storm surges and huge waves over the years to establish the correlation between the two indicators and to obtain the default weight for the subsequent assessment.
Through the preliminary analysis of the statistical data in this case study, it was found that the disaster loss fluctuated markedly each year. For example, the human losses from storm surges could be zero in some years and could reach hundreds of people in some years. A weight calculation method was needed that captured the substantial variations in this dataset. The entropy evaluation method was chosen to calculate and analyze the weights.
The entropy evaluation method uses the concept of entropy in thermodynamics to describe a measure of the disorder status of an indicator. It uses the original data of the indicator to calculate the information entropy of each indicator. As the entropy value decreases, the disorder status of the information decreases, and the utility value of the information increases.
Using the entropy evaluation method to determine the weights, it was first assumed that the multi-attribute decision matrix was as follows:
When the numerical dimension of each column of indicators is different, the nondimensionalization of the numerical value needs to be performed first. In this paper, when economic loss analysis or human loss analysis was carried out, the dimensions used for both disasters were the same, and thus there was no need for nondimensionalization. Then, under the jth disaster-causing indicator, the influence degree of the ith year can be calculated according to the following formula:
The entropy value of the jth indicator can be obtained, namely:
Among them, the constant , and it can be seen that tends to 1 when the contribution of the data in each year for the jth indicator tends to be consistent.
The diversity coefficient was defined to indicate the degree of consistency of the data for each indicator. A larger value of indicated that the importance of the indicator was higher. When tended to 1, tended to 0, indicating that the indicator had almost no effect.
We defined the weight of each indicator:
In this way, the weight of each assessment indicator was finally obtained.
2.3. Multi-Factor Coupling Approach
As mentioned above, with the rapid development of ocean numerical models, the accuracy of simulation and forecasting has been greatly improved. However, for specific phenomena in the nearshore area or in a small local area, the results of the numerical simulation have a large error range. Especially in nearshore shallow water areas, it is still hard to achieve satisfactory simulation results. Then, researchers began to focus on the relationships between various elements such as waves, tides, and currents and began to introduce different elements into respective numerical models for coupling, thereby improving the accuracy of numerical models. It was necessary to solve the problem that single numerical models, which simulated elements such as coastal currents and waves, tended not to achieve the expected assessment results. Similarly, to improve the accuracy and persuasiveness of the risk assessment of marine dynamic disasters, it was also necessary to consider the multi-factor coupling relationship between different dynamic disaster elements.
2.3.1. Theoretical Background of the Multi-Factor Coupling Assessment
As early as the 1960s, Longuet-Higgins [40] proposed the effect and influence of ocean waves on ocean currents, focusing on the residual momentum of wave motion. Especially in the nearshore area, the residual momentum of wave motion can significantly affect the coastal flow field, and thus it is mainly studied as radiation stress. Longuet-Higgins [41] continued to verify the relevant theories, and with continuous improvement by other researchers, the simulation of radiation stress was able to match the actual observations. In general, the radiative stress of ocean waves can increase the flow velocity and increase the tide level where the water increases, while decreasing the tide level where the water decreases. As researchers gradually carried out systematic studies and quantified the coupling relationship between ocean waves and currents, a synchronous coupling model was gradually applied [27]. Xie [42] and Cobb [43] also tried to incorporate the effect of radiation stress into numerical models such as POM and ADCIRC. Mellor [44] used the σ coordinate system and Cartesian coordinate system to extend the influence of radiation stress from two-dimensional to three-dimensional, which was also widely used in ROMS [45], and FVCOM [46].
In the coupling interaction, the reverse influence, which is the influence of ocean currents on ocean waves, is, however, relatively less studied. The main influence originates from the change in the flow field caused by the change in water depth. Recently, researchers have gradually increased the number of studies in this field. Ellingsen [47] showed that the storm flow field and terrain slope had a relatively significant strengthening effect on waves, especially in the nearshore area [48,49]. Therefore, on the basis of the findings of previous studies, the current study carried out a quantitative calculation of the influence of ocean currents on ocean waves.
In the field of ocean numerical models, researchers have successfully coupled the wave and the current models and integrated them into the numerical simulation process. Generally, the coupling method has two models that are set to run separately, and to exchange the outcome data every specific time period, so that the respective models can be revised and further iterated.
If the above-mentioned coupling method is adopted, although the accuracy of numerical simulation can be greatly improved, this coupling method is only fixedly embedded in the ocean numerical model itself, and it is not convenient to change to another numerical model as the data source for assessment. Thus, it is not easy to realize the concept of high cohesion and low coupling [50] for the integrated assessment framework. Therefore, the quantitative calculation of the coupled influence is carried out separately, and the calculation results are added to the assessment system to improve scientific robustness and reliability.
2.3.2. The Coupled Influence of Background Current and Terrain Slope on Coastal Ocean Waves
As mentioned above, in the study of wave–current coupling, ocean waves can significantly affect the motion of coastal currents through the process of radiation stress. This process has been widely studied, and the coupling has been reflected in the outcome data which are used in the assessment process. However, few studies have focused on the impact of ocean currents on ocean waves in nearshore conditions, and there is a lack of quantitative operational calculation methods. The current study tries to develop a method for calculating the effect of background current and terrain slope on ocean waves and takes this method as the key research content of the wave–current coupling effect and proposes.
Theoretical Basis
To study the motion laws of ocean wave elements, Yuan [51] proposed a unified linear wave theory using the most basic motion equations. Under the idealized conditions of a “general ocean”, the unified linear wave solution and dispersion relationship of ocean waves, such as surface gravitational waves, internal waves, and inertial gravitational waves, can be obtained. The theoretical basis of wave frequency modulation and wave amplitude enhancement by factors such as background current can also be established. The dispersion relationship of ocean waves can be expressed as Equation (5):
where represent horizontal components of wave number and complex frequency, respectively, H represents the bottom topography, , , , f is the Coriolis parameter, and R is the curvature radius of the mean flow path. The symbols represent two horizontal velocities, vertical velocity, pressure, density, and surface elevation, respectively. is the basin mean water density .
Equation (5) shows that both the background current shearing effect and terrain slope have an impact on the dispersion relationship of ocean waves. In the nearshore area, referring to the frequency of waves, as the water depth reduces, the vertical shearing effect of the background current weakens, the horizontal shearing effect increases, and the terrain slope’s strengthening effect also increases, thus clarifying the influence of background current and terrain slope on offshore waves and confirming the need to study this coupled method in the assessment process.
Quick Calculation Method of Influence
According to the further development of the unified linear wave theory based on Yuan [51], the effect of background current and terrain slope on the unified linear wave solution was studied, which was mainly reflected in two aspects.
The first is the shearing effect of the background current:
The second is the resonance excitation effect of the bottom boundary background current:
Among them, represents the wave orbital velocity in the x, y, and z directions. represents the storm flow field, represents the water depth, and and represent the terrain slope in the x and y directions.
In the sense of the generalized function, any arbitrary function can be written as Fourier integral forms. The Fourier integral transform form of the variable is , and then the calculation formula of is expressed as:
The symbols denote two horizontal orbital velocity amplitudes of waves. The symbol represents the vertical orbital velocity amplitude of waves. Substitute, into the resonance excitation effect Equation (7), and we get:
Although the calculation processes of , , and are very complicated, the current study only needed to analyze the strengthening effect of the waves according to their actual needs. It was not necessary to obtain the final form of the nearshore strengthening effect of ocean waves on the premise of a unified linear wave solution; thus, the calculation process could be simplified in advance.
In practice, to finally use the multi-factor coupling model in the evaluation process, it was necessary to simplify the calculation process. In the simplification process, for small-scale areas near the coast, we were able to ignore the change of seawater density in the horizontal direction and the influence of the background current curvature and consider the background current as a constant value. At the same time, if we ignored the influence of atmospheric pressure and the Coriolis force, the excitation generation term of the bottom boundary background current to the waves under different slopes could be obtained as shown in Equations (11)–(13):
In the subsequent calculation process, we only took the real part of Equations (11)–(13), and then the direct calculation formula of the strengthening effect could be obtained, as shown in Equations (14)–(16):
Among them, , , and are the multi-factor strengthening of the background current and terrain slope in the horizontal x, y, and vertical z directions. These three results were added to the assessment process.
2.4. Vulnerability Assessment of Offshore Aquaculture Areas
To complete the assessment to a high standard, it was important not to ignore the vulnerability assessment of the disaster-affected objectives. Marine dynamic disasters of the same level have different destructive effects on objects with different disaster-affected capacities.
The coupled strengthening mainly occurs in the nearshore area, and, therefore, we also analyzed and calculated the marine disaster-affected capacity of the nearshore area and selected the area of aquaculture as the main assessment indicator. Remote sensing image processing was used to obtain the aquaculture area in the offshore area, and the results were added to the assessment process.
In offshore China, raft farming is the main method of algae farming. The spectral characteristics of algae at maturity are similar to those of plants, and thus the Normalized Difference Vegetation Index (NDVI) could be used to detect potential raft farming patches. Owing to the complex water color, the natural algae in the seawater will interfere with the detection, but generally, the cultured patches had higher NDVI values than the surrounding seawater. Therefore, object-based visually salient NDVI (OBVS-NDVI) [52] was used to calculate the difference between cultured patches and surrounding patches to identify potential farming targets.
The whole extraction process adopted an object-oriented method, which combined spectral and edge features for operational extraction. After the remote sensing images were preprocessed, the NDWI values were used to separate water and land. Next, the Canny operator and the OBVS-NDVI method were used to extract the edge features and potential farming patches in the water. Then, the edge overlap calculation was used to obtain the final farming target.
After the extraction of aquaculture areas is completed, a kilometer grid is constructed to calculate the aquaculture area in a single grid, which is used as the vulnerability index of aquaculture and coupled with the comprehensive risk assessment results.
3. Results
On the basis of the integrated assessment framework, we calculated the numerical model, indicator weights, and nearshore coupling enhancement. Together with the extracted aquaculture area in China’s coastal waters, we completed a comprehensive marine dynamic disaster assessment.
3.1. Calculation of Indicator Weights
The China Marine Disaster Bulletin issued by the Ministry of Natural Resources (State Oceanic Administration) in recent years contains details of the losses caused by storm surges and huge waves, especially for economic losses and human losses. The current study summarized the disaster losses in China from 2000 to 2018. Table 1 shows the statistical results and Figure 1 shows the proportion of disaster intensity in the loss.
Using the above results, the weights for storm surges and huge waves were calculated by the entropy method for economic losses and human losses. The results are shown in Table 2. The economic and human losses were temporarily assigned equal weights to obtain the final weight for storm surges and ocean waves.
3.2. Experimental and Practical Verification of Coupled Strengthening Effect
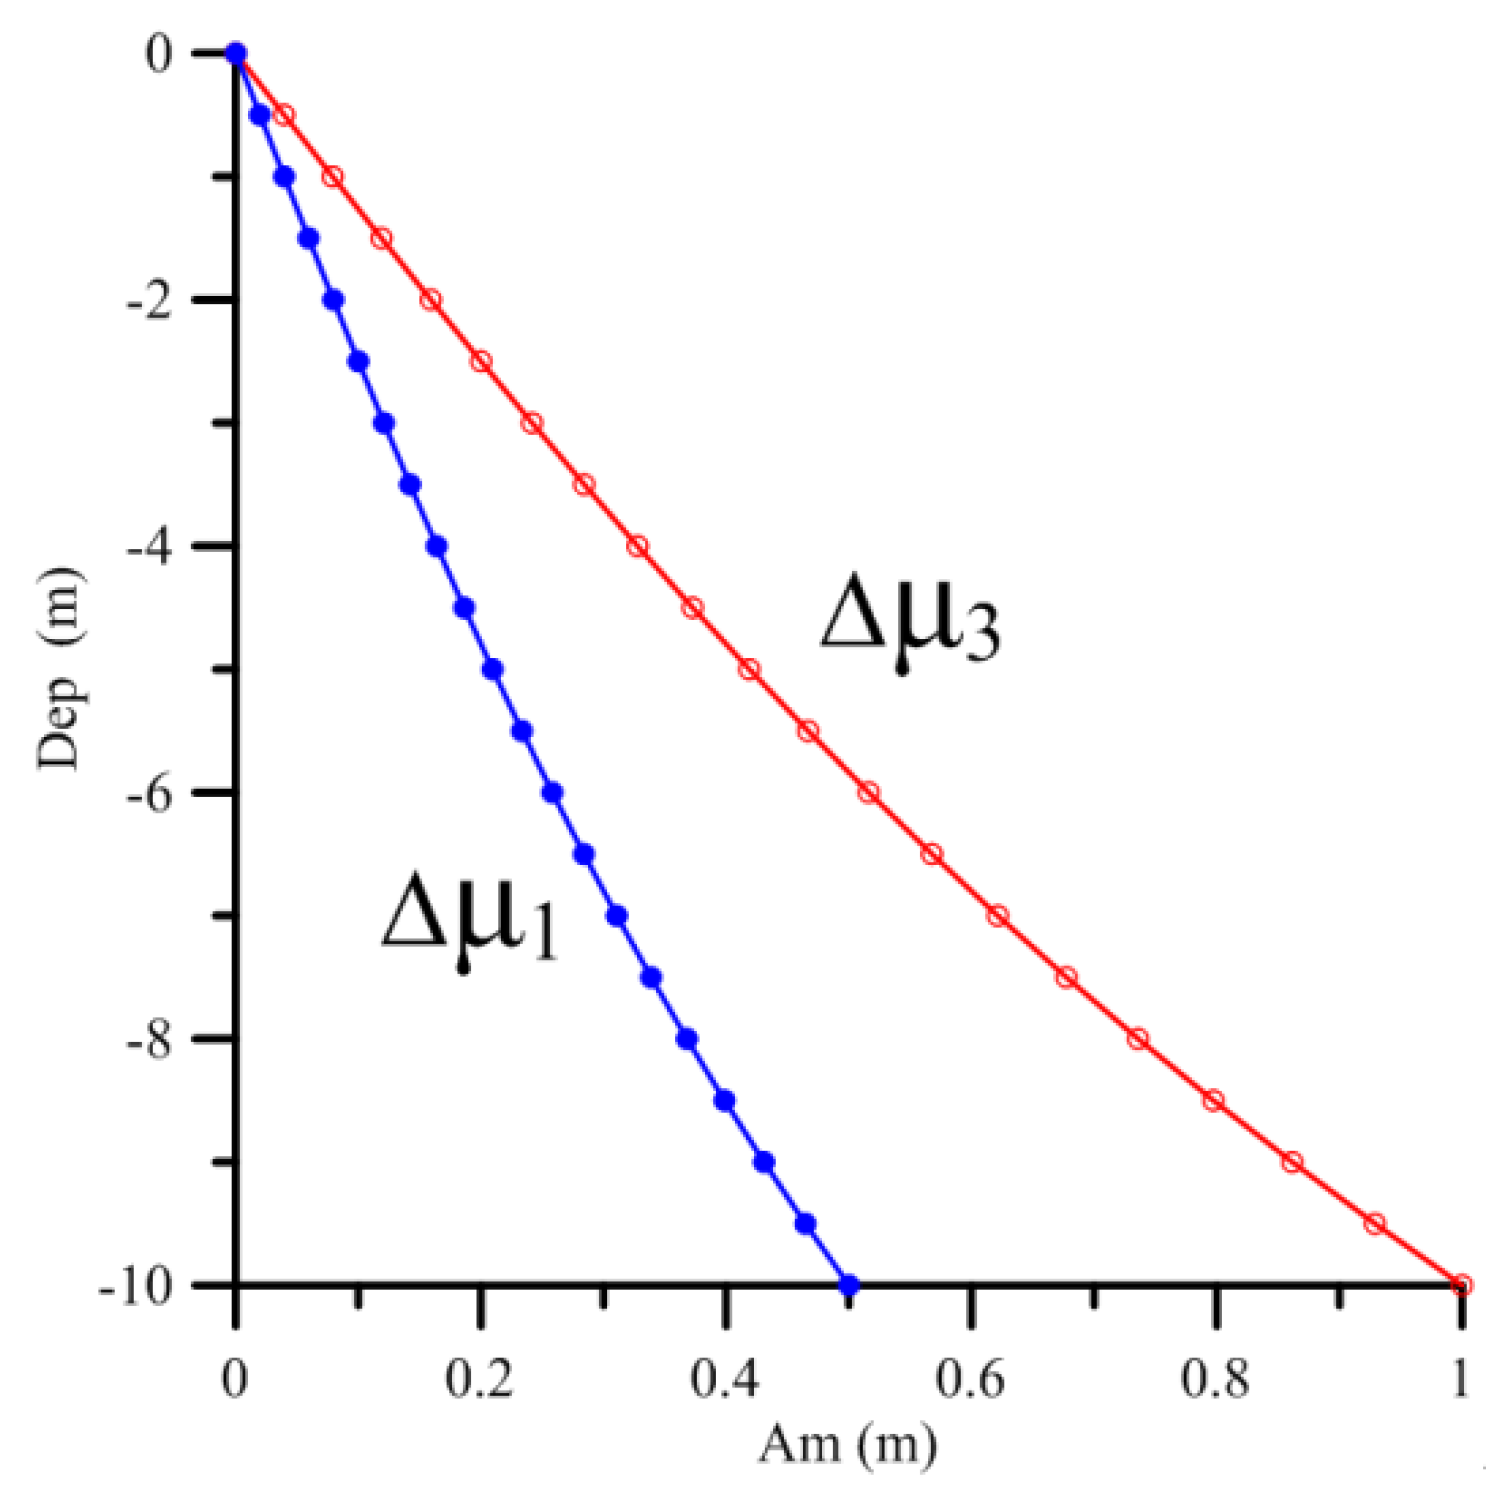
After establishing an assessment model of the influence of background current and terrain slope on coastal ocean waves, we first conducted an idealized experiment on the final result to verify whether the predicted nearshore strengthening effect had been obtained. We set the water depth to be 10 m, the slope in the horizontal x direction and the horizontal y direction to be 0.5, the velocity of the background current to be 2.0 m/s, and the dominant wavelength to be 50 m, namely:
After substituting into Equations (14)–(16), the strengthening effects of and were obtained, as shown in Figure 3, which represent the change in the waves in the horizontal and vertical directions, respectively. The background current and terrain slope clearly had a significant nearshore strengthening effect on the coastal ocean waves. The amount of change was the largest at the bottom boundary, and it increased with depth.
The coupled model showed that the nearshore strengthening was related to many factors, including the seabed topography, and therefore, there may be many changes in real coastal situations. The most intuitive factor was the positive and negative direction of the slope. In the case where other element data are identical, the positive and negative direction of the terrain slope will inevitably cause substantial changes in the strengthening effect. Similarly, for the same location, when the spatial environment such as the terrain slope remains unchanged, and the flow velocity and other factors change, the strengthening effect will also change. As shown in Figure 4, during the storm surge process, the strengthening effect at the same location was calculated for 3 consecutive days. The results show that with the generation, strengthening, and decay of the storm surge, the strengthening effect also reflected a corresponding change from weak to strong to weak again. This showed that the strengthening effect was positively correlated with the intensity of the background current.
In the practical assessment process, the strengthening effect could be calculated by acquiring basic information such as the outcome data of the ocean numerical model and refined seabed topographic information in the study area. Thus, the numerical models are the basis of the assessment.
Over the years, in order to simulate storm surges better, the hydrodynamic models have been coupled with wave models. Out of different coupled methods, it has been demonstrated that the advanced circulation model-simulating waves nearshore (ADCIRC+SWAN) coupled model can simulate storm surges and concomitant waves very well. Wang [53] used ADCIRC+SWAN to simulate the storm surges and waves in the sea near the Shandong Peninsula from 1980 to 2019 and proved its effectiveness in the Shandong Peninsula for disaster assessment of storm surges.
For better comparison of the results, we also chose numerical models ADCIRC+SWAN in our study and generated the marine physical element field data. According to the marine physical element field data, a group of datasets , , and for the entire forecast area were calculated, which represented the intensified changes of the coastal ocean waves in the three directions.
Finally, a systematic test was carried out using the numerical simulation data of the storm surge process caused by Typhoon 1410 (Typhoon Matmo). Typhoon Matmo, which caused serious damage to the Shandong Peninsula, provided a very typical process to calculate and validate the coupled strengthening effect. In this study, we actually simulated the physical element field for 96 hours, which covered the period of generation, strengthening, and decay of Typhoon Matmo. From hour 73 to hour 89, the typhoon center passed through the studied area and caused the High Sea States.
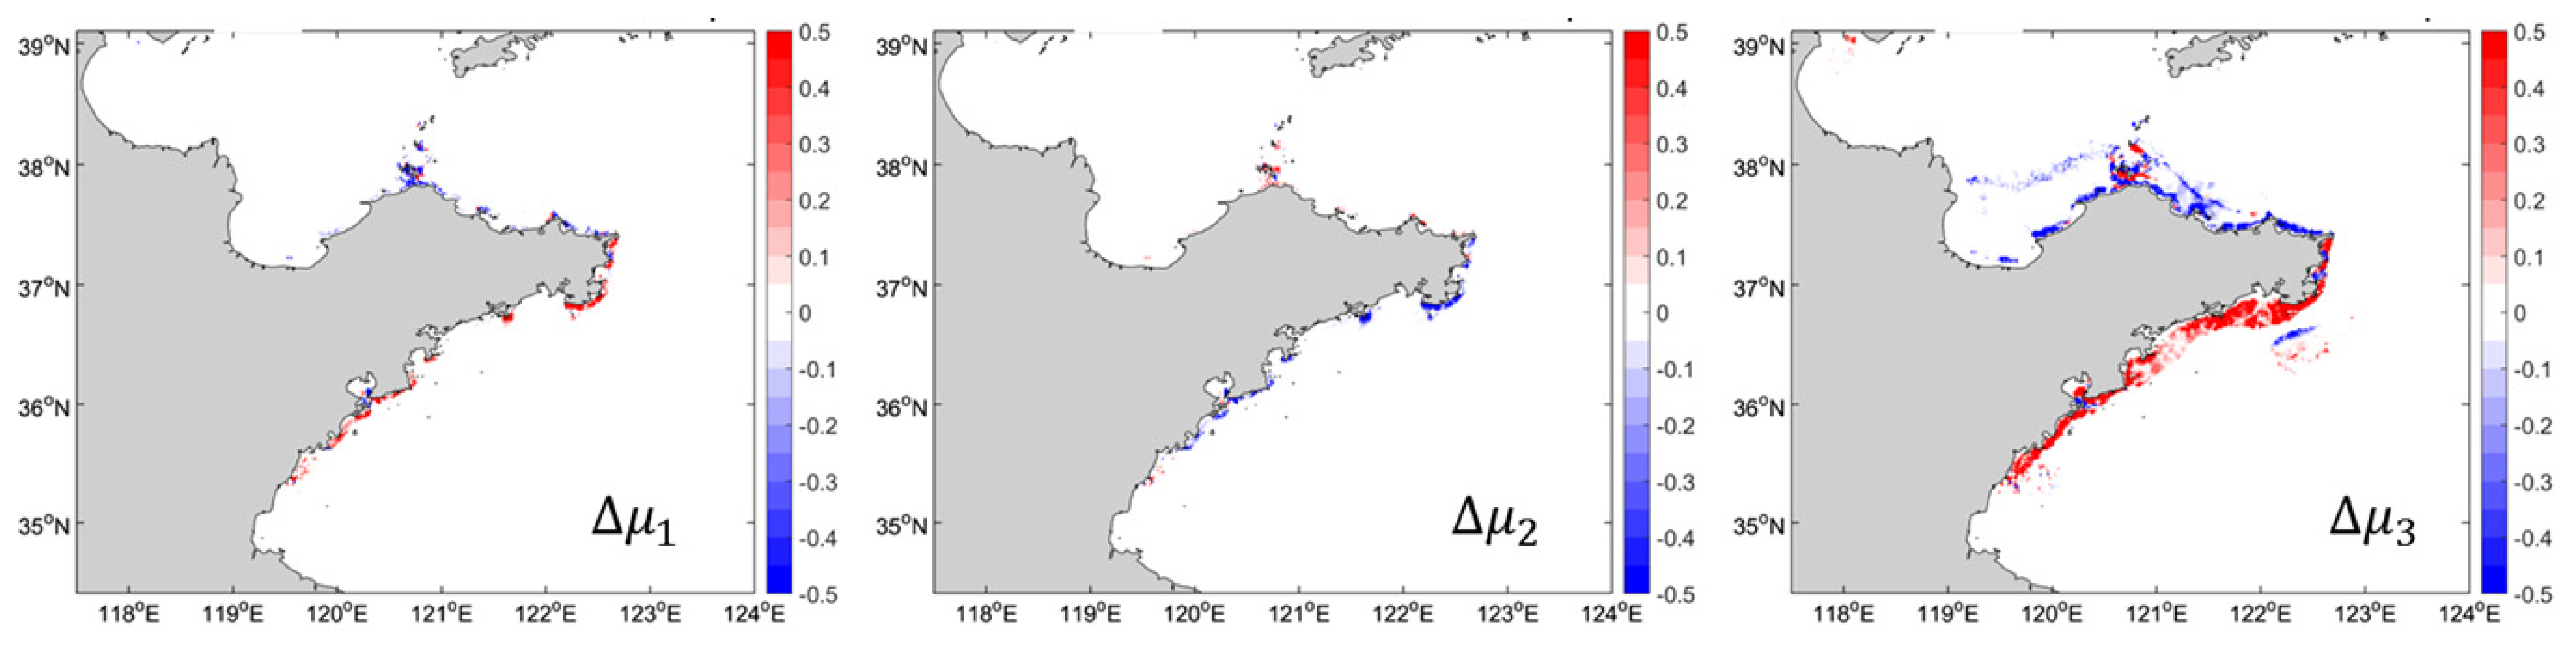
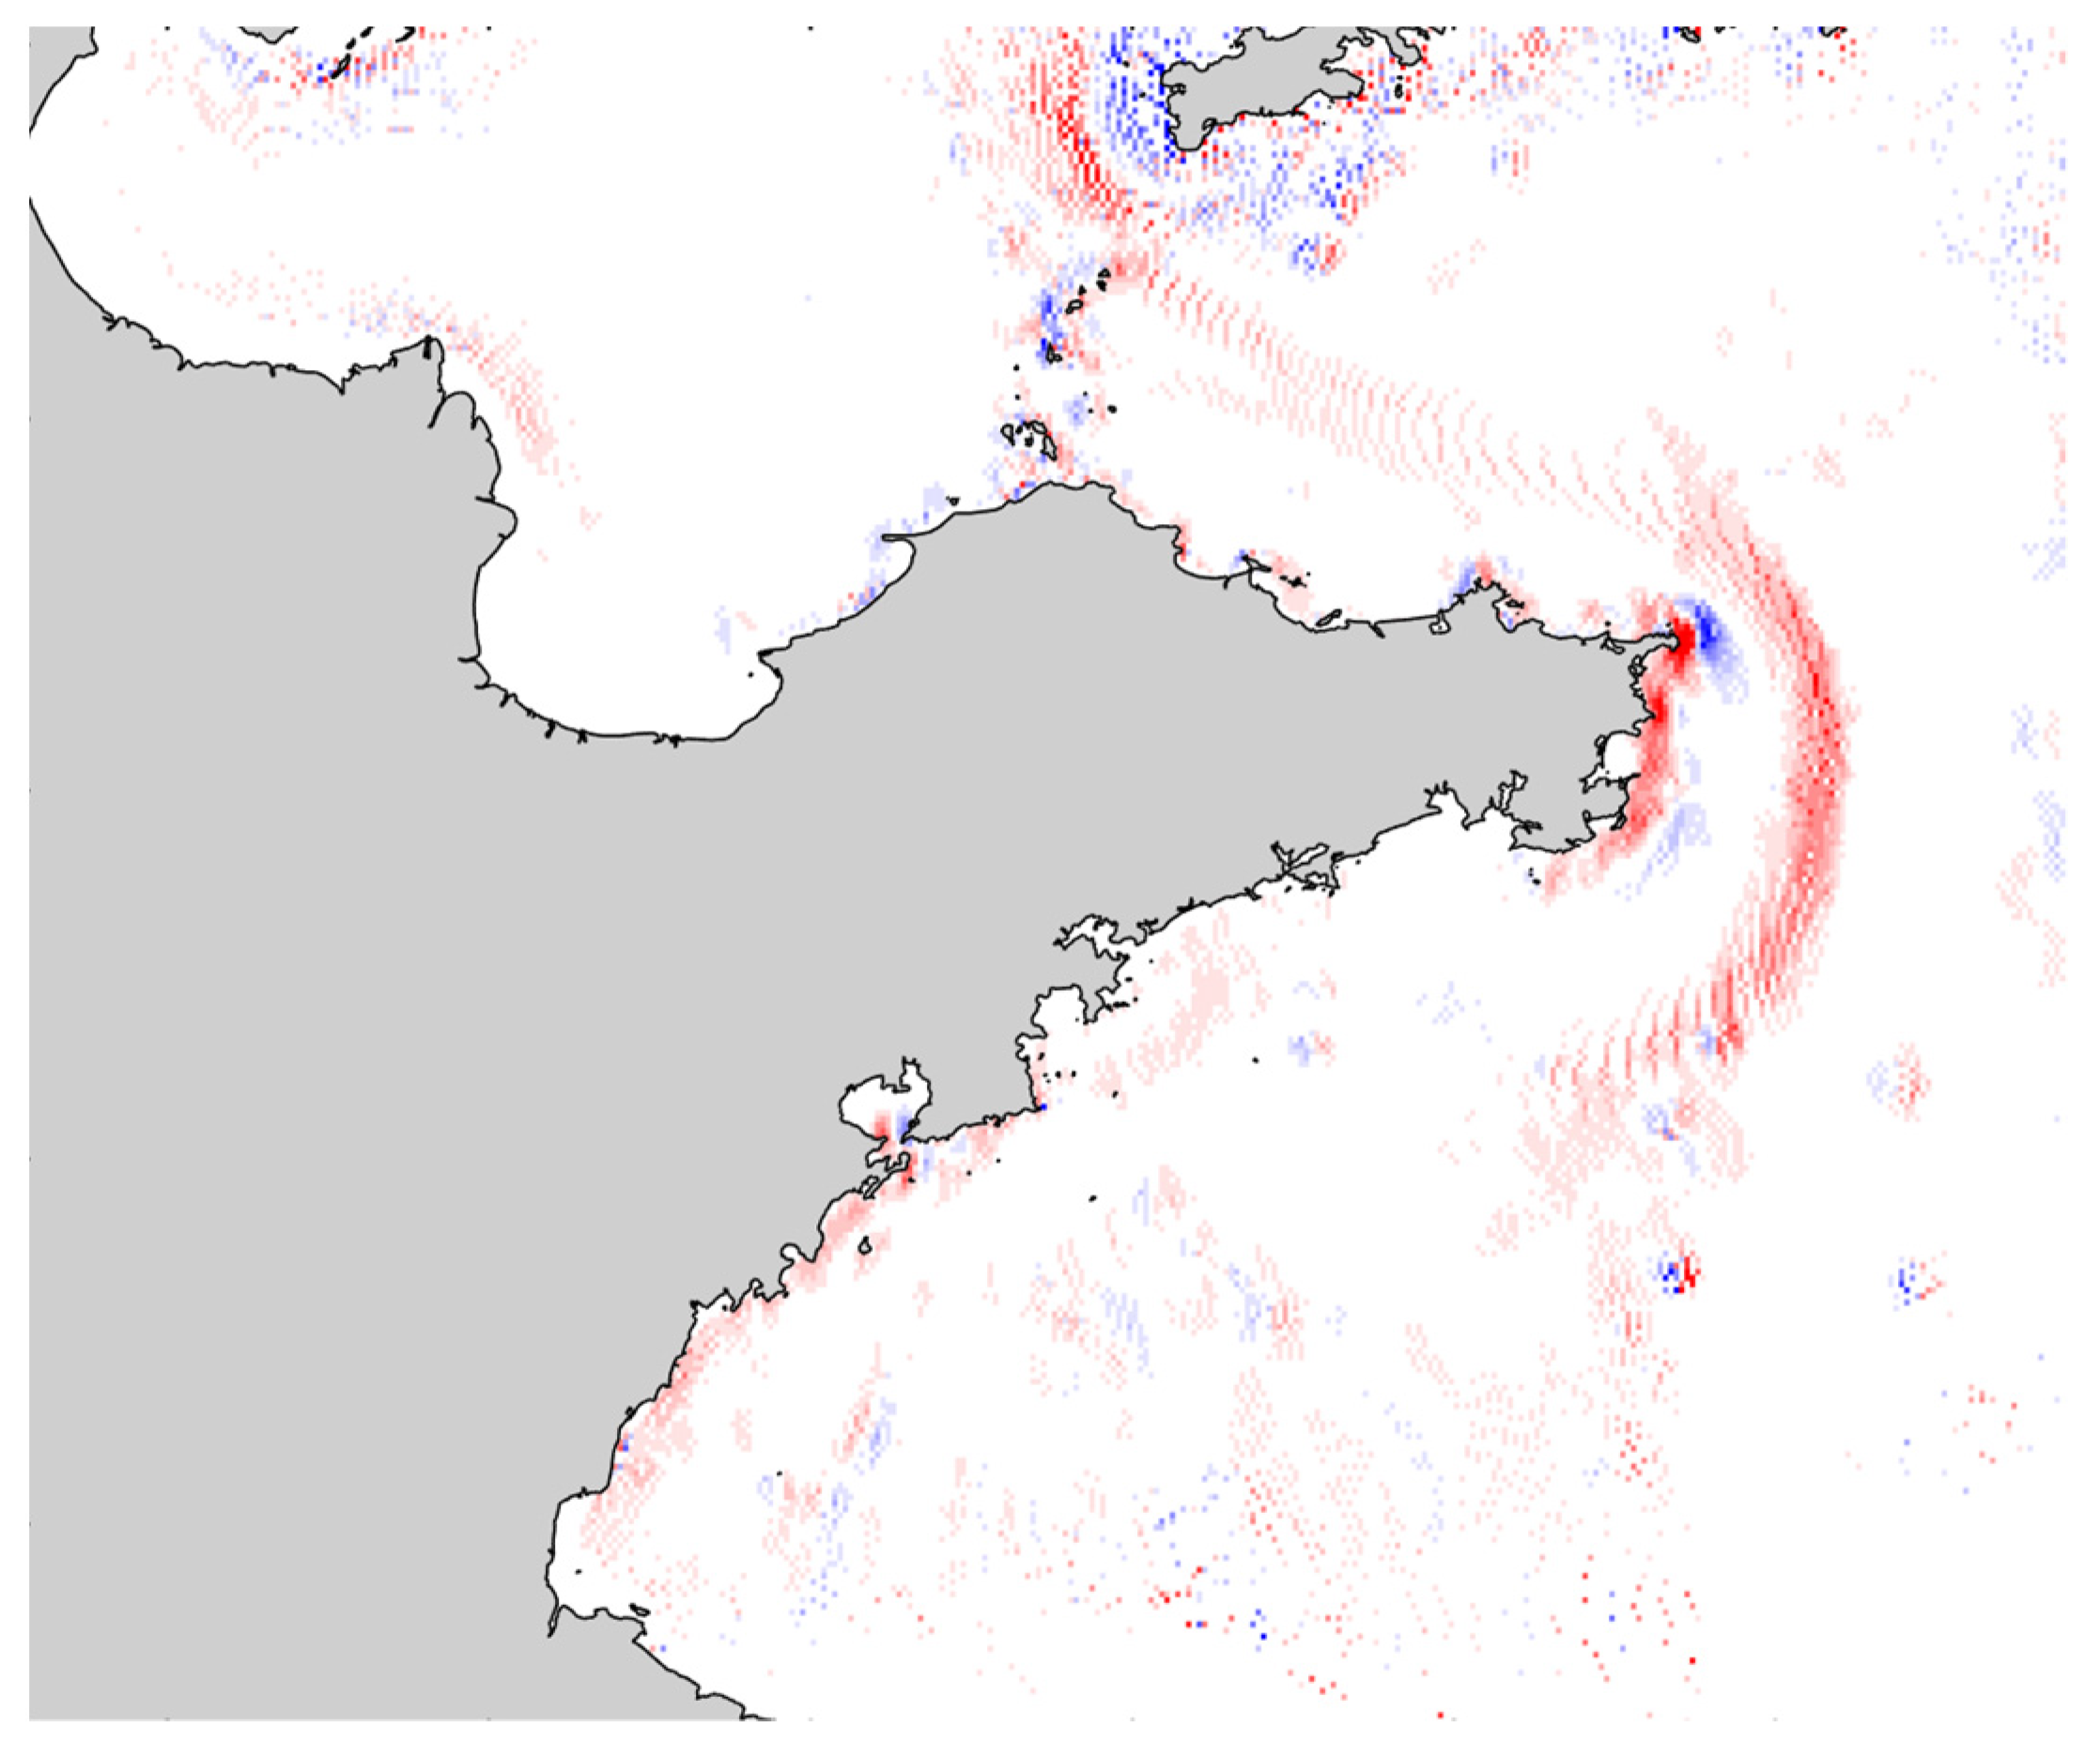
Using the outcome data of ADCIRC+SWAN as main inputs, the results for the coupled strengthening effect near the coast of the Shandong Peninsula were generated, as shown in Figure 5. This example shows that the absolute value of nearshore strengthening was generally more significant in the vertical direction.
3.3. Practical Verification of the Coupled Assessment
To evaluate the risk, in the research area, we first used the traditional method (without the coupled strengthening effect) to calculate the risk value R for every grid. For simplicity, the secondary indicators were not taken into consideration.
where w represents weight, a represents the value of the element at the grid, and all the value has been normalized to 0–1.
Then, considering the coupled strengthening effect, as the strengthening effect will affect waves, it will share the weight of the Huge Wave indicator. We could calculate the final risk as follows:
represent the values which are normalized to 0–1 from , while represent amplitude variations of wave orbital motion in horizontal and vertical directions, respectively. represent the weight shared in two horizontal and vertical directions, respectively. can be determined using evaluation methods that include subjective experience, such as the Delphi method. Since the weight (wi) and the value of the elements ) have already been normalized to 0–1, the final risk value’s range is also 0–1. If the risk value increases, it means there is a higher risk.
To further quantify the impact of the multi-factor coupled strengthening effect on the risk assessment, still using Typhoon 1410 as an example, a risk assessment of the entire storm surge process was completed. To compare with traditional assessment methods, we both used Equation (17) and Equation (18) to calculate the risk separately. In this case, according to the result of the Delphi method, in Equation (18) were set to .
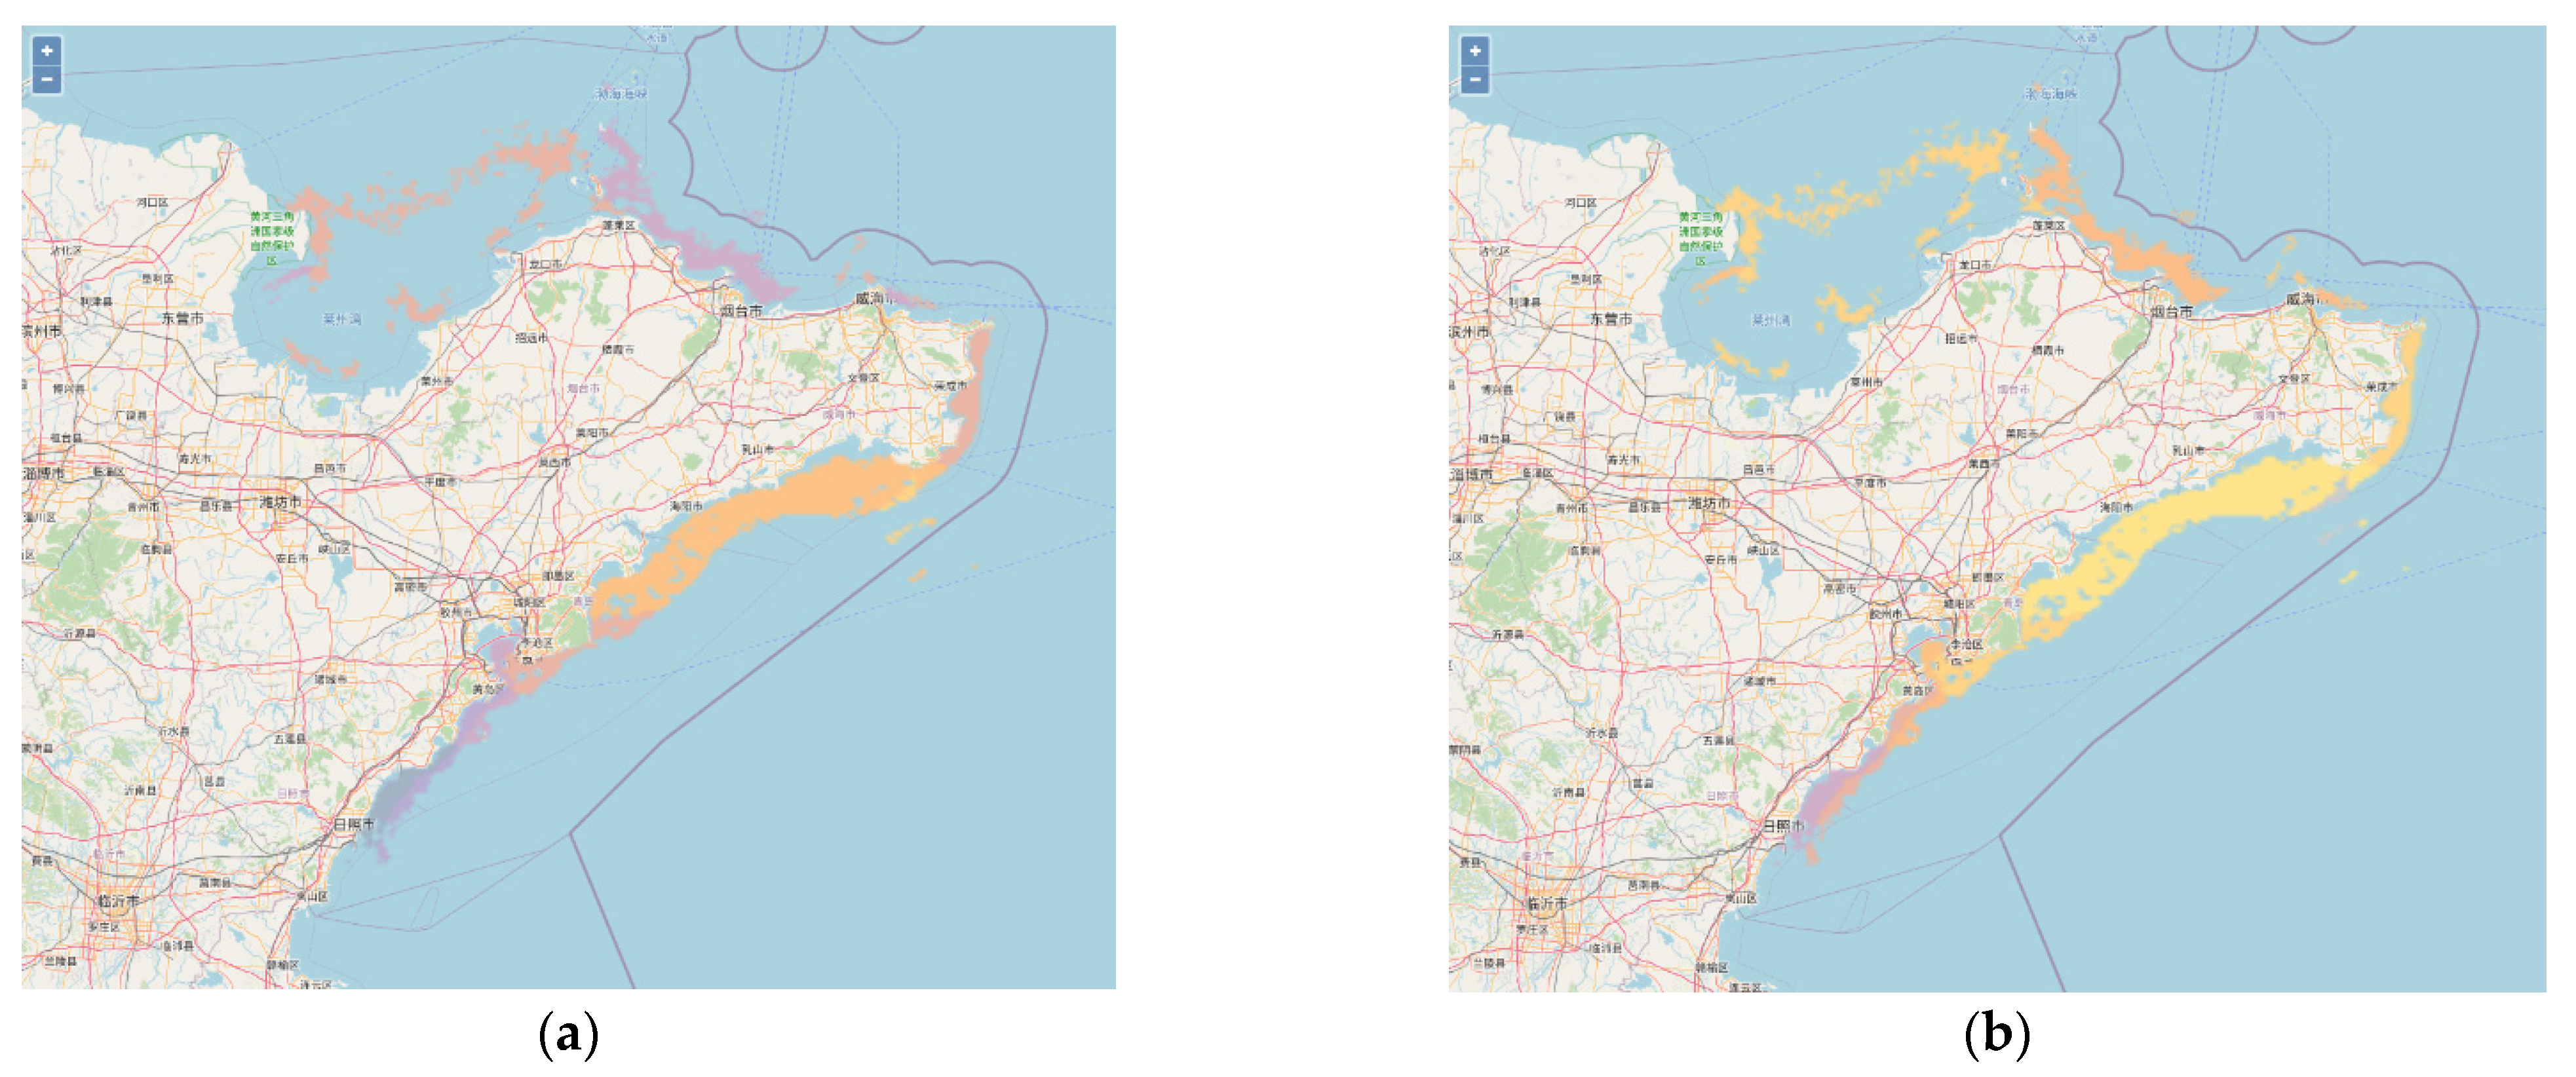
Then, the risk value of all the grids can be shown in Figure 6, and the comparison between the assessment results of the traditional method and the improved method showed substantial changes. After adding the coupled strengthening effect, the risk in the nearshore area increased (the lighter color represents a higher risk in the legend).
To quantify the change in the risk results after the coupled strengthening effect was added, the study area was evaluated every hour during the storm surge process, and all the assessment results at each hour were statistically analyzed.
For each hour, we calculated the risk value R for all the nearshore grids and generated the average risk value of these grids, then we obtained the results shown in Table 3. By comparing the hourly assessment results, we obtained the amount of change when considering the coupling strengthening effect. We found that the coupling strengthening effect could increase the risk value most significantly in the High Sea States by approximately 12% in this case.
However, we also found that the strengthening effect was not very significant under good sea conditions, and sometimes the contribution even could be negative. Meanwhile, the rate of change is not constant and differs from weight settings and other factors, which require a lot of empirical input and correction according to the actual terrain, disaster prevention facilities, economic vulnerability, etc.
3.4. Comprehensive Assessment of Offshore Aquaculture Areas
To calculate the final assessment result, it is not enough to develop numerical models and evaluate the risk only from the dynamic mechanism itself. It is still necessary to analyze disaster-affected objectives, which might cause different levels of losses or damage. Liu [54] studied risk assessment in the Shandong Peninsula, using not only numerical models but also remote sensing data. During Liu’s study, the coastal key objects were recognized, and the classification of coastal land use was identified, which was used for the vulnerability assessment of storm surge disasters. However, the spatial scope of the numerical data is in the sea area, while the spatial scope of the land use data is in the land area. So, these two groups of data could hardly be overlaid, and more improvement is needed.
In our study, on the basis of the marine dynamic disaster risk assessment, the vulnerability assessments of the disaster-affected objectives were overlaid based on the offshore aquaculture areas to obtain a comprehensive assessment result. We used Landsat 8 image data and applied an object-oriented method to identify the offshore aquaculture area. The spatial scope of the aquaculture data is in the sea area, which could match the numerical data better.
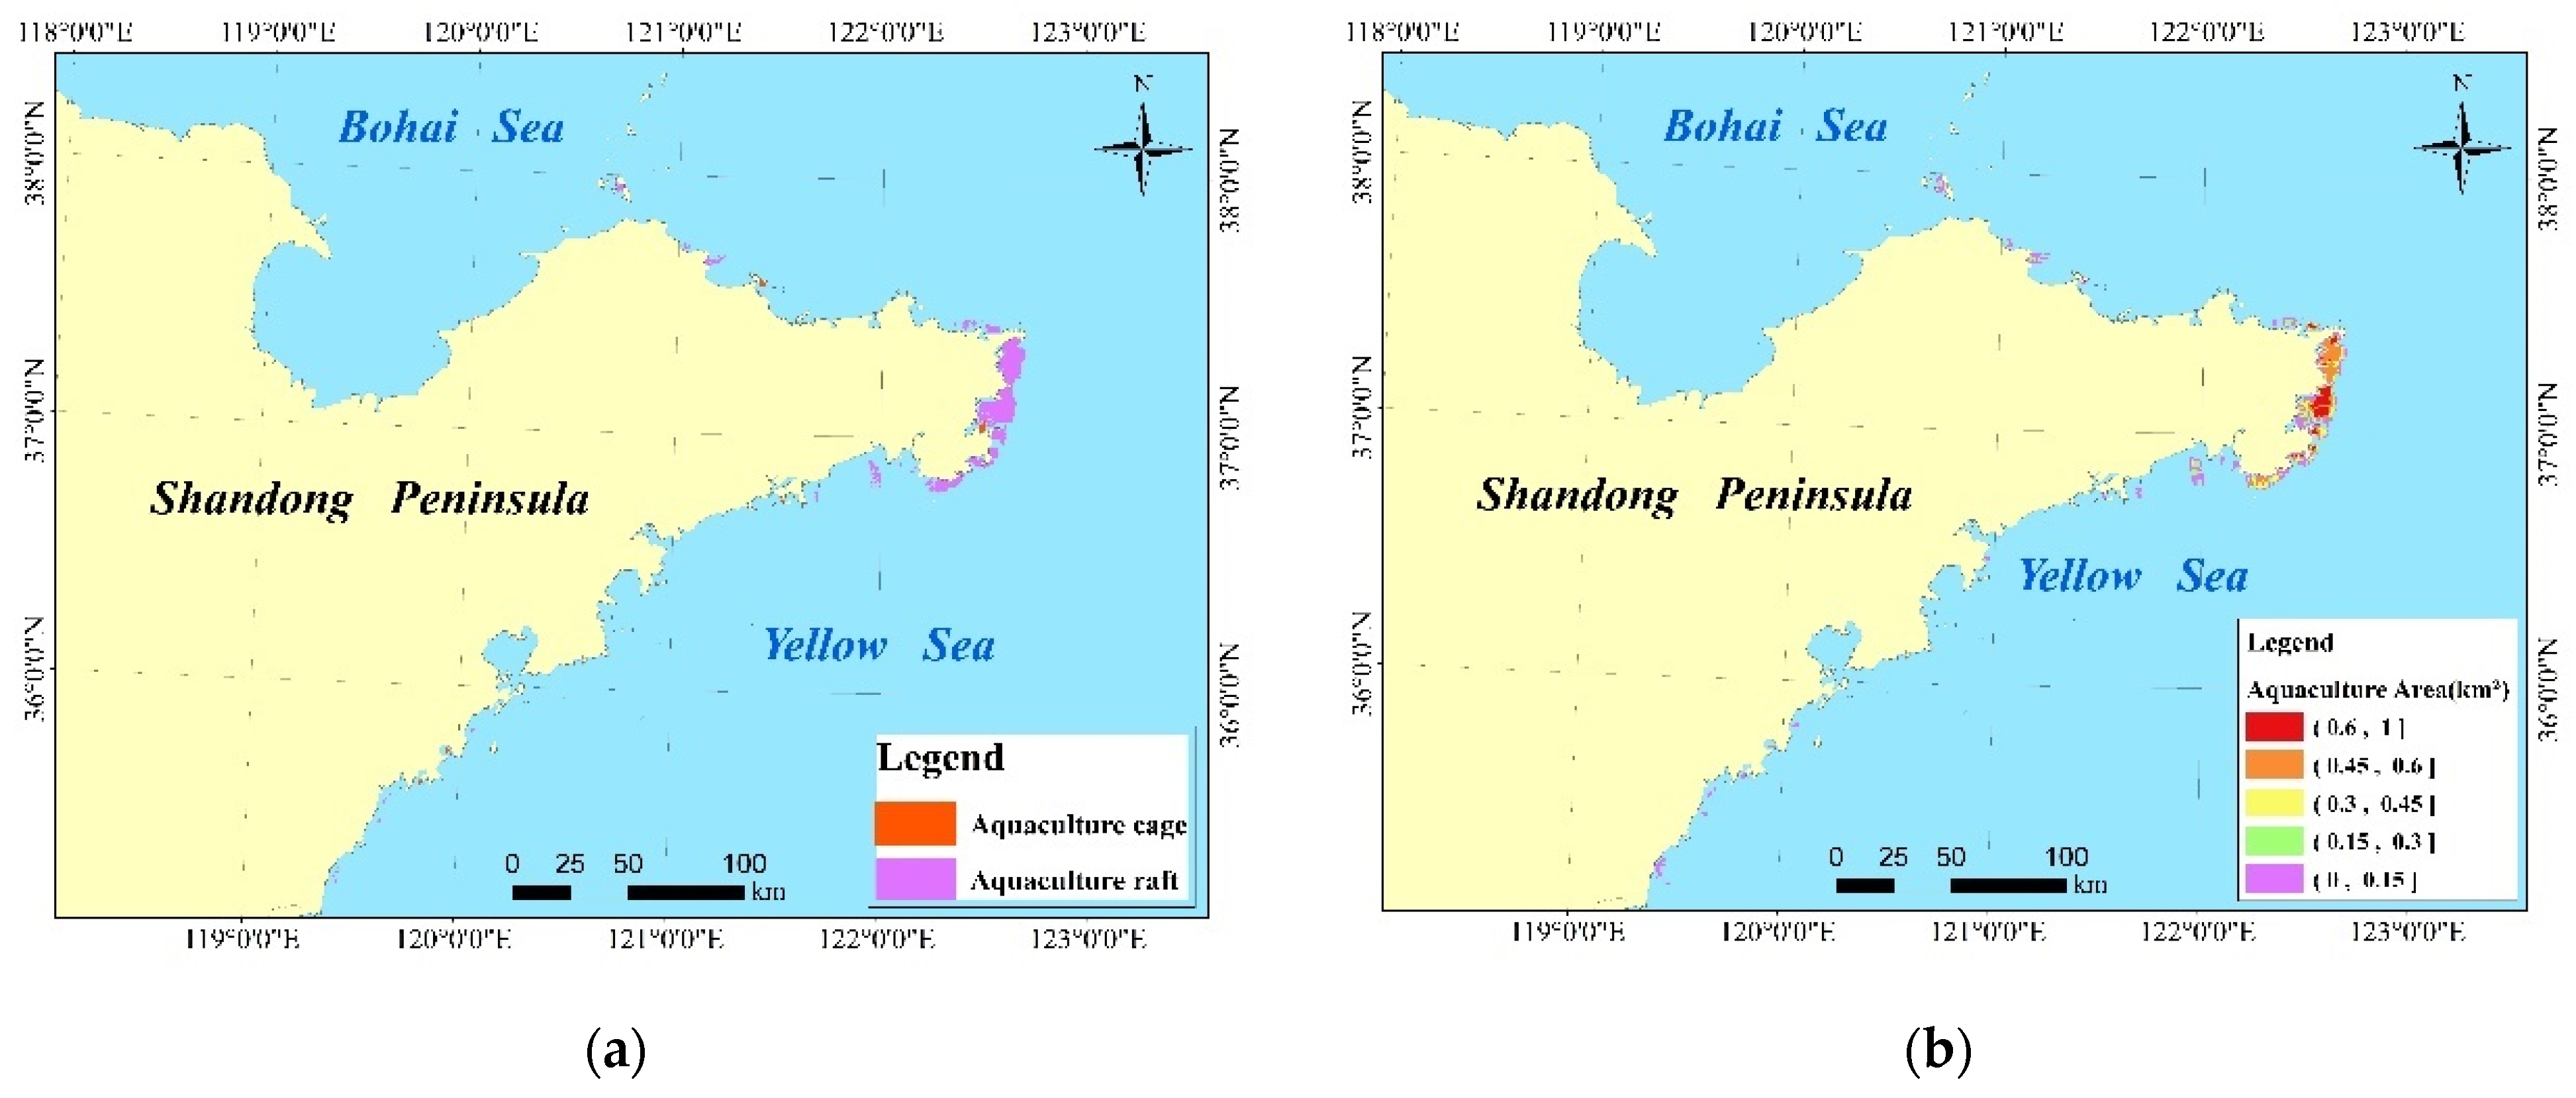
The aquaculture areas of the Shandong Peninsula were mainly concentrated in the east of the peninsula as shown in Figure 7a. We divided the coastal area into grids of 1 km by 1 km and calculated the aquaculture area for each grid. Then, the results could be used as aquaculture density. Finally, we classified the grids by aquaculture density and rendered different colors as shown in Figure 7b.
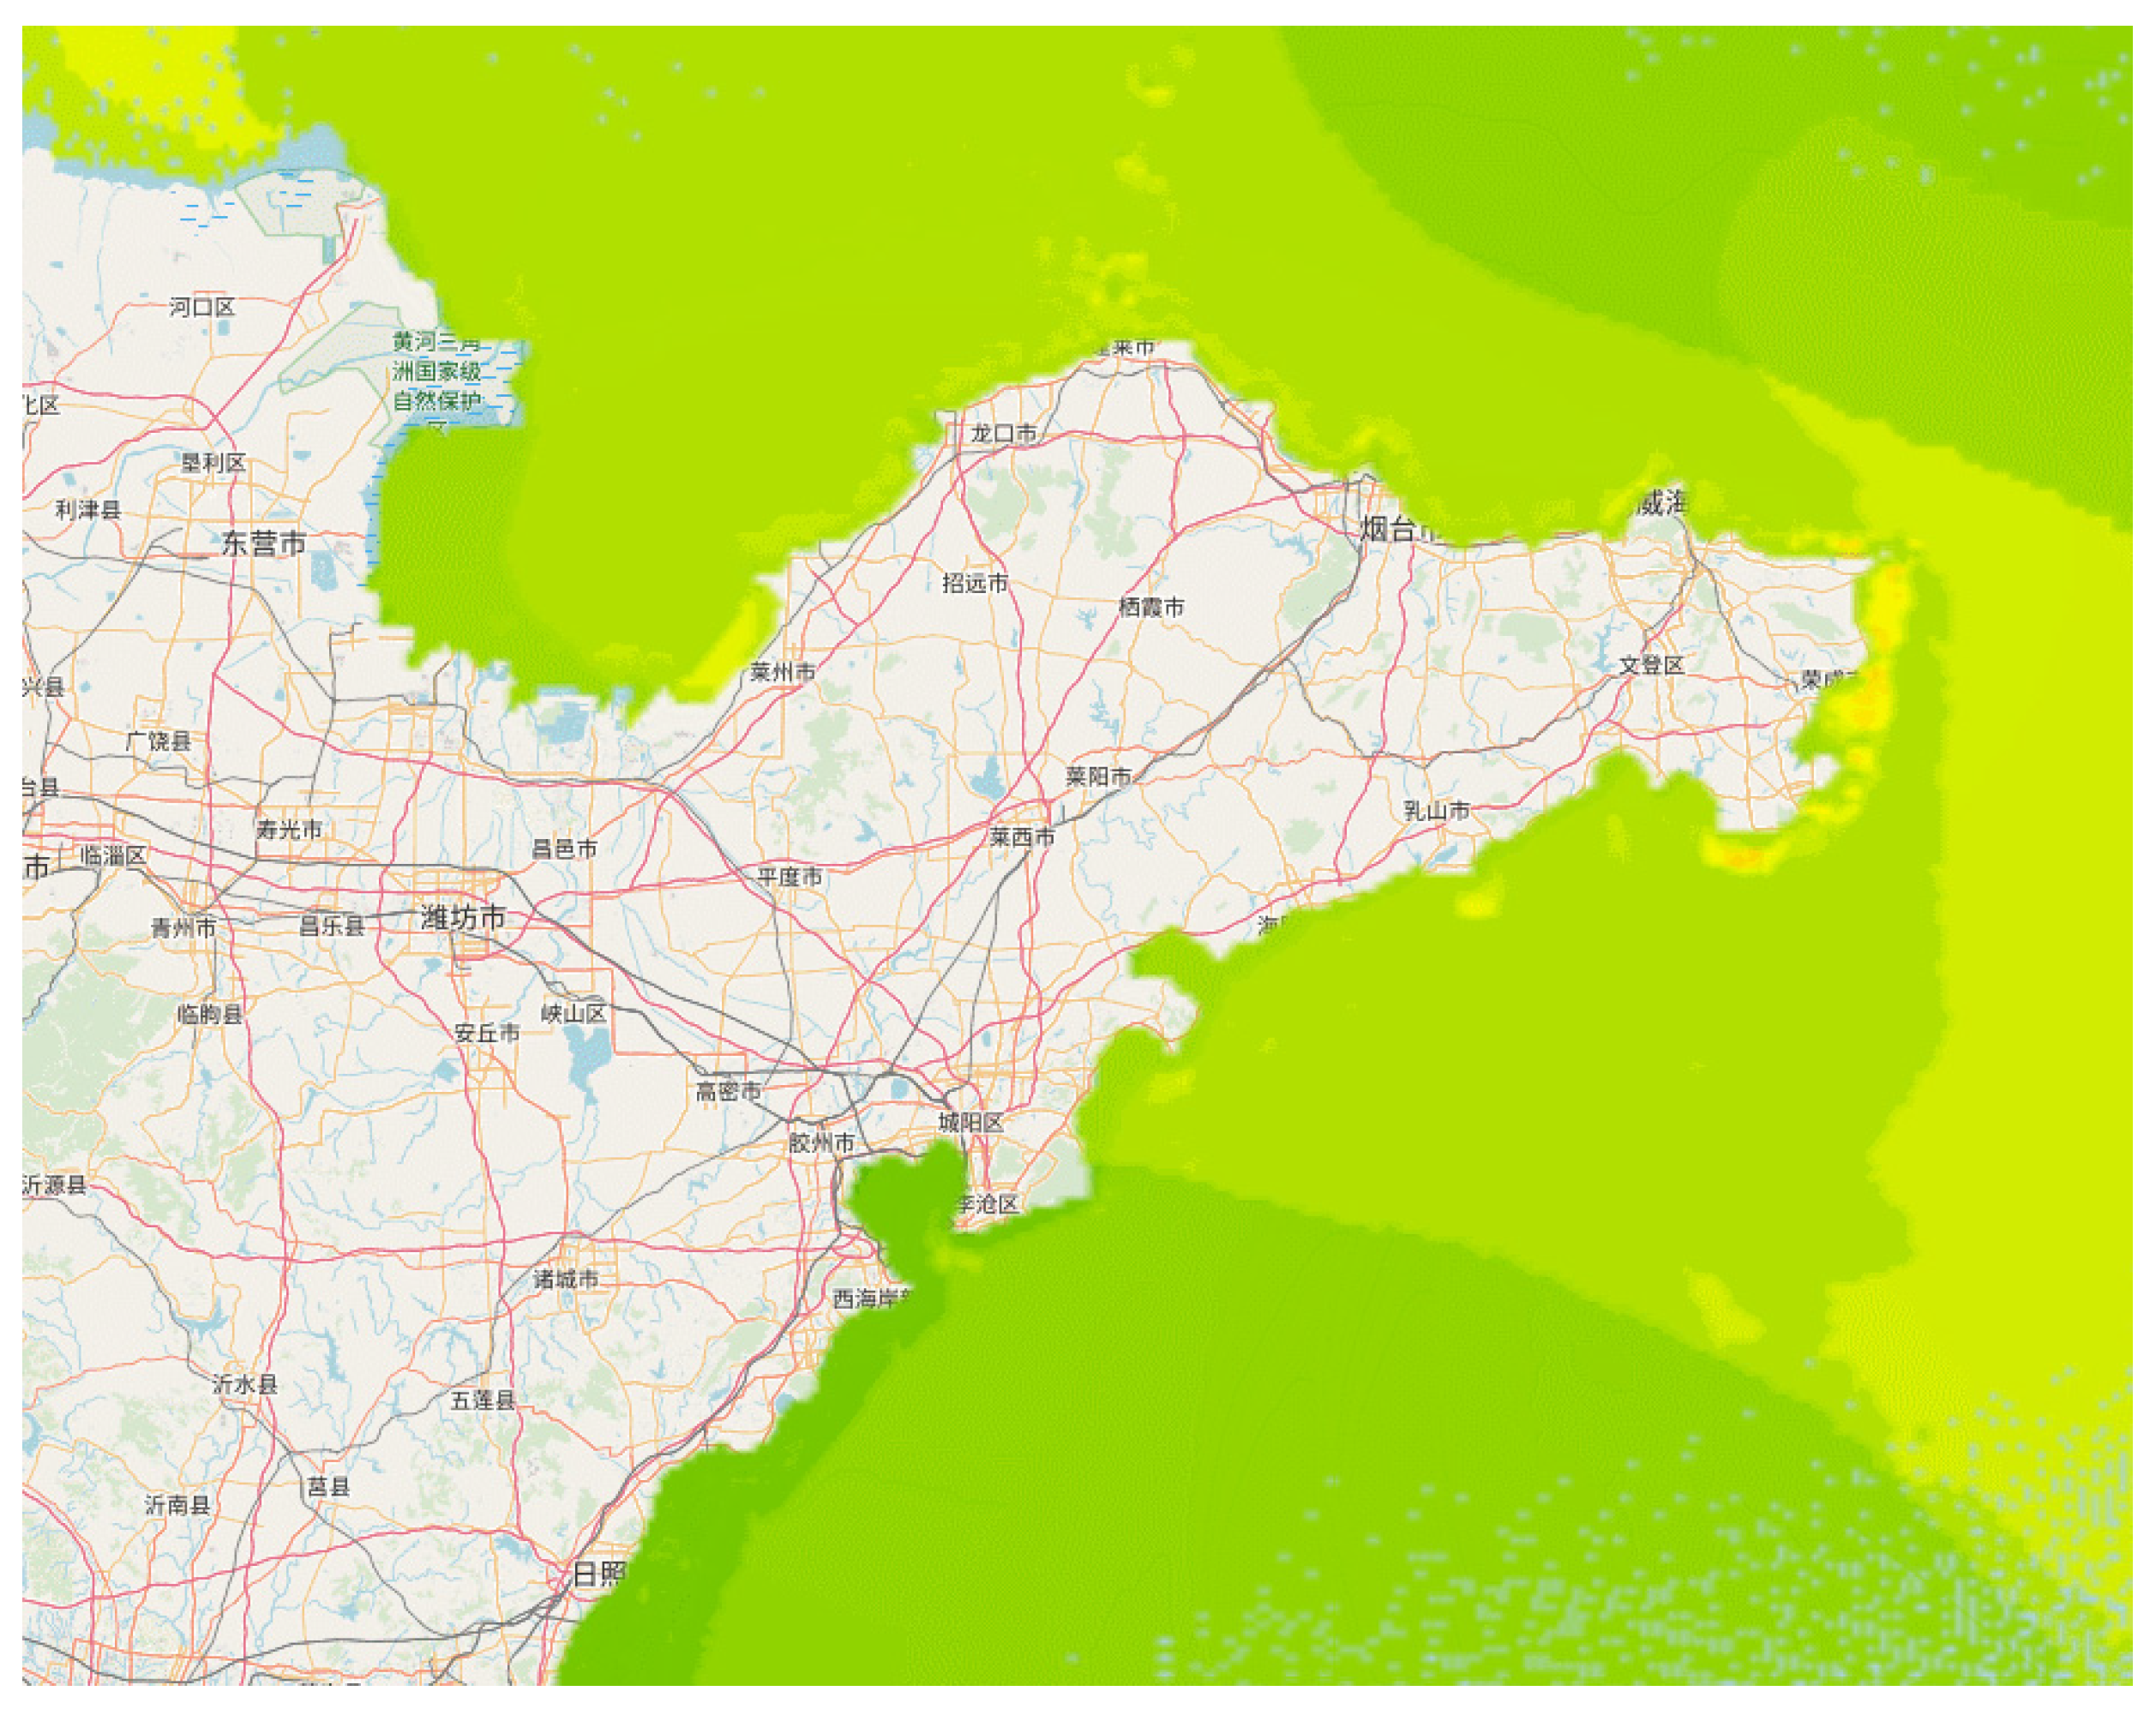
From the result in Figure 7b, it is very clear that in the eastern coastal area around the Shandong Peninsula, the aquaculture density is obviously high. We analyzed the terrain data around the Shandong Peninsula and noticed there was also the most significant terrain slope in the eastern coastal area (Figure 8). According to our multi-factor coupled strengthening effect, there would be a more significant strengthening effect, which could not be ignored.
By using the aquaculture density as a vulnerability index, the comprehensive assessment results showed a clear rise in the east of the peninsula where the aquaculture was located (Figure 9).
4. Discussion
Using the calculation and analysis of the multi-factor coupled strengthening effect of background currents and terrain slopes on coastal ocean waves in China’s coastal waters, it can be seen that the coupled influence cannot be ignored in most cases. Especially during the process of typical storm surges, the strengthening effect will also be significantly enhanced owing to the enhancement of the flow field, thereby aggravating the destructive power and influence of the disaster. Therefore, this multi-factor coupling needs to be considered in the risk assessments of marine dynamic disasters to improve their accuracy and reliability.
The results show that the coupled strengthening effect has a significant impact on the dynamic disaster risk assessment results in the nearshore area, especially in areas with a high flow velocity and large terrain slope. The nearshore area is also the location with the most intensive human activities, and thus the coupled strengthening effect cannot be ignored. From the statistical analysis of Typhoon Matmo, adding this coupling effect increased the risk value in the High Sea States by approximately 12%.
The coupling effect could have been built into the marine numerical model, but this approach would make the entire assessment system complex and unsuitable for the current modularization and lightweight structure. Under the current architectural concept of “low coupling and high cohesion”, as long as the numerical model data are updated, the strengthening effect formula in this paper can be applied directly to calculate the coupled strengthening effect in three directions.
Before the marine dynamic disaster assessment process starts, however, the data sources need to be identified. The data in this paper were from related numerical prediction models as mentioned before. Since marine numerical models for operational forecasts are relatively well studied and developed, we did not discuss them in detail in the paper and were confident in using them directly for subsequent steps.
When extracting the scope of the offshore aquaculture area, we used an object-oriented method, which also enhanced the real-time characteristics of the assessment process. When the input satellite images are updated, the scope of the extracted aquaculture area will also be dynamically updated. Therefore, the approach is convenient for the construction and promotion of the integrated assessment system in the future.
The comprehensive risk assessment method in this paper accomplished an improvement upon the existing assessment methods. Moreover, this paper proposed a method to calculate the multi-factor coupled strengthening effect to improve the comprehensive risk assessment result. Compared with existing papers, we made progress as follows:
- (1)
- Qi [39] used nine indicators to evaluate storm surges in China and calculated the risk from a statistical perspective. We think the statistical risk is not enough to prevent the storm surge, and we aim to build a comprehensive assessment system that might provide dynamic and real-time risk assessment. According to our assessment method, the result could change quickly as soon as the input data are changed or updated.
- (2)
- Wang [53] used ADCIRC+SWAN to simulate the storm surges and waves in the sea near the Shandong Peninsula and finished the hazard assessment using ADCIRC+SWAN data. This group of data is the basis of our research, and our improvement can be considered based on Wang’s achievements. The results in Table 3 could be recognized as the traditional method (without the coupling strengthening effect) and our improved method (with the coupling strengthening effect). We found that the coupling strengthening effect could increase the risk value most significantly in the High Sea States by approximately 12% in the case study.
- (3)
- Liu [54] used not only numerical models, but also remote sensing data to calculate the risk assessment in the Shandong Peninsula, which inspired us to consider the importance of the vulnerability assessment. This is the reason why remote sensing data are indispensable for our study. However, Liu used remote sensing data to calculate the land use status which could be hardly overlaid with numerical model data. We used the remote sensing data to calculate the aquaculture density, and innovatively overlaid the numerical model data and vulnerability data together, which could make the comprehensive assessment more reliable.
However, the actual process of disaster prevention and mitigation, similar to the numerical forecast results, can only be used as an important reference in the process of forecast consultation, and the marine dynamic disaster assessment model also requires a lot of empirical input and correction. Although this paper declared the important multi-factor coupled strengthening effect and proposed a method to determine the weights using historical data, in practical applications, it is still necessary to adjust the corresponding weights according to the actual terrain, disaster prevention facilities, economic vulnerability, etc.
For example, this paper used the historical data in the China Marine Disaster Bulletin to calculate the weights of tide levels and waves, but for small areas and high resolutions, the weights are not necessarily appropriate, and more local historical data are required for calculation. Meanwhile, during the process of disasters such as storm surges, disasters of the same level can cause different damages and losses in different places due to differences in local topography. This is also an important reason for our concern about the multi-factor coupled strengthening effect. We hope that by adding this effect, we can better explain the difference of this destruction.
From the results of the aquaculture density, it is very clear that the aquaculture density in the eastern part of the Shandong Peninsula is very high, which coincides with the area with a significant terrain slope around the Shandong Peninsula. In the process of marine dynamic disasters, according to our calculations, where there is a significant terrain slope, there will be a higher multi-factor coupled strengthening effect, which might increase the destructive power of the disaster itself. Meanwhile, in the area with a significant terrain slope, as the aquaculture density is high, it is very easy to bring higher economic losses. In this case, it is suggested to further improve the weight of the multi-factor coupled strengthening effect in practical application, so that the disaster assessment model can finally play a real decision-making role in the process of disaster prevention and mitigation.
5. Conclusions
The assessment of marine dynamic disasters is a comprehensive research process that is driven by practical requirements such as marine management, disaster prevention, and disaster mitigation. However, improving the accuracy and credibility of the assessment results is also a difficult problem.
On the basis of ocean numerical models, the current study used an indicator system method to evaluate the major disaster-causing factors and proposed an improved method from the perspective of the dynamic mechanism. The coupled strengthening effect of the background current and the terrain slope on ocean waves was added to the indicator system which improved the accuracy of the marine dynamic disaster risk assessment. In addition, by using the aquaculture distribution extracted from remote sensing data as the basis for vulnerability assessment, we were able to establish a comprehensive assessment system with a flexible structure. Changes in the results of numerical models can lead to changes in the results of the risk assessment; thus, marine dynamic disaster assessments for different application scenarios can be created on demand.
Remote sensing technology played an important role not only in the validation of the coupled strengthening effect but also in applying the risk assessment results in this study. First, the comprehensive assessment results considering the disaster-affected objectives are more useful than the single risk assessment results because they could reflect different levels of actual losses or damage. The distribution status of the disaster-affected objectives which is recognized as vulnerability is calculated by means of remote sensing inversion. Secondly, we used the remote sensing data not to calculate the land use status in the land area as usual, but to calculate the aquaculture density in the sea area. With this innovative change in the disaster-affected objectives, the numerical model data and vulnerability data could be spatially overlaid, which could increase the reliability of the comprehensive assessment. Finally, we aim to build a comprehensive assessment structure that could respond to the changes in real-time data. As the input source of the assessment, the remote sensing data could also extract the aquaculture density of different time series or different locations. In this way, the assessment process could be more dynamic and practical.
Author Contributions
All of the authors contributed to this manuscript. Conceptualization, L.Z., Y.Y. and T.S.; methodology, L.Z. and M.S.; software, L.Z., Y.L. and Z.J.; validation, L.Z., M.S. and Y.L.; formal analysis, Z.J.; investigation, Y.Y. and T.S.; resources, Z.J.; data curation, M.S.; writing—original draft preparation, L.Z.; writing—review and editing, M.S., Y.L. and Y.Y.; visualization, L.Z.; supervision, Y.Y.; project administration, T.S.; funding acquisition, Y.Y. All authors have read and agreed to the published version of the manuscript.
Funding
Please add: This work is supported by the National Key Research and Development Program of China (Grant No. 2021YFC3101604, 2022YFC3104803 and 2016YFC1402000) and the National Natural Science Foundation of China (Grant No. 41706114).
Data Availability Statement
The data that support this study are not publicly available. However, data are available from the authors upon reasonable request.
Acknowledgments
We appreciate the reviewers for their careful reading and valuable comments that helped us to improve the manuscript substantially.
Conflicts of Interest
The authors declare no conflict of interest.
References
- Ellis, J.T.; Sherman, D.J. Chapter 1 - Perspectives on Coastal and Marine Hazards and Disasters. In Coastal and Marine Hazards, Risks, and Disasters; Shroder, J.F., Ellis, J.T., Sherman, D.J., Eds.; Elsevier: Boston, MA, USA, 2015; pp. 1–13. [Google Scholar]
- Kuang, C.; Liang, H.; Gu, J.; Song, H.; Dong, Z. Morphological responses of unsheltered channel-shoal system to a major storm: The combined effects of surges, wind-driven currents and waves. Mar. Geol. 2020, 427, 106245. [Google Scholar] [CrossRef]
- Du, X.; Li, X.; Zhang, S.; Zhao, T.; Hou, Q.; Jin, X.; Zhang, J. High-accuracy estimation method of typhoon storm surge disaster loss under small sample conditions by information diffusion model coupled with machine learning models. Int. J. Disaster Risk Reduct. 2022, 2022, 103307. [Google Scholar] [CrossRef]
- Liu, Q.; Ruan, C.; Guo, J.; Li, J.; Lian, X.; Yin, Z.; Fu, D.; Zhong, S. Storm Surge Hazard Assessment of the Levee of a Rapidly Developing City-Based on LiDAR and Numerical Models. Remote Sens. 2020, 12, 3723. [Google Scholar] [CrossRef]
- Fang, J.; Liu, W.; Yang, S.; Brown, S.; Nicholls, R.J.; Hinkel, J.; Shi, X.; Shi, P. Spatial-temporal changes of coastal and marine disasters risks and impacts in Mainland China. Ocean. Coast. Manag. 2017, 139, 125–140. [Google Scholar] [CrossRef]
- Schweiger, C.; Kaehler, C.; Koldrack, N.; Schuettrumpf, H. Spatial and temporal evaluation of storm-induced erosion modelling based on a two-dimensional field case including an artificial unvegetated research dune. Coast. Eng. 2020, 161, 103752. [Google Scholar] [CrossRef]
- Bleck, R.; Halliwell, G.; Wallcraft, A.; Carroll, S.; Kelly, K.; Rushing, K. HYbrid Coordinate Ocean Model (HYCOM) User’s Manual. Available online: https://hycom.org/attachments/063_hycom_users_manual.pdf (accessed on 24 February 2020).
- Gurvan, M.; NEMO Team. NEMO Ocean Engine. Available online: https://www.nemo-ocean.eu/wp-content/uploads/NEMO_book.pdf (accessed on 24 February 2020).
- Stephen, M.G.; Ronald, J.S.; Alistair, J.A.; Kirk, B.; Keith, W.D.; Robert, H.; Matthew, J.H.; Ronald, C.P.; Anthony, R. A Historical Introduction to MOM. Available online: https://mom-ocean.github.io/assets/pdfs/mom_history_2017.09.19.pdf (accessed on 24 February 2020).
- Katherine, S.H. Technical Manual for a Coupled Sea-Ice/Ocean Circulation Model (Version 5). Available online: https://github.com/kshedstrom/roms_manual/blob/master/roms_manual.pdf (accessed on 24 February 2020).
- George, L.M. Users Guide for a Three-Dimensional, Primitive Equation, Numerical Ocean Model. Available online: http://www.ccpo.odu.edu/POMWEB/UG.10-2002.pdf (accessed on 24 February 2020).
- Qi, J.; Chen, C.; Beardsley, R.C.; Perrie, W.; Cowles, G.W.; Lai, Z. An unstructured-grid finite-volume surface wave model (FVCOM-SWAVE): Implementation, validations and applications. Ocean. Model. 2009, 28, 153–166. [Google Scholar] [CrossRef]
- Heaps, N.S. A two-dimensional numerical sea model. Philos. Trans. R. Soc. London. Ser. A Math. Phys. Sci. 1969, 265, 93–137. [Google Scholar]
- Blumberg, A.F.; Mellor, G.L. A Description of a Three-Dimensional Coastal Ocean Circulation Model. Three-Dimens. Coast. Ocean. Model. 1987, 4, 1–16. [Google Scholar] [CrossRef]
- Chen, C.; Liu, H.; Beardsley, R.C. An unstructured grid, finite-volume, three-dimensional, primitive equations ocean model: Application to coastal ocean and estuaries. J. Atmos. Ocean. Technol. 2003, 20, 159–186. [Google Scholar] [CrossRef]
- Huang, H.; Chen, C.; Cowles, G.W.; Winant, C.D.; Beardsley, R.C.; Hedstrom, K.S.; Haidvogel, D.B. FVCOM validation experiments: Comparisons with ROMS for three idealized barotropic test problems. J. Geophys. Res. Ocean. 2008, 113. [Google Scholar] [CrossRef]
- Pierson, W.J. Practical Methods for Observing and Forecasting Ocean Waves by Means of Wave Spectra and Statistics; US Government Printing Office: Washington, DC, USA, 1955; Volume 603. [Google Scholar]
- Mitsuyasu, H. On the Growth of the Spectrum of Wind-Generated Waves. Coast. Eng. Jpn. 1970, 13, 1–14. [Google Scholar] [CrossRef]
- Group, T.W. The WAM model—A third generation ocean wave prediction model. J. Phys. Oceanogr. 1988, 18, 1775–1810. [Google Scholar] [CrossRef]
- Tolman, H.L. A third-generation model for wind waves on slowly varying, unsteady, and inhomogeneous depths and currents. J. Phys. Oceanogr. 1991, 21, 782–797. [Google Scholar] [CrossRef]
- Sun, M.; Yang, Y.; Yin, X.; Du, J. Data assimilation of ocean surface waves using Sentinel-1 SAR during typhoon Malakas. Int. J. Appl. Earth Obs. Geoinf. 2018, 70, 35–42. [Google Scholar] [CrossRef]
- Longuet-Higgins, M.S.; Stewart, R.W. Radiation stress and mass transport in gravity waves, with application to ‘surf beats’. J. Fluid Mech. 1962, 13, 481–504. [Google Scholar] [CrossRef]
- Signell, R.P.; Beardsley, R.C.; Graber, H.; Capotondi, A. Effect of wave-current interaction on wind-driven circulation in narrow, shallow embayments. J. Geophys. Res. Ocean. 1990, 95, 9671–9678. [Google Scholar] [CrossRef]
- Janssen, P.A. Quasi-linear theory of wind-wave generation applied to wave forecasting. J. Phys. Oceanogr. 1991, 21, 1631–1642. [Google Scholar] [CrossRef]
- Wolf, J.; Hubbert, K.; Flather, R.A. A Feasibility Study for the Development of a Joint Surge and Wave Model; Proudman Oceanographic Laboratory: Liverpool, UK, 1988. [Google Scholar]
- Mastenbroek, C.; Burgers, G.; Janssen, P. The dynamical coupling of a wave model and a storm surge model through the atmospheric boundary layer. J. Phys. Oceanogr. 1993, 23, 1856–1866. [Google Scholar] [CrossRef]
- Zhang, M.Y.; Li, Y.S. The synchronous coupling of a third-generation wave model and a two-dimensional storm surge model. Ocean. Eng. 1996, 23, 533–543. [Google Scholar] [CrossRef]
- Xie, L.; Pietrafesa, L.; Wu, K. A numerical study of wave-current interaction through surface and bottom stresses: Coastal ocean response to Hurricane Fran of 1996. J. Geophys. Res. Ocean. 2003, 108. [Google Scholar] [CrossRef]
- Jelesnianski, C.P. A numerical calculation of storm tides induced by a tropical storm impinging on a continental self. Mon. Weather. Rev. 1965, 93, 343–358. [Google Scholar] [CrossRef]
- William, J.P.; Arthur, A.A. Natural Hazard Risk Assessment and Public Policy: Anticipating the Unexpected; Cambridge University Press: Bristol, UK, 1983. [Google Scholar]
- McInnes, K.; Walsh, K.; Hubbert, G.; Beer, T. Impact of sea-level rise and storm surges on a coastal community. Nat. Hazards 2003, 30, 187–207. [Google Scholar] [CrossRef]
- Wahl, T.; Mudersbach, C.; Jensen, J. Statistical assessment of storm surge scenarios within integrated risk analyses. Coast. Eng. J. 2015, 57, 1540003. [Google Scholar] [CrossRef]
- Zhang, K.; Li, Y.; Liu, H.; Xu, H.; Shen, J. Comparison of three methods for estimating the sea level rise effect on storm surge flooding. Clim. Change 2013, 118, 487–500. [Google Scholar] [CrossRef]
- Zhao, X.; Li, H.; Ding, L.; Liu, M. Research and application of a hybrid system based on interpolation for forecasting direct economic losses of marine disasters. Int. J. Disaster Risk Reduct. 2019, 37, 101121. [Google Scholar] [CrossRef]
- Yi, X.; Sheng, K.; Wang, Y.; Wang, S. Can economic development alleviate storm surge disaster losses in coastal areas of China? Mar. Policy 2021, 129, 104531. [Google Scholar] [CrossRef]
- Liang, C.; Cheng, B.; Xiao, B.; He, C.; Liu, X.; Jia, N.; Chen, J. Semi-/Weakly-Supervised Semantic Segmentation Method and Its Application for Coastal Aquaculture Areas Based on Multi-Source Remote Sensing Images—Taking the Fujian Coastal Area (Mainly Sanduo) as an Example. Remote Sens. 2021, 13, 1083. [Google Scholar] [CrossRef]
- Wu, Y.-L.; Lee, M.-A.; Chen, L.-C.; Chan, J.-W.; Lan, K.-W. Evaluating a Suitable Aquaculture Site Selection Model for Cobia (Rachycentron canadum) during Extreme Events in the Inner Bay of the Penghu Islands, Taiwan. Remote Sens. 2020, 12, 2689. [Google Scholar] [CrossRef]
- Ministry of Natural Resources of the People’s Repubulic of China. China Marine Disaster Bulletin 2018; Ministry of Natural Resources of the People’s Repubulic of China: Beijing, China, 2019; p. 36. [Google Scholar]
- Qi, P.; Du, M. Multi-factor evaluation indicator method for the risk assessment of atmospheric and oceanic hazard group due to the attack of tropical cyclones. Int. J. Appl. Earth Obs. Geoinf. 2018, 68, 1–7. [Google Scholar] [CrossRef]
- Longuet-Higgins, M.S.; Stewart, R. Radiation stresses in water waves; a physical discussion, with applications. Deep. Sea Res. Oceanogr. Abstr. 1964, 11, 529–562. [Google Scholar] [CrossRef]
- Longuet-Higgins, M.S. Longshore currents generated by obliquely incident sea waves: 1. J. Geophys. Res. 1970, 75, 6778–6789. [Google Scholar] [CrossRef]
- Xie, L.; Wu, K.; Pietrafesa, L.; Zhang, C. A numerical study of wave-current interaction through surface and bottom stresses: Wind-driven circulation in the South Atlantic Bight under uniform winds. J. Geophys. Res. Ocean. 2001, 106, 16841–16855. [Google Scholar] [CrossRef]
- Cobb, M.; Blain, C.A. Simulating wave-tide induced circulation in Bay St. Louis, MS with a coupled hydrodynamic-wave model. In Proceedings of the OCEANS'02 MTS/IEEE, Biloxi, MI, USA, 29–31 October 2002; pp. 1494–1500. [Google Scholar]
- Mellor, G. The three-dimensional current and surface wave equations. J. Phys. Oceanogr. 2003, 33, 1978–1989. [Google Scholar] [CrossRef]
- Haas, K.A.; Warner, J.C. Comparing a quasi-3D to a full 3D nearshore circulation model: SHORECIRC and ROMS. Ocean. Model. 2009, 26, 91–103. [Google Scholar] [CrossRef]
- Wang, J.; Shen, Y. Development and validation of a three-dimensional, wave-current coupled model on unstructured meshes. Sci. China Phys. Mech. Astron. 2011, 54, 42–58. [Google Scholar] [CrossRef]
- Ellingsen, S.Å.; Li, Y. Approximate dispersion relations for waves on arbitrary shear flows. J. Geophys. Res. Ocean. 2017, 122, 9889–9905. [Google Scholar] [CrossRef]
- Wandres, M.; Wijeratne, E.; Cosoli, S.; Pattiaratchi, C. The effect of the Leeuwin Current on offshore surface gravity waves in southwest Western Australia. J. Geophys. Res. Ocean. 2017, 122, 9047–9067. [Google Scholar] [CrossRef]
- Kukulka, T.; Jenkins III, R.L.; Kirby, J.T.; Shi, F.; Scarborough, R.W. Surface wave dynamics in Delaware Bay and its adjacent coastal shelf. J. Geophys. Res. Ocean. 2017, 122, 8683–8706. [Google Scholar] [CrossRef]
- Lee, J.K.; Jung, S.J.; Kim, S.D.; Jang, W.H.; Ham, D.H. Component identification method with coupling and cohesion. In Proceedings of the Proceedings Eighth Asia-Pacific Software Engineering Conference, Macao, China, 4–7 December 2001; pp. 79–86. [Google Scholar]
- Yuan, Y.; Han, L.; Qiao, F.; Yang, Y.; Lu, M. A unified linear theory of wavelike perturbations under general ocean conditions. Dyn. Atmos. 2011, 51, 55–74. [Google Scholar] [CrossRef]
- Wang, J.; Sui, L.; Yang, X.; Wang, Z.; Liu, Y.; Kang, J.; Lu, C.; Yang, F.; Liu, B. Extracting Coastal Raft Aquaculture Data from Landsat 8 OLI Imagery. Sensors 2019, 19, 1221. [Google Scholar] [CrossRef]
- Wang, N.; Hou, Y.; Mo, D.; Li, J. Hazard assessment of storm surges and concomitant waves in Shandong Peninsula based on long-term numerical simulations. Ocean. Coast. Manag. 2021, 213. [Google Scholar] [CrossRef]
- Liu, Q.; Ruan, C.; Zhong, S.; Li, J.; Yin, Z.; Lian, X. Risk assessment of storm surge disaster based on numerical models and remote sensing. Int. J. Appl. Earth Obs. Geoinf. 2018, 68, 20–30. [Google Scholar] [CrossRef]
Figure 1.
Proportion of major disaster-causing factors in direct economic losses and human losses from marine disasters in China.
Figure 1.
Proportion of major disaster-causing factors in direct economic losses and human losses from marine disasters in China.

Figure 2.
Indicator system for marine dynamic disaster risk assessment.

Figure 3.
Experimental results of the effect of background current and terrain slope on coastal ocean waves.
Figure 3.
Experimental results of the effect of background current and terrain slope on coastal ocean waves.

Figure 4.
Change in coastal ocean waves at different times during the storm surge process at the same location.
Figure 4.
Change in coastal ocean waves at different times during the storm surge process at the same location.

Figure 5.
Change of the coastal ocean waves caused by nearshore strengthening effect.

Figure 6.
Comparison between (a) the assessment results without the coupled strengthening effect; and (b) the assessment results with the coupled strengthening effect.
Figure 6.
Comparison between (a) the assessment results without the coupled strengthening effect; and (b) the assessment results with the coupled strengthening effect.

Figure 7.
Aquaculture areas extracted from Landsat 8. (a) Classified by aquaculture type; (b) Classified by aquaculture density.
Figure 7.
Aquaculture areas extracted from Landsat 8. (a) Classified by aquaculture type; (b) Classified by aquaculture density.

Figure 8.
Terrain slope around Shandong Peninsula.

Figure 9.
Comprehensive assessment result considering risk assessment and vulnerability assessment.


Table 1.
Statistics of losses caused by storm surges and huge waves in China.
| Year | Economic Loss (CNY 100 Million) | Human Loss (Person) | ||
|---|---|---|---|---|
| Storm Surges | Huge Waves | Storm Surges | Huge Waves | |
| 2000 | 115.4 | 1.7 | 15 | 63 |
| 2001 | 87 | 3.1 | 136 | 265 |
| 2002 | 63.1 | 2.5 | 30 | 94 |
| 2003 | 78.77 | 1.15 | 25 | 103 |
| 2004 | 52.15 | 2.07 | 49 | 91 |
| 2005 | 329.8 | 1.91 | 137 | 234 |
| 2006 | 217.11 | 1.34 | 327 | 165 |
| 2007 | 87.15 | 1.16 | 18 | 143 |
| 2008 | 192.24 | 0.55 | 56 | 96 |
| 2009 | 84.97 | 8.03 | 57 | 38 |
| 2010 | 65.79 | 1.73 | 5 | 132 |
| 2011 | 48.81 | 4.42 | 0 | 68 |
| 2012 | 126.29 | 6.96 | 9 | 59 |
| 2013 | 153.96 | 6.3 | 0 | 121 |
| 2014 | 135.78 | 0.12 | 6 | 18 |
| 2015 | 72.62 | 0.06 | 7 | 23 |
| 2016 | 45.94 | 0.37 | 0 | 60 |
| 2017 | 55.77 | 0.27 | 6 | 11 |
| 2018 | 44.56 | 0.35 | 3 | 70 |
Table 2.
Weights of storm surge and huge wave indicators calculated with the entropy method.
| Indicator | Weight of Economic Loss | Weight of Human Loss | Average Weight |
|---|---|---|---|
| Storm Surge Indicator | 0.277 | 0.806 | 0.542 |
| Huge Wave Indicator | 0.723 | 0.194 | 0.458 |
Table 3.
Results of the assessment with and without the coupled strengthening effect.
| Hour | Results of Improved Method (with Coupling Strengthening Effect) | Results of Traditional Method (without Coupling Strengthening Effect) | Rate of Change (%) |
|---|---|---|---|
| 73 | 0.394532 | 0.348833 | 13.10054 |
| 74 | 0.435645 | 0.388919 | 12.01433 |
| 75 | 0.498851 | 0.451626 | 10.45666 |
| 76 | 0.565385 | 0.516738 | 9.414249 |
| 77 | 0.584519 | 0.534502 | 9.357682 |
| 78 | 0.564823 | 0.512988 | 10.10452 |
| 79 | 0.497333 | 0.44538 | 11.66487 |
| 80 | 0.409582 | 0.357683 | 14.50978 |
| 81 | 0.420795 | 0.368878 | 14.07430 |
| 82 | 0.438726 | 0.383482 | 14.40589 |
| 83 | 0.463559 | 0.406135 | 14.13914 |
| 84 | 0.483525 | 0.426763 | 13.30059 |
| 85 | 0.485793 | 0.429635 | 13.07110 |
| 86 | 0.489241 | 0.435446 | 12.35400 |
| 87 | 0.498828 | 0.447249 | 11.53250 |
| 88 | 0.508457 | 0.458283 | 10.94826 |
| 89 | 0.526286 | 0.47522 | 10.74576 |
Disclaimer/Publisher’s Note: The statements, opinions and data contained in all publications are solely those of the individual author(s) and contributor(s) and not of MDPI and/or the editor(s). MDPI and/or the editor(s) disclaim responsibility for any injury to people or property resulting from any ideas, methods, instructions or products referred to in the content. |
© 2023 by the authors. Licensee MDPI, Basel, Switzerland. This article is an open access article distributed under the terms and conditions of the Creative Commons Attribution (CC BY) license (https://creativecommons.org/licenses/by/4.0/).
Share and Cite
MDPI and ACS Style
Zhou, L.; Sun, M.; Liu, Y.; Yang, Y.; Su, T.; Jia, Z. An Integrated Multi-Factor Coupling Approach for Marine Dynamic Disaster Assessment in China’s Coastal Waters. Remote Sens. 2023, 15, 838. https://doi.org/10.3390/rs15030838
AMA Style
Zhou L, Sun M, Liu Y, Yang Y, Su T, Jia Z. An Integrated Multi-Factor Coupling Approach for Marine Dynamic Disaster Assessment in China’s Coastal Waters. Remote Sensing. 2023; 15(3):838. https://doi.org/10.3390/rs15030838
Chicago/Turabian StyleZhou, Lin, Meng Sun, Yueming Liu, Yongzeng Yang, Tianyun Su, and Zhen Jia. 2023. "An Integrated Multi-Factor Coupling Approach for Marine Dynamic Disaster Assessment in China’s Coastal Waters" Remote Sensing 15, no. 3: 838. https://doi.org/10.3390/rs15030838
Note that from the first issue of 2016, this journal uses article numbers instead of page numbers. See further details here.