

Quantifying the Ecological Effectiveness of Poverty Alleviation Relocation in Karst Areas


1
School of Karst Science, Guizhou Normal University, Guiyang 550001, China
2
College of Tourism & Aviation Culture, Guizhou City Vocational College, Guiyang 550046, China
3
National Engineering Research Center for Karst Rocky Desertifification Control, Guiyang 550001, China
4
The Engineering Branch of the Third Institute of Surveying and Mapping of Guizhou Province, Guiyang 550001, China
*
Author to whom correspondence should be addressed.
Remote Sens. 2022, 14(23), 5920; https://doi.org/10.3390/rs14235920
Submission received: 17 October 2022
/
Revised: 19 November 2022
/
Accepted: 21 November 2022
/
Published: 23 November 2022
(This article belongs to the Special Issue Remote Sensing and GIS Technologies for Sustainable Ecosystem Management)
Abstract
:During the 13th Five-Year Plan period (2015–2020), the Poverty alleviation relocation (PAR), led by the Chinese government in the karst regions of southwest China, aimed to cope with poverty and ameliorate the ecological environment. Nevertheless, few research results have involved quantitative assessment of the ecological effectiveness of PAR. Moreover, few studies on the ecological effects of migration relocation have distinguished the effects of relocation on climatic factors and other ecological restoration projects concerning the ecological environment. It remains unclear to what extent PAR affects the regional ecological environment. In order to quantitatively assess the extent of PAR’s ecological restoration contribution, we adopted the Remote Sensing Ecological Index (RSEI) model, which integrates the four more intuitive and critical influencing factors of greenness, moisture, dryness, and heat. On the Google earth engine (GEE) platform, utilizing its powerful remote sensing data storage capacity and computational capability, we quantitatively assessed the spatial and temporal distribution characteristics of ecological environmental quality (EEQ). As revealed by our research findings, overall EEQ showed a fluctuating upward trend over the period 1996–2021 in the study area, exhibiting an improvement of 22.66%. Mann–Kendall mutation test curves showed the most significant improvement occurred after 2015, with an improvement of 8.06%. Based on the residual analysis model, in order to remove the influence of climatic factors and other anthropogenic activities, and to assess the driving effectiveness of PAR, PAR was remarkedly effective in ameliorating EEQ, causing the RSEI to improve by 0.0221–0.0422. The LISA correlation model further analyzed that 44.91% of regional PAR implementation exerted a remarkable influence on RSEI change, of which 54.59% belonged to positive correlation. Aside from that, we also found that not all areas involved in PAR experienced ameliorated RSEI. In the western region, where the human–land conflict is prominent and the ecology is more fragile, PAR exhibited a significant effect in ameliorating EEQ, but in the eastern region, where the EEQ foundation is better, PAR did not show significant effect, and, thus, the ecological restoration effect of PAR exhibited noticeable geographical suitability.
1. Introduction
The karst region in southwest China is located among the Mountains of Southwest China global biodiversity hotspots, and is one of the richest and most concentrated areas of rare and endangered species in China [1,2]. It has seven World Natural Heritage sites, accounting for 50% of the total in China, and is the Yangtze River and Pearl River’s ecological protection barrier which are located in the upper reaches, The region is one of the 200 global conservation priority eco-regions in the world [3], and plays an irreplaceable role in China’s ecological security pattern. Environmental changes and human interferences could influence its ecological health [4]. The impact of human interference on the region’s ecosystems has increased remarkedly since the 1970s. The karst region in southwest China covers an area of more than 120,000 km2 of stone desertification, a total of 220 million people live in the region, and the huge population pressure (217 people/km2) gives rise to the overuse of limited resources, and ecological damage. The ecological degradation represented by stone desertification, owing to strong and continuous human activities, has become the biggest impediment to regional social development [5,6]. EEQ reflects the suitability of an ecological environment for human survival and sustainable socio-economic development in a certain spatial and temporal range [7], and is primarily affected by natural climatic conditions and human activities [8]. As a result, understanding the impact of human activities on the EEQ in ecologically fragile areas is not only a paramount issue for human beings to cope with current and future environmental problems, but also advantageous for exploring the harmonious development model of human–Earth in karst ecologically fragile areas. In the period 2015–2020, the Chinese government’s poverty alleviation project aimed at eliminating poverty, and the implementation of PAR was its most critical project. The PAR population in the karst region of southwest China accounts for 63% of the total PAR nationwide [9]. PAR spatially transfers farm households living in ecologically fragile areas that cannot achieve sustainable development to developed urban areas, to eliminate poverty while ameliorating local ecology [10]. PAR aims to achieve ecological improvement by easing human–land conflict through population spatial transfer, which is not only consistent with the hypothesis that the smaller the population density, the greater the positive impact on ecological health [11], but is also in accordance with the territorial system of human–environment interaction in geography [12] and the Environmental Kuznets Curve theory [13,14].
Few studies on the ecological effectiveness of PAR have been carried out [15,16]. Referring to ecological resettlement, which is similar to PAR in relocating farmers to centralized resettlements, some scholars would argue that migration cannot help farmers achieve sustainable development. Instead, migration may exert disadvantageous influences on local ecological restoration [17,18]. Some scholars also agree with the ecological restoration effectiveness of resettlement [19]. Is the implementation of human activity with a huge investment like PAR in the Karst ecologically fragile area beneficial to local ecological improvement? Objective quantitative data are needed. Most of the existing studies on ecological effectiveness triggered by migration relocation are based on comparison of ecological indicators, such as utilization of local water, resources landscape ecological risk index [20,21]. By remote sensing, scholars determined that the area of water and perennial snow land increased noticeably during the ecological migration, while ecological risk decreased [22]. Some scholars found that the average values of Normalized difference vegetation index and Vegetation restoration degree exhibited a continuous and speedy growth trend, and the ecological migration project had a striking impact on ecological protection [23]. Some scholars also verified the ecological effectiveness of PAR by the noticeable augmentation in the value of ecosystem services in the study area after PAR implementation [24]. The existing studies basically illustrated the ecological effectiveness of migration relocation through the changes of certain ecological indicators after the implementation of migration relocation, and through comparison of the values of the indicators in the pre- and post-relocation phases. Nonetheless, the ecological effectiveness of PAR is reflected by the mitigation of the human–land relationship, and ecological environment changes are also influenced by climate factors and other human activities apart from PAR. As a consequence, to evaluate the ecological effectiveness of PAR, it is essential to distinguish PAR from natural factors and other human activities. This is also a paramount issue that needs to be addressed in PAR ecological effectiveness studies or even ecological studies of migrant relocation.
The residual model can distinguish the ecological effect of an item from natural factors and other items [25,26], and we adopted the residual model to refine the degree of ecological contribution of PAR. We chose RSEI for the ecological evaluation index used in the residual model, for the reason that the conclusions of remote sensing data analysis are objective and accurate [27], and can be employed as a technical tool to assess spatial and temporal evolution of EEQ. Compared with the single indicators, such as NDVI [28], the RSEI model, proposed by Xu, integrates the four more intuitive and critical influencing factors, namely greenness, moisture, dryness, and heat. It has the advantages of authentic and effective evaluation data sources, as well as objective and fair evaluation conclusions [29,30]. The residual model was adopted to distinguish the effect of PAR on RSEI from the effects of climate and other ecological restoration projects on RSEI. Furthermore, the residual between measured RSEI and predicted RSEI trends (regression models were established with data during the period not affected by PAR, and RSEI during PAR implementation was predicted using factors other than PAR factors as independent variables) were used to assess PAR’s RSEI contribution. A positive residual value indicates that PAR has a positive effect on EEQ, while a negative residual value indicates that PAR has a disadvantageous influence on EEQ [26]. The method requires specifying the time point at which RSEI is affected by PAR, unlike the artificial subjective determination of turning points [22]. On the basis of RSEI time series, this paper adopted the Mann–Kendall trend test to determine the turning point of the RSEI change trend [25]. Considering that the ecological effectiveness of PAR calculated by the residual model is speculative and its validity needs further verification, the spatial clustering effect of RSEI variables was first investigated at the pixel-level (2 km) scale with a bivariate local indicator of spatial association (LISA). Subsequently, the spatial correlation between RSEI changes and PAR population size in the study area was analyzed to further clarify the effectiveness of PAR implementation in driving regional RSEI changes [31]. This paper mainly addressed the following issues: (1) eliminating the effects of climate and other human activities to distill PAR-induced EEQ changes, and (2) analyzing the spatial correlation between PAR-induced EEQ change trends and PAR implementation intensity. This paper first used the GEE cloud platform to obtain Landsat remote sensing data from 1996 to 2021. Subsequently, we applied the RSEI calculation model to quantitatively assess the spatio-temporal evolution of EEQ, adopted the Mann–Kendall trend test to determine the turning point of RSEI trend change, and applied the residual calculation model to assess the RSEI-driven contribution of PAR. The LISA model was adopted to further determine the degree of correlation between PAR and RSEI variables, to predict the spatial and temporal evolution of RSEI in the study area at a later stage, and to quantitatively probe into the spatial and temporal evolution, as well as trend direction, of PAR-induced EEQ.
2. Materials and Methods
2.1. Study Area
The karst mountains of southwest China are one of the most ecologically fragile and densely populated areas in the world [6]. Guizhou province is located in the core area of the ecologically fragile karst region in southwest China, between 24°37′ and 29°13′N latitude and 103°36′ and 109°35′E longitude, with 88 counties and urban areas in the province, a population of 46,211,200 (Figure 1b) (2021), a land area of 176,200 km2, and an altitude of 147–2900 m, 92.5% of which is mountains and hills. It is the only province in China without plains. Guizhou has a subtropical humid monsoon climate, with the most widespread distribution of carbonate formations containing magnesium in the Triassic marine phase, and a stone desertification area of 24,700 km2 (Figure 1a). A total of 6.32 million people were impoverished in Guizhou in 2015, accounting for 8.9% of the total poverty-stricken population in China, with a poverty incidence rate of 18%, which was 10.8 percentage points higher than the national average [32]. With its fragile ecological environment, large deprived population, and prominent human–land conflicts, Guizhou Province is a typical region with a high overlap between ecological fragility and extreme poverty. Of course, through the poverty alleviation project represented by PAR, in 2020, the Chinese government announced to the world that China no longer had a poverty-stricken population.
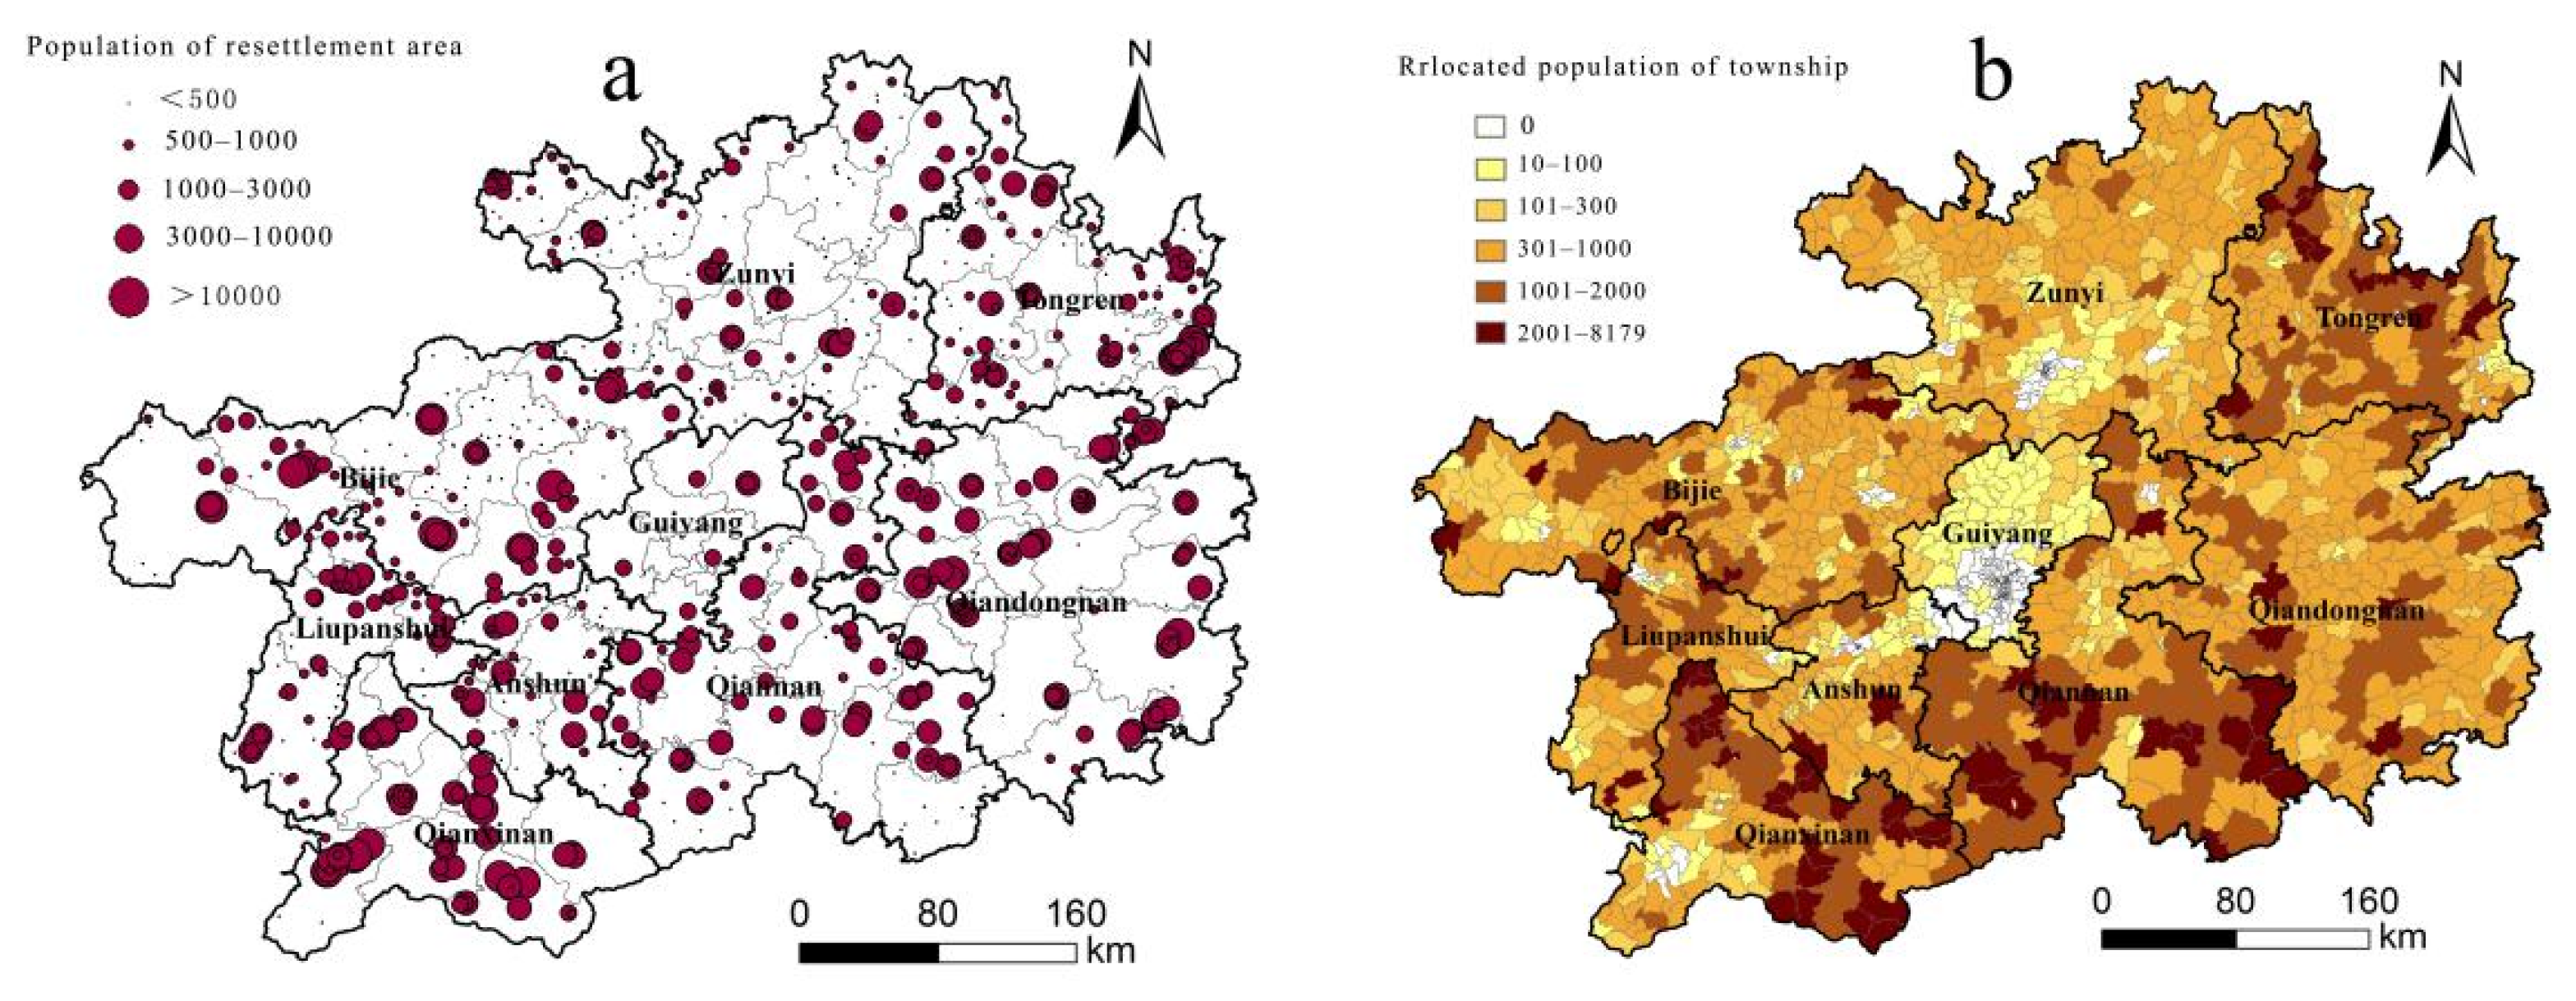
PAR targeted the most impoverished farming households that lived in areas with fragile ecological environments and impoverished living conditions, and relocated the population to areas with comparatively superior resource endowments, giving the relocated poor a new sustainable livelihood that they could use to earn a living and ameliorate their long-term lives. Over the period 2016–2019, Guizhou Province relocated approximately 430,000 households and 1.92 million people, accounting for nearly 1/5 of China’s total relocation, involving 12,000 administrative villages in 1598 townships in 85 counties (out of 88 counties in the province) (Figure 2b). PAR mainly makes use of two types of resettlements, namely, in rural areas and urban centralized resettlement. There were 856 PAR resettlement sites in Guizhou Province, including 591 urban centralized resettlement sites, which were used to resettle 97% of the relocated population (Figure 2a). Among the urban centralized resettlement sites, there were 125 resettlement sites with more than 5000 people, housing a total of 1.12 million relocated people, accounting for 58% of the total number of relocated people. Among the eight prefectures and cities in the province, the largest number of people relocated was in Qianxinan Prefecture, with 340,000 people relocated, and the smallest number of people relocated was in Guiyang City, with 10,000 people relocated.
2.2. Data Resources and Pre-Processing
The GEE cloud platform (www.googleearth.enger.com (accessed on 12 January 2022)), has a multitude of advantageous capabilities in terms of data acquisition, data analysis and processing, free public datasets and storage space. Apart from these capabilities, this platform integrates almost all public datasets, such as Landsat, MODIS, Sentinel, NPP VIIRS, etc. [33,34]. At the same time, GEE has advanced data identification and processing capabilities, which can complete all handling processes, such as pre-processing, modeling, calculation, and map output. The Landsat remote sensing data used in this article came from the GEE platform database, in which Landsat 5 was used before 2012 and Landsat 8 was used after 2012 [35]. Aside from that, the thermal infrared (TIR) band (band 6) of Landsat 5 TM Collection 1 Tier 1 raw scenes was originally collected with a resolution of 120 m/pixel. The two TIR bands (band 10 and band 11) of Landsat 8 Collection 1 Tier 1 raw scene were originally collected with a resolution of 100 m/pixel and resampled to 30 m using cubic convolution. The Single Channel (SC) algorithm was used in our study to calculate LST. We selected the Landsat 5 TM and Landsat 8 OLI surface reflectance sensors images (LANDSAT/LT05/C01/T1_SR and LANDSAT/LC08/C01/T1_SR) to calculate the NDVI, the WET, the NDISI and the LST. The radiance from band 6 of Landsat 5 TM, the radiance from band 10 of Landsat 8 OLI, and the dataset NCEP_RE/surface_wv were used to calculate LST [36,37]. MODIS remote sensing data began to be used after 2000, with a maximum image resolution of 250 m. However, the accuracy of the evolutionary results of medium resolution data is limited. For the reason that Guizhou province is characterized by cloudy and rainy monsoon weather, it is difficult to obtain images of low cloud coverage. For instance, in 2014, there were 224 scenes of Landsat images within the province, out of which there were only 41 scenes with less than 20% of cloud cover and only 18 scenes with less than 5%, and most of these were concentrated in the spring and winter seasons. In order to effectively collect low cloud coverage image data, on the basis of the GEE automatic calculation screening function, the best images were automatically synthesized by selecting images from April to October of the target year, and the results still had a total of six years of images with an integrated cloud amount higher than 20% in 1997, 2003, 2006, 2012, 2014, and 2020, which were not applicable for evaluation. The data preprocessing was performed by the official GEE programming algorithm. The geometric correction, radiometric correction, and atmospheric correction were first completed, and the cloud mask algorithm was employed to remove the overlying cloud amount. Apart from that, water body mask processing (updateMask) was implemented by code to avoid waters affecting the load distribution of the principal components. After GEE cloud computing, 20 periods of standardized image data for the study area, from 1996 to 2021, were obtained. Among the data sources, the administrative area vector data were obtained from the Resource and Environment Science Data Center of the Chinese Academy of Sciences (http://www.resdc.cn (accessed on 5 October 2021)), the data correlated with the reforestation project were obtained from the Master Plan of National Forestry and Grassland Administration (http://www.forestry.gov.cn (accessed on 21 April 2022)), and the data of the stone desertification project were obtained from the National Development and Reform Commission (http://www.rdrc.gov.cn (accessed on 21 April 2022)). Meteorological data were obtained from the China Meteorological Administration Network (http://www.cma.gov.cn (accessed on 25 April 2022)), and PAR project data were obtained from the Ecological Migration Bureau of Guizhou Province.
2.3. Methodology
2.3.1. RSEI Calculation
The RSEI involves four indicators that are in line with the Chinese Ministry of Environment’s ecological environment evaluation specification “Technical Specification for Ecological Environment Status Evaluation”, and address issues such as the ease of access to indicators, the setting of normalization coefficients, and the reasonableness of weights on the basis of comparability. It not only includes a vegetation index (NDVI), which is the wet component of a tasseled cap transformations (WET) of surface vegetation, soil, etc., but also includes a soil index and the index-based built-up index IBI, to form a comparative index. The built-up index IBI is expressed by the normalized difference impervious surface index NDISI, and the surface temperature conditions are expressed by the land surface temperature LST. The EEQ evaluation is more comprehensive, using a combination of the four indicators. The final RSEI value was obtained using the forward normalization process formula, yielding a value between 0 and 1; the higher the numerical value, the better the EEQ [29,38]:
In the formula: NI denotes the standard index value after processing; I is the index value; Imax and Imin are the maximum and minimum values of the index, respectively; RSEI denotes the final remote sensing ecological index; RSEI0 denotes the primary remote sensing ecological index; RSEI0-max and RSEI0-min are the maximum and minimum values of the primary remote sensing ecological index in the current period, respectively; PC1 denotes the first principal component.
2.3.2. Determination of Turning Points
In contrast to the artificial determination of turning points, this paper adopted Mann–Kendall mutation test curves to determine potential turning points of long time series RSEI trends. On the basis of MATLAB software, the changes in the RSEI trend over the period 1996–2021 were first analyzed by testing at the 95% confidence level of significance. Then, the order column of sequential time and inverse time was further calculated. In addition, the year in which the trend curves composed of the two sets of series intersected was the potential turning point, which was the mutation point of the detected time series [39]. The period before the turning point was identified as the reference period, while the period after the turning point was identified as the implementation period.
2.3.3. Residual Trends Method
RSEI changes are influenced by climatic conditions and human activities. We adopted the Residual trends method to calculate the extent of PAR contributions to RSEI. First, we calculated the correlation between the time series RSEI and the influencing factors, other than PAR, and, then, established the regression relationship. The time series was based on the reference period. Subsequently, we adopted a pixel-level (2 km) multiple regression model to calculate the regression coefficients with pixel-based units. Second, we fitted the predicted RSEI values for the actual period with the regression coefficients, and subsequently calculated the difference between the measured RSEI and the predicted RSEI for the implementation period; we called it the RSEI residual of PAR. Third, we calculated the trend of RSEI residual with the time series. If the trend of residual change was increasing, it was considered that PAR promoted regional EEQ improvement, and if the trend of residual was decreasing, it was considered that PAR factors caused regional EEQ degradation [26,40]:
2.3.4. Spatial Correlation Analysis
On the basis of the positive and negative spatial attributes of Moran’s I divided into two positive correlation types, high–high (HH) and low–low (LL), and two types of negative correlation, high–low (HL) and low–high (LH), spatial correlation between RSEI variables and PAR numbers in the study area was analyzed by bivariate local autocorrelation, with local Moran’s I values between −1 and 1 at a confidence level of 0.05. With a p value greater than 0.05, the two elements were not remarkably correlated in space:
where wij is the element of the spatial weight matrix, xi, xj are the spatial cell observations that have passed through the Piscean quasi-talk, x is the mean, and S2 is the variance, with specific reference to Ref. [31].
2.3.5. Technical Roadmap
The technical route of this paper is described in the last paragraph of the introduction, and the road technology roadmap is shown in Figure 3.
3. Results
3.1. Spatial and Temporal Evolution of EEQ
3.1.1. General Trends of EEQ Evolution
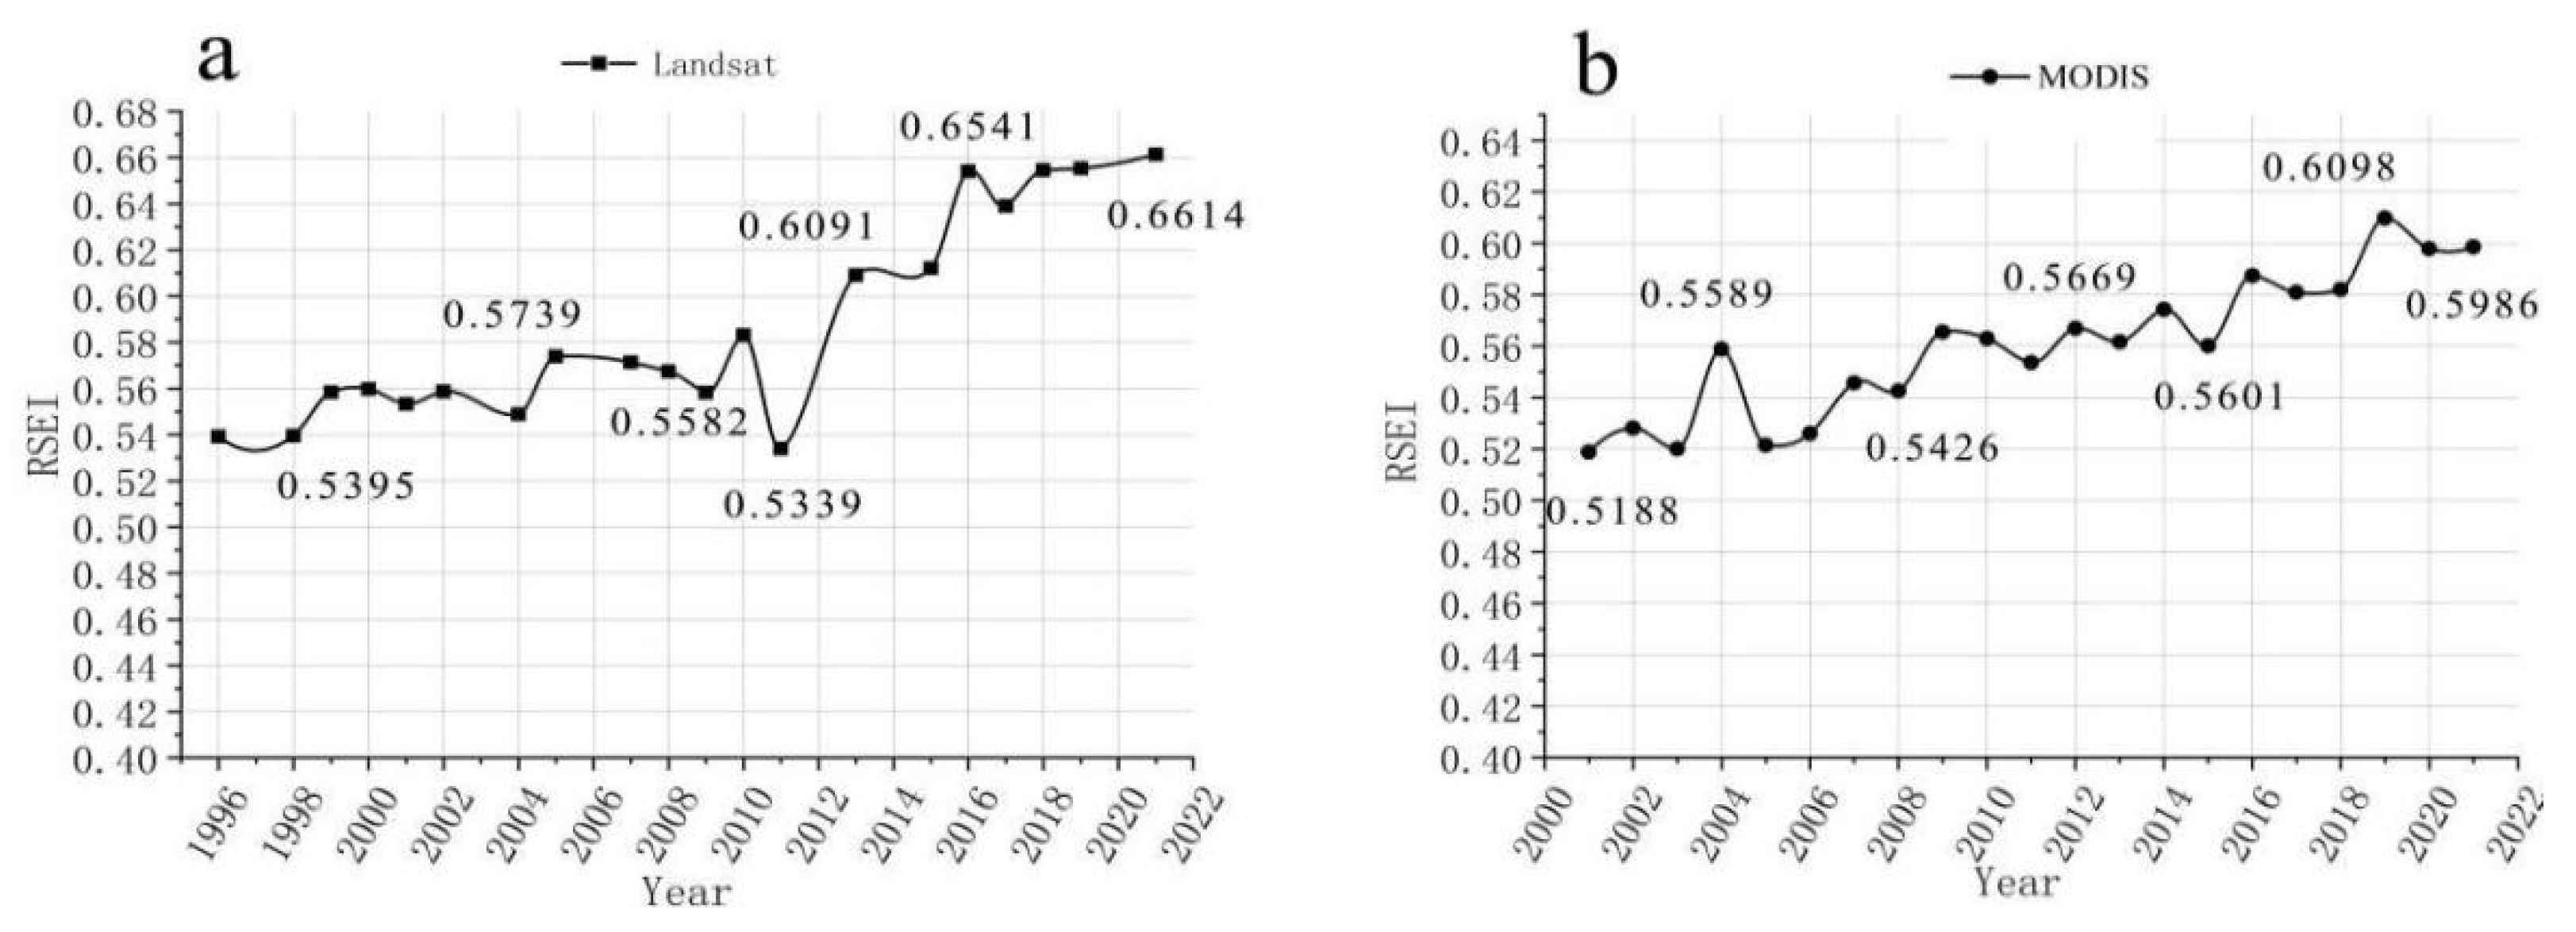
As demonstrated by the Landsat image data, the RSEI calculation formula showed that the RSEI of the study area from 1996 to 2021 exhibited a gradual augmentation with certain fluctuations during the period. Nonetheless, the overall trend of a gradual increase in RSEI with time migration was maintained. Apart from that, the average value of RSEI increased from 0.5392 in 1996 to 0.6614 in 2021 (Figure 4a). The MODIS image data differed from Landsat on account of the sensor and resolution (low resolution RSEI calculation accuracy deviation), and the calculation results had a certain gap (Figure 4b). The RSEI in the study area from 2001 to 2021 exhibited a gradual upturned trend, and the overall evolution trend was similar to that seen in the Landsat data.
3.1.2. RSEI Conclusion Test and Correlation Analysis of Indicators
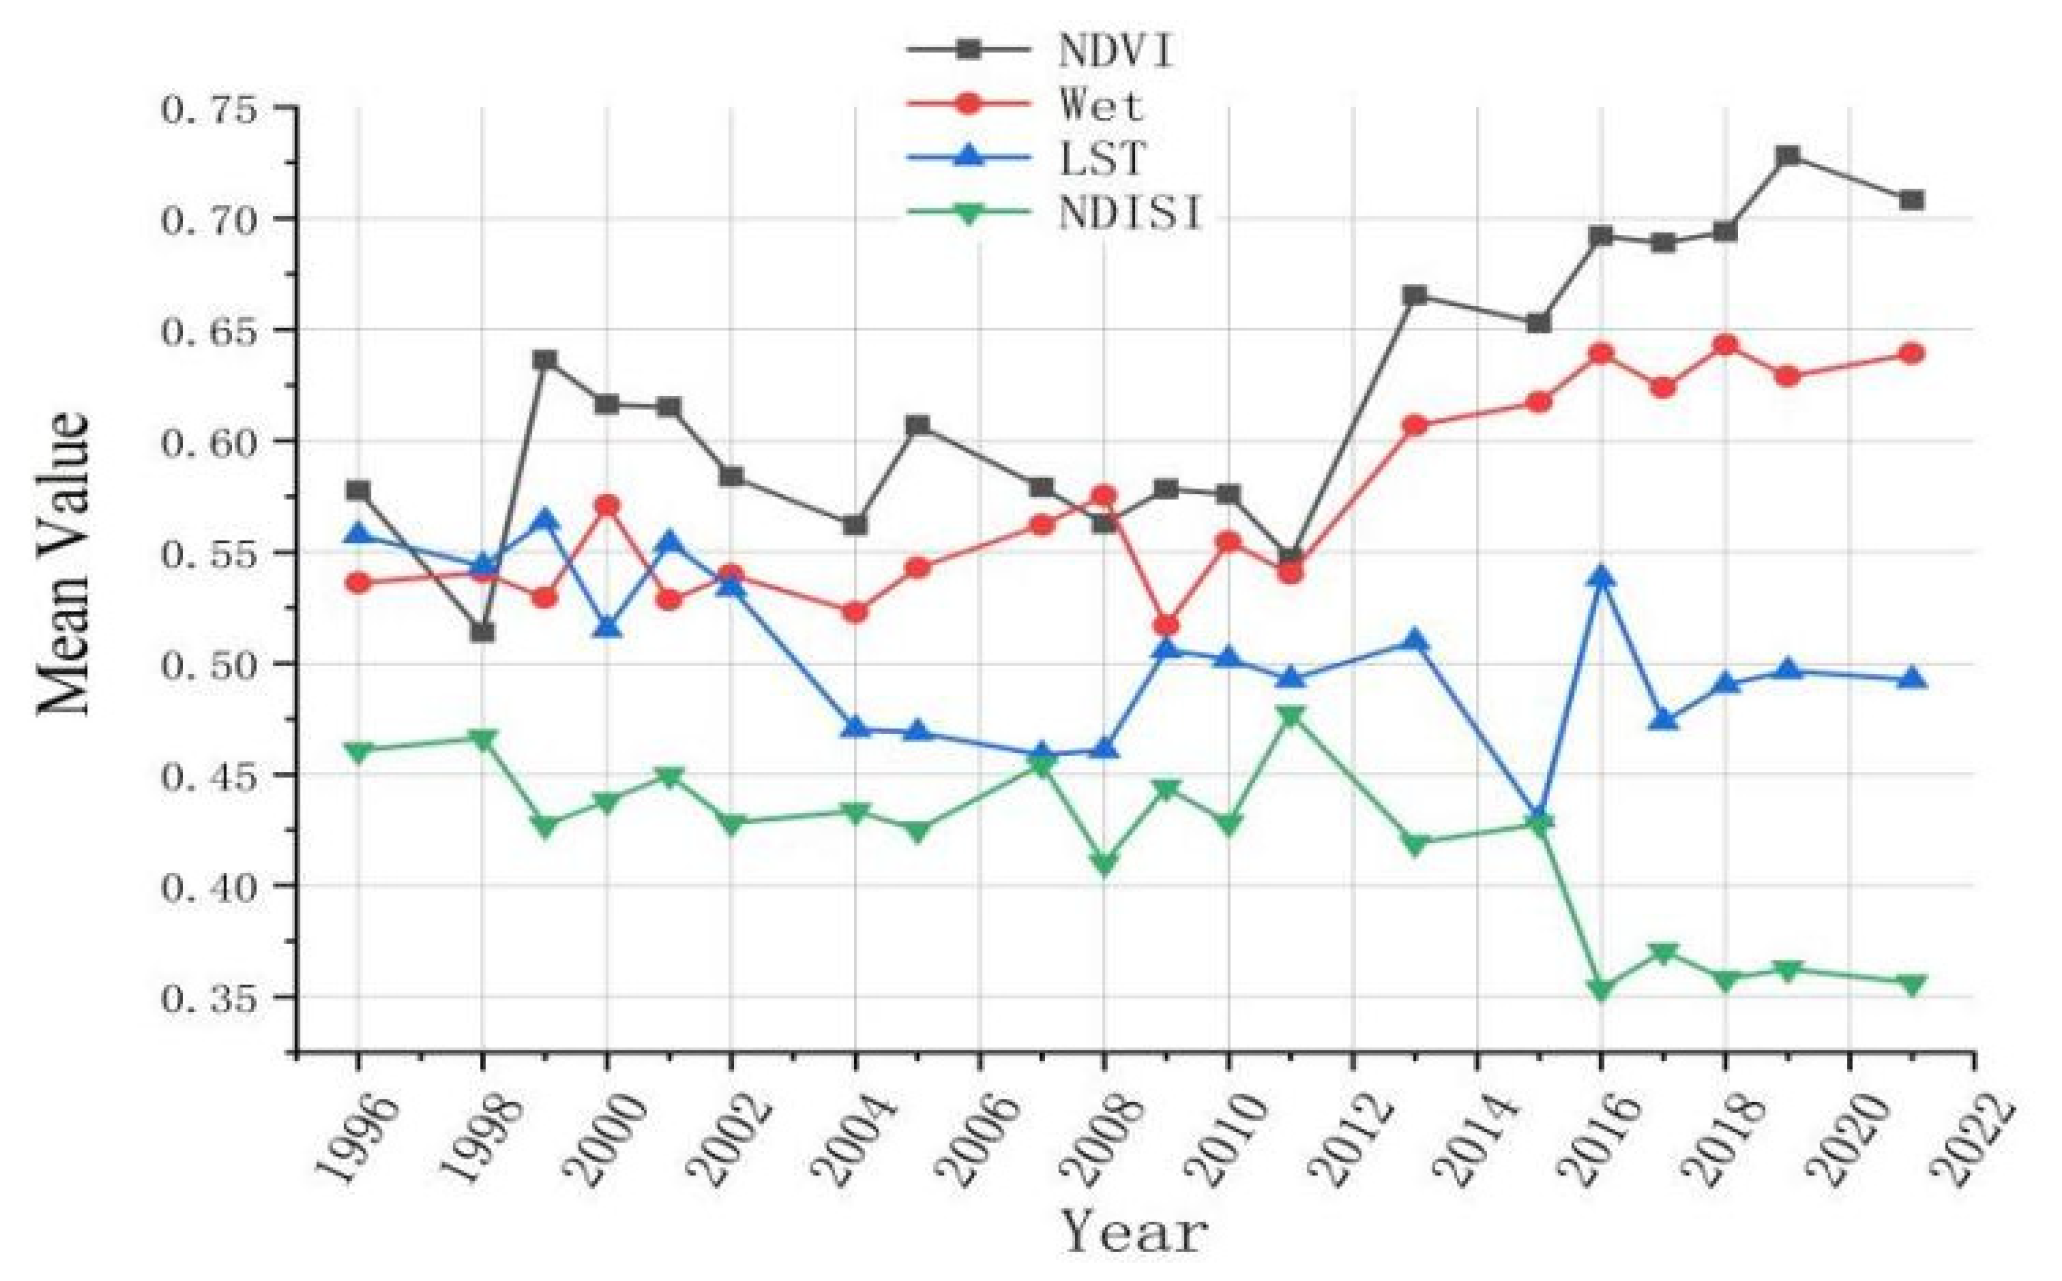
To monitor the accuracy of the calculated results and probe deep into the degree of correlation of the data within the RSEI, the reasonableness of the results was tested by adopting the Spearman test model. As demonstrated by the results, the correlation coefficients between RSEI and four indicators, NDVI, WET, LST, and NDISI, were 0.833, 0.878, −0.451, and −0.878, respectively, indicating that RSEI was positively correlated with NDVI and WET and negatively correlated with LST and NDISI. The correlation between RSEI results and three indicators, NDVI, WET, and NDISI, was strong and the significance was less than 0.001, and the correlation coefficient with LST was 0.095, which was not significant enough (Table 1). The trend of NDVI and WET during the study period tended to be the same as the trend of RSEI change, and the overall trend tended to improve in the state of continuous fluctuation, and maintained a higher level after 2016. The trend of LST and NDISI during the study period exhibited an inverse trend with the trend of RSEI change, and the overall trend showed a gradual decrease. The decreasing trend of NDISI was more striking, and the decreasing trend of LST was not noticeable, which contributed to the limited contribution to the improvement of RSEI (Figure 5).
3.1.3. EEQ Evolutionary Turning Points during the Study Period
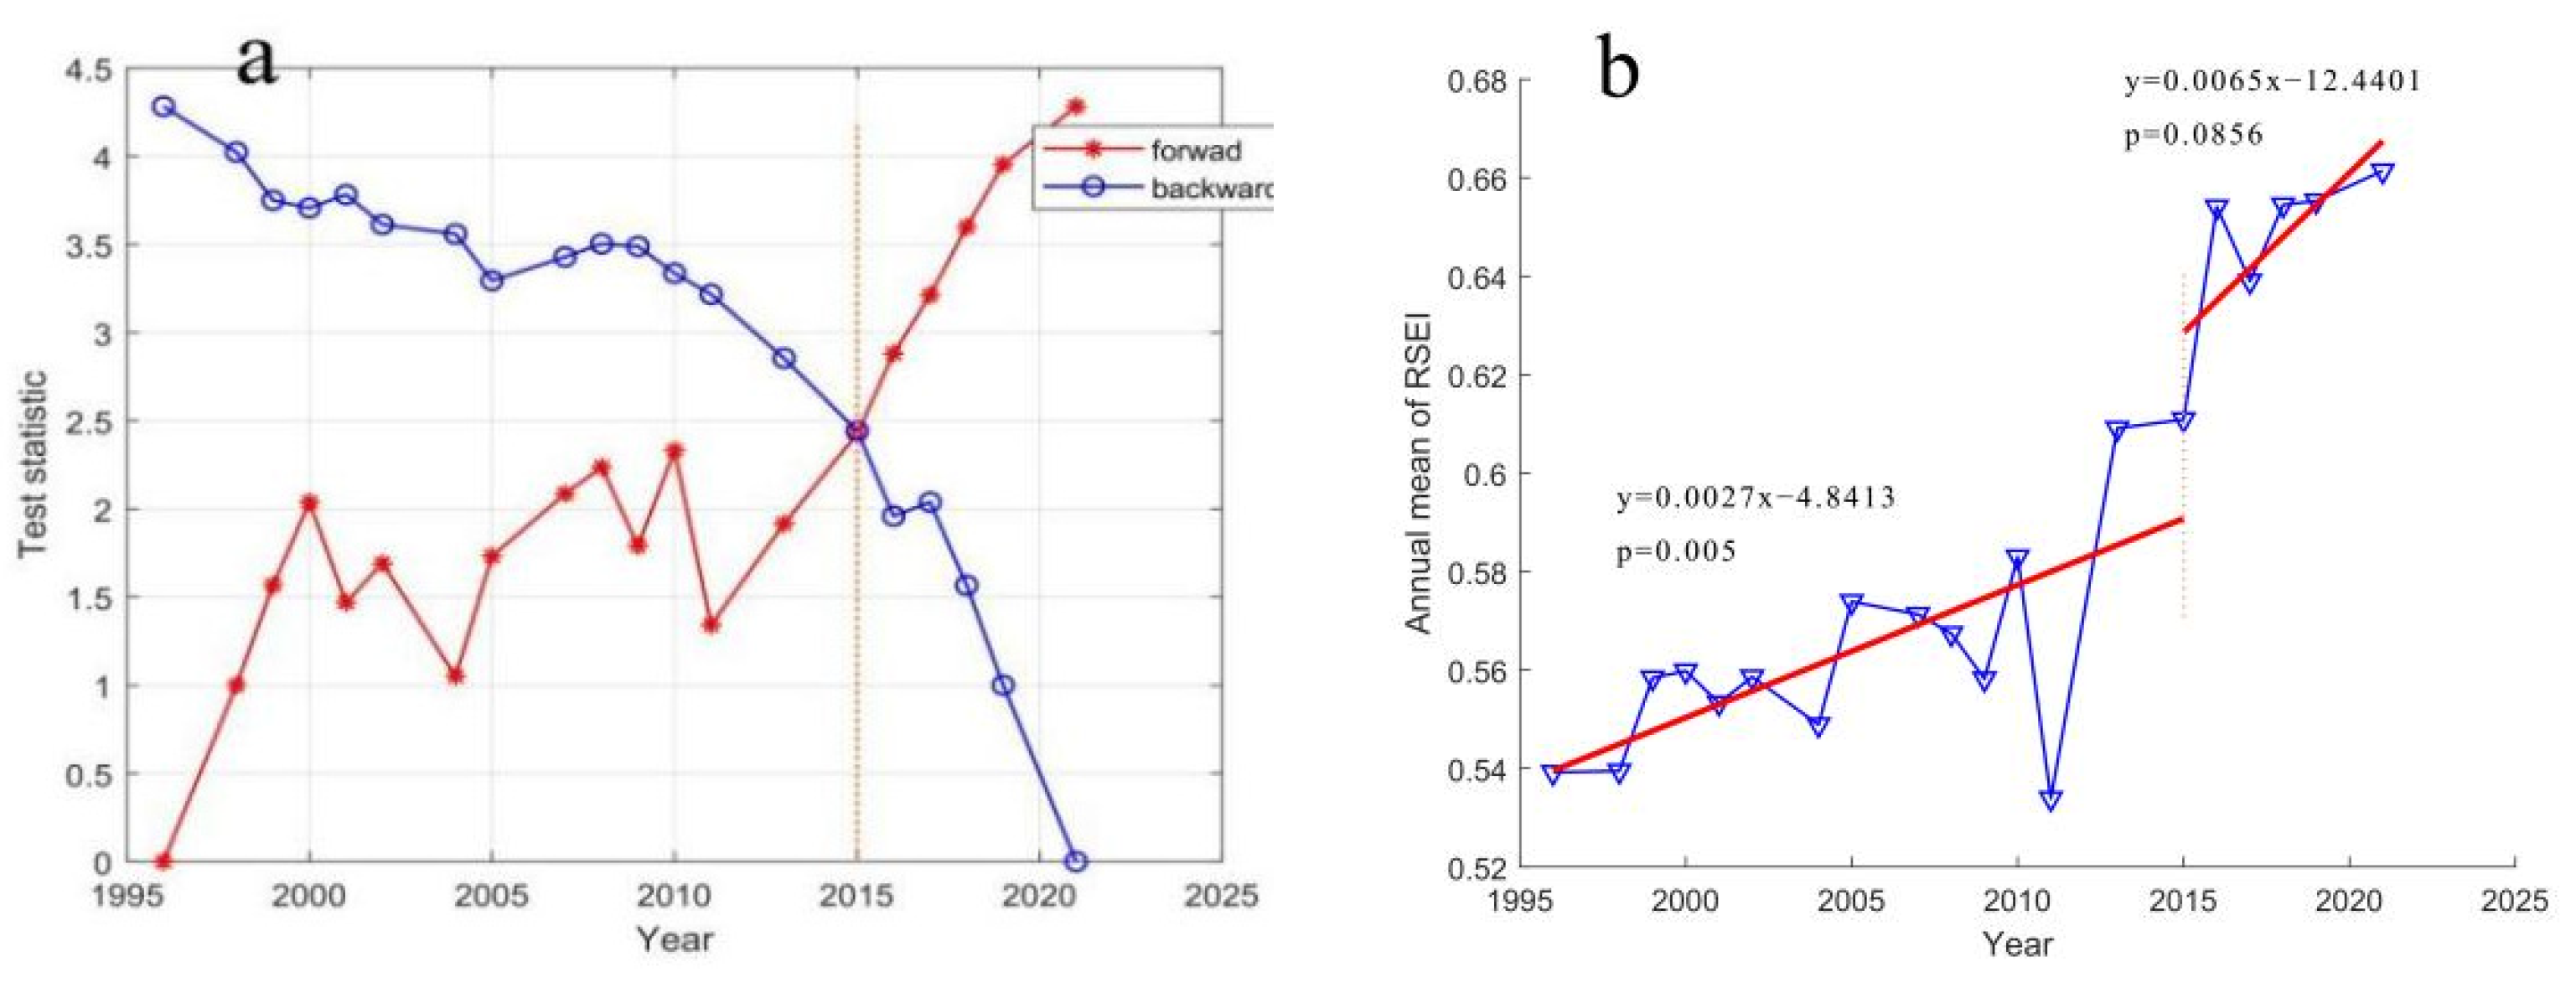
The Mann–Kendall test model was applied to calculate the turning point of RSEI evolution for the period 1996–2021. As indicated by the research findings, the backward trend of RSEI was a fluctuating decreasing trend, and the forward trend was a fluctuating increasing trend, and the two trends intersected in 2015, which was the turning point of the trend. In this paper, the study period was divided into two periods on the basis of the turning point, namely the reference period, 1996–2015, and the implementation period, 2016–2021. The trend of RSEI in the reference period had certain fluctuations, the overall trend was smoothly increasing (p = 0.005), and the slope was 0.0027. The RSEI trend of the implementation period was more significant (p = 0.0856), with a slope of 0.0065, which was a substantial augmentation compared to the reference period. The reference period RSEI increased from 0.5392 to 0.6109 with an increment of 0.0716 and an average annual increase of 0.0038, whereas in the implementation period RSEI increased from 0.6109 to 0.6614 with an increment of 0.0505 and an average annual increase of 0.0084 (Figure 6).
3.1.4. Spatial and Temporal Evolution Trend of RSEI
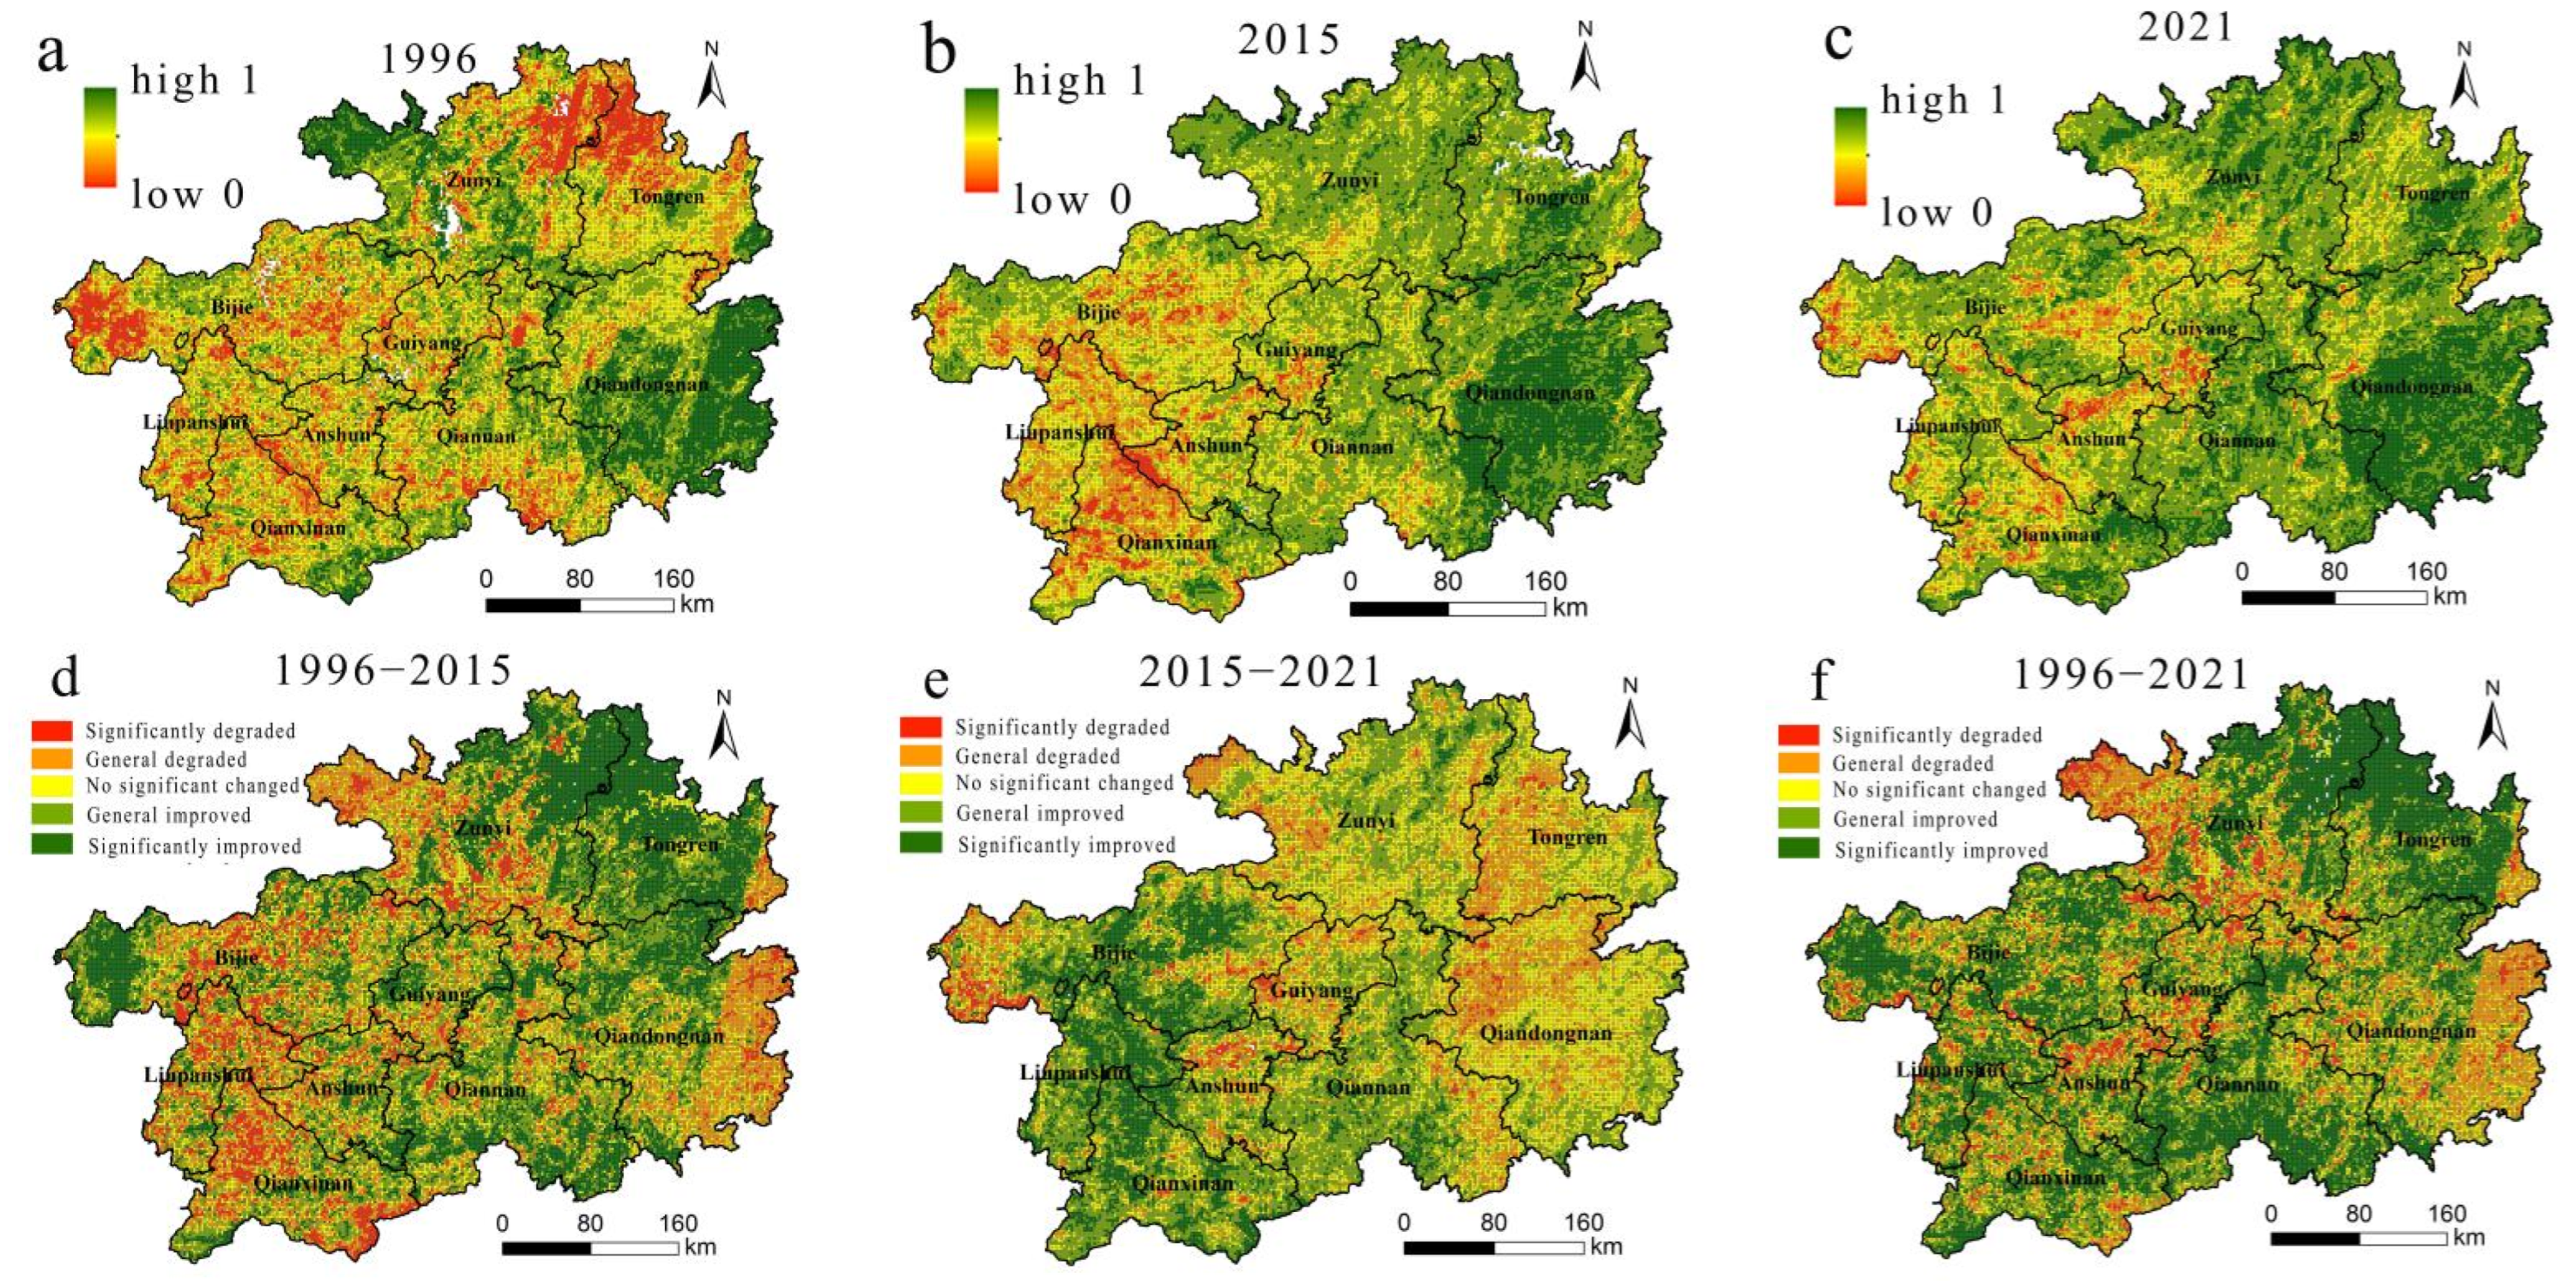
The mean value of RSEI during the study period was divided into five grades, namely grade I (<0.2), II (0.2–0.4), III (0.4–0.6), IV (0.6–0.8), and V (0.8–1), and the higher the grade the better the EEQ. The specific spatial and temporal evolution results during the study period are exhibited in Figure 5. RSEI mean values and basic characteristics of spatial distribution showed an overall upturn trend (Figure 7a,c,f). Of the RSEI grades in the regional area 53.63% were ameliorated (21.46% substantially improved, 32.17% generally ameliorated), and RSEI degradation in the study area accounted for 14.33% (12.24% generally degraded, 2.09% noticeably degraded).
The RSEI improvement trend was remarkably stronger than the degradation trend during the reference period (Figure 7a,b,d), and the area of RSEI grade improvement accounted for 44.07% (15.63% strikingly ameliorated, 28.44% generally ameliorated) in the regional area, mainly centered in the northeast side, with Tongren as the center. The area of RSEI degraded area accounted for 21.31% (17.90% generally degraded, 3.41% noticeably degraded), primarily centralized in the western part of Bijie, Liupanshui, Qianyinan and other areas where the population was concentrated (15.63% tremendously ameliorated, 28.44% generally improved). This region was the most prominent area of human–land conflict, and the ecological restoration rate was weaker than the ecological degradation rate.
During the implementation period, the trend of RSEI improvement was maintained (Figure 7b,c,e and Figure 8), and the area of RSEI level was ameliorated by 34.09% (4.75% markedly ameliorated, 29.34% generally ameliorated), and the improved areas were mostly centralized in the western regions of Liupanshui. This region was a more prominent area for human–land conflicts. The ecological degraded areas accounted for 12.77% (12.11% generally degraded, 0.66% remarkedly degraded), concentrated in Tongren, Qiandongnan and other regions. The EEQ degradation was more remarkable in Guiyang, Zunyi, Anshun, Bijie, Kaili and other urban areas, which were large and medium-sized cities where the province’s population growth was concentrated. The degradation trend was observed throughout the study period.
3.2. PAR and EEQ Spatio-Temporal Correlation Analysis
3.2.1. Remove the Influence of Climatic Factors and Other Anthropogenic Activities
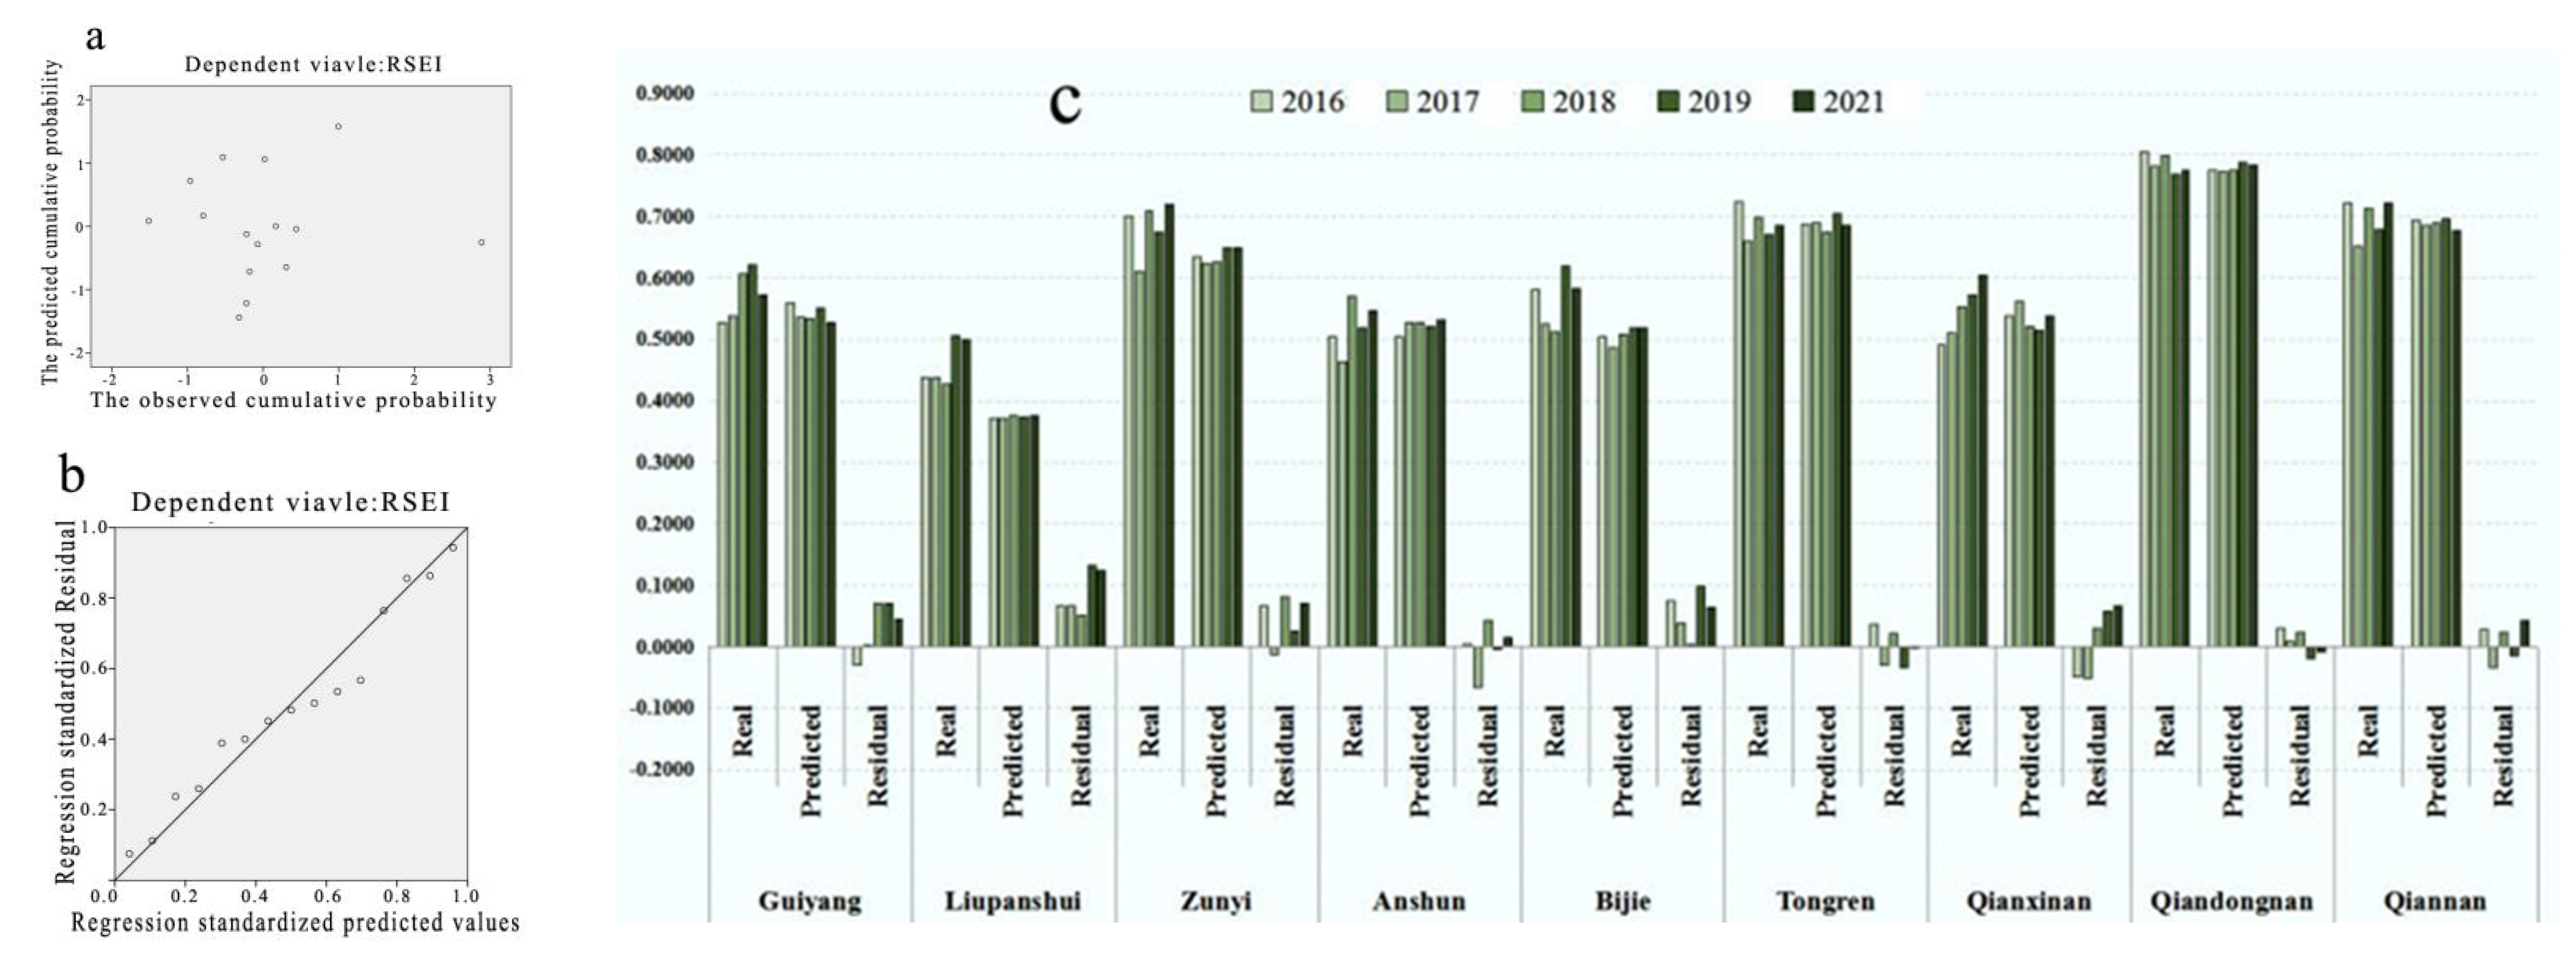
There was a clear trend of RSEI enhancement during the implementation period of the study. In order to remove the influence of climatic factors and other anthropogenic activities, and to assess the driving effectiveness of PAR, the residual model was employed to probe into the degree of PAR contribution to the regional RSEI enhancement. Through multiple linear regression analysis calculation, the natural conditions (mainly temperature and rainfall) and anthropogenic factors (the Grain for Green Project and the Karst Rocky Desertification Restoration Project) in the reference period were employed as the driving force for the PAR. The regression coefficients were calculated using natural conditions (mainly temperature and rainfall) and anthropogenic factors (the Grain for Green Project and the Karst Rocky Restoration Project) as independent variables and RSEI as dependent variables during the reference period (see Table 2 for details). The confidence range of the regression model was 95% (p = 0.044). Aside from that, both the observed cumulative and the predicted cumulative probabilities were normally distributed in the linear regression analysis model. Furthermore, standardized residuals had no outlier outliers and obeyed chi-square variance (Figure 9a,b). The regression coefficients predicted the RSEI values for the measured period, and the standardized coefficients were calculated as Variable (RSEI) = 0.391 × Variable (MAT) + 0.376 × Variable (ATP) + 0.281 × Variable (funds of the Grain for Green Project) + 0.570 × Variable (funds of the Karst Rocky Desertification Restoration Project). The forecast RSEI was subtracted from the measured RSEI to obtain the residual value of the year, and the proportion of the measured value of the year made up of the residual value formed under PAR in 2016–2021 was 5.17%, 3.46%, 6.37%, 5.05%, and 6.38% for 2016, 2017, 2018, 2019, and 2021, respectively (excluding 2020, Table 2). The degree of investment in stone desertification management projects during the reference period had the greatest impact on RSEI, while PAR during the implementation period played a paramount role in promoting EEQ, which was the uppermost factor for the substantial augmentation in RSEI values in the study area.
We adopted the residual model to probe into the impact of PAR on EEQ space during implementation. Generally, it was high in the west and low in the east. In the western regions, with large populations, namely Liupanshui and Bijie, the residual value was comparatively high. After 2019, the residual value was about 0.1, and the trend of increasing residual value in Southwest Guizhou was the most substantial. The province has the most serious rock desertification and the highest degree of poverty. The residual values were negative in the eastern regions of Tongren and Qiandongnan, where the population was small, and the average value of RSEI was at the top of the province for a long time, with a solid EEQ foundation. Based on the analysis of the spatial and temporal evolution of RSEI within the study area, the implementation of PAR strikingly elevated the effectiveness of EEQ, in a manner primarily centralized in the areas of Liupanshui, Bijie, and Qianxinan, where the contradiction between human and land was prominent and the ecology was poorer, and the ecological restoration was more effective. In the areas of Tongren and Qiandongnan, where the contradiction between humans and land was not prominent with higher RSEI values, a certain degradation trend was found (Figure 9c).
3.2.2. Correlation between PAR Implementation Intensity and RSEI Changes
The residual model algorithm results were based on the predicted RSEI and did not involve PAR-related data. On that account, we adopted the Morlan index to further verify the correlation between PAR implementation intensity and RSEI changes. The relocation of the province was mostly concentrated in Bijie and Liupanshui, which had a larger population base in the west, and Qianxinan, which had a more serious stone desertification. PAR was basically not involved in the important urban areas of Guiyang, the south of Zunyi, and the northeast side of Anshun (Figure 10a).
The correlation between PAR and RSEI of the region over the period 1996–2021 was further analyzed by employing the Moran index. As revealed by the experimental results, the univariate RSEI changes during the implementation period were aggregated under the significance condition of p < 0.05. Aside from that, the Moran index of the RSEI variables was 0.749, which exhibited noticeable spatial correlation with one another (Figure 10b). Furthermore, the region of remarkable RSEI increment was predominantly centralized in the western region, which was the RSEI boosting aggregation region. Apart from that, the eastern Tongren and Qiandongnan regions were the more concentrated regions of RSEI decrease (Figure 10c). At a p < 0.05 significance level, 44.91% of regional PAR implementation had a striking impact on RSEI change. As indicated by the results, 29.22% of the areas within the marked influence range belonged to the H–H range, concentrated in the western region, which was the area with a large relocated population and a more marked RSEI submission. Moreover, PAR exhibited a striking positive correlation with RSEI improvement: 20.44% of the areas belonged to the H–L range, concentrated around the western H–H region, with a noticeable RSEI improvement, but the size of the relocated population was not too large; 25.37% belonged to the L–L region, which was a decreasing region with a small relocated population and a strikingly positive correlation between PAR and RSEI, primarily concentrated in the urban areas of Guiyang, the east side of Anshun, and other areas with better EEQ in the east; and 24.97% belonged to the L–H region, with a large relocated population but a decreasing trend of RSEI, which was a negative correlation region, concentrated in the eastern region. As indicated by the research findings, RSEI of Tongren and Qiandongnan regions on the east side showed a certain degree of reduction after PAR implementation, and PAR implementation had little effect on the local RSEI, while PAR in the Bijie, Liupanshui, and Qiandongnan regions on the west side directly or indirectly contributed to a substantial augmentation in the regional RSEI and formed an aggregation effect (Figure 10d).
3.3. Ecological Effectiveness Analysis of PAR in Typical Regions
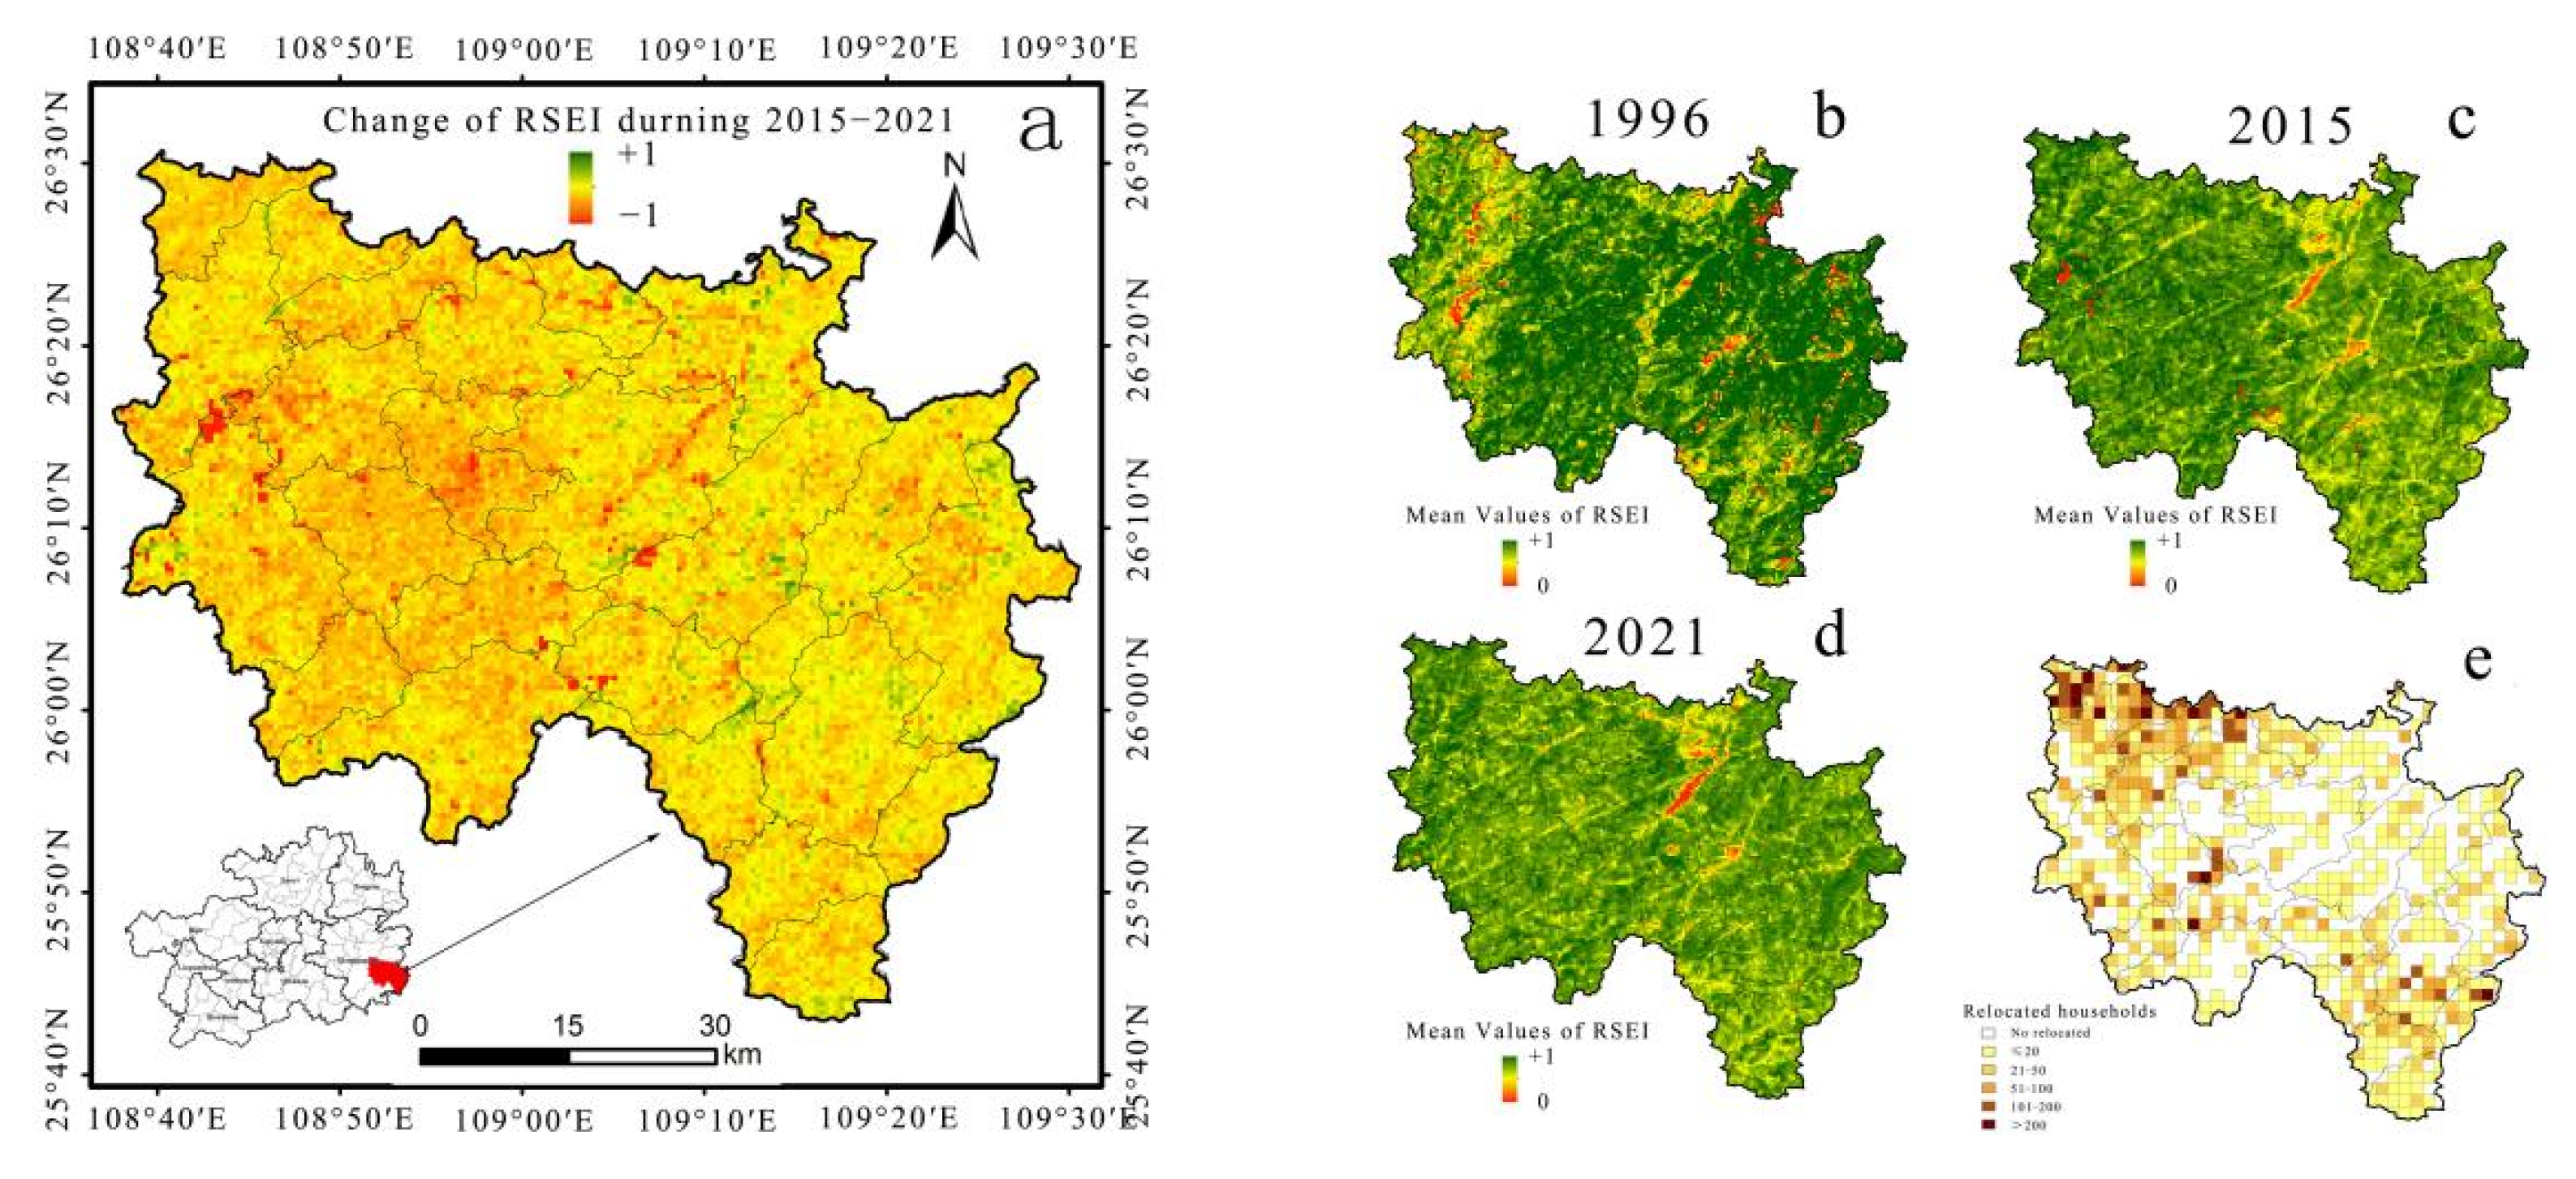
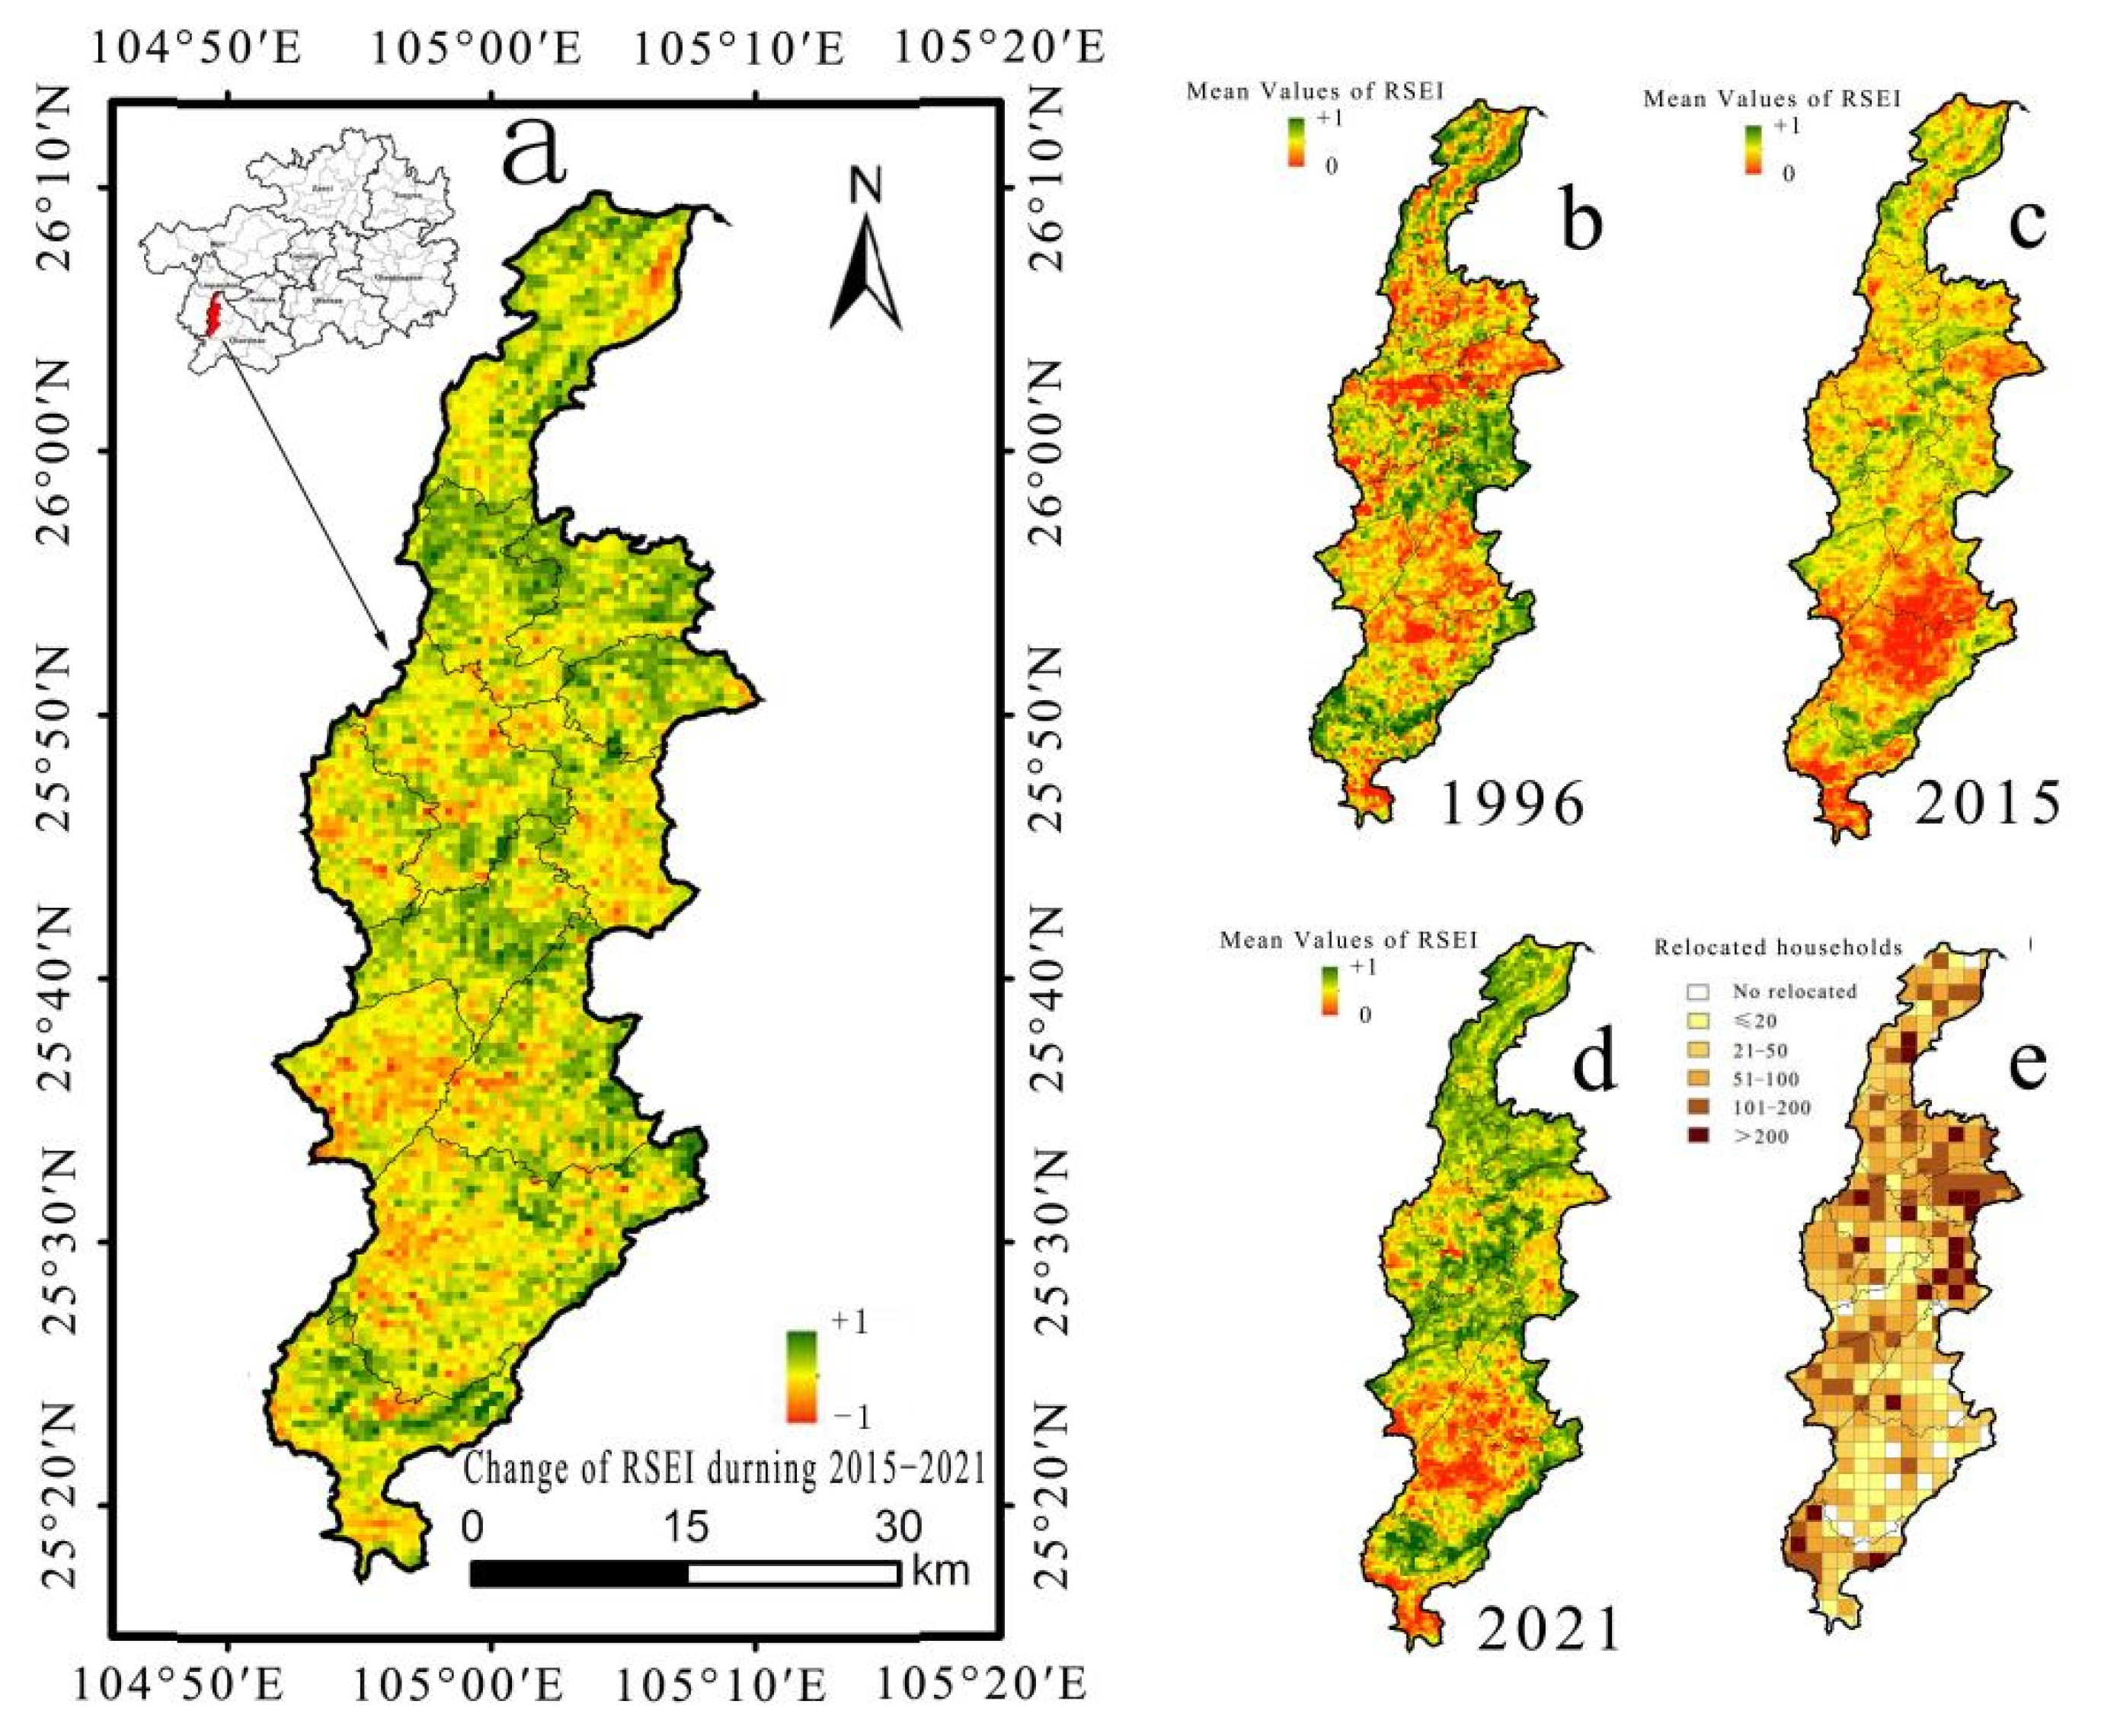
Liping County has a land area of 4441 km2, a total population of 578,000 in 2021, a GDP of 9.828 billion CNY (0.55% of the province’s total), and belongs to a non-karst area, with 0.93 million households and 39,700 people relocated (Figure 11e); it is the county with the largest number of relocated people in Qiandongnan Prefecture. The RSEI of Liping County was 0.8378, 0.7970, and 0.7846 in 1996, 2015, and 2021, respectively, with a reduction of 1.56% over 2015–2021 (Figure 11a–d). Besides, the residuals of RSEI formed by PAR over 2016–2021 accounted for −2.12%, 3.19%, 4.53%, −2.72%, and −5.36%, respectively. Moreover, the results of the LISA analysis exhibited that 8% of regional PAR and RSEI changes were strikingly correlated with a low degree of association. Pu’an County in Qianxinan Prefecture, where the RSEI was more strikingly ameliorated, and Liping County in Qiandongnan Prefecture, where it was slightly reduced, were selected for analysis. Pu’an county has a land area of 1429 km2, a total population of 359,400 in 2021, and a GDP of 10.002 billion CNY (0.56% of the province’s total). It is one of the counties that is most seriously affected by stone desertification in Guizhou Province, with 0.76 million households and 35,400 people relocated during 2016–2019 (Figure 12e). The average value of RSEI in Pu’an County was 0.4603, 0.4098, and 0.5578 in 1996, 2015, and 2021, respectively. Furthermore, the augmentation reached 36.12% over 2015–2021 (Figure 12a–d). Apart from that, the residual model concluded that the residuals of RSEI formed by PAR in 2016–2021 accounted for −3.54%, 4.56%, 3.93%, −0.47%, 14.01% of the proportion of measured RSEI in that year. The LISA analysis concluded that 27% of the regions in the county were substantially related, all of which belonged to the H–H region (71%) and H–L region (29%), and the number of PARs was evidently and positively correlated with RSEI improvement.
3.4. Prediction
PAR implementation contributed to the improvement of regional EEQ, though it is unclear whether this effect is sustainable or not. In order to effectively explore the subsequent effectiveness of PAR, this paper predicts the spatial and temporal distribution trends of RSEI after 2021. By analyzing ARIMA, BP neural network, entropy value TOPSIS, CA–Markov and other prediction models, as demonstrated by our research findings, RSEI values in the study area display a stable trend of improvement, and the size of the improvement trend differs among diverse models. In accordance with the existing research results on EEQ, RSEI reached a higher EEQ level, at 0.66, in areas with human settlement, which was much higher than the general urban and rural areas [41,42]. In the future, without the support of other more effective projects, the existing ecological projects will predominantly maintain the local EEQ level. This paper qualitatively predicts that the local EEQ will remain at 0.66, with some fluctuations as a result of natural factors or various ecological project inputs, but will generally maintain the current stable trend.
4. Discussion
As demonstrated by some scholars, rural population migration to urban areas tremendously lessens human disturbance to nature and ameliorates the regional ecological environment [43,44]. To be more specific, the more fragile the ecological environment is, the more marked the effect is [45]. What is particularly noteworthy is that their viewpoints are exactly consistent with the author’s standpoint. Moreover, the migration of rural population elevated by PAR is larger in scale and more thorough. Furthermore, this sort of migration is accompanied by the promotion of projects, such as the Grain for Green project, which also has more substantial ecological restoration effects. PAR has not only noticeable significance for poverty alleviation, but also reference value for building an ecological civilization model in which human beings live in harmony with nature. Apart from that, the results of the analysis exhibited that migrant relocation for the purpose of poverty alleviation or ecological improvement needs to be combined with regional population size, ecological carrying capacity, and natural resource endowment. Last but not least, the essential causes of ecological fragility are behind the implementation of a comprehensive relocation project in order to achieve an effective model of harmonious human–nature development in ecologically fragile areas.
Existing PAR studies primarily fix their attention on the social effects. In order to offer impoverished people better housing, medical and educational conditions, as well as more training and employment opportunities, the Chinese government invested 300 billion CNY to spatially relocate the most impoverished people to cities and towns. Nevertheless, just as the saying goes, there are two sides to every coin (Table 3). The well-intentioned policies may also give rise to an augmentation in cost of living and block the transmission of original customs and culture [46]. PAR ecological effectiveness research is rarely reflected, and the research results of this paper display that after the implementation of large-scale relocation, the RSEI in western regions with prominent human–land conflicts and more serious stone desertification, such as Bijie, Liupanshui, and Qianxinan, were more remarkably ameliorated. Nonetheless, in eastern regions, such as Tongren and Qiandongnan, RSEI predominantly maintained the status quo, and some regions declined. This indicates that PAR-driven ecological optimization has noticeable regional suitability, and it is not necessarily suitable in areas with high EEQ and less prominent human–land conflicts. Moreover, the effect of PAR implementation on local ecological improvement is comparatively limited. As demonstrated by the results of existing studies, migration and relocation can contribute to ecological degradation in areas with comparatively sparse population density as well as unsatisfactory water and heat conditions, such as Northwest China [17]. Migrant relocation does not ameliorate the regional EEQ in all ecologically fragile areas. To put it another way, improvement of RSEI is predominantly owing to the improvement in NDVI and reduction in NDISI, while the contribution of the WET and LST indicators is not remarkable. Regarding the overall improvement of RSEI, nonetheless, the four internal component indicators are not fully optimized and the overall quality of improvement is far from satisfactory. Some international scholars have claimed that the ecological restoration projects promoted by the Chinese government limit biodiversity [47], and the limited land after relocation is used by the government or companies on a large scale, which inevitably results in a single type of woodland. Apart from that, the already formed woodland area after relocation is also beneficial to the development of regional biodiversity after reduction in human disturbance. From the perspective of sustainable development after relocation, the majority of relocated farmers moved to towns and cities, and the analysis results show that the RSEI of urban areas were all reduced.
Nowadays, some scholars have probed deep into the ecological impact of human activities, such as assessing the impact of human migration on vegetation cover with Pearson correlation analysis [48], while others have explored the impact of human activity changes on peatlands with multivariate and nonparametric techniques [49], etc. Despite the fact that these studies have quantified the ecological impact effectiveness of relocation, they fail to quantify the degree of contribution of relocation to ecological restoration in conjunction with relocation intensity. The same is true for the use of RSEI to assess the ecological impact of human activities, which was adopted to probe into the ecological impact of land preparation projects in the Chaohu Lake area [50], the ecological impact of human activity enhancement on coal mining areas [51], and the ecological impact of ecological restoration projects on the ecological environment of Dongting Lake [42], etc. As is most revealed by these studies, human activities may exert a positive or negative influence on EEQ, but they fail to reflect the degree of contribution of human activities to ecological change. There were still some shortcomings in this paper. For instance, Guizhou is cloudy and foggy, and Landsat data basically did not have complete and clear images. Furthermore, there were still some data deficiencies under the GEE cloud platform, such as the lack of data in the year 2020, which affected the accuracy of the assessment. Aside from that, climate change also affected the accuracy of RSEI assessment; for example, the local area was affected by drought in 2009 and 2011 [52], and both LST and WET indicators were markedly affected, resulting in large fluctuations of RSEI values in that year. The NDISI indicator remained comparatively stable throughout the vegetation growing season (April–October), resulting in the low weight of LST indicators in the first principal component analysis, which had a comparatively limited impact on the RSEI values and resulted ina comparatively limited degree of ecological problems, such as the “heat island effect”.
5. Conclusions
(1) RSEI in Guizhou province exhibited a stable upturn trend throughout the study period (1996–2021). Moreover, the growth of RSEI was particularly noticeable after PAR implementation, with an augmentation of 0.0493 in 2015–2021, which reached 8.06%. Over the period 1996–2015, the growth rate was no more than 13.52%.
(2) The PAR-driven increments in RSEI in 2016–2021 were 0.0338, 0.0221, 0.0417, 0.0331, and 0.0422 (excluding 2020). In terms of spatial distribution, the contribution of PAR to EEQ improvement was chiefly concentrated in the western regions of Liupanshui, Bijie, Qianxinan, and other regions with prominent human–land conflicts, while the eastern regions of Tongren, Qiandongnan, and other regions with high EEQ, had negative residual values in some areas, playing a negative role.
(3) As exhibited by the LISA model, 44.91% of the region’s PAR implementation exerted a striking influence on RSEI changes. Among them, 29.22% of the areas belonged to the H–H range, positively correlated, which was the area where the size of the relocated population was larger and the RSEI submission was more striking. A total of 20.44% of the areas belonged to the H–L range, negatively correlated. Another 25.37% belonged to the L–L region, positively correlated, and 24.97% belonged to the L–H region, positively correlated.
(4) As indicated by the Typical areas analysis results, in Pu’an County, which had serious stone desertification and prominent human–land conflicts, PAR implementation had a striking effect on RSEI enhancement, whereas in Liping County, a non-stone desertification area with comparatively high EEQ, PAR implementation had a low contribution to RSEI change, the significant correlation was low, and the overall impact was limited.
(5) Although it was verified that PAR implementation had marked effects on RSEI enhancement in the study area, the main contribution cames from the karst ecologically fragile area with prominent human–land conflict in the west, and the ecological restoration effect was not necessarily remarkable in other regions.
Author Contributions
Z.Z., Q.F., C.Z., W.L. and L.Z. conceived and designed the manuscript. All authors analyzed the results and contributed to the writing of paper. All authors have read and agreed to the published version of the manuscript.
Funding
This research was funded by the National Natural Science Foundation of China (Grant NO. 41661088), the Program in Guizhou Planning of Philosophy and Social Science (Grant NO. 21GZZD39), and the High-level Innovative Talents Training Program in Guizhou Province (Grant NO. 2016-5674).
Acknowledgments
We appreciate the constructive comments and suggestions from the reviewers that helped improve the quality of this manuscript. We also would like to offer our sincere thanks to those who participated in the data processing and manuscript revisions.
Conflicts of Interest
The authors declare no conflict of interest.
References
- Ma, K. On Asia biodiversity conservation and database network. Biodivers. Sci. 2013, 21, 515–516. [Google Scholar]
- Currie, D.J.; Paquin, V. Large-scale biogeographical patterns of species richness of trees. Nature 1987, 6137, 326–327. [Google Scholar] [CrossRef]
- Olson, D.M.; Dinerstein, E. The Global 200: A Representation Approach to Conserving the Earth’s Most Biologically Valuable Ecoregions. Conserv. Biol. 1998, 12, 502–515. [Google Scholar] [CrossRef] [Green Version]
- Luque, G.M.; Hochberg, M.E.; Holyoak, M.; Hossaert, M.; Gaill, F.; Courchamp, F. Ecological effects of environmental change. Ecol. Lett. 2013, 16 (Suppl. S1), 1–3. [Google Scholar] [CrossRef]
- Wang, K.L.; Zhang, C.H.; Chen, H.S.; Yue, Y.M.; Zhang, W.; Zhang, M.Y.; Qi, X.K.; Fu, Z.Y. Karst landscapes of China: Patterns, ecosystem processes and services. Landsc. Ecol. 2019, 34, 2743–2763. [Google Scholar] [CrossRef] [Green Version]
- Sweeting, M.M. Karst in China: Its Geomorphology and Environment; Springer: Berlin/Heidelberg, Germany, 2012. [Google Scholar]
- Steffen, W.; Broadgate, W.; Deutsch, L.; Gaffney, O.; Ludwig, C. The trajectory of the Anthropocene: The Great Acceleration. Anthr. Rev. 2015, 2, 81–98. [Google Scholar] [CrossRef]
- Jiang, Z.; Lian, Y.; Qin, X. Rocky desertification in Southwest China: Impacts, causes, and restoration. Earth-Sci. Rev. 2014, 132, 1–12. [Google Scholar] [CrossRef]
- Yang, Y.; de Sherbinin, A.; Liu, Y. China’s poverty alleviation resettlement: Progress, problems and solutions. Habitat Int. 2020, 98, 102135. [Google Scholar] [CrossRef]
- National Development and Reform Commission. The 13th Five-Year Plan for China’s Poverty Alleviation Resettlement: Great Achievements and Practical Experience Macroeconomic Management; National Development and Reform Commission: Beijing, China, 2021; pp. 4–9. [Google Scholar]
- Jia, H.; Pan, D.; Zhang, W. Health Assessment of Wetland Ecosystems in the Heilongjiang River Basin, China. Wetlands 2015, 35, 1185–1200. [Google Scholar] [CrossRef]
- Lu, D.; Guo, L. Man-earth areal system—The core of geographical study—On the geographical thoughts and academic contributions of academician Wu Chuanjun. Acta Geogr. Sin. 1998, 53, 97–105. [Google Scholar] [CrossRef]
- Vina, A.; McConnell, W.J.; Yang, H.B.; Xu, Z.C.; Liu, J.G. Effects of conservation policy on China’s forest recovery. Sci. Adv. 2016, 2, 1500965. [Google Scholar] [CrossRef]
- Kuznets, S. Economic growth and income inequality. Am. Econ. Rev. 1955, 45, 1–28. [Google Scholar]
- Zhang, J.; Zhan, L.; Lu, C. The long-run effects of poverty alleviation resettlement on child development: Evidence from a quasi-experiment in China. Demogr. Res. 2020, 43, 245–284. [Google Scholar] [CrossRef]
- Gomersall, K. Imposition to agonism: Voluntary poverty alleviation resettlement in rural China. Political Geogr. 2020, 82, 102250. [Google Scholar] [CrossRef]
- Fan, M.; Li, Y.; Li, W. Solving one problem by creating a bigger one: The consequences of ecological resettlement for grassland restoration and poverty alleviation in Northwestern China. Land Use Policy 2015, 42, 124–130. [Google Scholar] [CrossRef]
- Yeh, E.T. Tibetan Range Wars: Spatial Politics and Authority on the Grasslands of Amdo. Dev. Chang. 2003, 34, 499–523. [Google Scholar] [CrossRef]
- Zhou, Z.; Feng, Q.; Zhu, C.; Luo, W.; Wang, L.; Zhao, X.; Zhang, L. The Spatial and Temporal Evolution of Ecological Environment Quality in Karst Ecologically Fragile Areas Driven by Poverty Alleviation Resettlement. Land 2022, 11, 1150. [Google Scholar] [CrossRef]
- Zhu, R.; Shi, J. Studies on the Sustainable Development of Ecological Emigration in Prairie Areas —A Case Study in Wulatezhong Banner of Inner Mongolia Region. J. Arid. Land Resour. Environ. 2007, 21, 28–31. [Google Scholar]
- Jia, G.; Zhu, Z.; Wang, X.; Deng, H.; Pei, Y. Research on the changes of migrant’s livelihood strategies and their ecological effects: A case study of Hongsipu District in Ningxia Province. Res. Agric. Mod. 2016, 37, 505–513. [Google Scholar]
- Zhang, T.; Du, Z.; Yang, J.; Yao, X.; Ou, C.; Niu, B.; Yan, S. Land cover mapping and ecological risk assessment in the context of recent ecological migration. Remote Sens. 2021, 13, 1381. [Google Scholar] [CrossRef]
- Zhang, W.; Zhou, L.; Sun, D.; Hu, F. Spatial migration characteristics and ecological impacts of ecological migrants in arid regions: A case of Gulang County, Gansu Province. Arid Land Geogr. 2022, 45, 618–627. [Google Scholar]
- Feng, Q.; Zhou, Z.; Chen, Q.; Zhu, C. Analysis of temporal and spatial evolution of ESV in Karst Ecologically Vulnerable Region based on the Poverty-alleviation relocation project from inhospitable areas. Acta Ecol. Sin. 2022, 42, 1–10. [Google Scholar]
- Tong, X.; Wang, K.; Yue, Y.; Brandt, M.; Liu, B.; Zhang, C.; Liao, C.; Fensholt, R. Quantifying the effectiveness of ecological restoration projects on long-term vegetation dynamics in the karst regions of Southwest China. Int. J. Appl. Earth Obs. Geoinf. 2017, 54, 105–113. [Google Scholar] [CrossRef] [Green Version]
- Evans, J.; Geerken, R. Discrimination between climate and human-induced dryland degradation. J. Arid. Environ. 2004, 57, 535–554. [Google Scholar] [CrossRef]
- Mohammadi, A.; Costelloe, J.F.; Ryu, D. Application of time series of remotely sensed normalized difference water, vegetation and moisture indices in characterizing flood dynamics of large-scale arid zone floodplains. Remote Sens. Environ. 2017, 190, 70–82. [Google Scholar] [CrossRef]
- Coutts, A.M.; Harris, R.J.; Phan, T.; Livesley, S.J.; Williams, N.S.G.; Tapper, N.J. Thermal infrared remote sensing of urban heat: Hotspots, vegetation, and an assessment of techniques for use in urban planning. Remote Sens. Environ. 2016, 186, 637–651. [Google Scholar] [CrossRef]
- Xu, H.; Wang, M.; Shi, T.; Guan, H.; Fang, C.; Lin, Z. Prediction of ecological effects of potential population and impervious surface increases using a remote sensing based ecological index (RSEI). Ecol. Indic. 2018, 93, 730–740. [Google Scholar] [CrossRef]
- Xu, H.; Wang, Y.; Guan, H.; Shi, T.; Hu, X. Detecting Ecological Changes with a Remote Sensing Based Ecological Index (RSEI) Produced Time Series and Change Vector Analysis. Remote Sens. 2019, 11, 2345. [Google Scholar] [CrossRef] [Green Version]
- Anselin, L. Local Indicators of Spatial Association—LISA. Geogr. Anal. 1995, 27, 93–115. [Google Scholar] [CrossRef]
- Li, P.; Wei, H.; Wu, G.; Wang, P.; Tan, X. Annual Report on Poverty Decuction of China; Social Sciences Academic Press: Beijing, China, 2017. [Google Scholar]
- Xiong, Y.; Xu, W.; Lu, N.; Huang, S.; Wu, C.; Wang, L.; Dai, F.; Kou, W. Assessment of spatial–temporal changes of ecological environment quality based on RSEI and GEE: A case study in Erhai Lake Basin, Yunnan province, China. Ecol. Indic. 2021, 125, 107518. [Google Scholar] [CrossRef]
- Tamiminia, H.; Salehi, B.; Mahdianpari, M.; Quackenbush, L.; Adeli, S.; Brisco, B. Google Earth Engine for geo-big data applications: A meta-analysis and systematic review. ISPRS J. Photogramm. Remote Sens. 2020, 164, 152–170. [Google Scholar] [CrossRef]
- Lymburner, L.; Botha, E.; Hestir, E.; Anstee, J.; Sagar, S.; Dekker, A.; Malthus, T. Landsat 8: Providing continuity and increased precision for measuring multi-decadal time series of total suspended matter. Remote Sens. Environ. 2016, 185, 108–118. [Google Scholar] [CrossRef]
- Parastatidis, D.; Mitraka, Z.; Chrysoulakis, N.; Abrams, M. Online global land surface temperature estimation from Landsat. Remote Sens. 2017, 9, 1208. [Google Scholar] [CrossRef] [Green Version]
- Jiménez-Muñoz, J.C.; Cristóbal, J.; Sobrino, J.A.; Sòria, G.; Ninyerola, M.; Pons, X. Revision of the single-channel algorithm for land surface temperature retrieval from Landsat thermal-infrared data. IEEE Trans. Geosci. Remote Sens. 2008, 47, 339–349. [Google Scholar] [CrossRef]
- Hu, X.; Xu, H. A new remote sensing index for assessing the spatial heterogeneity in urban ecological quality: A case from Fuzhou City, China. Ecol. Indic. 2018, 89, 11–21. [Google Scholar] [CrossRef]
- Chatterjee, S.; Bisai, D.; Khan, A. Detection of Approximate Potential Trend Turning Points in Temperature Time Series (1941-2010) for Asansol Weather Observation Station, West Bengal, India. Atmos. Clim. Sci. 2014, 4, 64–69. [Google Scholar] [CrossRef]
- Qu, B.; Zhu, W.; Jia, S.; Lv, A. Spatio-Temporal Changes in Vegetation Activity and Its Driving Factors during the Growing Season in China from 1982 to 2011. Remote Sens. 2015, 7, 13729–13752. [Google Scholar] [CrossRef] [Green Version]
- Wang, S.; Zhang, X.; Zhu, T.; Yang, W.; Zhao, J. Assessment of ecological environment quality in the Changbai Mountain Nature Reserve based on remote sensing technology. Prog. Geogr. 2016, 35, 1269–1278. [Google Scholar]
- Yuan, B.; Fu, L.; Zou, Y.; Zhang, S.; Xie, Y. Spatiotemporal change detection of ecological quality and the associated affecting factors in Dongting Lake Basin, Based on RSEI. J. Clean. Prod. 2021, 302, 126995. [Google Scholar] [CrossRef]
- Qi, X.; Li, Q.; Yue, Y.; Liao, C.; Xiong, Y. Rural–Urban Migration and Conservation Drive the Ecosystem Services Improvement in China Karst: A Case Study of HuanJiang County, Guangxi. Remote Sens. 2021, 13, 566. [Google Scholar] [CrossRef]
- Zhang, X.; Brandt, M.; Tong, X.; Ciais, P.; Yue, Y.; Xiao, X.; Zhang, W.; Wang, K.; Fensholt, R. A large but transient carbon sink from urbanization and rural depopulation in China. Nat. Sustain. 2022, 5, 321–328. [Google Scholar] [CrossRef]
- Li, W.; Tan, M. Influences of vertical differences in population emigration on mountainous vegetation greenness: A case study in the Taihang Mountains. Sci. Rep. 2018, 8, 16954. [Google Scholar] [CrossRef] [PubMed] [Green Version]
- Rogers, S.; Xue, T. Resettlement and climate change vulnerability: Evidence from rural China. Glob. Environ. Chang. 2015, 6137, 326–327. [Google Scholar] [CrossRef]
- Mark, Z. China’s tree-planting drive could falter in a warming world. Nature 2019, 573, 474–475. [Google Scholar]
- Cai, H.; Yang, X.; Wang, K.; Xiao, L. Is forest restoration in the southwest China Karst promoted mainly by climate change or human-induced factors? Remote Sens. 2014, 6, 9895–9910. [Google Scholar] [CrossRef] [Green Version]
- Tousignant, M.-Ê.; Pellerin, S.; Brisson, J. The relative impact of human disturbances on the vegetation of a large wetland complex. Wetlands 2010, 30, 333–344. [Google Scholar] [CrossRef]
- Guo, B.; Fang, Y.; Jin, X. Monitoring the effects of land consolidation on the ecological environmental quality based on remote sensing: A case study of Chaohu Lake Basin, China. Land Use Policy 2020, 95, 104569. [Google Scholar] [CrossRef]
- Nie, X.; Hu, Z.; Zhu, Q.; Ruan, M. Research on temporal and spatial resolution and the driving forces of ecological environment quality in coal mining areas considering topographic correction. Remote Sens. 2021, 13, 2815. [Google Scholar] [CrossRef]
- Tong, X.; Brandt, M.; Yue, Y.; Horion, S.; Wang, K.; De Keersmaecker, W.; Tian, F.; Schurgers, G.; Xiao, X.; Luo, Y.; et al. Increased vegetation growth and carbon stock in China karst via ecological engineering. Nat. Sustain. 2018, 1, 44–50. [Google Scholar] [CrossRef]
Figure 1.
Degree of stone desertification in 2020 (a); Population distribution on the county level in 2020 (b).
Figure 1.
Degree of stone desertification in 2020 (a); Population distribution on the county level in 2020 (b).

Figure 2.
Distribution of PAR settlements 2016–2019 (a); spatial distribution of population moving out at township level 2016–2019 (b).
Figure 2.
Distribution of PAR settlements 2016–2019 (a); spatial distribution of population moving out at township level 2016–2019 (b).

Figure 3.
Technical roadmap in the paper.

Figure 4.
Trend in RSEI. (a) Trend in RSEI from Landsat, resolution of 30–60 m, higher precision, more ideal map results; (b) Trend in RSEI from MODIS, karst mountainous terrain broken, small plot area, not applicable, for reference only.
Figure 4.
Trend in RSEI. (a) Trend in RSEI from Landsat, resolution of 30–60 m, higher precision, more ideal map results; (b) Trend in RSEI from MODIS, karst mountainous terrain broken, small plot area, not applicable, for reference only.

Figure 5.
Trends of 4 indicators of RSEI. Among them, NDVI and Wet indicators were positively correlated with RSEI, and LST and NDSI were negatively correlated with RSEI.
Figure 5.
Trends of 4 indicators of RSEI. Among them, NDVI and Wet indicators were positively correlated with RSEI, and LST and NDSI were negatively correlated with RSEI.

Figure 6.
The potential turning point of the change of annual RSEI (a); RSEI inter-annual variations and linear trends for the two periods (b).
Figure 6.
The potential turning point of the change of annual RSEI (a); RSEI inter-annual variations and linear trends for the two periods (b).

Figure 7.
EEQ dynamics change during the study period. (a) The current EEQ in 1996; (b) The current EEQ in 2015; (c) The current EEQ in 2021; (d) The spatial variation of RSEI over 1996–2015; (e) The spatial variation of RSEI over 2015–2021; (f) The spatial variation of RSEI over the whole study period (normal indicates 1 rank change, significant indicates 2 and more rank changes).

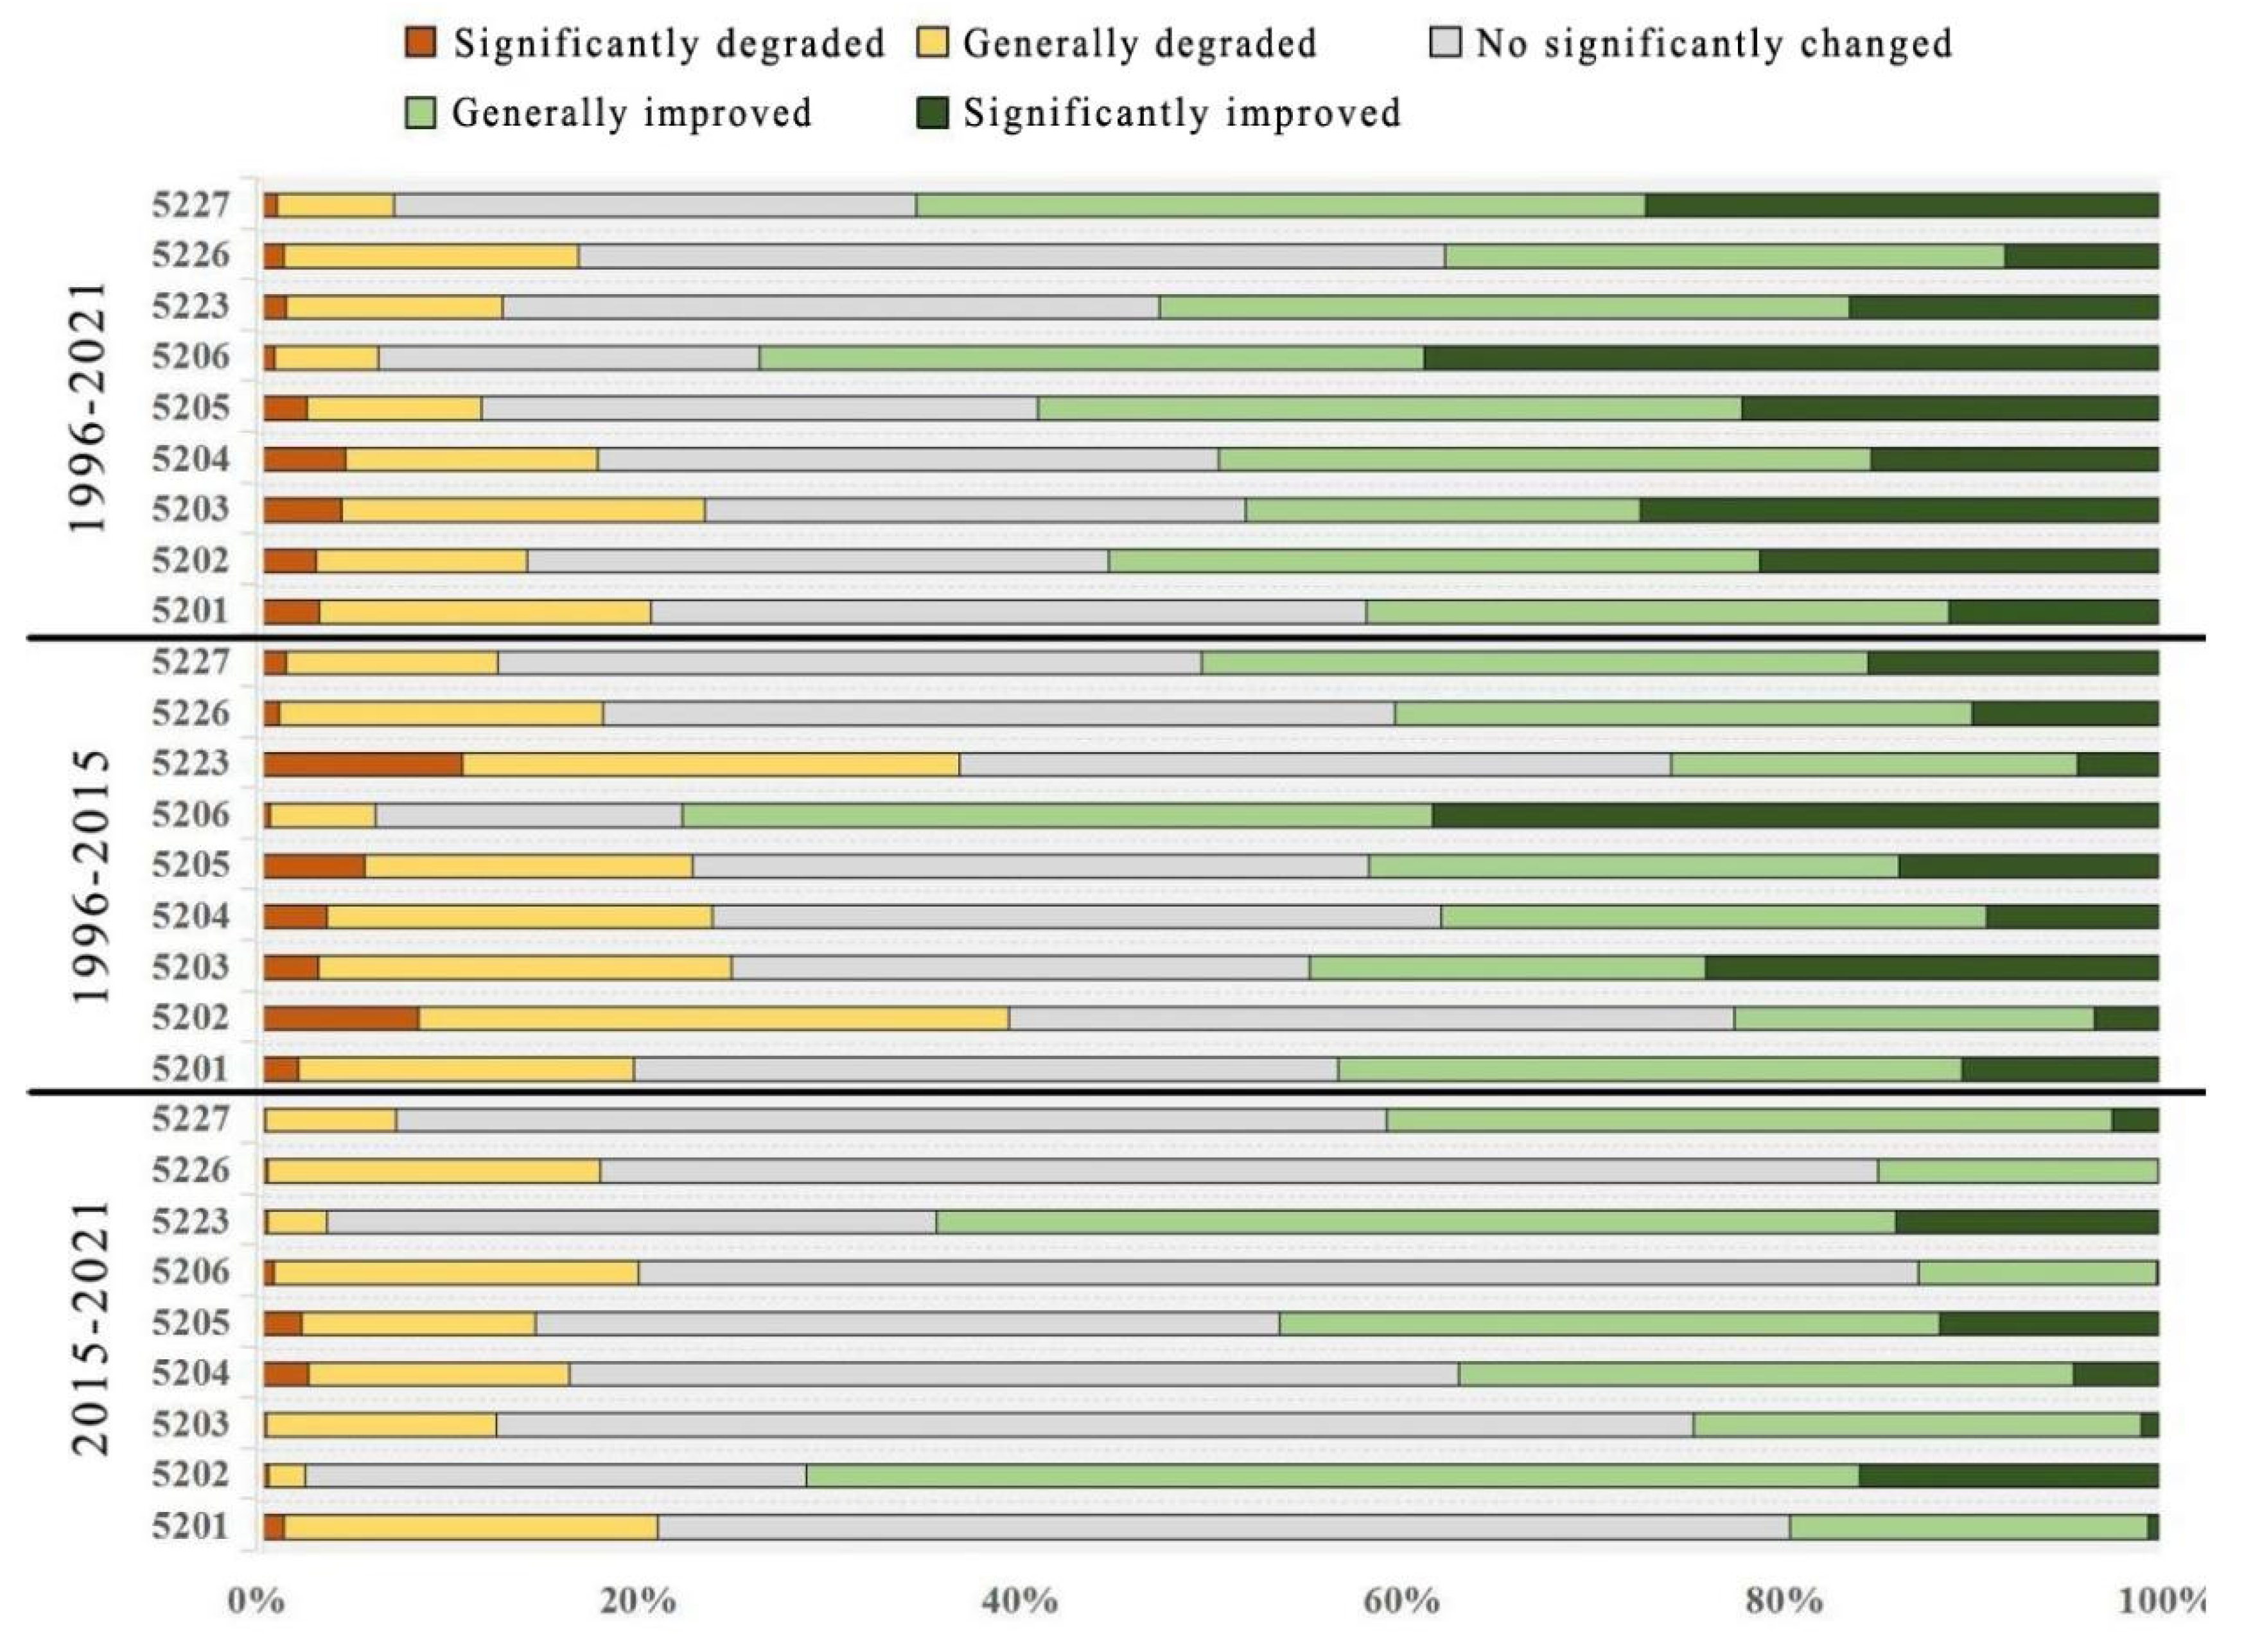
Figure 8.
EEQ dynamics by classified RSEI in prefecture; grade changes are divided into five grades, namely, remarkedly degraded (≤−2), generally degraded (−1), no striking change (0), generally ameliorated (1), and strikingly ameliorated (≥2). Administrative codes are represented as follows: 5201 is Guiyang, 5202 is Liupanshui, 5203 is Zunyi, 5204 is Anshun, 5205 is Bijie, 5206 is Tongren, 5223 is Qianxinan, 5226 is Qiandongnan, and 5227 is Qiannan.

Figure 9.
(a) The P–P plot of regression standardized residuals; (b) Residual scatter diagram. Note that (a,b) indicate that this linear regression fit fully satisfied the conditions of use; (c) Implementation period residual results distribution statistics.
Figure 9.
(a) The P–P plot of regression standardized residuals; (b) Residual scatter diagram. Note that (a,b) indicate that this linear regression fit fully satisfied the conditions of use; (c) Implementation period residual results distribution statistics.

Figure 10.
Coupling harmonious degree of density of relocated population and change of RSEI. (a) PAR density distribution; (b) Morlan index of 0.749, with an overall substantial spatial correlation; (c) Univariate local Morlan index, RSEI variables were extremely clustered; (d) Bivariate Morlan index, H–H in the west, relocation population with more RSEI increased remarkably, H–L concentrated around H-H, relocation population with less RSEI also increased noticeably, L–H concentrated in the east, relocation population with more RSEI exhibited a decreasing trend, L–L concentrated in areas with comparatively good economy, and relocation population and the RSEI decreased with less relocation population.

Figure 11.
Liping RSEI change. (a) Liping RSEI change (2015–2021); (b) Liping RSEI in 1996; (c) Liping RSEI in 2015; (d) Liping RSEI in 2021; (e) PAR population distribution in Liping.
Figure 11.
Liping RSEI change. (a) Liping RSEI change (2015–2021); (b) Liping RSEI in 1996; (c) Liping RSEI in 2015; (d) Liping RSEI in 2021; (e) PAR population distribution in Liping.

Figure 12.
Pu’an RSEI change. (a) Pu’an RSEI change (2015–2021); (b) Pu’an RSEI in 1996; (c) Pu’an RSEI in 2015; (d) Pu’an RSEI in 2021; (e) PAR population distribution in Pu’an.
Figure 12.
Pu’an RSEI change. (a) Pu’an RSEI change (2015–2021); (b) Pu’an RSEI in 1996; (c) Pu’an RSEI in 2015; (d) Pu’an RSEI in 2021; (e) PAR population distribution in Pu’an.


Table 1.
Correlation coefficient matrix of indices over the period 1996–2021.
| Indicator | NDVI | WET | LST | NDISI | RSEI |
|---|---|---|---|---|---|
| NDVI | 1 | 0.701 | −0.086 | −0.776 | 0.833 |
| WET | 0.701 | 1 | −0.418 | −0.75 | 0.878 |
| LST | −0.086 | −0.418 | 1 | 0.311 | −0.451 |
| NDISI | −0.776 | −0.75 | 0.311 | 1 | −0.878 |
| RSEI | 0.833 | 0.878 | −0.451 | −0.878 | 1 |
| Sig | <0.001 | <0.001 | 0.095 | <0.001 |
Table 2.
Analysis of PAR contribution to RSEI during the implementation period.
| Year | 2016 | 2017 | 2018 | 2019 | 2020 | 2021 |
|---|---|---|---|---|---|---|
| Actual measurement of RSEI | 0.6541 | 0.6390 | 0.6545 | 0.6553 | 0.6614 | |
| Predicted RSEI | 0.6203 | 0.6169 | 0.6128 | 0.6221 | 0.6224 | 0.6192 |
| Residuals | 0.0338 | 0.0221 | 0.0417 | 0.0331 | 0.0422 | |
| Residuals to measured weight | 5.17% | 3.46% | 6.37% | 5.05% | 6.38% |
Table 3.
Summary table of positive and disadvantageous influences of PAR.
| Indicators | Positive Effects | Disadvantageous Influences |
|---|---|---|
| Social effects | Tremendously ameliorates the housing and medical and educational conditions of relocated farmers, and provides them with more training, study and employment opportunities. | Cost of living rises, habitual lifestyles are changed, and original cultural heritage is affected |
| Suitable range | After relocation, the RSEI of the western Liupanshui and other regions with more prominent human–land conflicts, comparatively fragile ecologies, and comparatively high arable land settlement rates heightened noticeably. | The RSEI of the eastern Qiandongnan and other regions with less prominent human–land conflicts and relatively good ecologies decreased to a certain extent. |
| RSEI indicators | NDVI and NDISI are optimized, contributing to the overall improvement of RSEI indicators | WET indicators are ameliorated to a certain extent, while LST indicators are not noticeably declining, contributing to the limited extent of RSEI growth |
| Biodiversity | After relocation, human disturbance to ecology is reduced, which is conducive to the development of regional biodiversity | The land tends to be managed on a larger scale in the later stage, resulting in the monoculture of tree species to a certain extent |
Publisher’s Note: MDPI stays neutral with regard to jurisdictional claims in published maps and institutional affiliations. |
© 2022 by the authors. Licensee MDPI, Basel, Switzerland. This article is an open access article distributed under the terms and conditions of the Creative Commons Attribution (CC BY) license (https://creativecommons.org/licenses/by/4.0/).
Share and Cite
MDPI and ACS Style
Feng, Q.; Zhou, Z.; Zhu, C.; Luo, W.; Zhang, L. Quantifying the Ecological Effectiveness of Poverty Alleviation Relocation in Karst Areas. Remote Sens. 2022, 14, 5920. https://doi.org/10.3390/rs14235920
AMA Style
Feng Q, Zhou Z, Zhu C, Luo W, Zhang L. Quantifying the Ecological Effectiveness of Poverty Alleviation Relocation in Karst Areas. Remote Sensing. 2022; 14(23):5920. https://doi.org/10.3390/rs14235920
Chicago/Turabian StyleFeng, Qing, Zhongfa Zhou, Changli Zhu, Wanlin Luo, and Lu Zhang. 2022. "Quantifying the Ecological Effectiveness of Poverty Alleviation Relocation in Karst Areas" Remote Sensing 14, no. 23: 5920. https://doi.org/10.3390/rs14235920
Note that from the first issue of 2016, this journal uses article numbers instead of page numbers. See further details here.