
Comparative Study of Predominantly Daytime and Nighttime Lightning Occurrences and Their Impact on Ionospheric Disturbances


Abstract
:
1. Introduction
2. Data and Methods
2.1. Lightning Data
2.2. GNSS Data
2.3. Method
2.3.1. ROTI
2.3.2. Hourly Occurrence
2.3.3. Selection Criteria
3. Results
4. Discussions
5. Conclusions
Author Contributions
Funding
Data Availability Statement
Acknowledgments
Conflicts of Interest
References
- Cherniak, I.; Zakharenkova, I. Large-Scale Traveling Ionospheric Disturbances Origin and Propagation: Case Study of the December 2015 Geomagnetic Storm. Space Weather 2018, 16, 1377–1395. [Google Scholar] [CrossRef]
- Lu, Y.; Wang, Z.; Ji, S.; Chen, W. Assessing the Positioning Performance under the Effects of Strong Ionospheric Anomalies with Multi-GNSS in Hong Kong. Radio Sci. 2020, 55, 1–18. [Google Scholar] [CrossRef]
- Afraimovich, E.L.; Astafyeva, E.I.; Demyanov, V.V.; Edemskiy, I.K.; Gavrilyuk, N.S.; Ishin, A.B.; Kosogorov, E.A.; Leonovich, L.A.; Lesyuta, O.S.; Palamartchouk, K.S.; et al. A review of GPS/GLONASS studies of the ionospheric response to natural and anthropogenic processes and phenomena. J. Space Weather Space Clim. 2013, 3, A27. [Google Scholar] [CrossRef] [Green Version]
- Lay, E.H.; Shao, X.M.; Carrano, C.S. Variation in total electron content above large thunderstorms. Geophys. Res. Lett. 2013, 40, 1945–1949. [Google Scholar] [CrossRef]
- Chen, G.; Zhou, C.; Liu, Y.; Zhao, J.; Tang, Q.; Wang, X.; Zhao, Z. A statistical analysis of medium-scale traveling ionospheric disturbances during 2014–2017 using the Hong Kong CORS network. Earth Planets Space 2019, 71, 52. [Google Scholar] [CrossRef]
- Yang, Z.; Liu, Z. Observational study of ionospheric irregularities and GPS scintillations associated with the 2012 tropical cyclone Tembin passing Hong Kong. J. Geophys. Res. Space Phys. 2016, 121, 4705–4717. [Google Scholar] [CrossRef]
- Polyakova, A.S.; Perevalova, N.P. Investigation into impact of tropical cyclones on the ionosphere using GPS sounding and NCEP/NCAR Reanalysis data. Adv. Space Res. 2011, 48, 1196–1210. [Google Scholar] [CrossRef]
- Mao, T.; Wang, J.; Yang, G.; Yu, T.; Ping, J.; Suo, Y. Effects of typhoon Matsa on ionospheric TEC. Chin. Sci. Bull. 2010, 55, 712–717. [Google Scholar] [CrossRef]
- Kong, J.; Yao, Y.; Zhou, C.; Liu, Y.; Zhai, C.; Wang, Z.; Liu, L. Tridimensional reconstruction of the Co-Seismic Ionospheric Disturbance around the time of 2015 Nepal earthquake. J. Geod. 2018, 92, 1255–1266. [Google Scholar] [CrossRef]
- Miyazaki, S.I.; Larson, K.M. Coseismic and early postseismic slip for the 2003 Tokachi-oki earthquake sequence inferred from GPS data. Geophys. Res. Lett. 2008, 35, L04302. [Google Scholar] [CrossRef] [Green Version]
- Craig, T.J.; Calais, E. Strain accumulation in the New Madrid and Wabash Valley seismic zones from 14 years of continuous GPS observation. J. Geophys. Res. Solid Earth 2014, 119, 9110–9129. [Google Scholar] [CrossRef]
- Calais, E.; Minster, J.B. GPS, earthquakes, the ionosphere, and the Space Shuttle. Phys. Earth Planet. Inter. 1998, 105, 167–181. [Google Scholar] [CrossRef]
- Afraimovich, E.L.; Ding, F.; Kiryushkin, V.V.; Astafyeva, E.I.; Jin, S.; Sankov, V.A. TEC response to the 2008 Wenchuan Earthquake in comparison with other strong earthquakes. Int. J. Remote Sens. 2010, 31, 3601–3613. [Google Scholar] [CrossRef] [Green Version]
- Mendillo, M. The effect of rocket launches on the ionosphere. Adv. Space Res. 1981, 1, 275–290. [Google Scholar] [CrossRef]
- Kundu, B.; Senapati, B.; Matsushita, A.; Heki, K. Atmospheric wave energy of the 2020 August 4 explosion in Beirut, Lebanon, from ionospheric disturbances. Sci. Rep. 2021, 11, 2793. [Google Scholar] [CrossRef]
- Osei-Poku, L.; Tang, L.; Chen, W.; Mingli, C. Evaluating Total Electron Content (TEC) Detrending Techniques in Determining Ionospheric Disturbances during Lightning Events in A Low Latitude Region. Remote Sens. 2021, 13, 4753. [Google Scholar] [CrossRef]
- Rahmani, Y.; Alizadeh, M.M.; Schuh, H.; Wickert, J.; Tsai, L.-C. Probing vertical coupling effects of thunderstorms on lower ionosphere using GNSS data. Adv. Space Res. 2020, 66, 1967–1976. [Google Scholar] [CrossRef]
- Ogunsua, B.O.; Srivastava, A.; Bian, J.; Qie, X.; Wang, D.; Jiang, R.; Yang, J. Significant Day-time Ionospheric Perturbation by Thunderstorms along the West African and Congo Sector of Equatorial Region. Sci. Rep. 2020, 10, 8466. [Google Scholar] [CrossRef]
- Tang, L.; Chen, W.; Chen, M.; Osei-Poku, L. Statistical observation of thunderstorm-induced ionospheric Gravity waves above low-latitude areas in the northern hemisphere. Remote Sens. 2019, 11, 2732. [Google Scholar] [CrossRef] [Green Version]
- Liu, T.; Yu, Z.; Ding, Z.; Nie, W.; Xu, G. Observation of Ionospheric Gravity Waves Introduced by Thunderstorms in Low Latitudes China by GNSS. Remote Sens. 2021, 13, 4131. [Google Scholar] [CrossRef]
- Blanc, E.; Ceranna, L.; Hauchecorne, A.; Charlton-Perez, A.; Marchetti, E.; Evers, L.G.; Kvaerna, T.; Lastovicka, J.; Eliasson, L.; Crosby, N.B.; et al. Toward an Improved Representation of Middle Atmospheric Dynamics Thanks to the ARISE Project. Surv. Geophys. 2018, 39, 171–225. [Google Scholar] [CrossRef] [Green Version]
- Lay, E.H. Ionospheric Irregularities and Acoustic/Gravity Wave Activity Above Low-Latitude Thunderstorms. Geophys. Res. Lett. 2018, 45, 90–97. [Google Scholar] [CrossRef] [Green Version]
- Amin, M.M. Influence of Lightning on Electron Density Variation in the Ionosphere Using WWLLN Lightning Data and GPS Data. Master’s Thesis, University of Cape Town, Cape Town, South Africa, 2015. [Google Scholar]
- Qin, Z.; Chen, M.; Lyu, F.; Cummer, S.A.; Gao, Y.; Liu, F.; Zhu, B.; Du, Y.P.; Usmani, A.; Qiu, Z. Prima Facie Evidence of the Fast Impact of a Lightning Stroke on the Lower Ionosphere. Geophys. Res. Lett. 2020, 47, e2020GL090274. [Google Scholar] [CrossRef]
- Salem, M.A.; Liu, N.; Rassoul, H.K. Modification of the lower ionospheric conductivity by thunderstorm electrostatic fields. Geophys. Res. Lett. 2016, 43, 5–12. [Google Scholar] [CrossRef]
- Ji, S.; Chen, W.; Wang, Z.; Xu, Y.; Weng, D.; Wan, J.; Fan, Y.; Huang, B.; Fan, S.; Sun, G.; et al. A study of occurrence characteristics of plasma bubbles over Hong Kong area. Adv. Space Res. 2013, 52, 1949–1958. [Google Scholar] [CrossRef]
- Kumar, S.; Chen, W.; Chen, M.; Liu, Z.; Singh, R.P. Thunderstorm-/lightning-induced ionospheric perturbation: An observation from equatorial and low-latitude stations around Hong Kong. J. Geophys. Res. Space Phys. 2017, 122, 9032–9044. [Google Scholar] [CrossRef]
- Pi, X.; Mannucci, A.J.; Lindqwister, U.J.; Ho, C.M. Monitoring of global ionospheric irregularities using the worldwide GPS network. Geophys. Res. Lett. 1997, 24, 2283–2286. [Google Scholar] [CrossRef]
- Yang, Z.; Liu, Z. Correlation between ROTI and Ionospheric Scintillation Indices using Hong Kong low-latitude GPS data. GPS Solut. 2016, 20, 815–824. [Google Scholar] [CrossRef]
- Yang, Z.; Liu, Z. Low-Latitude Ionospheric Density Irregularities and Associated Scintillations Investigated by Combining COSMIC RO and Ground-Based Global Positioning System Observations Over a Solar Active Period. J. Geophys. Res. Space Phys. 2018, 123, 3998–4014. [Google Scholar] [CrossRef]
- Tang, L.; Louis, O.-P.; Chen, W.; Chen, M. A ROTI-Aided Equatorial Plasma Bubbles Detection Method. Remote Sens. 2021, 13, 4356. [Google Scholar] [CrossRef]
- Wu, Q.; Chou, M.-Y.; Schreiner, W.; Braun, J.; Pedatella, N.; Cherniak, I. COSMIC observation of stratospheric gravity wave and ionospheric scintillation correlation. J. Atmos. Sol. Terr. Phys. 2021, 217, 105598. [Google Scholar] [CrossRef]
- Oladipo, O.A.; Schüler, T. Equatorial ionospheric irregularities using GPS TEC derived index. J. Atmos. Sol. Terr. Phys. 2013, 92, 78–82. [Google Scholar] [CrossRef]
- Loewe, C.A. Classification and mean behavior of magnetic storms. J. Geophys. Res. A Space Phys. 1997, 102, 14209–14213. [Google Scholar] [CrossRef]
- Yu, S.; Liu, Z. The ionospheric condition and GPS positioning performance during the 2013 tropical cyclone Usagi event in the Hong Kong region. Earth Planets Space 2021, 73, 66. [Google Scholar] [CrossRef]
- Nishioka, M.; Saito, A.; Tsugawa, T. Occurrence characteristics of plasma bubble derived from global ground-based GPS receiver networks. J. Geophys. Res. Space Phys. 2008, 113. [Google Scholar] [CrossRef]
- Patel, K.; Singh, A.; Singh, S.B.; Singh, A.K. Causes responsible for intense and severe storms during the declining phase of Solar Cycle 24. J. Astrophys. Astron. 2019, 40, 4. [Google Scholar] [CrossRef]
- Jacobsen, K.S. The impact of different sampling rates and calculation time intervals on ROTI values. J. Space Weather Space Clim. 2014, 4, A33. [Google Scholar] [CrossRef] [Green Version]
- Liu, Z.; Yang, Z.; Xu, D.; Morton, Y.J. On Inconsistent ROTI Derived From Multiconstellation GNSS Measurements of Globally Distributed GNSS Receivers for Ionospheric Irregularities Characterization. Radio Sci. 2019, 54, 215–232. [Google Scholar] [CrossRef]
- Pinto, I.R.C.A.; Pinto, O.; Rocha, R.M.L.; Diniz, J.H.; Carvalho, A.M.; Filho, A.C. Cloud-to-ground lightning in southeastern Brazil in 1993: 2. Time variations and flash characteristics. J. Geophys. Res. Atmos. 1999, 104, 31381–31387. [Google Scholar] [CrossRef] [Green Version]
- Lopez, R.E.; Holle, R.L. Diurnal and Spatial Variability of Lightning Activity in Northeastern Colorado and Central Florida during the Summer. Mon. Weather Rev. 1986, 114, 1288–1312. [Google Scholar] [CrossRef] [Green Version]
- Williams, E.R.; Heckman, S.J. The local diurnal variation of cloud electrification and the global diurnal variation of negative charge on the Earth. J. Geophys. Res. Atmos. 1993, 98, 5221–5234. [Google Scholar] [CrossRef]
- Kandalgaonkar, S.S.; Tinmaker, M.I.R.; Kulkarni, J.R.; Nath, A. Diurnal variation of lightning activity over the Indian region. Geophys. Res. Lett. 2003, 30. [Google Scholar] [CrossRef]
- Easterling, D.R.; Robinson, P.J. The Diurnal Variation of Thunderstorm Activity in the United States. J. Appl. Meteorol. Climatol. 1985, 24, 1048–1058. [Google Scholar] [CrossRef]
- Kuo, C.L.; Lee, L.C. Ionospheric plasma dynamics and instability caused by upward currents above thunderstorms. J. Geophys. Res. Space Phys. 2015, 120, 3240–3253. [Google Scholar] [CrossRef] [Green Version]
- Collier, A.B.; Hughes, A.R.W.; Lichtenberger, J.; Steinbach, P. Seasonal and diurnal variation of lightning activity over southern Africa and correlation with European whistler observations. Ann. Geophys. 2006, 24, 529–542. [Google Scholar] [CrossRef] [Green Version]
- Alexander, M.J.; Holton, J.R.; Durran, D.R. The Gravity Wave Response above Deep Convection in a Squall Line Simulation. J. Atmos. Sci. 1995, 52, 2212–2226. [Google Scholar] [CrossRef] [Green Version]
- Vadas, S.L.; Liu, H.-I. Generation of large-scale gravity waves and neutral winds in the thermosphere from the dissipation of convectively generated gravity waves. J. Geophys. Res. Space Phys. 2009, 114, A10310. [Google Scholar] [CrossRef]
- Pasko, V.P.; Inan, U.S.; Bell, T.F.; Reising, S.C. Mechanism of ELF radiation from sprites. Geophys. Res. Lett. 1998, 25, 3493–3496. [Google Scholar] [CrossRef] [Green Version]
- Occhipinti, G.; Rolland, L.; Lognonné, P.; Watada, S. From Sumatra 2004 to Tohoku-Oki 2011: The systematic GPS detection of the ionospheric signature induced by tsunamigenic earthquakes. J. Geophys. Res. Space Phys. 2013, 118, 3626–3636. [Google Scholar] [CrossRef]
- Row, R.V. Acoustic-gravity waves in the upper atmosphere due to a nuclear detonation and an earthquake. J. Geophys. Res. 1967, 72, 1599–1610. [Google Scholar] [CrossRef]
- Francis, S.H. Global propagation of atmospheric gravity waves: A review. J. Atmos. Terr. Phys. 1975, 37, 1011–1054. [Google Scholar] [CrossRef]
- Taylor, M.J.; Hapgood, M.A. Identification of a thunderstorm as a source of short period gravity waves in the upper atmospheric nightglow emissions. Planet. Space Sci. 1988, 36, 975–985. [Google Scholar] [CrossRef]
- Chimonas, G. Enhancement of sporadicEby horizontal transport within the layer. J. Geophys. Res. 1971, 76, 4578–4586. [Google Scholar] [CrossRef]
- Taranenko, Y.N.; Inan, U.S.; Bell, T.F. Interaction with the lower ionosphere of electromagnetic pulses from lightning: Heating, attachment, and ionization. Geophys. Res. Lett. 1993, 20, 1539–1542. [Google Scholar] [CrossRef]
- Marshall, R.A.; Inan, U.S.; Chevalier, T.W. Early VLF perturbations caused by lightning EMP-driven dissociative attachment. Geophys. Res. Lett. 2008, 35. [Google Scholar] [CrossRef]
- Marshall, R.A. Effect of self-absorption on attenuation of lightning and transmitter signals in the lower ionosphere. J. Geophys. Res. Space Phys. 2014, 119, 4062–4076. [Google Scholar] [CrossRef]
- Cheng, Z.; Cummer, S.A.; Baker, D.N.; Kanekal, S.G. Nighttime D region electron density profiles and variabilities inferred from broadband measurements using VLF radio emissions from lightning. J. Geophys. Res. Space Phys. 2006, 111. [Google Scholar] [CrossRef] [Green Version]
- Shao, X.M.; Lay, E.H.; Jacobson, A.R. Reduction of electron density in the night-time lower ionosphere in response to a thunderstorm. Nat. Geosci. 2012, 6, 29–33. [Google Scholar] [CrossRef]
- Armstrong, W.C. Recent advance from studies of the Trimpi effect. Antarct. Jour. 1983, 18, 281–290. [Google Scholar]
- Leyser, T.B.; Inan, U.S.; Carpenter, D.L.; Trimpi, M.L. Diurnal variation of burst precipitation effects on subionospheric VLF/LF signal propagation near L = 2. J. Geophys. Res. Space Phys. 1984, 89, 9139–9143. [Google Scholar] [CrossRef]
- Rodger, C.J. Subionospheric VLF perturbations associated with lightning discharges. J. Atmos. Sol. Terr. Phys. 2003, 65, 591–606. [Google Scholar] [CrossRef]
- Lay, E.H.; Shao, X.M.; Kendrick, A.K.; Carrano, C.S. Ionospheric acoustic and gravity waves associated with midlatitude thunderstorms. J. Geophys. Res. A Space Phys. 2015, 120, 6010–6020. [Google Scholar] [CrossRef]
- Interpret all Statistics and Graphs for Cross Correlation. Available online: https://support.minitab.com/en-us/minitab/18/help-and-how-to/modeling-statistics/time-series/how-to/cross-correlation/interpret-the-results/all-statistics-and-graphs/ (accessed on 10 June 2022).


| Year | Number of Lightning Days |
|---|---|
| 2014 | 85 |
| 2015 | 81 |
| 2016 | 108 |
| 2017 | 102 |
| Cross-Correlation Coefficient | n | k | ECCF | ||
|---|---|---|---|---|---|
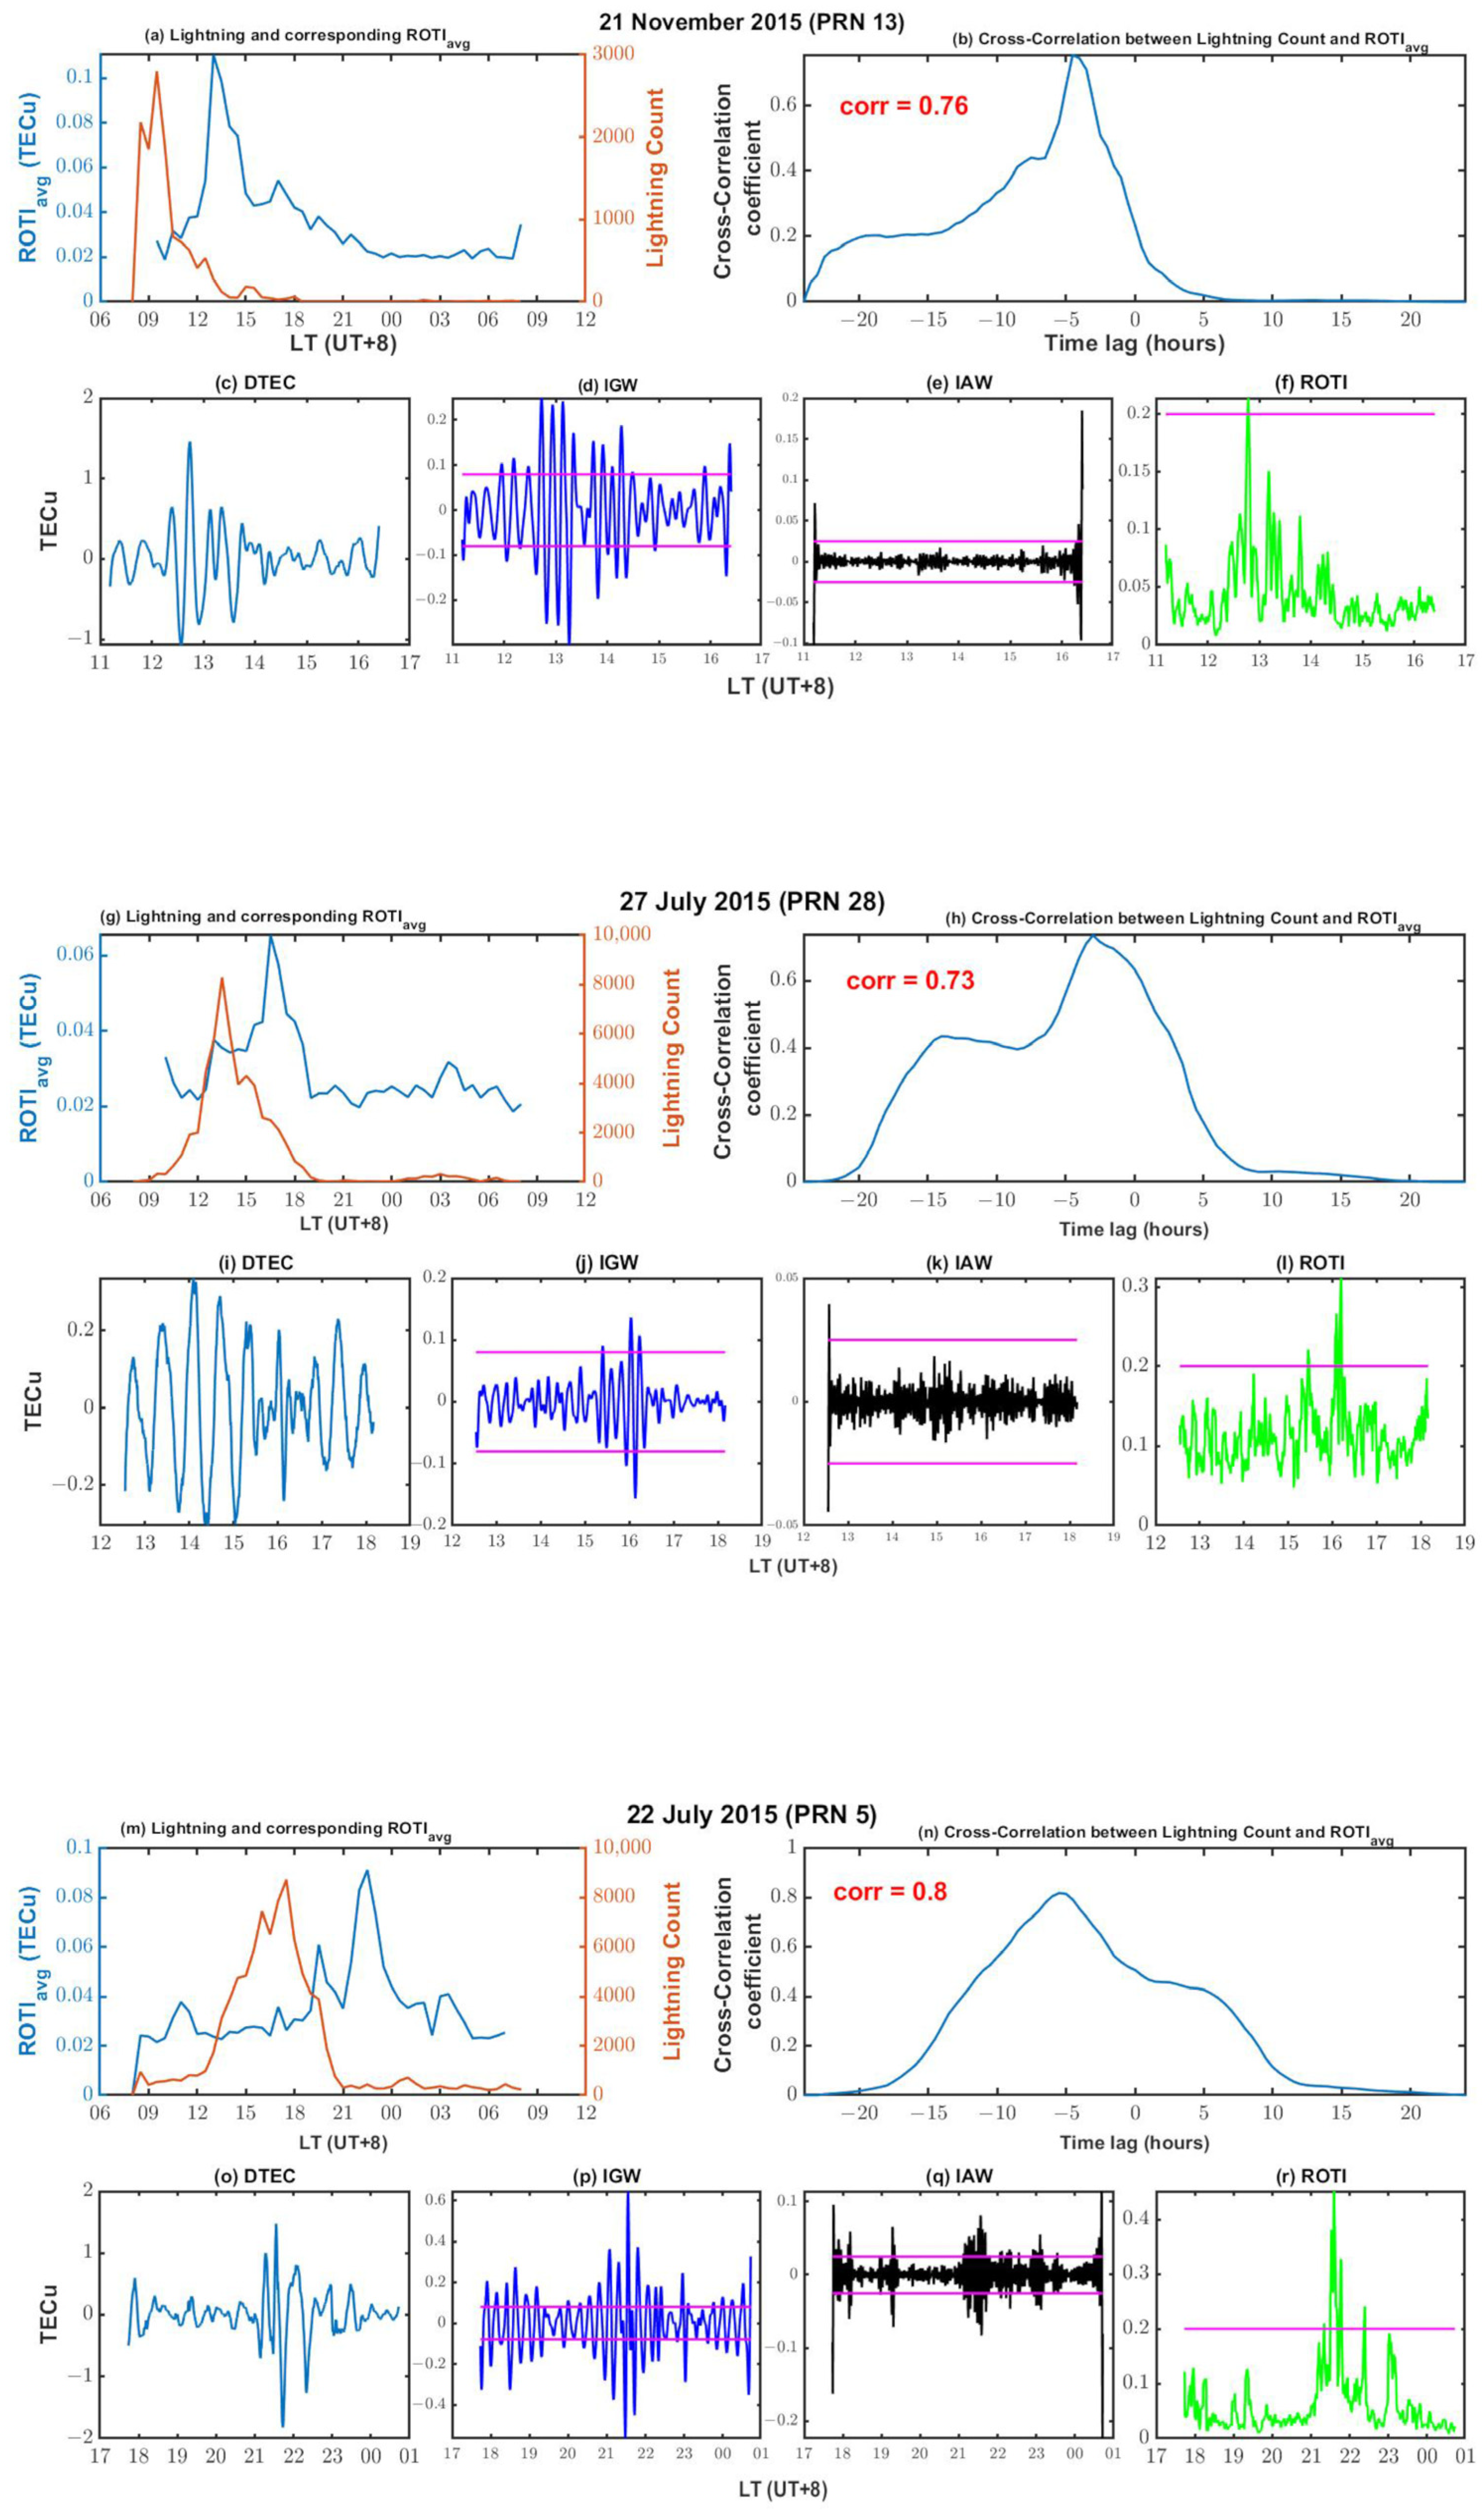
| Days in Figure 3 | 21 November 2015 | 0.76 | 48 | −9 | 0.32 |
| 27 July 2015 | 0.76 | 48 | −6 | 0.31 | |
| 22 July 2015 | 0.8 | 48 | −11 | 0.33 | |
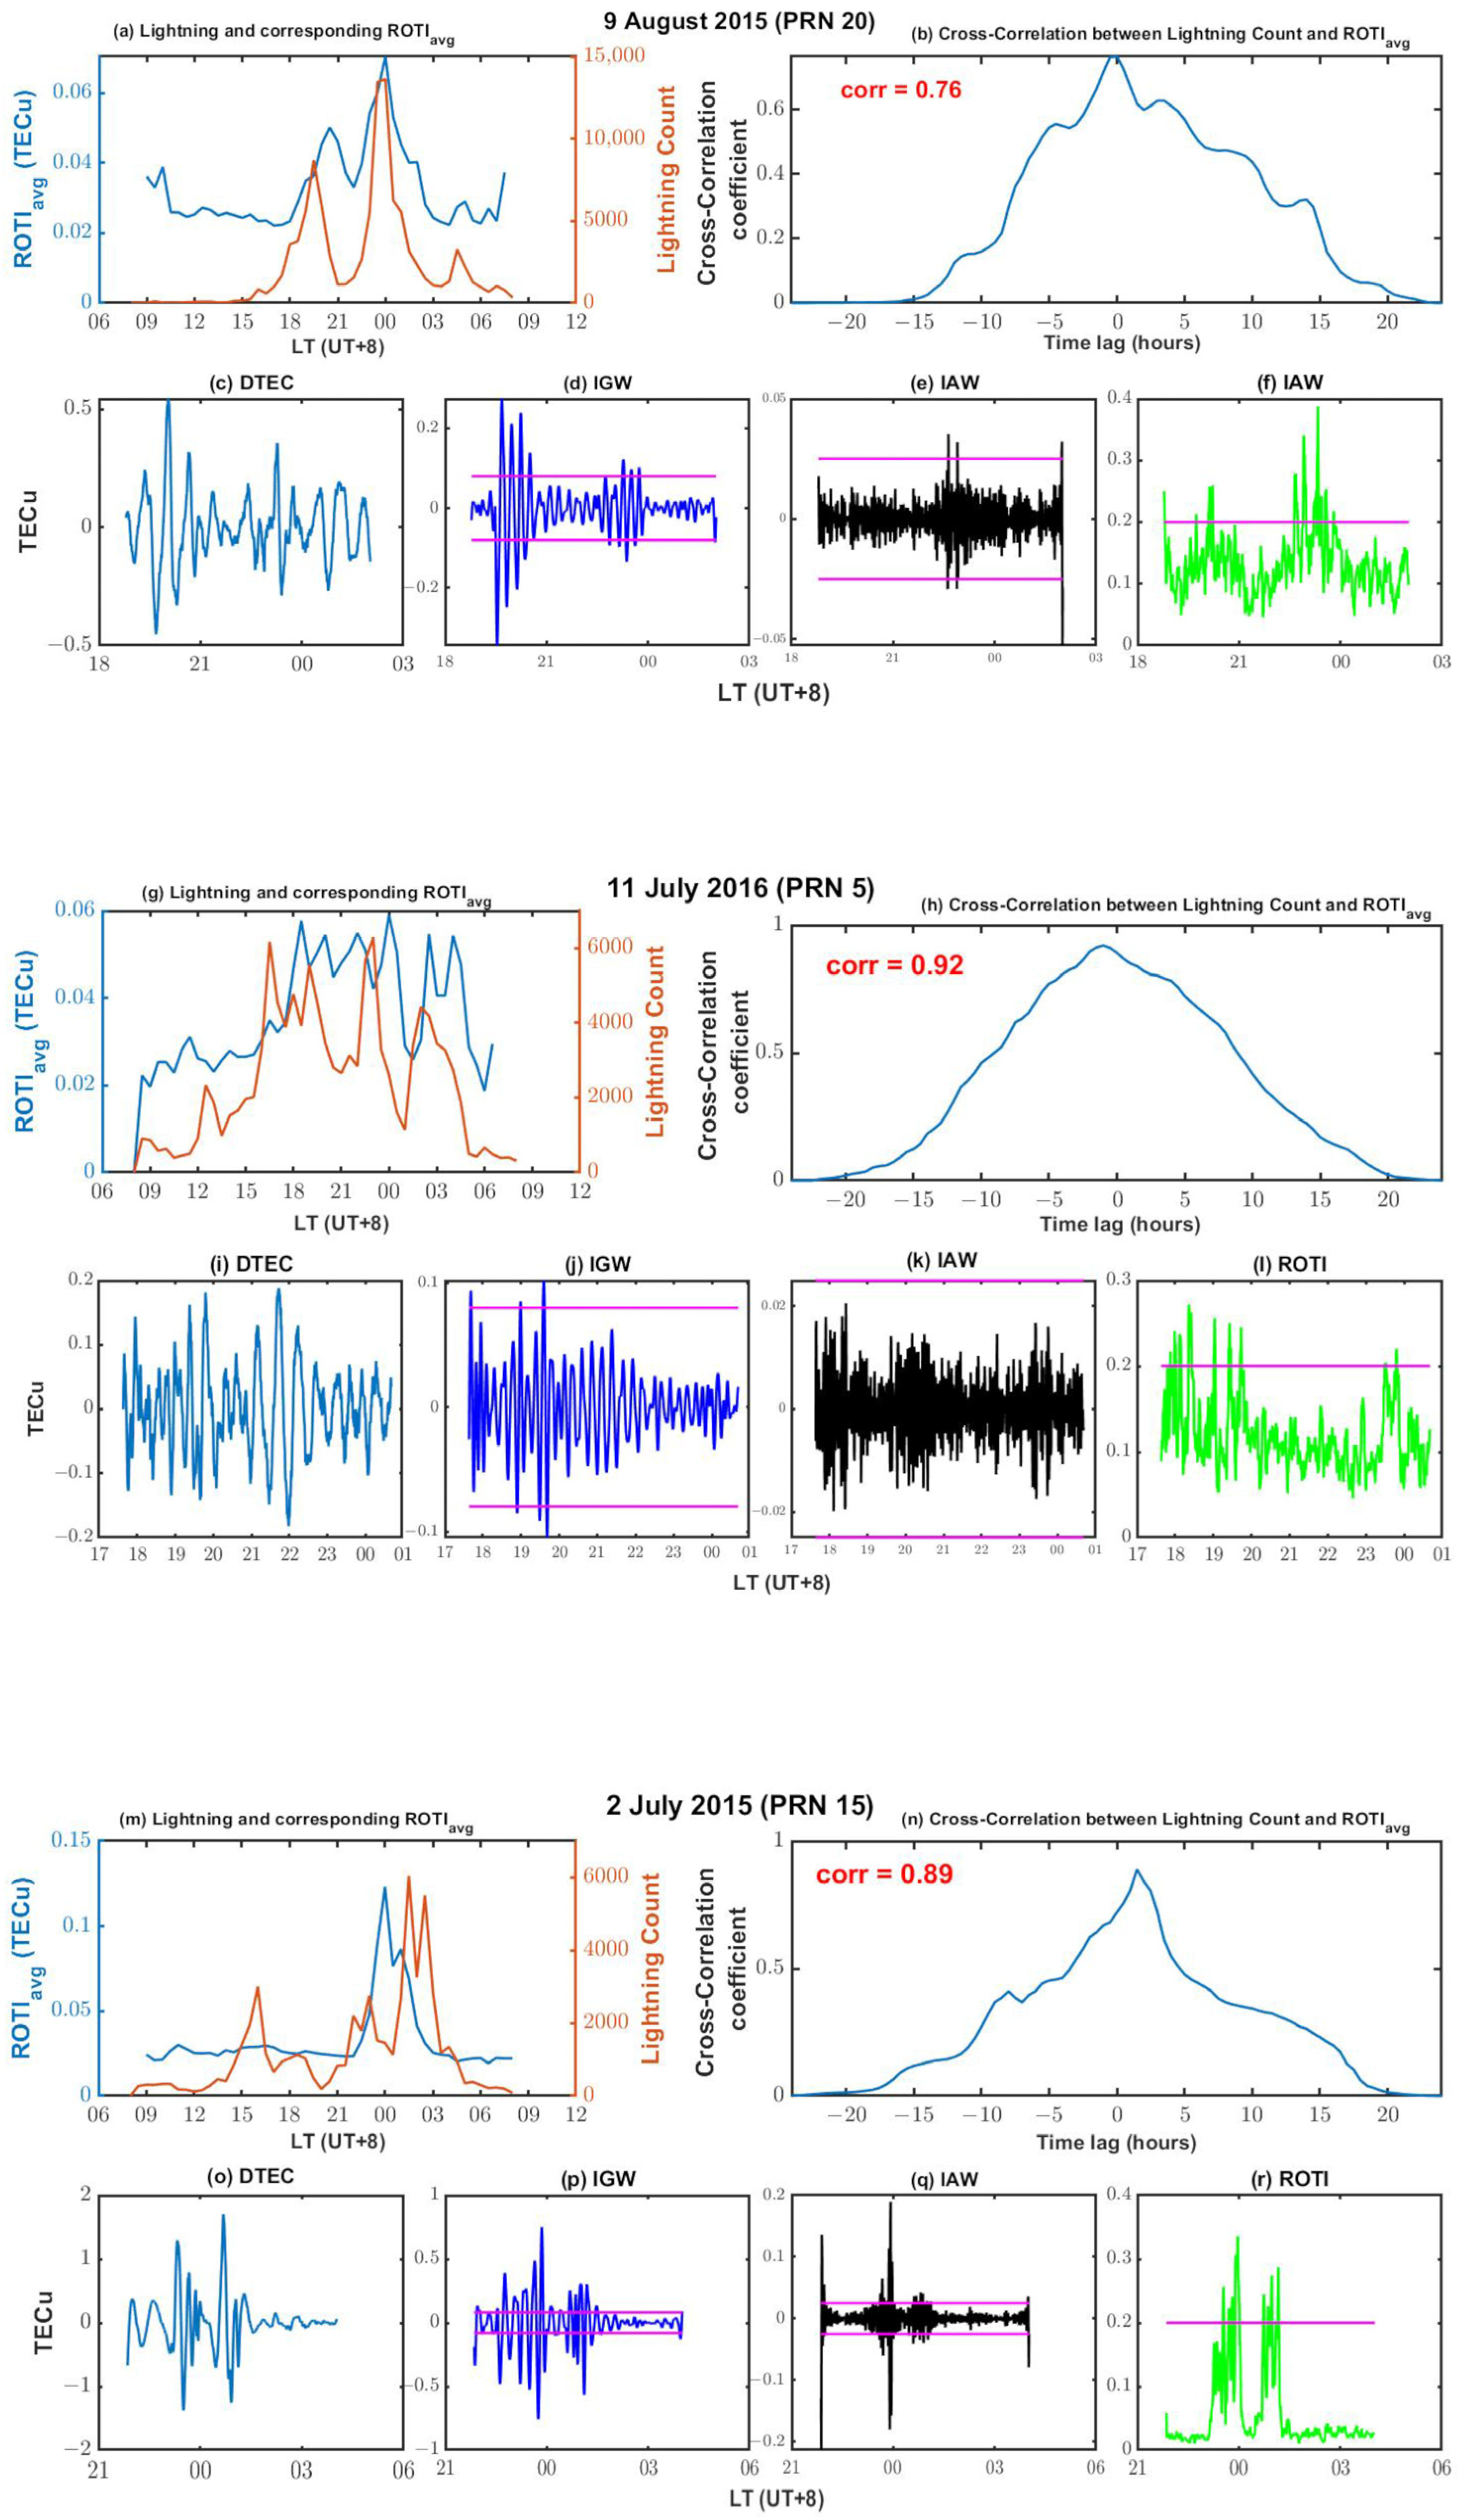
| Days in Figure 4 | 9 August 2015 | 0.76 | 48 | 0 | 0.3 |
| 2 July 2015 | 0.89 | 48 | −1 | 0.29 | |
| 11 July 2016 | 0.92 | 48 | −1 | 0.29 | |
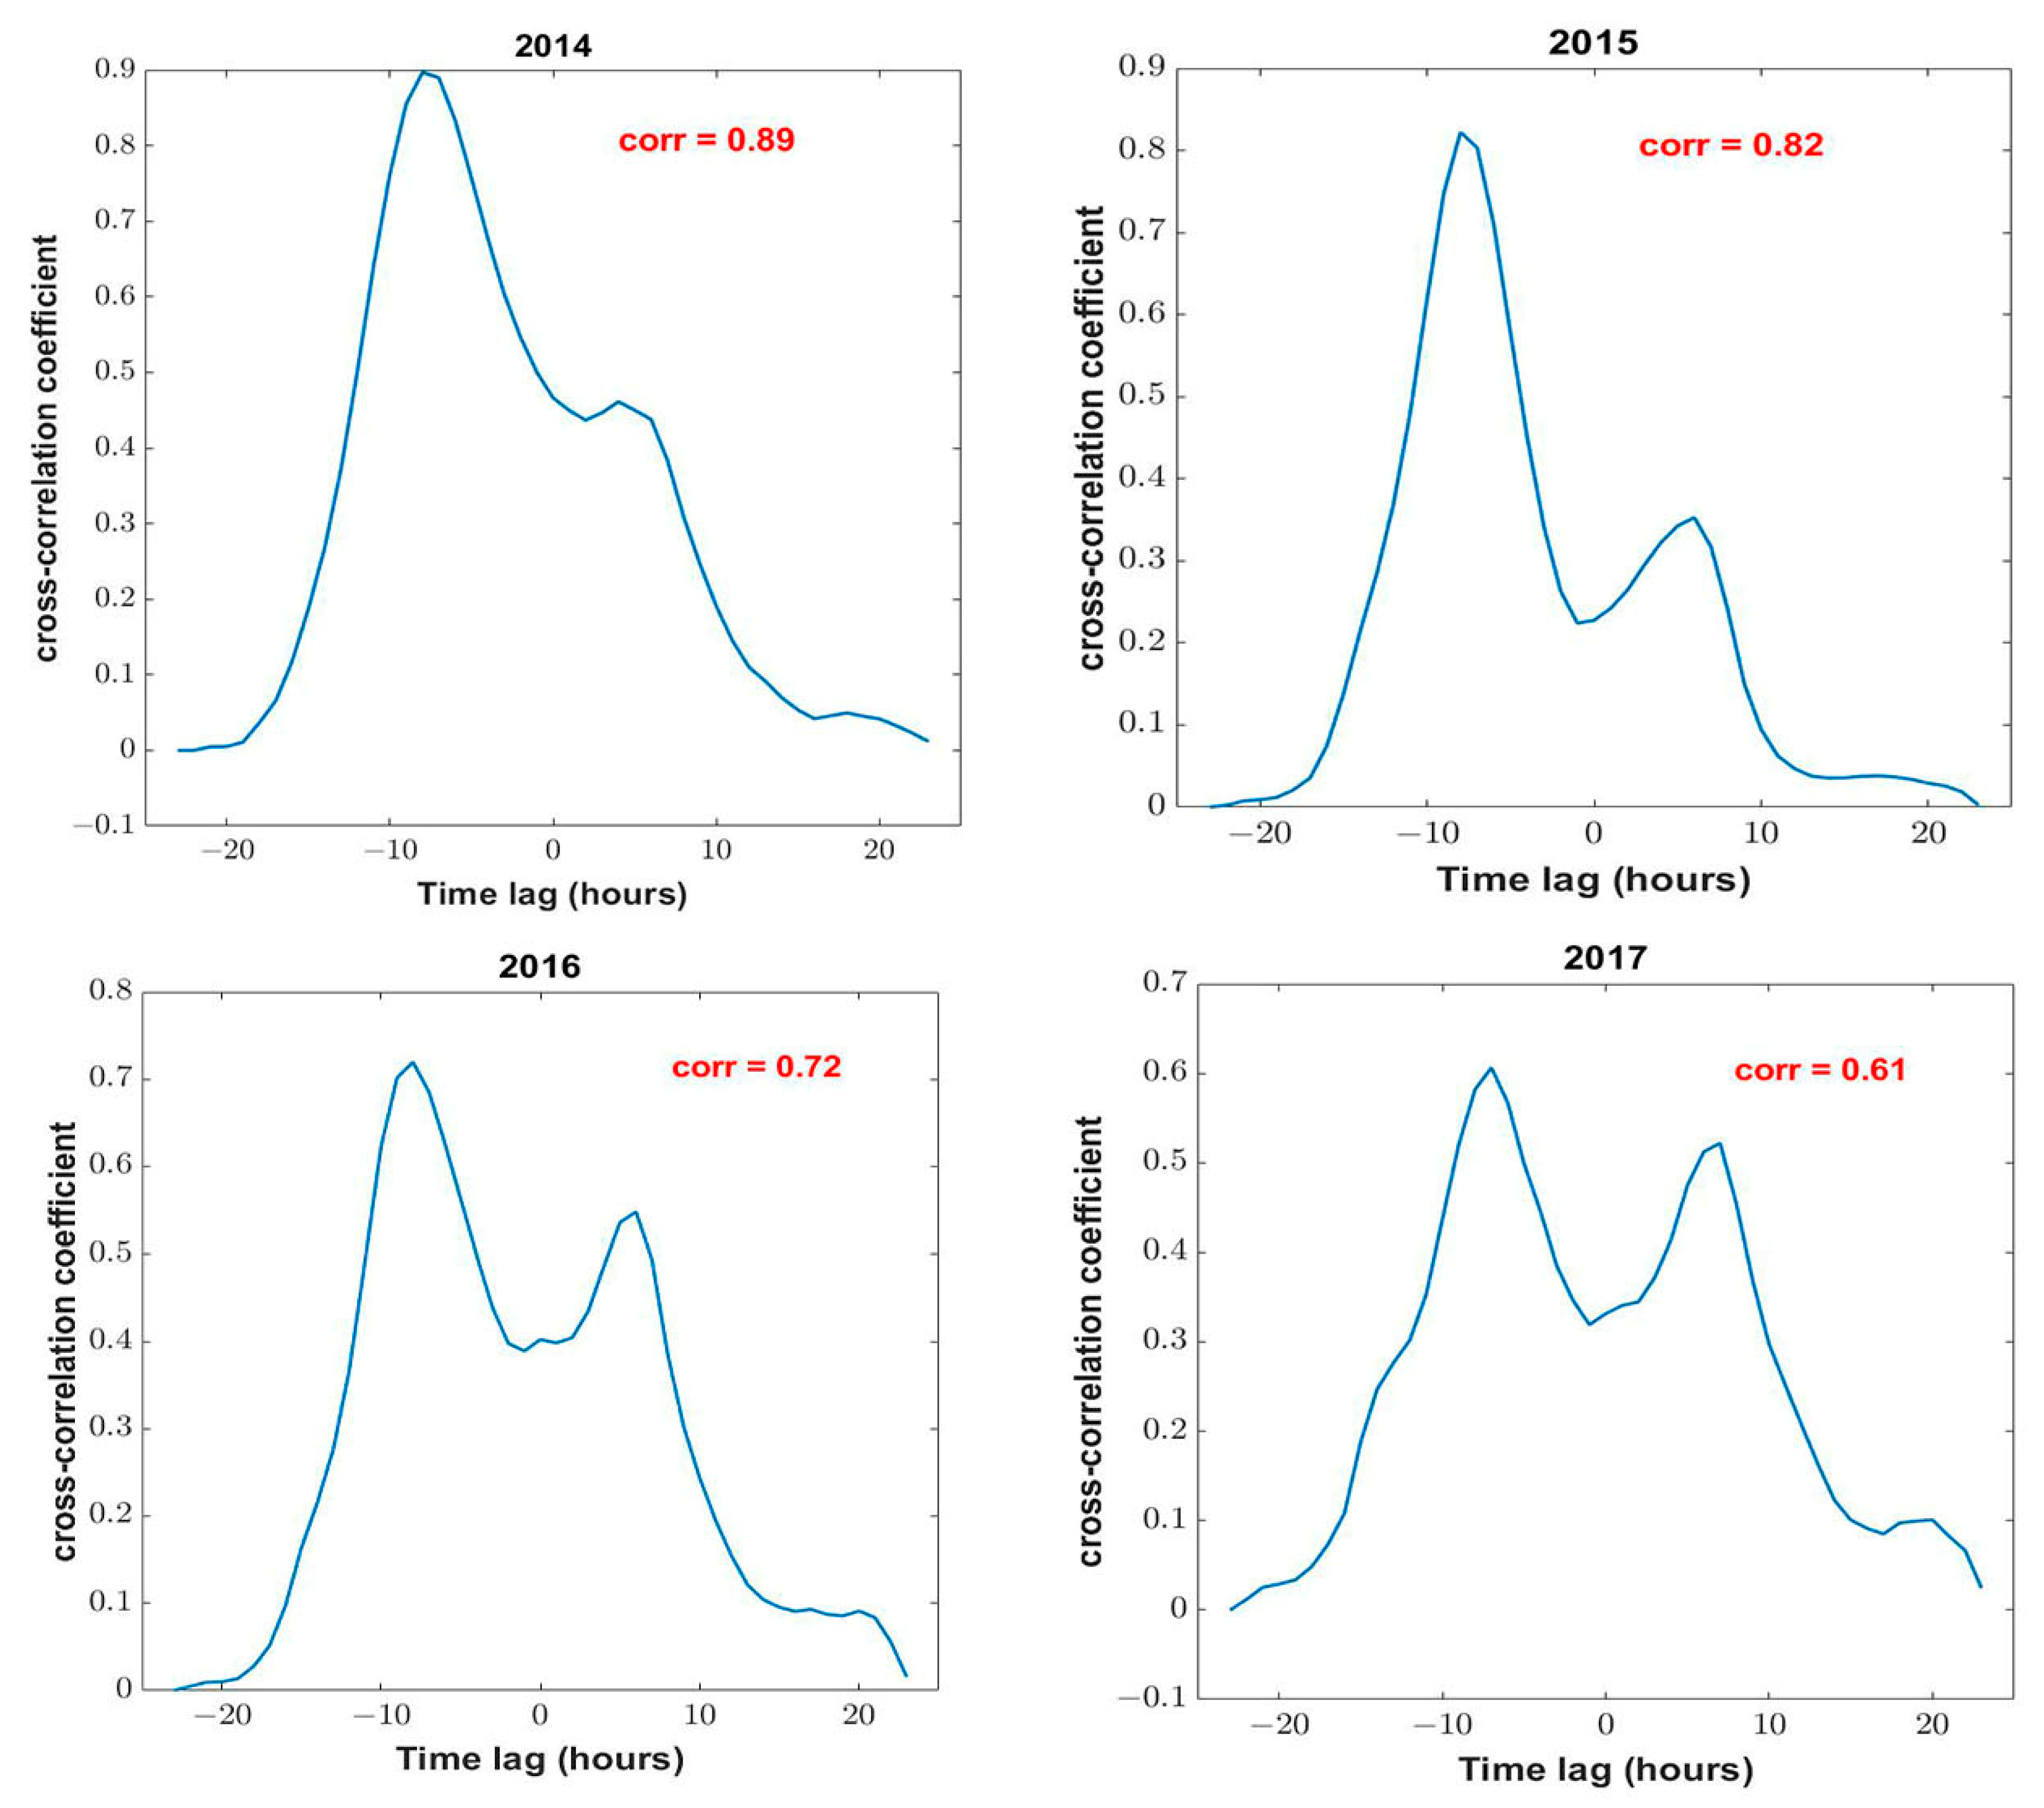
| Years in Figure 5 | 2014 | 0.89 | 24 | −8 | 0.5 |
| 2015 | 0.82 | 24 | −8 | 0.5 | |
| 2016 | 0.71 | 24 | −8 | 0.5 | |
| 2017 | 0.6 | 24 | −7 | 0.4 |
Publisher’s Note: MDPI stays neutral with regard to jurisdictional claims in published maps and institutional affiliations. |
© 2022 by the authors. Licensee MDPI, Basel, Switzerland. This article is an open access article distributed under the terms and conditions of the Creative Commons Attribution (CC BY) license (https://creativecommons.org/licenses/by/4.0/).
Share and Cite
Osei-Poku, L.; Tang, L.; Chen, W.; Chen, M.; Acheampong, A.A. Comparative Study of Predominantly Daytime and Nighttime Lightning Occurrences and Their Impact on Ionospheric Disturbances. Remote Sens. 2022, 14, 3209. https://doi.org/10.3390/rs14133209
Osei-Poku L, Tang L, Chen W, Chen M, Acheampong AA. Comparative Study of Predominantly Daytime and Nighttime Lightning Occurrences and Their Impact on Ionospheric Disturbances. Remote Sensing. 2022; 14(13):3209. https://doi.org/10.3390/rs14133209
Chicago/Turabian StyleOsei-Poku, Louis, Long Tang, Wu Chen, Mingli Chen, and Akwasi Afrifa Acheampong. 2022. "Comparative Study of Predominantly Daytime and Nighttime Lightning Occurrences and Their Impact on Ionospheric Disturbances" Remote Sensing 14, no. 13: 3209. https://doi.org/10.3390/rs14133209