
Vehicle Target Detection Network in SAR Images Based on Rectangle-Invariant Rotatable Convolution


The National Lab of Radar Signal Processing, Xidian University, Xi’an 710071, China
*
Author to whom correspondence should be addressed.
Remote Sens. 2022, 14(13), 3086; https://doi.org/10.3390/rs14133086
Submission received: 12 May 2022
/
Revised: 23 June 2022
/
Accepted: 24 June 2022
/
Published: 27 June 2022
(This article belongs to the Special Issue SAR-Based Signal Processing and Target Recognition)
Abstract
:In recent years, convolutional neural network (CNN)-based methods have been extensively explored for synthetic aperture radar (SAR) target detection. Nevertheless, the convolutional sampling locations of CNNs cannot accurately fit vehicle targets due to the fixed sampling mechanism in the convolutional kernel. In this paper, we focus on the vehicle target detection task in SAR images and propose a novel rectangle-invariant rotatable convolution (RIRConv) to determine more accurately the convolutional sampling locations for vehicle targets. Specifically, this paper considers the shape characteristic of vehicle targets in SAR images, which always retain a rectangular shape despite having varying sizes, aspect ratios, and rotation angles. The proposed RIRConv equips three additional learnable attribute parameters, namely, width, height, and angle attributes, to adaptively adjust the sampling locations in the convolutional kernel according to the targets. In addition, the RIRConv applies a modulation mechanism to focus on the sampling locations that significantly affect the output. Finally, the RIRConv is introduced into the single-shot multibox detector (SSD) to realize SAR vehicle target detection. In this way, the feature representation capability of SSD for vehicle targets can be enhanced, thus leading to higher detection performance. Notably, the proposed RIRConv is “plug-and-play” and can also be used with other existing advanced technologies to achieve higher detection performance. The experiments based on the measured miniSAR data validate the effectiveness of the proposed method.
1. Introduction
Synthetic aperture radar (SAR) imaging is not limited by time, illumination, and weather constraints and can obtain large areas of high-resolution radar images with the development of SAR sensor technology. With the acquisition of numerous SAR images in recent years, SAR automatic target detection has become one of the vital issues studied by researchers. An important branch in this field is SAR vehicle target detection, which is of great significance in urban traffic management and military surveillance. During the past few decades, constant false alarm rate (CFAR) methods [1,2], as one of the conventional SAR target detection methods, have been extensively studied. However, the performance of CFAR methods heavily depends on the statistical modeling of clutter. The land scene where the vehicle targets are located is complex, and the interference of buildings, trees, and other clutter is too severe to accurately establish the statistical model, thus restricting the performance of CFAR methods.
With the improvement of computing power, target detection methods based on convolutional neural networks (CNNs) are developing rapidly. These methods can be roughly divided into two-stage and one-stage detectors. The two-stage detectors, such as region-based CNN (R-CNN) [3] and Faster R-CNN [4], must first extract region proposals and then perform further classification and regression. Without the proposal extraction step, one-stage detectors, such as You Only Look Once (YOLO) [5] and the single-shot multibox detector (SSD) [6], are faster and more straightforward. Furthermore, unlike YOLO, SSD combines the predictions in multi-scale feature maps, which is conducive to detecting objects of various sizes. Therefore, SSD has been widely used in the optical target detection task. Apart from optical images, SSD has also been adopted for SAR vehicle target detection and performs better than conventional methods [7,8].
Nevertheless, a square kernel shape (e.g., ) is applied in the regular convolutional layer, in which fixed locations are sampled for the convolution operation. Although a stack of convolutional layers can increase the range of the receptive field, the shape of the receptive field remains square. However, the vehicle targets in the SAR images we are interested in mainly include cars, trucks, vans, and so on, which vary significantly in terms of size, aspect ratio, and rotation angle and do not always maintain a square shape. The convolutional sampling locations of CNNs cannot accurately fit the vehicle targets, resulting in the limited feature representation ability of CNNs for the vehicle targets. With the goal of enhancing the transformation modeling capability of CNNs, Dai et al. [9] proposed the deformable convolution, which adjusts the sampling locations with learned offsets to matching targets. However, it is mainly designed for general geometric transformations without considering the characteristics of vehicle targets in SAR images. As for vehicle target detection in SAR images, there are more rotation and scale variations, but hardly nonrigid deformation. Furthermore, learning these additional offsets without extra constraints makes the network converge more difficult.
Inspired by the idea of matching the sampling locations of convolutions with the corresponding targets, we propose a novel rectangle-invariant rotatable convolution (RIRConv) for SAR vehicle target detection. Specifically, we noticed that the vehicle targets in SAR images vary significantly in terms of size, aspect ratio, and rotation angle, but always maintain a rectangular shape. The proposed RIRConv combines this characteristic. It keeps the rectangular sampling shape in the convolution kernel unchanged, while adaptively adjusting the sampling locations by learning three additional attribute parameters (i.e., the width, height, and rotation angle attributes) according to different vehicle targets. The RIRConv makes the sampling locations focus more on the target area of interest. In addition, refer to [10], we apply a modulation mechanism into RIRConv. By multiplying a learnable modulation mask with the pixel values at the sampling locations, the RIRConv can pay more attention to the sampling locations that significantly impact the output. Notably, because the RIRConv always keeps the sampling shape of the rectangle, only three attribute parameters and a modulation mask must be learned to make the sampling process more adaptive. In this way, learning these parameters does not make the network converge more difficult, and the network can still be trained end-to-end. By introducing the RIRConv into SSD, the feature representation capability of SSD for vehicle targets gains a marked improvement, thus improving the detection performance.
The principal contributions of this paper are as follows: (1) the shape-related prior information of vehicle targets in SAR images is fully exploited in the proposed method, and (2) this work proposes a design for a convolution operation (i.e., the RIRConv) for vehicle targets in SAR images. In particular, the RIRConv can extract the features of vehicle targets more accurately by adaptively adjusting the sampling locations, thus improving the detection performance.
2. Proposed Method
2.1. Network Architecture
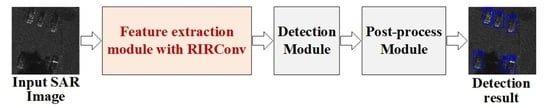
The architecture of the proposed SAR vehicle target detection network is illustrated in Figure 1. We take the SSD network [6] as our baseline. Based on SSD, the proposed RIRConv is introduced. The framework is briefly introduced as follows.
- (1)
- Feature extraction module with RIRConv. This module is used to extract deep features of input SAR images. Its backbone is the truncated VGG16 network [11], which consists of 10 convolutional layers with convolutional kernels and three pooling layers. In the feature extraction module with RIRConv, the proposed RIRConv replaces the first two convolutional layers of the truncated VGG16.
- (2)
- Detection module. The detection module is added following the feature extraction module with RIRConv. It first extracts feature maps of five scales, the sizes of which are , , , , and , respectively. Then, these feature maps are fed into the convolutional predictors to output the detected boxes and the confidence score of each box.
- (3)
- Post-process module. After the detection module outputs the detected boxes, we use the non-maximum suppression (NMS) algorithm [12] to reduce the repeated detected boxes positioned to the same vehicle targets. Thus, we are able to obtain the detection results, which are the predicted specific locations of the vehicle targets.
In the following section, the details of the RIRConv are introduced concretely.
2.2. Rectangle-Invariant Rotatable Convolution
The vehicle targets vary significantly in terms of size, aspect ratio, and rotation angle but maintain a rectangular shape. Considering this prior information, we propose a novel RIRConv. Its convolutional kernel is equipped with width, height, and rotation angle attributes to adaptively adjust the sampling locations according to the targets.
First, the regular convolution operation samples the input feature map using a fixed square grid centered on the location . For example, for a convolutional kernel, . Then, the sampled values are element-wise multiplied by the learned weight . Finally, the corresponding output value on the output feature map is obtained through summation. The convolution operation can be formulated as follows:
where enumerates the locations in the square grid .
Considering that the vehicle targets maintain a rectangular shape with different sizes and aspect ratios, a scale-transformation matric is applied to each location in ; hence, and the sampling is now on the new location:
where and represent the extent of the expansion of the convolution kernel on the width and height, respectively. Based on and , the sampling points can form a rectangle instead of a fixed square.
With the goal of rotating the sampling points to match the angles of targets, a rotation-transformation matric with the rotation angle is adopted. As a result, the sampling is now on location , which can be formulated as follows:
where and denote the cosine and sine functions, respectively.
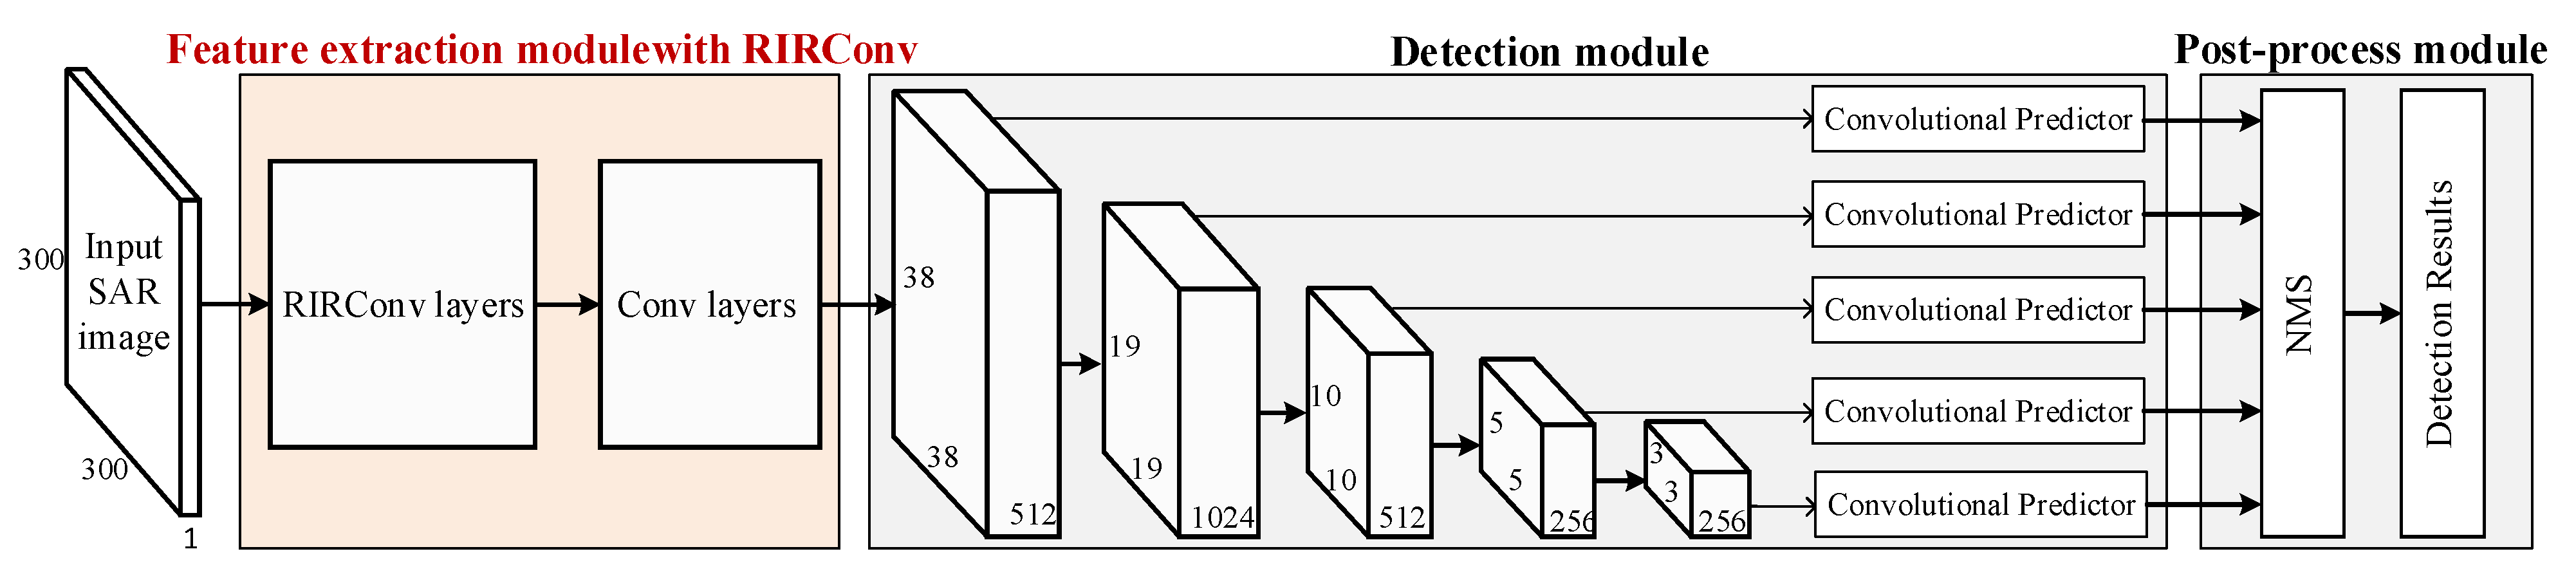
Figure 2 presents the sampling locations with different , , and values based on a convolutional kernel. As expected we can see in Figure 2 that, given the , , and values, the sampling locations have a rectangular shape with different widths, heights, and rotation angles, respectively.
Through the new sampling locations , where represents the number of sampling locations in , the convolution operation can be formulated as:
where .
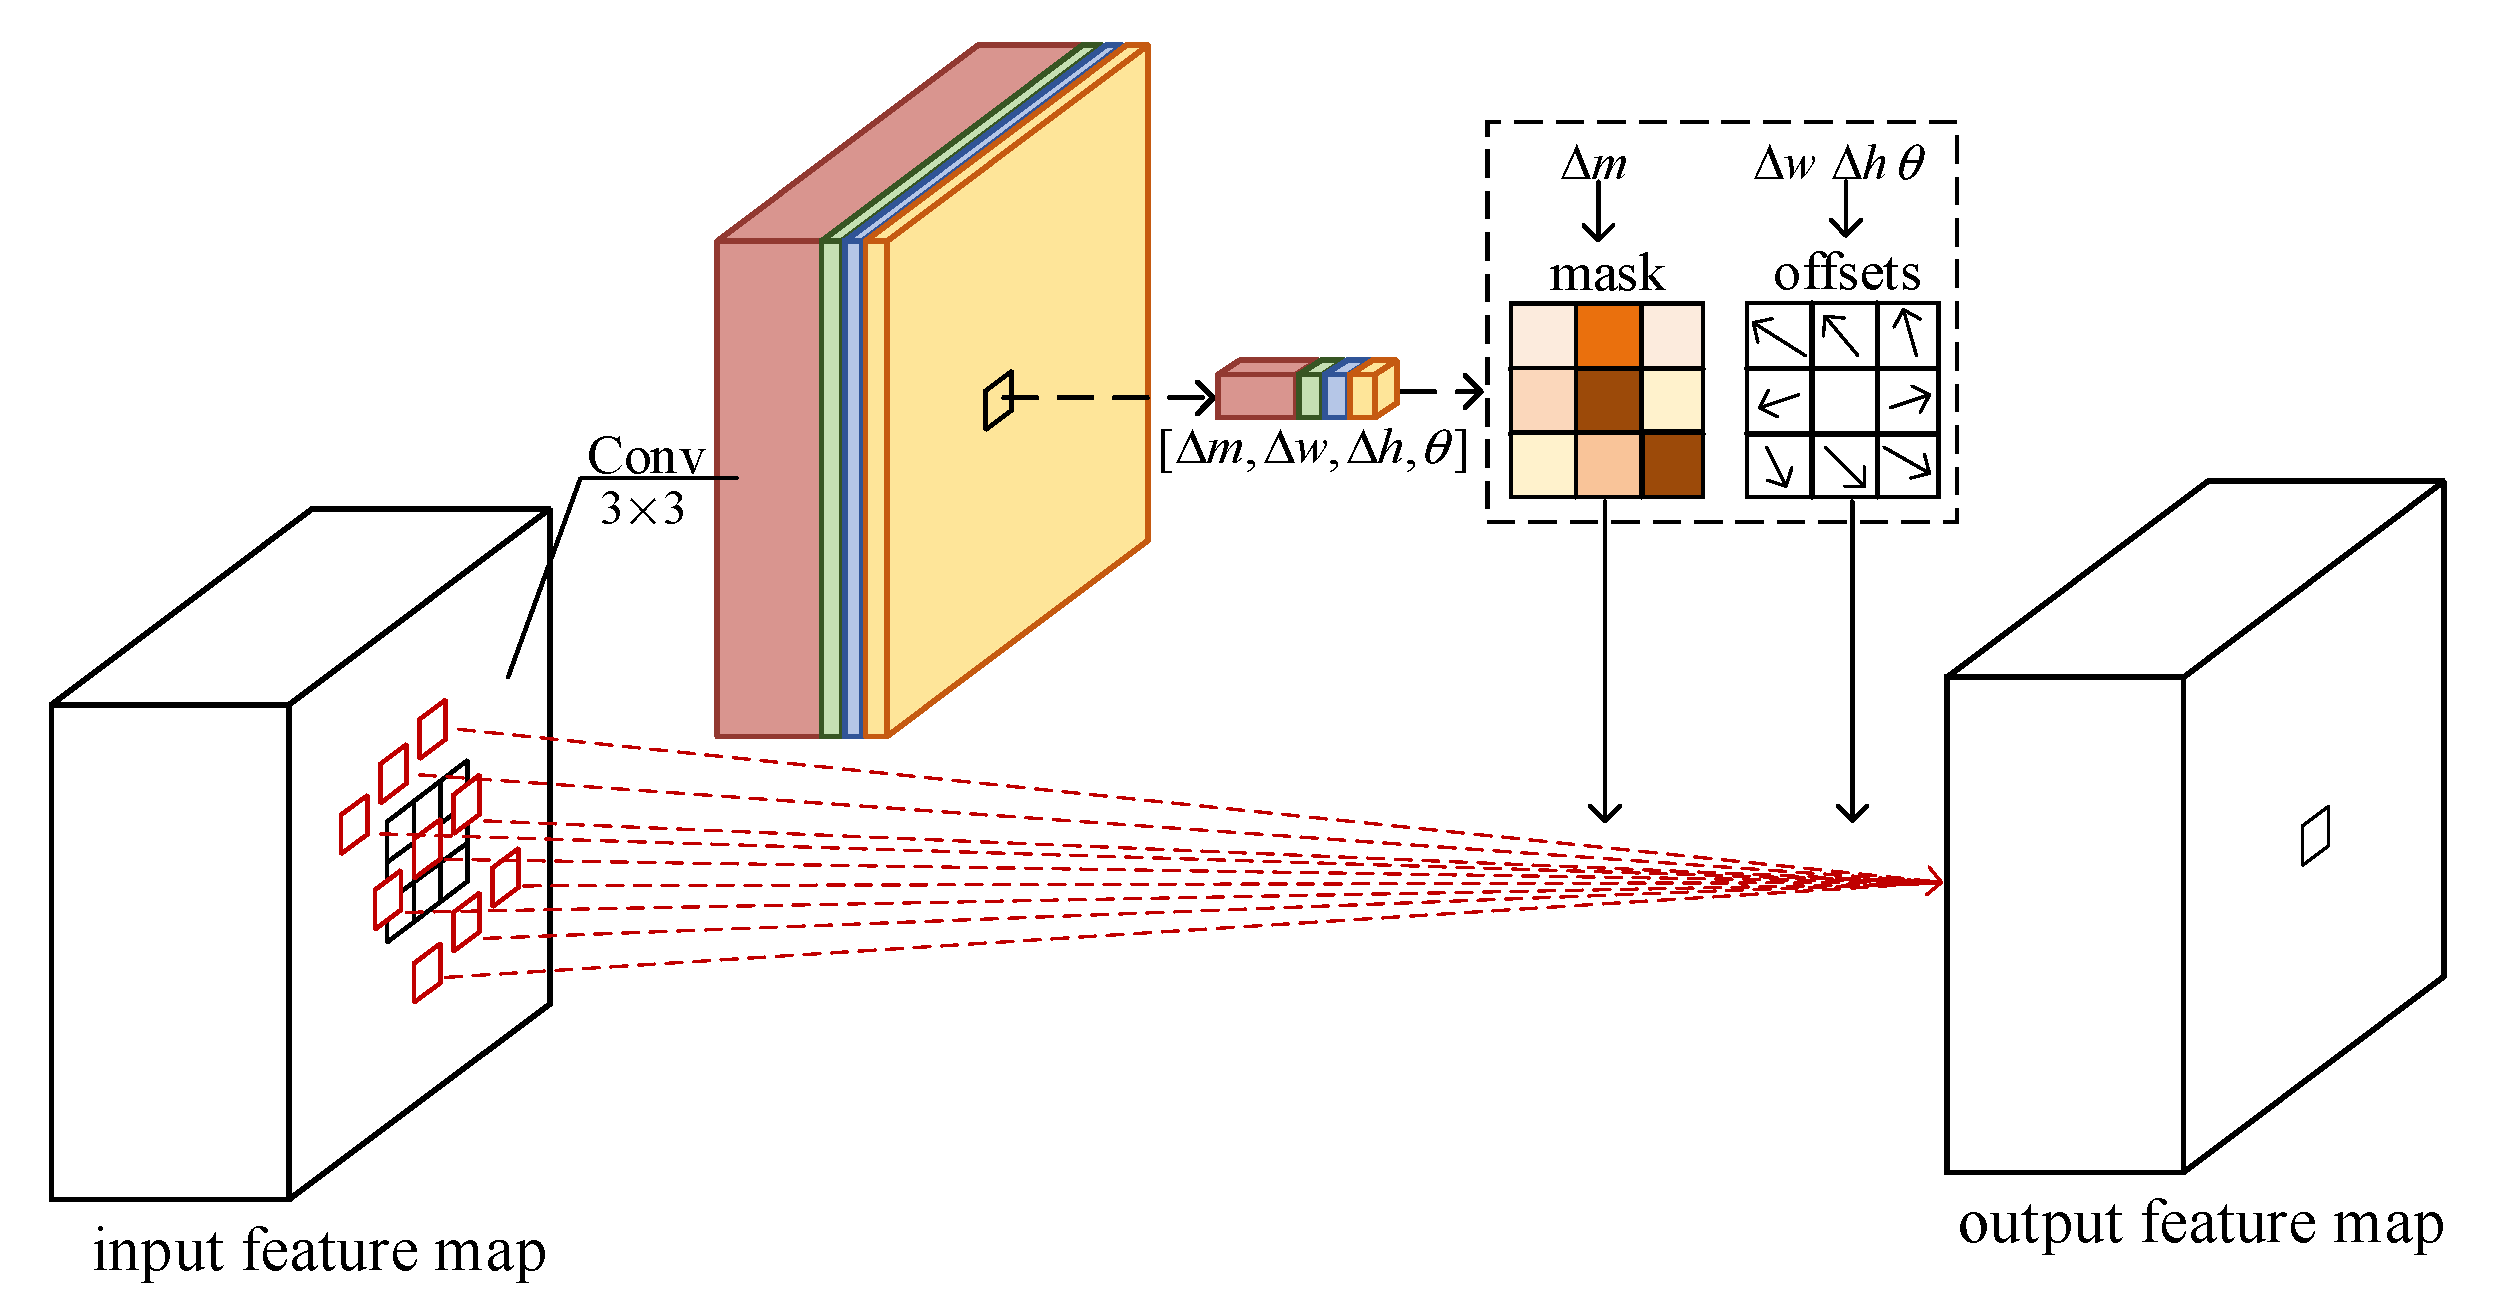
Next, a learnable modulation mask, which can assign modulation weights to sampling locations, is adopted to enable the RIRConv to focus on the sampling locations that significantly impact the output. The modulation weights indicate the importance of different sampling locations and will be multiplied by the pixel values at the corresponding sampling locations. Finally, the RIRConv operation can be formulated as follows:
As the offset may be fractional, the sampling location may not correspond to an integer position. Thus, Equation (5) is implemented via bilinear interpolation as:
where , which denotes a fractional location; enumerates all integral spatial locations in the feature map ; and represents the bilinear interpolation kernel proposed by [9]:
where .
The proposed RIRConv is illustrated in Figure 3. As can be seen, an additional convolutional layer is employed over the input feature map to learn the transformation parameters and mask (i.e., , , , and ). The offsets can then be computed based on the learned , , and values. The offsets and mask are employed to obtain the values in the output feature map, as shown in Equation (6). During training, the transformation parameters, mask, and other network parameters are learned simultaneously and adaptively under supervision. Although an additional convolution layer is added, this only amounts to small additional network parameters and costs.
3. Experimental Results and Analysis
3.1. Experimental Data Description
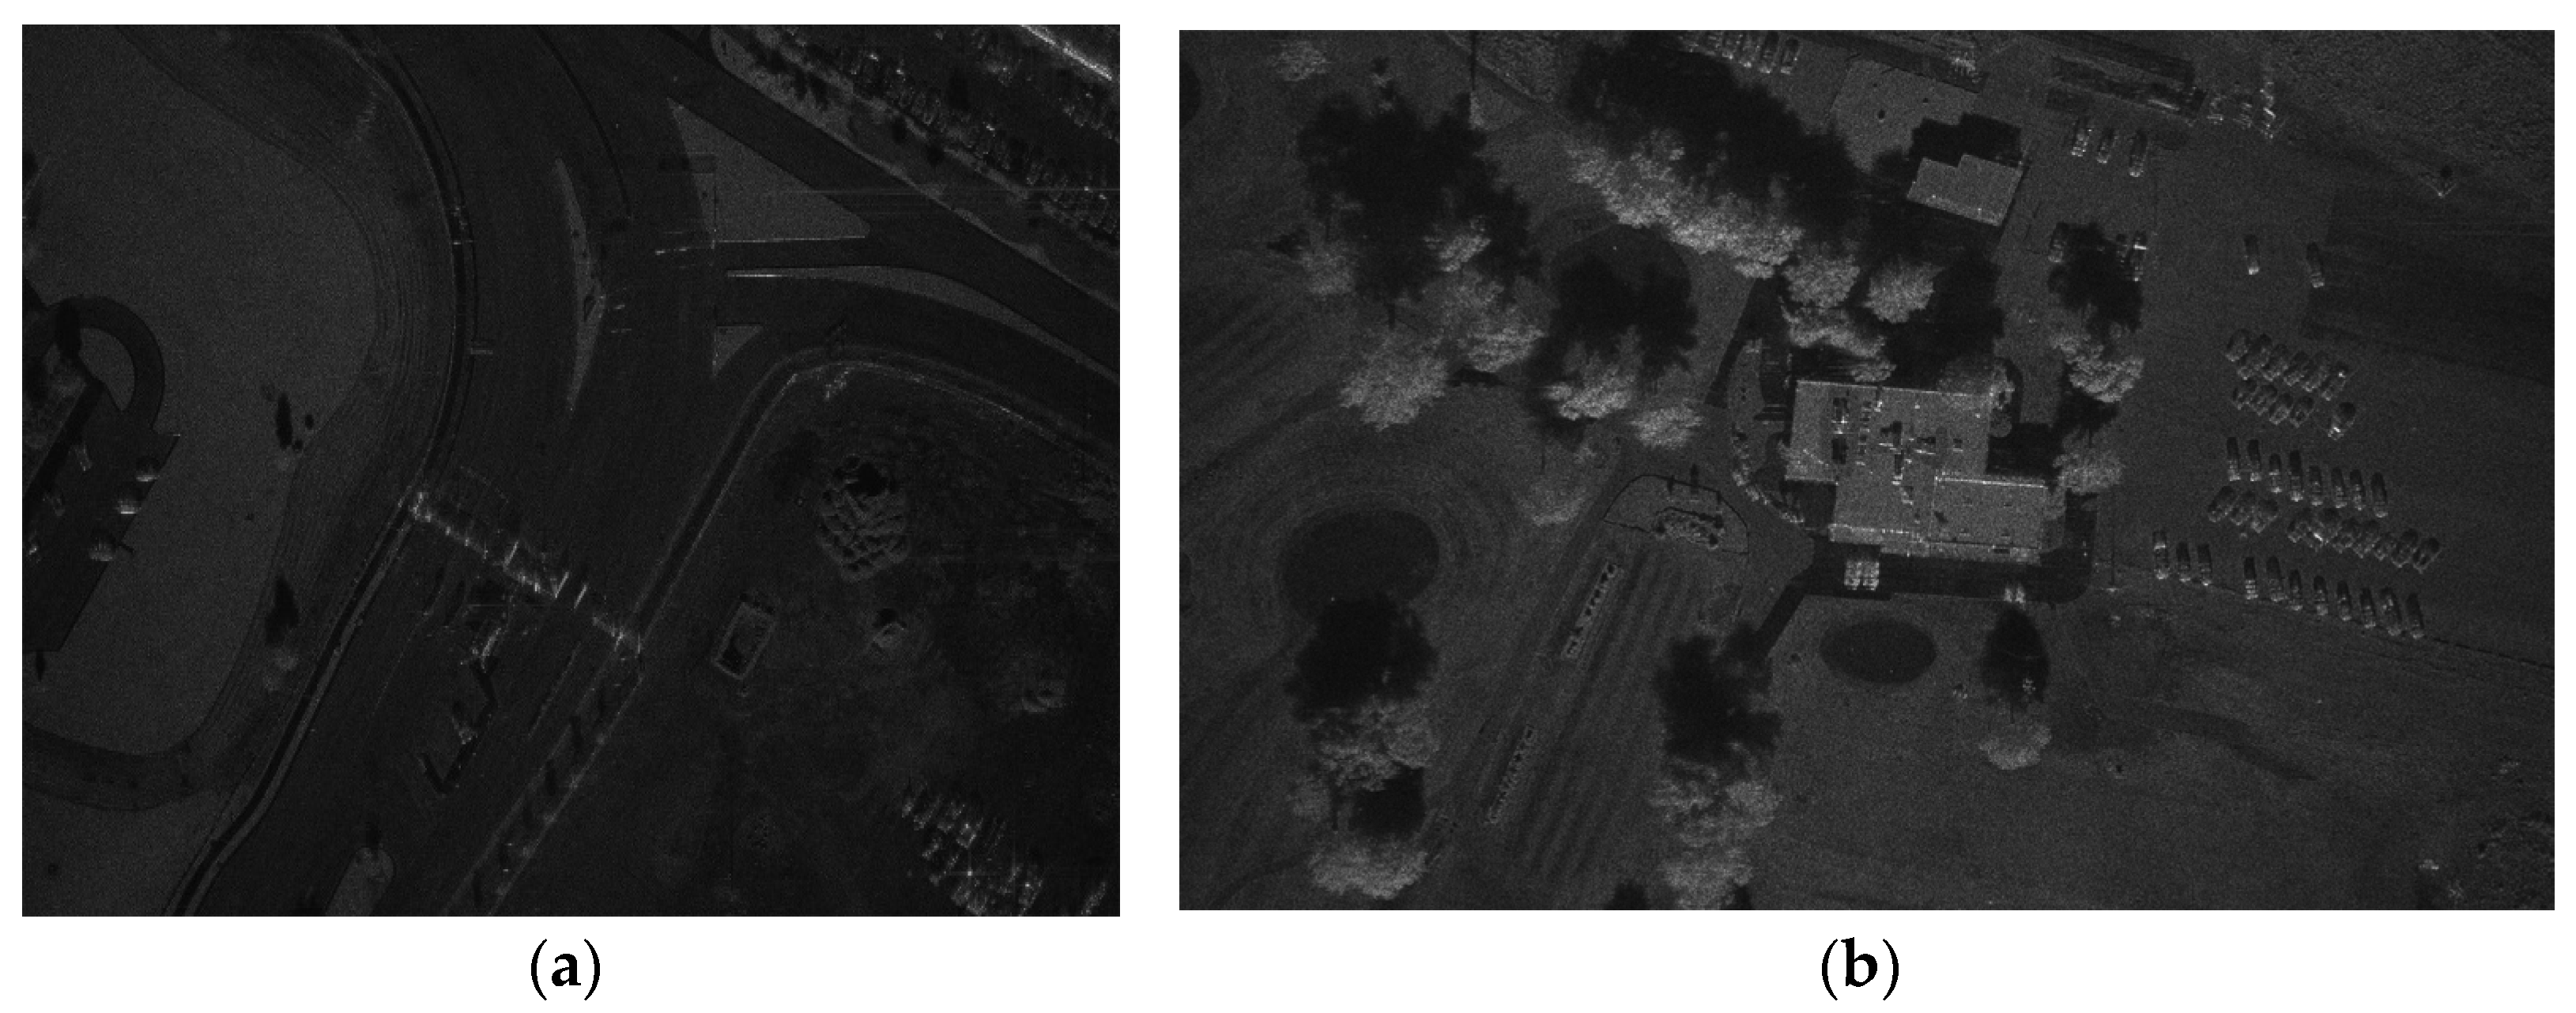
The experimental data comprise the miniSAR data provided by the U.S. Sandia National Laboratories. The miniSAR dataset is an actual measured dataset acquired by the spotlights mode in the Ku band. The resolutions of SAR images in the miniSAR dataset are , and the sizes are pixels [13]. All these SAR images have large-area complex scenes, in which the background clutter includes man-made clutter (e.g., buildings, roads, and streetlights) and natural clutter (e.g., trees and grasslands). The split of training and test SAR images is consistent with [7]. In each SAR image of the miniSAR dataset, the targets, which we are interested in, are all vehicle targets. The labels of these vehicle targets are all marked manually. However, these SAR images are collected by the airborne SAR at different places. Figure 4a shows a SAR image from the training set, which is obtained by imaging a highway area with the airborne SAR. Figure 4b shows a SAR image from the test set, which is obtained by imaging an urban area with the airborne SAR. Therefore, the training and test SAR images have obvious differences in scene types, clutter types, etc., which guarantees the experiments in this paper can verify the generalization of the proposed method.
3.2. Experimental Settings
As described in Section 3.1, the sizes of the original SAR images are too large, not satisfying the size restriction of general network inputs. Therefore, when training, the large original SAR images were cropped into many sub-images with a fixed size of . Then, we augment the training sub-images by adding noise, filtering, rotating, and flipping. After augmentation, we arrive at a total of 1430 sub-images in the training set. These sub-images and the corresponding labels are used to train the network. Under the weighted loss function (i.e., smooth L1 loss for localization and softmax loss for classification), the proposed network is trained by a stochastic gradient descent (SGD) optimizer in an end-to-end manner. When testing, the original test SAR images are also cropped into many test sub-images by sliding window with overlapping. Then all the test sub-images are fed into the network to process individually. After that, all detection results in test sub-images are stitched together. Finally, we use the NMS algorithm to select the predicted bounding box with the highest confidence and to remove duplicate bounding boxes.
The experiments are implemented with the Pytorch deep learning framework, using a personal computer with Intel Xeon E5-2630 v4 CPU of 2.2 GHz and NVIDIA GTX 1080Ti GPU on an Ubuntu 16.04 Linux system.
3.3. Evaluation Criteria
The quantitative evaluation criteria we used in the experiments include precision, recall, and F1-score, which can be formulated as:
where precision measures the fraction of true positives among all detected results. The recall measures the fraction of positives over the number of ground truth, and the F1-score is the harmonic mean between precision and recall, which is the main reference index to evaluate the detection performance comprehensively. The higher the value of the above three evaluation criteria, the better the performance of the detection method.
3.4. Comparison with Other SAR Target Detection Methods
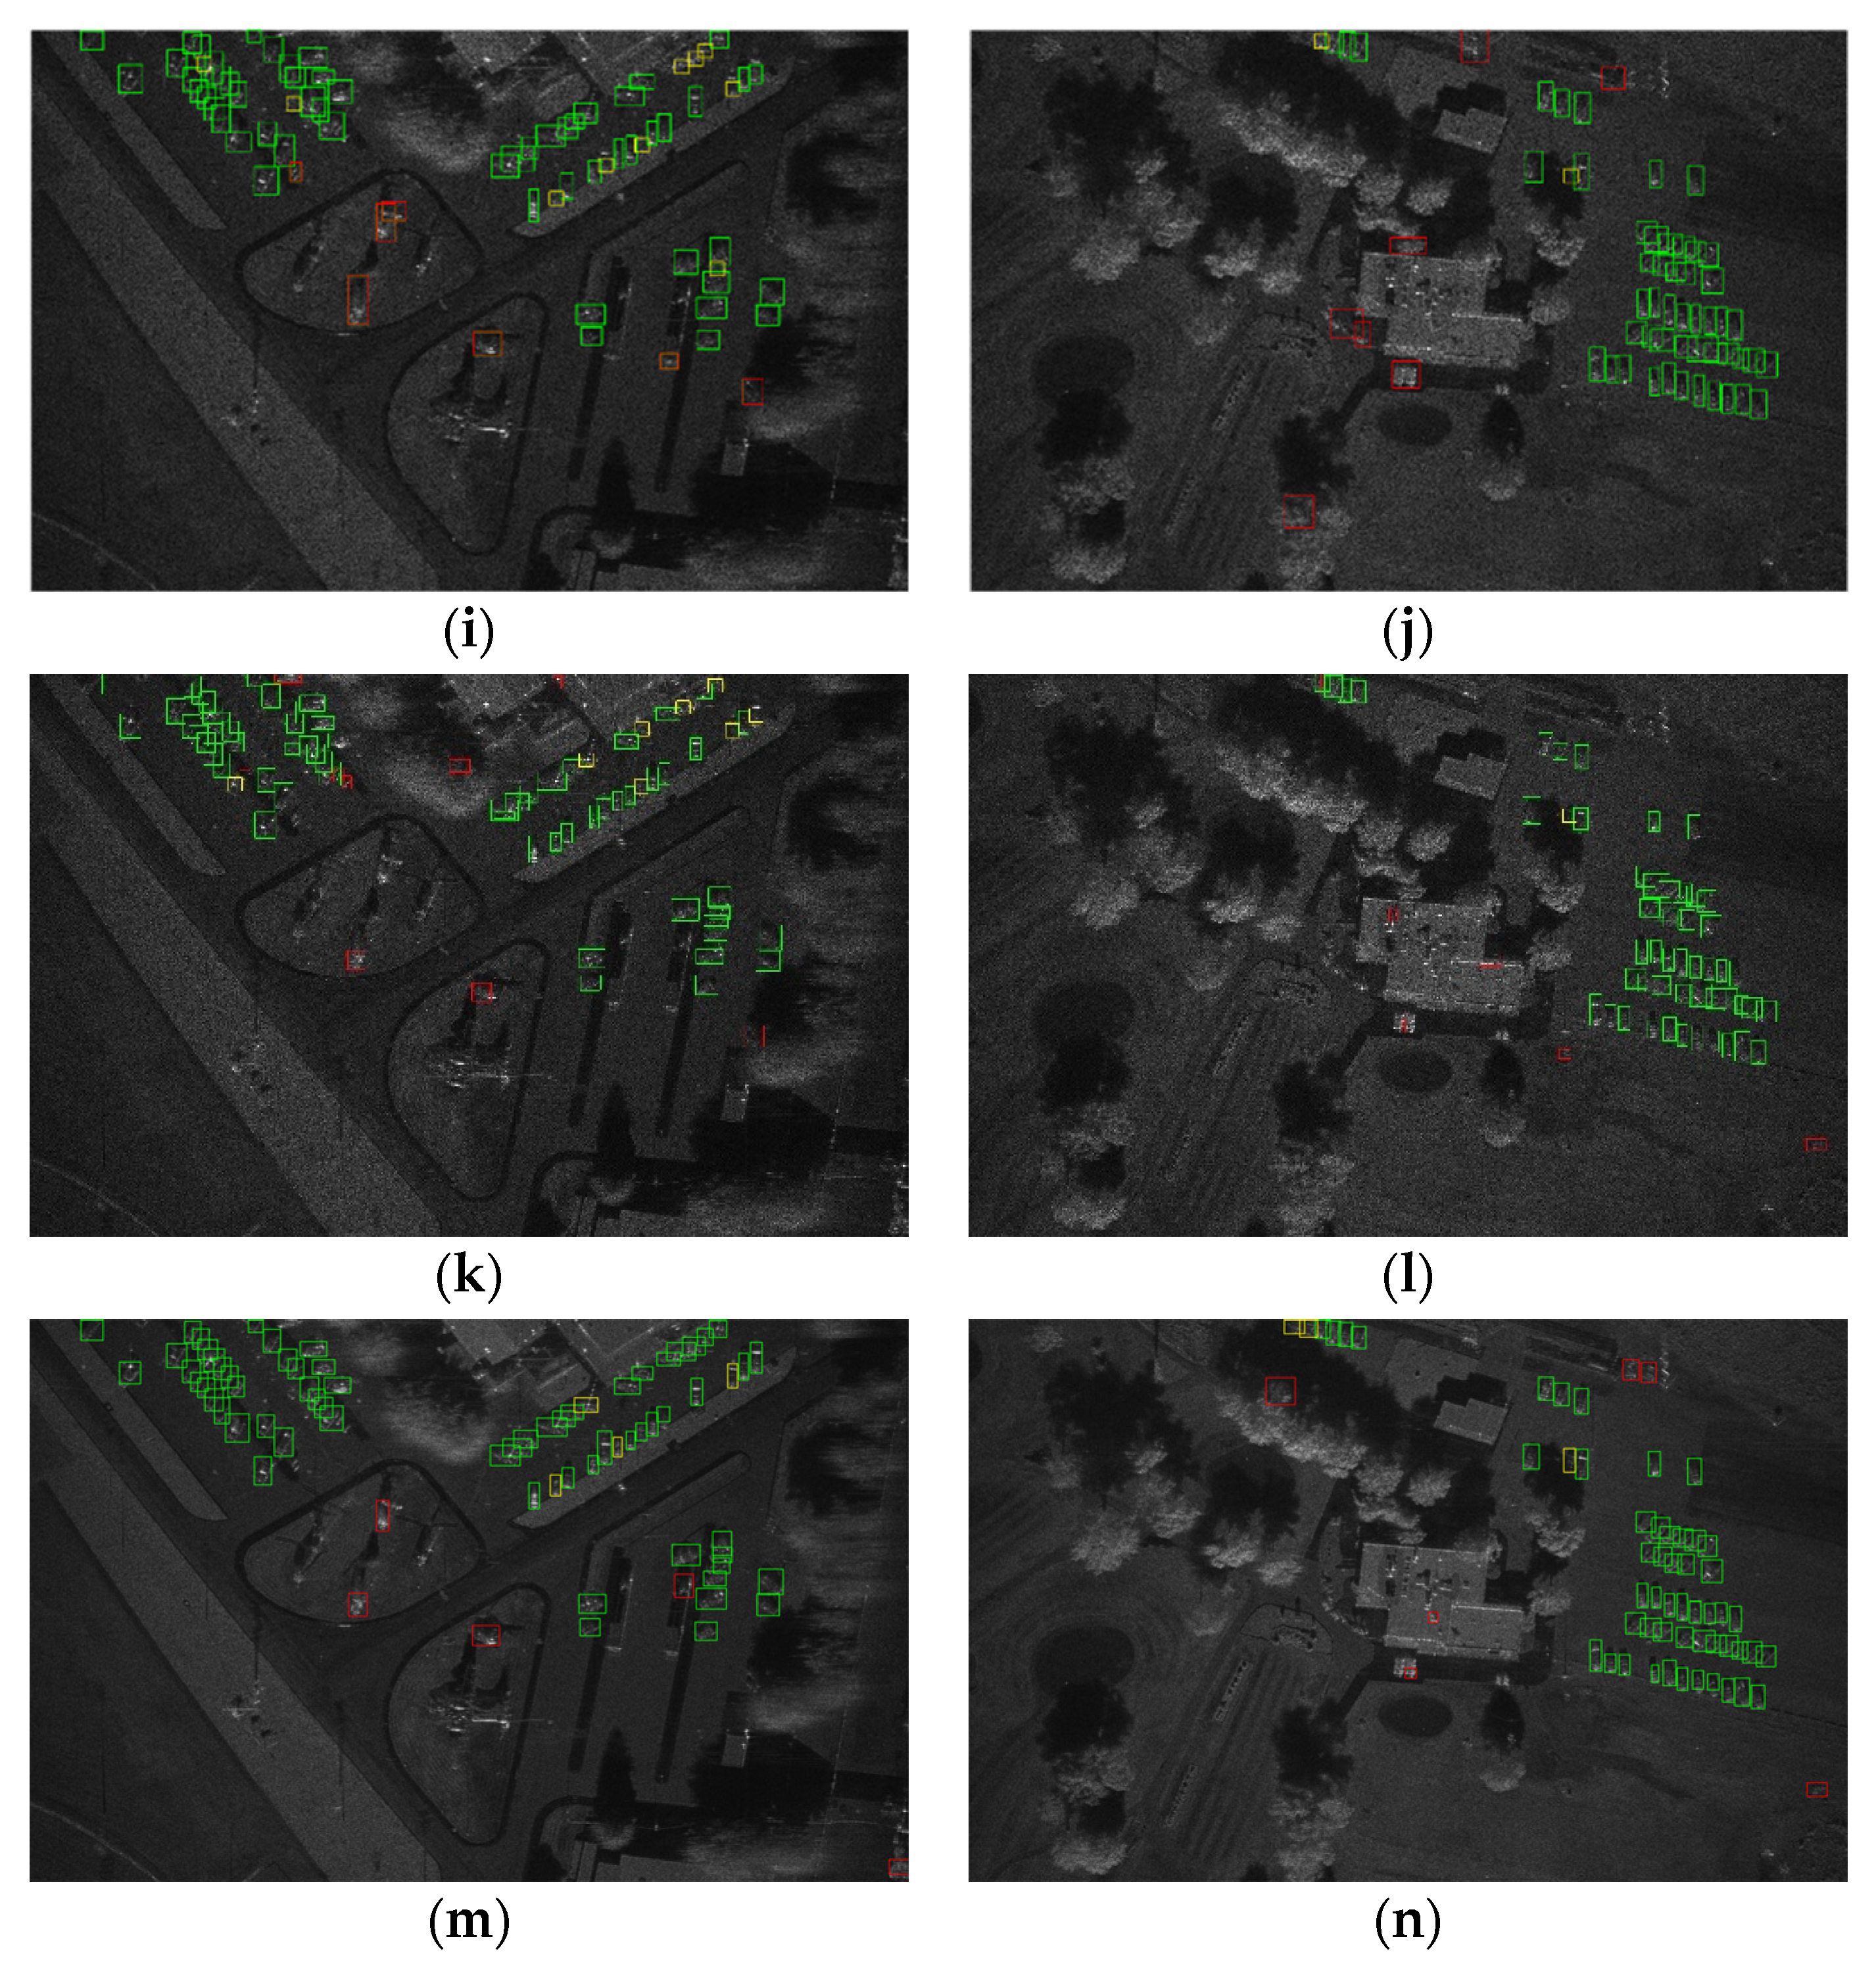
In this section, we compare the proposed SAR target detection method with conventional SAR detection methods and some deep-learning based target detection methods in SAR images. The conventional SAR target detection methods for comparison are two common CFAR detectors, namely, the two-parameters CFAR detector and the Gamma-CFAR detector. The deep-learning based target detection methods in SAR images include some basic target detection networks (i.e., the Faster R-CNN [4] and the original SSD [6]) and two other target detection networks proposed in the last three years, namely, the DA-TL SSD [8] and the RefineDet [14]. The DA-TL SSD applies subaperture decomposition to acquire three-channel SAR images and then uses the VGG pre-trained model trained on the optical ImageNet dataset to initialize corresponding parameters. Based on SSD architecture, the RefineDet introduces the idea of two-step cascaded regression used in two-stage target detection methods. At the same time, RefineDet introduces a structure similar to FPN to fuse features. Figure 5 exhibits the target detection results on two test SAR images, while Table I lists the numerical detection results in terms of the evaluation criteria shown in Section 3.3.
From Figure 5a–d, we can see that the CFAR methods have numerous false alarms, leading to lower precisions. From rows 2 and 3 in Table 1, we can observe that the precision of the two-parameter CFAR is 0.3789, while that of the Gamma CFAR is a little better, at 0.3931, which significantly reduces the corresponding comprehensive criterion F1-score. The reason is that CFAR methods face difficulties in accurately establishing the statistical model in complex scenes, resulting in poor detection performance. Compared with unsupervised CFAR methods, the deep-learning based target detection methods draw support from the data-driven approach and have better performance. From Figure 5e–n, we can see that the deep-learning based methods have fewer false alarms than the CFAR methods. Moreover, the deep-learning based methods also have fewer missing alarms, leading to higher recalls. In conclusion, the detection performance of the deep-learning based methods is generally better than that of conventional CFAR methods. In the listed deep-learning based target detection networks, the proposed method has the highest precision, recall, and F1-score. Therefore, it can achieve the best detection performance compared to other detection methods. As mentioned in Section 3.1, the training and test SAR images have obvious differences in terms of scene types, clutter types, and so on. Meanwhile, from Figure 5m–n, we can see that the proposed method generates very few false and missing alarms on the test SAR images, which verifies that the proposed method has strong generalization.
3.5. Model Analyses
3.5.1. Sampling Locations in the RIRConv
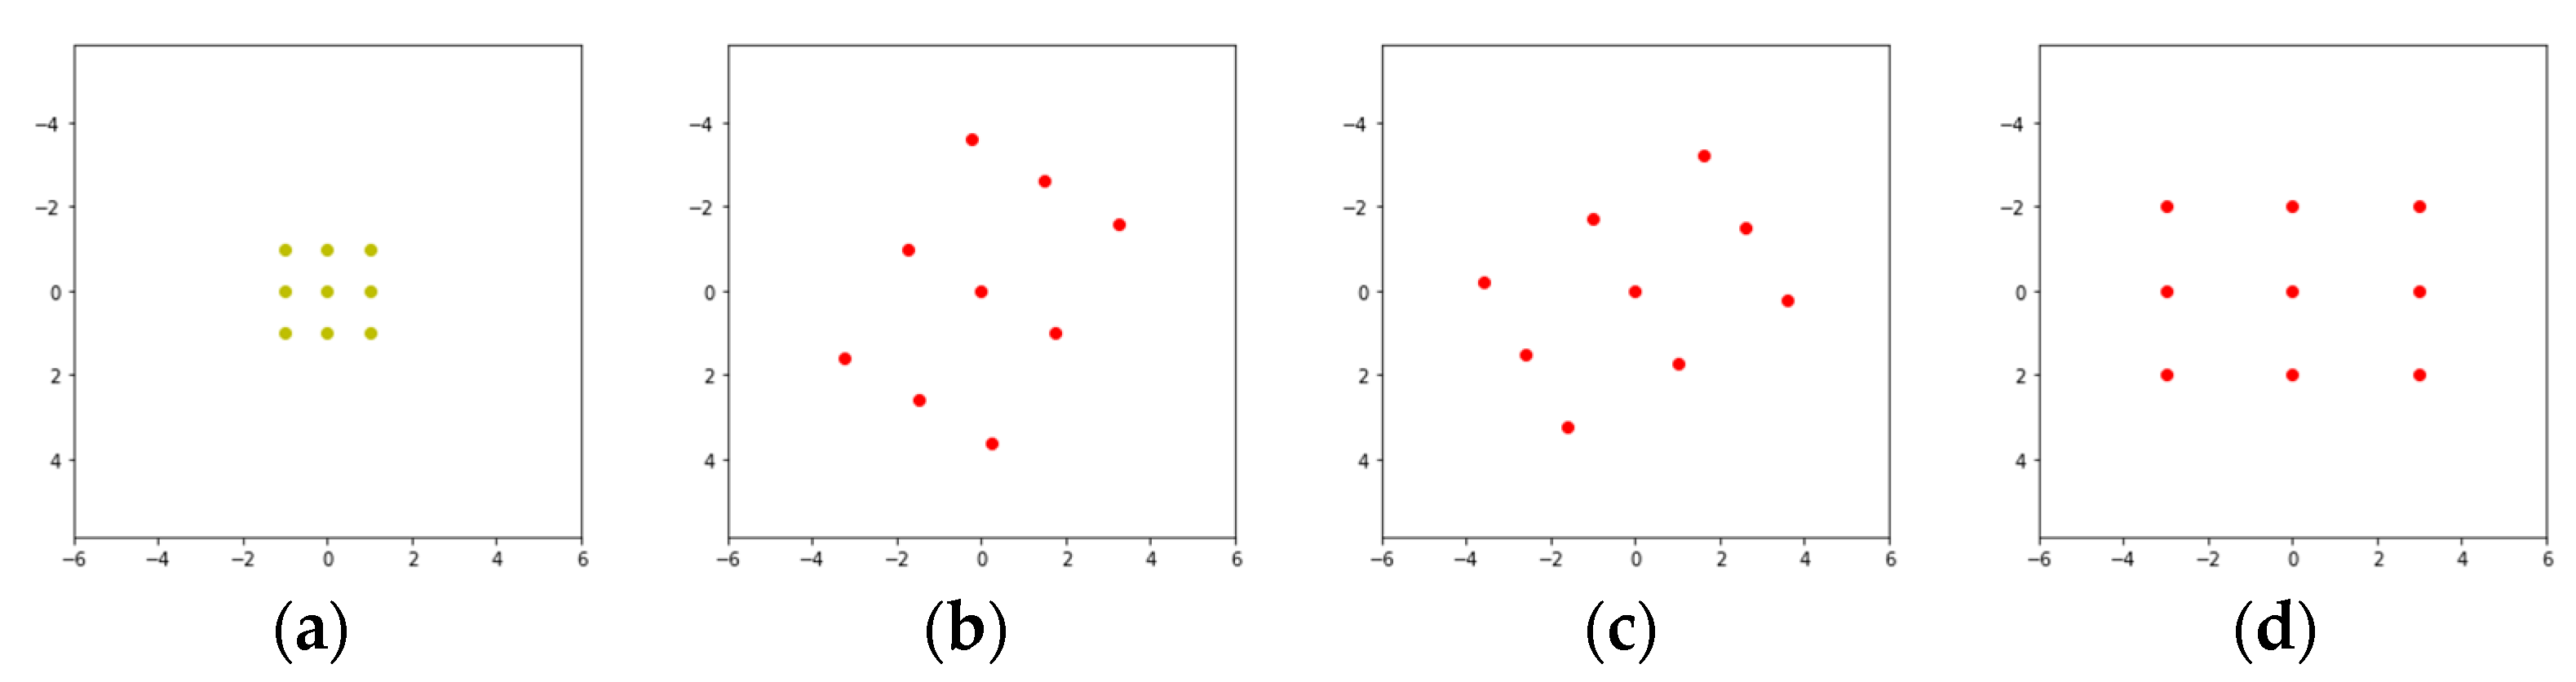
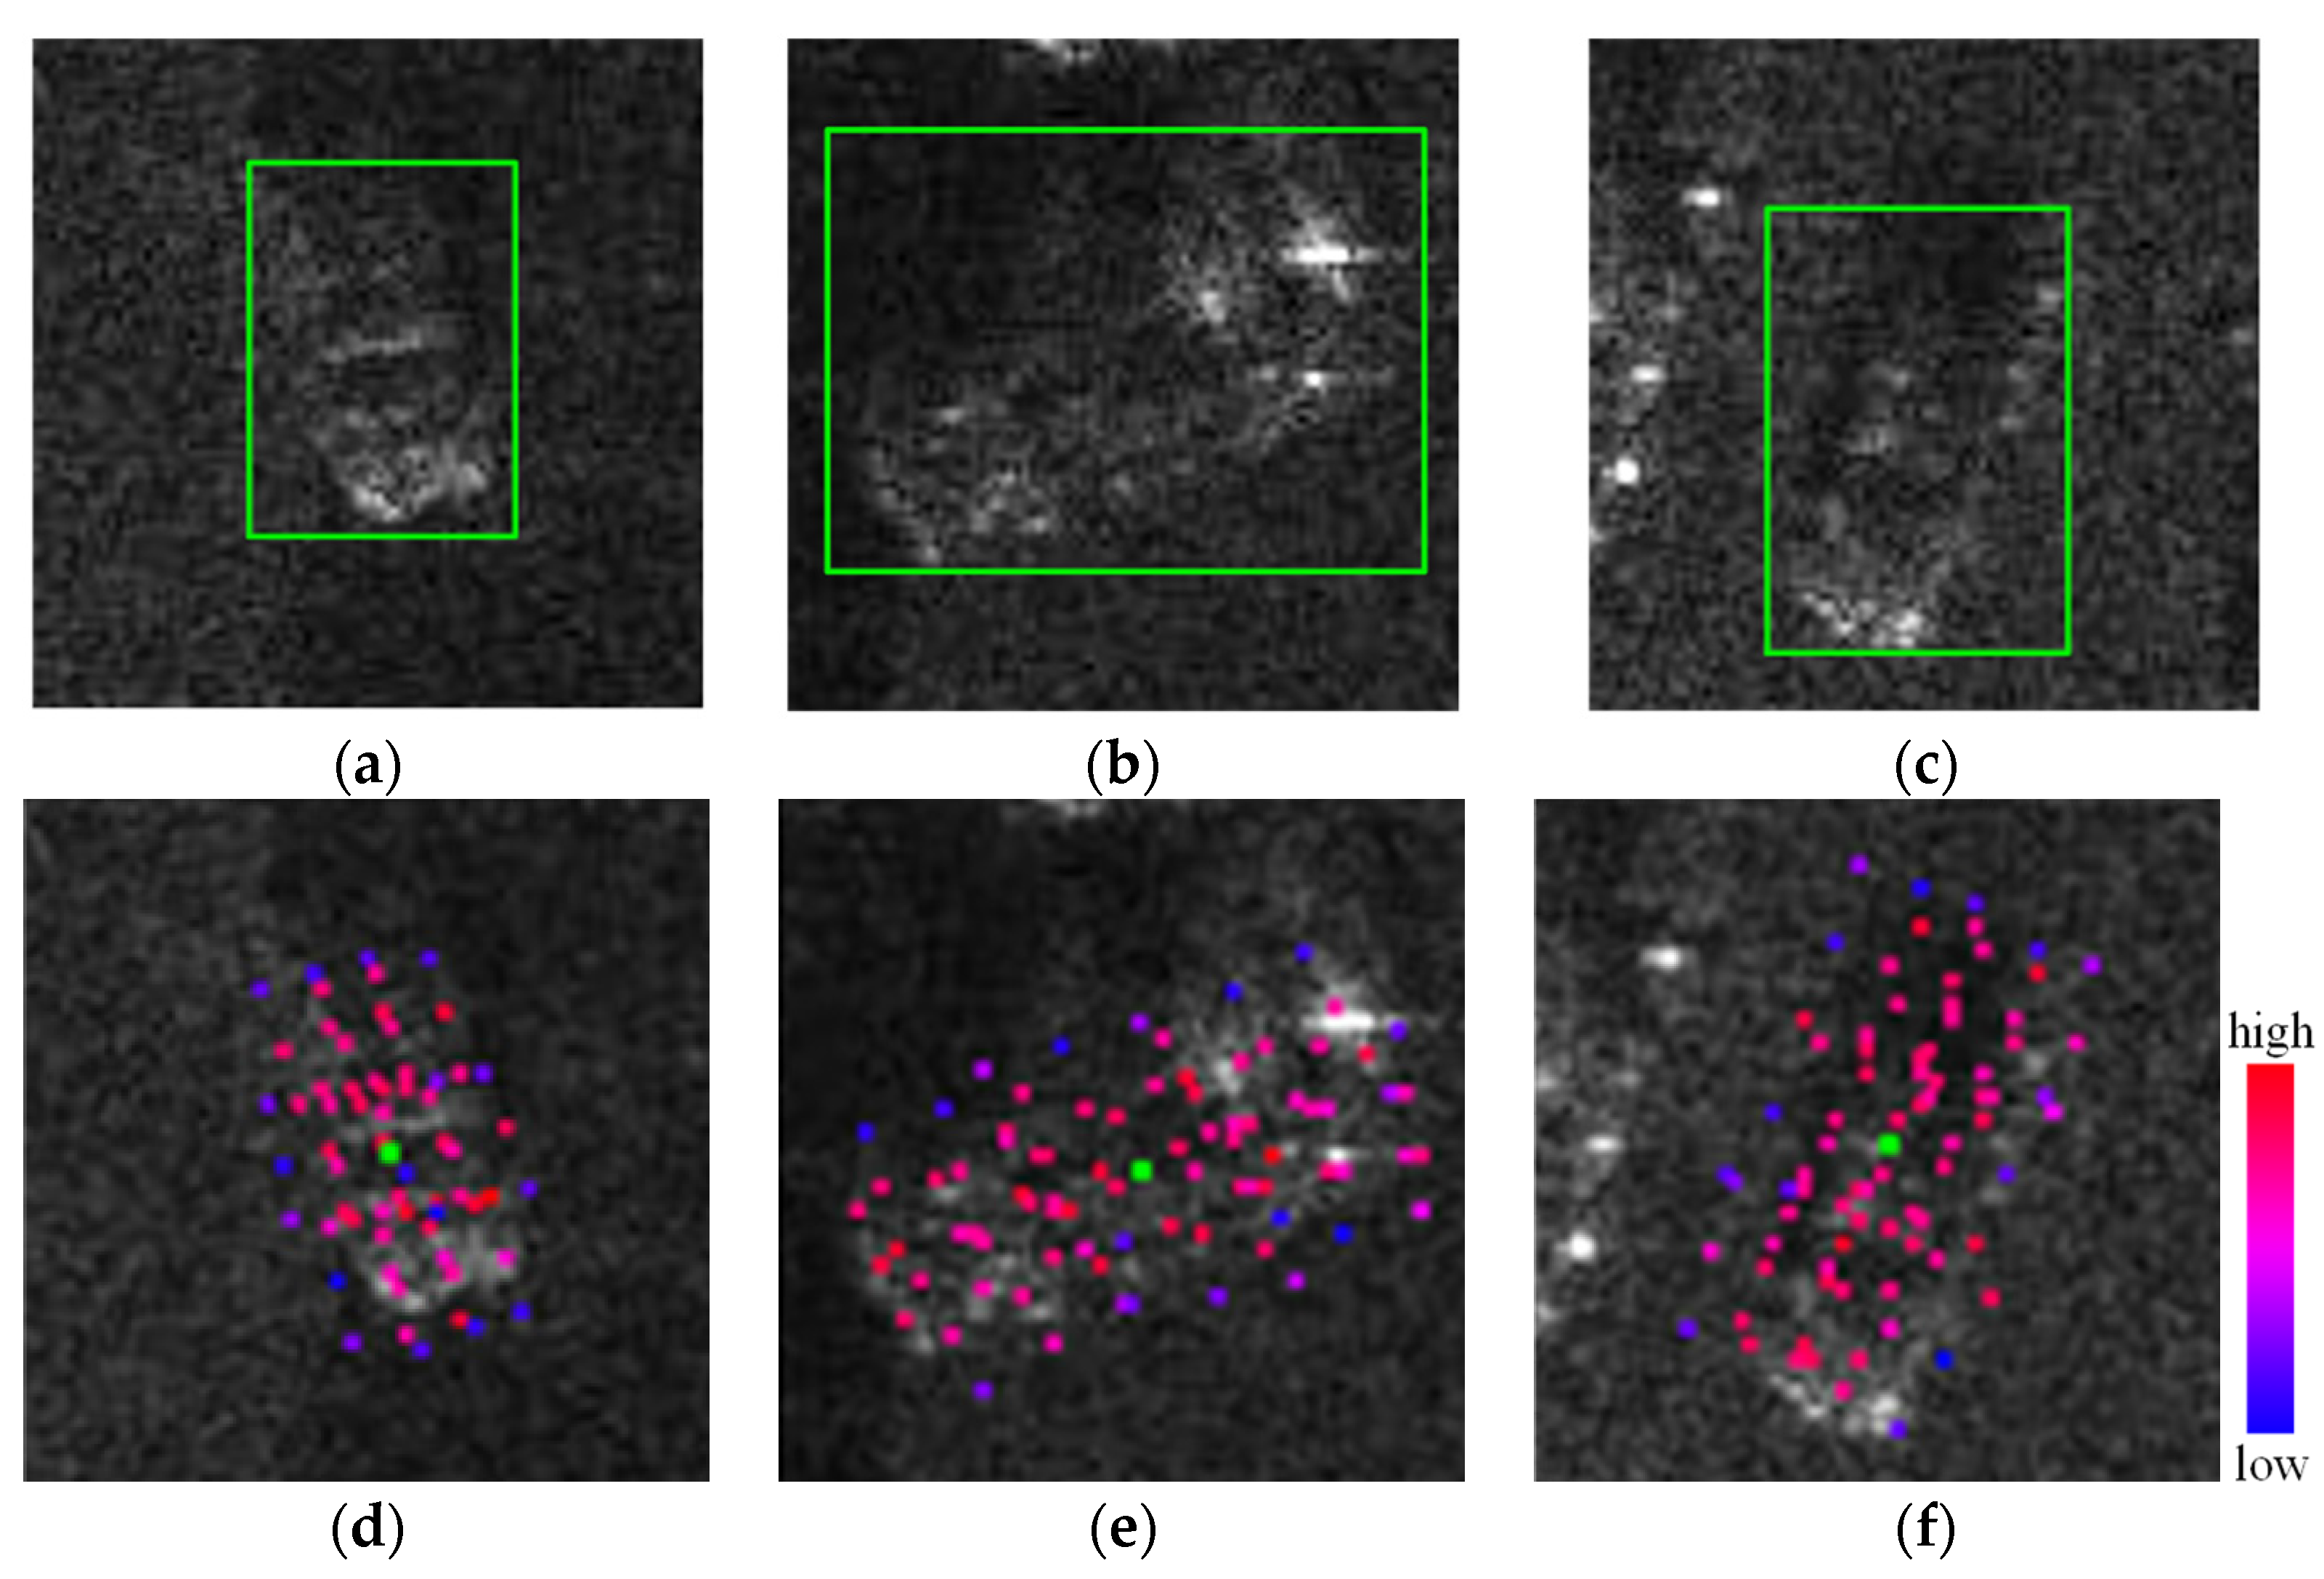
Figure 6 exhibits the SAR chips of vehicle targets and the sampling locations obtained from the RIRConv on three different SAR targets. Considering that the sizes of the SAR images are too large, which cannot show the sampling locations clearly. Thus, we plot the sampling locations on the vehicle target chips of SAR images. Figure 6a–c show the SAR chips of three vehicle targets with different lengths, widths, and rotation angles. Figure 6d–f show the sampling locations obtained from the RIRConv. In Figure 6d–f, the points denote the sampling locations in two levels of RIRConv kernels. The green points at the center of the vehicle targets represent the center sampling location of the RIRConv kernel. The modulation weights of the sampling locations are reflected in the colors of the points: the larger the modulation weight, the closer it is to a red color, while the smaller the modulation weight, the closer it is to a blue color. By stacking two layers of RIRConv, we can obtain 81 sampling points.
From Figure 6d–f, we can see that these sampling locations no longer obey a fixed square but can be adaptively adjusted according to the lengths, widths, and rotation angles of the vehicle targets, thus proving that the RIRConv can adjust the sampling locations adaptively. Moreover, by observing the colors of these sampling points, we can see that the sampling points with low modulation weights (i.e., the sampling points close to blue) are mostly distributed outside the vehicle targets. The sampling points with high modulation weights (i.e., the sampling points close to red) are mostly distributed inside the vehicle targets. It proves that the modulation weights can make the RIRConv pay more attention to the sampling locations that significantly impact the output.
3.5.2. Parameters, FLOPs, and Runtime Analysis
We compare the parameters, FLOPs, and runtime of the proposed method and other deep-learning based target detection methods. As shown in Table 2, we can see that the proposed method is significantly less than RefineDet and Faster RCNN in terms of parameters, FLOPs, and runtime, but only slightly higher than SSD. Nevertheless, as described in Section 3.4, the proposed method can obtain the highest detection performance. In conclusion, the proposed method can significantly improve the detection performance by adding a few parameters, FLOPs, and runtime.
4. Conclusions
In this paper, we proposed a novel vehicle target detection network based on RIRConv. For the vehicle target detection task in SAR images, the proposed RIRConv is designed according to the shape prior information of the vehicle targets to determine more accurately the convolutional sampling locations for vehicle targets. The RIRConv is lightweight and can be trained without additional supervision in an end-to-end manner. Finally, we introduced the proposed RIRConv into SSD to realize SAR vehicle target detection. The qualitative and quantitative experimental results based on the measured SAR dataset show the effectiveness of the proposed method. In addition, as the vehicle targets in optical remote sensing images also maintain a rectangular shape, we believe the RIRConv can also be used for optical vehicle target detection. However, the effect of RIRConv is more prominent for SAR vehicle target detection.
Author Contributions
Conceptualization, L.D. and L.L.; methodology, L.L. and Y.D.; software, L.L. and Y.D.; validation, L.L.; data curation, L.L.; writing—original draft preparation, L.L.; writing—review and editing, L.D. and Y.D.; supervision, L.D.; All authors have read and agreed to the published version of the manuscript.
Funding
This research was funded in part by the National Science Foundation of China (Grant Number U21B2039), in part by the 111 Project.
Conflicts of Interest
The authors declare there is no conflict of interest.
References
- Novak, L.M.; Burl, M.C.; Irving, W.W. Optimal polarimetric processing for enhanced target detection. IEEE Trans. Aerosp. Electron. Syst. 1993, 29, 234–244. [Google Scholar] [CrossRef]
- Alberola-Lopez, C.; Casar-Corredera, J.; de Miguel-Vela, G. Object CFAR detection in gamma-distributed textured-background images. IEE Proc.-Vis. Image Signal Process. 1999, 146, 130–136. [Google Scholar] [CrossRef]
- Girshick, R.; Donahue, J.; Darrell, T.; Malik, J. Rich feature hierarchies for accurate object detection and semantic segmentation. In Proceedings of the IEEE Conference on Computer Vision and Pattern Recognition, Columbus, OH, USA, 23–28 June 2014; pp. 580–587. [Google Scholar]
- Ren, S.; He, K.; Girshick, R.; Sun, J. Faster R-CNN: Towards realtime object detection with region proposal networks. In Proceedings of the Neural Information Processing System, Montreal, QC, Canada, 7–12 December 2015; pp. 91–99. [Google Scholar]
- Redmon, J.; Divvala, S.; Girshick, R.; Farhadi, A. You only look once: Unified, real-time object detection. In Proceedings of the IEEE Conference on Computer Vision and Pattern Recognition, Las Vegas, NV, USA, 27–30 June 2016; pp. 779–788. [Google Scholar]
- Liu, W.; Anguelov, D.; Erhan, D.; Szegedy, C.; Reed, S.; Fu, C.Y.; Berg, A.C. SSD: Single shot multibox detector. In Proceedings of the European Conference on Computer Vision, Amsterdam, The Netherlands, 8–16 October 2016; pp. 21–37. [Google Scholar]
- Du, L.; Li, L.; Wei, D.; Mao, J. Saliency-Guided Single Shot Multibox Detector for Target Detection in SAR Images. IEEE Trans. Geosci. Remote Sens. 2020, 58, 3366–3376. [Google Scholar] [CrossRef]
- Wang, Z.; Du, L.; Mao, J.; Liu, B.; Yang, D. SAR target detection based on SSD with data augmentation and transfer learning. IEEE Geosci. Remote Sens. Lett. 2018, 16, 150–154. [Google Scholar] [CrossRef]
- Dai, J.; Qi, H.; Xiong, Y.; Li, Y.; Zhang, G.; Hu, H.; Wei, Y. Deformable Convolutional Networks. In Proceedings of the IEEE International Conference on Computer Vision, Venice, Italy, 22–29 October 2017; pp. 764–773. [Google Scholar]
- Zhu, X.; Hu, H.; Lin, S.; Dai, J. Deformable ConvNets V2: More Deformable, Better Results. In Proceedings of the IEEE International Conference on Computer Vision, Long Beach, CA, USA, 15–20 June 2019; pp. 9300–9308. [Google Scholar]
- Simonyan, K.; Zisserman, A. Very deep convolutional networks for large-scale image recognition. In Proceedings of the International Conference on Learning Representations, San Diego, CA, USA, 7–9 May 2015. [Google Scholar]
- Neubeck, A.; Van Gool, L. Efficient Non-Maximum Suppression. In Proceedings of the 18th International Conference on Pattern Recognition, Hong Kong, 20–24 August 2006; pp. 850–855. [Google Scholar]
- SANDIA Mini SAR Complex Imagery. Available online: http://www.sandia.gov/radar/complex-data/index.html (accessed on 10 January 2018).
- Zhang, S.; Wen, L.; Bian, X.; Lei, Z.; Li, S.Z. Single-Shot Refinement Neural Network for Object Detection. In Proceedings of the 2018 IEEE/CVF Conference on Computer Vision and Pattern Recognition, Salt Lake City, UT, USA, 18–23 June 2018; pp. 4203–4212. [Google Scholar]
Figure 1.
The architecture of the proposed vehicle target detection network for SAR images.

Figure 2.
The sampling locations on a kernel: (a) original sampling locations; (b) the sampling locations when , , and ; (c) the sampling locations when , , and ; (d) the sampling locations when , , and .
Figure 2.
The sampling locations on a kernel: (a) original sampling locations; (b) the sampling locations when , , and ; (c) the sampling locations when , , and ; (d) the sampling locations when , , and .

Figure 3.
Illustration of the RIRConv.

Figure 4.
Two SAR images in the miniSAR dataset. (a) a SAR image from the training set; (b) a SAR image from the test set.
Figure 4.
Two SAR images in the miniSAR dataset. (a) a SAR image from the training set; (b) a SAR image from the test set.

Figure 5.
The target detection results compared with other detection methods for Images I and II, where green, red, and yellow rectangles represent the detected target chips, false alarms, and missing alarms, respectively. (a,b) the two-parameter CFAR method, (c,d) the Gamma CFAR method, (e,f) the Faster RCNN, (g,h) the original SSD, (i,j) the DA-TL SSD, (k,l) the RefineDet, (m,n) the proposed target detection method.


Figure 6.
SAR chips of vehicle targets and the sampling locations ( points in each SAR chip) in two levels of RIRConv kernels. (a,b,c) SAR chips of vehicle targets. (d,e,f) Sampling locations in two levels of RIRConv kernels.
Figure 6.
SAR chips of vehicle targets and the sampling locations ( points in each SAR chip) in two levels of RIRConv kernels. (a,b,c) SAR chips of vehicle targets. (d,e,f) Sampling locations in two levels of RIRConv kernels.


Table 1.
Overall evaluation of different target detection methods.
| Precision | Recall | F1-Score | |
|---|---|---|---|
| Two-parameter CFAR | 0.3789 | 0.7966 | 0.5135 |
| Gamma CFAR | 0.3931 | 0.8136 | 0.5301 |
| Faster R-CNN | 0.8115 | 0.8051 | 0.8083 |
| Original SSD | 0.8468 | 0.8814 | 0.8638 |
| DA-TL SSD | 0.8843 | 0.8983 | 0.8912 |
| RefineDet | 0.8828 | 0.9237 | 0.9027 |
| Proposed method | 0.9134 | 0.9431 | 0.9280 |
Table 2.
Complexities of the proposed method and other deep-learning based methods.
| Parameters | FLOPs | Runtime (Seconds/Per Test Sub-Image) | |
|---|---|---|---|
| Faster R-CNN | 0.102 | ||
| SSD | 0.015 | ||
| RefineDet | 0.054 | ||
| Proposed method | 0.021 |
Publisher’s Note: MDPI stays neutral with regard to jurisdictional claims in published maps and institutional affiliations. |
© 2022 by the authors. Licensee MDPI, Basel, Switzerland. This article is an open access article distributed under the terms and conditions of the Creative Commons Attribution (CC BY) license (https://creativecommons.org/licenses/by/4.0/).
Share and Cite
MDPI and ACS Style
Li, L.; Du, Y.; Du, L. Vehicle Target Detection Network in SAR Images Based on Rectangle-Invariant Rotatable Convolution. Remote Sens. 2022, 14, 3086. https://doi.org/10.3390/rs14133086
AMA Style
Li L, Du Y, Du L. Vehicle Target Detection Network in SAR Images Based on Rectangle-Invariant Rotatable Convolution. Remote Sensing. 2022; 14(13):3086. https://doi.org/10.3390/rs14133086
Chicago/Turabian StyleLi, Lu, Yuang Du, and Lan Du. 2022. "Vehicle Target Detection Network in SAR Images Based on Rectangle-Invariant Rotatable Convolution" Remote Sensing 14, no. 13: 3086. https://doi.org/10.3390/rs14133086
Note that from the first issue of 2016, this journal uses article numbers instead of page numbers. See further details here.