
Atmospheric Effects and Precursors of Rainfall over the Swiss Plateau


1
Institute of Applied Physics, University of Bern, 3012 Bern, Switzerland
2
Oeschger Centre for Climate Change Research, University of Bern, 3012 Bern, Switzerland
*
Author to whom correspondence should be addressed.
Remote Sens. 2022, 14(12), 2938; https://doi.org/10.3390/rs14122938
Submission received: 18 March 2022
/
Revised: 31 May 2022
/
Accepted: 17 June 2022
/
Published: 20 June 2022
(This article belongs to the Special Issue Advances in Earth Observation to Improve Flood Disaster Monitoring and Management)
Abstract
:In this study, we investigate the characteristics of atmospheric parameters before, during, and after rain events in Bern, Switzerland. Ground-based microwave radiometer data of the TROpospheric WAter RAdiometer (TROWARA) with a time resolution of 7 s, observations of a weather station, and the composite analysis method are used to derive the temporal evolution of rain events and to identify possible rainfall precursors during a 10-year period (1199 available rain events). A rainfall climatology is developed using parameters integrated water vapor (IWV), integrated liquid water (ILW), rain rate, infrared brightness temperature (T), temperature, pressure, relative humidity, wind speed, and air density. It was found that the IWV is reduced by about 2.2 mm at the end of rain compared to the beginning. IWV and T rapidly increase to a peak at the onset of the rainfall. Precursors of rainfall are that the temperature reaches its maximum around 30 to 60 min before rain, while the pressure and relative humidity are minimal. IWV fluctuates the most before rain (obtained with a 10 min bandpass). In 60% of rain events, the air density decreases 2 to 6 h before the onset of rain. The seasonality and the duration of rain events as well as the diurnal cycle of atmospheric parameters are also considered. Thus, a prediction of rainfall is possible with a true detection rate of 60% by using the air density as a precursor. Further improvements in the nowcasting of rainfall are possible by using a combination of various atmospheric parameters which are monitored by a weather station and a ground-based microwave radiometer.
1. Introduction
Continuous and heavy rainfall in Switzerland often triggers floods [1,2]. The Swiss Plateau is the most densely populated place with frequent floods not only causing huge economic losses but even endangering the safety of human life [3,4]. For example, flood events in August 2005, October 2011, July 2014, June 2015, June 2018, and July 2021 occurred on the Swiss Plateau, where villages and several major cities were severely affected. Due to the geographical location of the Swiss Plateau between the Jura Mountains and the Swiss Alps, rainfall is inherently complex [5,6]. Furthermore, local-scale detection of heavy rainfall trends may be masked or amplified by natural variability [7], and numerical weather prediction (NWP) models have difficulty in predicting them accurately [8]. A complete and organized description of the occurrence and development of rainfall on the Swiss Plateau, understanding of its effects with the evolution of atmospheric parameters, and seeking atmospheric precursors of rainfall for the nowcasting or prediction therefore become an urgent need.
Rainfall can be acquired by different techniques. Rain gauges and Doppler weather radars both collect rainfall data in minutes, but the former may be degraded by wind effects and the latter has a high operating cost. Satellite microwave radiometers have low temporal sampling at a certain place and are limited in the inversion of rainfall over land [9]. To overcome these drawbacks, the ground-based microwave radiometer is now extensively being used for rainfall retrieval, nowcasting convective activity, and meteorological analysis [10,11,12,13]. The TROpospheric WAter RAdiometer (TROWARA), as a ground-based microwave radiometer, can reliably retrieve rain rate, IWV, and ILW values since 2004 in Bern [14]. The enhanced microwave emission from rain droplets due to the Mie effect leads to a rapid rise in the ILW when rain starts [15]. TROWARA rainfall retrieval takes advantage of this physical property and uses the ILW acquired by the TROWARA radiometer as an indicator to determine the onset of rain (ILW > 0.4 mm) [16]. Accurately identifying the onset of rain is important for the nowcasting of rainfall, which can clearly distinguish between the variables needed to cause rainfall and their subsequent behavior [17]. Furthermore, TROWARA’s data products are available nearly continuously and in all weather with a high time resolution of 7 s [18]. Because of the intermittent nature and spatial complexity of rainfall, high-temporal-resolution observations are necessary to accurately capture rainfall [19]. High time resolution can also offer details of the microphysical, dynamic, and thermodynamic characteristics of mesoscale rainfall phenomena [20].
The convection and transportation of water vapor are closely linked to rainfall [21]. Van Baelen et al. [22] found that water vapor plays an essential role in studying the life cycle of rainfall and inducing convection. Rainfall and humidity are positively related, and tracking water vapor advection and understanding the shallow-to-deep transition of convection on the mesoscale can be enabled by integrated water vapor (IWV) [23,24]. Convergence of water vapor, anomalies in IWV, and increased tropospheric instability before the onset of heavy rain are employed as nowcasting tools [13,25]. The warm conveyor belt consists of coherent ascending airstreams along the cold front originated in extratropical cyclones’ warm sector, delivering a steady stream of water vapor [26]. Heavy rainfall events on the Swiss Plateau are typically associated with warm conveyor belts and water vapor convectively enhanced lifting [21,27]. Analyses of changes in water vapor and the relationship with rainfall are thus necessary.
Composite analysis is an excellent method to explore observations and to learn about the temporal evolution of rainfall and atmospheric parameters. Adams et al. [28] conducted the composite analysis of 320 convective rain events using 3.5 years of tropical GNSS-IWV. The shallow-to-deep transition of mesoscale convection can be determined by a water vapor convergence timescale. Zhang et al. [29] investigated 10 rain events with the composite analysis using ground-based microwave radiometer and micro rain radar measurements in central China. They found IWV increases by 5 mm before monsoon light rain events. Sapucci et al. [30] studied the composite average of GNSS-IWV of 1 h before and after 18 heavy rain events. IWV increases sharply before heavy rain events, and there are oscillations in the IWV time series. The composite analysis method is also commonly applied to develop the precursors. Allan et al. [31] demonstrated atmospheric precursors of 25 heaviest rainfall events and 200 most intense 3-hourly events on regional scales through the composite analysis of rain gauge records and ERA-Interim reanalysis data over the United Kingdom. However, most related studies analyzed only a limited number of rain events or lacked long-term observations. This is likely to have a weak robustness [32], and composite results may rely on individual rain events and are not representative [33].
Air density is an important atmospheric parameter that interacts with and predicts rainfall. When rainfall increases, the air density also increases [34], and the falling velocity of raindrops is affected by the air density [35]. The air density is used as an input for many rainfall prediction models [36,37,38]. For example, a computer-aided rule-based rainfall prediction model is proposed by Ji et al. [39], and they found that the air density occurs at the highest level of this rule, which means the air density is most important for predicting hourly rainfall intensity.
Knowledge about atmospheric effects and precursors of rainfall contributes to a better nowcasting. Nowcasting is the use of weather parameters already obtained by technologies to extrapolate the likely future 0 to 6 h temporal evolution of the air mass. Numerical weather models such as NWP can provide rainfall forecasts by solving physical equations a few days earlier. However, because the models do not have sufficiently accurate temperature and humidity distribution or cloud state information at startup, they tend to provide poor predictions in the short term. Nowcasting fills the limitations for this important time interval and is typically applied to weather on the local scale and mesoscale. Advances in communication technology, weather observations, and data assimilation/numerical modeling and their combined synergy can offer better possibilities for nowcasting, and the climate change adaptation requires progress in nowcasting [40]. The Federal Office of Meteorology and Climatology (MeteoSwiss) of Switzerland uses weather radar combined with satellite, lightning measurements, and model data for nowcasting. However, the weather radars miss predictions because they can only locate precipitation particles (rain, snow, or hail) and cannot observe water vapor as microwave radiometers do. In the case of high-altitude and low-temperature mountainous areas, a large amount of water vapor moves there, forming heavy rainfall rapidly, which may trigger flash floods. In addition, due to the lack of radar systems for nowcasting in less developed and remote areas, further analysis of data from the network of weather stations can be useful.
In this study, we investigate the potential of eight atmospheric parameters from a ground-based microwave radiometer and a weather station for the nowcasting of rainfall. We use 1199 rain events provided by TROWARA on the Swiss Plateau to identify conditions favorable for the triggering rainfall over 10 years and to analyze how they are related to observed changes in water vapor. The composite analysis is carried out in a long time interval of 8 h before and 16 h after rain, with the onset of rain serving as the time marker for this method. The aim of our study is to show the typical behavior of rainfall, to reveal the interaction of rainfall with atmospheric parameters, and to explore the precursors of rainfall. Section 2 outlines the derivation of the atmospheric parameters, the study area, data, and methodology. Section 3 presents the temporal evolution of atmospheric parameters, provides the analysis results, as well as analyzes rainfall mechanisms, the ILW threshold, and diurnal cycles. Section 4 discusses multiple parameters and studies by others. Conclusions are given in Section 5.
2. Study Area, Derivation, Data, and Methodology
2.1. Study Area
The Swiss Plateau lies north of the Alps and extends west–east from Lake Geneva on the French border to Lake Constance on the German–Austrian border. To the northwest of the plateau are the Jura Mountains. The entire plateau is covered with rolling hills, lakes, and rivers, with an average elevation of 580 m. The Swiss Plateau covers about one-third of Switzerland, but two-thirds of the population lives there. According to the Köppen climate classification, the Swiss Plateau is in the transition zone between a marine climate (Cfb) and a continental climate (Dfb). The weather is changeable and often overcast. It is cool in summer due to the cover of clouds, while the climate is relatively milder in winter. Freezing weather usually occurs from December to early March. The annual precipitation in Switzerland is between 1000–2000 mm, and the average annual precipitation in three-quarters of the region exceeds 1000 mm, and its precipitation is also greatly affected by the terrain.
TROWARA is operated in a room on the roof of the Exakte Wissenschaften (ExWi) (46.95°N, 7.44°E, 575 m a.s.l.) of the University of Bern. Bern is located on the Swiss Plateau. The mean annual precipitation sum and temperature in Bern are about 1059 mm and 8.8 °C, respectively [41]. Brandsma and Buishand [42] worked out that this area in summer is dominated by pre-frontal or post-frontal showers or thunderstorms, and rainfall totals are maximal during summer. The mean rain-day rainfall is about 10 mm from June to August. In winter, it is mainly frontal rainfall because of uphill or leeward effects and is an obvious dry season, nearly 6 mm rain per day.
2.2. Derivation
TROWARA’s antenna receives the atmospheric radiation signal through the microwave transparent window in a temperature control room at an elevation angle of 40° pointing to the southeast. The indoor operation avoids a water film caused by raindrops falling on the antenna. TROWARA retrieves integrated water vapor (IWV) and integrated liquid water (ILW) of cloud droplets during no rain (ILW ≤ 0.4 mm) and retrieves the rain rate during rain (ILW > 0.4 mm). Mätzler and Morland [43] and Wang et al. [16] described the TROWARA measurement principles and retrieval methods in detail, which are briefly described in the following. The radiative transfer equation of the non-scattering atmosphere is
where i is the frequency of the microwave channel (21 or 31 GHz). is the zenith opacity. is the cosine of the zenith angle . is the brightness temperature observed by TROWARA. is the brightness temperature of the cosmic background. is the effective mean temperature calculated by linear combinations of the surface air temperature, pressure, and relative humidity [43].
Equation (1) can be deduced to the zenith opacity as
The zenith opacity derived from TROWARA can be expressed as a function of IWV, ILW, and integrated rain liquid (IRL). The contributions of ice and dry snow are neglected because of their small dielectric loss.
where the coefficients and rely on the air pressure, and they can be obtained statistically by the coincident measurement of radiosondes and fine-tuned at clear sky [43]. The coefficient is the Rayleigh mass absorption coefficient of cloud water and depends on temperature (and frequency) rather than pressure. It is derived from the dielectric model of water [44]. is the Mie gain of raindrops, up to 10 at 21 GHz and 7 at 31 GHz. When there is no rain, i.e., , IWV and ILW are calculated from the opacity measurement values of 21 and 31 GHz channels in Equation (3), whereas IRL can be obtained when there is rain. IWV during the rain period is filled by the IWV calculated by linear interpolation of opacity before and after the rain [19]. The IRL provides the rain rate using a physical retrieval method [16].
Air density (kg/m) depends on temperature, pressure, and water vapor content in the air [45]. The water vapor pressure is calculated by the saturation water vapor pressure and the relative humidity RH [46]:
where the coefficients , . T is the air temperature. The units of and T are Pa and K, respectively. The air density is related to [45] by
where q is the specific humidity and is the virtual temperature. P is the air pressure and R = 287.047 (J/K·kg) is the specific gas constant of dry air. Here, we only consider the atmospheric parameters which are monitored by a Vaisala weather station at ground with a time resolution of 10 min.
2.3. Data and Methodology
To investigate the evolution of rainfall characteristics over time, the present study uses eight atmospheric parameters and rain rate to develop rainfall “climatology”. The eight atmospheric parameters are IWV, ILW, T, temperature, pressure, relative humidity, wind speed, and air density. TROWARA, as a dual-channel microwave radiometer (21.4 and 31.5 GHz), retrieves IWV, ILW, and rain rate with a time resolution of 7 s. It also has a 9.5–11.5 µm infrared radiometer channel to measure sky temperature. A standard weather station (ExWi weather station) similar to TROWARA on the roof of the ExWi building of the University of Bern acquires surface meteorological data with a time resolution of 10 min.
The composite analysis method (superposed epoch method) consists of two independent datasets. The first is discrete events in time, such as rain events. The second is the long, continuous, uniformly sampled time series, such as observations of atmospheric parameters [33]. The method assumes that these events lead to the characteristics of the continuous time series, and intercepts time series before, during, and after the event through time windows to construct a two-dimensional matrix. One row of the matrix represents a data segment for a single event. The number of rows is the sample size of these events (e.g., 1199 rain events). The columns are the epoch time. The number of columns depends on the time resolution of the data. The arithmetic mean values of these columns yield the composite of all events. The fundamental characteristic is to highlight the influence of parameters at the critical moment while weakening the influence from other phenomena and atmospheric noise [47]. It allows any fluctuations in the key time column to remain in the average value, and the time fluctuations of the row-by-row movement are averaged out [48]. To form the composite of rain events, the criteria are the following:
- The timing mark of a rain event is set as 0 epoch time (onset time of rainfall). The occurrence/duration time of rainfall is set as t; 1 h before rainfall is set as −1, 1 h during rainfall is set as +1, and 1 h after rainfall is set as t + 1.
- If no rainfall occurs during 8 h before the time 0 and during 16 h after the time t, then this rain event is selected.
From 1 January 2011 to 31 December 2020, all compliant rainfall events detected by TROWARA in Bern are considered. The number of rain events is denoted by N. There are, in total, 1199 rain events, including N = 345 in summer (June, July, August), N = 273 in winter (December, January, February), N = 428 long-duration rainfall (t > 16 h), and N = 497 short-duration rainfall (t < 8 h). The 8 h before rain is used because water vapor convection can be observed on this time scale [28]. The use of 16 h during and after rain is to observe the effect of rain on atmospheric parameters for as long as possible while maintaining a certain amount of available rain events.
To investigate 10 min fluctuations of IWV, its time series are filtered by a digital non-recursive, finite-impulse response (FIR), and fast-response bandpass filter. More details about the selected bandpass filter are given by Studer et al. [50].
3. Results
3.1. Atmospheric Effects of Rainfall
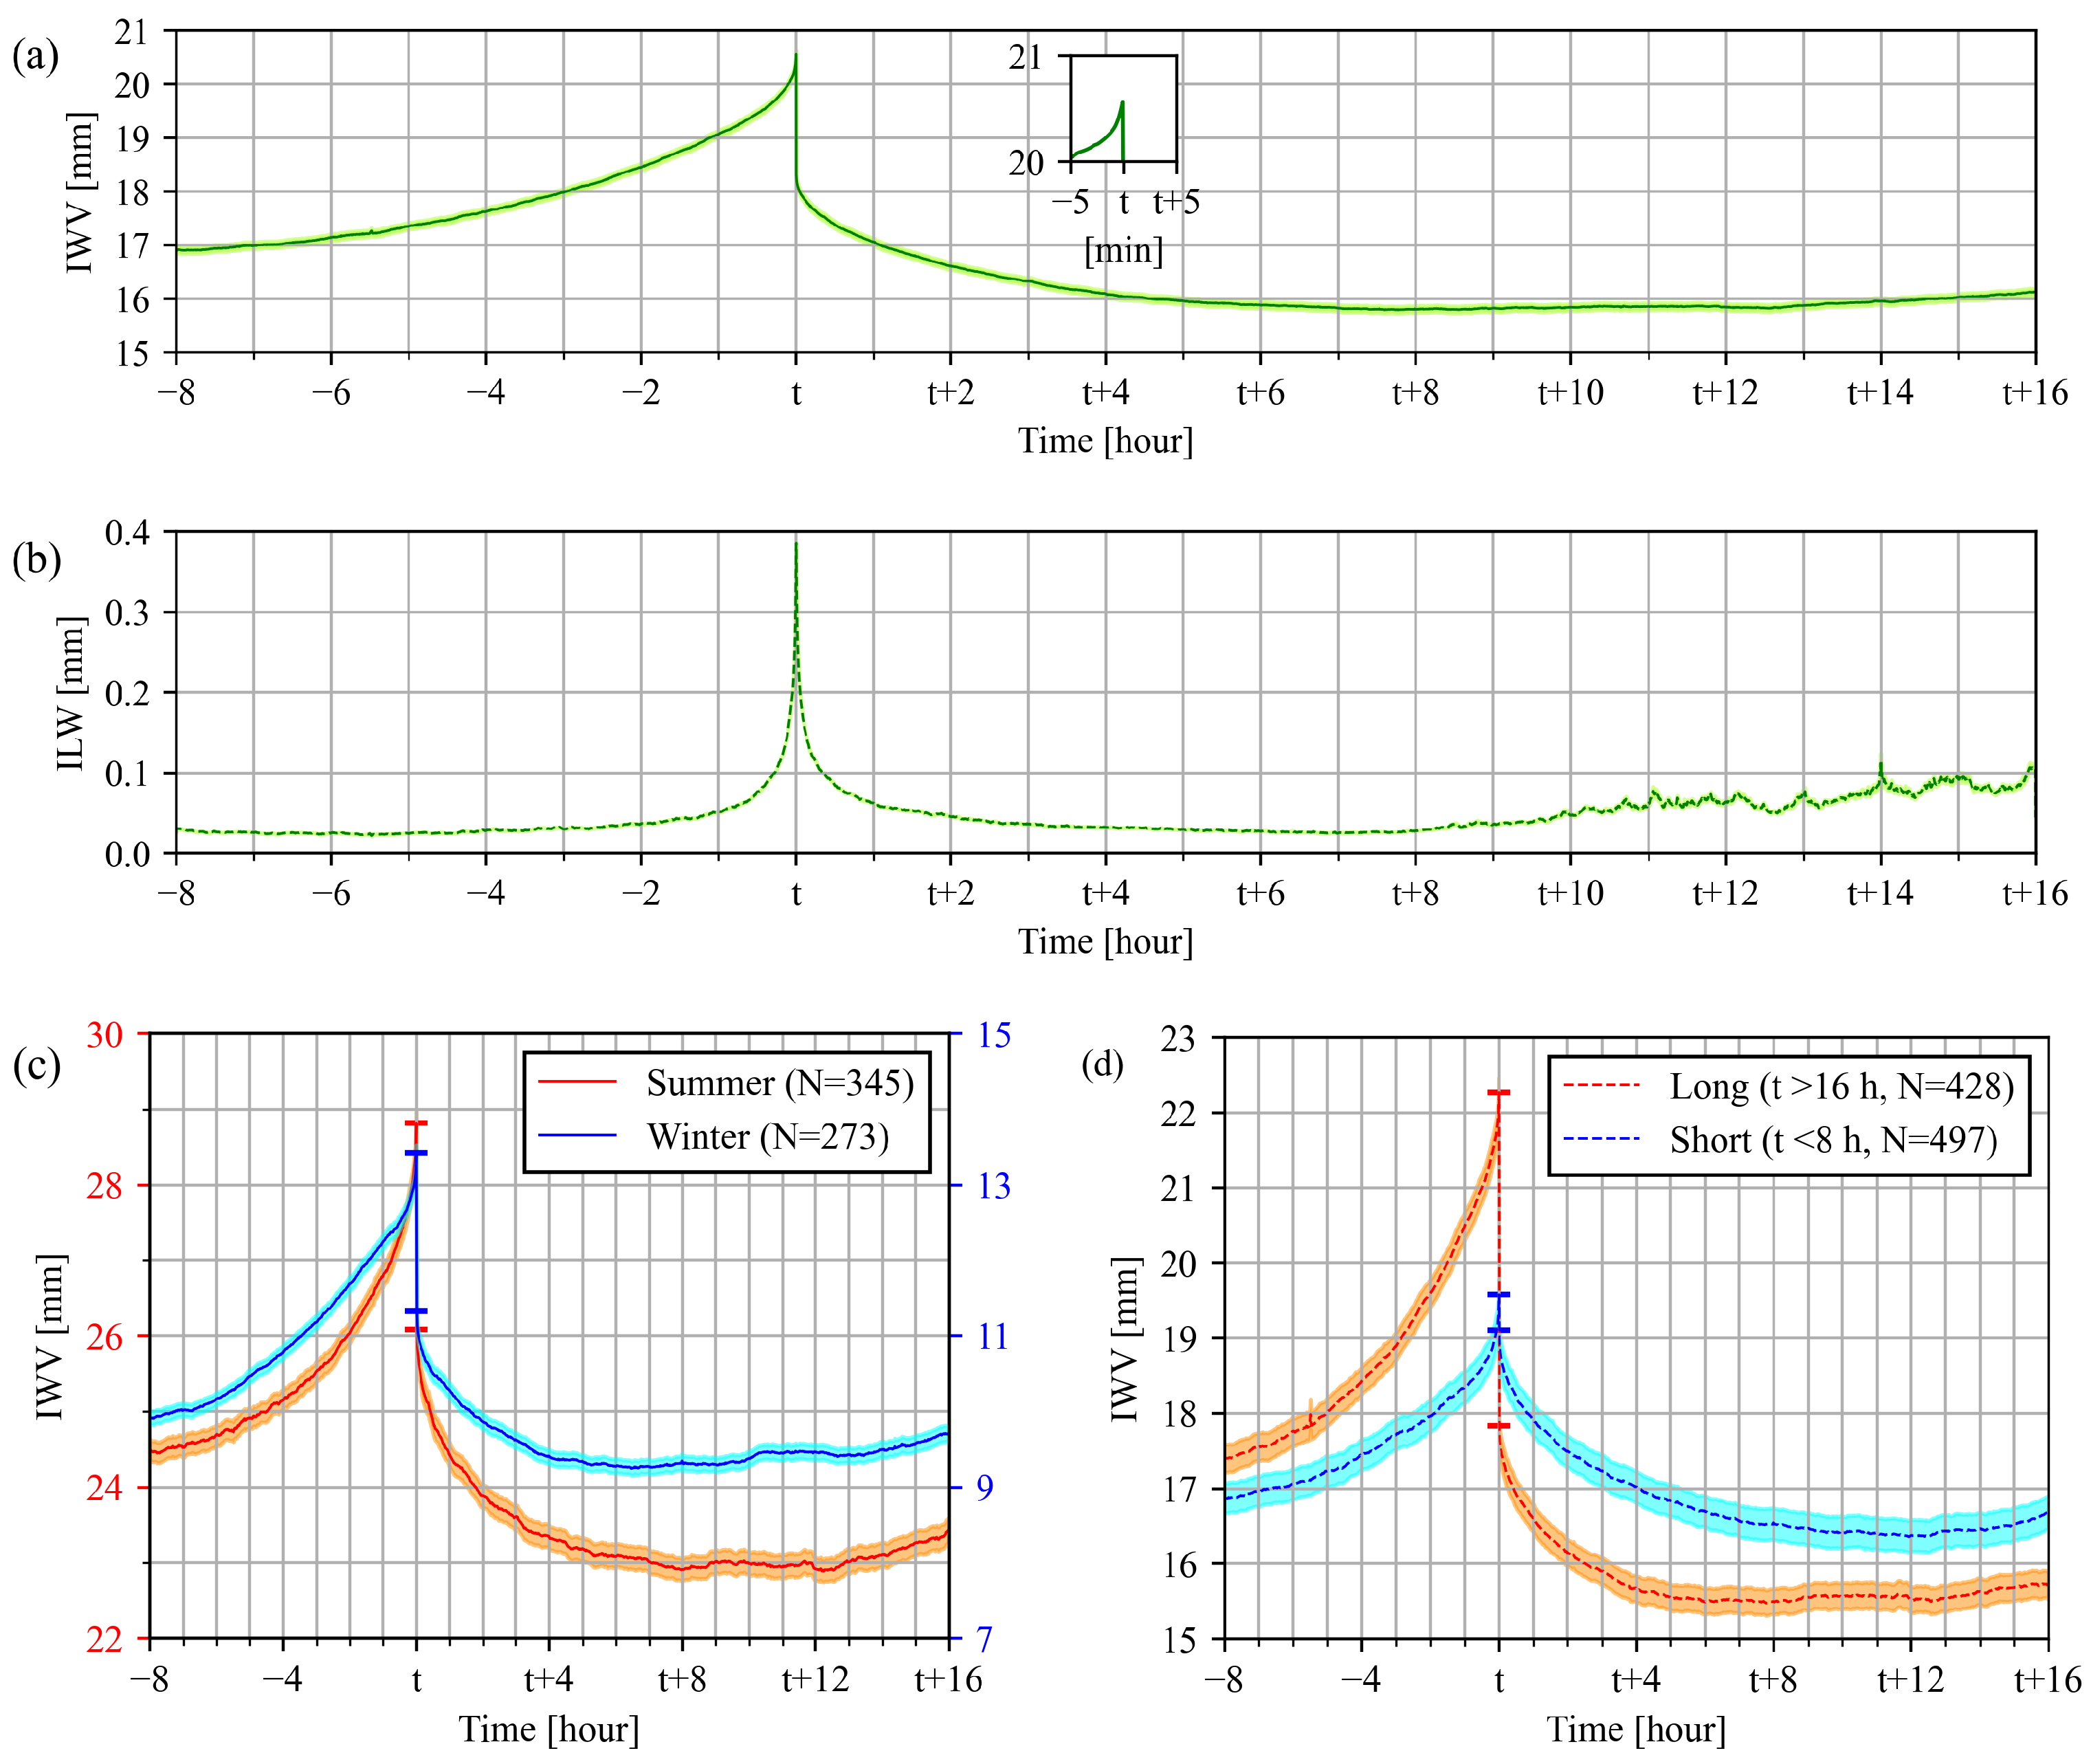
Figure 1a,b show the composites of IWV and ILW of all 1199 rain events before and after rain in Bern. Note that IWV during the rainfall is skipped since TROWARA cannot acquire IWV and ILW (of cloud droplets) during rain. The time before and after rain is expressed as a negative number and t + number, respectively. During the 6 to 8 h before rain, a slow increase is observed, and the mean IWV is around 17 mm. During the 0 to 6 h before rain, a rapid increase is observed, and IWV reaches the maximum value of 20.6 mm from 17 mm; it especially increases sharply by 0.6 mm within 5 min before the onset of rain. Convective processes likely play a greater role in the increase of IWV before rain. At low pressure or along the front, with the upward movement of water vapor, its convergence in highly hygroscopic condensation nuclei leads to an increase in IWV [51,52]. IWV at the end of rain is about 2.2 mm lower than at the beginning. The IWV decrease could be due to the direct removal of atmospheric water vapor by rainfall or to horizontal transport effects of water vapor. After rain, IWV decreases and remains at a stable level of 16 mm during the 4 to 16 h. ILW variations slightly vary from that of IWV. The ILW threshold for rainfall is approximately 0.4 mm [15,49]. During the 1 to 8 h before and after rain, ILW levels off about 0.03 mm but increases to 0.4 mm dramatically when rain starts. This is due to the opacity gain when the droplet diameter increases. During the 8 to 16 h after rain, ILW increases to about 0.1 mm and fluctuates. This might be due to cloud (fog) formation as a consequence of re-evaporation of surface water after rainfall.
Figure 1c,d show the composites of IWV for summer and winter as well as for short- and long-duration rain events. IWV in summer is more than twice that in winter and shows a larger peak. During the 8 h before rain, IWV in summer reaches a maximum value of 28.8 mm from 24.5 mm, and in winter it rises to 13.4 mm from 9.9 mm. IWV in summer at the end of rain is about 2.7 mm lower than at the beginning, and in winter it is 2.1 mm. As shown in Figure 1d, different duration of rainfall have different effects on IWV. The longer the rainfall, the greater the reduction in IWV from the beginning to the end of rain. The horizontal advection of water vapor plays a crucial role in cumulative rainfall. After long-duration rainfall (t > 16 h), IWV decreases by 4.4 mm, but the average cumulative rainfall of longer duration events is much larger than this value, about 11.8 mm. This may be due to the convergence of a small area of precipitation from the horizontal advection of a larger area of moist air. Statistics show that about 65% of all 1199 rain events have more cumulative rainfall than the difference of IWV acquired by the microwave radiometer from the onset to the end of rain. This finding may provide an indication of rainfall intensity in rainfall predictions. The impact of short-duration rainfall on IWV changes is limited. After short-duration rainfall (t < 8 h), IWV decreases by only 0.5 mm. IWV values of long-duration rainfall and short-duration rainfall 8 h before rain are close: both are around 17 mm. However, the IWV for long-duration rainfall reaches a peak of 22.3 mm at the beginning of rain, whereas for the short-duration rainfall, it is only 19.6 mm.
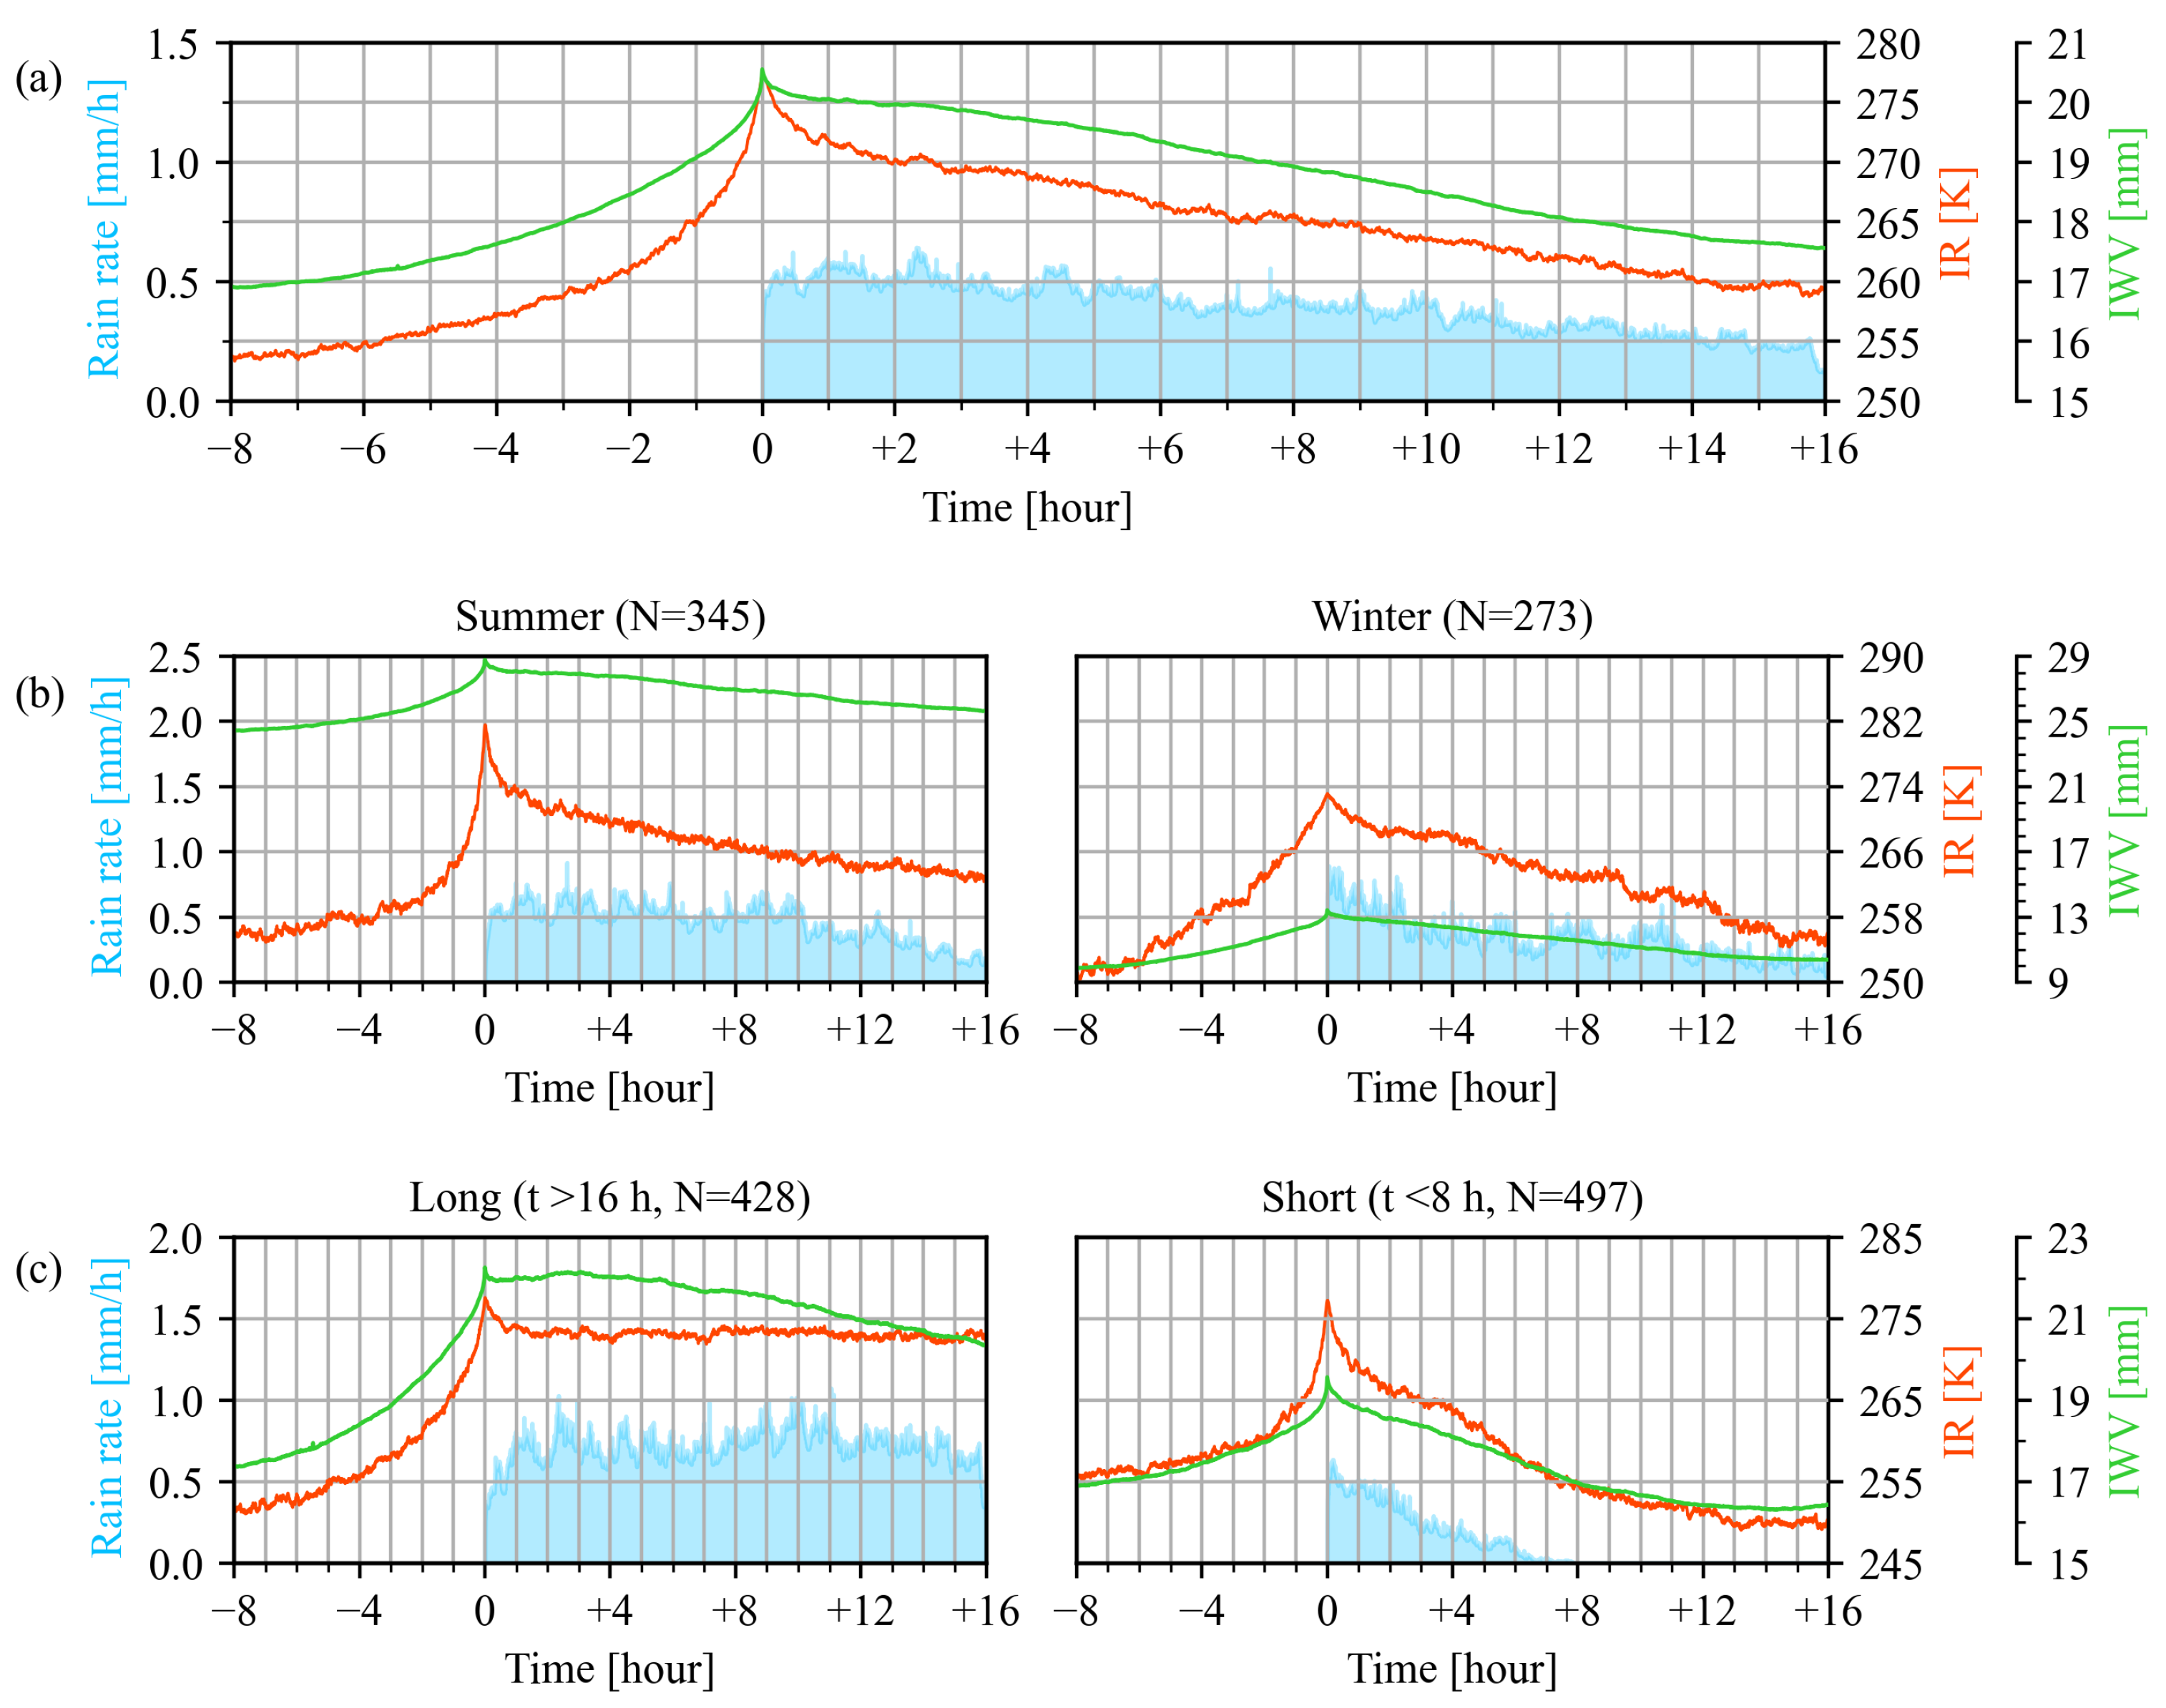
Figure 2a shows the composites of IWV, T, and rain rate of all 1199 rain events before and during rain. Note that IWV during rain is not acquired but is interpolated from TROWARA’s opacity measurements before and after rain [19]. The time before and during rain is expressed as a negative and positive number, respectively. Rain starts when time is 0, and the rain rate gradually decreases over time. From 0 to 8 h before rain, IWV is the same as in Figure 1, with an increase of 3.6 mm. It can be clearly seen that IWV reaches its peak when rain starts, and then it shows a slow downward trend. T also reaches a peak at the beginning of rain. The reason IWV and rain rate vary with T is that the water-holding capacity of the atmosphere increases with temperature, i.e., the warmer the air, the more water it can hold. At a given temperature, air reaches its maximum water-holding capacity (also known as the dew point) and becomes saturated. When the atmospheric temperature drops below the dew point and above 0°, the water vapor in the air condenses on the dust to form rain. As raindrops fall, they make the atmosphere cooler by evaporation. Figure 2b,c show the composites of IWV, T, and rain rate for summer and winter as well as for short- and long-duration rain events. These three parameters in summer are higher than in winter, and the T peak in summer is stronger and steeper than in winter. As shown in Figure 2c, after the onset of rain, the slope of IWV, T, and rain rate are similar. For long-duration rainfall, the rain rate continues to be high and maintains an average of about 0.75 mm/h. IWV stays at about 22 mm for 6 h, and then drops slightly to 20.4 mm. T remains at around 273 K. For short-duration rainfall, the rain rate gradually decreases to 0 from time 0 to +8. IWV and T decrease for 8 h and continue to fall to about 16.4 mm and 250 K after 8 h, respectively.
3.2. Precursors of Rainfall
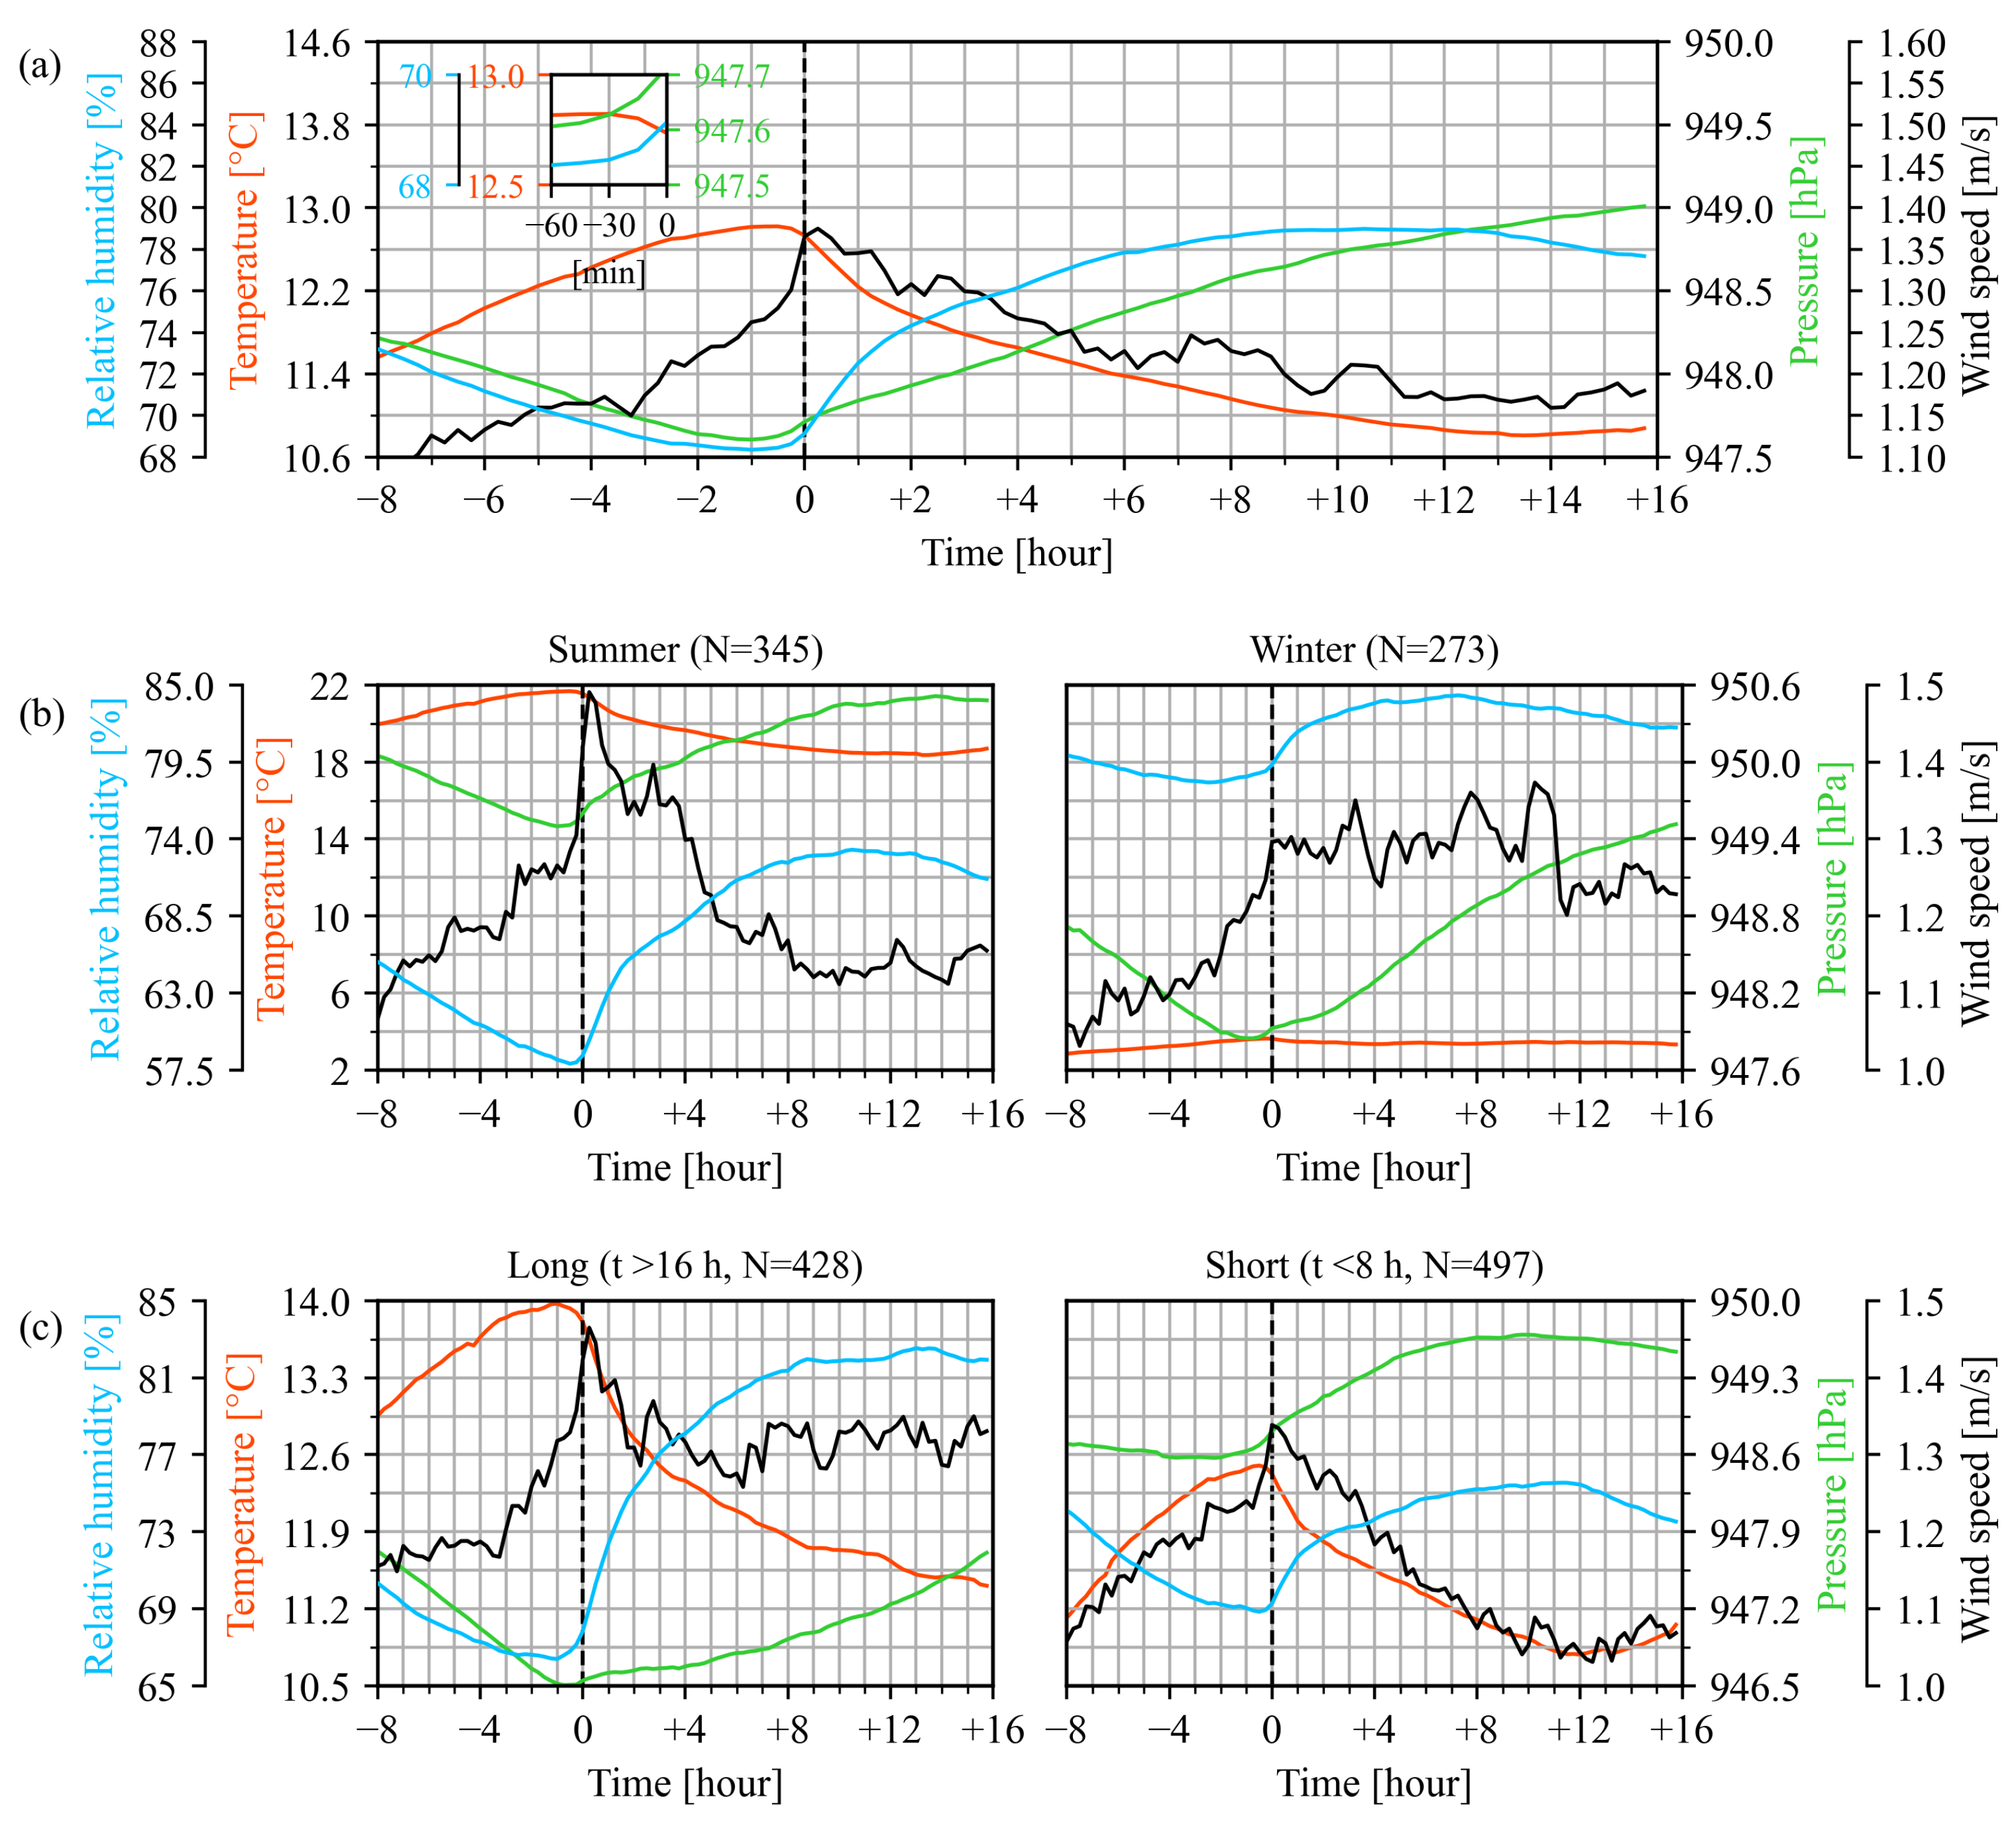
Figure 3a shows the composites of temperature, pressure, relative humidity, and wind speed before and during rain. Before rain starts, the temperature rises steadily and reaches its maximum of about 12.8 °C at 30 to 60 min before rain onset. The main reason for this increase in temperature may be that (1) thicker clouds make ground radiation blocked between the clouds and the ground, or (2) the increase of atmospheric water vapor affects the surface and atmospheric longwave radiation, and its absorption of solar radiation causes the surface temperature to increase [53]. On the other hand, at 30 to 60 min before rain onset, the pressure and relative humidity reach their minima of 947.6 hPa and 68.2%, respectively. The low density of moist air is the reason for the low pressure. The higher surface temperature before rain determines the low relative humidity. After rain starts, the temperature drops rapidly for 2 h, and then falls slowly until it remains stable. The pressure rises slowly, while the relative humidity rises rapidly for 2 h and drops slightly after reaching a maximum. These changes are because droplets begin to evaporate on the surface and energy is absorbed in the form of heat (latent heat). The wind speed increases rapidly before rain and reaches its maximum at the rain onset or a bit later. The main reason for this increase in wind may be that (1) at the front, one air mass is lifted above another, creating a low-pressure zone. The wind blows towards the low-pressure zone. The greater the temperature difference between the two air masses, the stronger the wind. (2) The falling rain creates downdrafts that spread air to the ground, creating gust fronts.
Figure 3b,c show the composites of temperature, pressure, relative humidity, and wind speed for summer and winter as well as for short- and long-duration rain events. The temperature and pressure in summer are higher than those in winter, whereas the relative humidity in summer is lower and shows a larger variation than in winter. In winter, the temperature variation caused by rainfall is very small, only rising by nearly 1 °C, but the pressure variation is relatively large. The wind speed in winter remains fluctuating at 1.3 m/s after rain starts. As shown in Figure 3c, long-duration rainfall has more obvious effects on temperature, pressure, relative humidity, and wind speed. Compared with short-duration rainfall, these four parameters show a larger variety and reach higher or lower extreme values before rain onset.
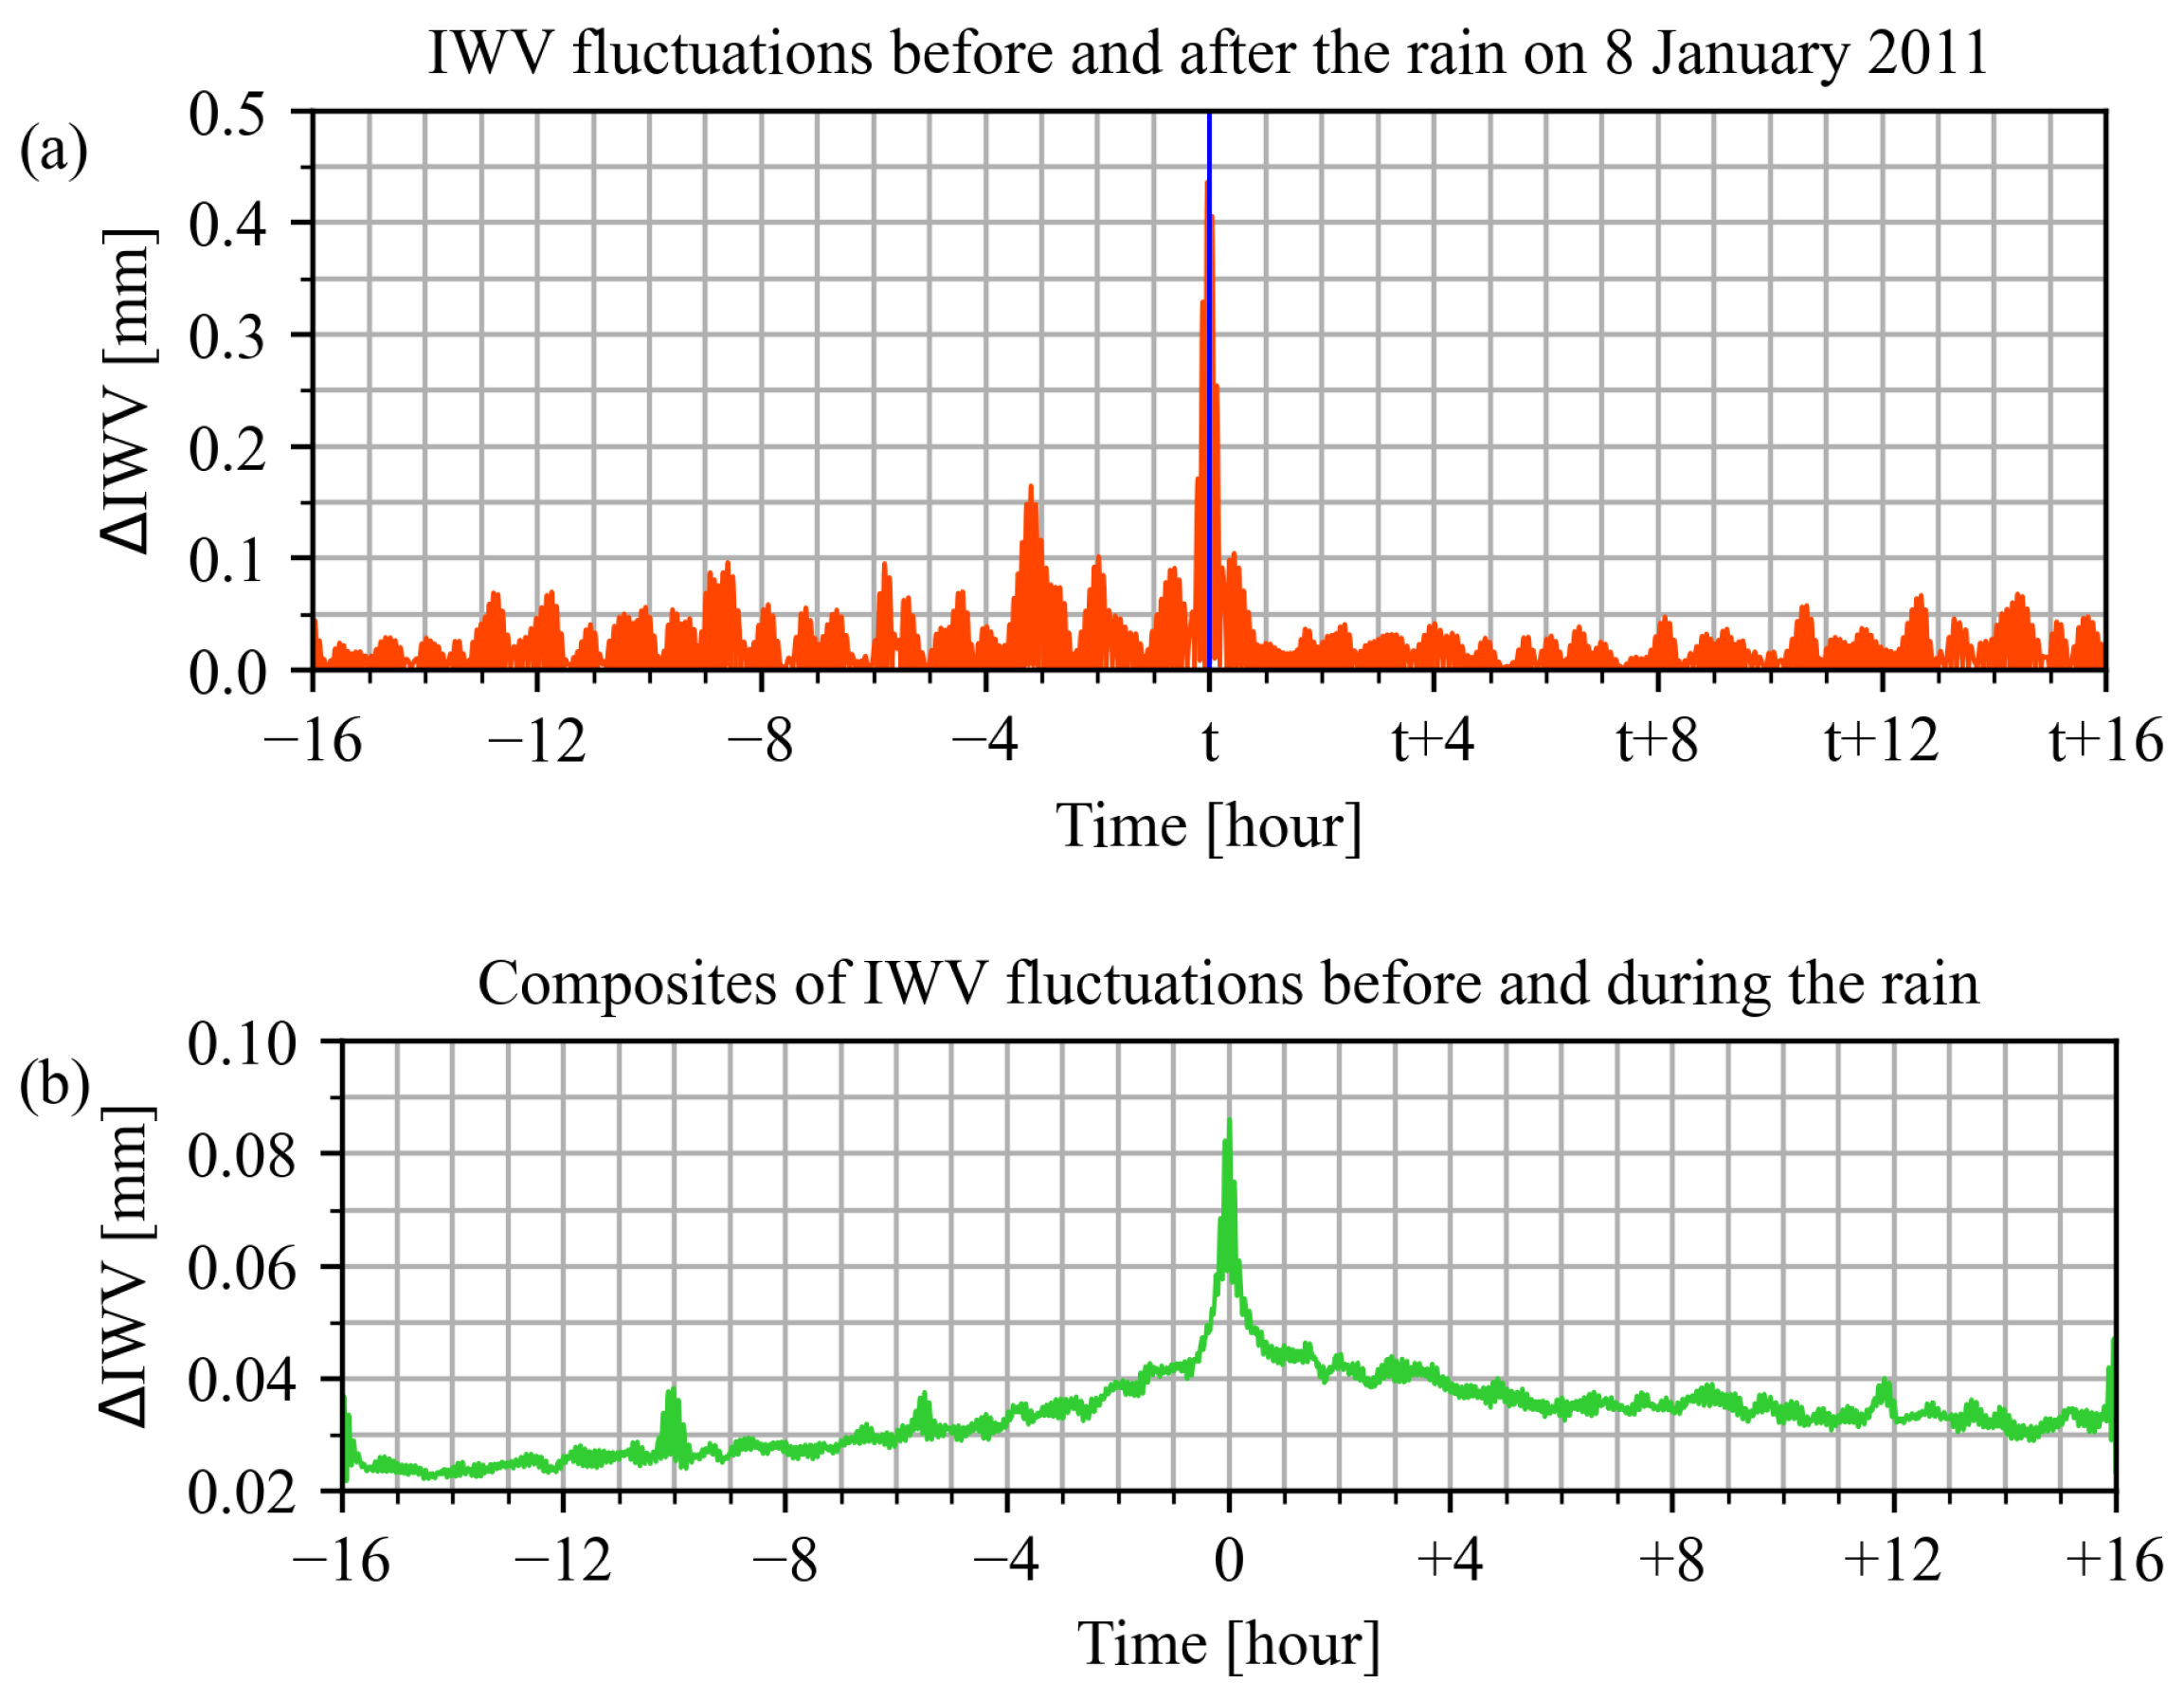
Fluctuations in the IWV field are closely related to the approaching frontal rainfall [54]. Figure 4a shows an individual example for the magnitude of the 10 min IWV fluctuations. To compare the difference before and after rain, the time is unified as 16 h. This rain event happened in Bern from 02:11 UT to 07:05 UT on 8 January 2011, and it is marked by the vertical blue line. The time series was obtained with a 10 min bandpass filter, and the amplitude (or magnitude) was computed as a function of time [50]. It is evident that the IWV fluctuation before rain is stronger than after rain. The maximum fluctuation is 2 to 4 h before rain and reaches a peak of 0.15 mm. During the 4 to 13 h before rain, the fluctuation remains at 0.05 to 0.1 mm. During the 13 to 16 h before rain and the 1 to 14 h after rain, it is relatively stable, with a mean value of about 0.025 mm. Figure 4b shows the composite of the IWV fluctuation amplitude 16 h before and during rain. IWV fluctuates the most around the time when rain starts, up to 0.085 mm. Ten hours before rain, the fluctuation increases from about 0.025 mm to 0.04 mm.
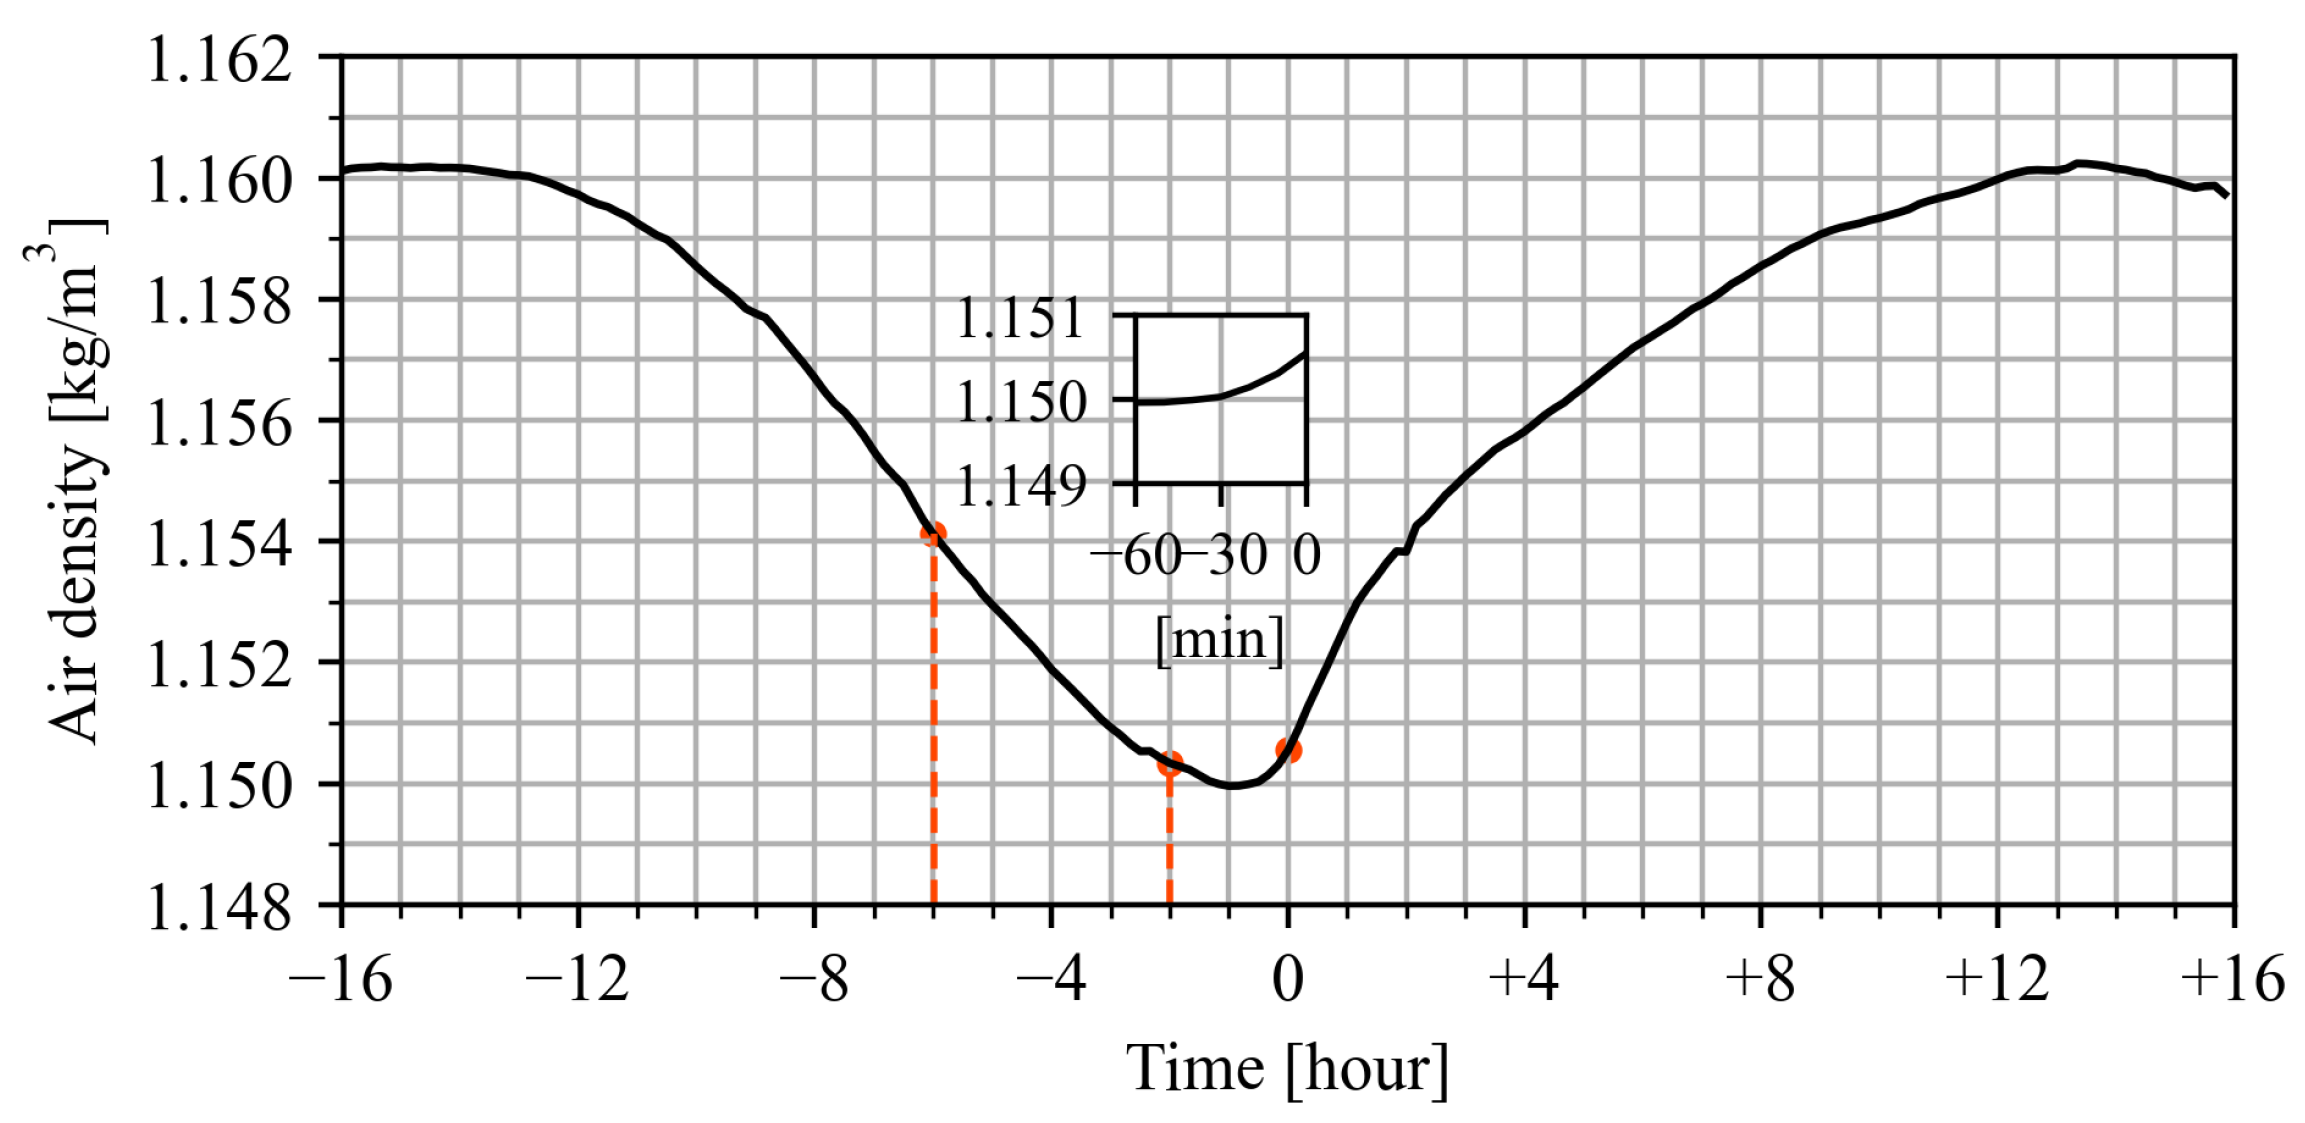
Figure 5 shows the composite of air density 16 h before and during rain. The air density also reaches its minimum during the 30 to 60 min before rain. Calculating the slope in a time window is used to analyze the time derivative of the air density before rain. It was found that in about 60% of 784 rain events (), the air density decreases 2 to 6 h before rain from 1.15412 to 1.15034 . This decrease in air density may be due to two reasons: first, extratropical cyclones cause changes in air density. Before the cold front rain passes through Bern, there is a warm front rain. Because the cold front moves faster than the warm front, the cold air mass behind the cold front moves over time into the area occupied by the warm air mass behind the warm front. The warm air has a lower density, and the cold and cool air has a higher density. The warm air mass ahead reduces the air density, and then the cold air mass replaces the warm air mass to increase the air density. Second, the density of moist air is lower than that of dry air, as was first proposed by Newton [55]. The molecular weight of water molecules is 18, which is lighter than both nitrogen and oxygen. Water vapor, instead of nitrogen and oxygen, will reduce the mass of air per cubic meter and reduce air density [56]. Before rain starts, water vapor is abundant and the air density decreases accordingly. We have the impression that air density is the best precursor because it changes earlier than the other parameters before the rain onset.
Figure 6 shows an example of a rain event that started at 03:14:03 UT on 2 January 2016. There is no rainfall within 8 h before the rain starts. The ILW increases rapidly, and the precipitation measured by rain gauge indicates the onset of rain when the ILW exceeds 0.4 mm in Figure 6a. As shown in Figure 6, before the onset of light rain, the IWV and temperature increase, while the pressure, relative humidity, and air density decrease. When the moderate rain starts, all these atmosphere parameters reach their extreme point. The changes in the atmosphere parameters exhibited by this example are consistent with the results of this study.
3.3. ILW Threshold and Diurnal Variations
Since the IWV and ILW retrieved by TROWARA coincide in space and time, the ILW threshold is undoubtedly a good choice for identifying whether there is rain [19]. Furthermore, the physical retrieval algorithm used in this study estimates rainfall from below the melting layer, avoiding the detection of rain events that are raindrops in clouds [16]. Figure 7a shows the time series of IWV, ILW, and the rain gauge precipitation for an interesting time interval of different weather situations in January 2016. The ILW is at a high value when the rain gauge detects rain. The reason is that convergence and condensation of water vapor cause the droplet size (diameter) to increase rapidly to above 0.3 mm, resulting in a very strong rise in the ILW value. The ILW threshold is usually between 0.1 and 0.6 mm, but even an inaccurate threshold is sufficient to identify the rain period as shown in Figure 7a. Mätzler [57] found that the ILW values of non-rain clouds do not exceed 0.4 mm. Raindrops are likely to appear when the ILW value exceeds 0.4 mm [43,49], so TROWARA uses ILW = 0.4 mm as the threshold of rainfall in the present study. This threshold was also selected by Cossu et al. [15] for summer 2012. They analyzed that non-precipitating clouds are typically associated with ILW values between 0.01 and 0.4 mm. According to Cossu et al. [15], clear sky occurs if ILW is smaller than 0.01 mm, and rain occurs if ILW is greater equal 0.4 mm. Furthermore, there is a certain difference between the ILW threshold and the rain gauge in determining the start and end time of a rain event. For example, for a rain event from 8–9 January in Figure 7a, the rainfall start time to end time recorded by TROWARA and rain gauge are 10:22:35 UT on 8 January to 13:51:18 UT on 9 January and 12:20:00 UT on 8 January to 11:10:00 UT on 9 January, respectively. This time difference between TROWARA and the rain gauge might be due to the higher sensitivity of TROWARA for light rain or due to spatial variations of the rain area since the sounding volume of TROWARA is not at the place of the rain gauge (horizontal distance is about 100–500 m). TROWARA detects rain occasionally, but the rain gauge does not, such as on 24 January. It may be because of the virga that the rain evaporates or sublimates before it reaches the ground. There are also cases where only the rain gauge shows rain.
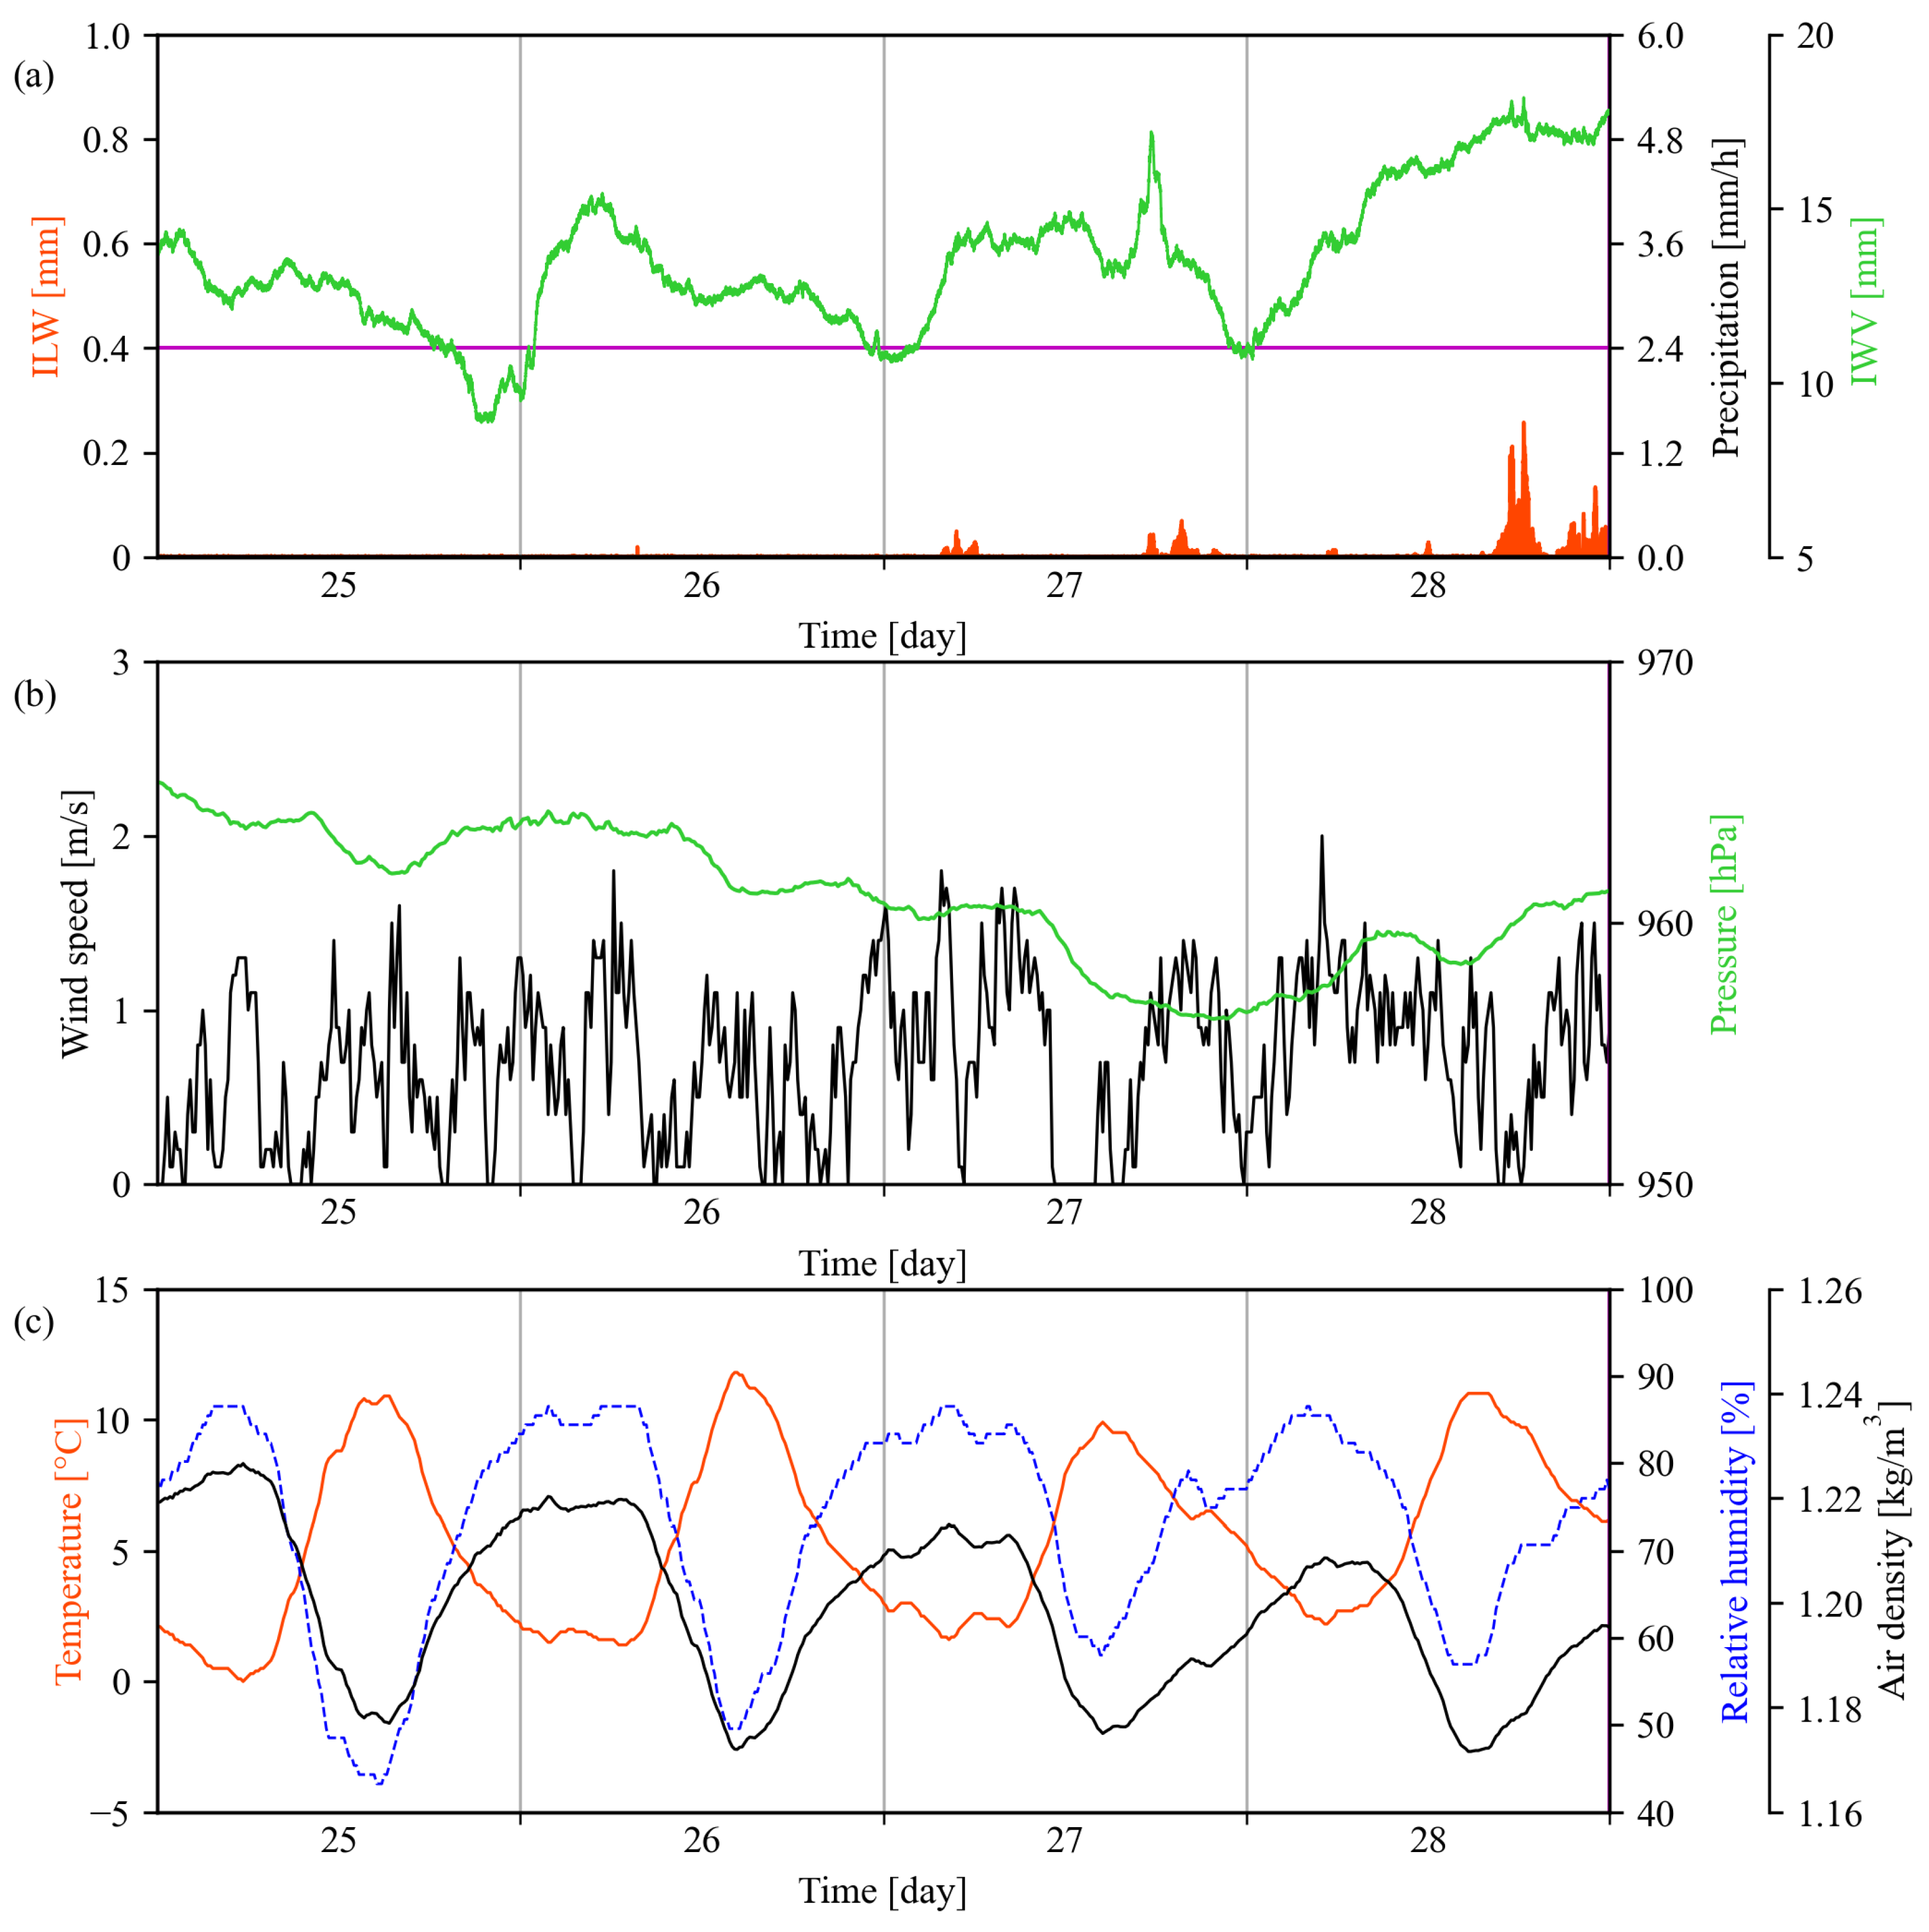
Diurnal variations of atmospheric parameters do not cause the main effect and domination during the rain period. Figure 8a shows the diurnal variation of IWV during the long clear sky period from 25–28 January. Hocke et al. [58] described that the diurnal cycle of IWV over Bern ranges from 0.5 mm below the daily average in the morning to 0.5 mm above the daily average in the evening. Because this change is less than 5%, it can be assumed that the diurnal cycle of IWV has no direct effect on its changes during the rain period. For example, there are two light rain events lasting 1 to 2 min at 22:58:01 UT on 2 January and at 5:07:11 UT on 3 January, and a rain event lasting three days from 5:20:07 UT on 10 January to 22:55:19 UT on 12 January. During these rain events, the changes in IWV are consistent with the description in the previous subsection. As shown in Figure 8b,c, the wind speed and pressure have no obvious diurnal cycle during the clear sky period (with ILW = 0 mm), but temperature, relative humidity, and air density do. The temperature is highest around 14 UT, while the relative humidity and air density are lowest. The strong diurnal cycle of temperature during the clear sky period might be due to the absence of cloud droplets and to the diurnal variation of the greenhouse gas water vapor. Because only 22.6% of all 1199 rain events in this study occur in the afternoon from 14 to 17 UT, it can be assumed that the diurnal cycle of these parameters has no strong effect on them as precursors of rainfall.
4. Discussion
Using only rainfall precursors obtained by a single parameter will limit the accuracy of rainfall prediction. The performance of rainfall prediction is typically evaluated with a true detection rate and a false alarm rate [29,59]. The true detection rate is the proportion of rain events detected during rain, and the false alarm rate is the proportion of rain events detected during no rain. For example, counting all 1199 rain events yields the result that the air density was significantly reduced in 60% of the cases 2 to 6 h before rain. This is the true detection rate using air density for predicting rainfall. However, because of the diurnal cycle of air density during the clear sky period or other weather, false alarms are inevitable. Therefore, considering all parameters provided by the weather station and the radiometer would lead to a higher potential for high-precision rainfall nowcasting. This is important for various meteorological and hydrological applications. During no rain, the surface temperature, relative humidity, and air density provided by the weather station have the diurnal cycle, whereas the surface pressure and wind speed have no diurnal cycle. If these weather station parameters are used together for rainfall nowcasting, the diurnal cycle problem may be avoided. IWV and ILW are directly related to rainfall processes. If these microwave radiometer parameters are added for rainfall nowcasting, the influence of other weather may be excluded.
To the best of our knowledge, no studies in the literature have performed joint analysis of IWV and other meteorological observations in the Swiss Plateau similar to our study, which can achieve improvements to current nowcasting systems [25]. Manandhar et al. [60] proposed a simple algorithm for nowcasting of rainfall by using the composite analysis of observed changes in GNSS-IWV and its second derivative in the tropical region. The true detection rate is 87.7%, and the false alarm rate is 38.6%. However, the formation of rainfall in the tropics is simpler. It often rains in the afternoon after water vapor convection due to the sun exposure. In addition, their study only can predict rainfall events 5 min into the future. Manandhar et al. [59] applied GNSS-IWV and meteorological parameters to a data-driven method for the rainfall prediction. The false alarm rate is significantly reduced (20.3%), but they only identified characteristics of several atmospheric parameters (temperature, relative humidity, dew point, and solar radiation). For complex atmospheric states, the detailed studies of multiple atmospheric parameters inevitably enhance the predictability of rainfall [61].
5. Conclusions
The ground-based microwave radiometer TROWARA, given its high temporal resolution, is very sensitive to rain intervals. Combined with data from a weather station, we were able to derive the mean temporal evolution of eight atmospheric parameters before, during, and after rainfall from 2011 to 2020 over the Swiss Plateau. This study helps to further understand the atmospheric effects of rainfall and to achieve progress in the nowcasting of rainfall by means of a microwave radiometer and a weather station. Our study quantitatively describes the average behavior of 1199 rain events in the changes of integrated water vapor (IWV), integrated liquid water (ILW), rain rate, infrared brightness temperature (T), temperature, pressure, relative humidity, wind speed, and air density. These parameters show noticeable variation under the influence of rainfall. For example, at the onset of the rain, IWV reaches a peak, and ILW rises rapidly in a short time. IWV at the end of rain is lower than at the beginning. Interestingly, IWV, T, and wind speed show a sharp increase of around 3.6 mm, 25 K, and 0.27 m/s before rain. Temperature, pressure, relative humidity, and air density reach their extrema 30 to 60 min before rain. The IWV fluctuation amplitude increases slightly before rain. Air density decreases 2 to 6 h before the onset of rain. The air density seems to be the best precursor for the prediction of rainfall. We obtained a true detection rate of 60% for the nowcasting of rainfall 2 to 6 h in advance by using our time series of air density.
Further improvement of the nowcasting of rainfall might be possible if we consider a combination of different atmospheric parameters as precursors. Consideration of the influence of the seasons on rainfall might be also helpful, such as convection in summer. In terms of application, the results of this study can be used as an input factor for model training, which is of great help in building a rainfall nowcasting model with high accuracy and applicability. They can also be ingested into an expert system to provide forecasters with better forecasts.
Author Contributions
Conceptualization, W.W. and K.H.; methodology, W.W. and K.H.; software, W.W.; validation, W.W.; data curation, W.W. and K.H.; writing—original draft preparation, W.W.; writing—review and editing, W.W. and K.H.; supervision, K.H.; project administration, K.H. All authors have read and agreed to the published version of the manuscript.
Funding
The study was mainly funded by a fellowship of the China Scholarship Council (CSC) for W.W. The APC and a part of the salary of W.W. was funded by the Global Climate Observing System (GCOS Switzerland) project “Operational Monitoring of the Rain Rate by Ground-based Microwave Radiometry in Switzerland”.
Data Availability Statement
TROWARA-derived high-resolution IWV, ILW, and rain rate data are available upon request. Data of the ExWi weather station are provided by the STARTWAVE database (https://startwave.mw.iap.unibe.ch/, accessed on 15 March 2022).
Acknowledgments
We thank all the engineers and scientists at the Institute of Applied Physics (IAP) at the University of Bern for the design, construction, and operation of TROWARA.
Conflicts of Interest
The authors declare no conflict of interest.
References
- Rössler, O.; Froidevaux, P.; Börst, U.; Rickli, R.; Martius, O.; Weingartner, R. Retrospective analysis of a nonforecasted rain-on-snow flood in the Alps—A matter of model limitations or unpredictable nature? Hydrol. Earth Syst. Sci. 2014, 18, 2265–2285. [Google Scholar] [CrossRef] [Green Version]
- Barton, Y.; Giannakaki, P.; Von Waldow, H.; Chevalier, C.; Pfahl, S.; Martius, O. Clustering of regional-scale extreme precipitation events in southern Switzerland. Mon. Weather Rev. 2016, 144, 347–369. [Google Scholar] [CrossRef] [Green Version]
- Beniston, M.; Stoffel, M. Rain-on-snow events, floods and climate change in the Alps: Events may increase with warming up to 4 °C and decrease thereafter. Sci. Total Environ. 2016, 571, 228–236. [Google Scholar] [CrossRef] [PubMed]
- Schmocker-Fackel, P.; Naef, F. More frequent flooding? Changes in flood frequency in Switzerland since 1850. J. Hydrol. 2010, 381, 1–8. [Google Scholar] [CrossRef]
- Speirs, P.; Gabella, M.; Berne, A. A comparison between the GPM dual-frequency precipitation radar and ground-based radar precipitation rate estimates in the Swiss Alps and Plateau. J. Hydrometeorol. 2017, 18, 1247–1269. [Google Scholar] [CrossRef]
- Ragettli, S.; Tong, X.; Zhang, G.; Wang, H.; Zhang, P.; Stähli, M. Climate change impacts on summer flood frequencies in two mountainous catchments in China and Switzerland. Hydrol. Res. 2021, 52, 4–25. [Google Scholar] [CrossRef] [Green Version]
- Kreienkamp, F.; Philip, S.Y.; Tradowsky, J.S.; Kew, S.F.; Lorenz, P.; Arrighi, J.; Belleflamme, A.; Bettmann, T.; Caluwaerts, S.; Chan, S.C.; et al. Rapid Attribution of Heavy Rainfall Events Leading to the Severe Flooding in Western Europe during July 2021. 2021. Available online: https://biblio.ugent.be/publication/8732135 (accessed on 15 March 2022).
- Sun, J.; Xue, M.; Wilson, J.W.; Zawadzki, I.; Ballard, S.P.; Onvlee-Hooimeyer, J.; Joe, P.; Barker, D.M.; Li, P.W.; Golding, B.; et al. Use of NWP for nowcasting convective precipitation: Recent progress and challenges. Bull. Am. Meteorol. Soc. 2014, 95, 409–426. [Google Scholar] [CrossRef] [Green Version]
- Marzano, F.S.; Fionda, E.; Ciotti, P. Neural-network approach to ground-based passive microwave estimation of precipitation intensity and extinction. J. Hydrol. 2006, 328, 121–131. [Google Scholar] [CrossRef]
- Chakraborty, R.; Das, S.; Jana, S.; Maitra, A. Nowcasting of rain events using multi-frequency radiometric observations. J. Hydrol. 2014, 513, 467–474. [Google Scholar] [CrossRef]
- Wei, J.; Shi, Y.; Ren, Y.; Li, Q.; Qiao, Z.; Cao, J.; Ayantobo, O.O.; Yin, J.; Wang, G. Application of ground-based microwave radiometer in retrieving meteorological characteristics of Tibet Plateau. Remote Sens. 2021, 13, 2527. [Google Scholar] [CrossRef]
- Xu, G.; Zhang, W.; Feng, G.; Liao, K.; Liu, Y. Effect of off-zenith observations on reducing the impact of precipitation on ground-based microwave radiometer measurement accuracy. Atmos. Res. 2014, 140, 85–94. [Google Scholar] [CrossRef]
- Chan, P.W. Performance and application of a multi-wavelength, ground-based microwave radiometer in intense convective weather. Meteorol. Z. 2009, 18, 253–265. [Google Scholar] [CrossRef]
- Bernet, L.; Brockmann, E.; von Clarmann, T.; Kämpfer, N.; Mahieu, E.; Mätzler, C.; Stober, G.; Hocke, K. Trends of atmospheric water vapor in Switzerland from ground-based radiometry, FTIR and GNSS data. Atmos. Chem. Phys. 2020, 20, 11223–11244. [Google Scholar] [CrossRef]
- Cossu, F.; Hocke, K.; Martynov, A.; Martius, O.; Mätzler, C. Atmospheric water parameters measured by a ground-based microwave radiometer and compared with the WRF model. Atmos. Sci. Lett. 2015, 16, 465–472. [Google Scholar] [CrossRef] [Green Version]
- Wang, W.; Hocke, K.; Mätzler, C. Physical retrieval of rain rate from ground-based microwave radiometry. Remote Sens. 2021, 13, 2217. [Google Scholar] [CrossRef]
- Sherwood, S.C. Convective precursors and predictability in the tropical western Pacific. Mon. Weather Rev. 1999, 127, 2977–2991. [Google Scholar] [CrossRef]
- Hocke, K.; Navas-Guzmán, F.; Moreira, L.; Bernet, L.; Mätzler, C. Oscillations in atmospheric water above Switzerland. Atmos. Chem. Phys. 2017, 17, 12121–12131. [Google Scholar] [CrossRef] [Green Version]
- Hocke, K.; Bernet, L.; Wang, W.; Mätzler, C.; Hervo, M.; Haefele, A. Integrated water vapor during rain and rain-free conditions above the Swiss Plateau. Climate 2021, 9, 105. [Google Scholar] [CrossRef]
- Knupp, K.; Coleman, T.; Phillips, D.; Ware, R.; Cimini, D.; Vandenberghe, F.; Vivekanandan, J.; Westwater, E.; Coleman, T.; Phillips, D. Ground-based passive microwave profiling during dynamic weather conditions. J. Atmos. Ocean. Techol. 2009, 26, 1057–1073. [Google Scholar] [CrossRef]
- Piaget, N.; Froidevaux, P.; Giannakaki, P.; Gierth, F.; Martius, O.; Riemer, M.; Wolf, G.; Grams, C.M. Dynamics of a local Alpine flooding event in October 2011: Moisture source and large-scale circulation. Q. J. R. Meteorol. Soc. 2015, 141, 1922–1937. [Google Scholar] [CrossRef] [Green Version]
- Van Baelen, J.; Reverdy, M.; Tridon, F.; Labbouz, L.; Dick, G.; Bender, M.; Hagen, M. On the relationship between water vapor field evolution and the life cycle of precipitation systems. Q. J. R. Meteorol. Soc. 2011, 137, 204–223. [Google Scholar] [CrossRef] [Green Version]
- Adams, D.K.; Fernandes, R.M.; Kursinski, E.R.; Maia, J.M.; Sapucci, L.F.; Machado, L.A.; Vitorello, I.; Monico, J.F.G.; Holub, K.L.; Gutman, S.I.; et al. A dense GNSS meteorological network for observing deep convection in the Amazon. Atmos. Sci. Lett. 2011, 12, 207–212. [Google Scholar] [CrossRef] [Green Version]
- Muller, C.J.; Back, L.E.; O’Gorman, P.A.; Emanuel, K.A. A model for the relationship between tropical precipitation and column water vapor. Geophys. Res. Lett. 2009, 36, L16804. [Google Scholar] [CrossRef]
- Benevides, P.; Catalao, J.; Miranda, P. On the inclusion of GPS precipitable water vapor in the nowcasting of rainfall. Nat. Hazard. Earth Sys. 2015, 15, 2605–2616. [Google Scholar] [CrossRef] [Green Version]
- Madonna, E.; Wernli, H.; Joos, H.; Martius, O. Warm conveyor belts in the ERA-Interim dataset (1979–2010). Part I: Climatology and potential vorticity evolution. J. Clim. 2014, 27, 3–26. [Google Scholar] [CrossRef] [Green Version]
- Pfahl, S.; Madonna, E.; Boettcher, M.; Joos, H.; Wernli, H. Warm conveyor belts in the ERA-Interim dataset (1979–2010). Part II: Moisture origin and relevance for precipitation. J. Clim. 2014, 27, 27–40. [Google Scholar] [CrossRef]
- Adams, D.K.; Gutman, S.I.; Holub, K.L.; Pereira, D.S. GNSS observations of deep convective time scales in the Amazon. Geophys. Res. Lett. 2013, 40, 2818–2823. [Google Scholar] [CrossRef]
- Zhang, W.; Xu, G.; Xi, B.; Ren, J.; Wan, X.; Zhou, L.; Cui, C.; Wu, D. Comparative study of cloud liquid water and rain liquid water obtained from microwave radiometer and micro rain radar observations over central China during the monsoon. J. Geophys. Res. Atmos. 2020, 125, e2020JD032456. [Google Scholar] [CrossRef]
- Sapucci, L.F.; Machado, L.A.; de Souza, E.M.; Campos, T.B. Global Positioning System precipitable water vapor (GPS-PWV) jumps before intense rain events: A potential application to nowcasting. Meteorol. Appl. 2019, 26, 49–63. [Google Scholar] [CrossRef] [Green Version]
- Allan, R.P.; Blenkinsop, S.; Fowler, H.J.; Champion, A.J. Atmospheric precursors for intense summer rainfall over the United Kingdom. Int. J. Climatol. 2020, 40, 3849–3867. [Google Scholar] [CrossRef]
- Madhulatha, A.; Rajeevan, M.; Venkat Ratnam, M.; Bhate, J.; Naidu, C. Nowcasting severe convective activity over southeast India using ground-based microwave radiometer observations. J. Geophys. Res. Atmos. 2013, 118, 1–13. [Google Scholar] [CrossRef] [Green Version]
- Rao, M.P.; Cook, E.R.; Cook, B.I.; Anchukaitis, K.J.; D’Arrigo, R.D.; Krusic, P.J.; LeGrande, A.N. A double bootstrap approach to Superposed Epoch Analysis to evaluate response uncertainty. Dendrochronologia 2019, 55, 119–124. [Google Scholar] [CrossRef]
- Wan, T.; Wu, S.W. Aerodynamic analysis under influence of heavy rain. J. Aeronaut. Astronaut. Aviat. 2004, 41, 173–180. [Google Scholar]
- Niu, S.; Jia, X.; Sang, J.; Liu, X.; Lu, C.; Liu, Y. Distributions of raindrop sizes and fall velocities in a semiarid plateau climate: Convective versus stratiform rains. J. Appl. Meteorol. Clim. 2010, 49, 632–645. [Google Scholar] [CrossRef]
- Nakakita, E.; Ikebuchi, S.; Nakamura, T.; Kanmuri, M.; Okuda, M.; Yamaji, A.; Takasao, T. Short-term rainfall prediction method using a volume scanning radar and grid point value data from numerical weather prediction. J. Geophys. Res. Atmos. 1996, 101, 26181–26197. [Google Scholar] [CrossRef]
- Sugimoto, S.; Nakakita, E.; Ikebuchi, S. A stochastic approach to short-term rainfall prediction using a physically based conceptual rainfall model. J. Hydrol. 2001, 242, 137–155. [Google Scholar] [CrossRef]
- French, M.N.; Krajewski, W.F. A model for real-time quantitative rainfall forecasting using remote sensing: 1. Formulation. Water Resour. Res. 1994, 30, 1075–1083. [Google Scholar] [CrossRef]
- Ji, S.Y.; Sharma, S.; Yu, B.; Jeong, D.H. Designing a rule-based hourly rainfall prediction model. In Proceedings of the 2012 IEEE 13th International Conference on Information Reuse and Integration (IRI), Las Vegas, NV, USA, 8–10 August 2012; pp. 303–308. [Google Scholar]
- Mass, C. Nowcasting: The promise of new technologies of communication, modeling, and observation. Bull. Am. Meteorol. Soc. 2012, 93, 797–809. [Google Scholar] [CrossRef] [Green Version]
- MeteoSwiss. Climate Normals Bern/Zollikofen (Reference Period. 1981–2010); Federal Office of Meteorology and Climatology MeteoSwiss: Zurich, Switzerland, 2014; Available online: https://www.meteoswiss.admin.ch/home/climate/swiss-climate-in-detail/climate-normals/climate-diagrams-and-normals–per-station.html?station=ber (accessed on 15 March 2022).
- Brandsma, T.; Buishand, T.A. Statistical linkage of daily precipitation in Switzerland to atmospheric circulation and temperature. J. Hydrol. 1997, 198, 98–123. [Google Scholar] [CrossRef]
- Mätzler, C.; Morland, J. Refined physical retrieval of integrated water vapor and cloud liquid for microwave radiometer data. IEEE Trans. Geosci. Remote Sens. 2009, 47, 1585–1594. [Google Scholar] [CrossRef]
- Ellison, W. Dielectric properties of natural media. In Thermal Microwave Radiation: Applications for Remote Sensing; Mätzler, C., Ed.; IET Electromagnetic Waves Series: London, UK, 2006; Volume 52, pp. 431–454. Available online: https://scholar.google.com/scholar?cluster=13553953111540458320&hl=en&as_sdt=0,5 (accessed on 16 June 2022).
- McIlveen, R. Fundamentals of Weather and Climate; Oxford University Press: New York, NY, USA, 2010. [Google Scholar]
- Wexler, A. Vapor pressure formulation for water in range 0 to 100 C. A revision. J. Res. Natl. Bur. Stand. A Phys. Chem. 1976, 80, 775. [Google Scholar] [CrossRef] [PubMed]
- Zheng, Z.; Xu, G.; Li, Q.; Chen, C.; Li, J. Effect of precipitation on reducing atmospheric pollutant over Beijing. Atmos. Pollut. Res. 2019, 10, 1443–1453. [Google Scholar] [CrossRef]
- Haurwitz, M.W.; Brier, G.W. A critique of the superposed epoch analysis method: Its application to solar–weather relations. Mon. Weather Rev. 1981, 109, 2074–2079. [Google Scholar] [CrossRef] [Green Version]
- Löhnert, U.; Crewell, S. Accuracy of cloud liquid water path from ground-based microwave radiometry 1. Dependency on cloud model statistics. Radio Sci. 2003, 38, 8041. [Google Scholar] [CrossRef] [Green Version]
- Studer, S.; Hocke, K.; Kämpfer, N. Intraseasonal oscillations of stratospheric ozone above Switzerland. J. Atmos. Sol. Terr. Phy. 2012, 74, 189–198. [Google Scholar] [CrossRef]
- Koffi, E.N.; Graham, C.E.; Mätzler, C. The water vapor flux above Switzerland and its role in the August 2005 extreme precipitation and flooding. Meteorol. Z. 2013, 22, 329–342. [Google Scholar] [CrossRef]
- Graham, E.; Koffi, E.N.; Mätzler, C. An observational study of air and water vapor convergence over the Bernese Alps, Switzerland, during summertime and the development of isolated thunderstorms. Meteorol. Z. 2012, 21, 561–574. [Google Scholar] [CrossRef]
- Wang, J.; Dai, A.; Carlson, D.J.; Ware, R.H.; Liljegren, J.C. Diurnal Variation in Water Vapor and Liquid Water Profiles from a New Microwave Radiometer Profiler; No. ANL/ER/CP-105344; Argonne National Lab.: Argonne, IL, USA, 2001. Available online: https://publications.anl.gov/anlpubs/2001/10/40826.pdf (accessed on 16 June 2022).
- Priego, E.; Jones, J.; Porres, M.; Seco, A. Monitoring water vapor with GNSS during a heavy rainfall event in the Spanish Mediterranean area. Geomat. Nat. Hazards Risk 2017, 8, 282–294. [Google Scholar] [CrossRef]
- Newton, I. Opticks, or, a Treatise of the Reflections, Refractions, Inflections and Colours of Light; Courier Corporation: Gloucester, MA, USA, 1952. [Google Scholar]
- Avogadro, A. Essay on a manner of determining the relative masses of the elementary molecules of bodies, and the proportions in which they enter into these compounds. J. Phys. (Paris) 1811, 73, 58–76. [Google Scholar]
- Mätzler, C. Ground-based observations of atmospheric radiation at 5, 10, 21, 35, and 94 GHz. Radio Sci. 1992, 27, 403–415. [Google Scholar] [CrossRef]
- Hocke, K.; Bernet, L.; Hagen, J.; Murk, A.; Renker, M.; Mätzler, C. Diurnal cycle of short-term fluctuations of integrated water vapour above Switzerland. Atmos. Chem. Phys. 2019, 19, 12083–12090. [Google Scholar] [CrossRef] [Green Version]
- Manandhar, S.; Dev, S.; Lee, Y.H.; Meng, Y.S.; Winkler, S. A data-driven approach for accurate rainfall prediction. IEEE Trans. Geosci. Remote Sens. 2019, 57, 9323–9331. [Google Scholar] [CrossRef] [Green Version]
- Manandhar, S.; Lee, Y.H.; Meng, Y.S.; Yuan, F.; Ong, J.T. GPS-derived PWV for rainfall nowcasting in tropical region. IEEE Trans. Geosci. Remote Sens. 2018, 56, 4835–4844. [Google Scholar] [CrossRef]
- Kim, D.K.; Suezawa, T.; Mega, T.; Kikuchi, H.; Yoshikawa, E.; Baron, P.; Ushio, T. Improving precipitation nowcasting using a three-dimensional convolutional neural network model from multi parameter phased array weather radar observations. Atmos. Res. 2021, 262, 105774. [Google Scholar] [CrossRef]
Figure 1.
Composites of (a) integrated water vapor (IWV, green solid line) and (b) integrated liquid water (ILW, green dashed line) 8 h before and 16 h after rain, (c) the IWV composites in summer (N = 345) and winter (N = 273), as well as (d) the IWV composites for long (N = 428)- and short (N = 497)-duration rain events. The subplot is from 5 min before rain to 5 min after rain. IWV and ILW acquired by the TROpospheric WAter RAdiometer (TROWARA) in Bern. The shaded area shows the standard deviation of the mean (error of the mean ). Time t is the duration of rainfall. Short horizontal lines mark the beginning and end of rainfall.

Figure 2.
Composites of (a) IWV (green solid line), T (red solid line), rain rate (blue area) 8 h before and 16 h during rain, considering the rain events (b) in summer and winter, as well as (c) with long and short duration.
Figure 2.
Composites of (a) IWV (green solid line), T (red solid line), rain rate (blue area) 8 h before and 16 h during rain, considering the rain events (b) in summer and winter, as well as (c) with long and short duration.

Figure 3.
Composites of (a) temperature (red solid line), pressure (green solid line), relative humidity (blue solid line), and wind speed (black solid line) 8 h before and 16 h during rain, considering the rain events (b) in summer and winter, as well as (c) with long and short duration. Subplot (a) is from 60 min before rain to the onset of rain.

Figure 4.
(a) IWV fluctuation series 16 h before and after a rain event between 02:11 UT and 07:05 UT on 8 January 2011 (red). The blue vertical line represent the occurrence/duration time of rain. (b) Composite of IWV fluctuation series of 759 rain events 16 h before and during rain (green).
Figure 4.
(a) IWV fluctuation series 16 h before and after a rain event between 02:11 UT and 07:05 UT on 8 January 2011 (red). The blue vertical line represent the occurrence/duration time of rain. (b) Composite of IWV fluctuation series of 759 rain events 16 h before and during rain (green).

Figure 5.
Composite of air density 16 h before and during rain. Red dots represent the 6 h, 2 h before rain, and the onset of the rain. The subplot is from 60 min before rain to the onset of rain. A total of 784 rain events is shown.
Figure 5.
Composite of air density 16 h before and during rain. Red dots represent the 6 h, 2 h before rain, and the onset of the rain. The subplot is from 60 min before rain to the onset of rain. A total of 784 rain events is shown.

Figure 6.
Time series of TROWARA and meteorological data from 1 January at 12:00 UT to 2 January at 24:00 UT, 2016. (a) Time series of IWV (green solid line) and ILW (red area) provided by TROWARA, and the precipitation (black area) observed by the rain gauge at the ExWi weather station. The two purple vertical lines represent the onset of light rain and moderate rain, respectively. The purple horizontal line is ILW = 0.4 mm. (b) Time series of surface pressure (green solid line) and wind speed (black solid line) observed by the ExWi weather station. (c) Time series of surface temperature (red solid line) and relative humidity (blue dashed line) observed by the ExWi weather station, as well as air density (black solid line).

Figure 7.
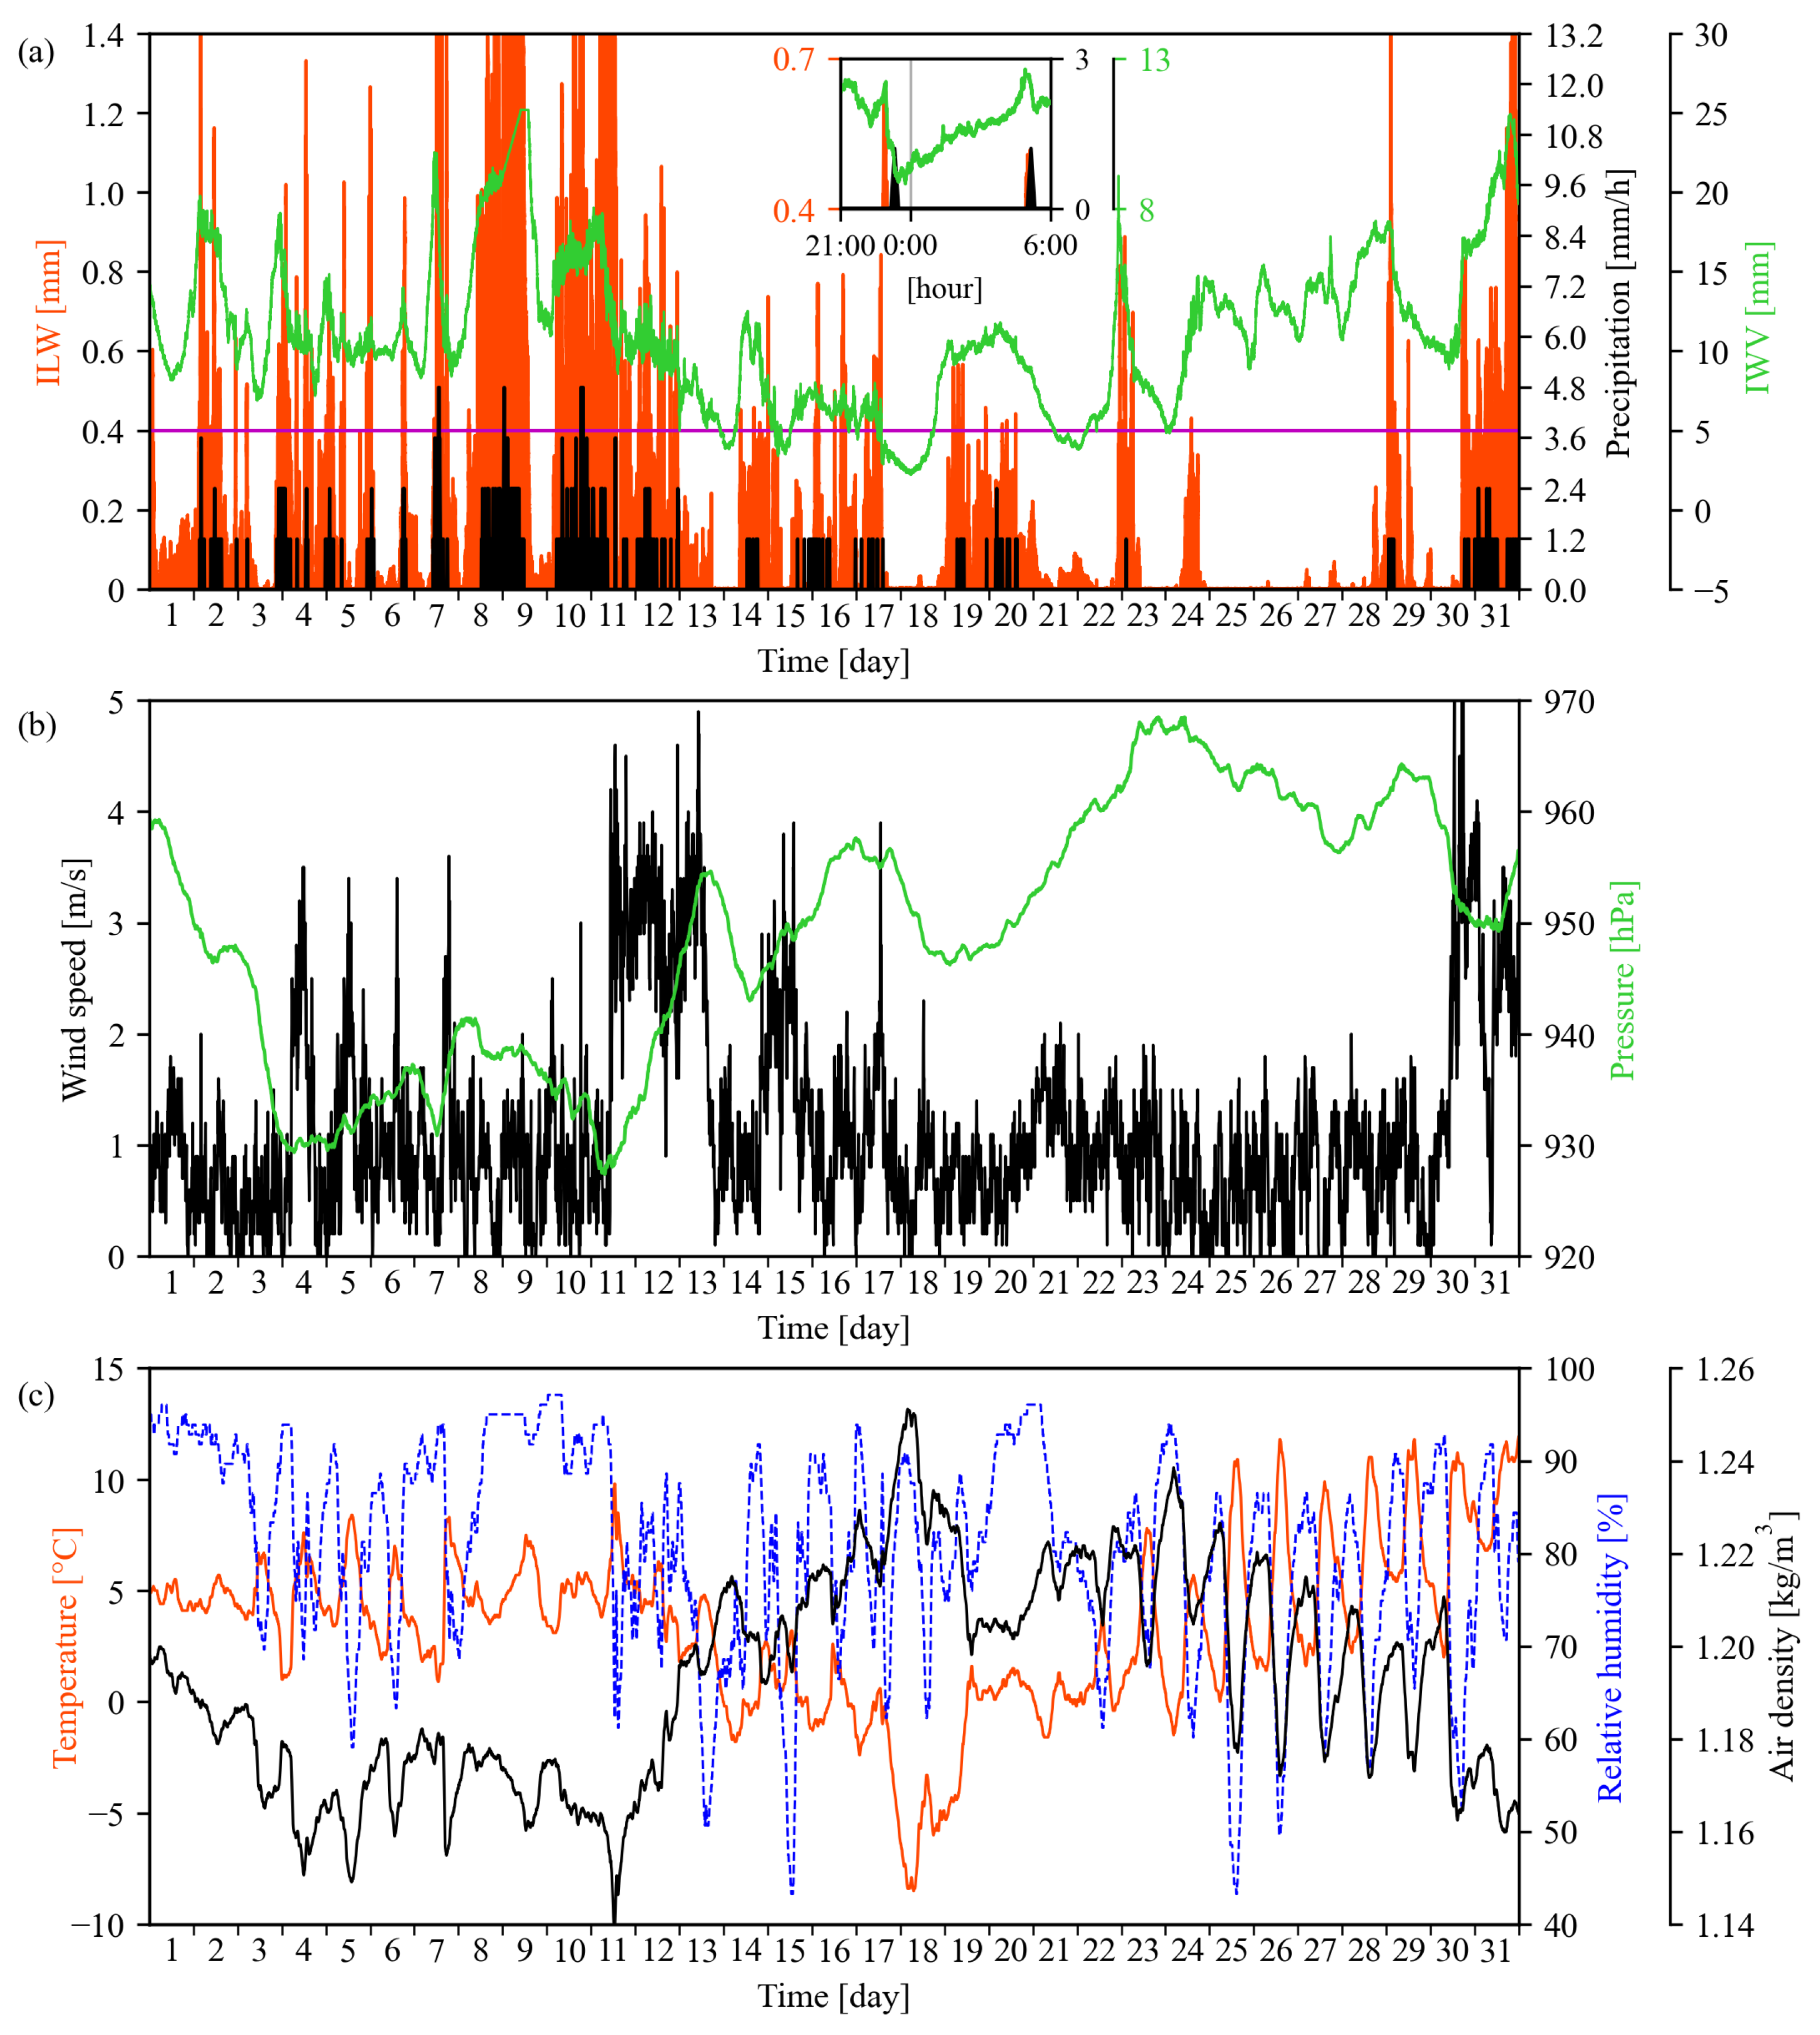
Time series of TROWARA and meteorological data from 1–31 January 2016. (a) Time series of IWV (green solid line), ILW (red area), and the precipitation (black area). The purple horizontal line is ILW = 0.4 mm. The subplot is from 21:00 UT on 2 January to 6:00 UT on 3 January. (b) Time series of surface pressure (green solid line) and wind speed (black solid line). (c) Time series of surface temperature (red solid line), relative humidity (blue dashed line), and air density (black solid line).
Figure 7.
Time series of TROWARA and meteorological data from 1–31 January 2016. (a) Time series of IWV (green solid line), ILW (red area), and the precipitation (black area). The purple horizontal line is ILW = 0.4 mm. The subplot is from 21:00 UT on 2 January to 6:00 UT on 3 January. (b) Time series of surface pressure (green solid line) and wind speed (black solid line). (c) Time series of surface temperature (red solid line), relative humidity (blue dashed line), and air density (black solid line).

Figure 8.
Time series of TROWARA and meteorological data from 24–29 January 2016. Between the two purple vertical lines is a long clear sky period that lasts from 25–28 January. (a) Time series of IWV (green line) and ILW (red area).The purple horizontal line is ILW = 0.4 mm. (b) Time series of surface pressure (green line) and wind speed (black line). (c) Time series of surface temperature (red line), relative humidity (blue dotted line), and air density (black line).

Publisher’s Note: MDPI stays neutral with regard to jurisdictional claims in published maps and institutional affiliations. |
© 2022 by the authors. Licensee MDPI, Basel, Switzerland. This article is an open access article distributed under the terms and conditions of the Creative Commons Attribution (CC BY) license (https://creativecommons.org/licenses/by/4.0/).
Share and Cite
MDPI and ACS Style
Wang, W.; Hocke, K. Atmospheric Effects and Precursors of Rainfall over the Swiss Plateau. Remote Sens. 2022, 14, 2938. https://doi.org/10.3390/rs14122938
AMA Style
Wang W, Hocke K. Atmospheric Effects and Precursors of Rainfall over the Swiss Plateau. Remote Sensing. 2022; 14(12):2938. https://doi.org/10.3390/rs14122938
Chicago/Turabian StyleWang, Wenyue, and Klemens Hocke. 2022. "Atmospheric Effects and Precursors of Rainfall over the Swiss Plateau" Remote Sensing 14, no. 12: 2938. https://doi.org/10.3390/rs14122938
Note that from the first issue of 2016, this journal uses article numbers instead of page numbers. See further details here.