
Research on Inversion and Correction Method of Urban Light Environment Based on Cooperative Observation

Abstract
:1. Introduction
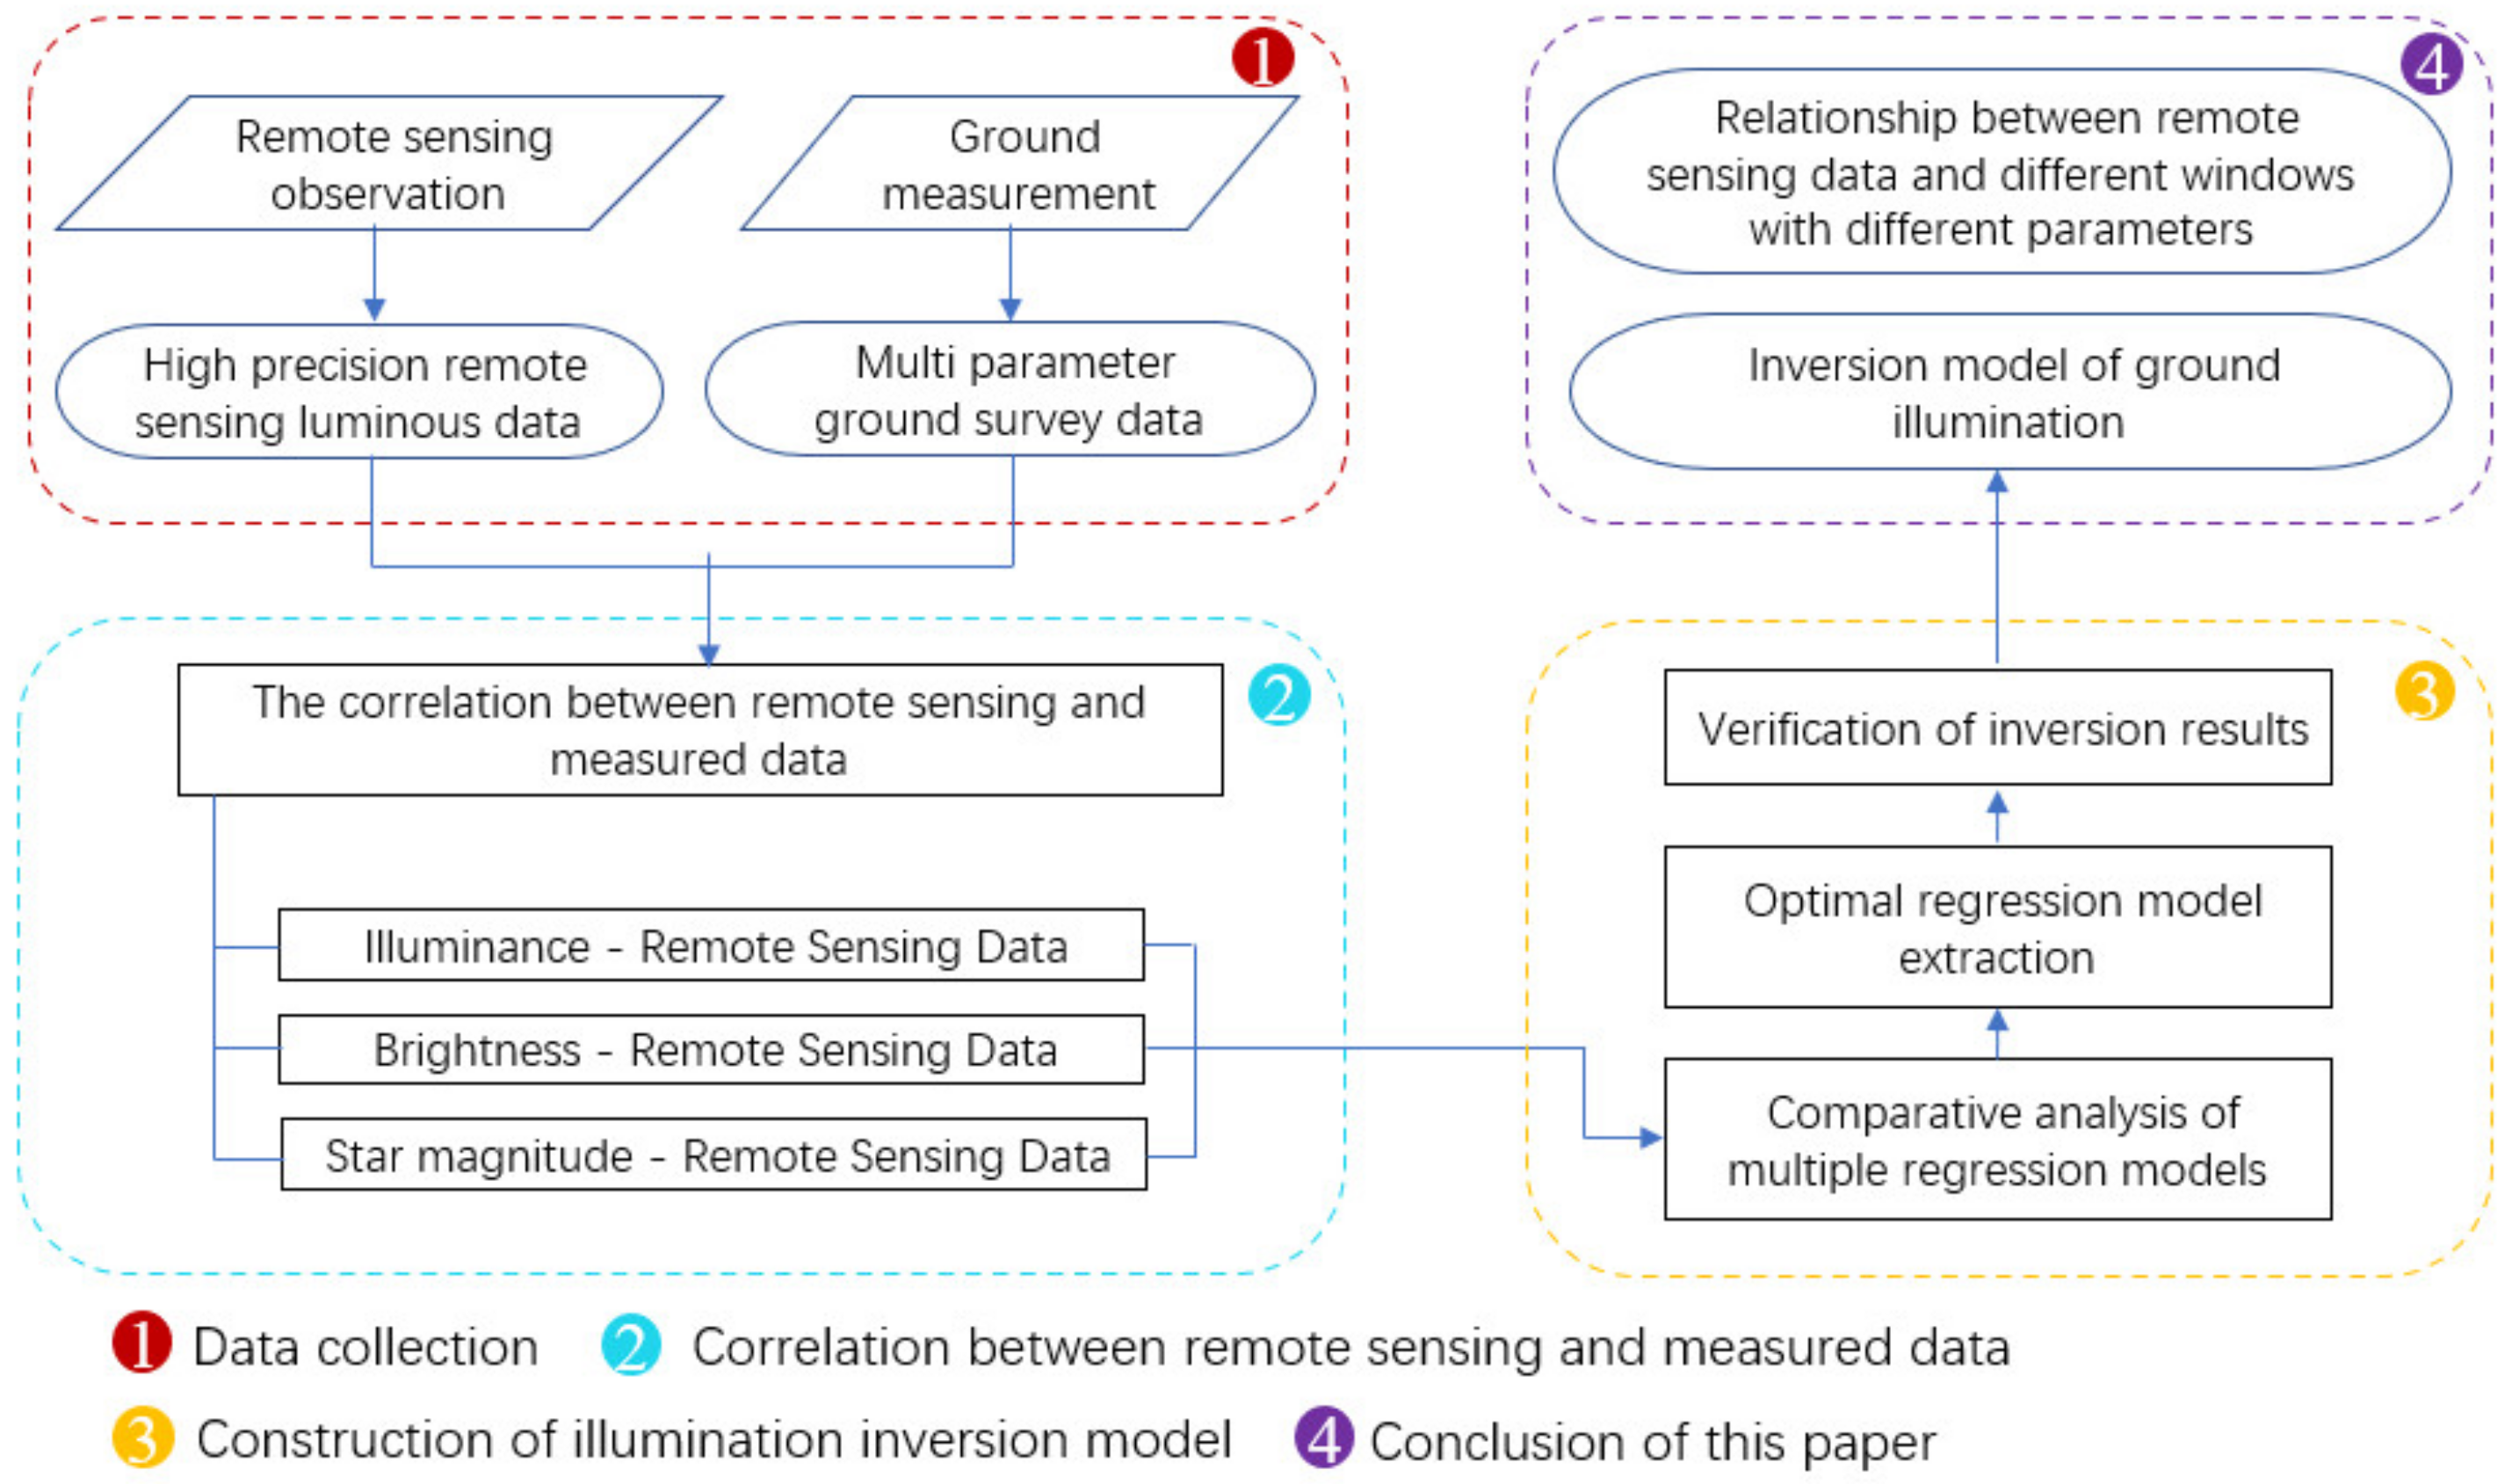
2. Research Method
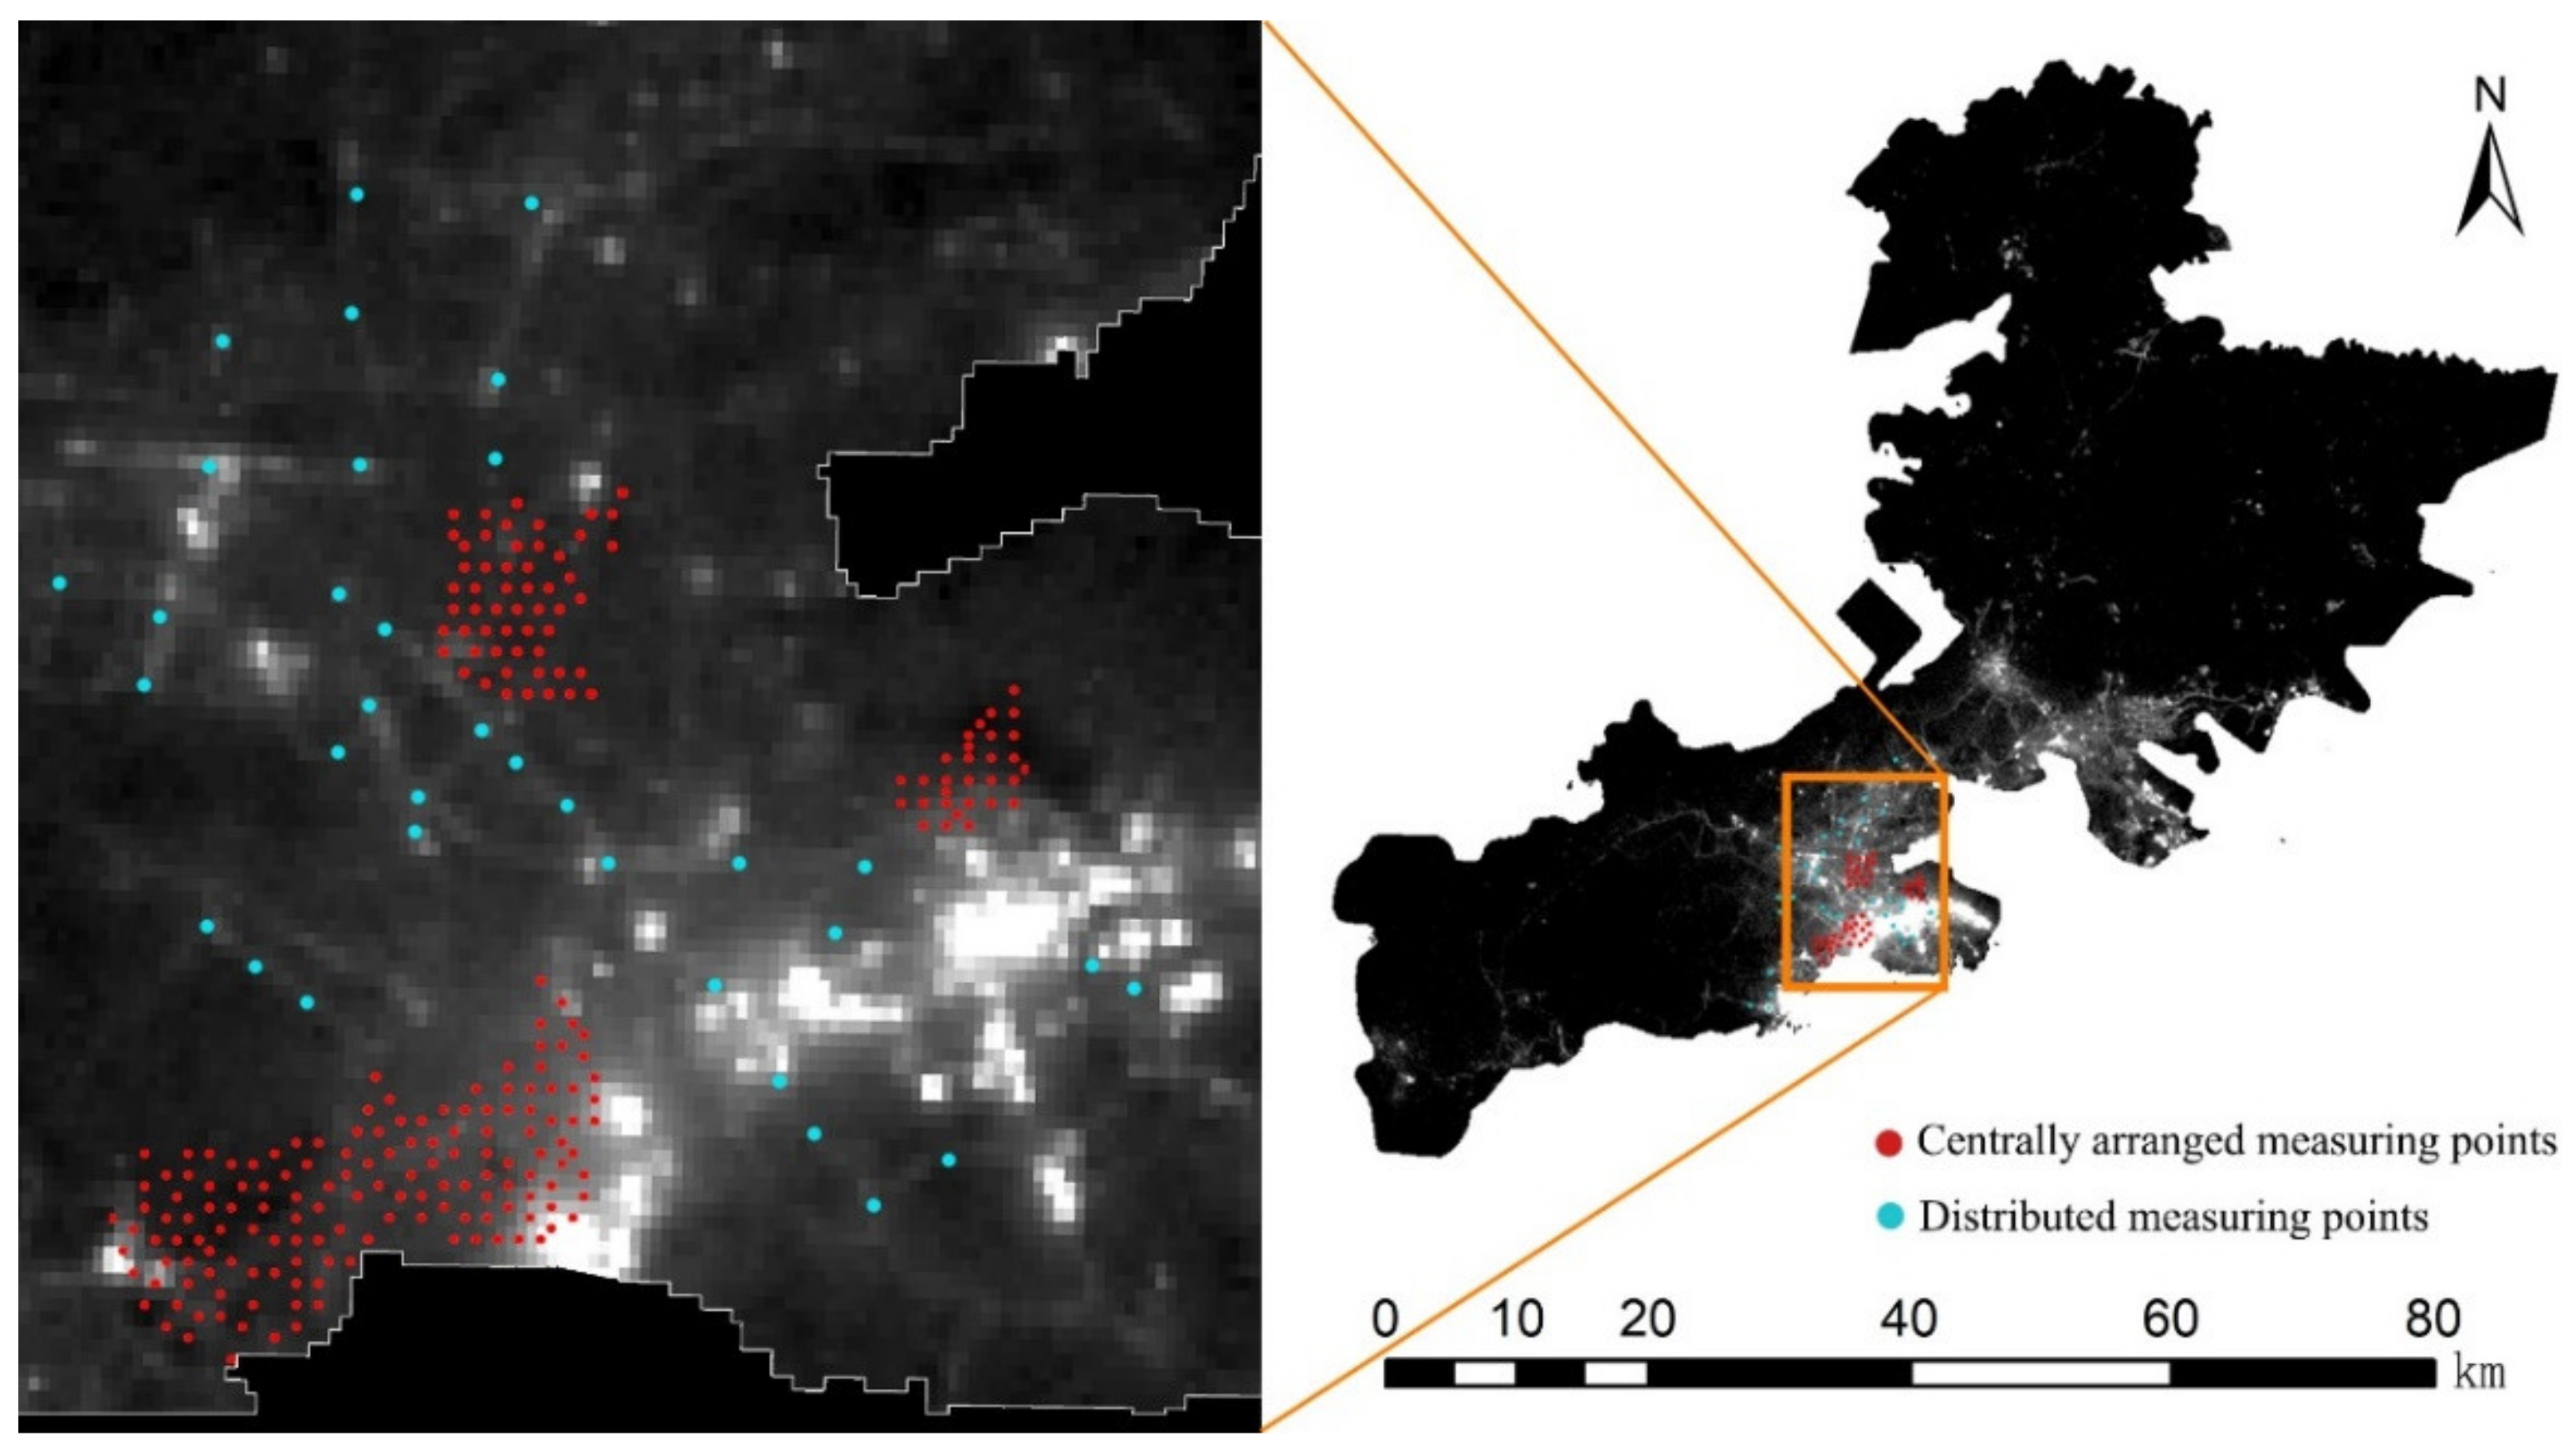
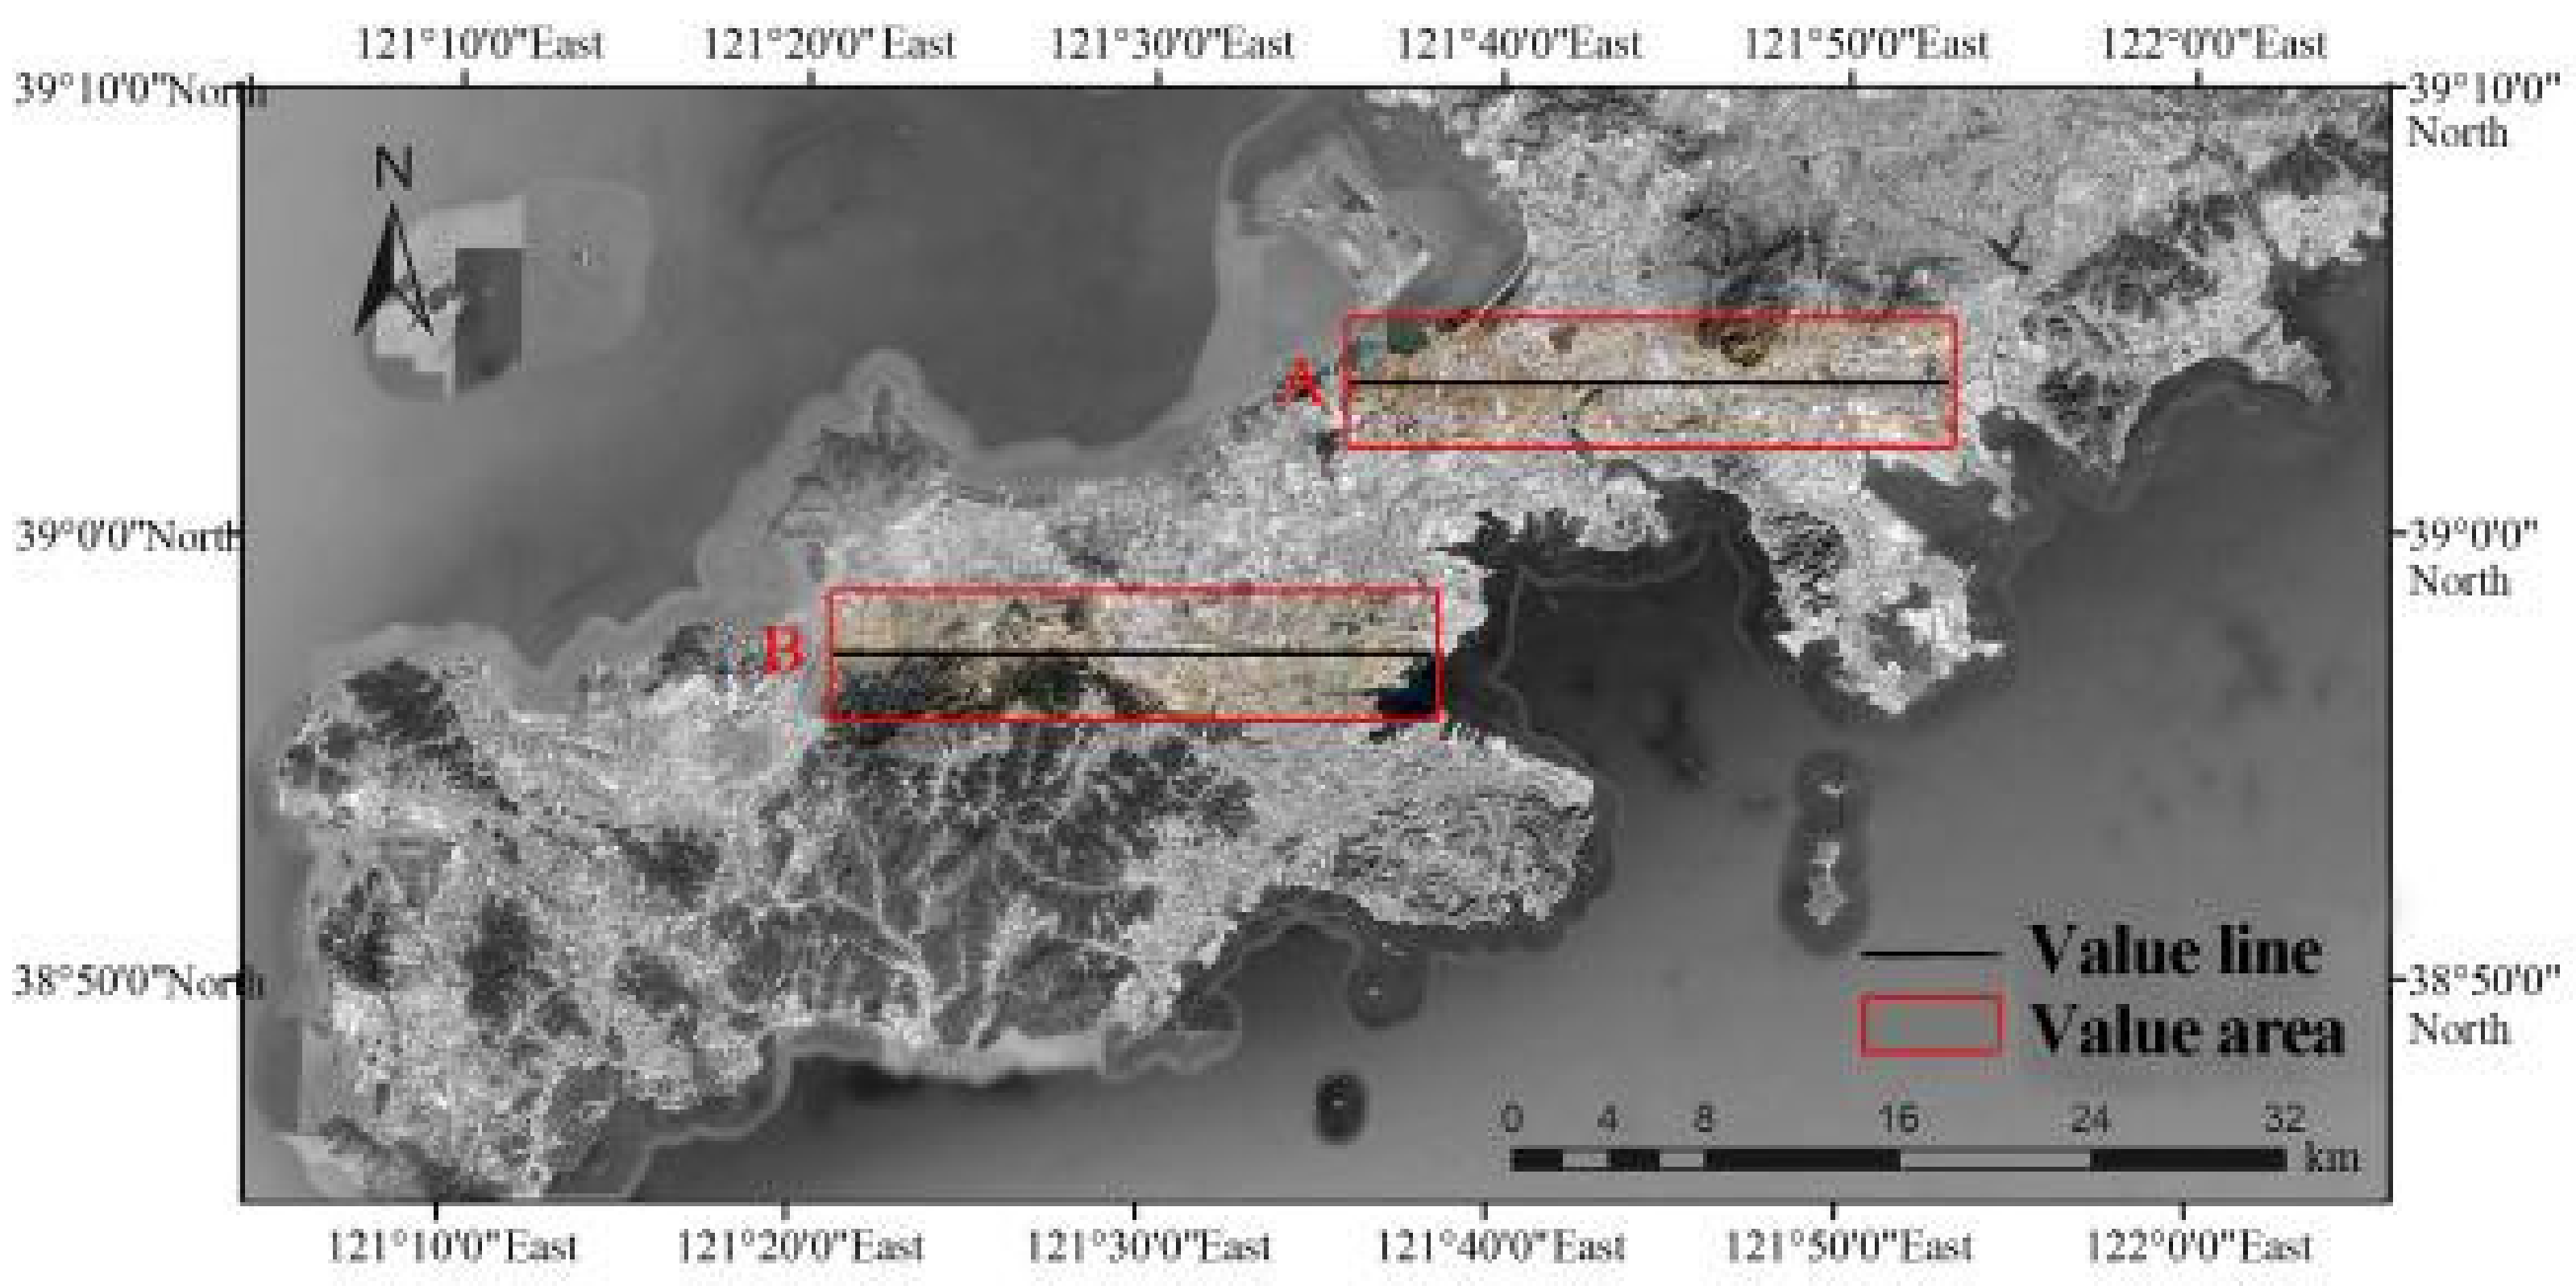
2.1. Study Area
2.2. Research Method
2.3. Data Processing
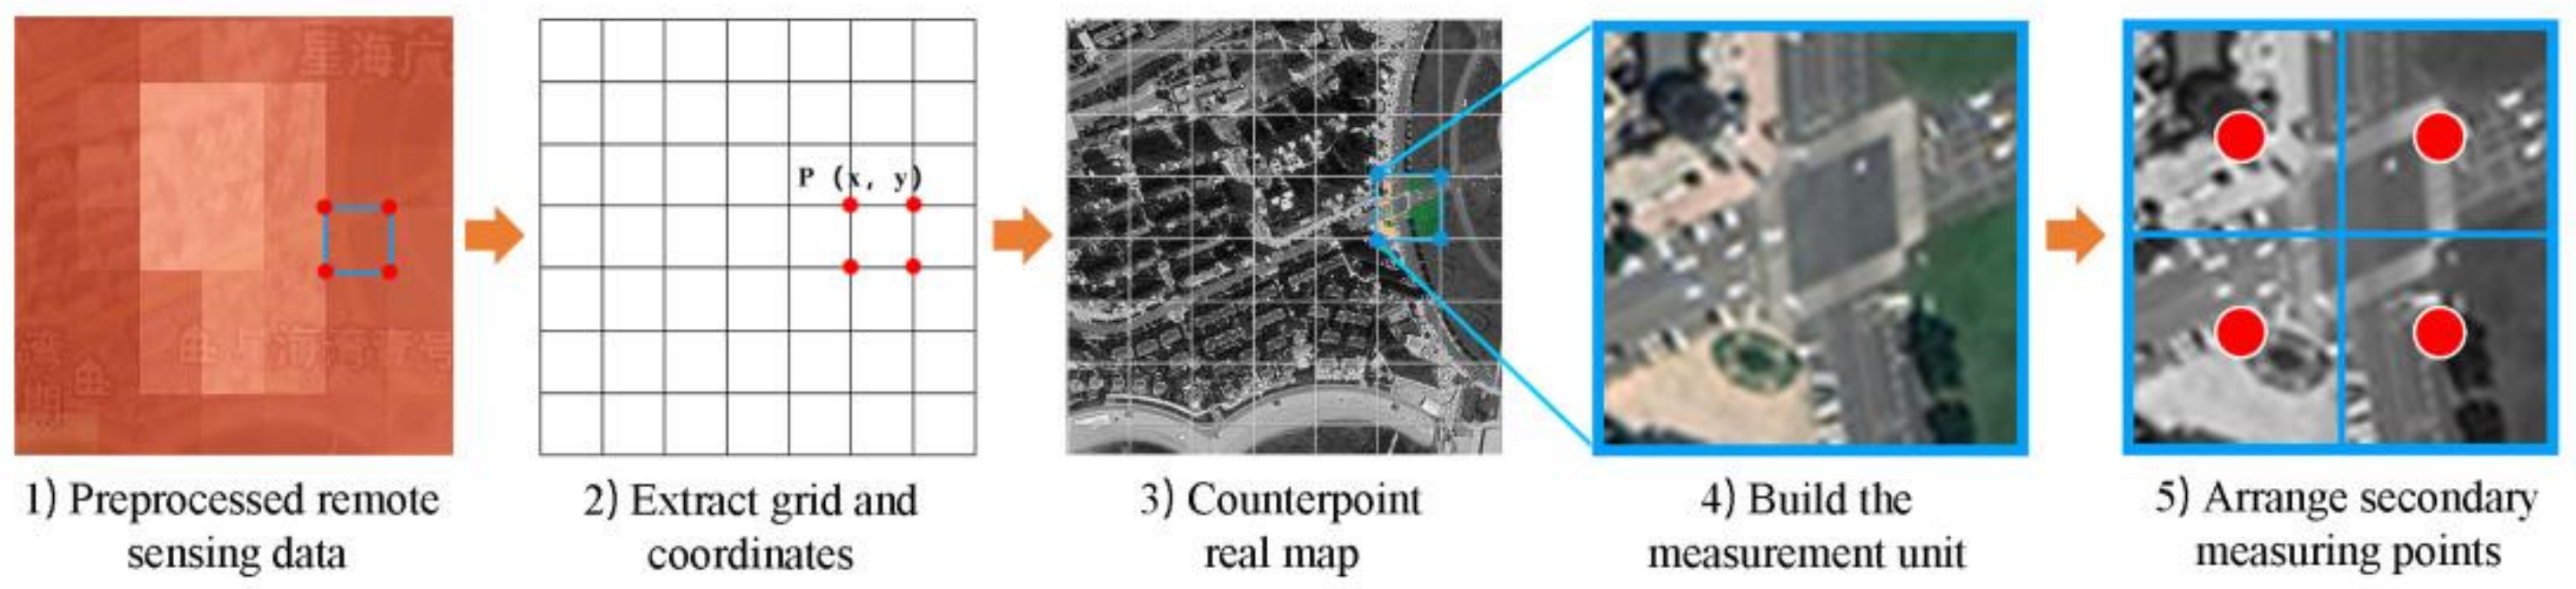
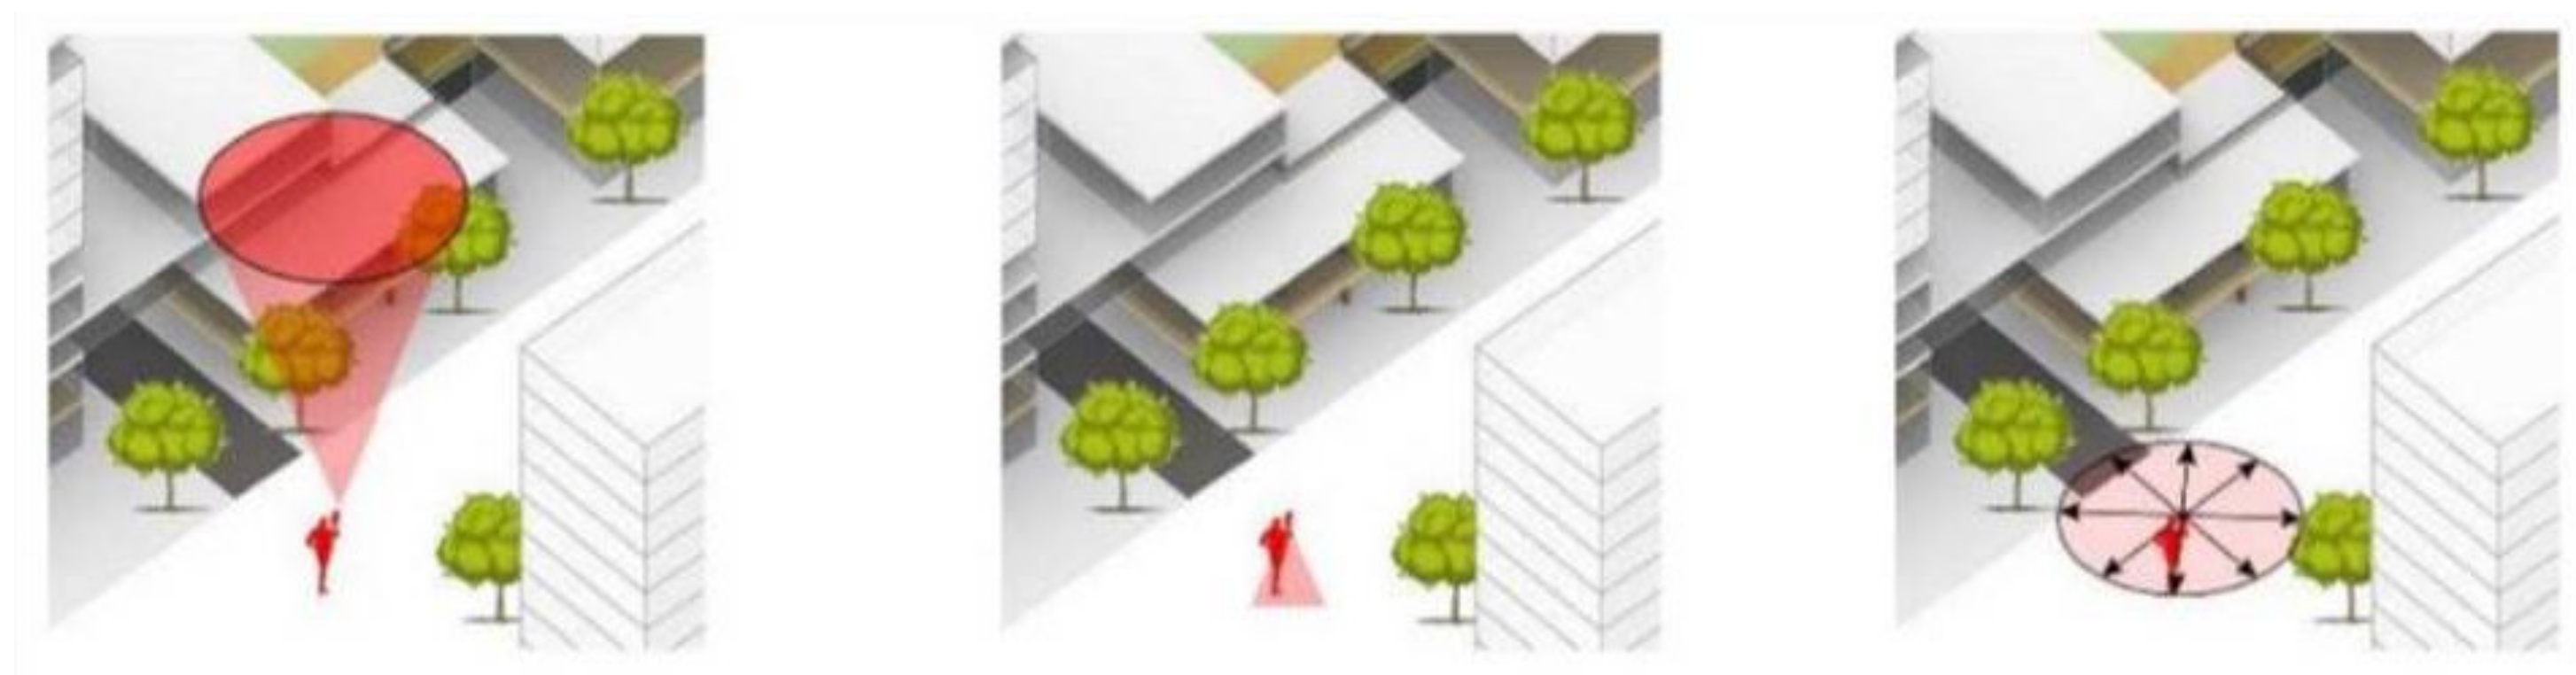
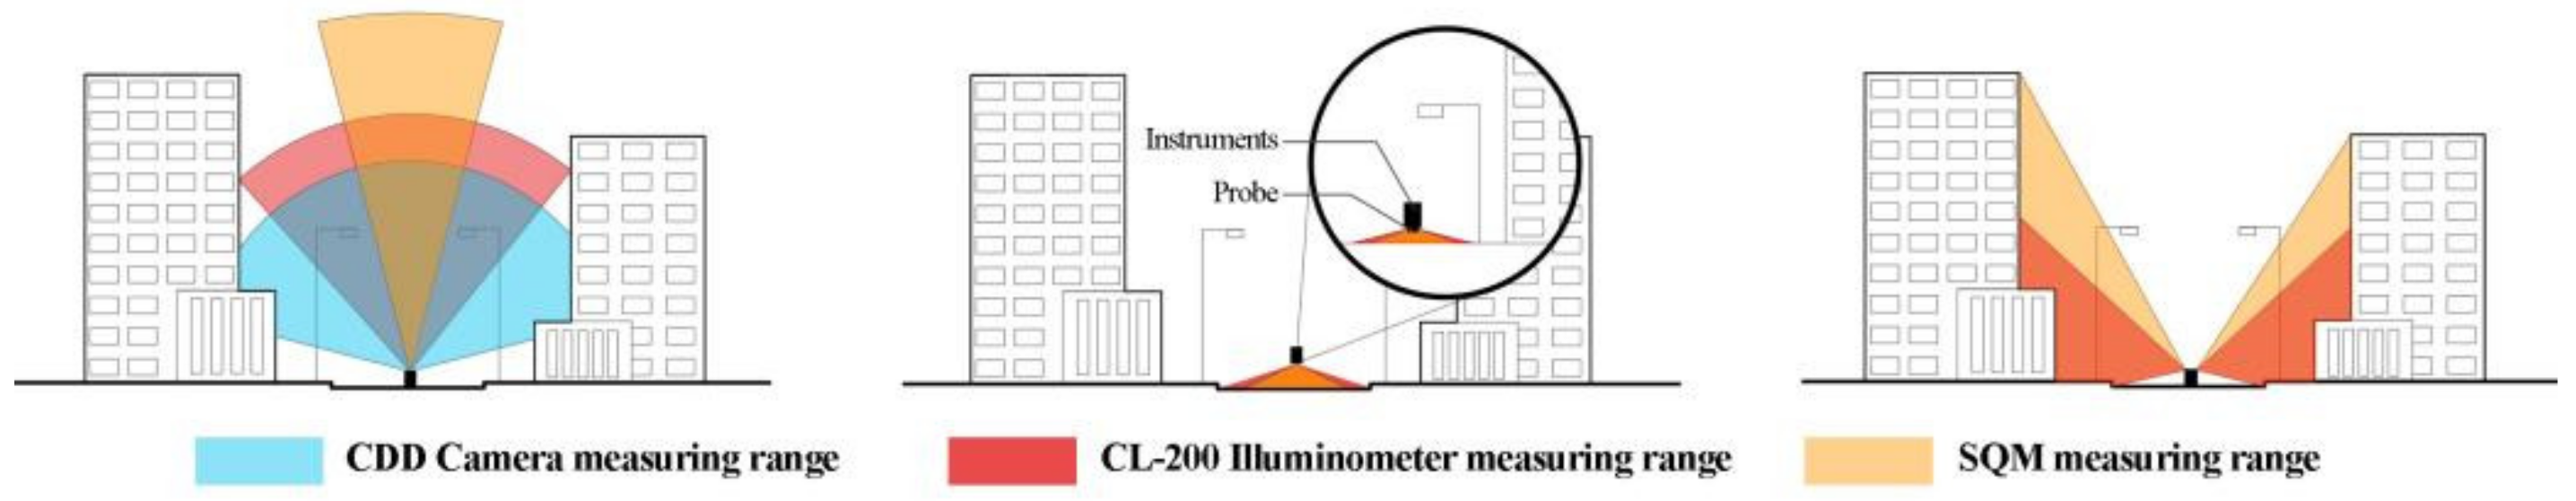
2.3.1. Measured Data Collection and Processing
2.3.2. Remote Sensing Data Processing
2.4. Model Construction
3. Result
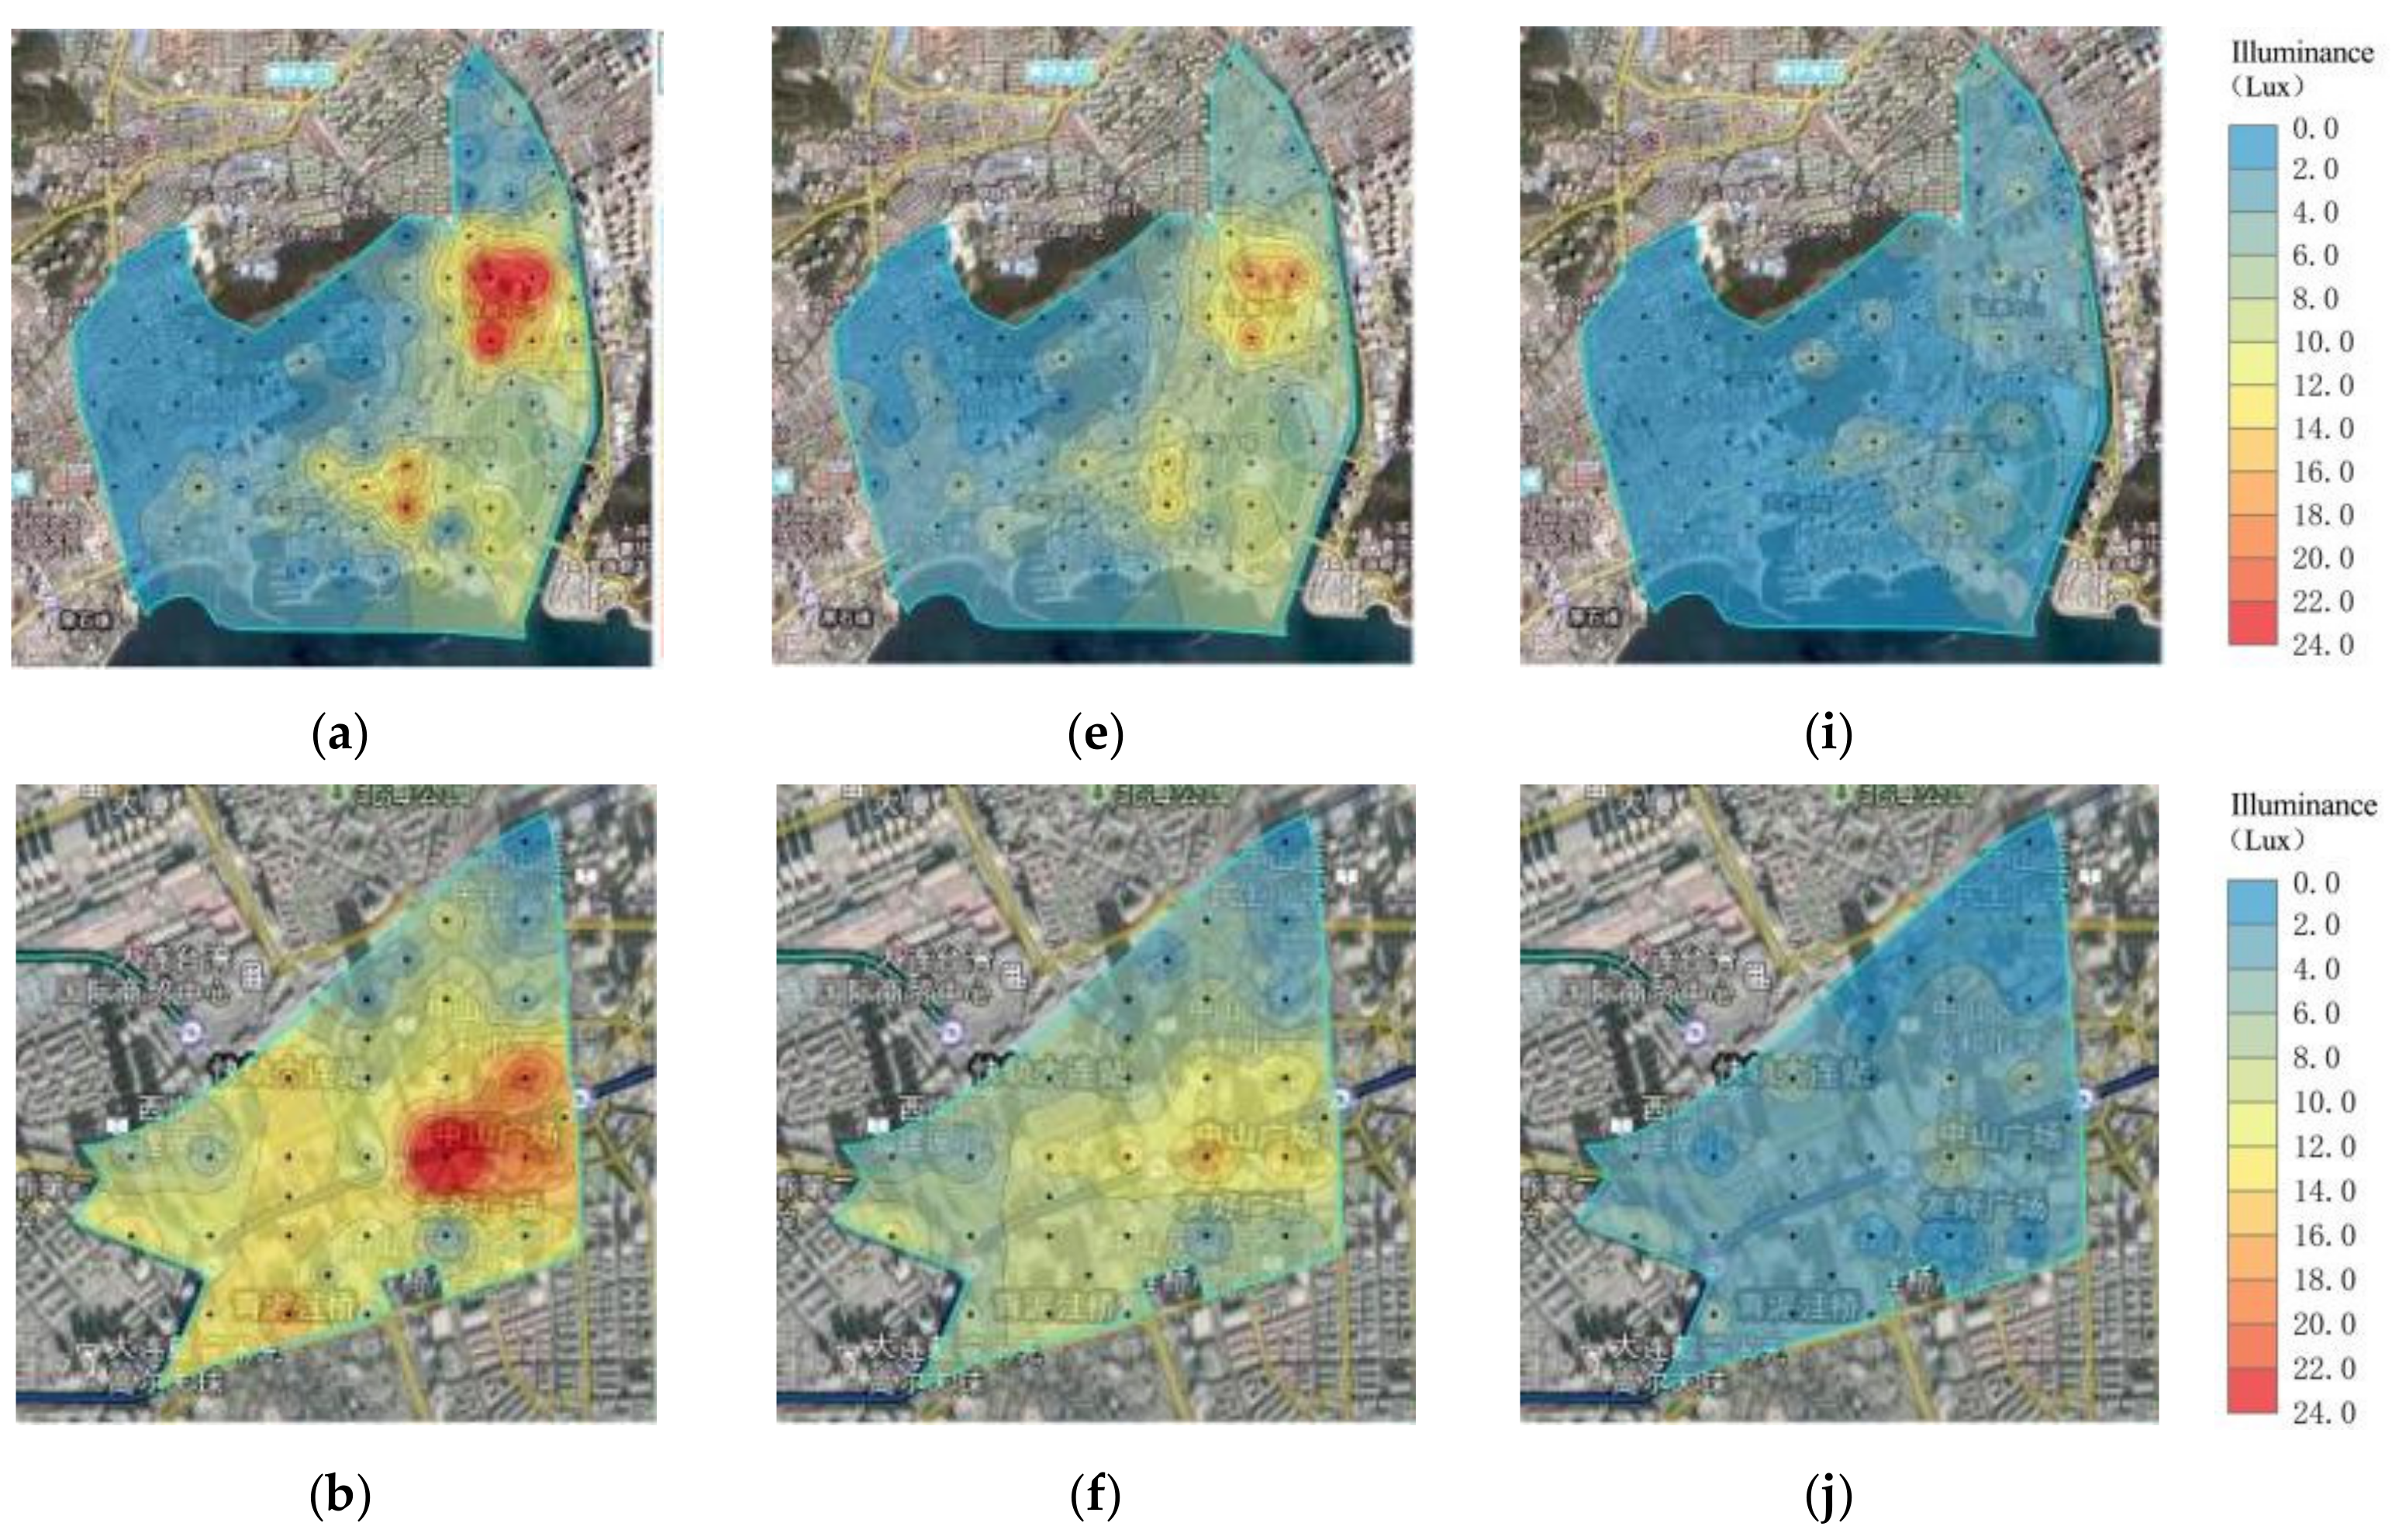
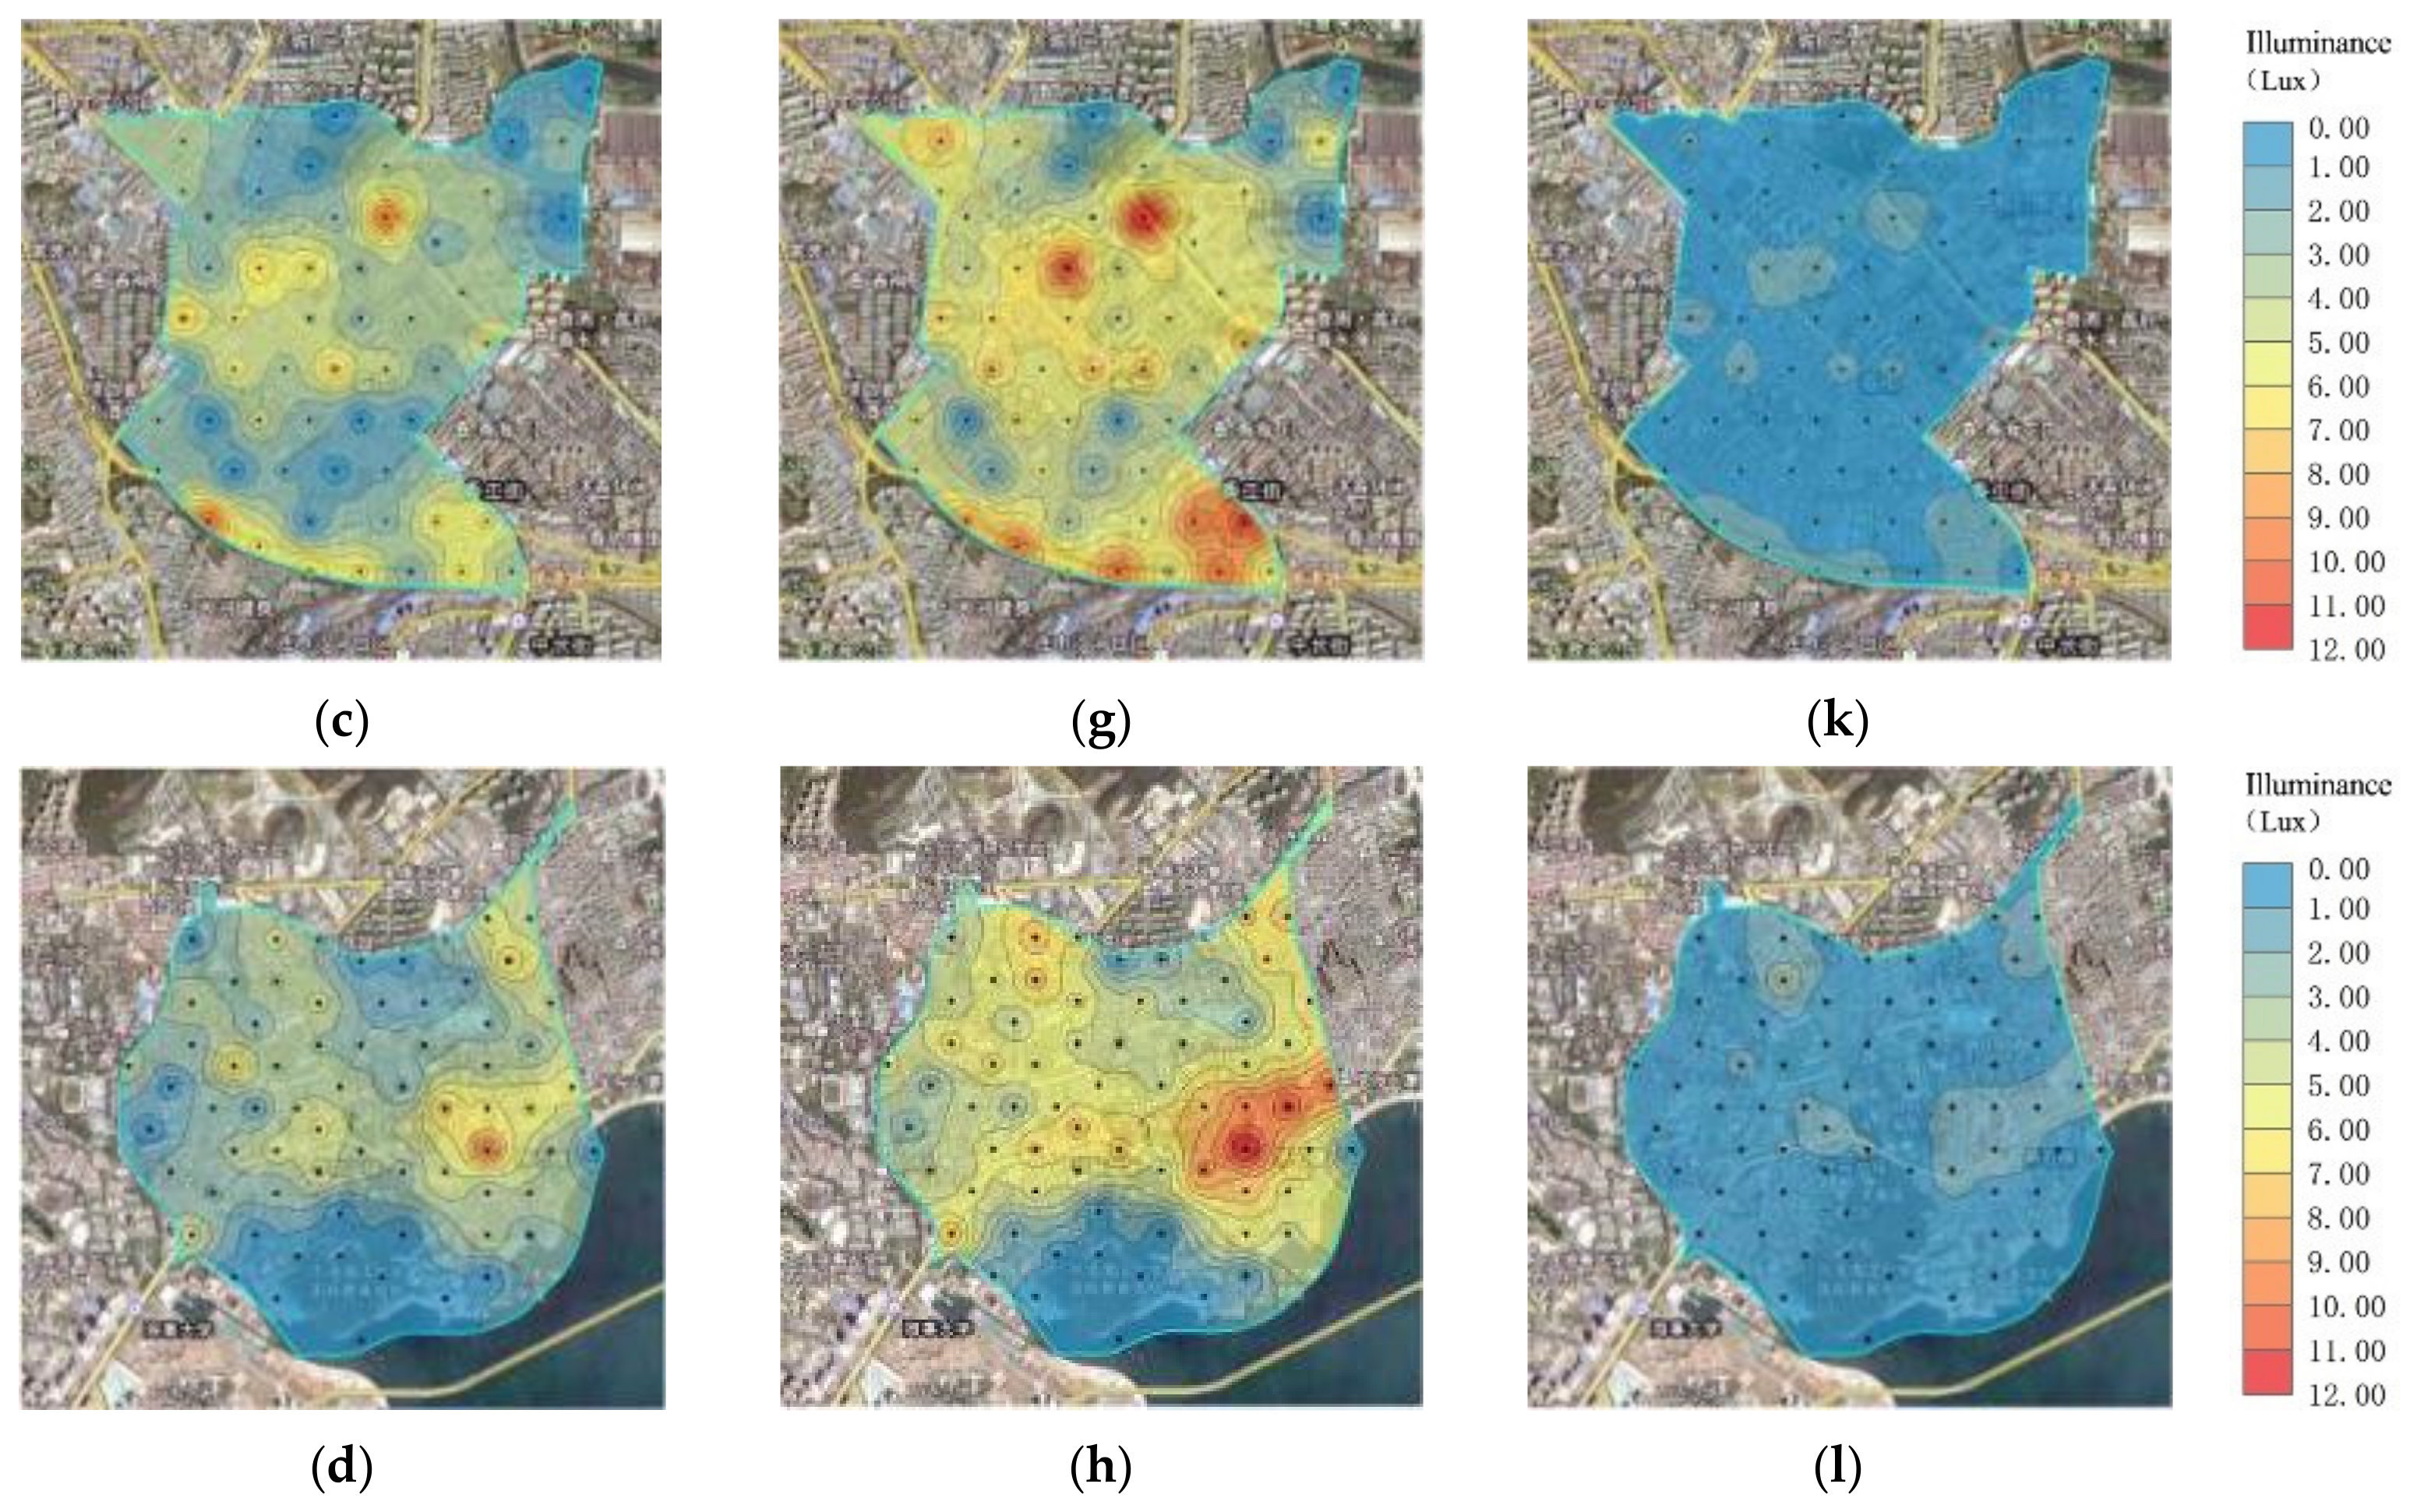
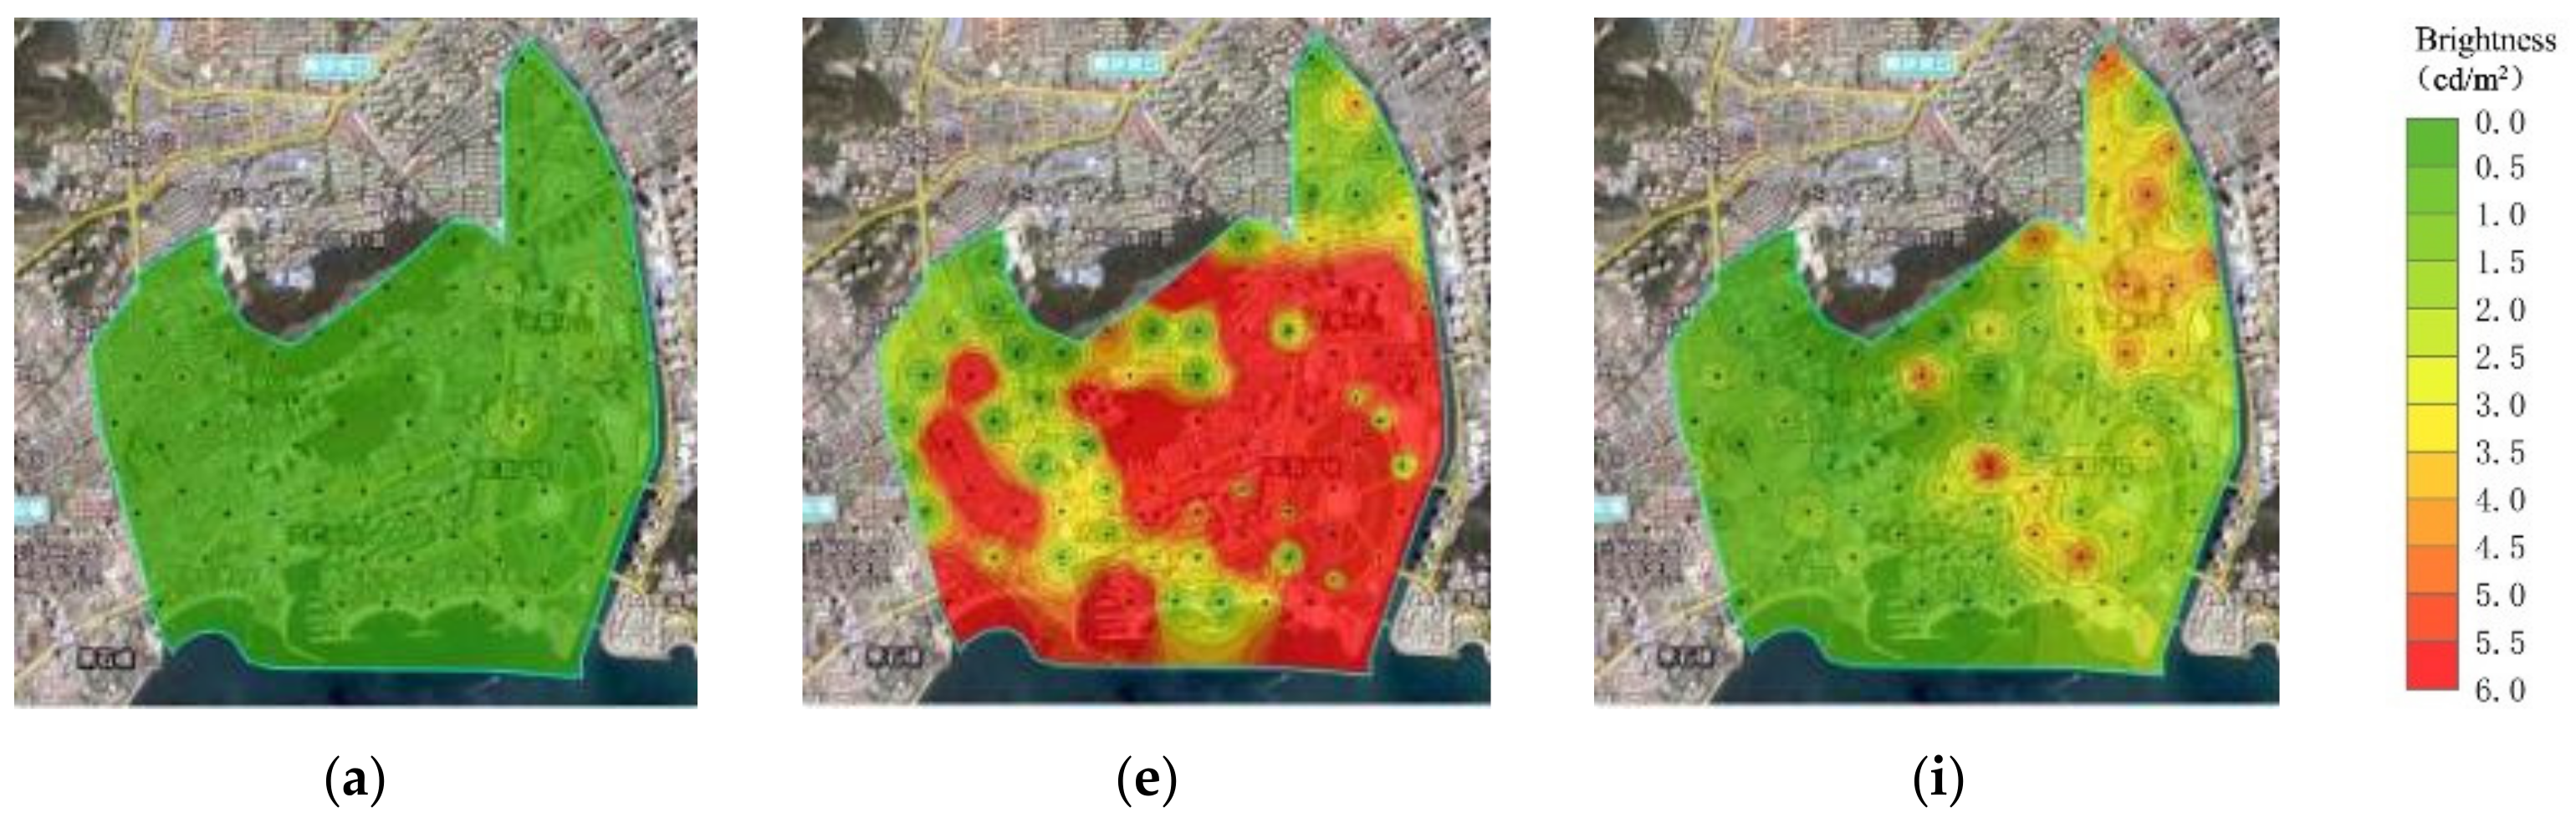
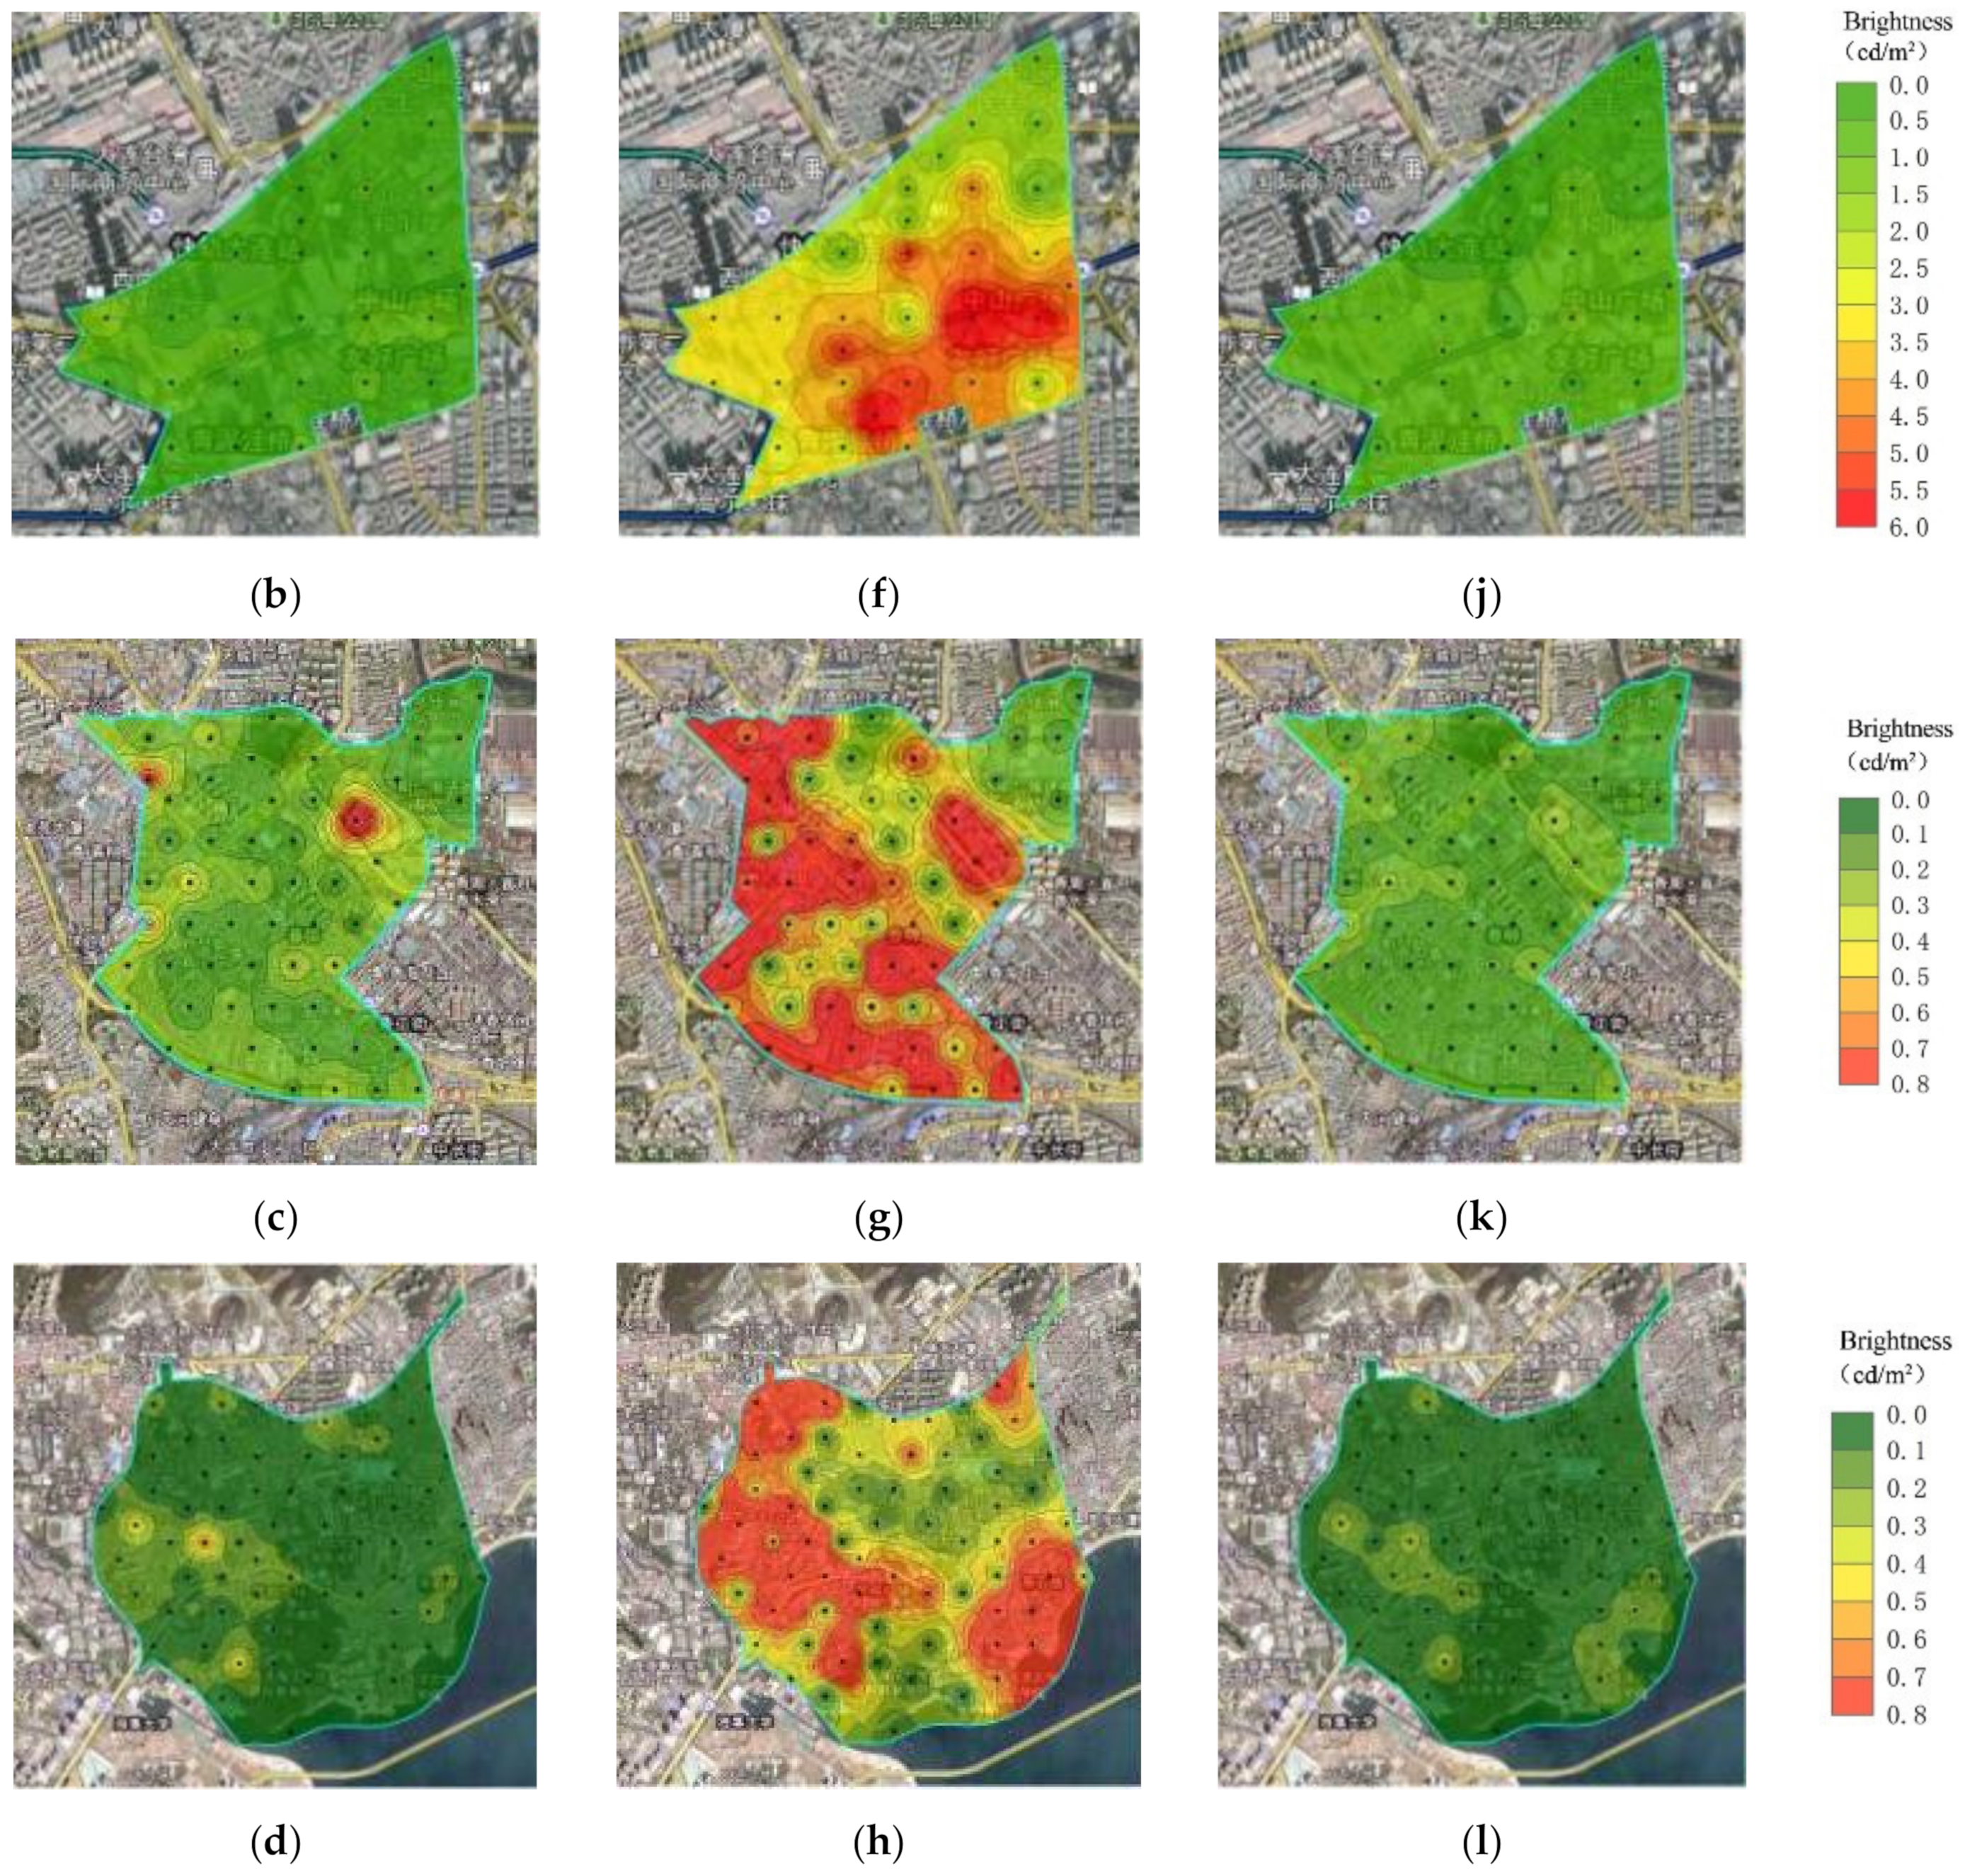
3.1. Measured Data Processing Results
3.2. Inversion Model
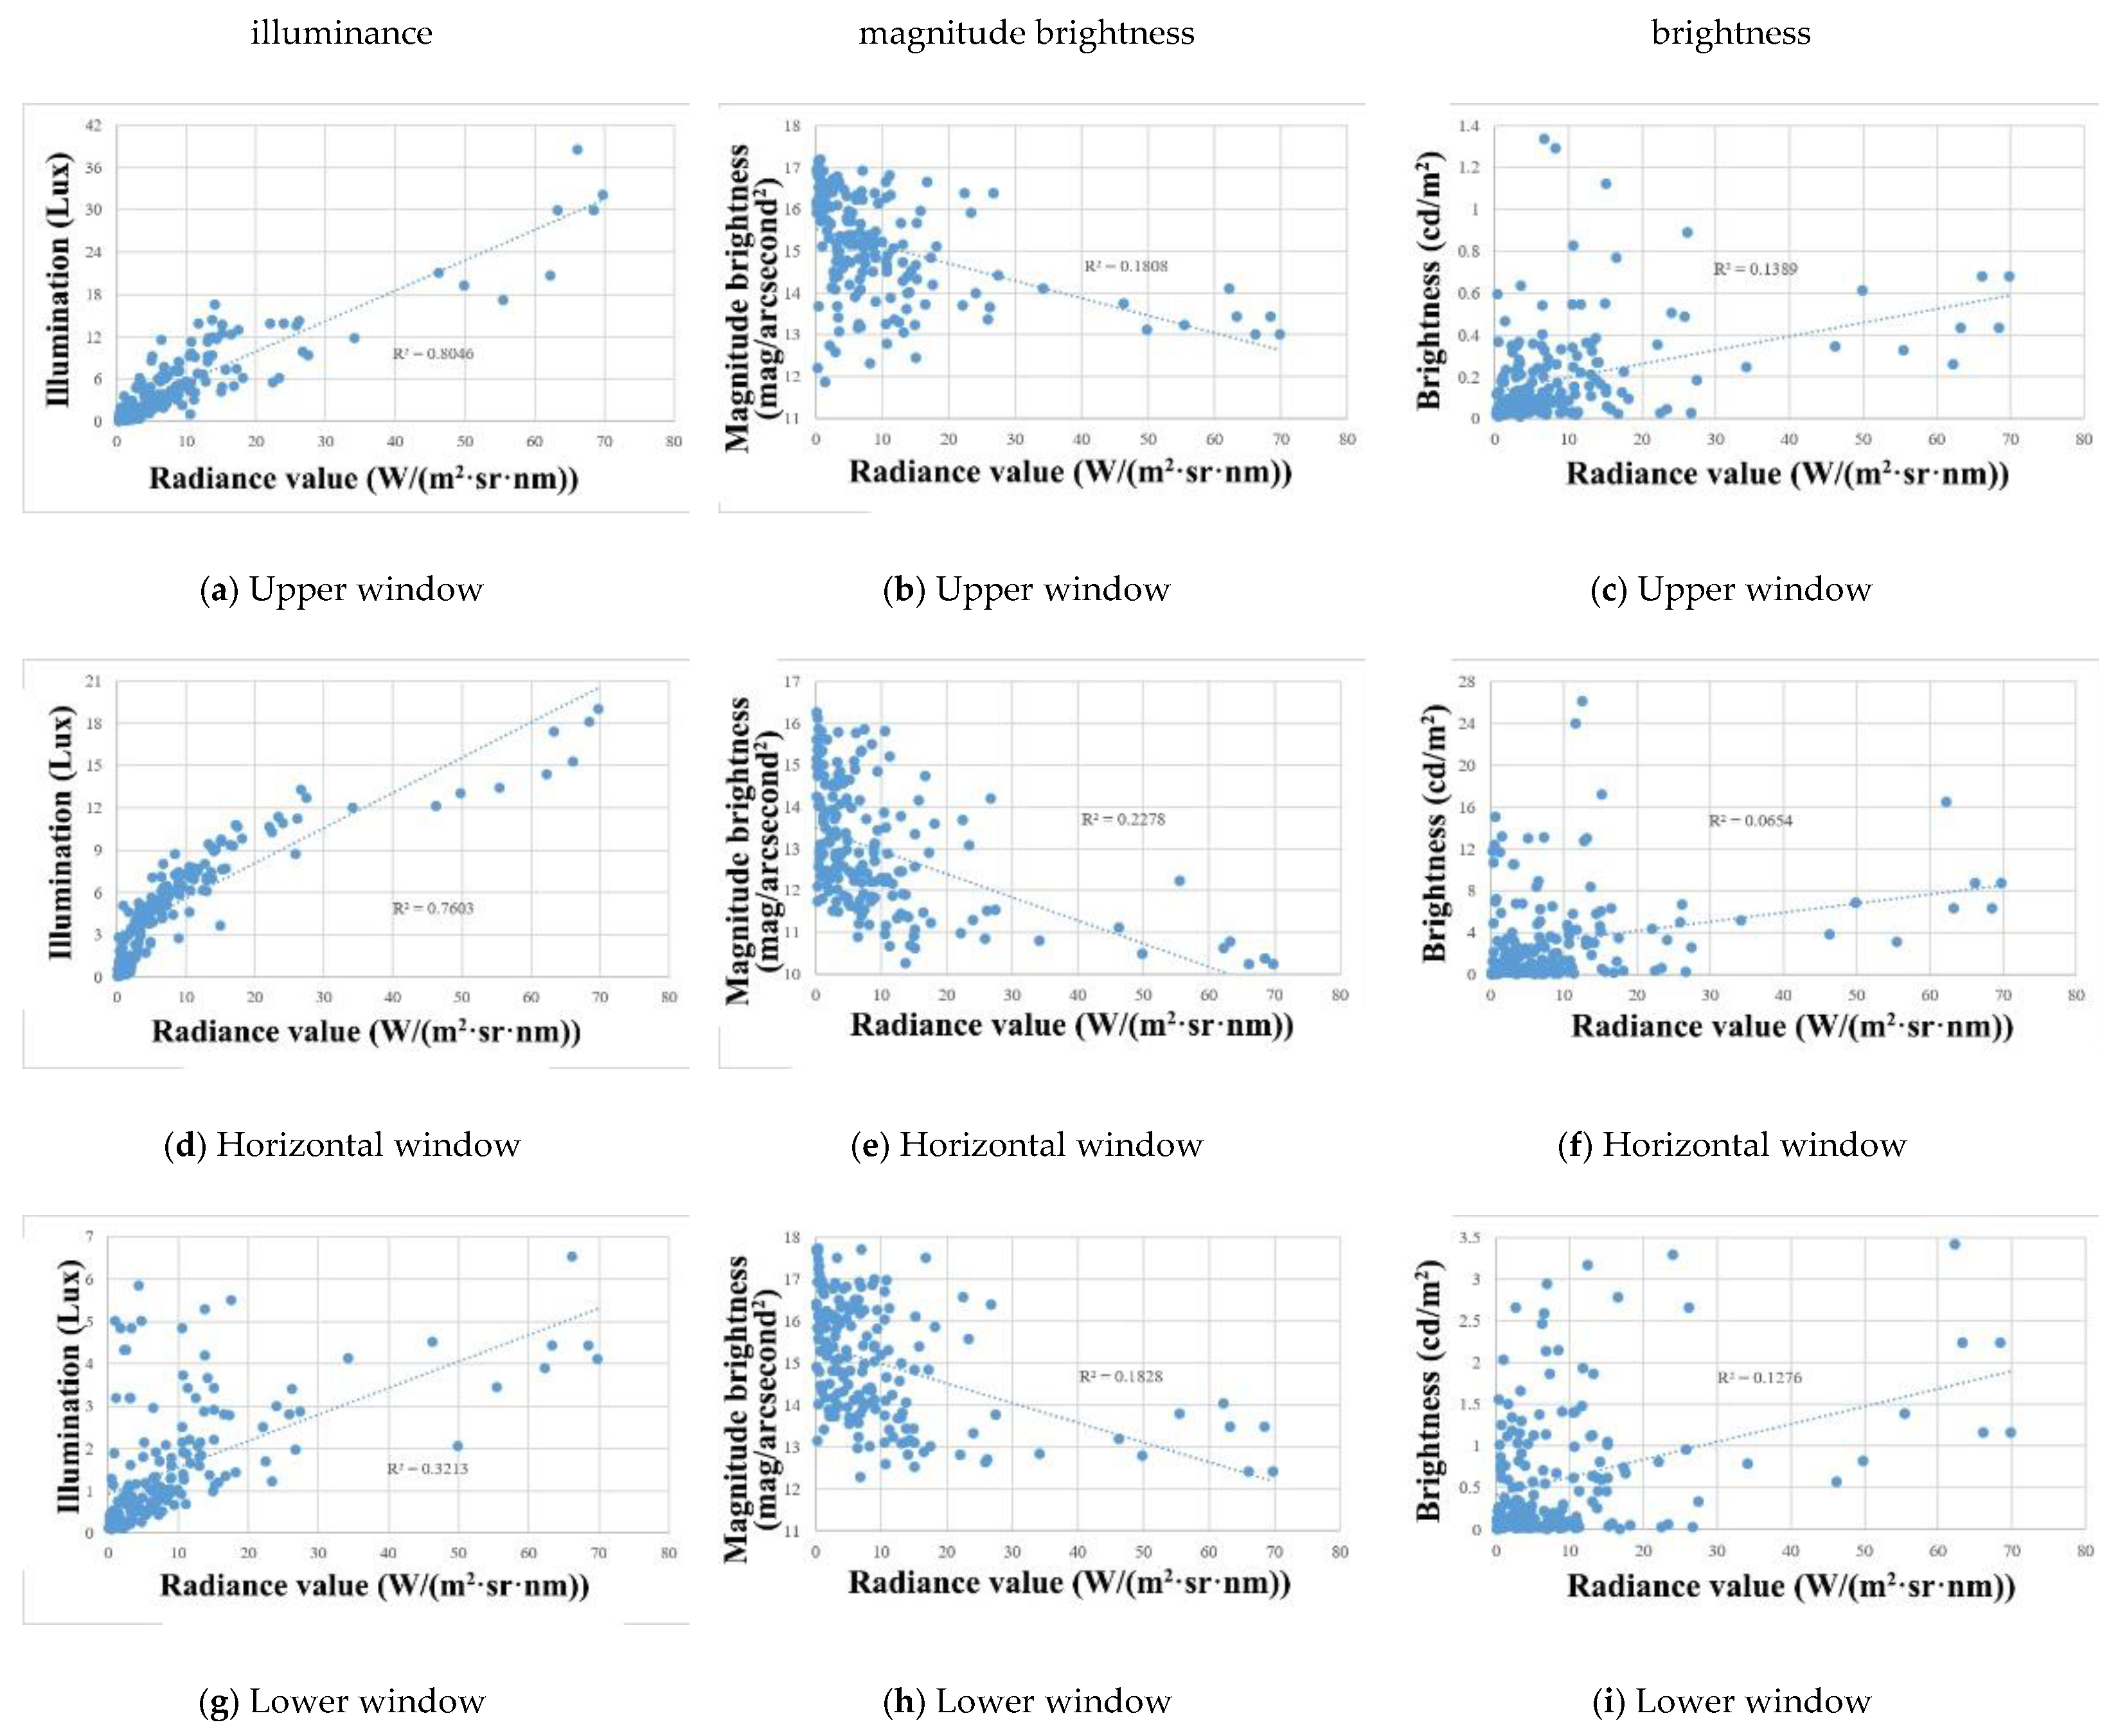
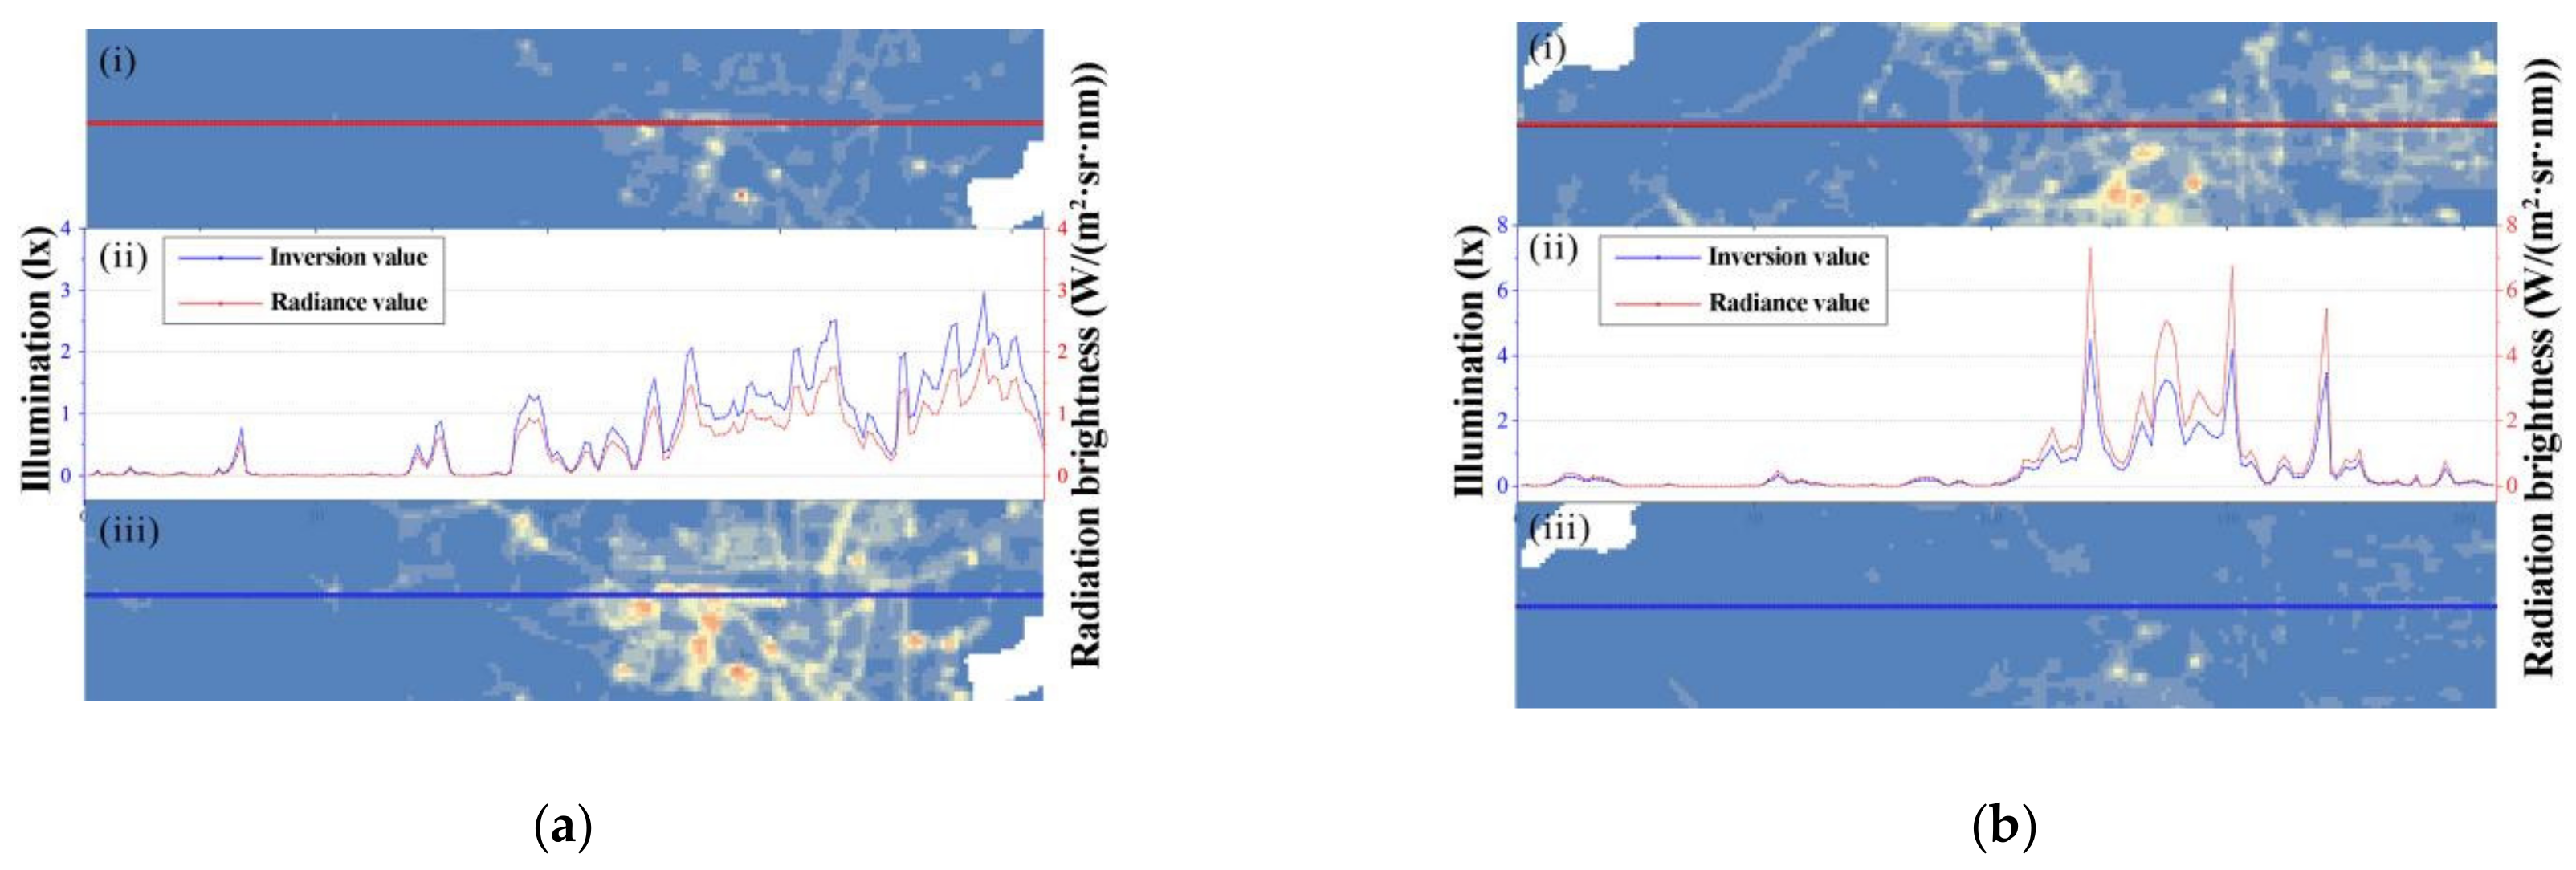
3.2.1. Target Inversion Parameter Extraction
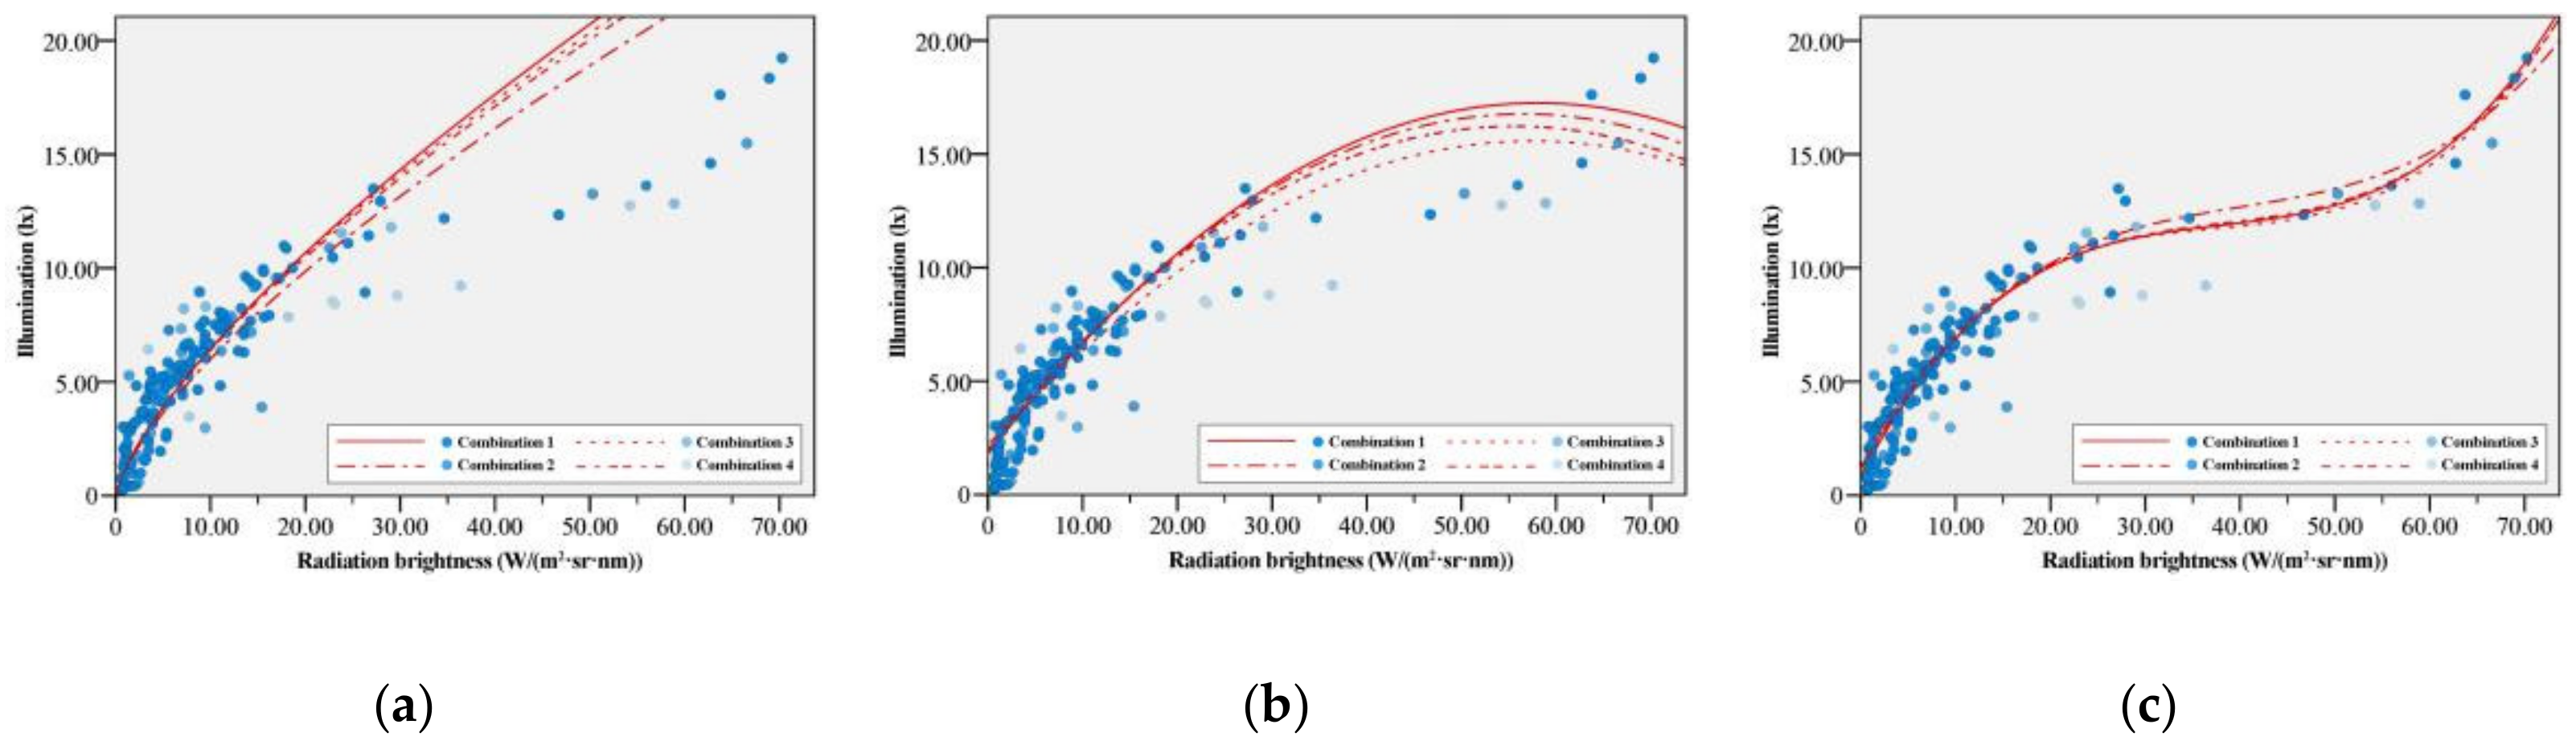
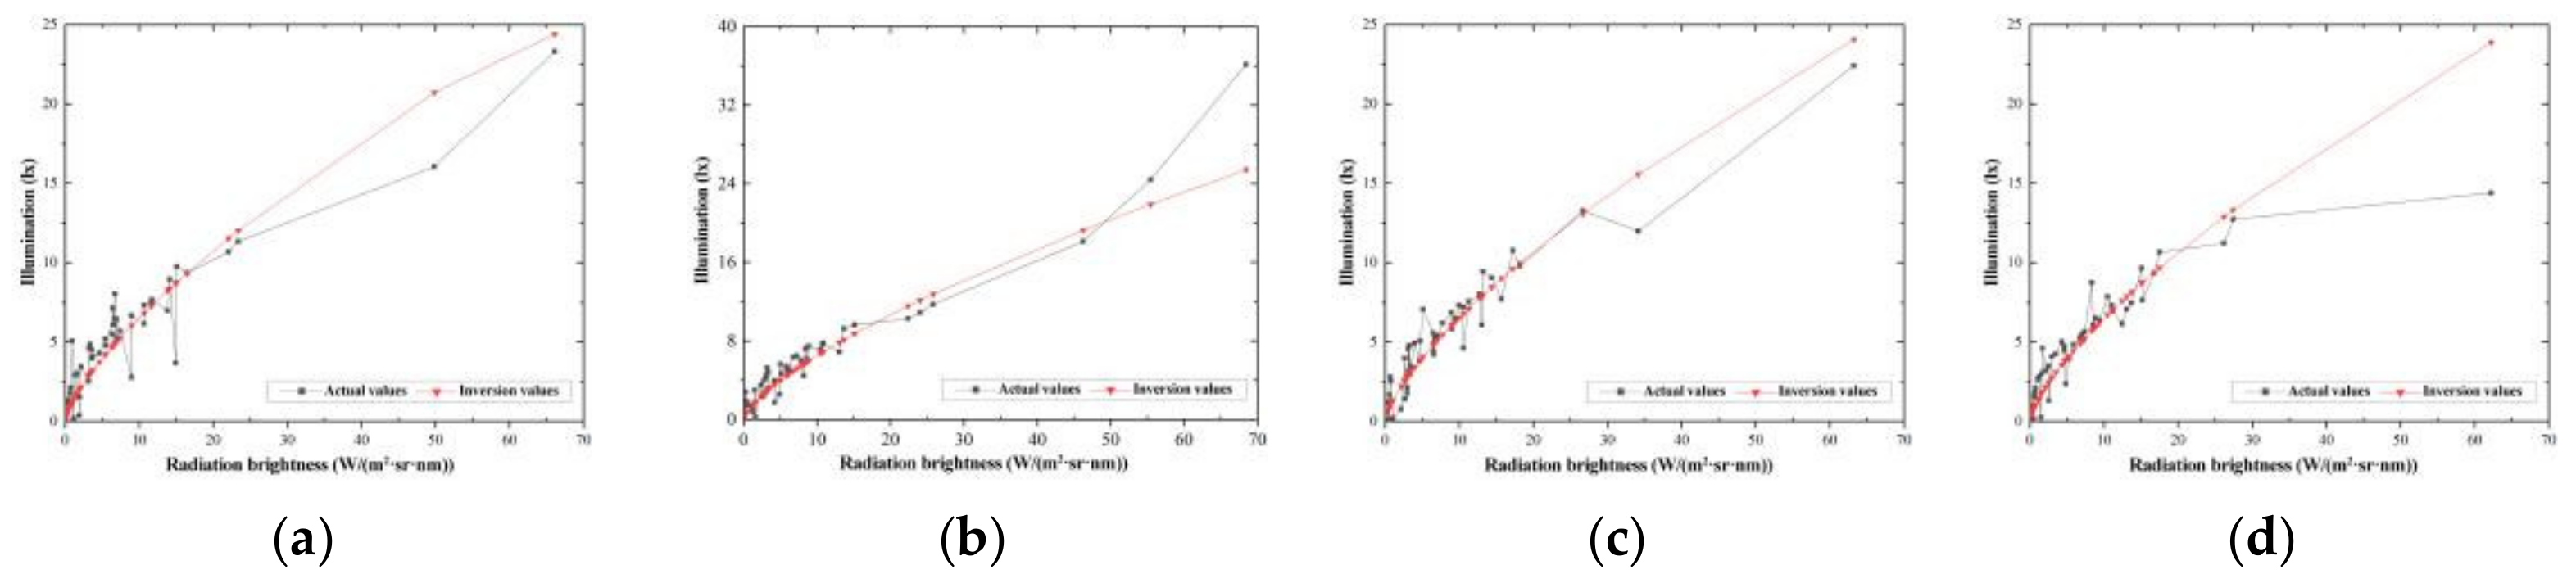
3.2.2. Model Construction and Comparison
Data Packet
Model Contrast
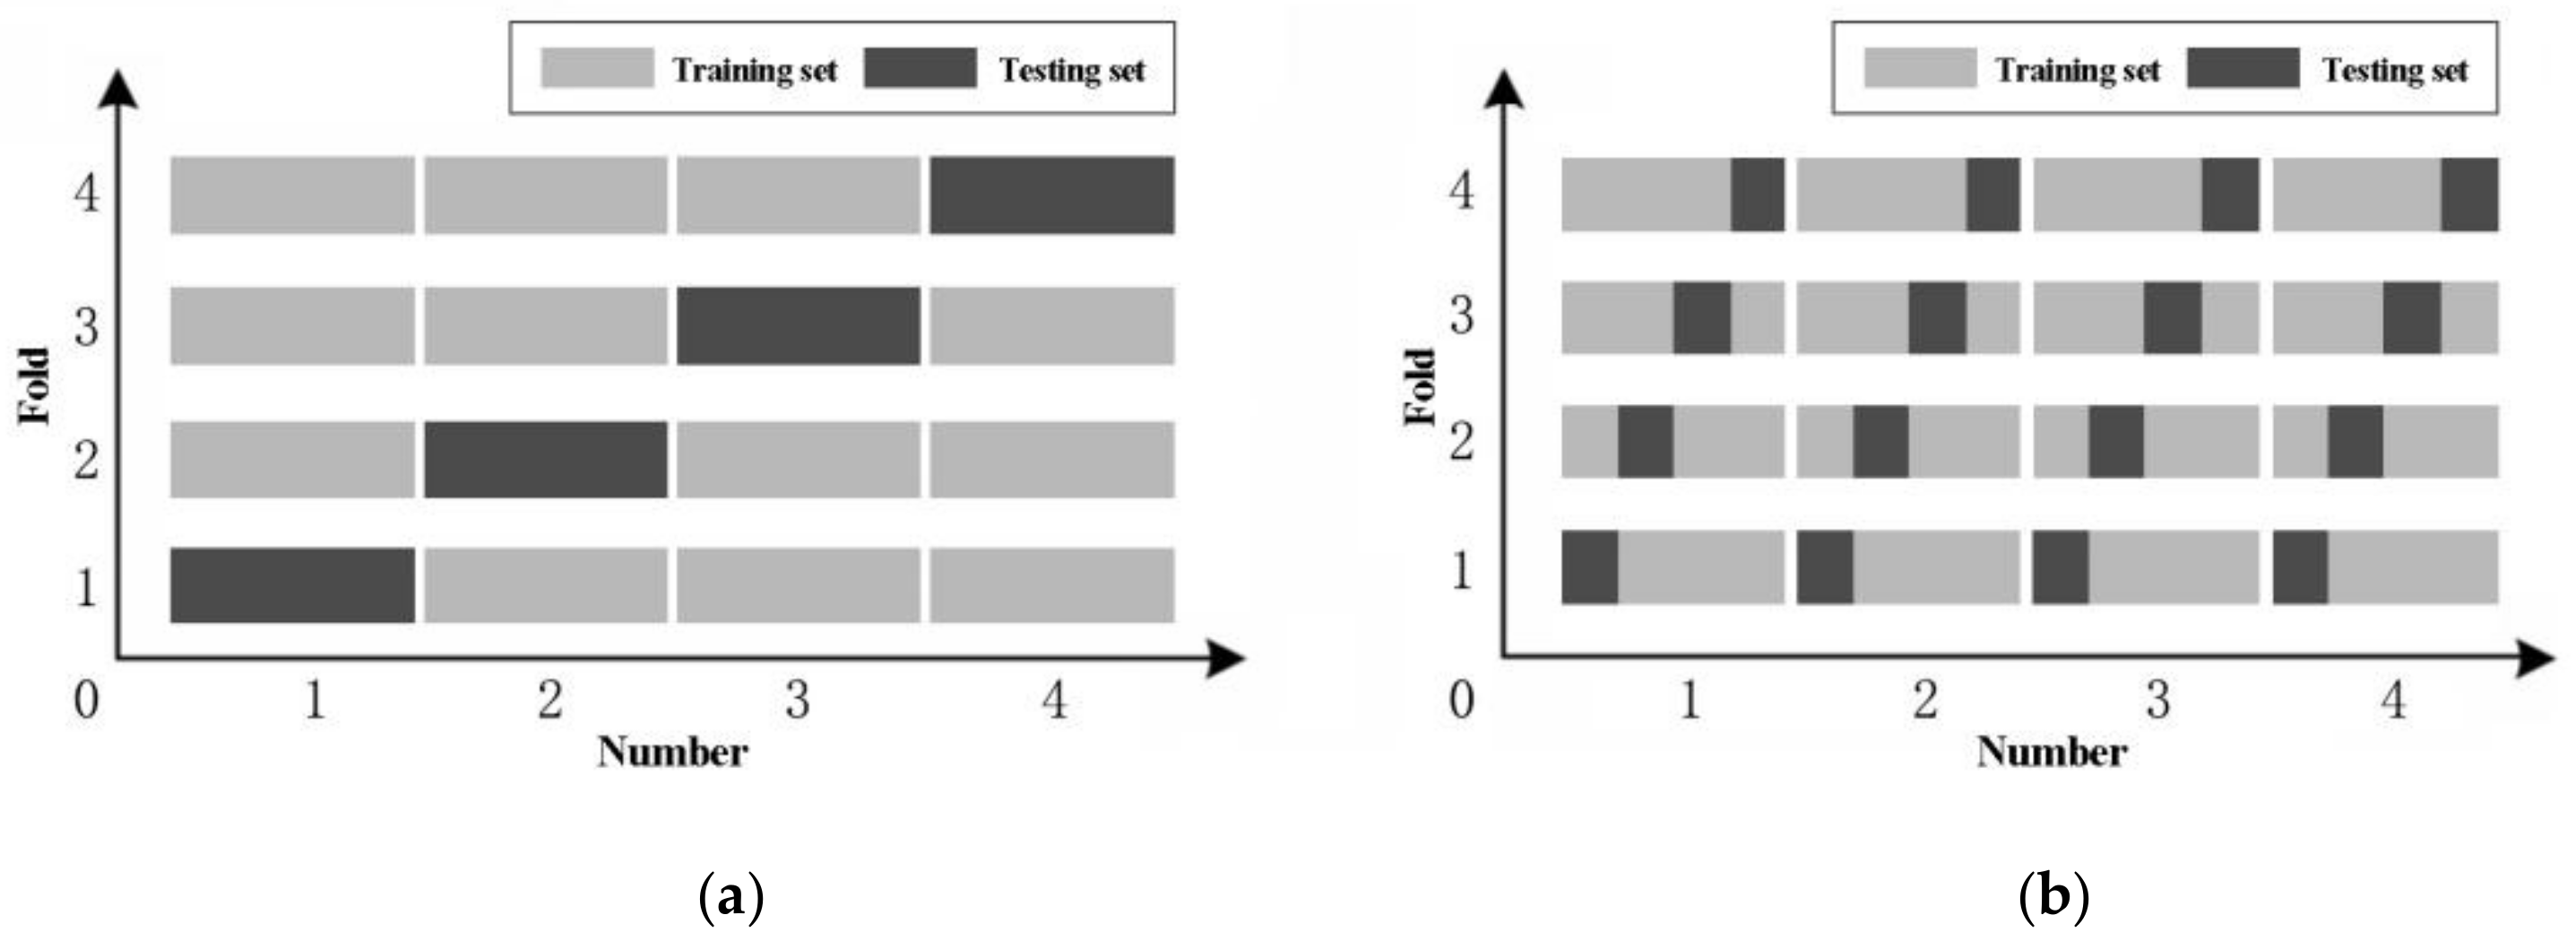
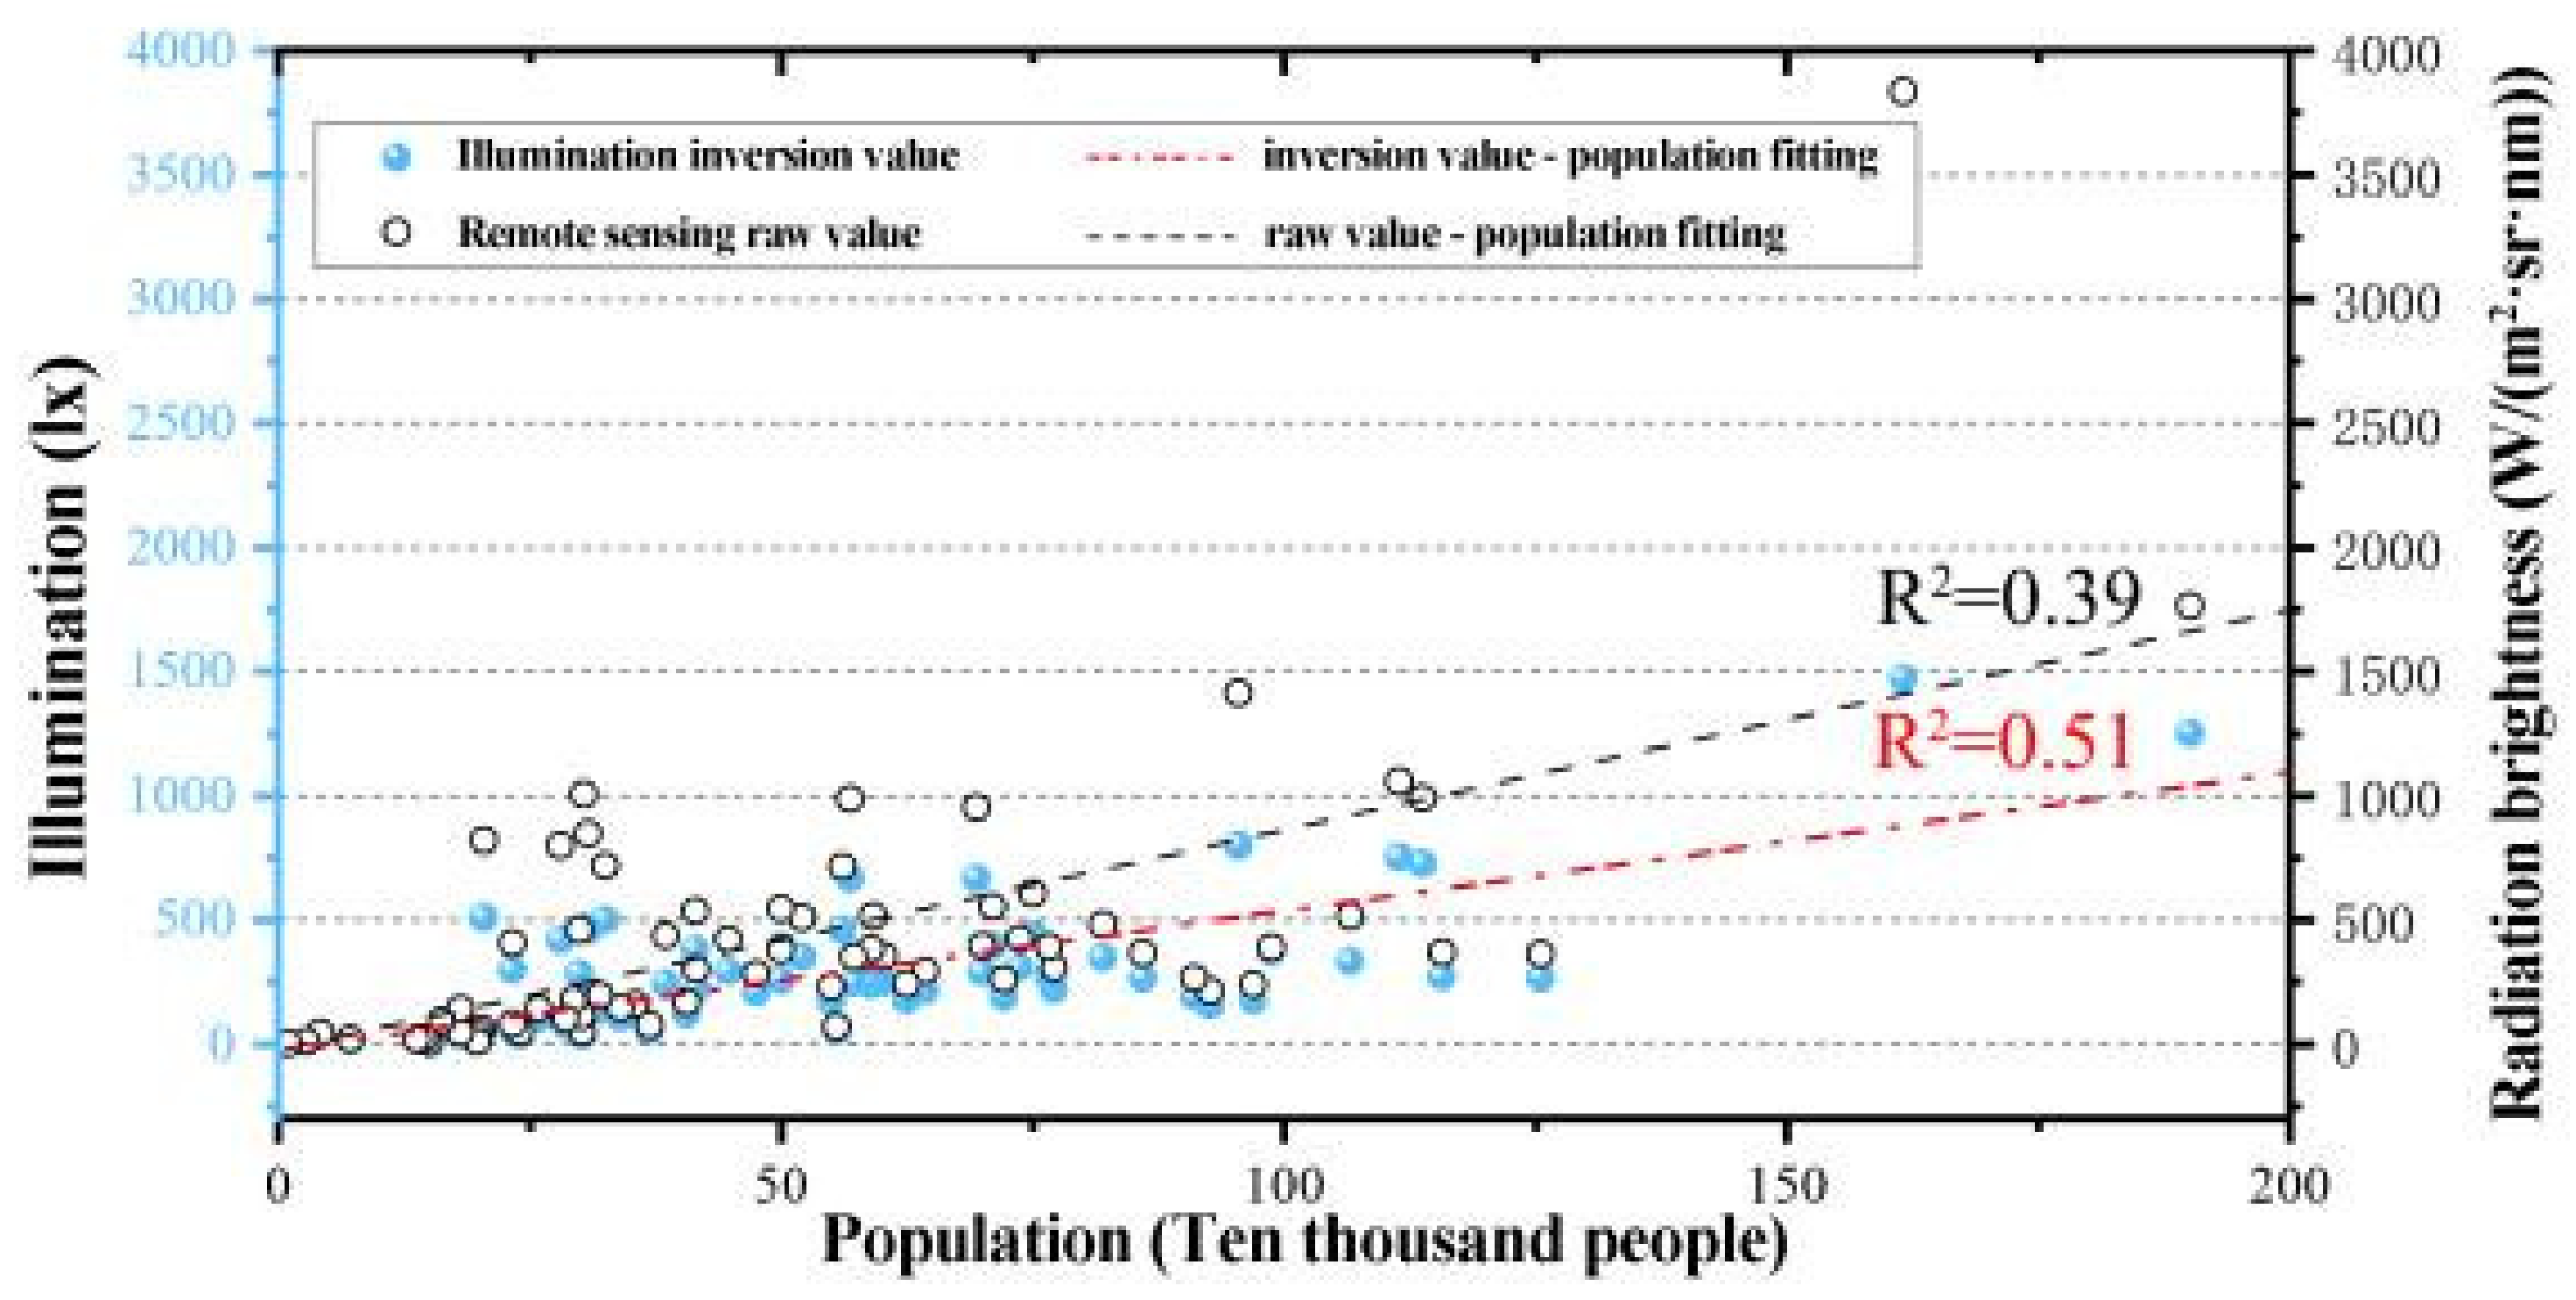
3.2.3. Model Validation
Verification of Population Data
Ground Data Processing Results
4. Discussion
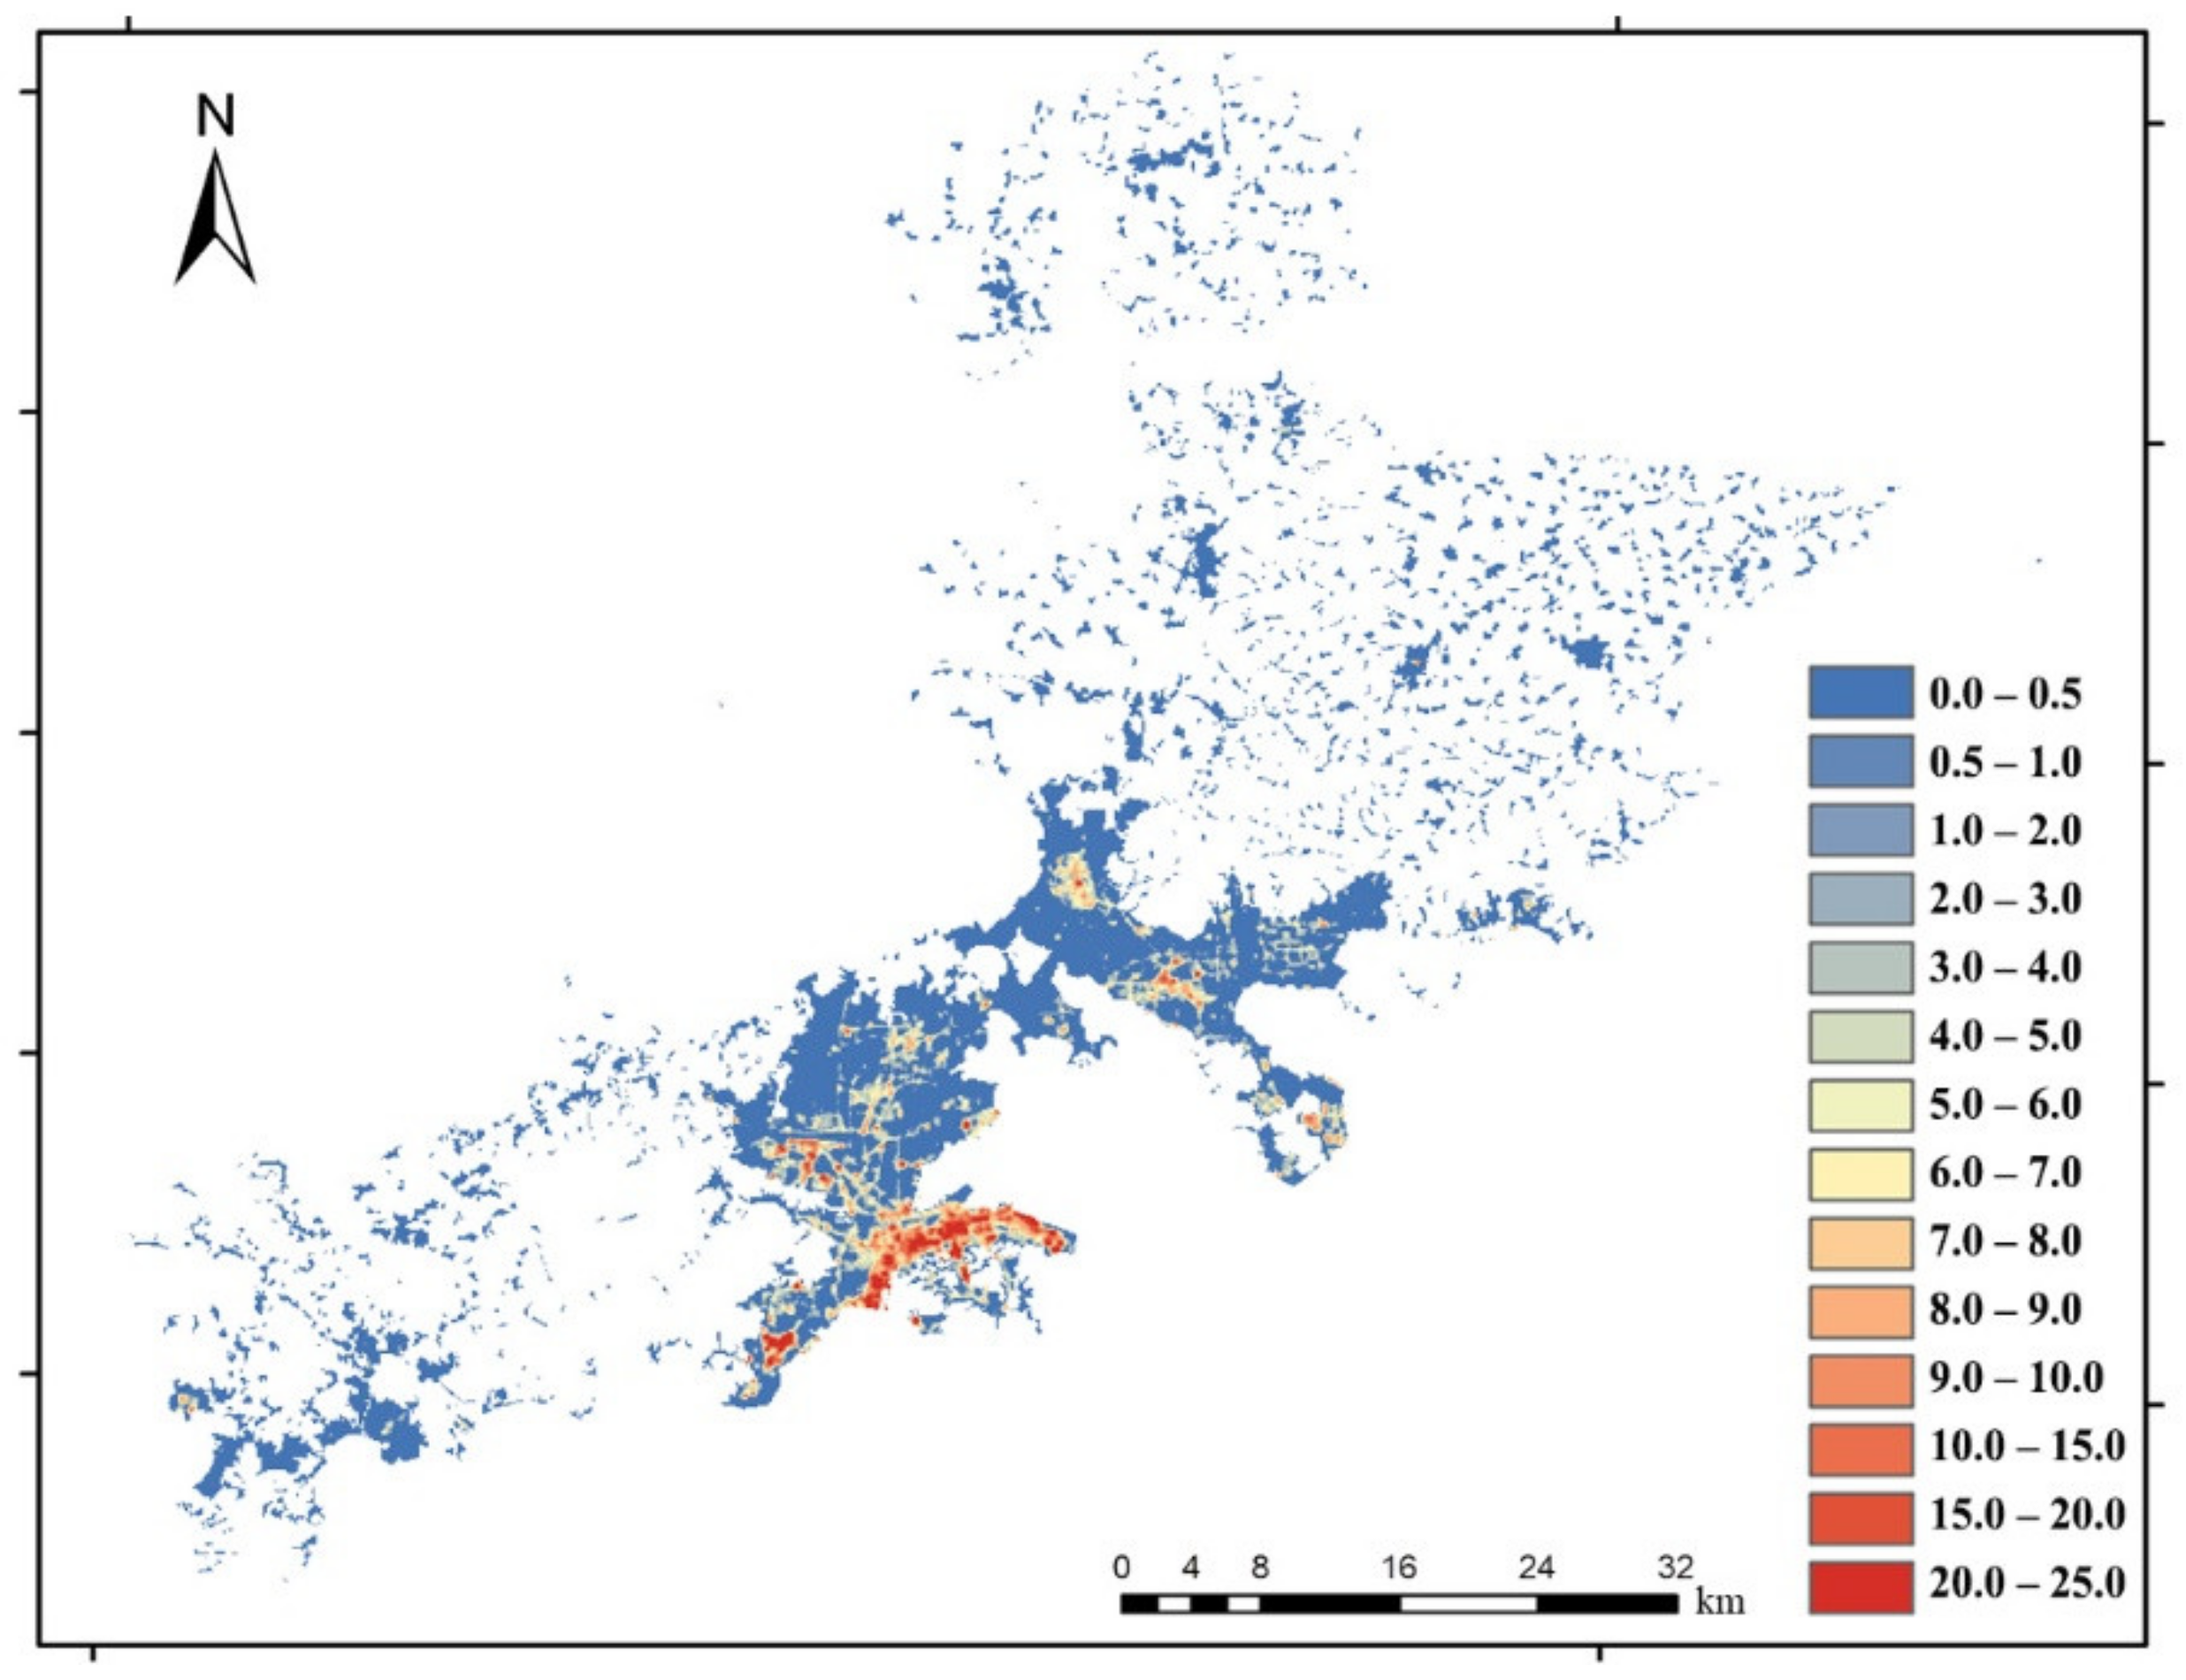
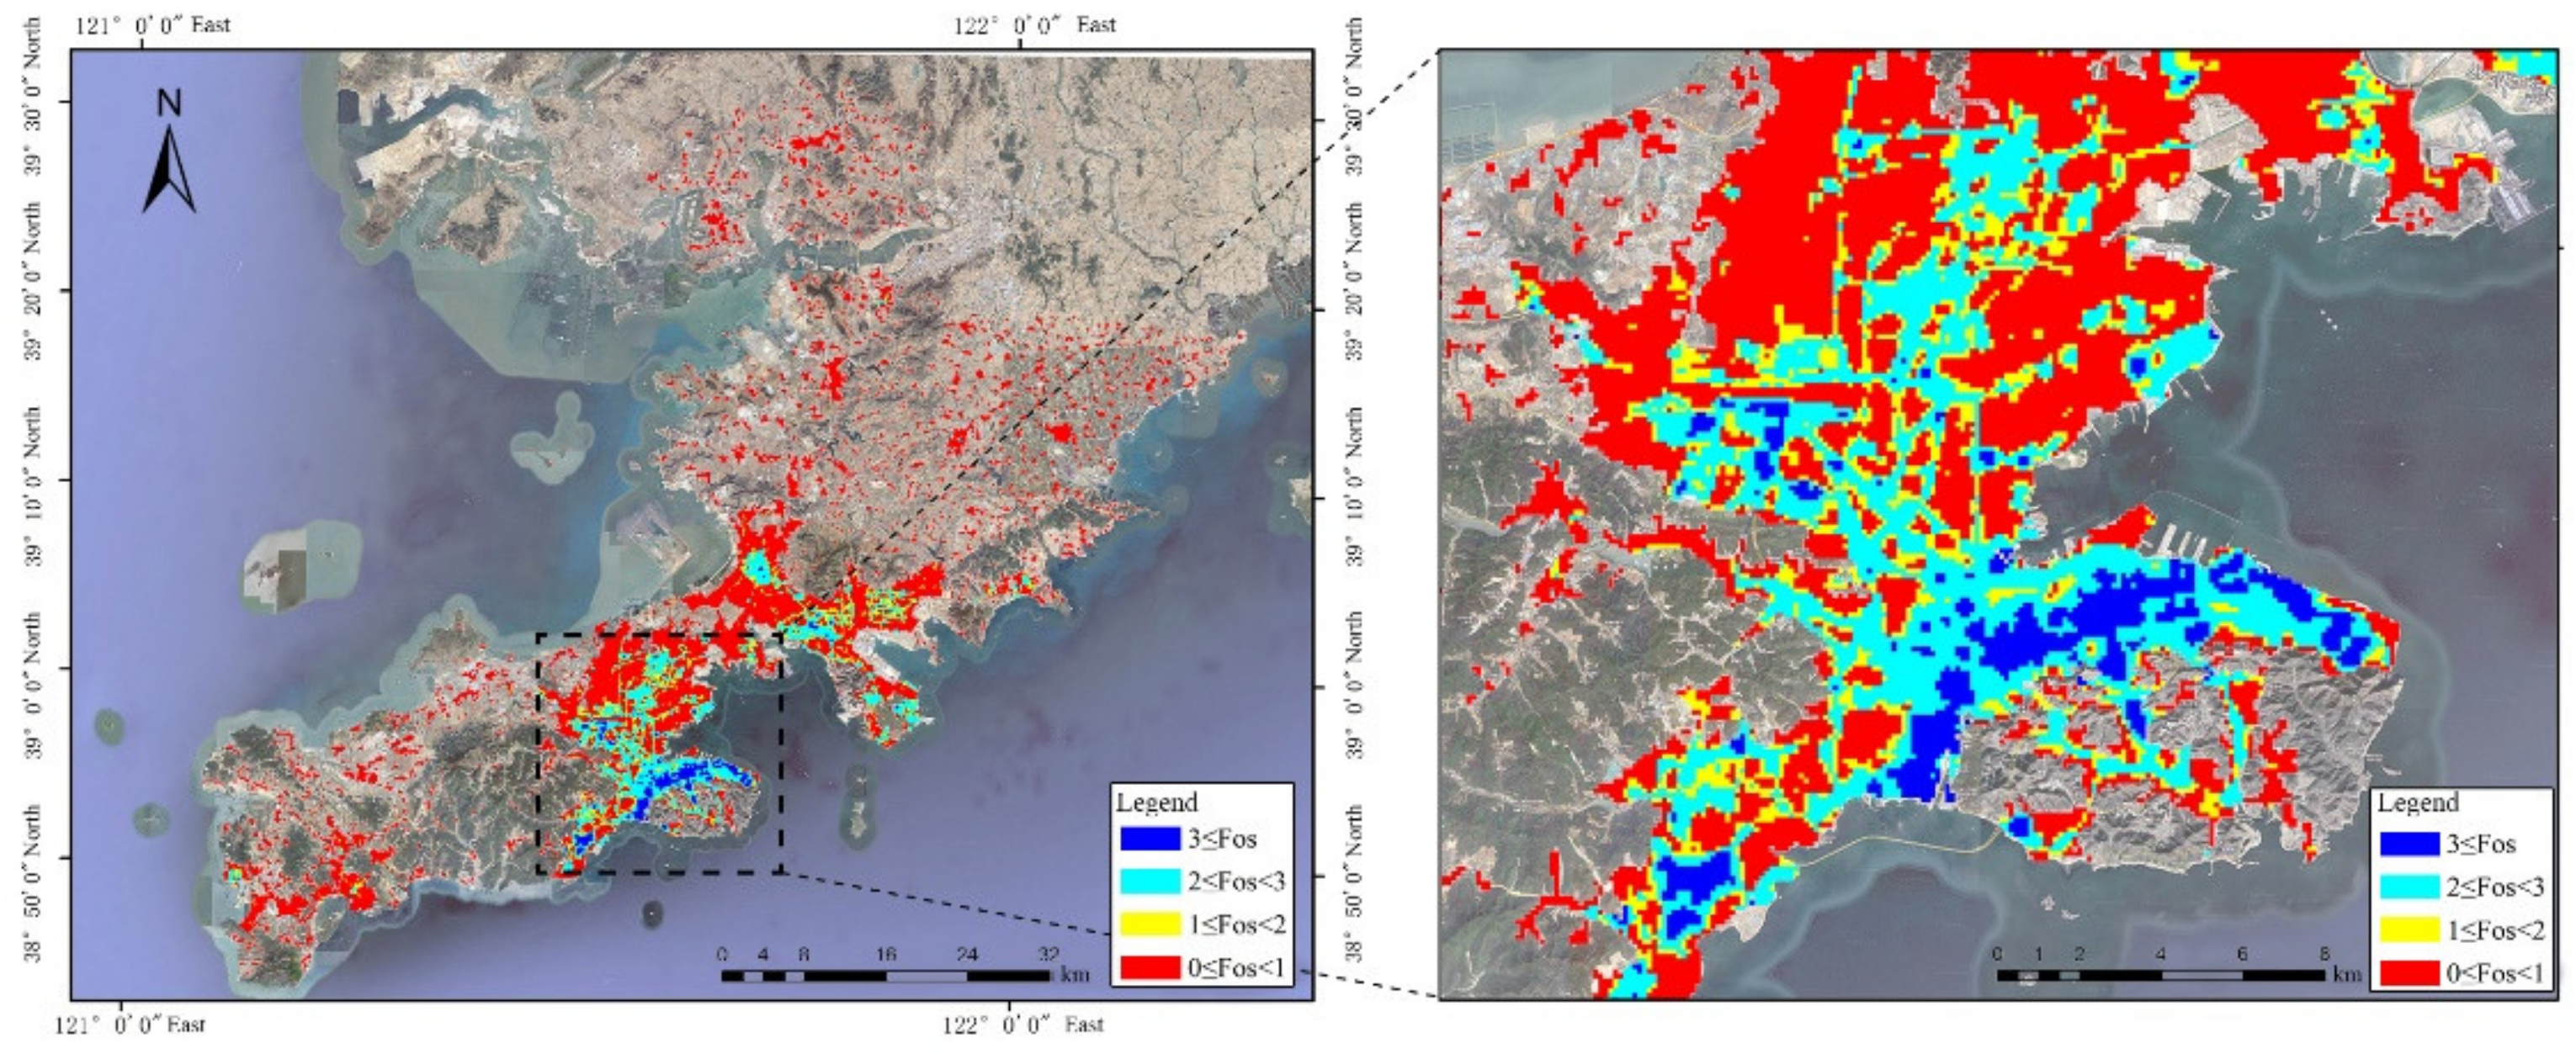
4.1. Safety Map
4.2. Urban Night Light Environment Risk Monitoring System Construction
4.3. Architectural Design Strategy
5. Conclusions
- (1)
- Spatial Distribution Characteristics of Ground Light Environment
- (2)
- Inversion Model Construction of Remote Sensing Data
Author Contributions
Funding
Acknowledgments
Conflicts of Interest
References
- Raap, T.; Sun, J.; Pinxten, R.; Eens, M. Disruptive effects of light pollution on sleep in free-living birds: Season and/or light intensity-dependent. Behav. Process. 2017, 144, 13–19. [Google Scholar] [CrossRef] [PubMed]
- Kloog, I.; Haim, A.; Stevens, R.G.; Portnov, B.A. Global Co-Distribution of Light at Night (LAN) and Cancers of Prostate, Colon, and Lung in Men. Chronobiol. Int. 2009, 26, 108–125. [Google Scholar] [CrossRef] [PubMed]
- Riegel, K.W. Light pollution. Science 1973, 179, 1285–1291. [Google Scholar] [CrossRef] [PubMed]
- Kyba, C.C.M.; Kuester, T.; Sanchez De Miguel, A.; Baugh, K.; Jechow, A.; Hoelker, F.; Bennie, J.; Elvidge, C.D.; Gaston, K.J.; Guanter, L. Artificially lit surface of Earth at night increasing in radiance and extent. Sci. Adv. 2017, 3, e1701528. [Google Scholar] [CrossRef] [Green Version]
- Ispas, N.; Trusca, D. Urban planning and traffic safety at night. In Proceedings of the IOP Conference Series-Materials Science and Engineering, Iasi, Romania, 9–10 June 2016. [Google Scholar]
- Tahar, M.R.; Kamarudin, F.; Umar, R.; Kamarudin, M.K.A.; Sabri, N.H.; Ahmad, K.; Rahim, S.A.; Baharim, M.S.A. Spatial Model of Sky Brightness Magnitude in Langkawi Island, Malaysia. Res. Astron. Astrophys. 2017, 17, 037. [Google Scholar] [CrossRef]
- Liu, M.; Yang, L. Comparison and Analysis of the Light Pollution Effect at Night in the Typical Commercial Areas of Milan and Dalian. China Illum. Eng. J. 2020, 31, 94–101. [Google Scholar]
- Puschnig, J.; Naeslund, M.; Schwope, A.; Wallner, S. Correcting sky-quality-meter measurements for ageing effects using twilight as calibrator. Mon. Not. R. Astron. Soc. 2021, 502, 1095–1103. [Google Scholar] [CrossRef]
- Kollath, Z.; Szaz, D.; Kollath, K.; Tong, K.P. Light Pollution Monitoring and Sky Colours. J. Imaging 2020, 6, 104. [Google Scholar] [CrossRef]
- Butt, M.J. Estimation of Light Pollution Using Satellite Remote Sensing and Geographic Information System Techniques. GISci. Remote Sens. 2012, 49, 609–621. [Google Scholar] [CrossRef]
- Netzel, H.; Netzel, P. High resolution map of light pollution over Poland. J. Quant. Spectrosc. Radiat. Transf. 2016, 181, 67–73. [Google Scholar] [CrossRef]
- Small, C.; Elvidge, C.D. Night on Earth: Mapping decadal changes of anthropogenic night light in Asia. Int. J. Appl. Earth Obs. 2013, 22, 40–52. [Google Scholar] [CrossRef] [Green Version]
- Jiang, W.; He, G.; Long, T. Using Time Series Nighttime Images to Measure Light Pollution Trend in China. Int. J. Environ. Sci. Dev. 2017, 8, 622–625. [Google Scholar] [CrossRef] [Green Version]
- Zhang, G.; Li, L.; Jiang, Y.; Shen, X.; Li, D. On-Orbit Relative Radiometric Calibration of the Night-Time Sensor of the LuoJia1-01 Satellite. Sensors 2018, 18, 4225. [Google Scholar] [CrossRef] [Green Version]
- Hao, Q. Research on Digital Observation and Spatial Model Construction of Multi-Dimensional Urban Nighttime Light Environment. Master’s Thesis, Dalian University of Technology, Dalian, China, 2019. [Google Scholar]
- Aube, M.; Simoneau, A. New features features to the night sky radiance model illumina: Hyperspectral support, improved obstacles and cloud reflection. J. Quant. Spectrosc. Radiat. Transf. 2018, 211, 25–34. [Google Scholar] [CrossRef]
- Roychowdhury, K.; Jones, S.D.; Arrowsmith, C.; Reinke, K. A Comparison of High and Low Gain DMSP/OLS Satellite Images for the Study of Socio-Economic Metrics. IEEE J. Sel. Top. Appl. Earth Obs. Remote Sens. 2011, 4, 35–42. [Google Scholar] [CrossRef]
- Katz, Y.; Levin, N. Quantifying urban light pollution—A comparison between field measurements and EROS-B imagery. Remote Sens. Environ. 2016, 177, 65–77. [Google Scholar] [CrossRef]
- Li, J.; Xu, Y.; Cui, W.; Ji, M.; Su, B.; Wu, Y.; Wang, J. Investigation of Nighttime Light Pollution in Nanjing, China by Mapping Illuminance from Field Observations and Luojia 1-01 Imagery. Sustainability 2020, 12, 681. [Google Scholar] [CrossRef] [Green Version]
- Liao, Z. Research on Land Surface Temperature Inversion Based on Surface Sensor Data and Remote Sensing Data. Master’s Thesis, China University of Mining and Technology, Beijing, China, 2014. [Google Scholar]
- Kuechly, H.U.; Kyba, C.C.M.; Ruhtz, T.; Lindemann, C.; Wolter, C.; Fischer, J.; Hoelker, F. Aerial survey and spatial analysis of sources of light pollution in Berlin, Germany. Remote Sens. Environ. 2012, 126, 39–50. [Google Scholar] [CrossRef]
- Tan, H.; Liu, P.; Li, B. Perception of Tourism Destination Image in Dalian Based on Network Text Analysis. Econ. Geogr. 2021, 41, 231–239. [Google Scholar]
- Hubei Data and Application Network. Available online: http://www.hbeos.org.cn (accessed on 1 August 2019).
- The Luojia-La Scientific Experimental Satellite was Successfully Launched. Available online: http://www.lmars.whu.edu.cn/index.php/en/researchnews/2169.html (accessed on 1 August 2019).
- Jiang, W.; He, G.; Long, T.; Guo, H.; Yin, R.; Leng, W.; Liu, H.; Wang, G. Potentiality of Using Luojia 1-01 Nighttime Light Imagery to Investigate Artificial Light Pollution. Sensors 2018, 18, 2900. [Google Scholar] [CrossRef] [Green Version]
- Jiang, P.; Zeng, Z.; Chen, J.; Huang, T. Generalized Regression Neural Networks with K-Fold Cross-Validation for Displacement of Landslide Forecasting. In Advances in Neural Networks, Proceedings of the International Symposium on Neural Networks, Hong Kong, China, 28 November–1 December 2014; Springer: Cham, Switzerland, 2014; pp. 533–541. [Google Scholar]
- Freire, A.L.; Rocha-Neto, A.R.; Barreto, G.A. On robust randomized neural networks for regression: A comprehensive review and evaluation. Neural Comput. Appl. 2020, 32, 16931–16950. [Google Scholar] [CrossRef]
- Dailian Municipal Bureau of Statistics. Available online: https://stats.dl.gov.cn/col/col3811/index.html (accessed on 1 August 2019).
- Li, Y.; Chen, A.; Zhou, Y.; Zou, N.; He, X.; Wang, J. Research on the assessment indicators for crime prevention lighting in residential areas based on AHP and Entropy Weight. In Proceedings of the MATEC Web of Conferences, Amsterdam, The Netherlands, 28 June 2016. [Google Scholar]
- Fotios, S.; Unwin, J.; Farrall, S. Road lighting and pedestrian reassurance after dark: A review. Lighting Res. Technol. 2015, 47, 449–469. [Google Scholar] [CrossRef] [Green Version]


| Window | Parameter | Luojia-01 Correlation Analysis of Remote Sensing Data | |
|---|---|---|---|
| The Correlation Coefficient of Pearson | p Value | ||
| Illuminance | Upper Window | 0.897 ** | 0.000 |
| Horizontal Window | 0.872 ** | 0.000 | |
| Lower Window | 0.567 ** | 0.000 | |
| Magnitude of brightness | Upper Window | −0.425 ** | 0.000 |
| Horizontal Window | −0.477 ** | 0.000 | |
| Lower Window | −0.428 ** | 0.000 | |
| Brightness | Upper Window | 0.373 ** | 0.000 |
| Horizontal Window | 0.256 ** | 0.001 | |
| Lower Window | 0.357 ** | 0.000 | |
| Combination Name | Correction Set | Validation Set |
|---|---|---|
| Combination 1 | Group A, Group B, Group C | Group D |
| Combination 2 | Group A, Group C, Group D | Group B |
| Combination 3 | Group A, Group B, Group D | Group C |
| Combination 4 | Group B, Group C, Group D | Group A |
| Check the Numerical | Type of Regression Model | Combination 1 | Combination 2 | Combination 3 | Combination 4 |
|---|---|---|---|---|---|
| Power function | RMSE | 1.69 | 1.99 | 1.23 | 1.08 |
| MRE | 59.71 | 66.53 | 49.81 | 65.50 | |
| Quadratic polynomial | RMSE | 1.77 | 3.41 | 1.55 | 1.67 |
| MRE | 144.72 | 217.20 | 101.60 | 159.38 | |
| Cubic polynomial | RMSE | 1.17 | 1.09 | 1.11 | 1.00 |
| MRE | 100.23 | 161.06 | 76.95 | 115.15 | |
| Logarithmic function | RMSE | 2.47 | 4.49 | 2.23 | 2.32 |
| MRE | 241.89 | 379.94 | 70.36 | 117.17 |
| Name | Related Parameters | Total Population | Total Radiant Brightness W/(m2·sr·nm) | Total Inversion Illuminance (lx) |
|---|---|---|---|---|
| Total population | Correlation coefficient | 1 | 0.626 ** | 0.714 ** |
| p value (double-tailed) | 0.000 | 0.000 | ||
| Total radiant brightness | Correlation coefficient | 0.626 ** | 1 | 0.945** |
| p value (double-tailed) | 0.000 | 0.00 | ||
| Inversion of the total illuminance | Correlation coefficient | 0.714 ** | 0.945 ** | 1 |
| p value (double-tailed) | 0.000 | 0.000 | ||
| Number of samples | 72 | 72 | 72 |
Publisher’s Note: MDPI stays neutral with regard to jurisdictional claims in published maps and institutional affiliations. |
© 2022 by the authors. Licensee MDPI, Basel, Switzerland. This article is an open access article distributed under the terms and conditions of the Creative Commons Attribution (CC BY) license (https://creativecommons.org/licenses/by/4.0/).
Share and Cite
Zhang, B.; Li, Y.; Liu, M.; Liu, Y.; Luo, T.; Liu, Q.; Feng, L.; Jiao, W. Research on Inversion and Correction Method of Urban Light Environment Based on Cooperative Observation. Remote Sens. 2022, 14, 2888. https://doi.org/10.3390/rs14122888
Zhang B, Li Y, Liu M, Liu Y, Luo T, Liu Q, Feng L, Jiao W. Research on Inversion and Correction Method of Urban Light Environment Based on Cooperative Observation. Remote Sensing. 2022; 14(12):2888. https://doi.org/10.3390/rs14122888
Chicago/Turabian StyleZhang, Baogang, Yiwei Li, Ming Liu, Yuchuan Liu, Tong Luo, Qingyuan Liu, Lie Feng, and Weili Jiao. 2022. "Research on Inversion and Correction Method of Urban Light Environment Based on Cooperative Observation" Remote Sensing 14, no. 12: 2888. https://doi.org/10.3390/rs14122888