
Monitoring Ecological Conditions by Remote Sensing and Social Media Data—Sanya City (China) as Case Study
by
 ,
,
Tengfei Yang
1,2 ,
,
Jibo Xie
1,2,*,
Peilin Song
1,2,3,
Guoqing Li
1,2,
Naixia Mou
3,
Xinyue Gao
1,2,3 and
Jing Zhao
2 1
Key Laboratory of Earth Observation of Hainan Province, Hainan Research Institute, Aerospace Information Research Institute, Chinese Academy of Sciences, Sanya 572000, China
2
Aerospace Information Research Institute, Chinese Academy of Sciences, Beijing 100094, China
3
College of Geomatics, Shandong University of Science and Technology, Qingdao 266590, China
*
Author to whom correspondence should be addressed.
Remote Sens. 2022, 14(12), 2824; https://doi.org/10.3390/rs14122824
Submission received: 4 May 2022
/
Revised: 6 June 2022
/
Accepted: 11 June 2022
/
Published: 12 June 2022
(This article belongs to the Special Issue Environmental Health Diagnosis Based on Remote Sensing)
Abstract
:The ecological environment is the basis of human survival and development. Effective methods to monitor the ecological environment are essential for the healthy development of human settlements. At present, methods based on remote sensing images and other basic data have played key roles in ecological environment monitoring, providing support for decision-making on local ecological environment protection. However, these data and methods have obvious limitations. On the one hand, they cannot reflect the feelings of human beings about the ecological environment in which they live. On the other hand, it is difficult to capture more detailed information about the ecological environment. Non-professional observation data represented by social media describe the ecological environment from the perspective of the public, which can be a powerful supplement to traditional data. However, these different data sources have their own characteristics and forms, and it is difficult to achieve efficient integration. Therefore, in this paper, we proposed a framework that comprehensively considers social media, remote sensing, and other data to monitor the ecological environment of a study area. First, the framework extracted the ecological environment-related information contained in social media data, including public sentiment information and topic keyword information, by integrating algorithms such as natural language processing and machine learning. Then, we constructed a social semantic network related to the ecological environment based on the extracted information. We used a remote sensing image and other basic data to analyze the ecological sensitivity in the study area. Finally, based on the keyword with spatial location attribute contained in the social semantic network, we established the link between the constructed network and the results of ecological sensitivity analysis to comprehensively analyze the ecological environment in the study area. The comprehensive analysis results not only reflect the distribution of ecological vulnerability in the study area, but also help identify specific areas worthy of attention and the ecological problems faced by these areas. We used the city of Sanya in China as a case study to verify the effectiveness of the method in this paper.
1. Introduction
The continuous intensification of human activities has brought unprecedented pressure to the healthy development of the ecological environment. It has caused a series of serious ecological environmental problems, such as abnormal climate change, the destruction of biodiversity, etc., which threaten the sustainable development of society. With the development of science and technology, the Earth observation technologies represented by remote sensing play an important role in ecological environment monitoring. Compared to statistical data or land use data, remote sensing data can provide long time series and large-scale image information on the monitoring area [1], which has greatly promoted the improvement of the efficiency of ecological environment monitoring.
However, remote sensing images and other basic data only intuitively describe the state of the ecological environment. It is difficult for these images and data to reflect the specific problems related to the ecological environment and whether the public is satisfied with the ecological environment where they live. This information is important for decision-making. Some researchers have tried to use questionnaires to gather public feedback on the ecological environment [2], such as Internet surveys, telephone interviews, etc., which make up for the lack of traditional data to a certain extent. However, these methods also have certain disadvantages. For example, the network survey method, which is one of the more popular methods at present, invites the public to answer specific questions by distributing an online questionnaire. This method has many shortcomings, such as weak sample representation and low population coverage [3], and the form of passive acceptance may even lead to public distrust. With the popularity of mobile devices and the development of network facilities, non-professional observational data represented by social media have entered public life. Anyone with a mobile phone can upload what they have seen and heard, or even what they feel and think, to social media platforms anytime and anywhere. This is a spontaneous, proactive form of data upload. Moreover, social media has a large user base, which guarantees the quantity and coverage of the data. For example, as of 2018, the Sina microblog, which is the largest social media platform in China, had 523 million monthly active users [4].
Some scholars have used social media data to study the ecological environment. For example, Emily M. Cody et al. [5] used public sentiment analysis to process Twitter data containing the word “climate” collected between September 2008 and July 2014, and the results reflected public attitudes towards different climate themes. Based on Twitter data, Hywel T. P. Williams et al. [6] built a social network related to the topic of global climate change. Combined with the public sentiment information contained in the data, they effectively mined the distribution characteristics of people with different views in the social network. By studying the correlation between social media data and air quality data, Wang Shiliang et al. [7] quantitatively found that the amount of social media can reflect the real level of particulate pollution, and these data can also provide more information related to air quality. Although related research has achieved some results, it is still insufficient. On the one hand, most of the research is related to the atmosphere, while studies on other topics, such as the actual human habitation environment, are relatively rare. On the other hand, few research works integrate multi-source heterogeneous data to serve ecological environment monitoring, especially social media data and remote sensing images. These different data sources have their advantages and can glean more ecological environment information from different perspectives.
Here, we attempted to combine social media with remote sensing to effectively monitor human settlements, which was also an effective exploration of multi-source data integration in ecological environment monitoring. In this process, the first problem we solve is establishing the connection between multi-source heterogeneous data, as these data have different structures and characteristics, especially data from social media. Social media data often exist in an unstructured form, making it difficult to integrate them with other professional observation data. Thus, in this paper, we propose a framework to try to solve these problems. Firstly, we used natural language processing and machine learning to extract information related to the ecological environment contained in social media data, such as public sentiment information, hotspots of public attention (keywords in social media), etc., which effectively structured social media data. Then, we constructed an ecological environment-related social semantic network based on the extracted information. This network can relay the public’s attitudes and concerns about the ecological environment in which they live. Secondly, we combined remote sensing and other basic data to calculate the ecological sensitivity in the study area. Finally, based on some nodes with spatial location information in the social semantic network, we realized the link between the constructed network and the ecological sensitivity analysis results. This link helped us to evaluate the overall ecological environment of the study area from different perspectives and excavated some areas with more prominent ecological environment problems, serving to improve the monitoring efficiency of the ecological environment and assist decision making. We selected Sanya, China, as a case study to verify the effectiveness of the framework proposed in this paper.
2. Study Area and Data
2.1. Study Area
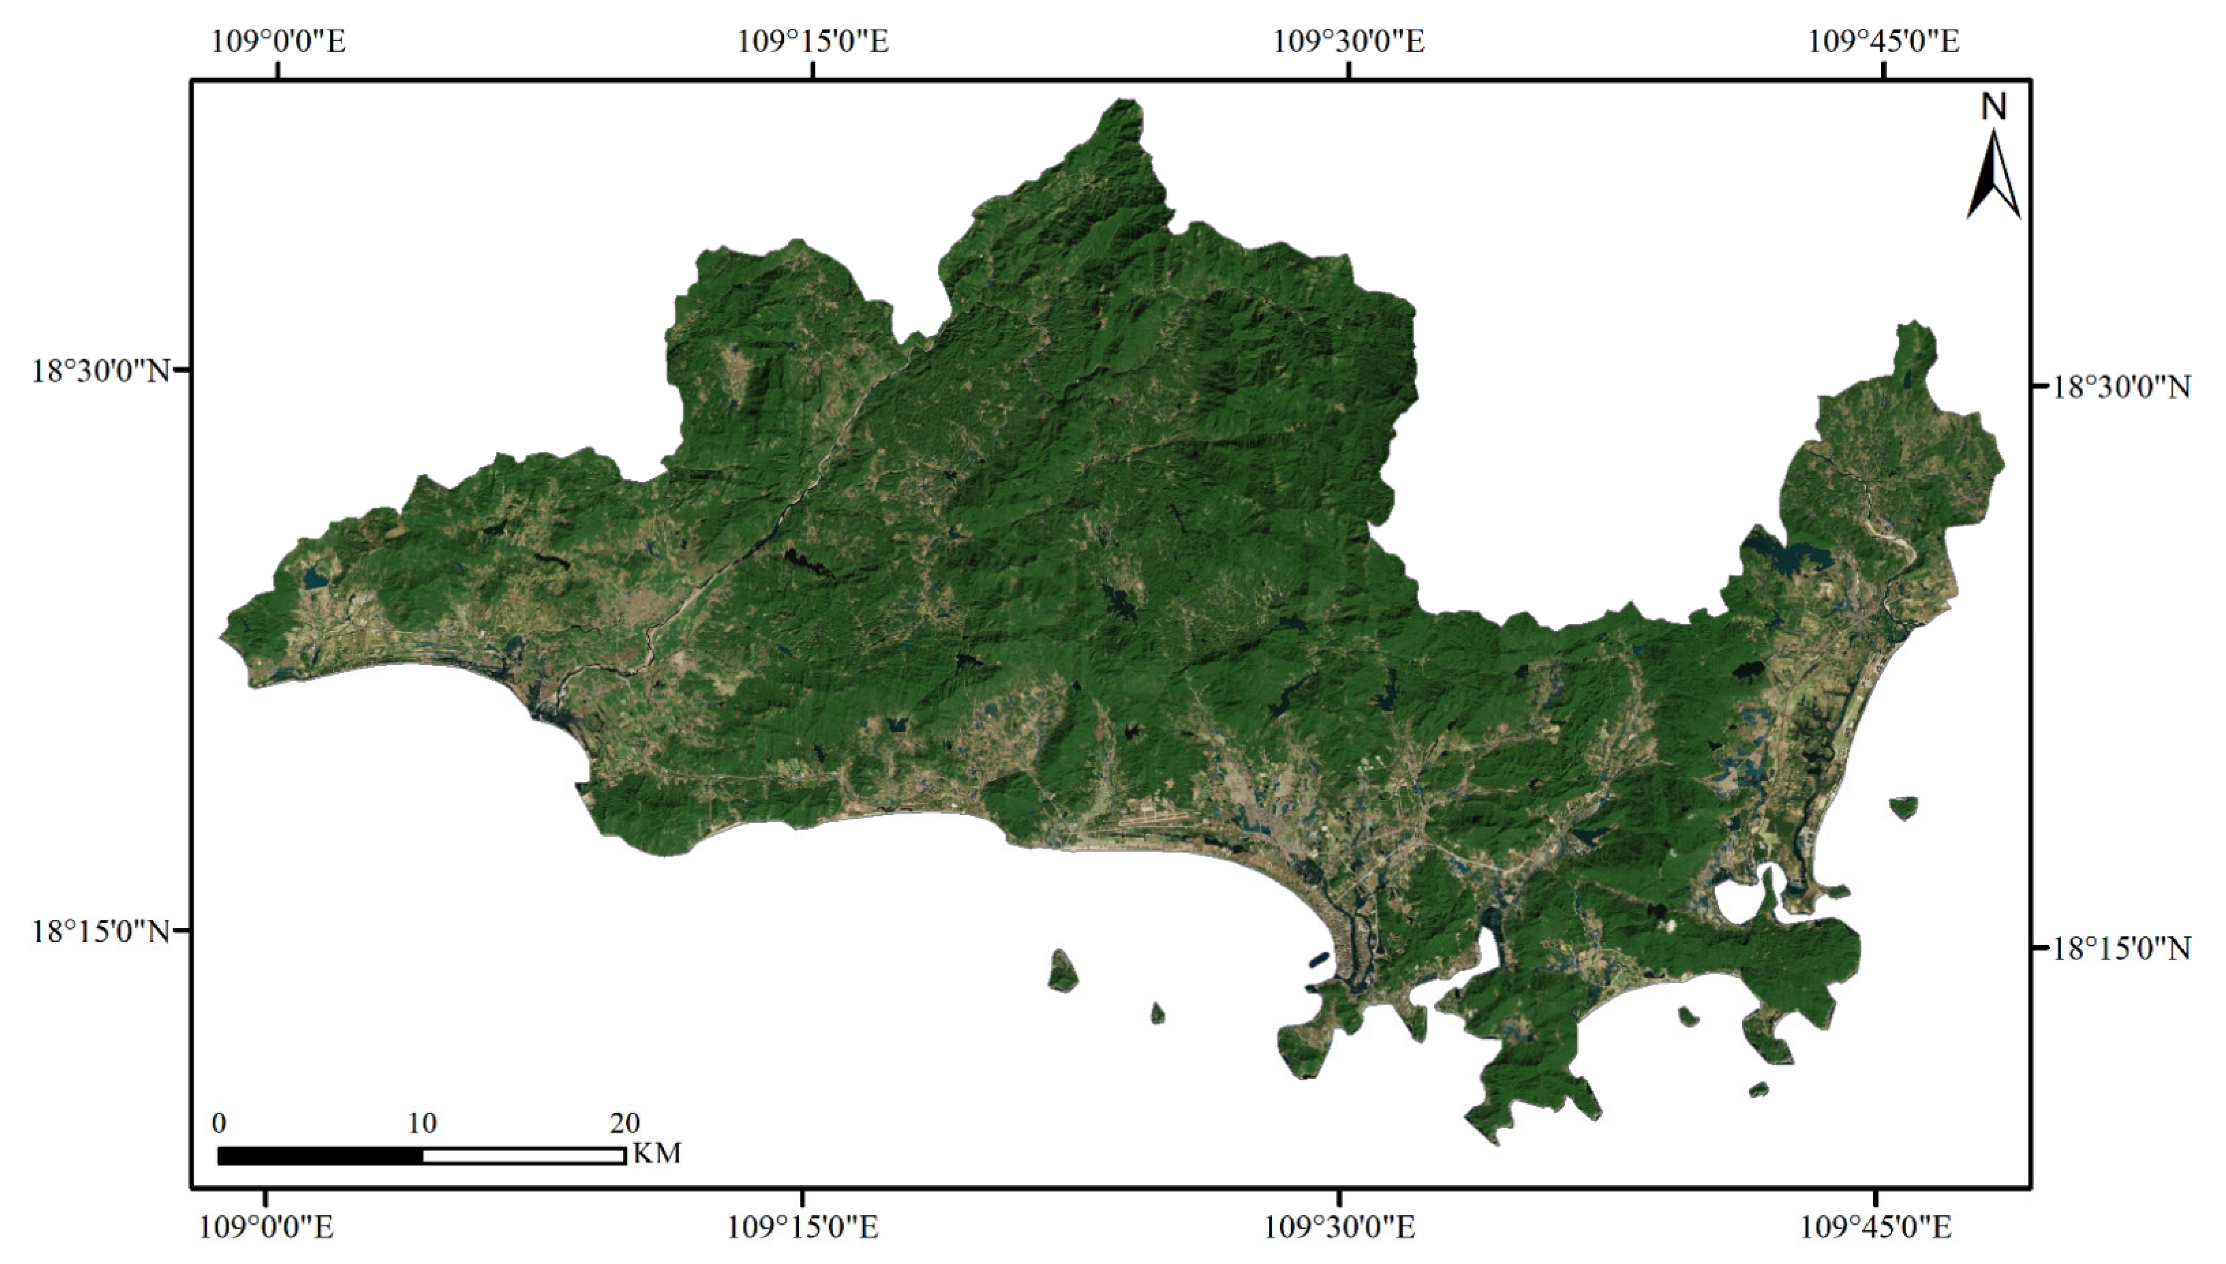
We took the city of Sanya in China as the study area, as shown in Figure 1. This city is located at the southernmost tip of Hainan Province on Hainan Island, the second largest island in China. Geographically, it is located on the northern edge of the tropics. Sanya is rich in natural resources, hydrological resources, and landforms, attracting many tourists from all over the world every year.
2.2. Data
2.2.1. Remote Sensing Image and Other Basic Data
For ecological sensitivity analysis, it is necessary to select appropriate evaluation indicators and determine the weight of each indicator. This process should be adapted to local conditions. Generally, the natural conditions and human activities in different areas are not the same, so the factors that affect the ecological environment are also different. In this study, we drew on the research results in the literature [8] and used nine indicators, including slope, elevation, aspect, vegetation coverage, land use type, soil erosion intensity, population density distribution, and road accessibility distribution, to analyze ecological sensitivity in Sanya. The data involved were as follows.
Remote sensing image: We used DEM data to calculate slope, slope direction, and elevation. The image is the 30-meter resolution data from SRTM Digital Elevation. A Landsat 8 image was selected to help analyze vegetation coverage and land use type. These data are from the GEE (Google Earth Engine) platform and were produced in 2018, covering the entire city of Sanya.
Other basic data: Based on the evaluation indicators, we obtained a variety of basic data, including soil data, road network data, population density data, and precipitation data. Among them, the soil data are from the National Tibetan Plateau/Third Pole Environment Data Center (http://data.tpdc.ac.cn/, accessed on 15 March 2022). The road network data are from the Open Street Map platform (https://wordpress.org/plugins/osm/, accessed on 15 March 2022). The precipitation data are from the National Oceanic and Atmospheric Administration (https://www.ngdc.noaa.gov/, accessed on 15 March 2022). The population density data are from WorldPop (https://dx.doi.org/10.5258/SOTON/WP00660, accessed on 15 March 2022).
2.2.2. Social Media Data
We obtained social media data from the Sina microblog. Based on the advanced search platform of Sina, we developed a data acquisition tool. By setting some parameters, including keywords and time, we could obtain social media data related to the specified time period, focus area, and theme. The keyword parameters included “Sanya ecology” and “Sanya environment”, and the time parameter was 2018. Through data deduplication, we finally yielded a total of 3431 social media data points.
3. Methods
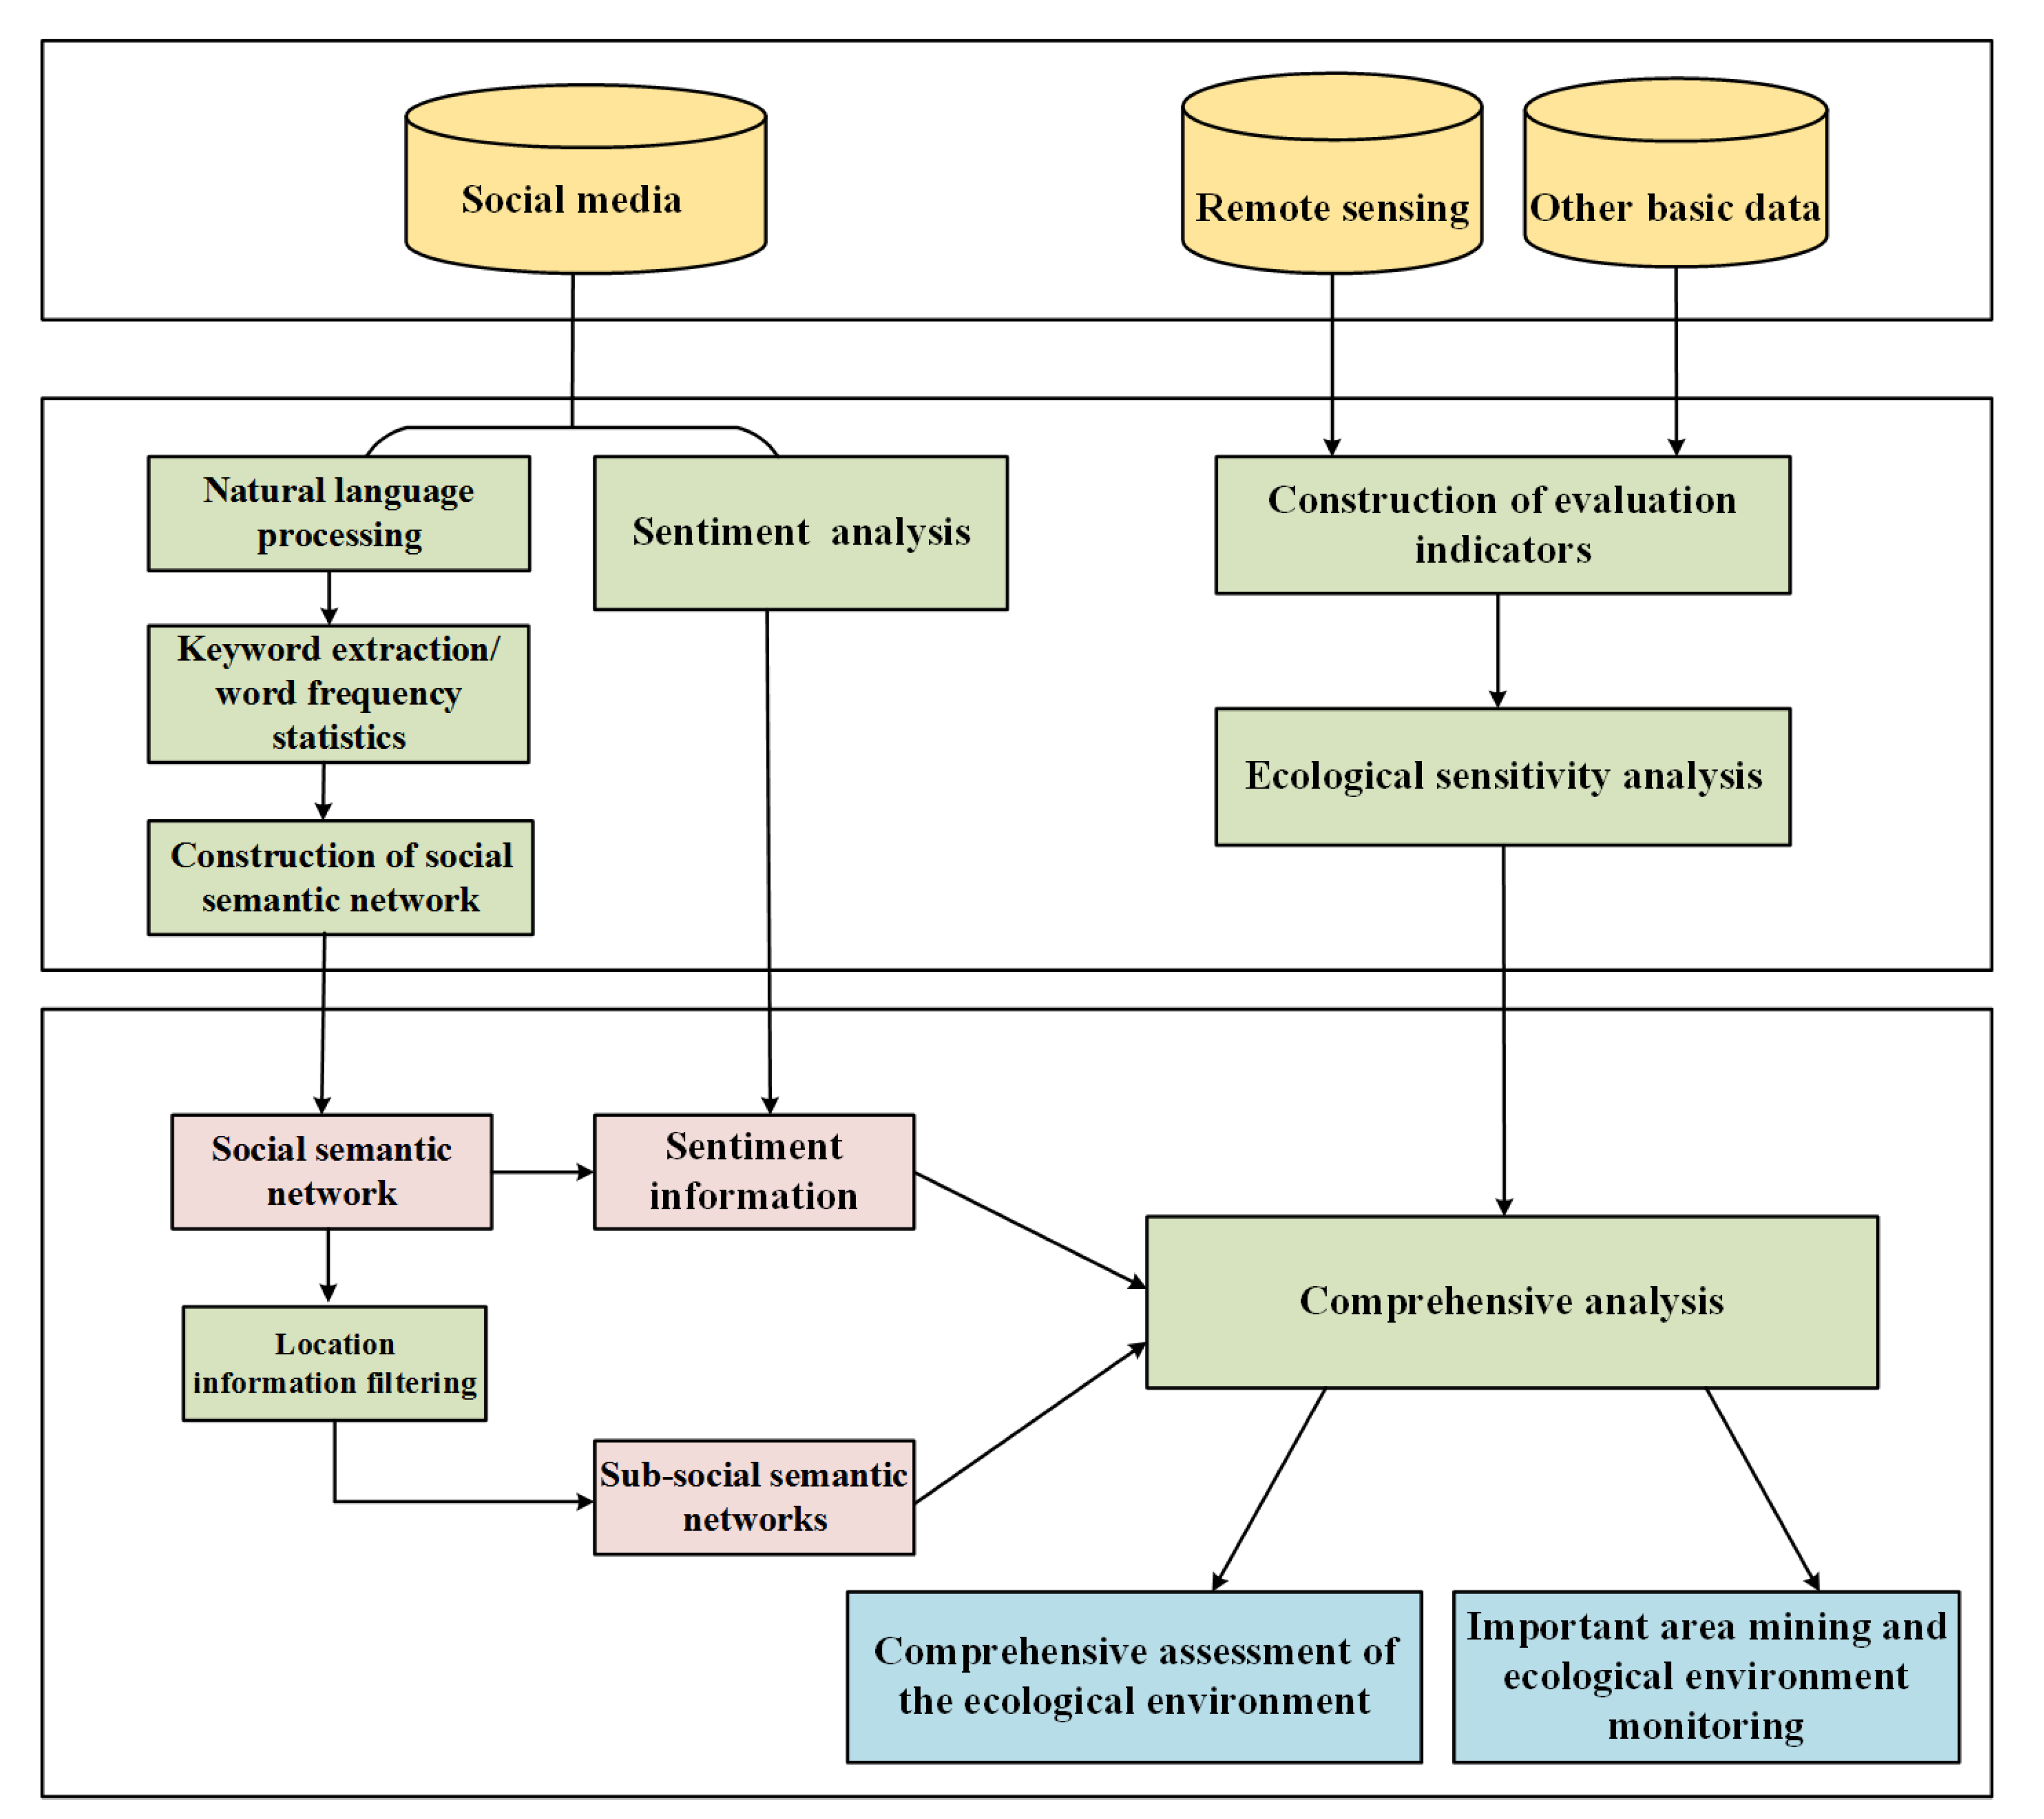
We proposed a framework that integrates algorithms including natural language processing, sentiment analysis, network analysis, etc., to deal with social media data. Then, we combined the processed social media data with the remote sensing image and other basic data to evaluate the ecological environment of the study area in detail. The overall process of the framework is shown in Figure 2.
3.1. Ecological Sensitivity Analysis Based on Remote Sensing Imagery and Other Basic Data
Ecological sensitivity can indicate the probability that an ecological system is affected by human activities and environmental changes [9]. It reflects the possible risks to the ecological environment in the designated area [10,11]. In this paper, we used the method described in Ref. [8] to analyze the ecological sensitivity in the study area. The overall process mainly included the construction of evaluation indicators and ecological sensitivity analysis.
3.1.1. Construction of Evaluation Indicators
There are many factors that must be considered in determining the evaluation indicators, such as the local natural conditions, human activities, and the ecological topic to be studied. For example, Yilmaz et al. [12] selected 9 indicators including water buffer zone and soil to analyze and evaluate the ecological sensitivity of a river basin. Symeonakise et al. [13] took land degradation in Europe as the research topic and used 5 indicators, namely, climate, vegetation, soil, groundwater, and socio-economic quality, to study ecological sensitivity. Liu L et al. [14] used 4 natural factors (i.e., rainfall, soil texture, slope, and vegetation coverage) and 2 human activity factors (i.e., population density and GDP) to fully evaluate the soil erosion situation in the Loess Plateau in China.
In this paper, based on literature research and comprehensive consideration of the ecological status in Sanya, we selected 9 evaluation indicators, including slope, elevation, slope direction, water body, vegetation coverage, land use type, soil erosion intensity, population density distribution, and accessibility distance. Furthermore, we gave different weights to these indicators according to their importance. Relevant methods include the analytic hierarchy process [15,16], entropy weight method [17,18,19], and coefficient of variation [20,21,22]. These methods have their own characteristics, and we selected the analytic hierarchy process as our final method. The relevant calculation process can be found in Ref. [8]. The weight of each indicator is shown in Table 1.
3.1.2. Ecological Sensitivity Analysis
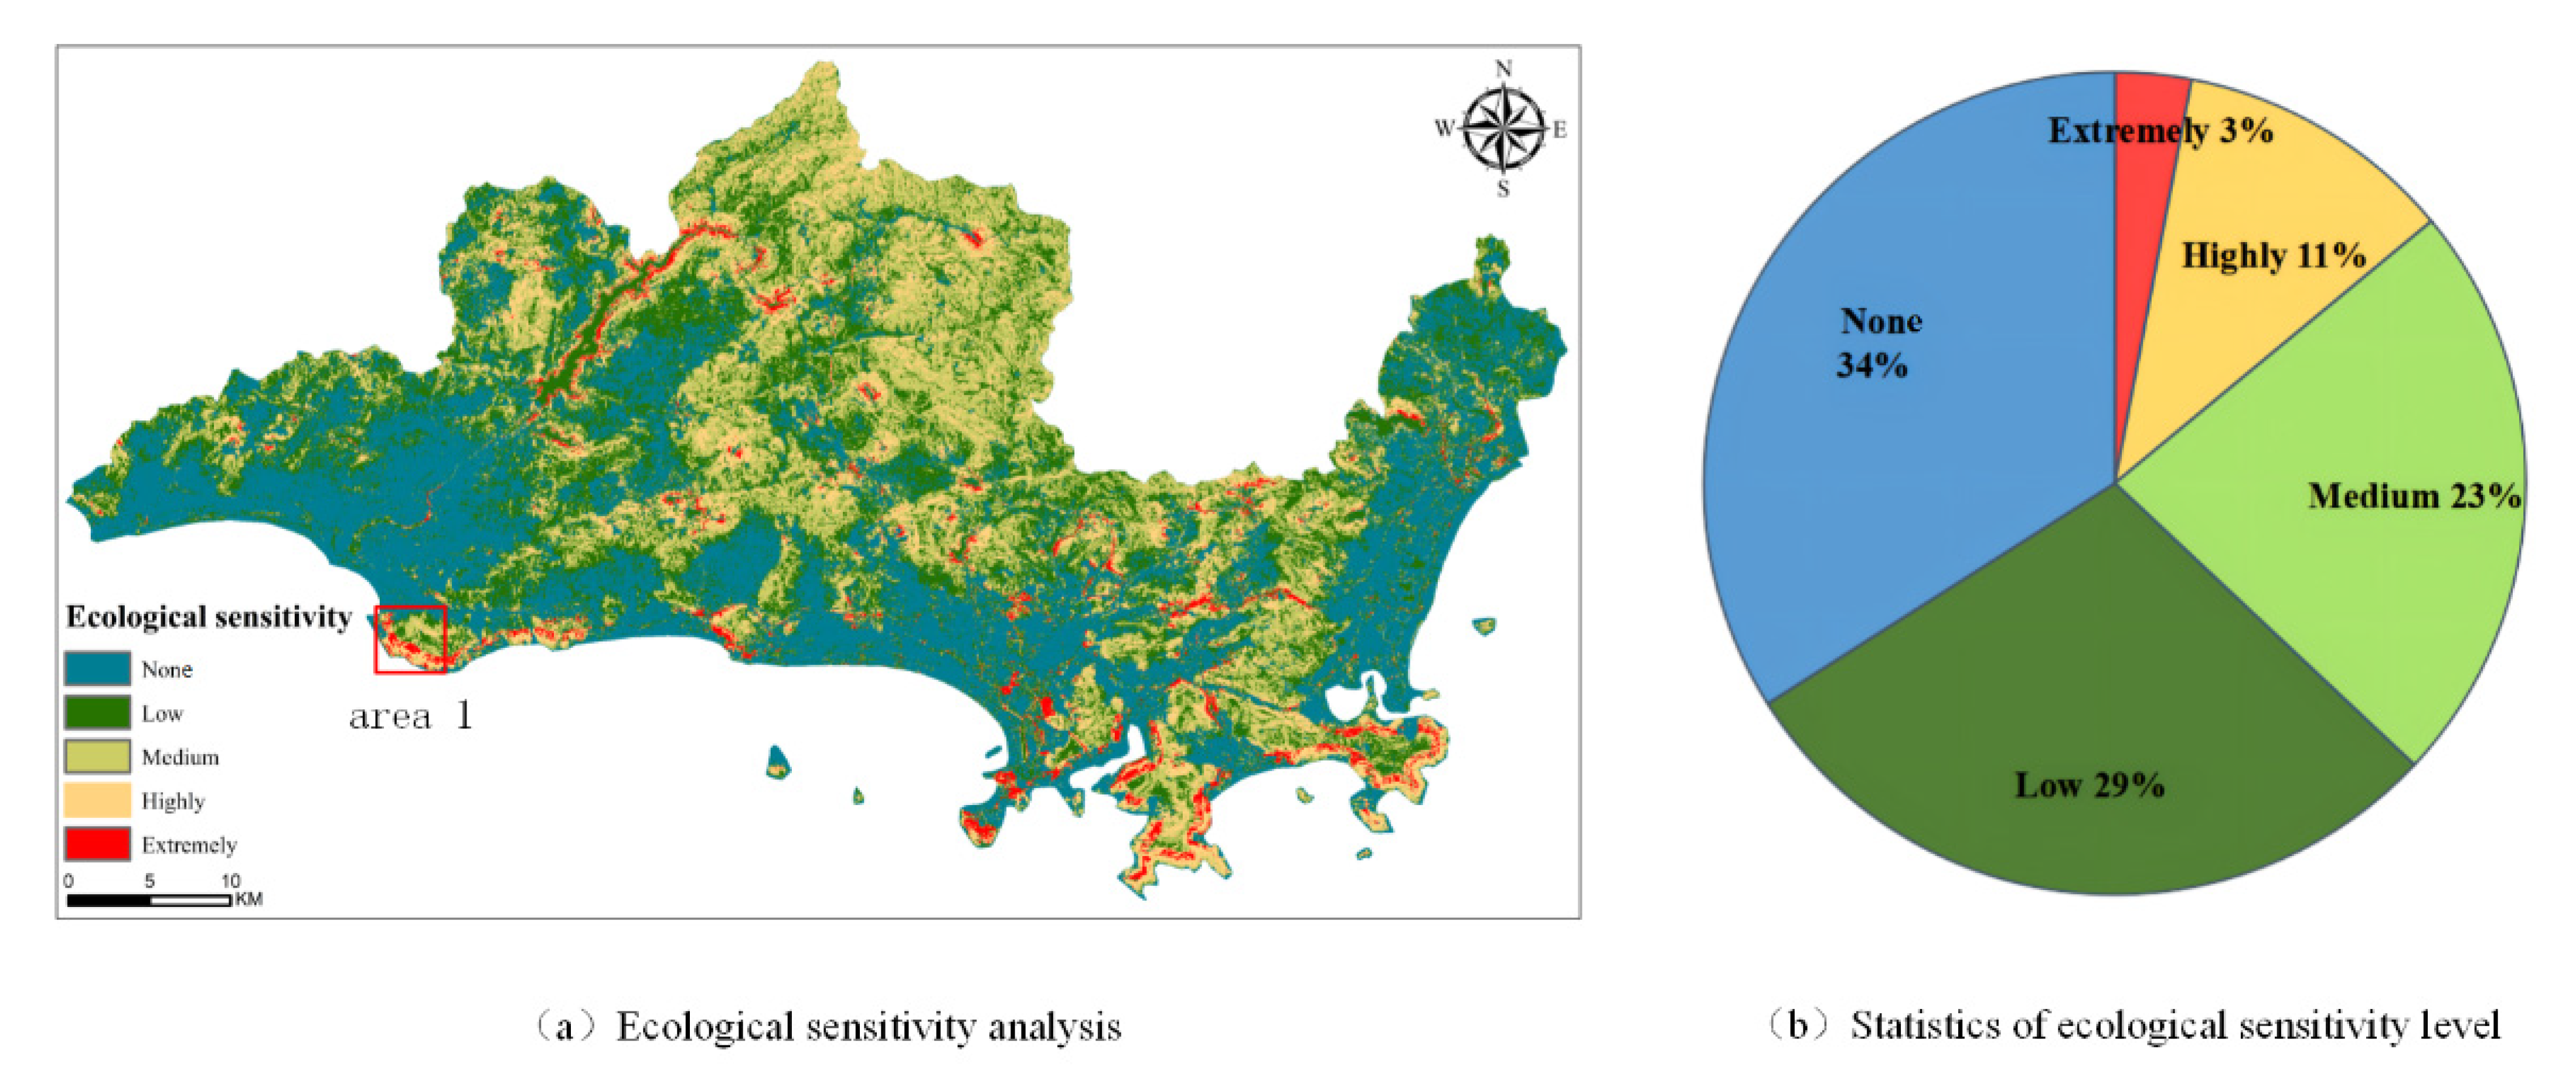
ArcGIS software was used to calculate the weighted sum of all indicators through a multi-factor weighted summation model. The calculation results showed the distribution of comprehensive scores in the study area. According to the final calculated score, we divided the study area into five sub-areas based on the natural break method: extremely sensitive, highly sensitive, moderately sensitive, low sensitive, and non-sensitive. These sub-areas expressed different degrees of ecological environment vulnerability.
3.2. Public Sentiment Information Extraction Based on Social Media Data
Social media contains rich sentiment information, which can express the public’s feelings and attitudes towards topics of concern. At present, scholars have generally applied this information to many research fields, such as disaster analysis [23,24], tourism recommendations [25,26], and even ecological environment evaluation [27]. The methods extracting public sentiment information from texts mainly include sentiment lexicon [28,29] and machine learning [30] (even deep learning [31]). These methods are relatively mature and show suitable results. Moreover, there are already some mature tools that integrate these methods and provide services to extract sentiment information from text, such as ROST EA (Emotion Analysis), the iFLYTEK open platform, and the Baidu AI open platform. In this paper, we selected the Baidu AI open platform (https://cloud.baidu.com/product/nlp_apply/sentiment_classify, accessed on 10 April 2022) and used its sentiment analysis module to process the obtained social media data. According to the calculated sentiment value, we divided the social media data into three categories: positive sentiment (the sentiment value is greater than zero), neutral sentiment (the sentiment value is equal to zero), and negative sentiment (the sentiment value is less than zero). Among them, positive sentiment indicates that the public recognizes the local ecological environment. The negative sentiment expresses the public’s dissatisfaction with the deteriorated ecological environment. The texts expressing neutral sentiment were mainly some news reports, which only objectively described the current situation of the ecological environment without sentimental tendencies.
3.3. Construction of Social Semantic Network Related to Ecological Environment
In order to quickly understand the hotspot information of public concern, we constructed a social semantic network that can perceive the state of the ecological environment. The network is composed of text keywords, word frequencies, and co-occurrence frequencies between keywords. It reflects the public’s attention to different hotspot information related to the ecological environment and the internal connections between this information.
3.3.1. Text Natural Language Processing
We performed natural language processing on raw social media texts, including word segmentation, part of speech tagging, and removing stop words. Compared with English text, there is no clear delimiter between words in Chinese text. Therefore, word segmentation can help divide the semantic features contained in the text. Currently, there are many excellent tools that can effectively provide word segmentation services, such as HanLp, NLPIR-ICTCLAS, and LTP-cloud. We selected HanLp (https://www.hanlp.com/, accessed on 18 April 2022) to process social media text. The part of the speech tagging module of this tool can be used to process the word segmentation results. In addition, the text usually contains some meaningless words, such as auxiliary words, interjections, etc., which are called stop words. In natural language processing tasks, these words are usually removed to improve the efficiency of text processing. We used the open stop word dictionary provided by the Harbin Institute of Technology to process the social media text.
3.3.2. Keyword Extraction in Text
The keywords in the text largely reflect the topics expressed by the text. By mining the keywords in social media data, we can understand the information related to the ecological environment that people pay attention to. In this paper, the algorithm [32] was used to extract a keyword from the processed social media text. The formula of this algorithm is as follows:
where is word frequency. represents the number of occurrences of the word in a single microblog text ( is the serial number of the microblog text). indicates the frequency of the most frequently occurring word in this microblog text. is the inverse document frequency, which indicates the distribution of words in the entire corpus (the corpus contains all microblog texts). represents the number of microblog texts in the corpus. indicates the number of microblog texts containing the word in the corpus.
3.3.3. Construction of the Network
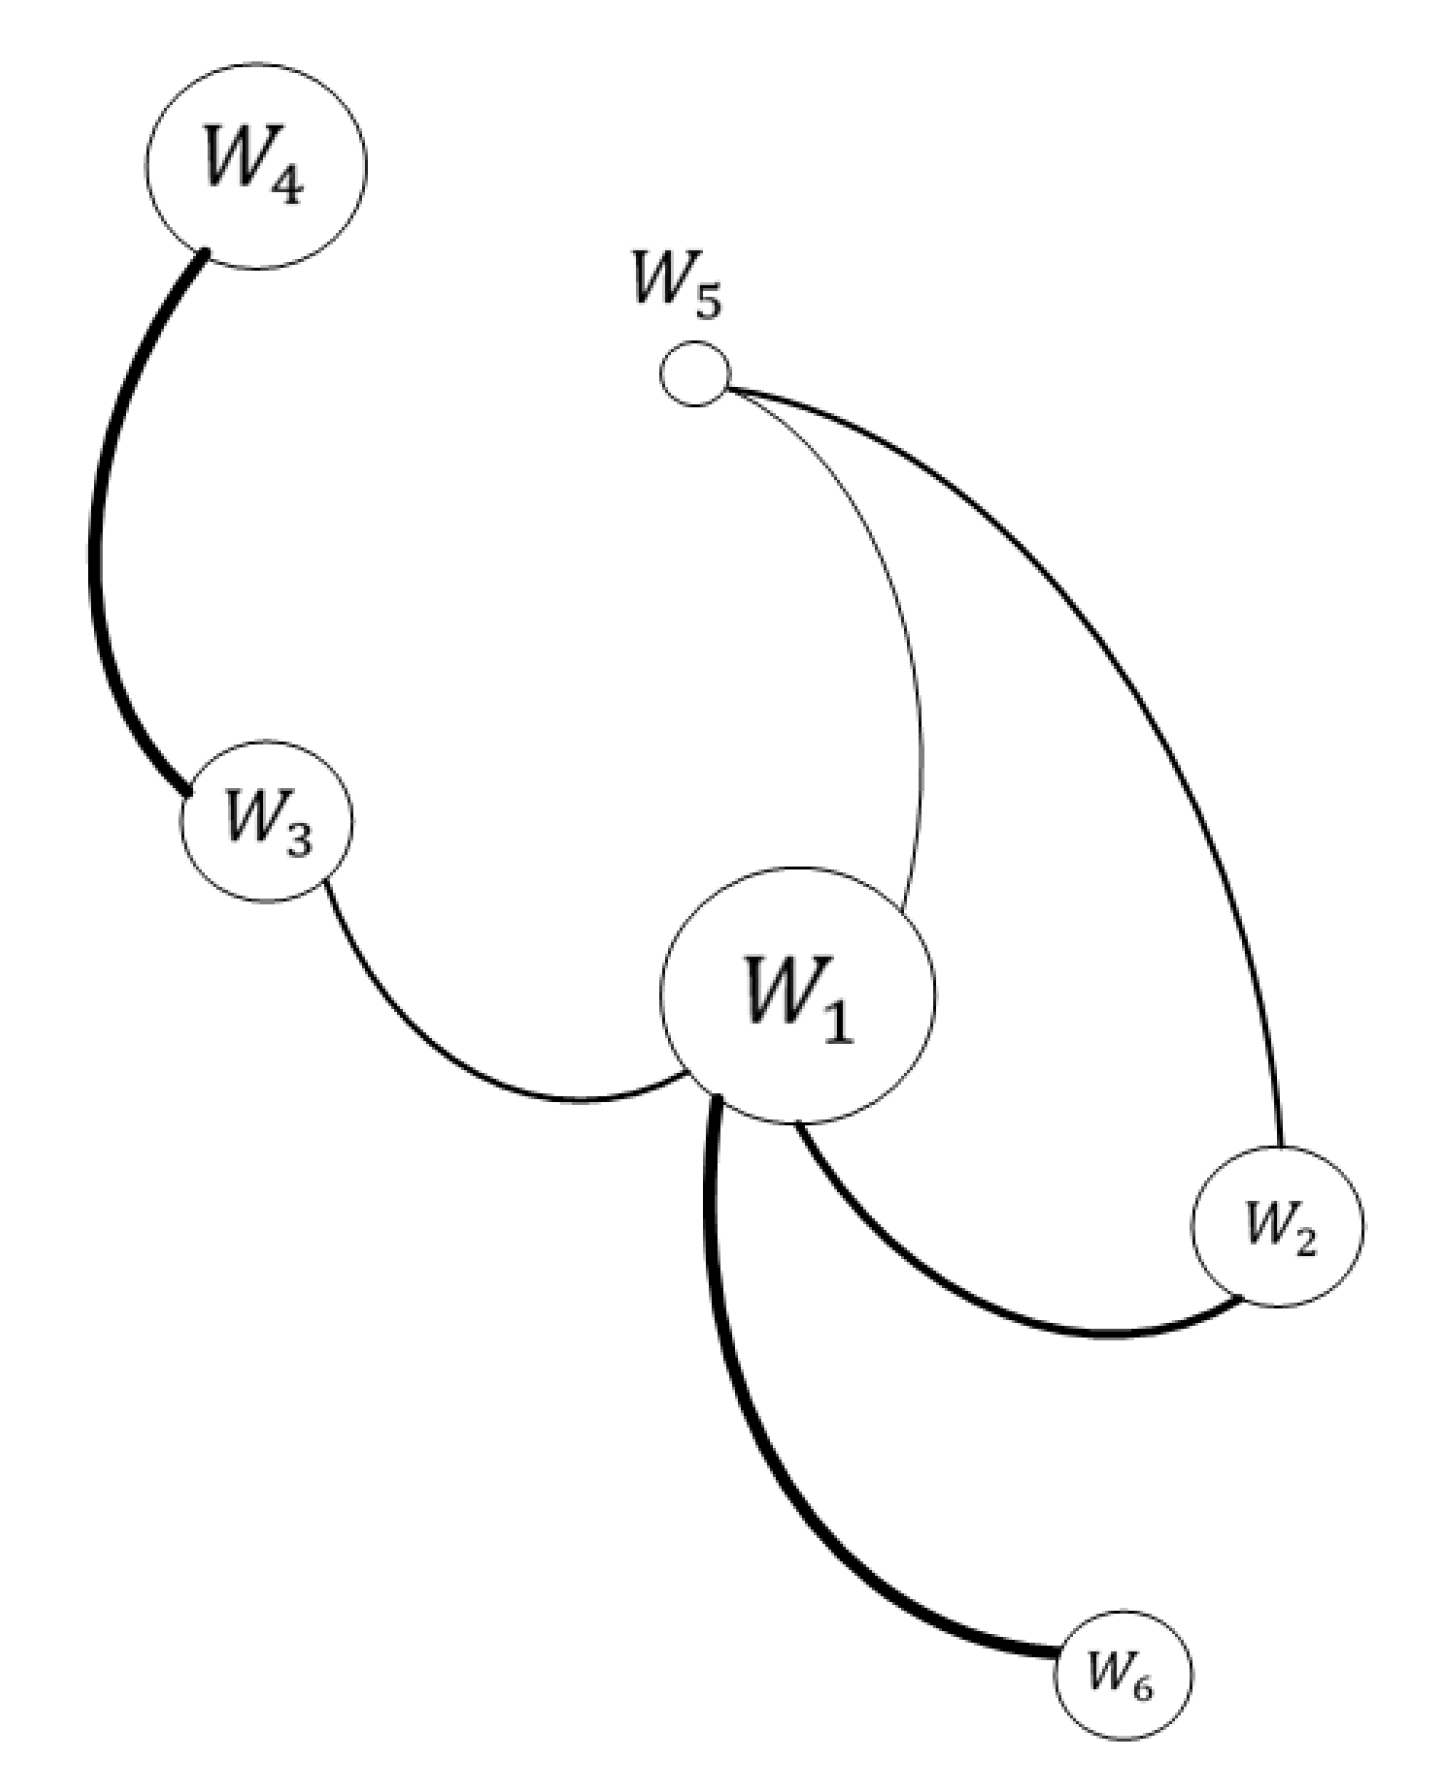
We counted the word frequency of the extracted keyword in the corpus and the co-occurrence frequency between the keywords and . Among them, we took these keywords as the nodes of the network and the word frequency as the size of the nodes. It showed the extent to which this hotspot information related to the ecological environment had received public attention. Nodes are connected through the co-occurrence between keywords, and the thickness of the connection indicates the strength of the relationship between the corresponding hotspot information. The structure of the network is shown in Figure 3.
3.4. Comprehensive Analysis Based on Multi-Source Data
Based on the constructed social semantic network and ecological sensitivity analysis results, we monitored and evaluated the ecological environment status in the study area from both macroscopic and local perspectives. Information from multi-source data can complement each other, which is helpful for fully understanding the ecological environment of the study area.
3.4.1. Comprehensive Assessment of the Ecological Environment in the Study Area
Ecological sensitivity analysis macroscopically describes the degree of ecological vulnerability in different areas. However, it is difficult to dig out the specific ecological environment problems in the study area. The social semantic network provides feedback on the hot issues of the ecological environment in the study area from the perspective of the public, which can serve as an important complement to the results of ecological sensitivity analysis.
First, we evaluated the results of ecological sensitivity analysis, including the proportion statistics and distribution characteristics of different sensitive areas. This analysis reflects the overall situation of the ecological environment in Sanya. Secondly, according to the public sentiment information contained in social media data, we divided the data into a positive sentiment corpus set and a negative sentiment corpus set. Based on the word frequency and co-occurrence frequency between keywords, we constructed social semantic networks and visualized them through the Gephi program [33]. Finally, we conducted cluster analysis on these social semantic networks, using the cluster method Structural Clustering Algorithm for Networks [34]. This divided the entire network into different semantic clusters according to the co-occurrence relationship between keywords, and these clusters can express different ecological environmental hot topics. Combining these clusters, we can further understand the specific ecological environment state in the study area, including the main problems faced and praiseworthy aspects. The information from multi-source data provides effective support for the comprehensive assessment of the ecological environment.
3.4.2. Important Area Mining and Ecological Environment Monitoring
In addition, we tried to mine some important areas that may face serious ecological environmental problems. By monitoring these areas, it is possible to efficiently understand the current detailed ecological environment conditions in the area, such as what potential ecological environment risks may exist and what are the factors that lead to the deterioration of the ecological environment. This requires an effective combination of social semantic network and ecological sensitivity analysis results. The corresponding analysis process is as follows:
- (1)
- Based on the filtering of sentimental tendencies, we obtained social media data that express negative sentiment, and we constructed a social semantic network based on these data.
- (2)
- We analyzed the nodes in the network and selected the nodes that contain keywords with spatial location attributes. These spatial location attributes can be judged by the part of speech tagging of keywords, such as the label “ns”, which represents geographic names in HanLp. These nodes with spatial location information served as links between social semantic networks and ecological sensitivity analysis results.
- (3)
- We took the nodes with spatial location information and the links between them as a kind of layer, and spatially overlaid this layer with the ecological sensitivity analysis results. Some important areas with larger nodes and higher ecological sensitivity should be mined. These areas deserve further detailed analysis, as the ecology in these areas may be severely damaged.
- (4)
- We selected some nodes in the important areas and built sub-social semantic networks by combining other nodes that had a direct link with this node. These sub-social semantic networks reflected the ecological environment issues in these important areas in detail.
4. Results and Discussion
4.1. Overall Assessment of Ecological Environment Based on Multi-Source Data
Based on remote sensing images and other basic data, we conducted an ecological sensitivity analysis for Sanya, as shown in Figure 4a. This figure shows the distribution of ecological sensitivity in the entire study area. We further calculated the proportion of ecological sensitivity at each level, as shown in Figure 4b. We can see that the areas with non-ecological sensitivity and low ecological sensitivity accounted for a relatively large proportion, reaching 34% and 29%, respectively. These areas were mainly distributed in the southern parts of Sanya. The ecological environment in these areas was relatively invulnerable and we probably did not have to pay too much attention to these areas. The areas with high ecological sensitivity and extreme ecological sensitivity were mainly located in the northern and southeastern coastal areas of Sanya. Although the proportion of these areas was not high, they deserved more attention from the local environmental protection department. It showed that the ecological environment in these areas was very good, but they were very fragile and vulnerable to damage. For example, area 1 in Figure 4a is Yazhou Bay, a bay in the southwest of Sanya and an important port for departure and supply of the ancient Chinese Maritime Silk Road. Moreover, it is a specific area for the development of cultural tourism in Sanya and even Hainan. However, the results of the ecological sensitivity analysis in Yazhou Bay indicated that the ecological environment in this area was vulnerable to damage and needed to be protected with priority.
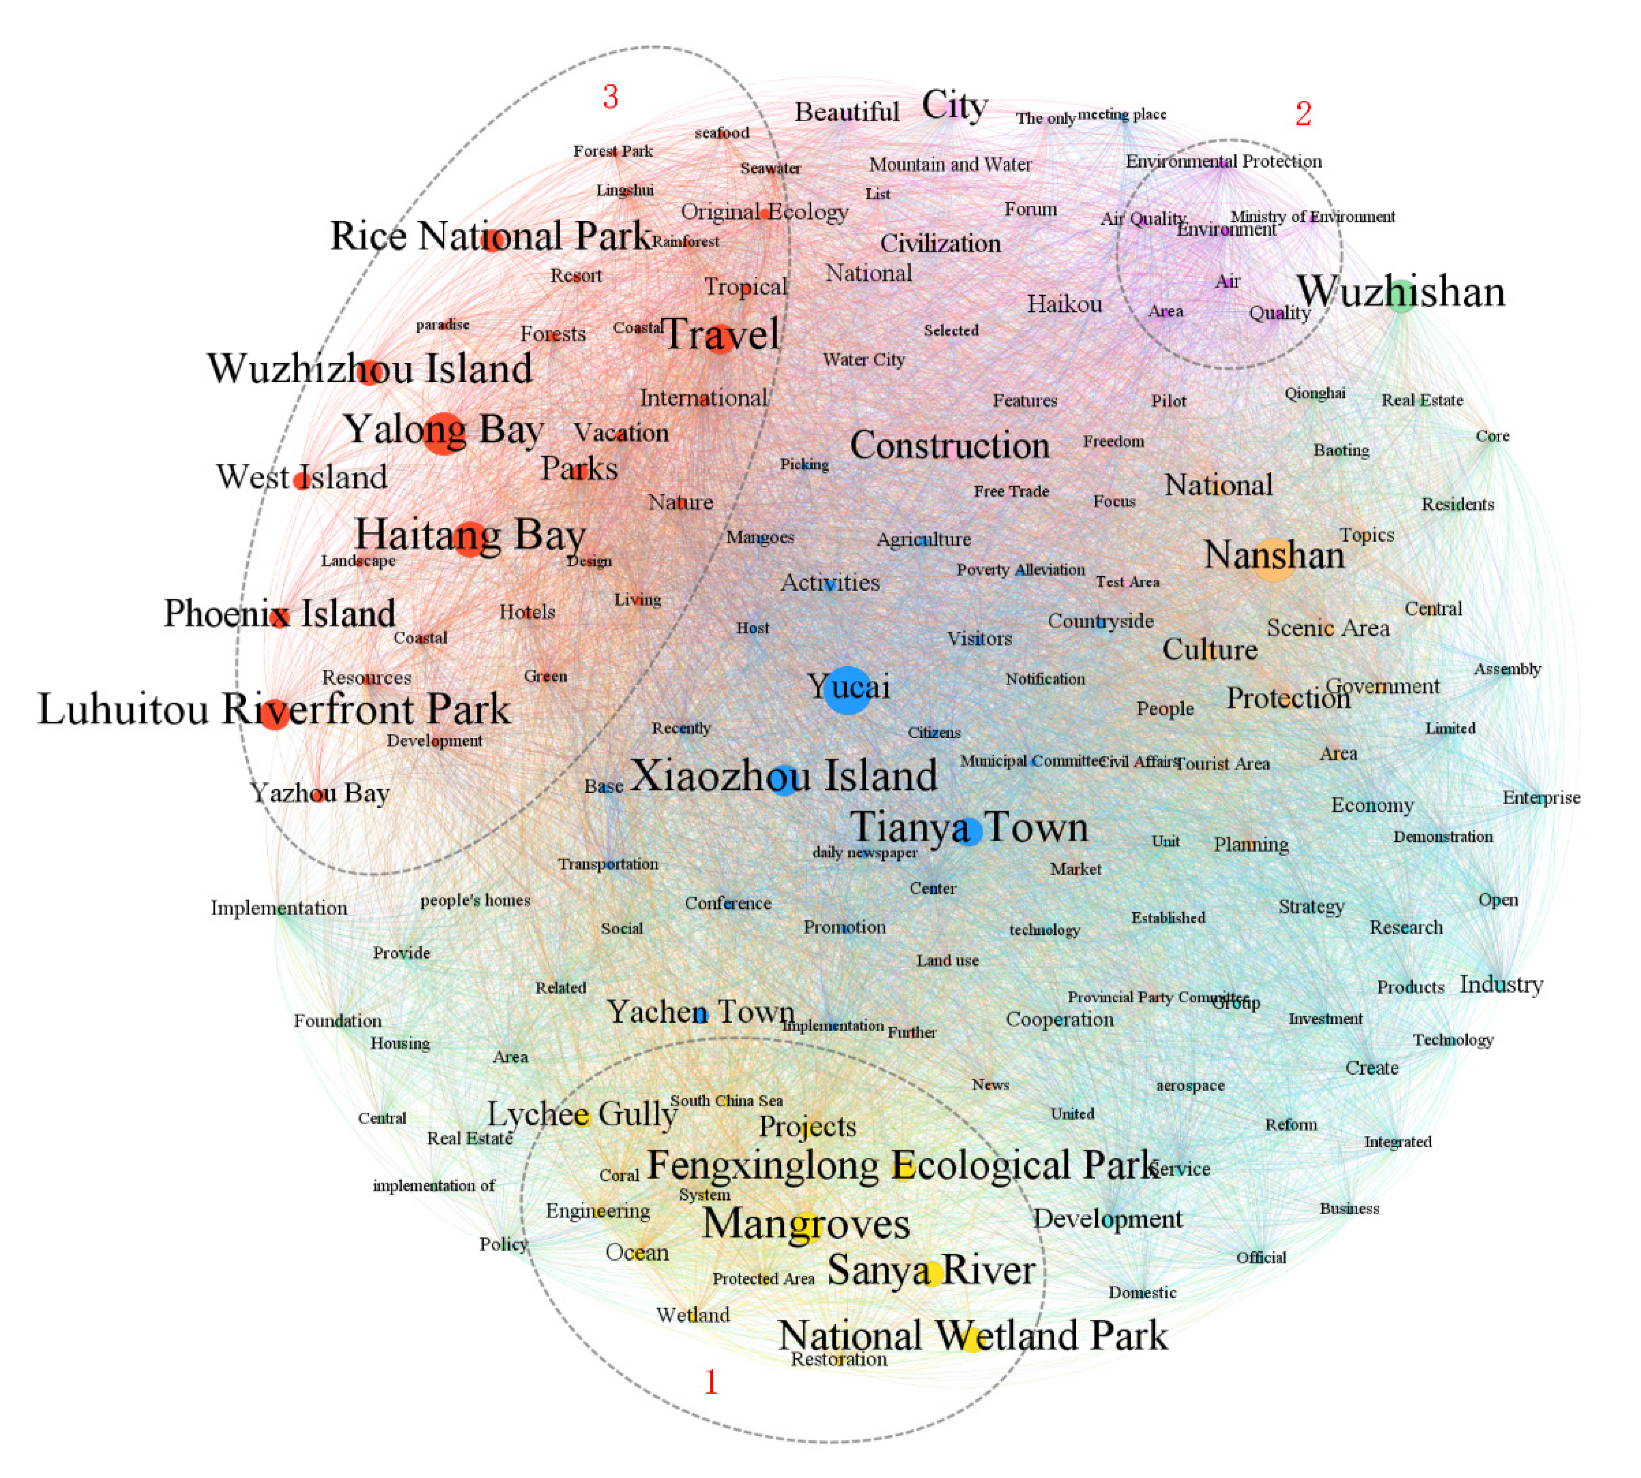
The results shown in Figure 4 roughly summarize the current ecological environment in Sanya. However, it is difficult to derive more detailed information, such as the specific ecological environment problems faced by the study area. Therefore, we constructed two different social semantic networks based on negative sentiment and positive sentiment social media data and performed cluster analysis on these semantic networks to further supplement the ecological sensitivity analysis results. We set 10 clusters for each social semantic network, the results are shown in Figure 5 and Figure 6. The analysis results in Figure 5 show that the public was satisfied with the ecological environment in the study area. We took the three clusters marked in the figure as an example. In cluster 1, we can see that some important nature reserves and ecological functional areas were being effectively protected, and the quality of the ecological environment had been improved, such as in “mangroves” and “wetland parks”. Cluster 2 mainly describes the air quality in Sanya. Combining the keywords “air”, “quality”, etc., and corresponding texts, we can see that under the comprehensive environmental management, the air quality was much better than before. There were a lot of tourism areas in cluster 3, such as Haitang Bay, Wuzhizhou Island, Rice National Park, etc. The themes of this cluster were mainly related to tourism. Combining the text and sentiment information corresponding to the keywords, we can see that the overall ecological environment of these tourism resources was satisfactory, and they attract the attention of many tourists.
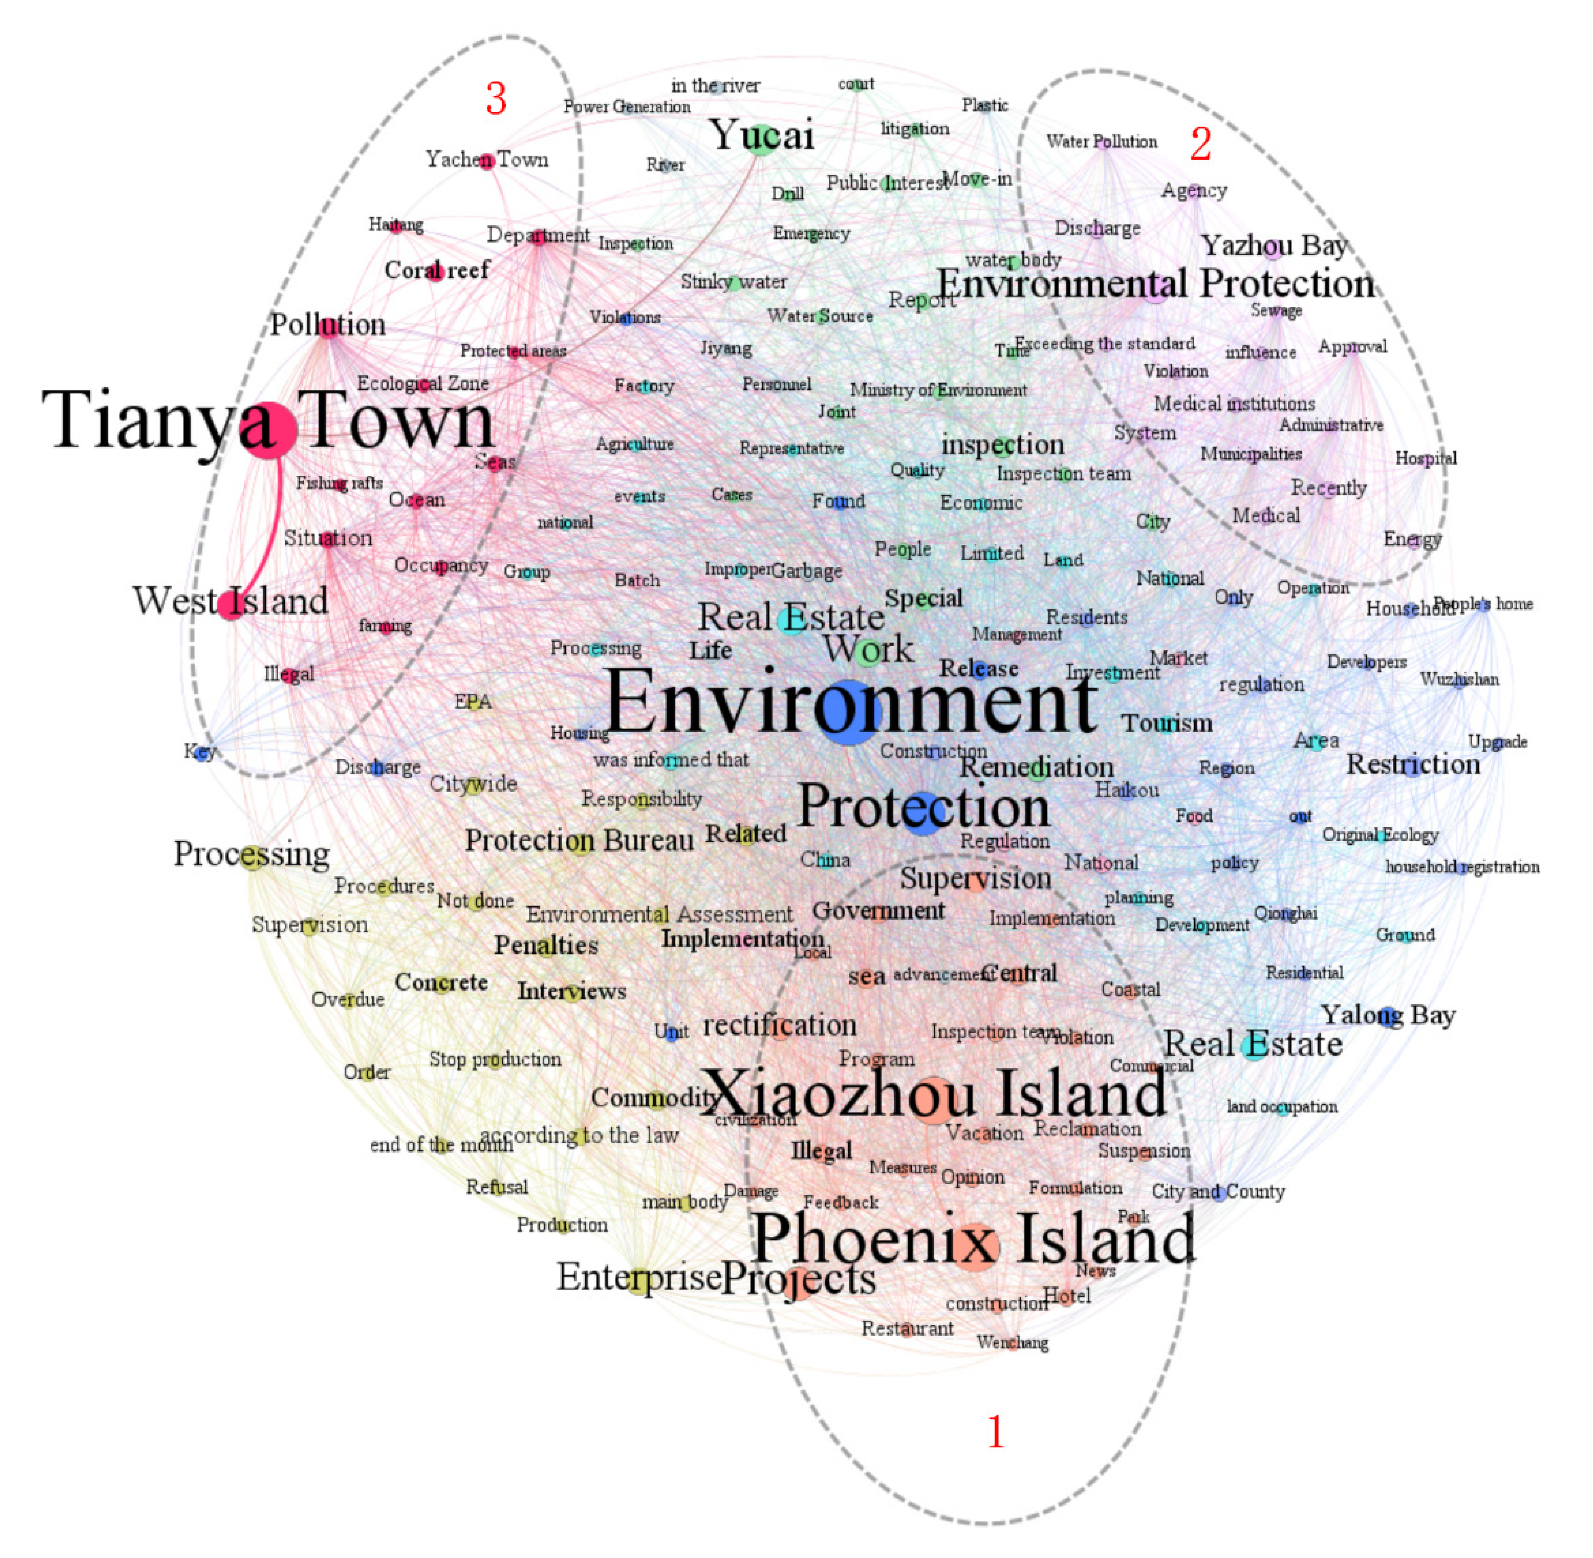
The social semantic network shown in Figure 6 was constructed based on social media data that expressed negative sentiment. We selected three clusters for thematic analysis. Cluster 1 reflects the problem of illegal land reclamation in Sanya City, which causes great damage to the coastline and coastal ecology. In cluster 2, the keywords “water pollution”, “influence”, “violation”, and “sewage” revealed the phenomenon of illegal pollution. The keywords “hospitals”, “medical institutions”, etc., pointed out the reasons for this phenomenon. Cluster 3 indicates the illegal occupation of marine resources, such as excessive aquaculture and flooded fishing rafts (a kind of small restaurant on the sea). This had a greater impact on the ocean and marine life (especially coral reefs).
In this section, the results of ecological sensitivity analysis and results statistics show the overall situation of the ecological environment in Sanya. We can clarify the distribution and size of those areas that are vulnerable to ecological damage. Furthermore, the introduction of a social semantic network involving different public sentiment information reflects the specific information about the ecological environment, such as what were the main ecological problems facing Sanya at this stage, and which protection measures related to the ecological environment people were satisfied with. The synthesis of this different information described the current situation of the ecological environment in Sanya from both objective and subjective aspects. This provides effective information support for the formulation of environmental protection policies in this area.
4.2. Mining and Monitoring Important Areas Based on Multi-Source Data
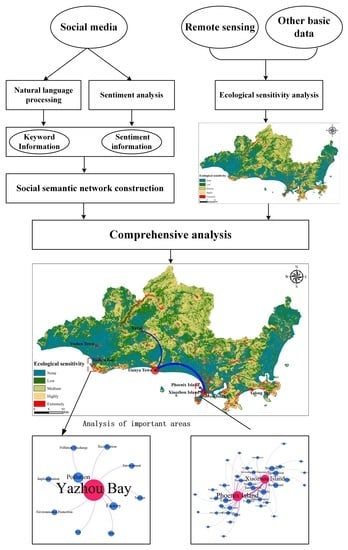
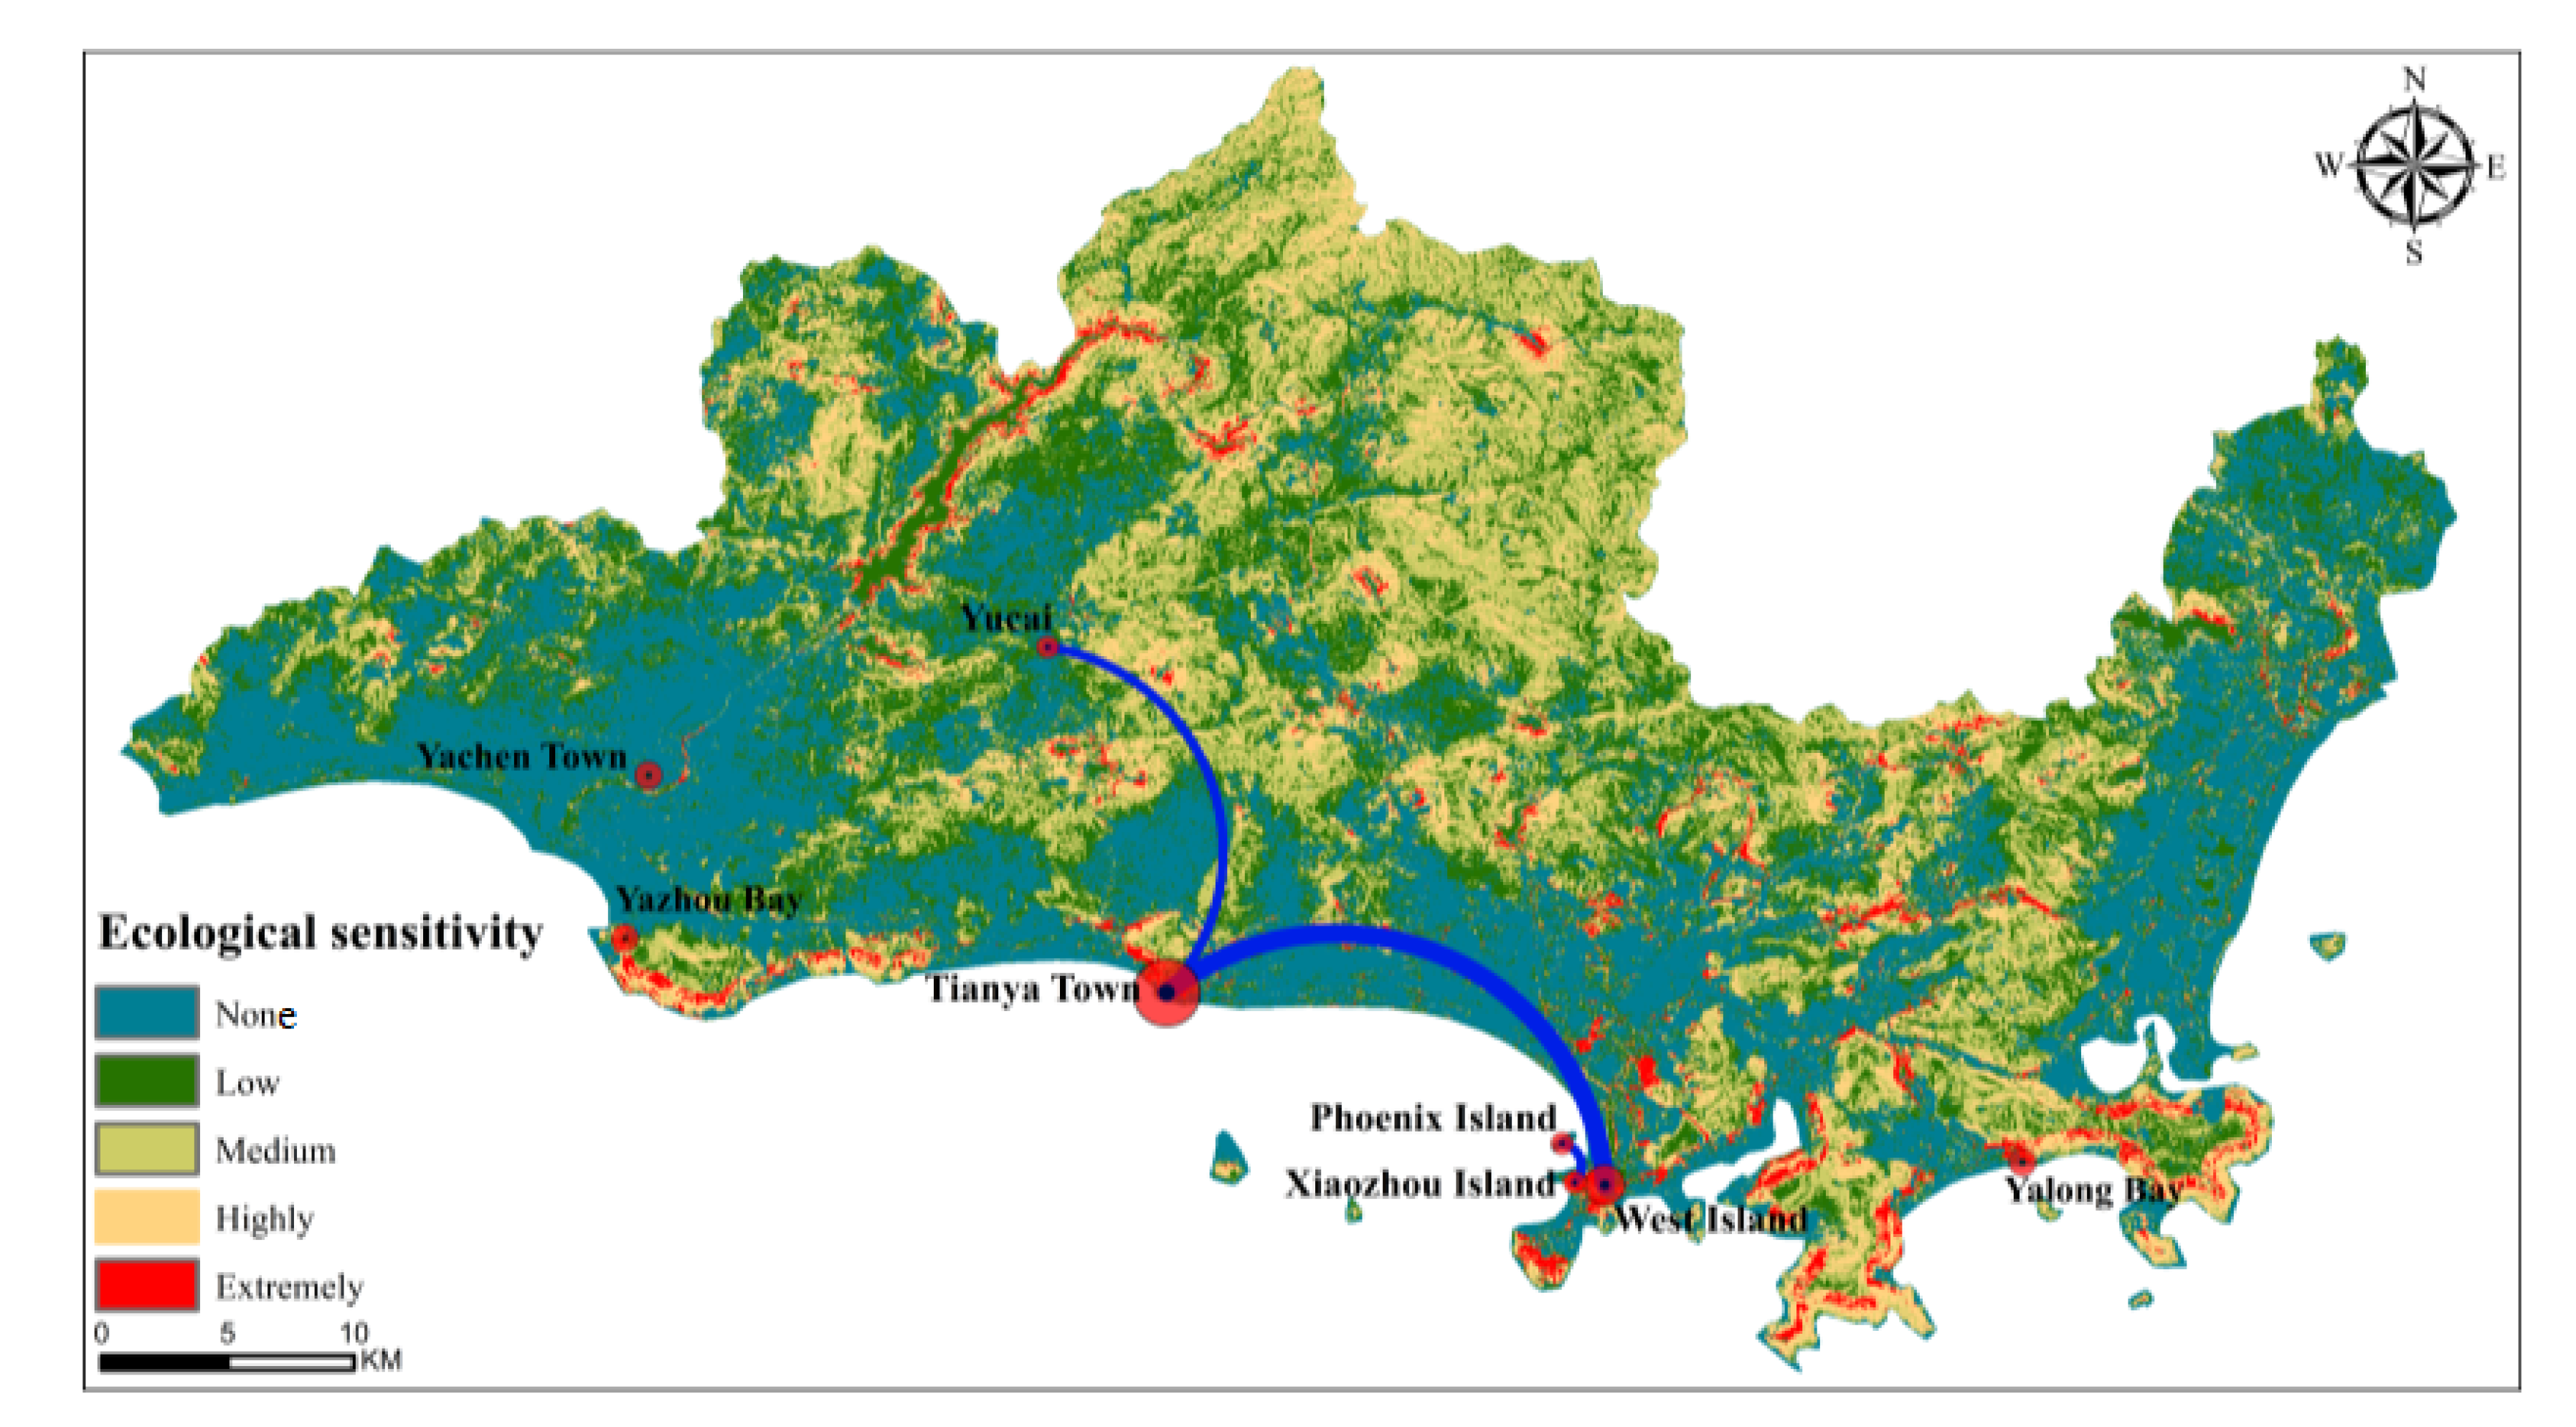
Based on multi-source data, we mined some important areas that needed to be targeted for protection. We took the social semantic network constructed based on social media data that expressed negative sentiment as the research object. This network reflected some ecological environment issues that were of urgent public concern at the moment. We filtered the part of speech information of the words contained in each node and selected the part of speech that can represent the spatial location, such as “ns”, “nt”, etc., so that the nodes corresponding to these parts of speech have spatial attribute features. We constructed a network based on these nodes and the co-occurrence relationship between them and used this new network as a layer to build the link between it and the ecological sensitivity analysis results, as shown in Figure 7. Among them, the bigger the red circle, the more attention the area is receiving, as in West Island, Yalong Bay, and Tianya Town. At the same time, combined with the ecological sensitivity analysis, it can be seen that the ecological environment in these areas was relatively fragile and easily damaged. Taken together, these areas are worthy of attention.
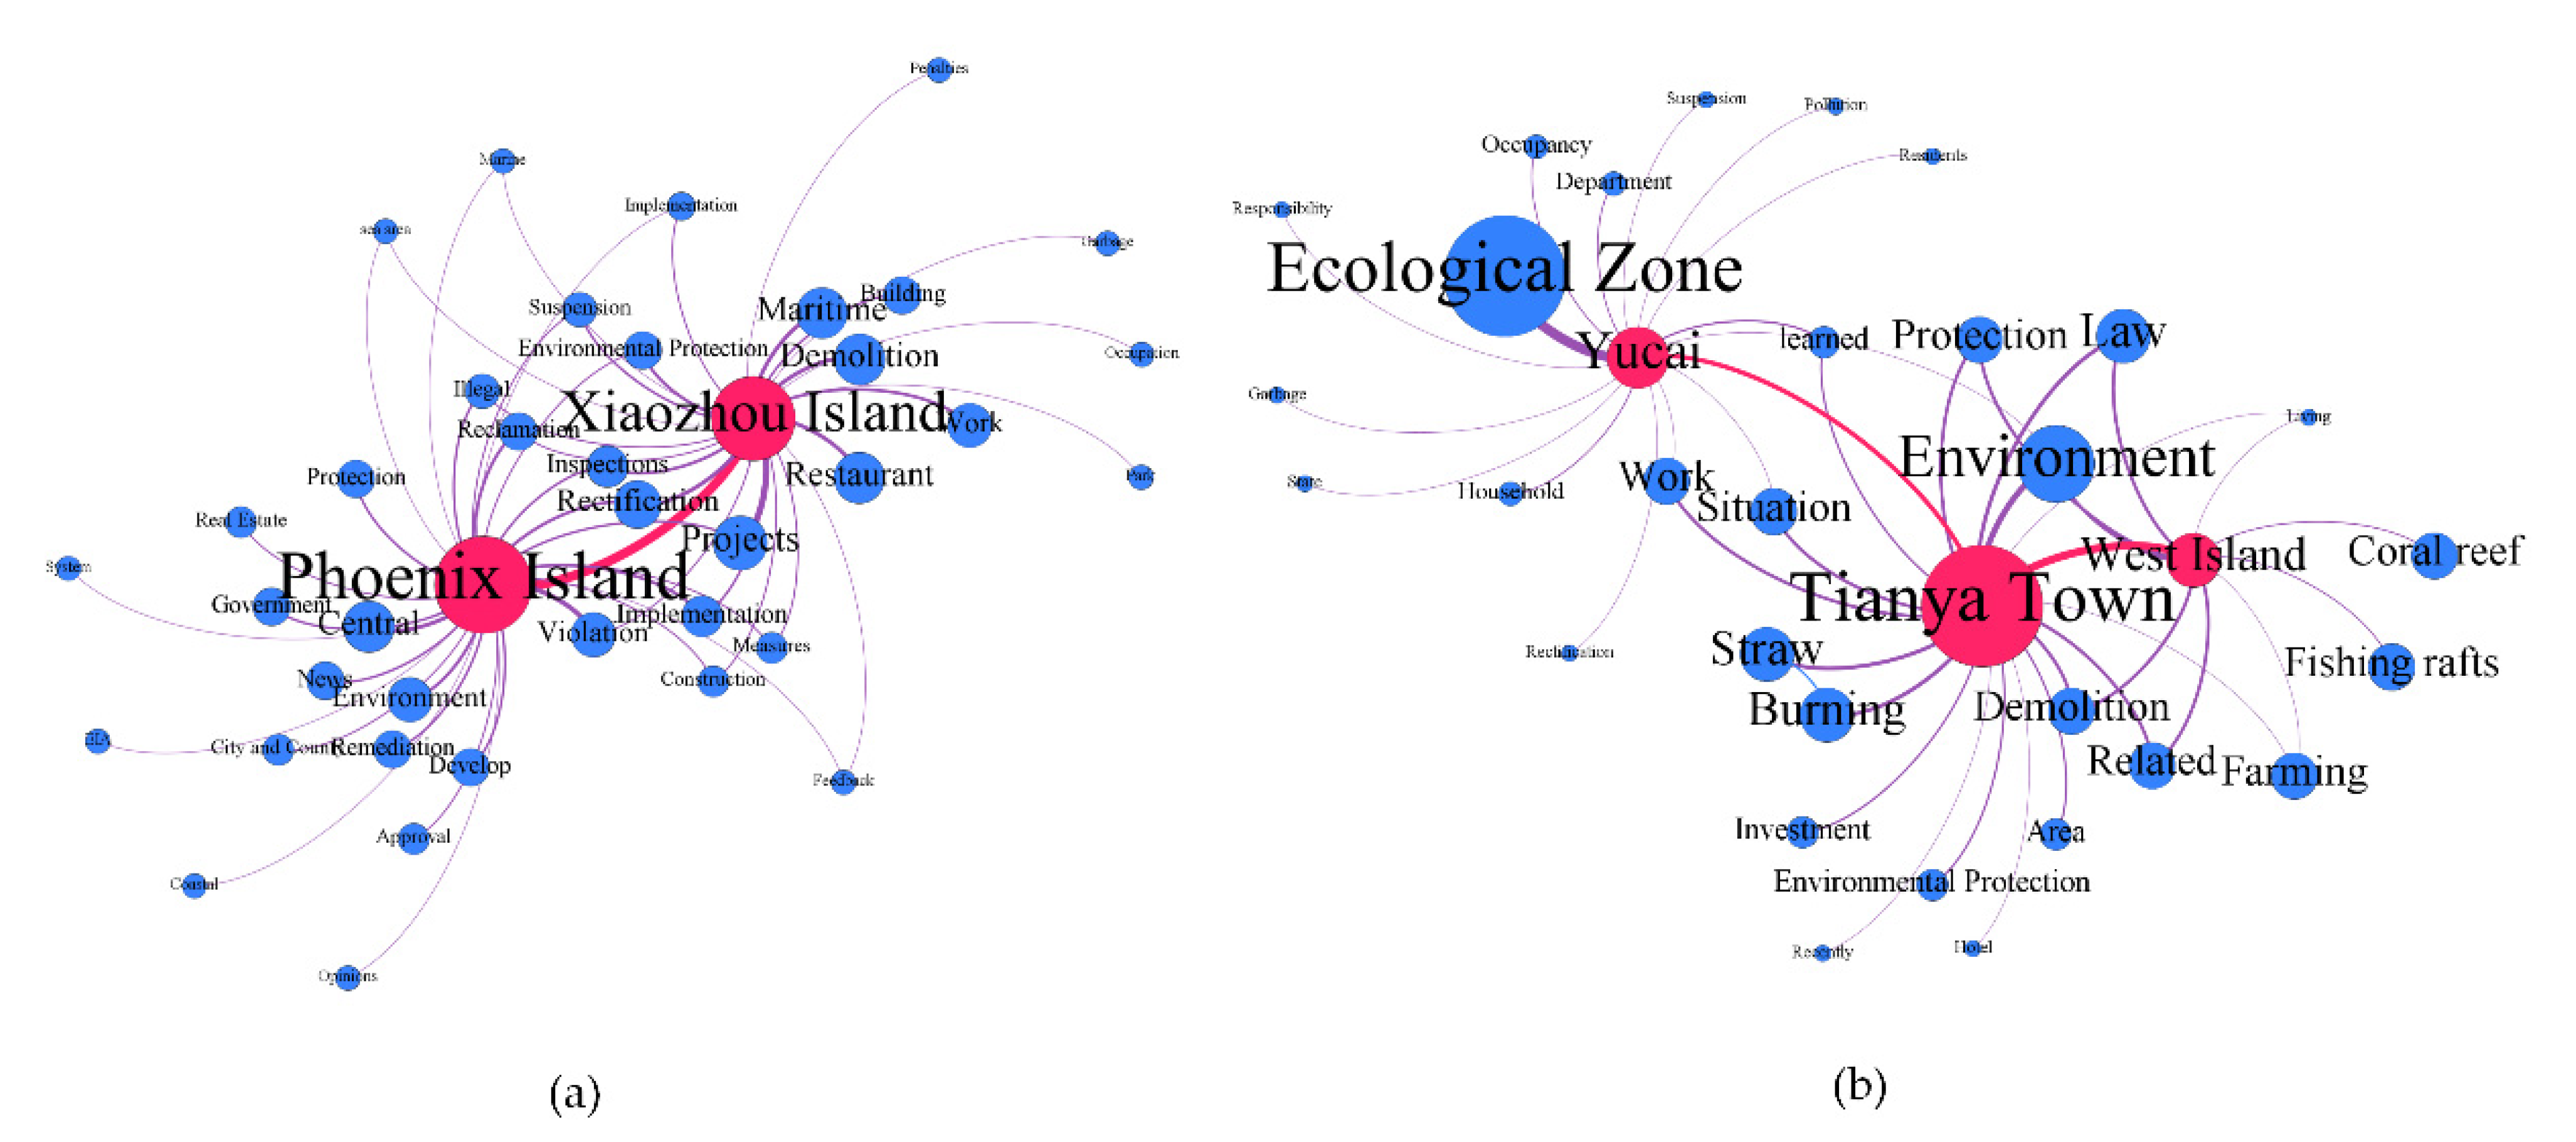
The lines between the nodes indicate the co-occurrence frequency of the two areas. The thicker the connection line, the higher the frequency of the corresponding two areas appearing on the same social media. This shows that the ecological environment problems contained in these two areas are more similar. In Figure 7, we can see that there is a link between Yucai, Tianya Town, and West Island, and a link between Phoenix Island and Xiaozhou Island. We constructed two social semantic networks based on these nodes, as shown in Figure 8. Among them, in Figure 8a, we can see that Phoenix Island and Xiaozhou Island have many co-occurrence keywords, showing that the ecological environment problems faced by these two areas were relatively similar. Combining some co-occurrence keywords, such as “illegal”, “rectification”, “marine”, and “projects”, and the corresponding texts containing these keywords, we can know that the main problem in these two areas is illegal reclamation. To pursue economic growth, people have continued to expand to the sea and practice reclamation. This has had a great impact on marine ecology. In addition, there were also some keywords related to Phoenix Island and Xiaozhou Island. These keywords show the unique ecological environment problems in the two areas. For example, the keywords related to Xiaozhou Island, such as “restaurant”, “building”, and “park”, further illustrated the drivers of illegal reclamation in the area. This provides detailed information for targeted decision-making. Figure 8b shows the co-occurrence relationship of Yucai, Tianya Town, and West Island. Overall, there were not many common keywords among these areas. This shows that they faced relatively different ecological environment problems. Among them, we can see that there was almost no damage to the ecological environment in the Yucai area. Moreover, the ecological sensitivity in this area was low, which indicated that the overall ecological environment in Yucai was in good condition. Keywords related to Tianya Town, such as “straw”, “burning”, “environment”, etc., indicate that the public’s attention in the area mainly concerns the living environment. People had expressed great dissatisfaction with the burning of garbage and straw without permission, which seriously pollutes the environment. For West Island, people paid more attention to marine ecology. Keywords such as “coral reef”, “fishing rafts”, “law”, etc., indicate the state of the ecological environment in the area. A large number of fishing rafts pose a greater threat to marine ecology, especially coral reefs. People called for more protection of marine ecology. In addition, the ecological sensitivity in Tianya Town and West Island was relatively high. The comprehensive results show that the ecological environment in these two areas should receive more attention and protection.
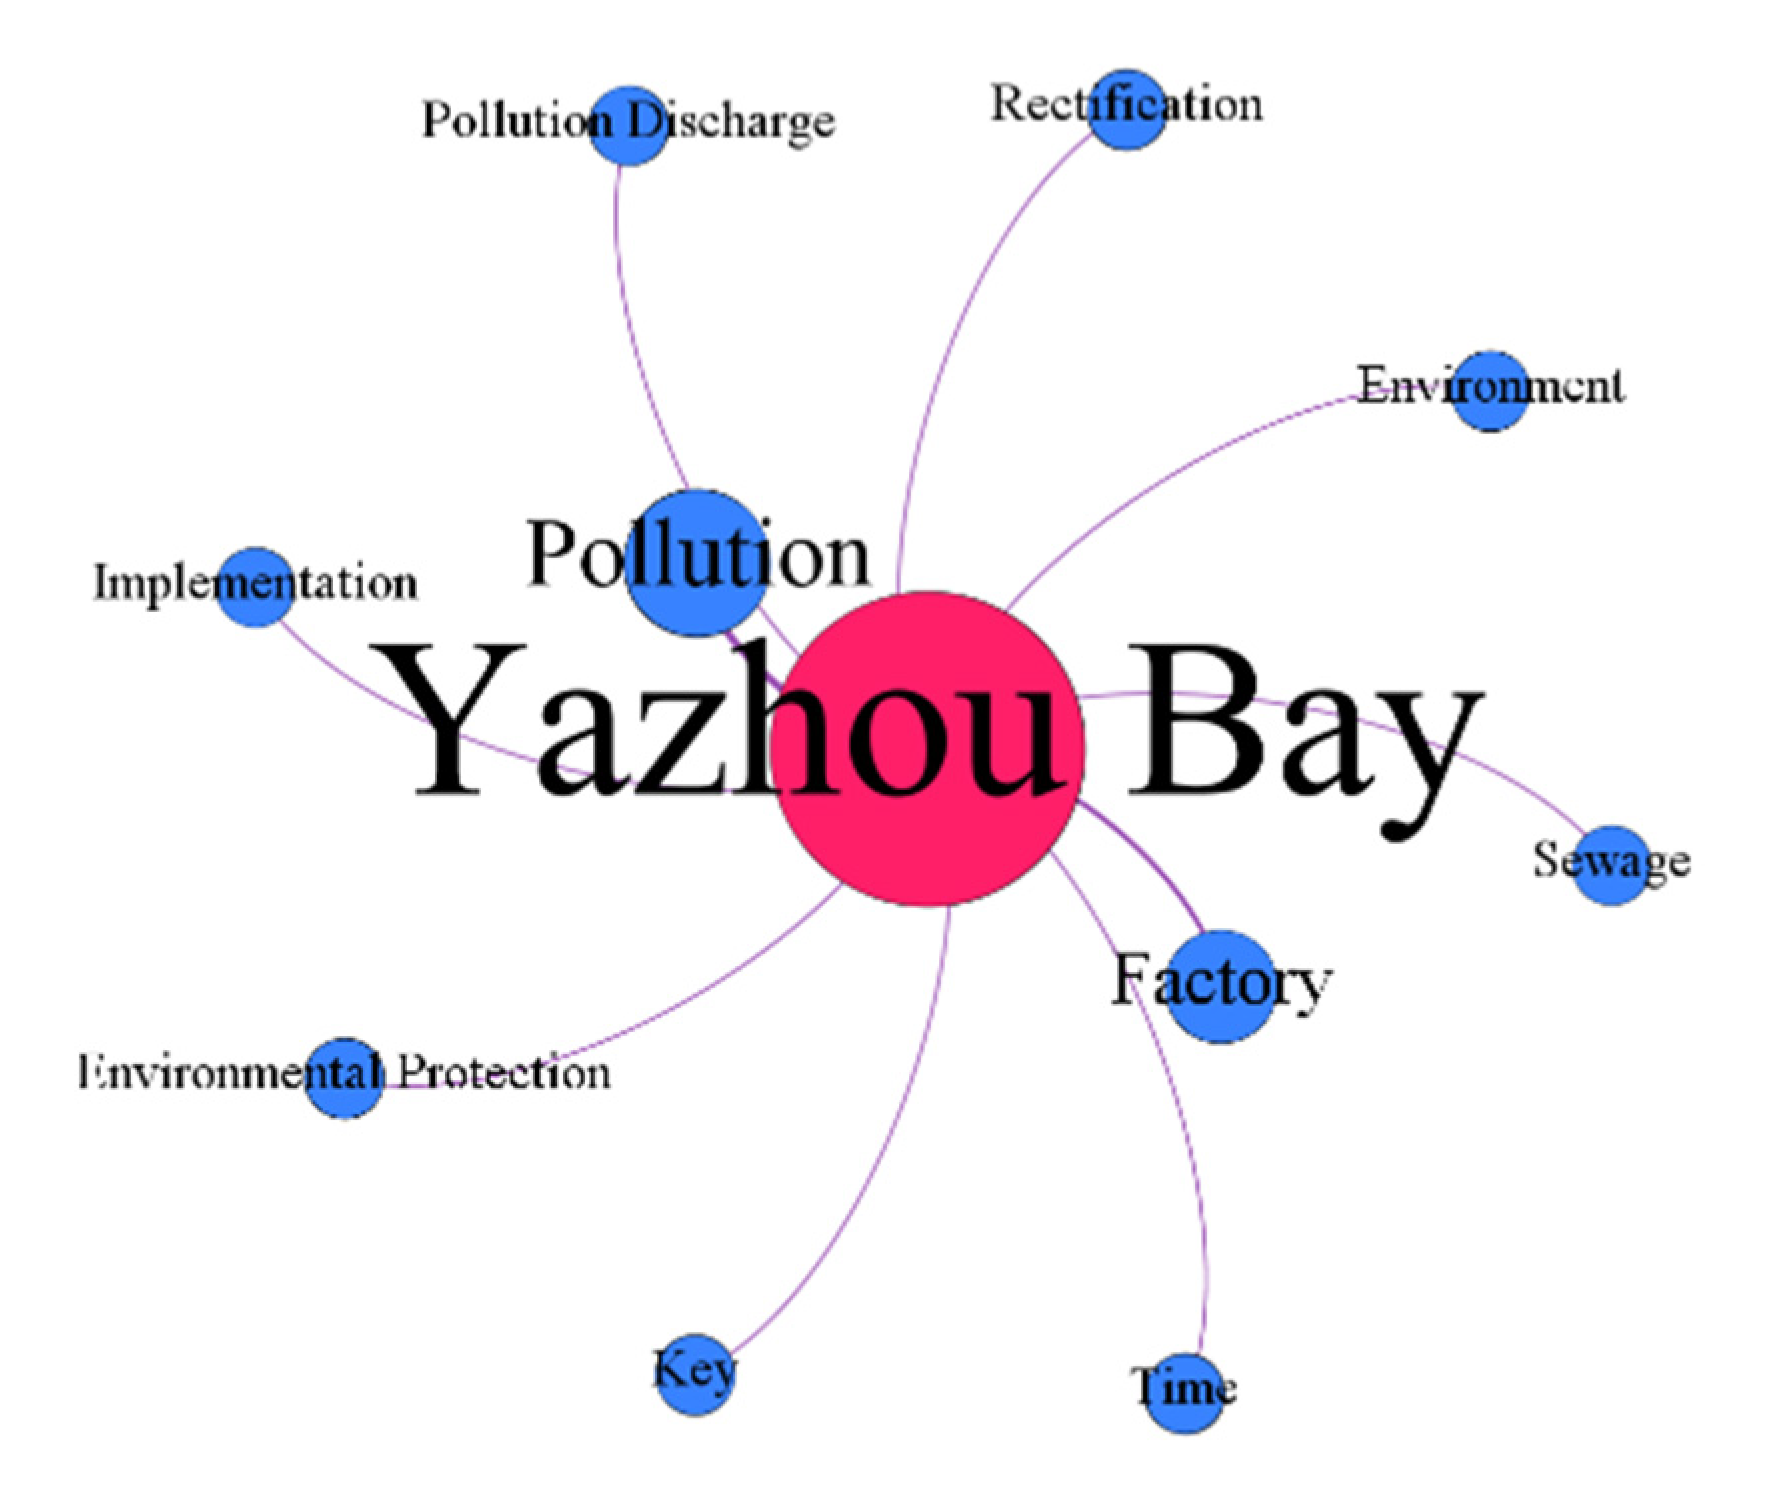
There were also some areas that had no link with other areas, but they had high ecological sensitivity and people paid much attention to these areas, such as Yazhou Bay, Yalong Bay, etc. We took Yazhou Bay as an example to build a social semantic network, as shown in Figure 9. We can see that there were some behaviors that damaged the ecological environment in this area, such as deforestation, sewage discharge, etc. The keywords “pollution”, “sewage”, “environment”, etc., and their corresponding microblogs offer additional details.
The same method is also applicable to monitoring other areas. It helps to monitor and mine the eco-environmental problems in these areas from the perspectives of objective reflection and subjective feedback. The ecological sensitivity analysis results show the distribution of ecological environment vulnerability in Sanya. The introduction of social media data helps to unearth some areas that people pay attention to and the specific ecological and environmental problems these areas are currently facing. This information can urge relevant departments to pay enough attention to the corresponding area and provide support for targeted decision-making.
5. Conclusions
Professional observations represented by remote sensing images and other basic data can macroscopically and objectively reflect the ecological environment in the study area. However, these data ignore the role of human beings in ecological environment monitoring. Social media, as a mobile sensor, relays more information from the public’s point of view, which strongly complements professional observational data. In this paper, we proposed a framework that attempts to combine these multi-source data to exploit their different potentials in ecological environment monitoring. We dealt with these multi-source heterogeneous data by constructing a social semantic network and performing ecological sensitivity analysis and establishing the correlation between the processed heterogeneous information through the spatial location nodes contained in the social semantic network. This correlation effectively realizes the complementary advantages of multi-source heterogeneous data in ecological environment monitoring. Among them, remote sensing images show the degree and distribution characteristics of ecological sensitivity in the study area. The introduction of social media data reflects additional dimensions of information related to the ecological environment in the study area, including whether the public is satisfied with the ecological environment, what kind of damage the ecological environment is suffering, etc. Such information can not only help decision-makers effectively locate areas worthy of monitoring, but also carry out targeted protection. In this paper, we took Sanya, China, as an example to verify the effectiveness of this method.
In future research, we will continue to explore the potential of multi-source data fusion in ecological environment monitoring. (1) The time feature will be considered, which is mainly reflected in the long-term monitoring of the regional ecological environment. Decision-makers can understand the changing trend of regional ecological environment quality and the specific factors affecting the change from the long-term ecological environment status relayed according to different data sources. (2) More methods will be introduced for data processing, especially for social media data. The unstructured formal characteristics of social media restrict the fusion efficiency of these data with other data. In this paper, we used methods including natural language processing, etc., to extract as much effective information as possible, but it was far from enough. We hope to be able to directly extract the elements related to the ecological environment contained in each piece of social media data, including time, location, events, etc. This will effectively convert these unstructured data into traditional geographic information data to improve the efficiency of using data.
Author Contributions
T.Y., J.X. and G.L. conceived and designed the paper; T.Y. and J.X. wrote the paper; T.Y., P.S. and N.M. designed and implemented the algorithmic framework; T.Y., P.S., X.G. and J.Z. realized the visualization; P.S. collected data and processed them. All authors have read and agreed to the published version of the manuscript.
Funding
This research was financially supported by the Hainan Provincial Department of Science and Technology under grant no. ZDKJ2019006.
Conflicts of Interest
The authors declare no conflict of interest.
References
- Shan, W.; Jin, X.; Ren, J.; Wang, Y.; Xu, Z.; Fan, Y.; Gu, Z.; Hong, Z.; Lin, J.; Zhou, Y. Ecological environment quality assessment based on remote sensing data for land consolidation. J. Clean. Prod. 2019, 239, 118126. [Google Scholar] [CrossRef]
- White, P.C.; Jennings, N.V.; Renwick, A.R.; Barker, N.H. Questionnaires in ecology: A review of past use and recommendations for best practice. J. Appl. Ecol. 2005, 42, 421–430. [Google Scholar] [CrossRef]
- Yarmak, O. Online Surveys in Sociology: Opportunities, Drawbacks and Limitations. In Proceedings of the 11th International Conference on Computer Science and Information Technologies CSIT, Yerevan, Armenia, 25–29 September 2017; Volume 4, pp. 476–477. [Google Scholar]
- Sina Finance. Available online: https://baijiahao.baidu.com/s?id=1683768694318658265&wfr=spider&for=pc (accessed on 25 March 2022).
- Cody, E.M.; Reagan, A.J.; Mitchell, L.; Dodds, P.S.; Danforth, C.M. Climate change sentiment on Twitter: An unsolicited public opinion poll. PLoS ONE 2015, 10, e0136092. [Google Scholar] [CrossRef] [PubMed] [Green Version]
- Williams, H.T.; McMurray, J.R.; Kurz, T.; Lambert, F.H. Network analysis reveals open forums and echo chambers in social media discussions of climate change. Glob. Environ. Chang. 2015, 32, 126–138. [Google Scholar] [CrossRef]
- Wang, S.; Paul, M.J.; Dredze, M. Social media as a sensor of air quality and public response in China. J. Med. Internet Res. 2015, 17, e22. [Google Scholar] [CrossRef]
- Song, P.; Yang, T.; Xie, J.; Gao, X.; Mou, N. 2020 Ecological Sensitivity Evaluation Dataset of Sanya. China Sci. 2021. Available online: http://www.csdata.org/en/p/725/ (accessed on 12 April 2022).
- Rossi, P.; Pecci, A.; Amadio, V.; Rossi, O.; Soliani, L. Coupling indicators of ecological value and ecological sensitivity with indicators of demographic pressure in the demarcation of new areas to be protected: The case of the Oltrepò Pavese and the Ligurian-Emilian Apennine area (Italy). Landsc. Urban Plan. 2008, 85, 12–26. [Google Scholar] [CrossRef]
- Tezer, A.; Turkay, Z.; Uzun, O.; Terzi, F.; Koylu, P.; Karacor, E.; Okay, N.; Kaya, M. Ecosystem services-based multi-criteria assessment for ecologically sensitive watershed management. Environ. Dev. Sustain. 2020, 22, 2431–2450. [Google Scholar] [CrossRef]
- Yuan, S.; Zhu, C.; Yang, L.; Xie, F. Responses of ecosystem services to urbanization-induced land use changes in ecologically sensitive suburban areas in Hangzhou, China. Int. J. Environ. Res. Public Health 2019, 16, 1124. [Google Scholar] [CrossRef] [Green Version]
- Yilmaz, F.C.; Zengin, M.; Tekin Cure, C. Determination of ecologically sensitive areas in Denizli province using geographic information systems (GIS) and analytical hierarchy process (AHP). Environ. Monit. Assess. 2020, 192, 1–13. [Google Scholar] [CrossRef]
- Symeonakis, E.; Karathanasis, N.; Koukoulas, S.; Panagopoulos, G. Monitoring sensitivity to land degradation and desertification with the environmentally sensitive area index: The case of lesvos island. Land Degrad. Dev. 2016, 27, 1562–1573. [Google Scholar] [CrossRef] [Green Version]
- Peng, H.; Hua, L.; Zhang, X.; Yuan, X.; Li, J. Evaluation of ESV Change under Urban Expansion Based on Ecological Sensitivity: A Case Study of Three Gorges Reservoir Area in China. Sustainability 2021, 13, 8490. [Google Scholar] [CrossRef]
- Singh, R.P.; Nachtnebel, H.P. Analytical hierarchy process (AHP) application for reinforcement of hydropower strategy in Nepal. Renew. Sustain. Energy Rev. 2016, 55, 43–58. [Google Scholar] [CrossRef]
- Wu, Q.; Li, S.; Liu, S.; Gong, H.; Li, Z.; Qi, J. AHP method determining the weight of main factors controlling water inrush from coal seam floor and system research and development. Coal Sci. Technol. 2017, 45, 154–159. [Google Scholar]
- Shi, Y.; Li, J.; Xie, M. Evaluation of the ecological sensitivity and security of tidal flats in Shanghai. Ecol. Indic. 2018, 85, 729–741. [Google Scholar] [CrossRef]
- He, D.; Hou, K.; Wen, J.; Wu, S.; Wu, Z. A coupled study of ecological security and land use change based on GIS and entropy method—A typical region in Northwest China, Lanzhou. Environ. Sci. Pollut. Res. 2022, 29, 6347–6359. [Google Scholar] [CrossRef]
- Wu, J.; Li, P.; Qian, H.; Chen, J. On the sensitivity of entropy weight to sample statistics in assessing water quality: Statistical analysis based on large stochastic samples. Environ. Earth Sci. 2015, 74, 2185–2195. [Google Scholar] [CrossRef]
- Wu, J.; Bai, h.; Li, J. Research on the land use strategies from ecological perspective. In Proceedings of the 2011 International Symposium on Water Resource and Environmental Protection, Xi’an, China, 20–22 May 2011; IEEE: Piscataway, NJ, USA, 2011; Volume 4, pp. 2860–2863. [Google Scholar]
- Liu, Y.; Li, C.; Ren, Z.; Wen, W. Land Eco-sensitivity Assessment Based on LUCC in Ecological City. Res. Soil Water Conserv. 2012, 19, 124–130. [Google Scholar]
- Mas, J.; Gao, Y.; Pacheco, J.A.N. Sensitivity of landscape pattern metrics to classification approaches. For. Ecol. Manag. 2010, 259, 1215–1224. [Google Scholar] [CrossRef]
- Yang, T.; Xie, J.; Li, G.; Mou, N.; Li, Z.; Tian, C.; Zhao, J. Social media big data mining and spatio-temporal analysis on public emotions for disaster mitigation. ISPRS Int. J. Geo-Inf. 2019, 8, 29. [Google Scholar] [CrossRef] [Green Version]
- Gruebner, O.; Lowe, S.R.; Sykora, M.; Shankardass, K.; Subramanian, S.V.; Galea, S. Spatio-temporal distribution of negative emotions in New York City after a natural disaster as seen in social media. Int. J. Environ. Res. Public Health 2018, 15, 2275. [Google Scholar] [CrossRef] [PubMed] [Green Version]
- Zhou, S.; Yan, Q.; Yan, M.; Shen, C. Tourists’ emotional changes and eWOM behavior on social media and integrated tourism websites. Int. J. Tour. Res. 2020, 22, 336–350. [Google Scholar] [CrossRef]
- Jabreel, M.; Moreno, A.; Huertas, A. Semantic comparison of the emotional values communicated by destinations and tourists on social media. J. Destin. Mark. Manag. 2017, 6, 170–183. [Google Scholar] [CrossRef]
- Zheng, S.; Wang, J.; Sun, C.; Zhang, X.; Kahn, M.E. Air pollution lowers Chinese urbanites’ expressed happiness on social media. Nat. Hum. Behav. 2019, 3, 237–243. [Google Scholar] [CrossRef]
- Wu, C.; Wu, F.; Liu, J.; Huang, Y.; Xie, X. Sentiment lexicon enhanced neural sentiment classification. In Proceedings of the 28th ACM International Conference on Information and Knowledge Management, Beijing, China, 3–7 November 2019; pp. 1091–1100. [Google Scholar]
- Al-Thubaity, A.; Alqahtani, Q.; Aljandal, A. Sentiment lexicon for sentiment analysis of Saudi dialect tweets. Procedia Comput. Sci. 2018, 142, 301–307. [Google Scholar] [CrossRef]
- Zou, H.; Tang, X.; Xie, B.; Liu, B. Sentiment classification using machine learning techniques with syntax features. In Proceedings of the 2015 International Conference on Computational Science and Computational Intelligence (CSCI), Las Vegas, NV, USA, 7–9 December 2015; IEEE: Piscataway, NJ, USA, 2015; pp. 175–179. [Google Scholar]
- Seo, S.; Kim, C.; Kim, H.; Mo, K.; Kang, P. Comparative study of deep learning-based sentiment classification. IEEE Access 2020, 8, 6861–6875. [Google Scholar] [CrossRef]
- Rajaraman, A.; Ullman, J.D. Mining of Massive Datasets; Cambridge University Press: Cambridge, UK, 2011. [Google Scholar]
- Bastian, M.; Heymann, S.; Jacomy, M. Gephi: An open source software for exploring and manipulating networks. In Proceedings of the International AAAI Conference on Web and Social Media, San Jose, CA, USA, 17–20 May 2009; Volume 3, pp. 361–362. [Google Scholar]
- Xu, X.; Yuruk, N.; Feng, Z.; Schweiger, T.A. Scan: A structural clustering algorithm for networks. In Proceedings of the 13th ACM SIGKDD International Conference on Knowledge Discovery and Data Mining, San Jose, CA, USA, 12–15 August 2007; pp. 824–833. [Google Scholar]
Figure 1.
Remote sensing image of Sanya city.

Figure 2.
The structure of the proposed framework.

Figure 3.
The structure of the constructed social semantic network.

Figure 4.
Ecological sensitivity analysis and results statistics.

Figure 5.
The social semantic network related to positive sentiments.

Figure 6.
The social semantic network related to negative sentiments.

Figure 7.
Important area mining based on multi-source data.

Figure 8.
Construction of social semantic network based on areas with associative relationships. Among them, the figure (a) is the social semantic network related to “Phoenix Island” and “Xiaozhou Island”, and the figure (b) is the Social semantic network related to “Yucai” and “Tianya Town” and “West Island”.

Figure 9.
Construction of social semantic network related to Yazhou Bay.


Table 1.
Weight calculation results of different indicators.
| Evaluation Indicators | Weights |
|---|---|
| Elevation | 0.0199 |
| Slope | 0.0566 |
| Slope Direction | 0.0199 |
| Vegetation Coverage | 0.1973 |
| Water Body | 0.1018 |
| Land Use Type | 0.1973 |
| Soil Erosion Intensity | 0.1019 |
| Population Density Distribution | 0.1973 |
| Accessibility Distance | 0.1080 |
Publisher’s Note: MDPI stays neutral with regard to jurisdictional claims in published maps and institutional affiliations. |
© 2022 by the authors. Licensee MDPI, Basel, Switzerland. This article is an open access article distributed under the terms and conditions of the Creative Commons Attribution (CC BY) license (https://creativecommons.org/licenses/by/4.0/).
Share and Cite
MDPI and ACS Style
Yang, T.; Xie, J.; Song, P.; Li, G.; Mou, N.; Gao, X.; Zhao, J. Monitoring Ecological Conditions by Remote Sensing and Social Media Data—Sanya City (China) as Case Study. Remote Sens. 2022, 14, 2824. https://doi.org/10.3390/rs14122824
AMA Style
Yang T, Xie J, Song P, Li G, Mou N, Gao X, Zhao J. Monitoring Ecological Conditions by Remote Sensing and Social Media Data—Sanya City (China) as Case Study. Remote Sensing. 2022; 14(12):2824. https://doi.org/10.3390/rs14122824
Chicago/Turabian StyleYang, Tengfei, Jibo Xie, Peilin Song, Guoqing Li, Naixia Mou, Xinyue Gao, and Jing Zhao. 2022. "Monitoring Ecological Conditions by Remote Sensing and Social Media Data—Sanya City (China) as Case Study" Remote Sensing 14, no. 12: 2824. https://doi.org/10.3390/rs14122824
Note that from the first issue of 2016, this journal uses article numbers instead of page numbers. See further details here.