
Human Disturbance on the Land Surface Environment in Tropical Islands: A Remote Sensing Perspective


1
Key Laboratory of Digital Earth Science, Aerospace Information Research Institute, Chinese Academy of Sciences, Beijing 100094, China
2
International Research Center of Big Data for Sustainable Development Goals, Beijing 100094, China
3
Key Laboratory of Earth Observation of Hainan Province, Sanya 572029, China
4
University of Chinese Academy of Sciences, Beijing 100049, China
*
Author to whom correspondence should be addressed.
Remote Sens. 2022, 14(9), 2100; https://doi.org/10.3390/rs14092100
Submission received: 9 March 2022
/
Revised: 14 April 2022
/
Accepted: 25 April 2022
/
Published: 27 April 2022
(This article belongs to the Special Issue Remote Sensing of Land Use and Land Change with Google Earth Engine)
Abstract
:Geographically isolated islands are under great stress due to global climate change, as well as the social and environmental issues relating to human activities. It is necessary to monitor and analyze the spatial–temporal changes of the land surface environment in species-rich tropical islands in order to realize the sustainable development and protection of island areas. In this study, we extracted the land cover and coastline information of three tropical islands from 1990 to 2020 based on the Google Earth Engine platform and the Random Forest algorithm. The results showed that: (1) different tropical islands have similar characteristics in terms of land surface environment changes, with the amount of artificial surface and cultivated land increasing, the forest and mangrove areas decreasing, and the amount of artificial coastline increasing; (2) human disturbance plays an important role in changes in the land surface environment. Population growth, immigration policies, food security, and human activities related to achieving economic profits are likely responsible for these land cover changes; and (3) the main factors driving coastline changes include natural processes (topography, ecological ecosystems, sea-level rise, sea waves, and storms) and human activities (sand mining, tourism, port construction, aquaculture expansion, and mangrove deforestation). Understanding these changes will help tropical islands and coastal zones to make suitable policies for land management and respond to climate change and sustainable development challenges.
Keywords:
land cover/use; coastline; GEE; small islands; Sri Lanka; Timor; Palawan; sustainable development
1. Introduction
As an important part of the marine ecosystem, islands are of great economic, political, military, scientific, and ecological value and are vital to the sustainable development of coastal countries and the world as a whole. In recent years, human activities have caused a series of ecological and environmental problems for islands, such as disproportionate coastline attributes due to land reclamation activities, the degradation of wetlands, tidal ecological damage, and the encroachment of coastal wetlands by uncontrolled aquaculture development [1,2]. In addition, global climate change has led to serious negative effects on coastal areas [3], such as permanent surface submersion and coastal flooding due to sea-level rise and an increase in coastal vulnerability caused by frequent extreme marine events [4,5]. Compared to the mainland, geographically isolated islands are under greater pressure to respond to global climate change and socioeconomic development [6], with the issues faced by Small Island Developing States (SIDS) receiving the most attention [7]. These island countries encounter various challenges, including their small territorial size and limited resources for development, weak resistance to natural disasters, and high level of dependence on international trade and assistance. Thus, sustainable development that takes into account the social, economic, and environmental aspects of development is critical for the future of island countries, especially in SIDS [8].
Current research on islands focuses on land use/cover, species diversity, ecological environment assessment and management, shoreline changes, vegetation, and algal distribution [9,10,11,12]. Among these aspects, monitoring the island surface ecological environment and understanding the spatial and temporal characteristics of its changes is vital for the rational development of island and marine resources, the protection of islands’ ecological environments, and the realization of their sustainable development. Monitoring the land use/land cover of islands and its changes is an important tool for understanding the changes in islands’ geographic environment [13]. As one of the most important standard elements in the study of the dynamics of coastal zones [4], the coastline is one of the twenty-seven important Earth surface features recognized by the International Geographic Information Committee (IGDC) [14]. The coastline and the process of its variation reflect the interaction between the ecosystem and human activities in the coastal zone region. Thus, in this study, we chose land cover and coastline as typical factors with which to analyze changes in the land surface environment of islands.
Due to the short periodicity and repetitive observation capacity of satellites, remote sensing plays an important role in monitoring geographic factors, geological disasters, and the atmospheric environment, as well as providing effective massive data and strong technical support for the ecological monitoring of island environments [15]. A series of studies on the extraction and spatio-temporal analysis of land cover/use in islands have been conducted using remote sensing technology. In terms of data sources, the existing studies mainly use medium-resolution and high-resolution satellite data such as Landsat, IKONOS, Quick Bird, and SPOT, as well as SAR images and UAV remote sensing data. For example, Chen et al. used multi-source and time-series remote sensing data (CORONA, Landsat, and SPOT 5) to reconstruct the change process of land cover on Zhoushan Island over the past four decades at a fine scale; they found that a large amount of agricultural land was lost, while water bodies and forests were well-protected [16]. In terms of technical methods, the existing studies mostly use visual interpretation, the maximum likelihood method, the object-oriented method, neural networks, and other classification methods to extract the land cover data of islands. For example, Mageswaran et al. used Landsat satellite data to obtain the land-use information of Neil Island (south Andaman) through visual interpretation and found that the area of forest decreased and the area of built-up land increased from 2000 to 2013 [17]. Cao et al. used the back propagation neural network based on airborne images to extract the land cover information of Dongyu Island in Hainan [18]. The main methods used to extract coastline data from remote sensing images are visual interpretation and automated extraction (including the threshold segmentation method, image classification method, and edge detection method) [14,19,20,21,22,23]. For example, Hou et al. obtained coastline information by visual interpretation; the results obtained were smoother and precisely matched the actual coastline location [20]. Kuleli et al. analyzed the coastline change rates in the coastal wetlands of Turkey by automatic detection using multi-temporal Landsat images [21]. Zhang et al. extracted the water edge line of Qinhuangdao City using an improved Canny operator and then corrected it to the coastline using tide level data and field GPS measurement data [22]. Puissant et al. proposed a new approach based on morphological tools to extract coastline data from VHR imagery according to their context [23].
At present, the research on islands still has some limitations: the research in this area mainly focuses on economically developed islands close to the mainland, whereas there is less research on tropical islands far from the mainland. Moreover, using traditional methods of data acquisition and processing is less efficient, and the existing research is mainly focused on very small islands or small parts of islands due to the limitation of technical methods and available data. In recent years, high-performance cloud computing technologies such as the Google Earth Engine (GEE, which is currently the world’s most advanced petabyte-scale platform for the scientific analysis and visualization of geographic data [24]) have been developed; these have the advantages of long-term data archiving, stable operation, high computational efficiency, low hands-on difficulty, and low cost. Therefore, this paper will: (a) extract the land cover and coastline data of three tropical islands (area over 10,000 km2) based on the GEE platform; and (b) analyze the spatial and temporal change patterns of land surface ecological environments and their impact on tropical islands. This can provide a more efficient technical route for the monitoring of the ecological environment in large tropical islands and further provide basic data helping islands to cope with global climate change and achieve sustainable development.
2. Materials and Methods
2.1. Study Areas
This paper selected three Asian tropical islands with a medium size (area over 10,000 km2), including Sri Lanka (for the country level), Timor Island (for the regional level; this is administered by two countries, Indonesia and Timor-Leste), and Palawan Island (for the provincial level; this is an island province of the Philippines). The three islands have different levels of economic development. Sri Lanka represents the high level, as it is currently the only country in South Asia rated “high” in the Human Development Index according the Human Development Report of UNDP [25]. Timor and Palawan represent the low level (especially East Timor, which is the least developed and belongs to SIDS). In terms of the natural and ecological environment, Palawan is famous for its biodiversity (terrestrial and marine) and Sri Lanka is one of the biodiversity hotspots of the world.
2.1.1. Sri Lanka
Sri Lanka is a tropical island country in South Asia located in the Indian Ocean (5°55′–9°50′N, 79°42′–81°53′E) (Figure 1). The main island of Sri Lanka has an area of 65,268 km2, with 1585 km of coastline. Sri Lanka Island is the 25th largest island in the world by area [26]. Sri Lanka is known as the “Kingdom of Gems” and the “Pearl of the Indian Ocean”, and is currently the only country in South Asia rated “high” in the Human Development Index [25]. Sri Lanka Island is roughly pear-shaped, with a high plateau in the south and a plain in the north and coastal areas. Sri Lanka has a tropical monsoon climate and its year is divided into a rainy season and a dry season. The average annual precipitation of Sri Lanka ranges from 1283 mm to 3321 mm, and the average annual temperature ranges from 28 to 31 °C. In addition, Sri Lanka is rich in minerals, fisheries, and forestry resources. Sri Lanka’s economy is dominated by services (accounted for 58.2% in 2019), industry (27.4%), and agriculture (7.4%) [27]. Additionally, its main crops are tea, rubber, coconut, and rice.
2.1.2. Timor Island
Timor Island is located in the easternmost part of the Lesser Sunda Islands between the Savu and Timor seas (8°32′–10°37′S, 123°45′–127°30′E) (Figure 1). With an area of about 30,777 km2, Timor Island is the 43rd largest island in the world [26]. Timor Island is divided into two parts; the eastern half is the Democratic Republic of Timor-Leste (East Timor), with an area of about 14,874 km2, while the western half belongs to Indonesia, with an area of about 15,850 km2, and is also known as West Timor. Timor Island has a tropical rainforest climate with a hot climate and distinct dry and rainy seasons. The annual rainfall in Timor Island is about 1500 mm. Timor has high mountains, steep coasts, coral reefs, and frequent earthquakes. Timor is rich in forestry and mineral resources. Its main source of economic activity is agriculture, including crops (corn and rice) and plantations (coconut, coffee, and rubber). Some timber harvesting is undertaken, and fisheries mainly catch sea cucumbers and pearls.
2.1.3. Palawan Island
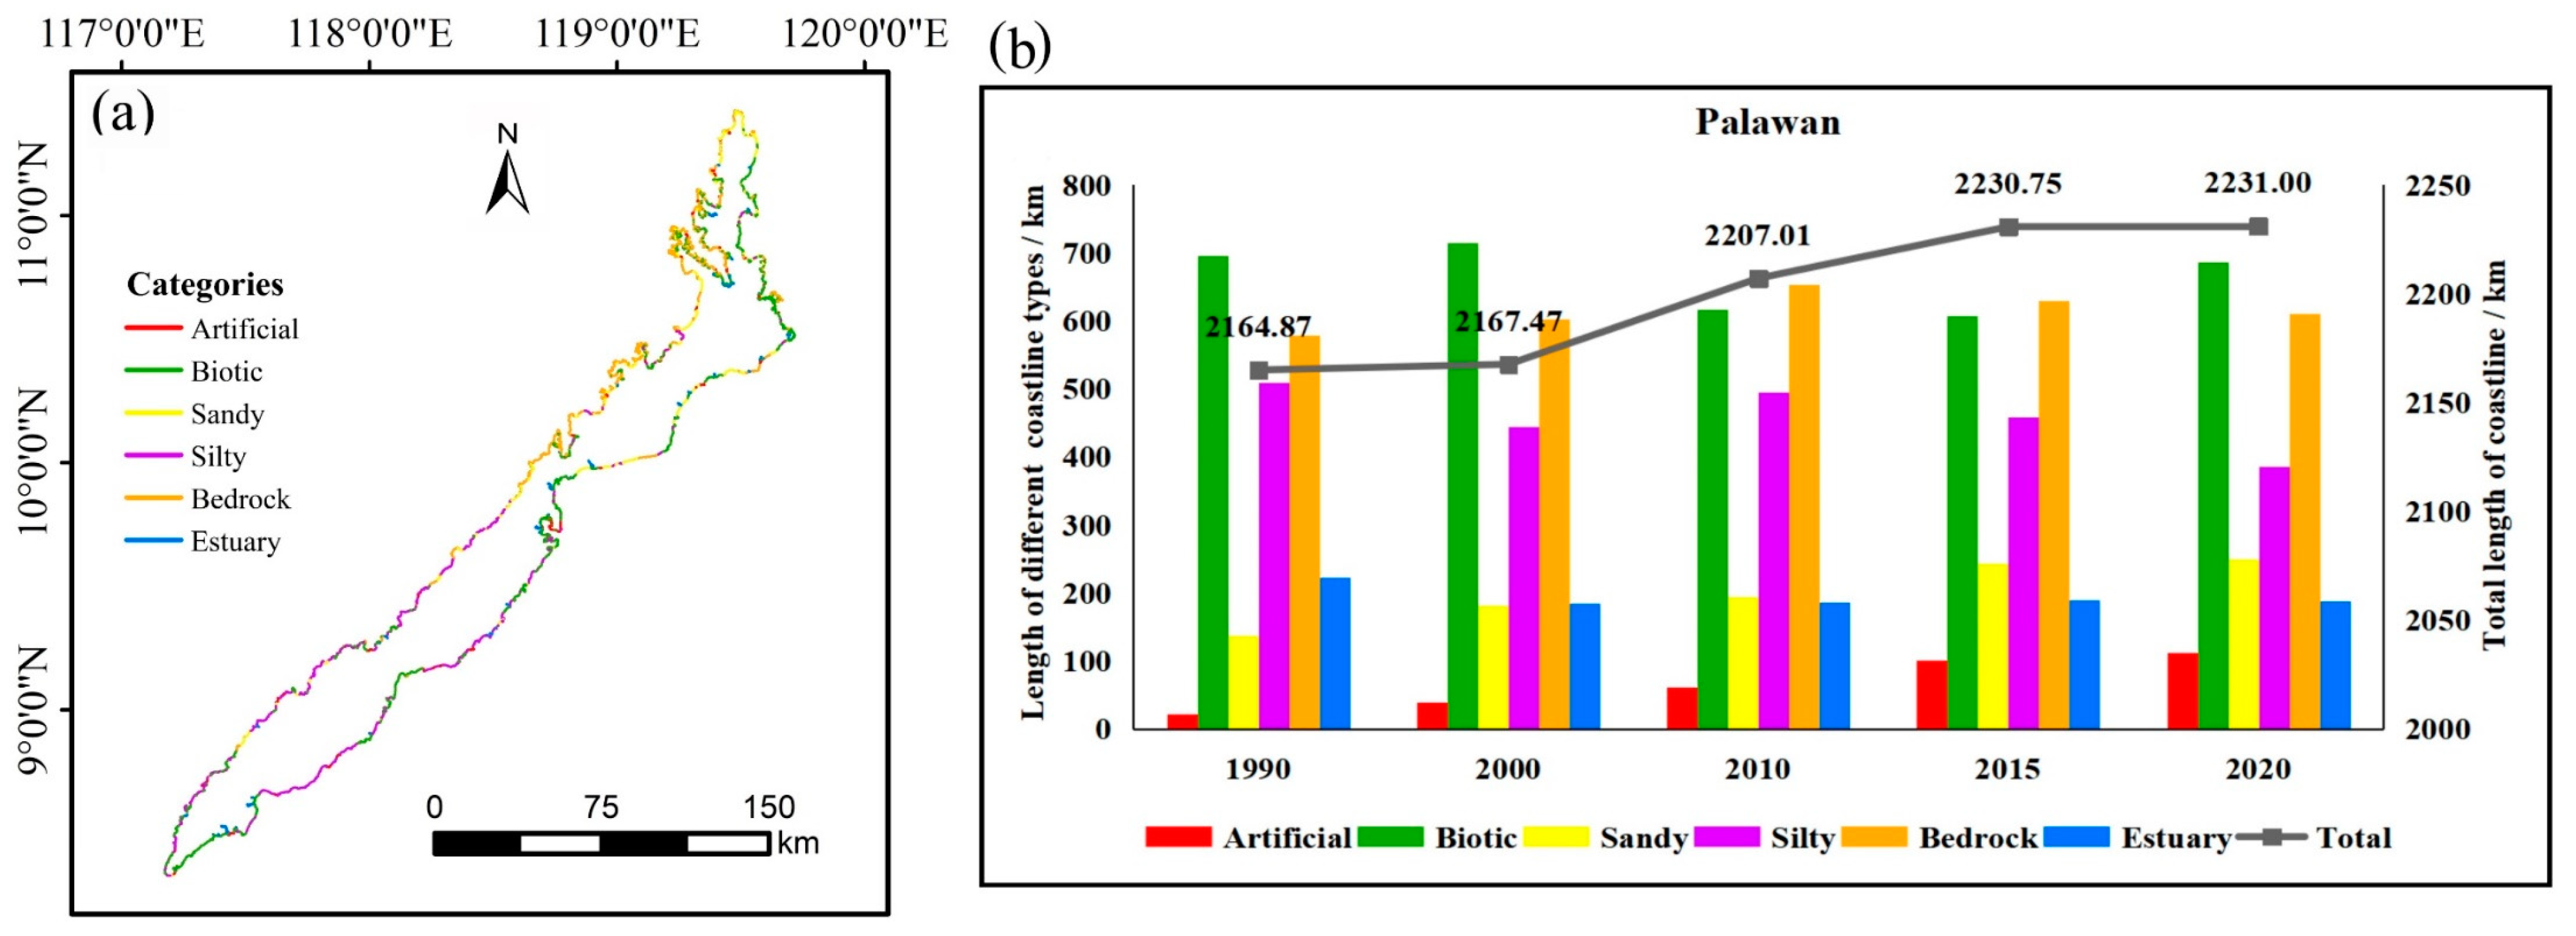
Palawan is a tropical island located in the western part of the Philippines, between the South China Sea and the Sulu Sea (8°34′–11°50′N, 117°17′–119°71′E), with an area of about 11,784 km2 and a coastline length of about 1354 km (Figure 1). Palawan island is the 64th largest island in the world [26]. Most of its area is still unexplored, and it is rich in biological resources, being known as the “Utopia of the Sea” and the “Most Beautiful Island in the World”. Palawan is long and narrow, sloping from northeast to southwest. Palawan has a tropical maritime monsoon climate, with a dry season and a rainy season. Palawan is rich in agricultural land, tropical timber, fishing, and mineral resources. The island also has beautiful beaches, coral reefs, a world-famous underground river, and endemic wildlife, all of which are attracting more and more tourists. Agriculture is also its main source of economic activity, which is mainly distributed in the coastal plain. Additionally, the agriculture mode is rotational, with rice being the main food crop, but corn, beans, and sweet potatoes also being grown.
2.2. Datasets
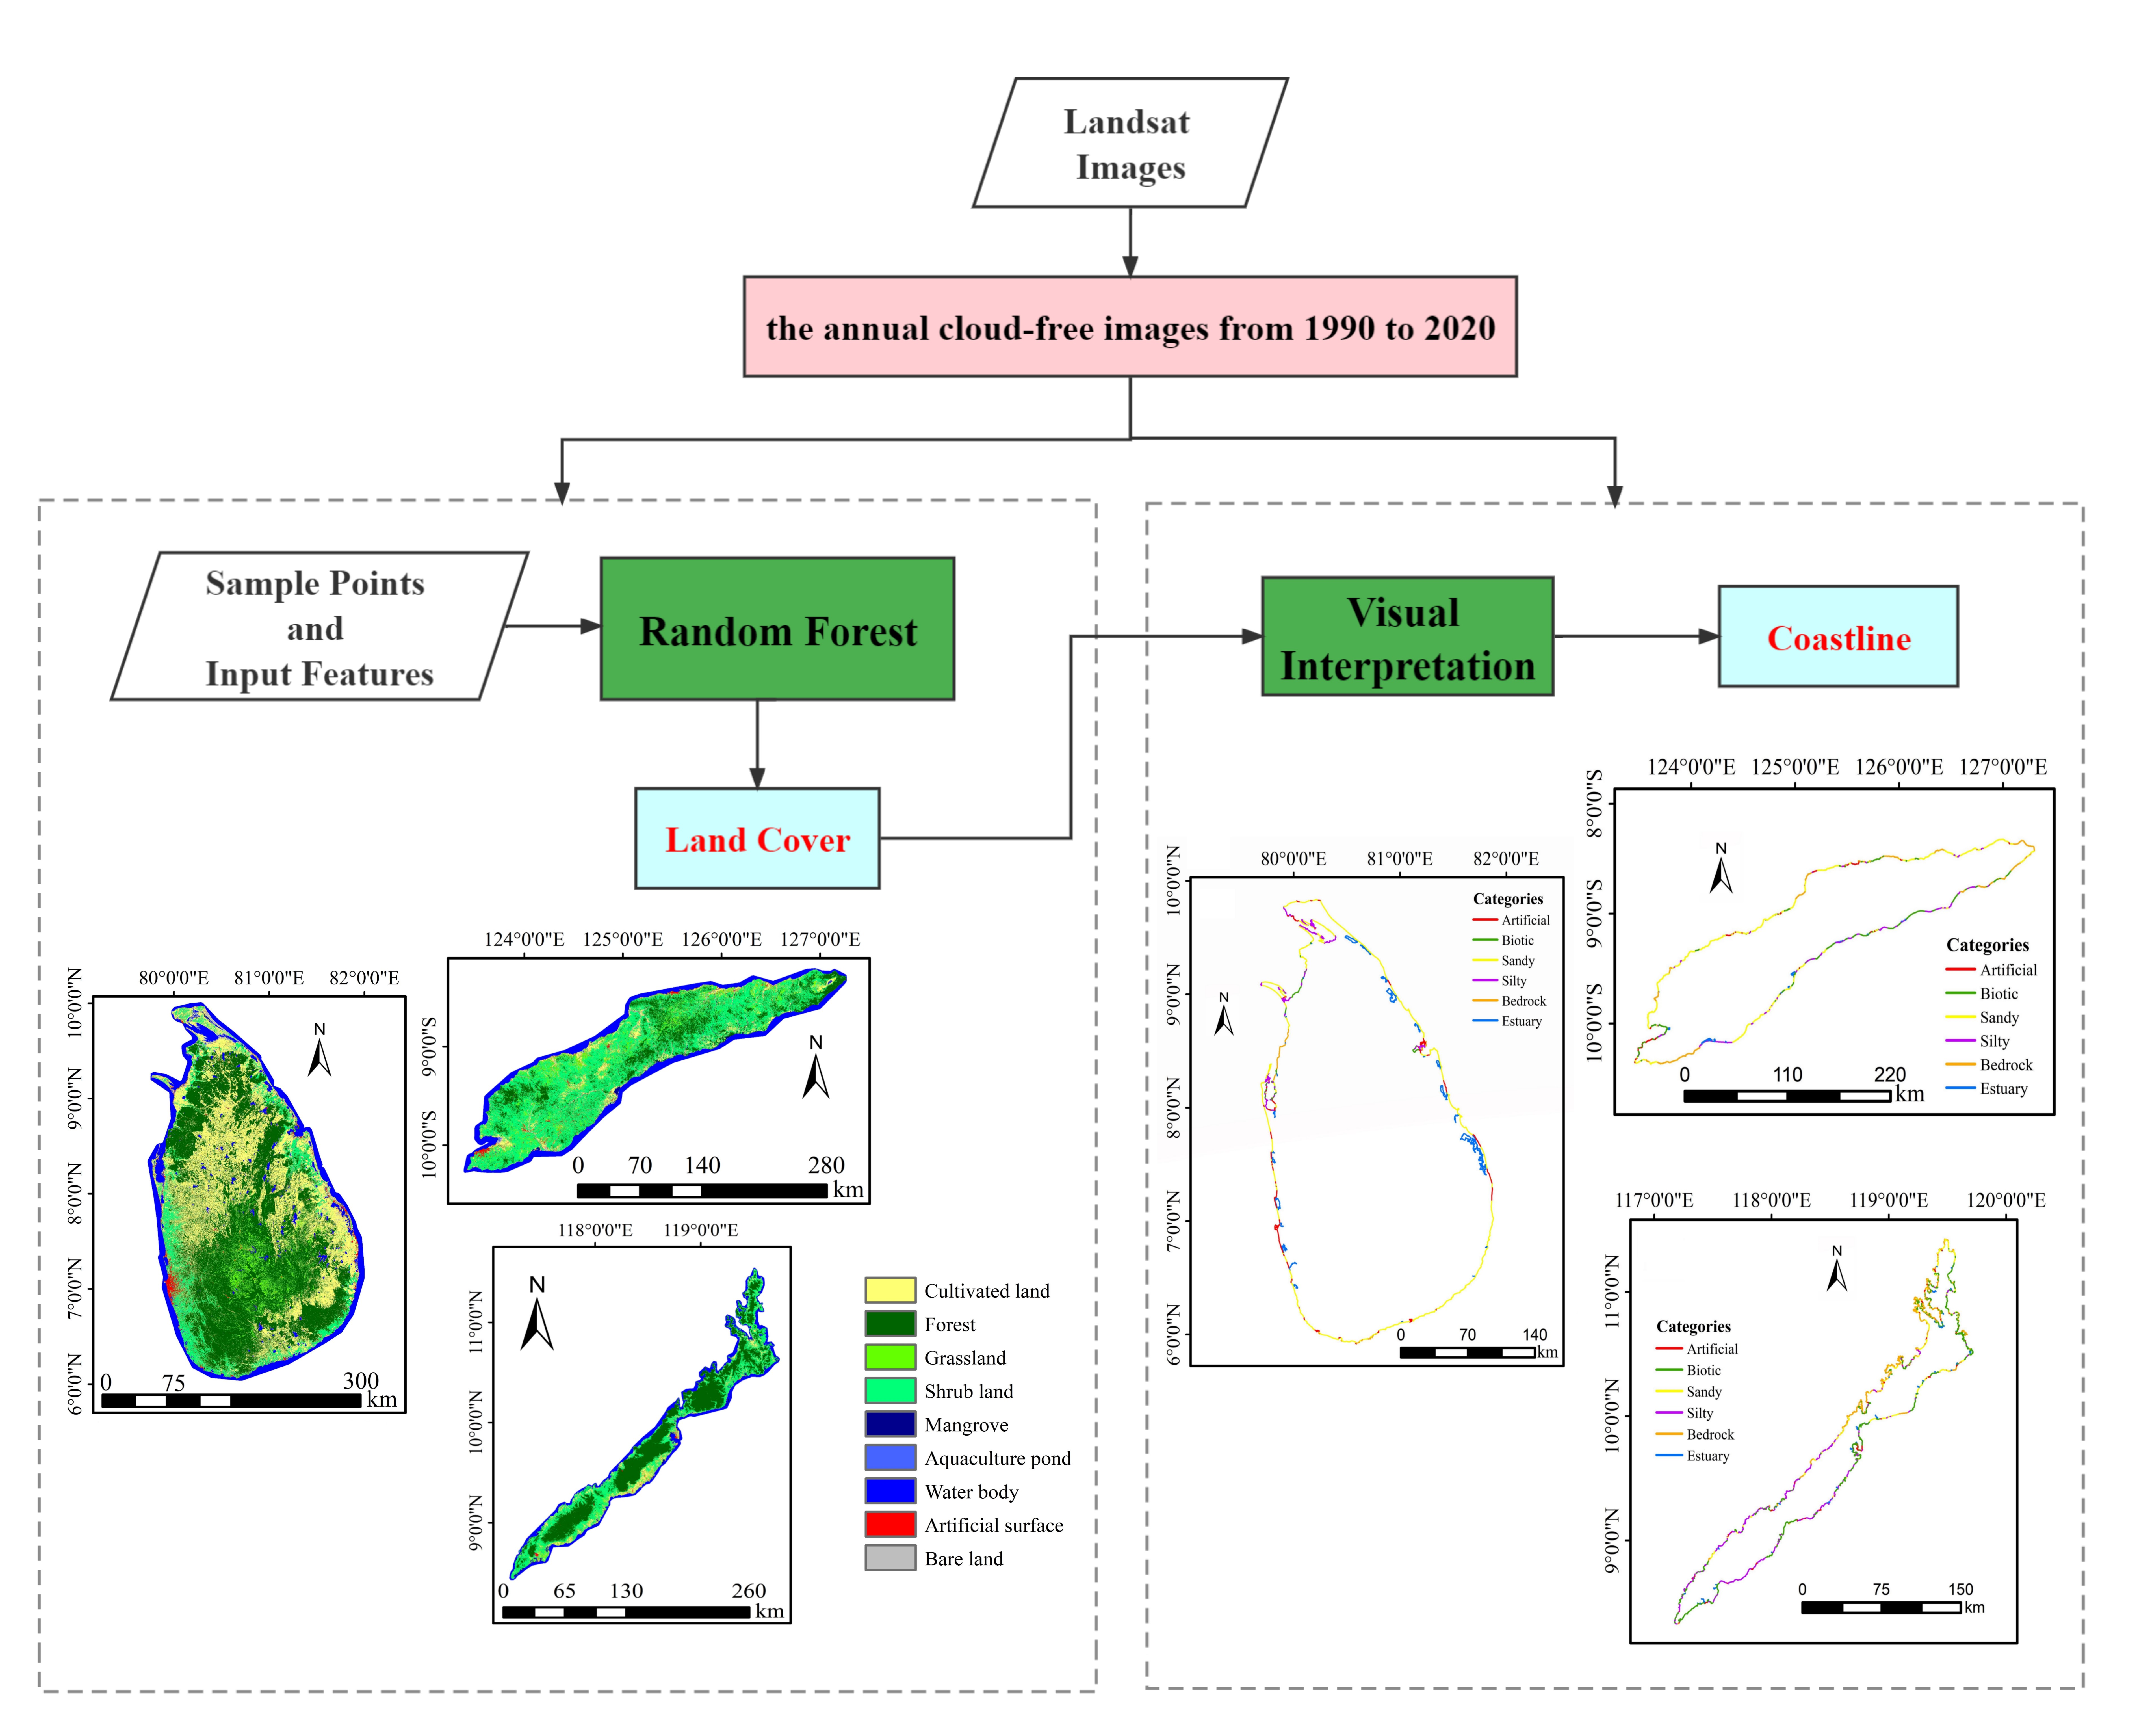
Based on the online programming platform of the Google Earth Engine, this study selected data from the five periods of 1990, 2000, 2010, 2015, and 2020 to monitor the land cover changes of the three islands. The main datasets used were Landsat images, Synthetic Aperture Radar (SAR) data, and Digital Elevation Model (DEM) data.
2.2.1. Landsat Data
Since the study areas are located in the tropics and severely affected by clouds and rain, the raw Landsat images taken from January to December of the study year were selected based on the GEE to ensure that an image of the study area with the minimum amount of clouds could be composited. We used the simple composite algorithm module provided by GEE to create a Landsat Top-Of-Atmosphere (TOA) composite from a collection of raw Landsat scenes. The size of the range of cloud scores to accept per pixel was 10, and the percentile value used when compositing each band was 50 in our study. Next, the final annual TOA image with the minimum cloud coverage was composited and used in land cover classification.
2.2.2. SAR Data
Since Synthetic Aperture Radar (SAR) is not affected by cloud and rain and has the advantage of all-day, all-weather monitoring, it can be used to compensate for the lack of available optical images due to clouds and rain in tropical island areas. Back-scattering coefficient data with VV and VH polarization obtained from Sentinel-1 SAR GRD data (with a resolution of 10 m, Earth Engine Dataset: “COPERNICUS/S1_GRD”; provider: European Union/ESA/Copernicus) were mainly used in the land cover classification for 2015 and 2020, and the annual mean SAR image was composited using the online API programming of GEE. HH and HV polarization back-scattering coefficient bands were selected as the feature inputs from the PALSAR-2 yearly mosaic data (with a resolution of 25 m, Earth Engine Dataset: “JAXA/ALOS/PALSAR/YEARLY/SAR”; provider: JAXA EORC), which was mainly used in the land cover classification for 2010.
2.2.3. DEM Data
Since DEM data have the ability to improve the distinction among land cover classes, the 30 m STRM digital elevation model data (Earth Engine Dataset: “USGS/SRTMGL1_003”; provider: NASA/USGS/JPL-Caltech) were also used in our study. Elevation, slope, aspect, and hillshade bands were added to the feature inputs to aid in the classification.
2.3. Methods
2.3.1. Extraction of the Land Cover Map
Land cover is the basic and most important element of the island ecological environment. Based on the land surface characteristics of the tropical islands, the classification system in our study was constructed with reference to the GlobeLand30 data product [28] and relevant research on the classification system used for coastal zones [29]. There are nine kinds of land cover on islands: cultivated land, forest, grassland, shrub land, mangrove, aquaculture pond, water body, artificial surface, and bare land. Due to its advantages of fast learning speed, low need for manual intervention, and high accuracy, we used the Random Forest (RF) algorithm to extract the land cover data of tropical islands [30]; this is a combinatorial classification algorithm based on the classification and regression tree (CART) that was proposed by Leo Breiman in 2001 [31].
Using multiple feature variables and combinations of feature variables can effectively improve the accuracy of classification. Thus, we selected multi-spectral bands, SAR bands, index features, terrain features, and texture features as the input features for the Random Forest algorithm. The multi-spectral bands were derived from the annual minimum cloud TOA composite image, and the SAR bands are explained in Section 2.2.2. The calculation equations of index features can be seen in Table 1, and the terrain features include the elevation, slope, aspect, and hillshade bands obtained from the DEM data. The texture features include the eight typical texture indices obtained by the Gray Level Co-occurrence Matrix (GLCM, which is a tabulation of how often different combinations of pixel brightness values occur in an image [32]), including angular second moment, contrast, correlation, variance, inverse difference moment, and entropy. In our study, we selected the near-infrared bands of Landsat image data and polarization bands of radar data to calculate the texture features.
Confusion matrices were used to evaluate the accuracy of classification, and the indices of the confusion matrix included the overall accuracy (OA) and Kappa coefficient. The classification sample points were selected based the high-spatial resolution images from Google Earth; Table 2 shows the total number of sample points for each period. A total of 70% of the sample points were randomly selected as training samples for classification, and 30% of them were randomly selected as validation samples for accuracy assessment.
2.3.2. Extraction of Coastlines
Coastline data were extracted by visual interpretation using the annual cloud-free images synthesized by the GEE platform (based on Landsat images) with reference to the results from land cover classification and Google Earth high-resolution images. Based on the interpreted signs of coastlines from the Landsat satellite images and related research [33,34], the coastline types of tropical islands mainly included artificial and natural coastlines, and the natural coastlines could be subdivided into biotic, sandy, silty, bedrock, and estuary coastlines in detail.
3. Results
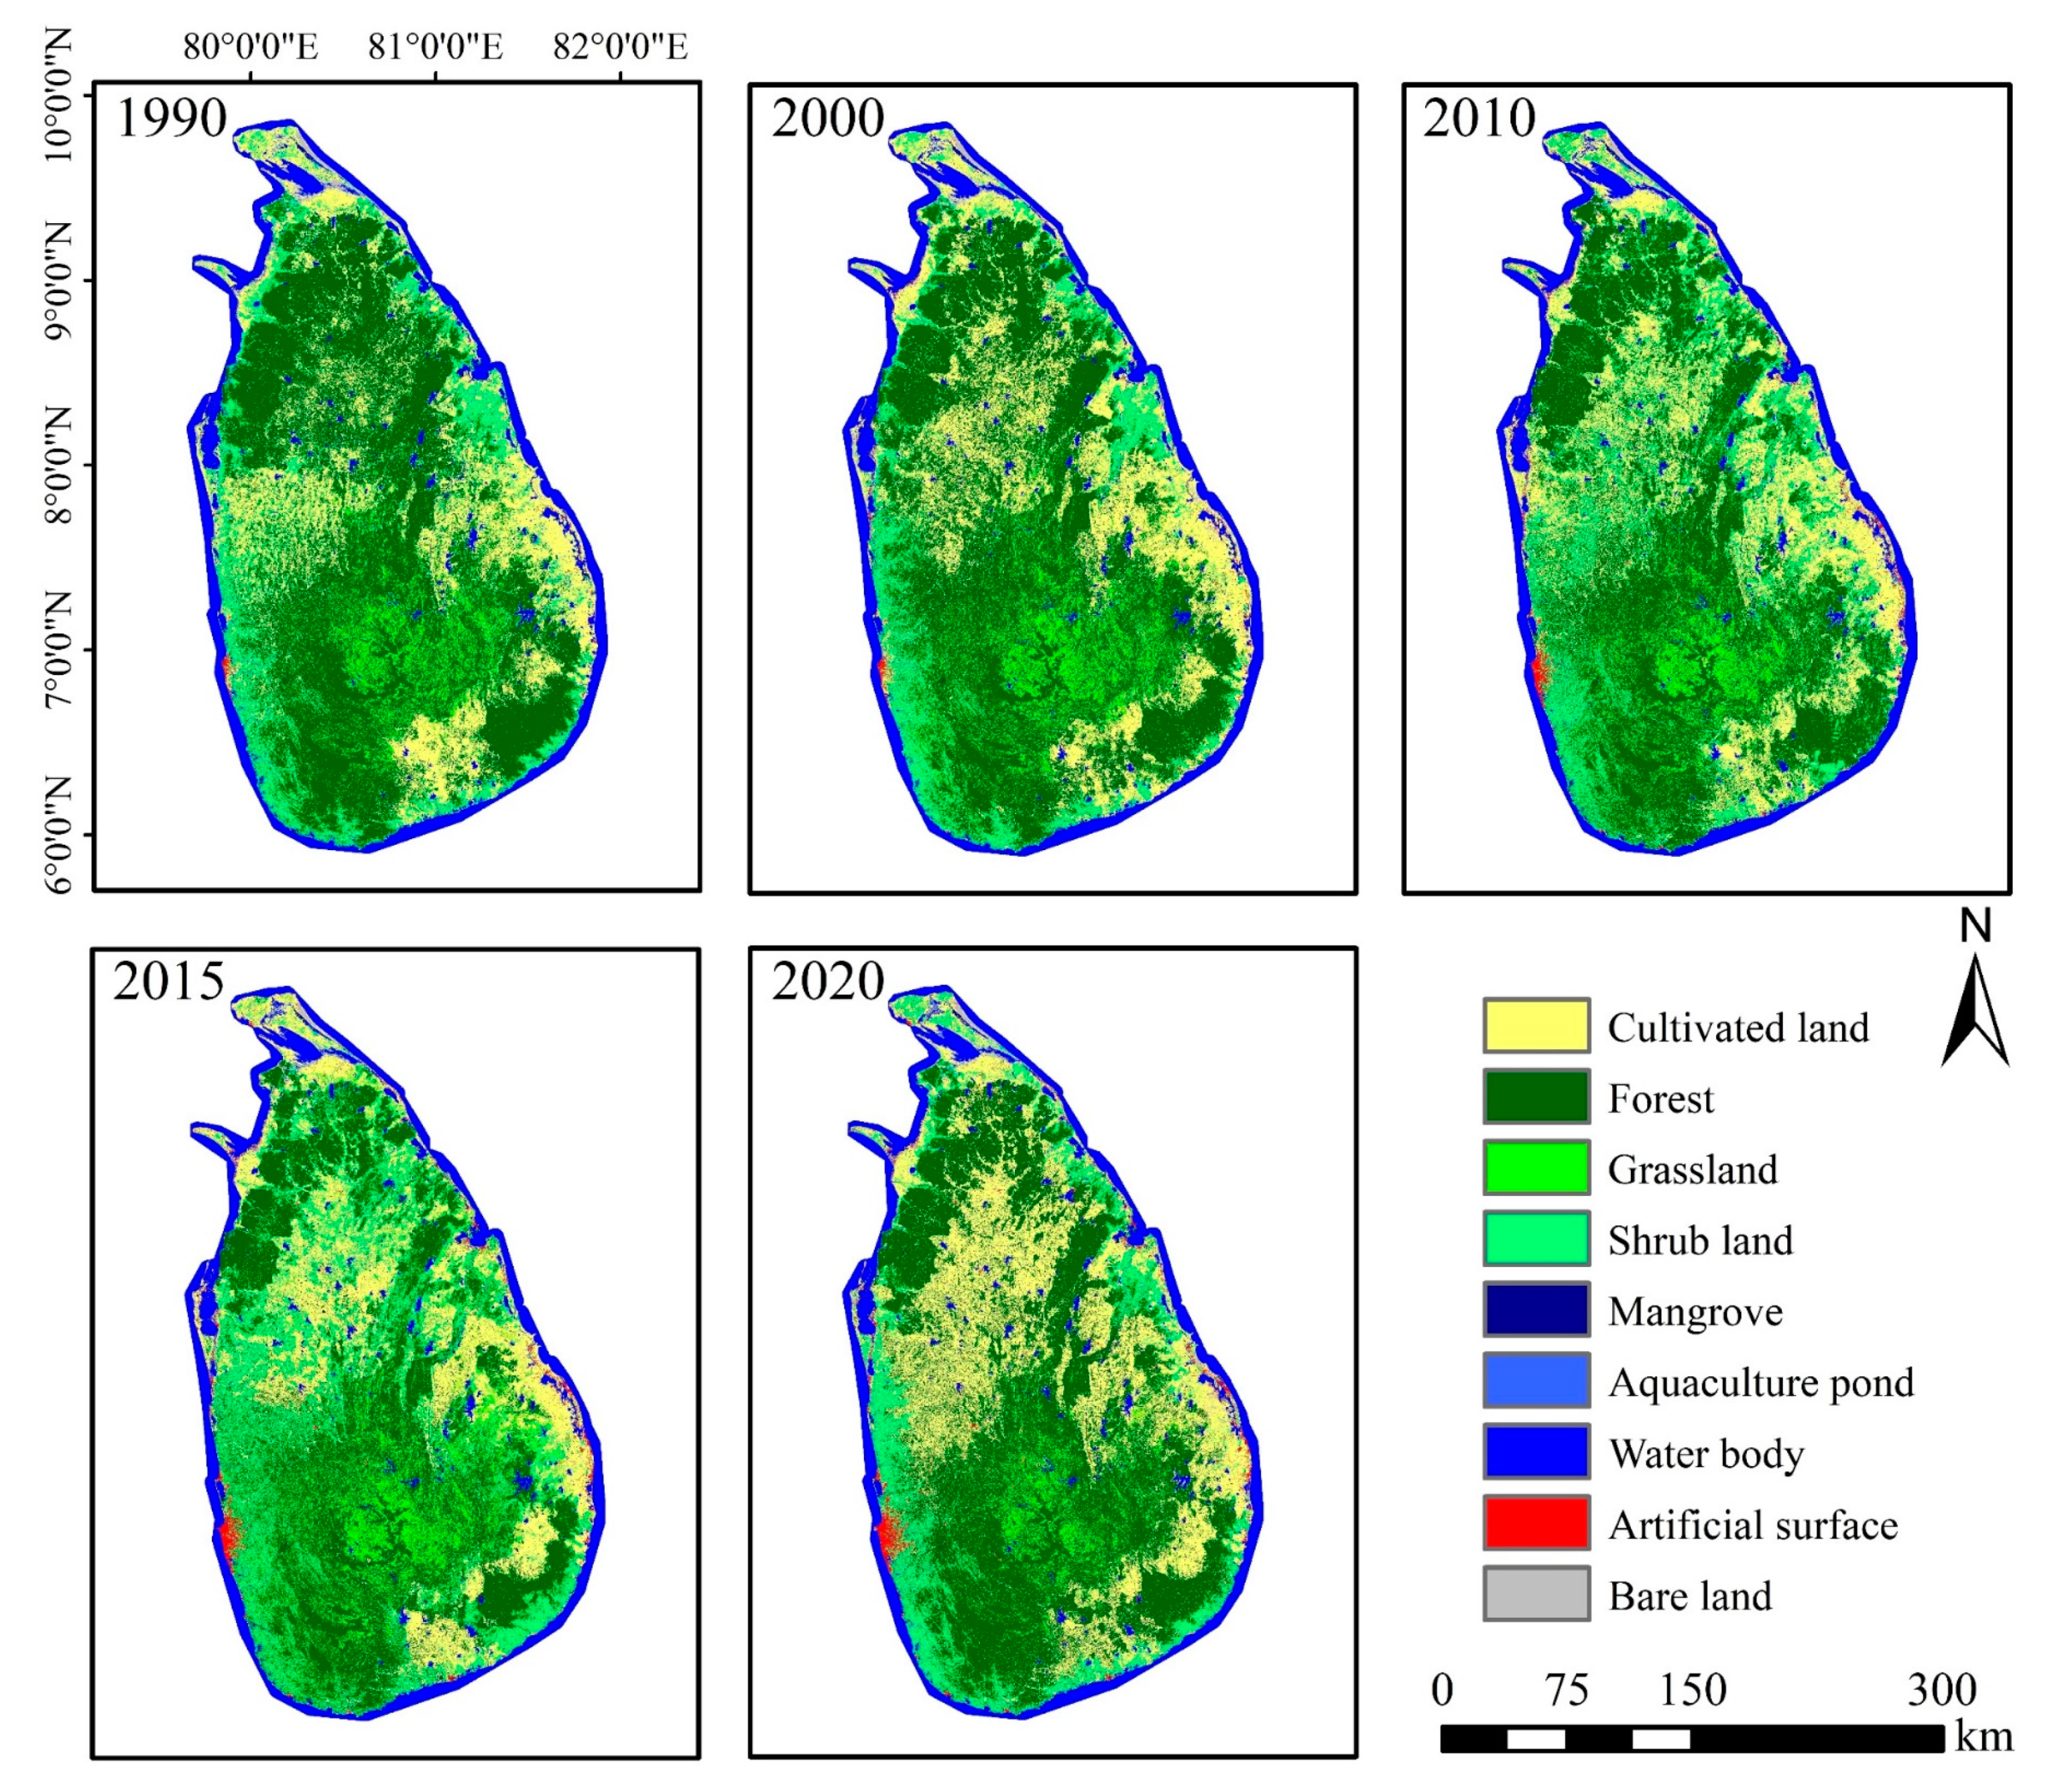
3.1. Surface Land Cover Changes of the Three Tropical Islands
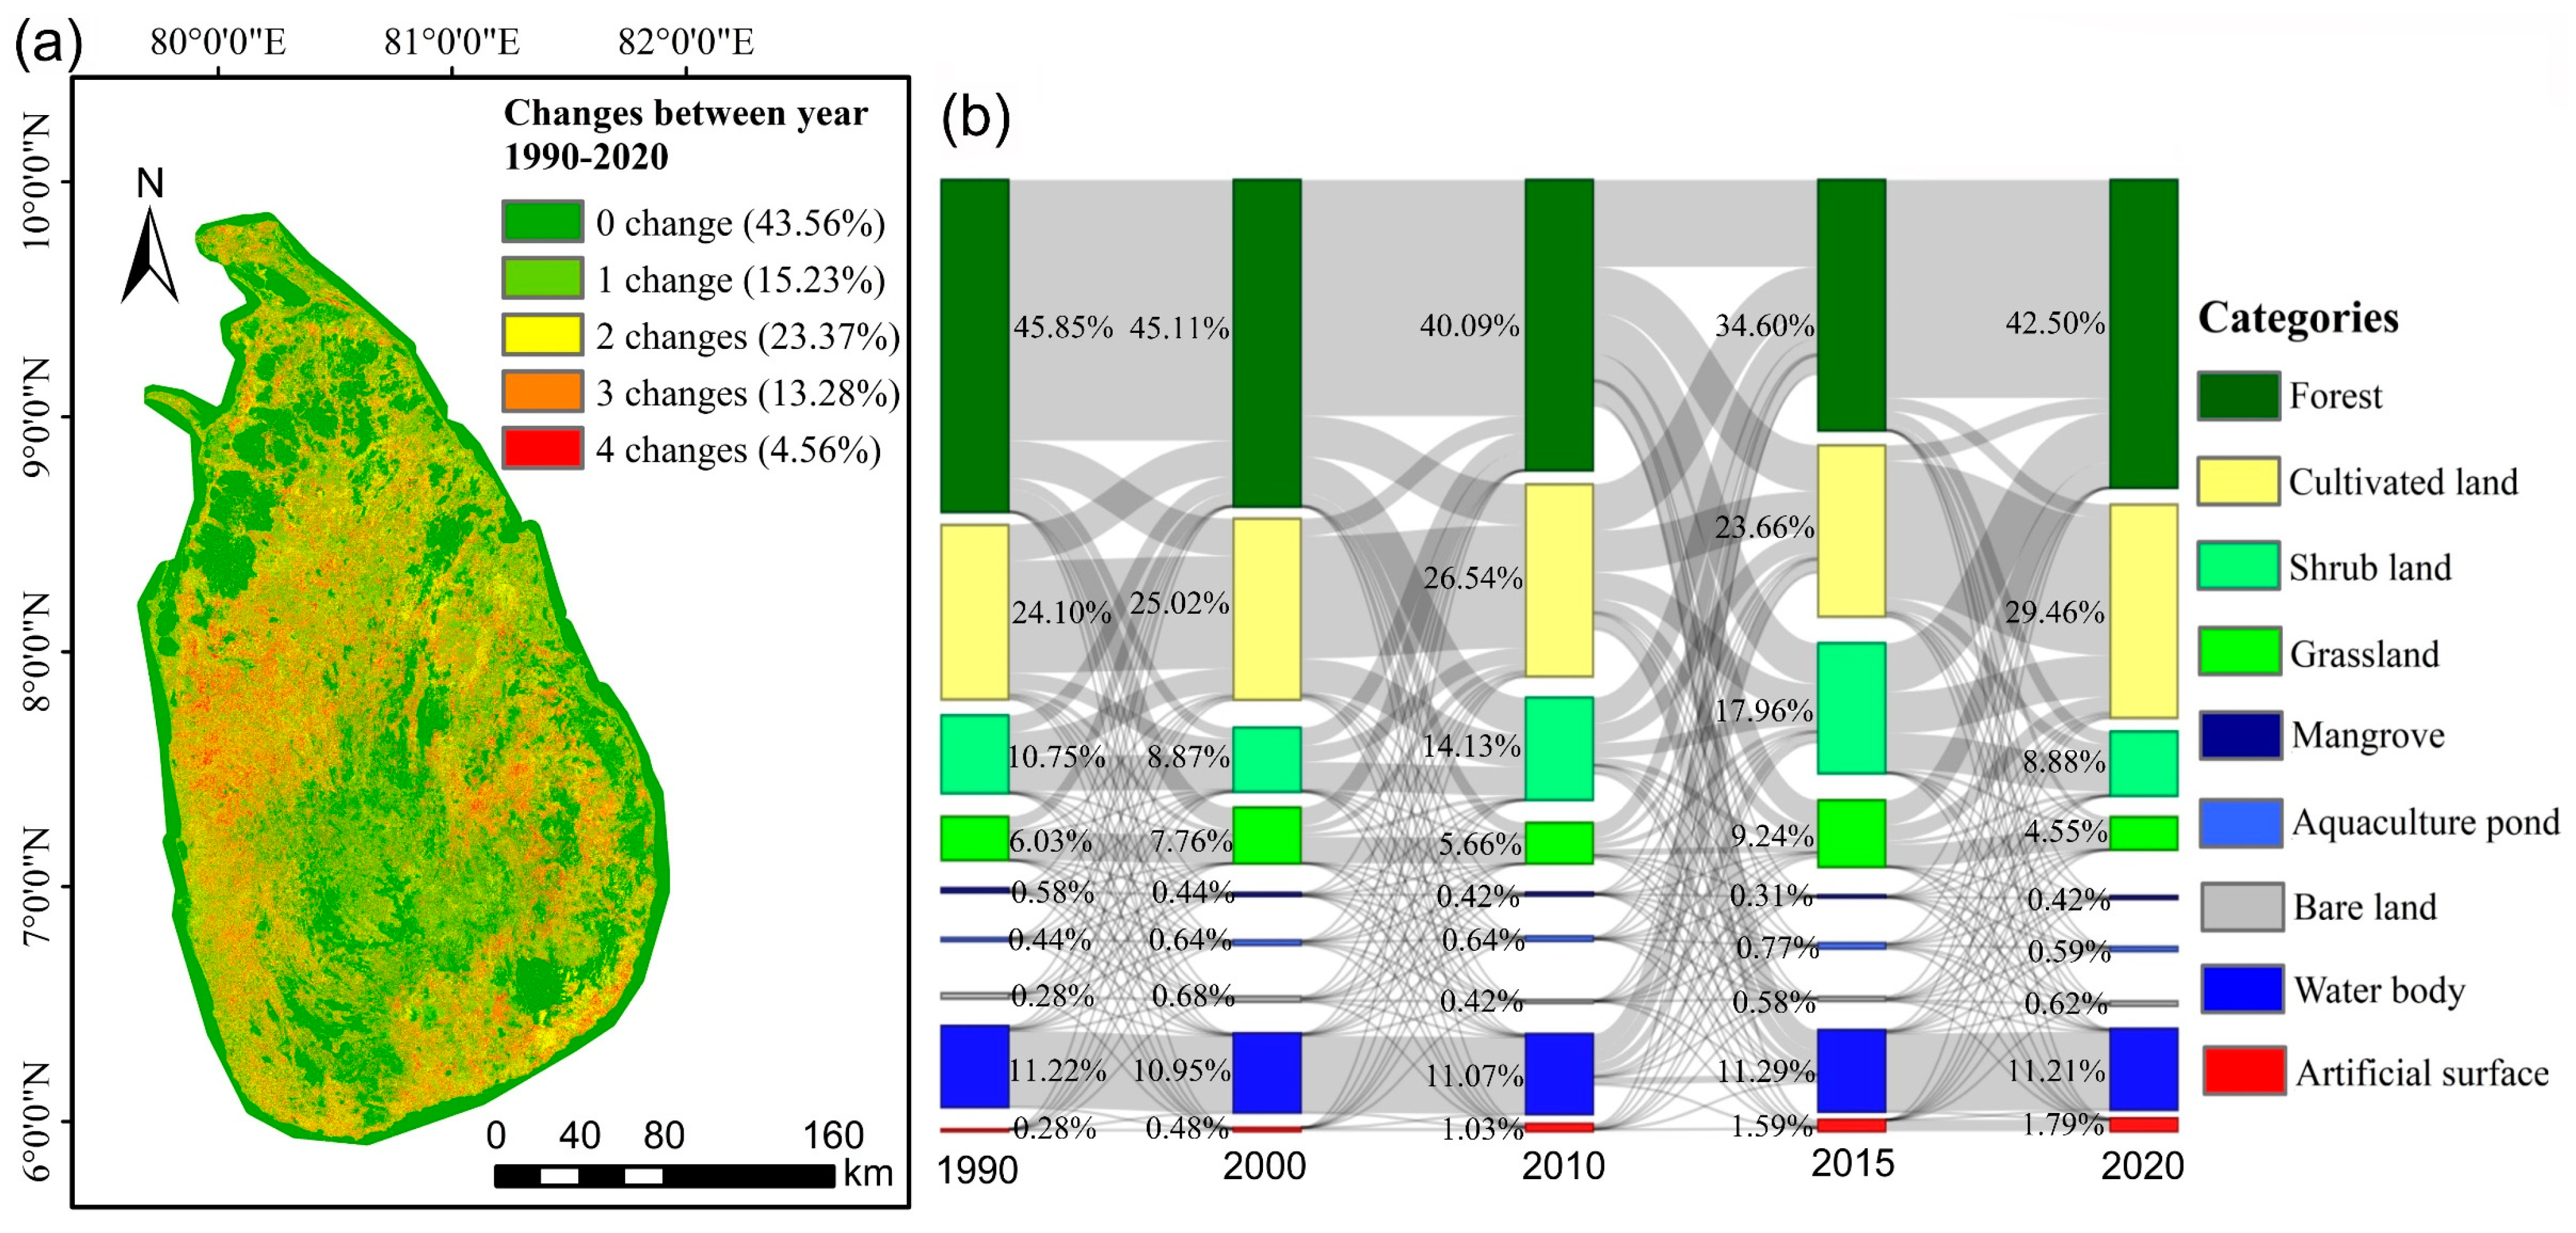
The accuracy of the land cover classification is shown in Table 2. The average overall accuracy was above 85%, and the average Kappa coefficient was above 0.85. Therefore, the classification results were reliable for monitoring the temporal and spatial change in land cover for three tropical islands from 1990 to 2020. According to the classification results, we calculated the overall changes in the key land cover types of three islands (see Table 3). In order to display the spatial distribution of the intensity of land cover changes, we further obtained the frequency of land cover changes for each pixel (30 m by 30 m) over the past 30 years. In addition, we visualized the detailed transfer information between different land cover types between 1990 and 2020 with change flows.
3.1.1. Sri Lanka
Table A1 showed the area statistics of land cover types in Sri Lanka between 1990 and 2020. The land cover of Sri Lanka (Figure 2) is dominated by forest (accounting for 45.85% in 1990 and 42.50% in 2020) and cultivated land (accounting for 24.10% in 1990 and 29.46% in 2020); the overall structure of land cover remained basically unchanged from 1990 to 2020. The area of cultivated land showed an increasing trend (Table 3), with an increase of 3952.71 km2 (grew by 22%). The area of forest decreased by 8306.86 km2 from 1990 to 2015, and then increased by 31,377.96 km2 from 2015 to 2020, with a trend of shrinkage in general (Table 3). The area of artificial surface showed a significant increase from 205.23 km2 in 1990 to 1321.67 km2 in 2020, with an increase of 1116.45 km2 (about 5.44 times). The mangrove showed the characteristic of decreasing first and then increasing, with a decrease of 121.13 km2 (decreased by 28%) in general.
From Figure 3a, we found that 43.56% of the land had unchanged over the 30 years. The 23.37% and 15.23% have changed twice and once, respectively, mainly in the mountainous areas in the south-central portion of Sri Lanka, where the land cover is mostly grassland. In total, 4.56% of the land shows strong dynamic changes, with four changes occurring from 1990 to 2020, mainly distributed in cultivated land adjacent to shrub land.
Figure 3b shows that the inflow and outflow directions of cultivated land are mainly forest and shrub land, while the main inflow and outflow directions of forest are cultivated land, shrub land, and grassland. In total, 18.97% of the forest and 31.66% of the shrub land in 1990 became cultivated land by 2020, respectively. Additionally, the new cultivated land in 2020 had mainly been transferred from forest land in 1990 (accounting for 29.77% of the cultivated land area in 2020), and the new artificial surface had mainly been transferred from cultivated land in 1990 (accounting for 46.45% of the artificial surface area in 2020).
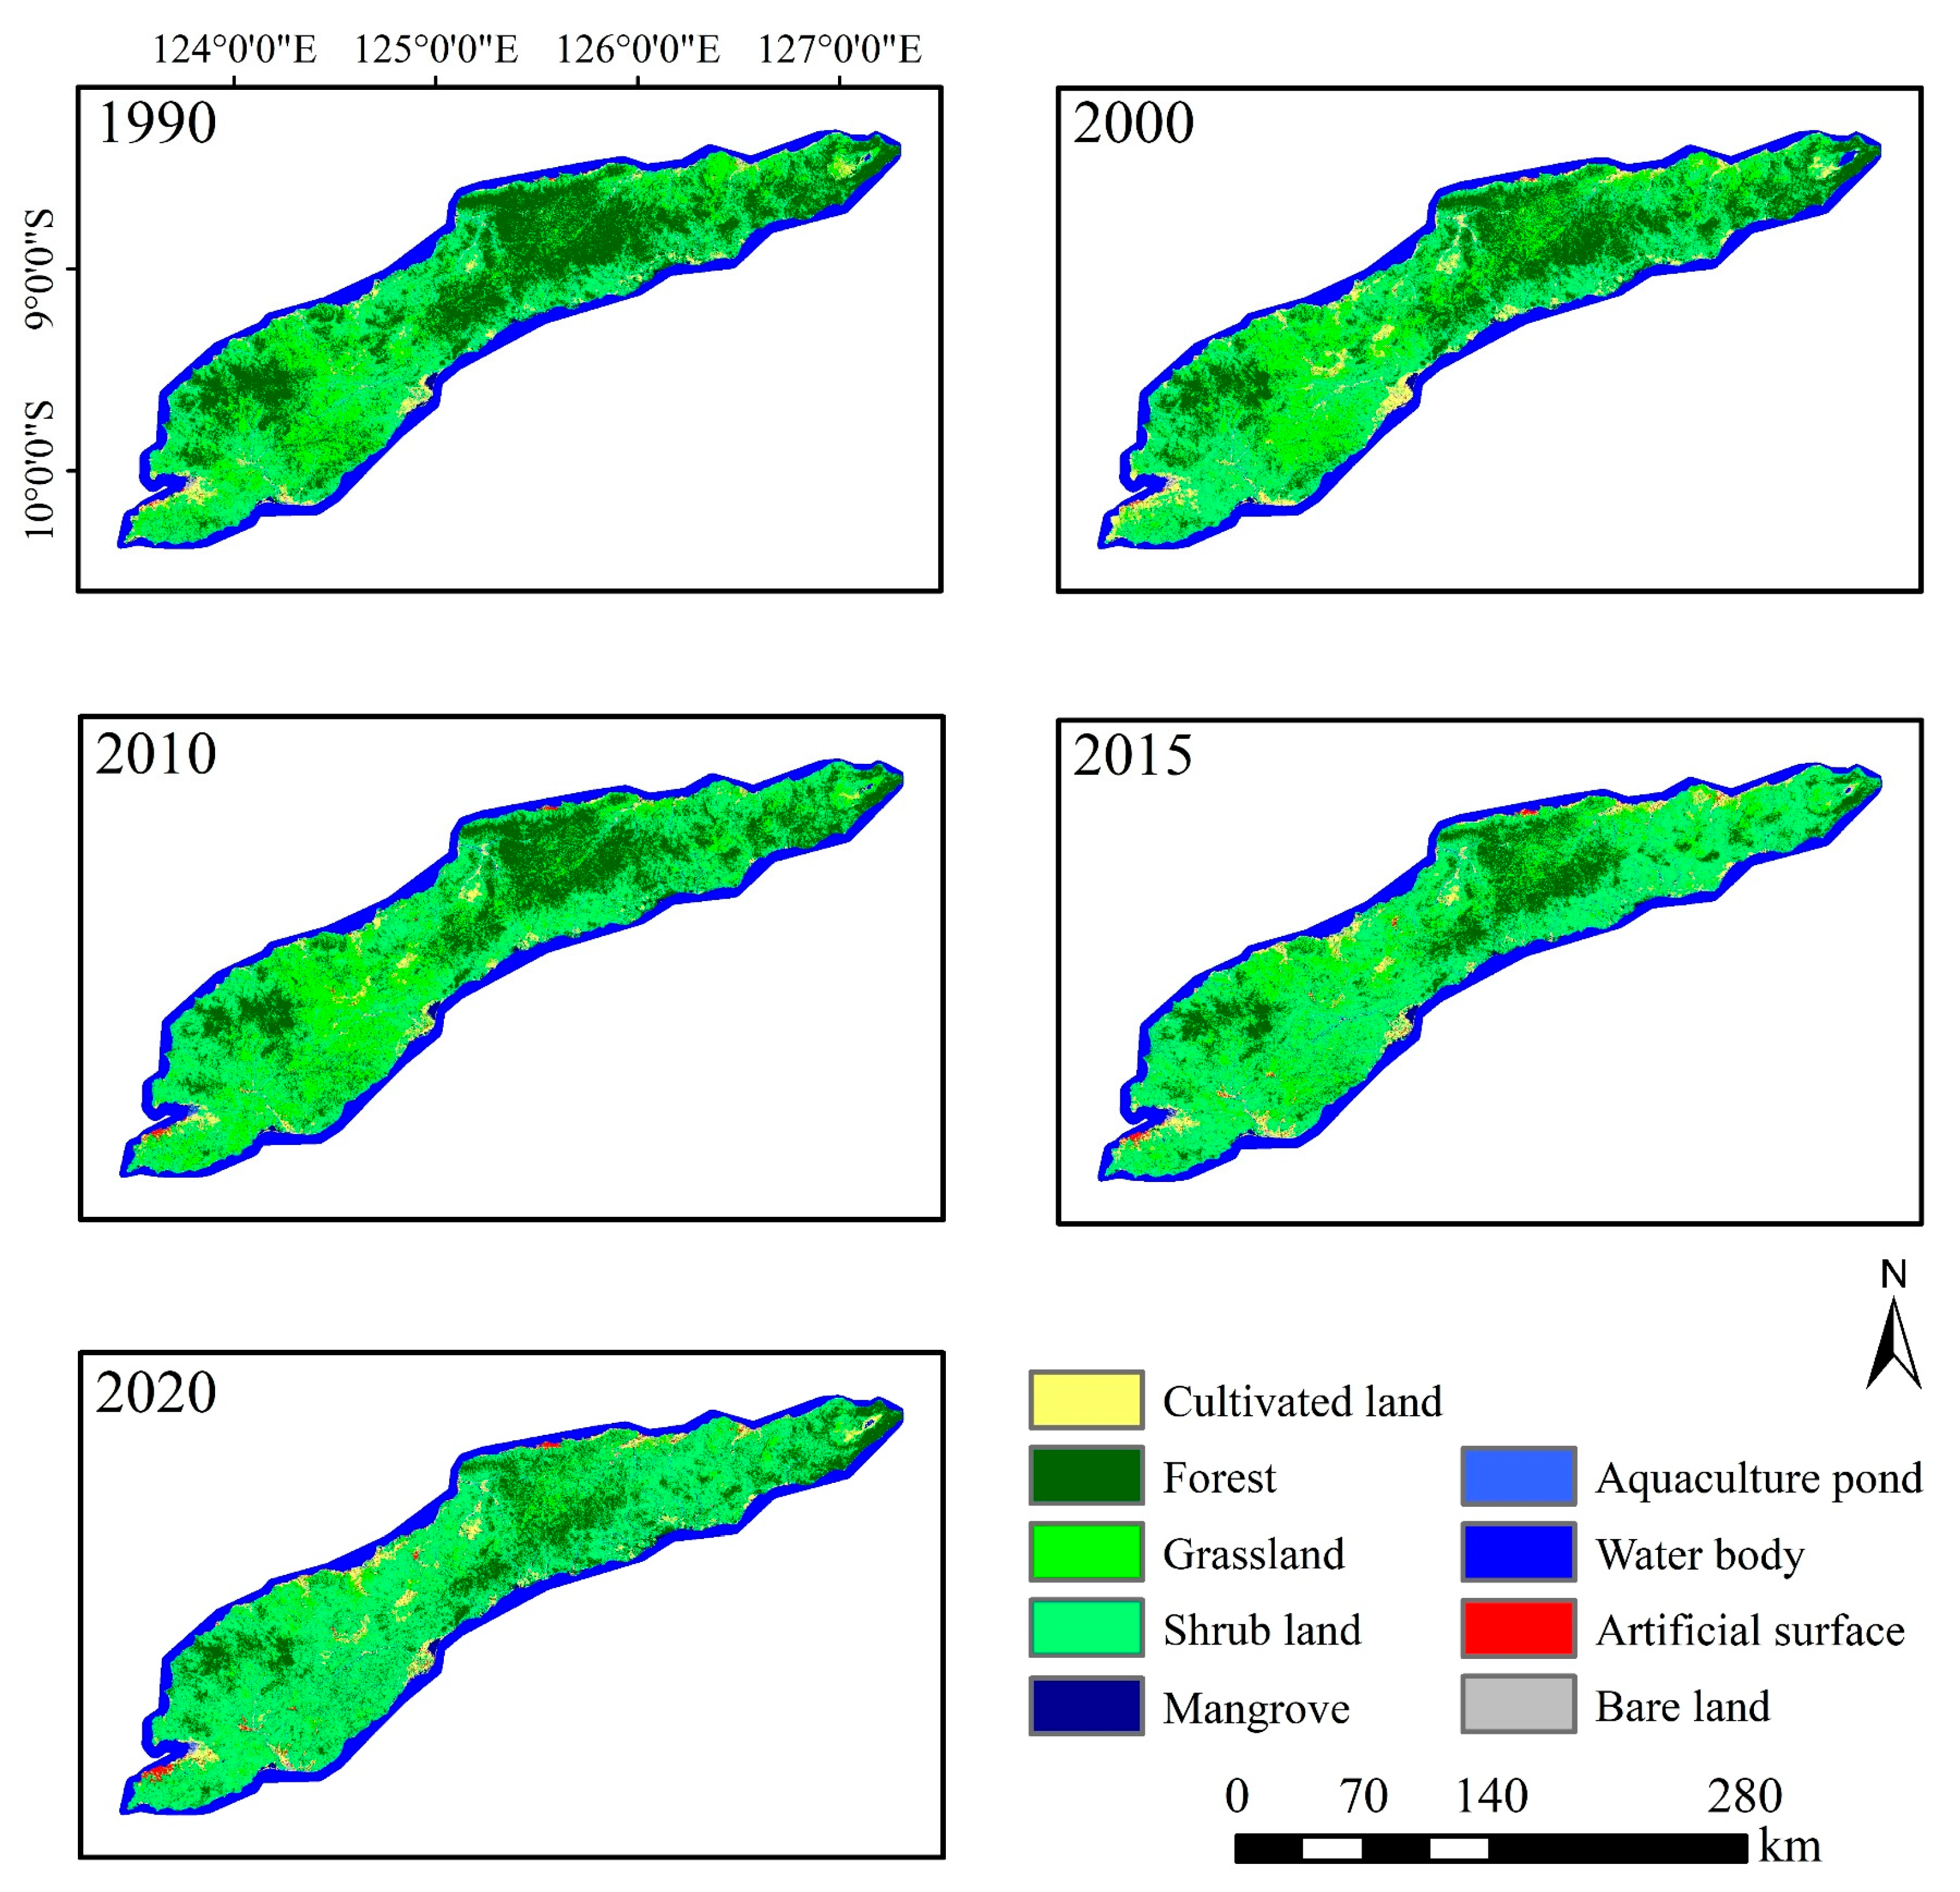
3.1.2. Timor
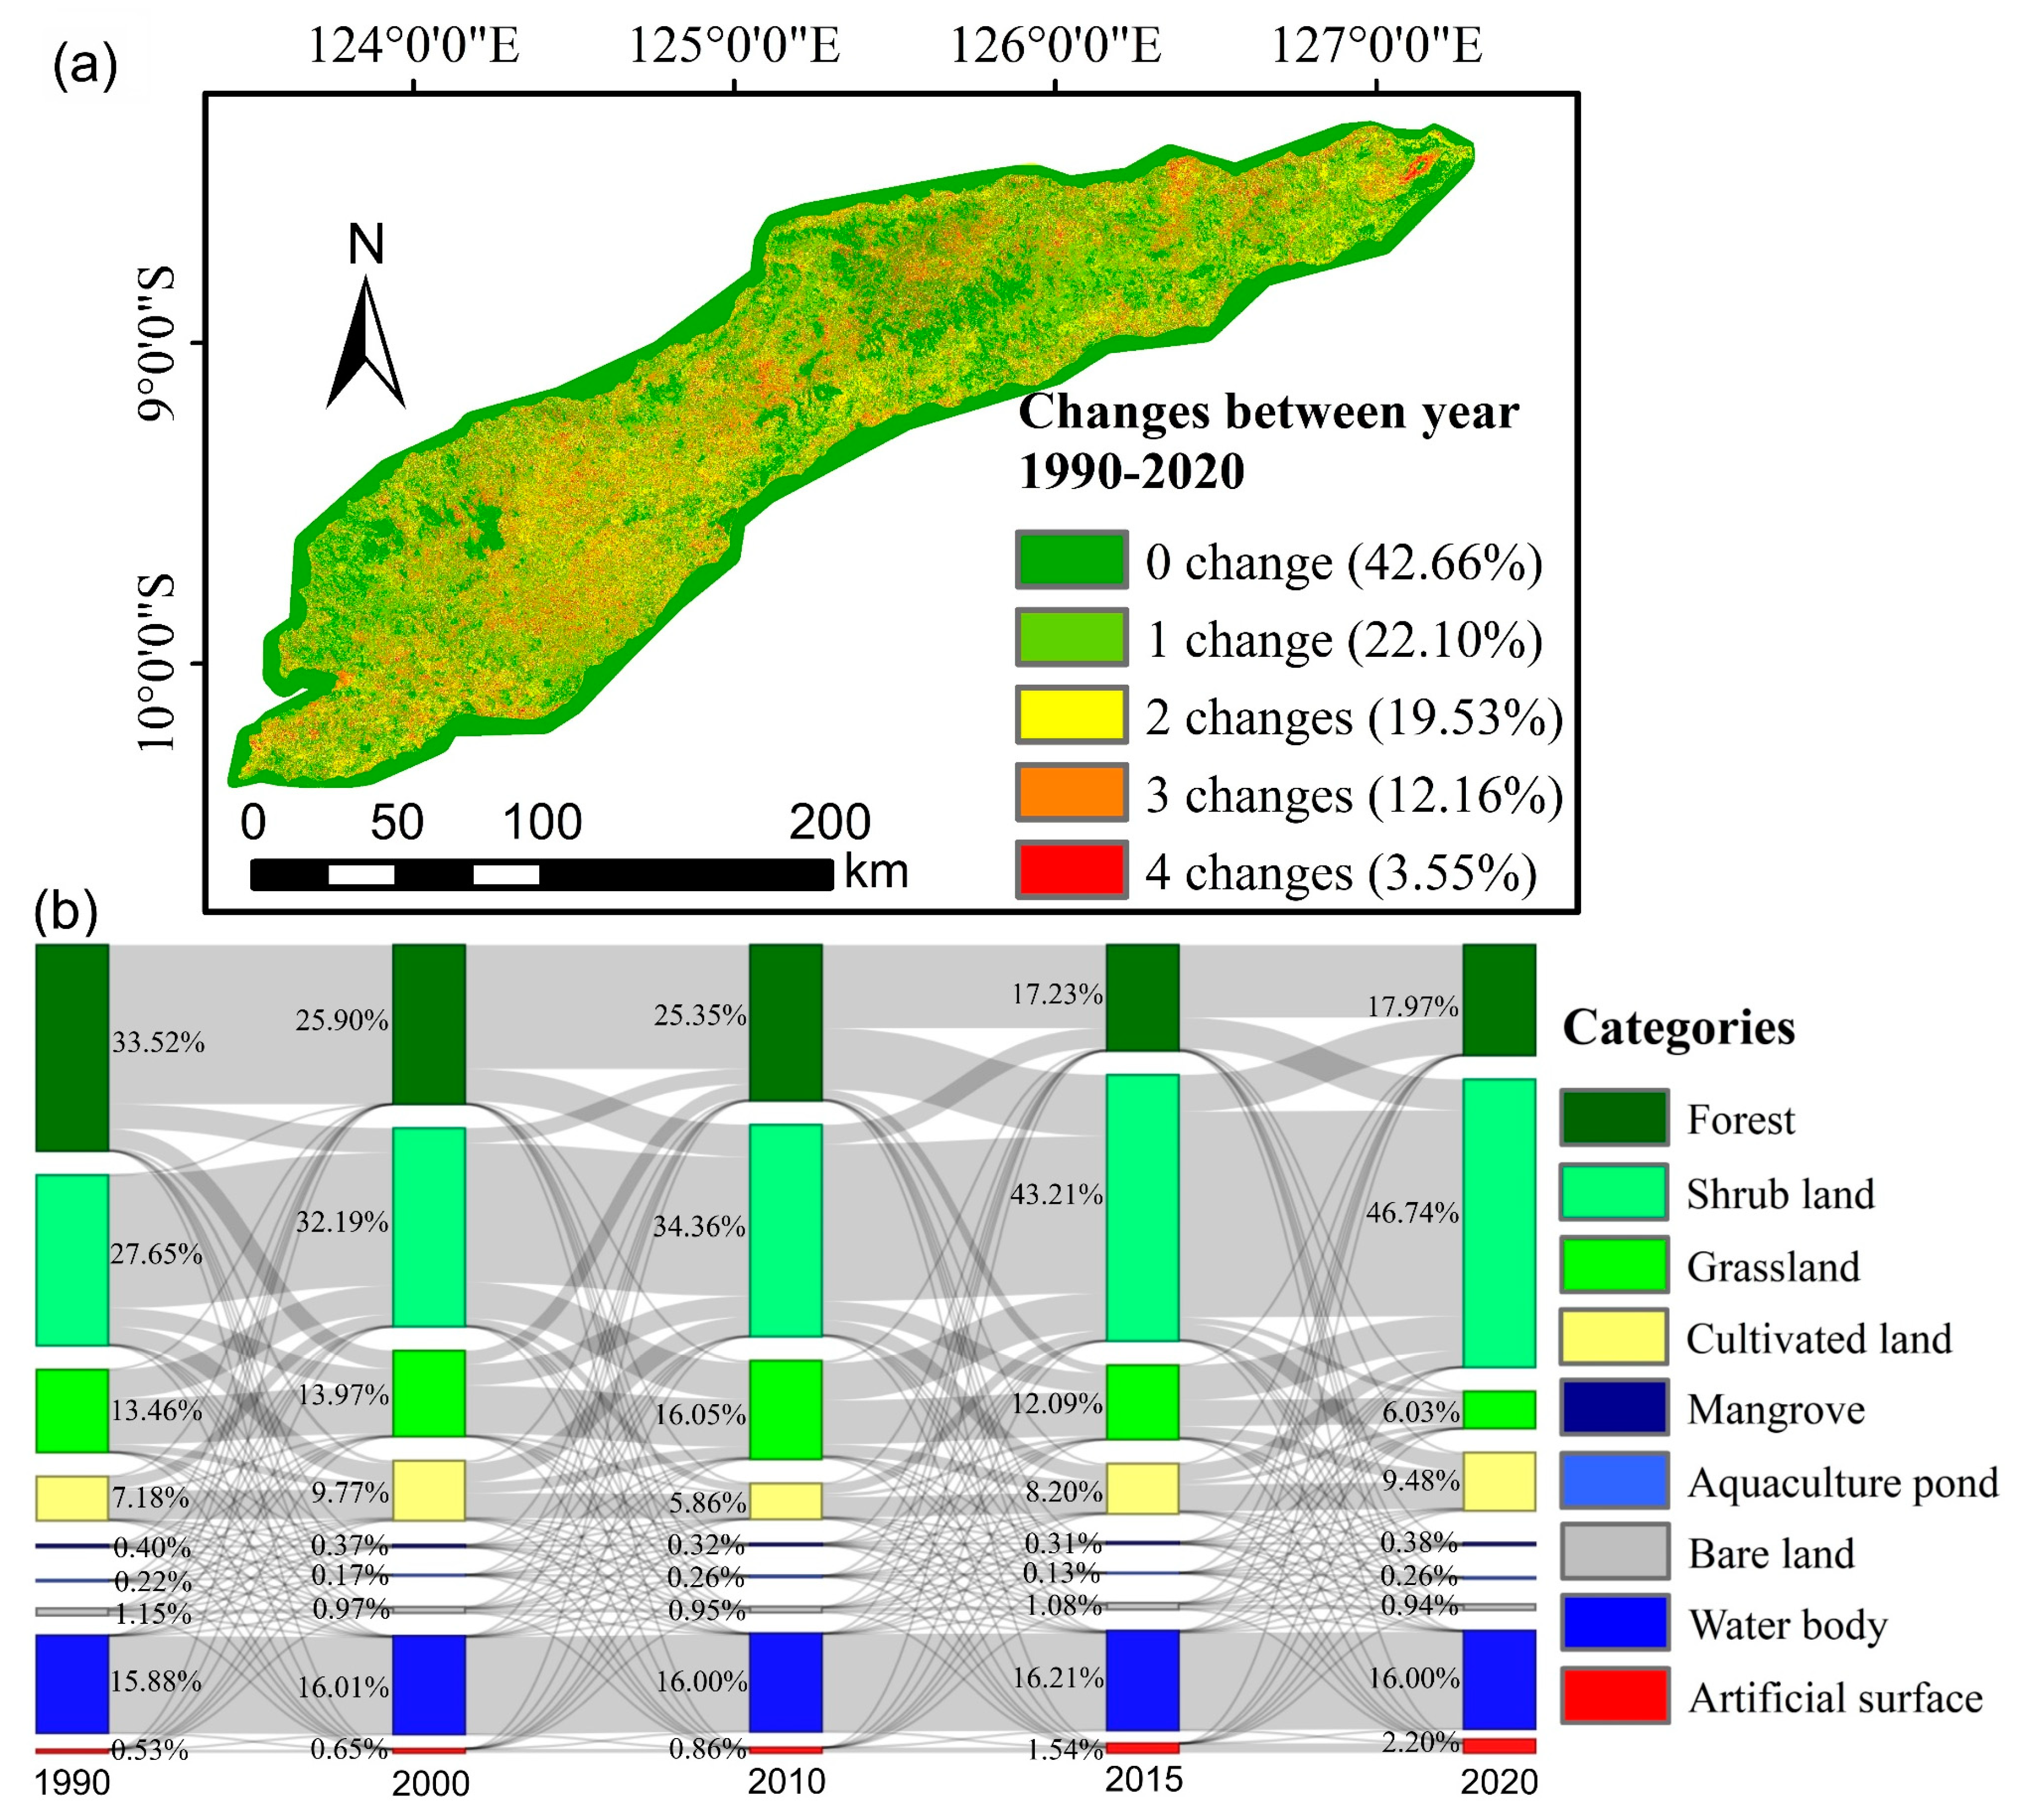
Table A2 shows the area statistics of land cover types in Timor Island between 1990 and 2020. The land cover of Timor (Figure 4) was dominated by forest (accounting for 33.52% in 1990) and shrub land (accounting for 27.65% in 1990). However, the shrub land became the top land cover type of Timor Island (16,198.03 km2, accounting for 46.74% in 2020), followed by forest (6226.20 km2, accounting for 17.97% in 2020). In detail, the forest area showed a change trend of decreasing (decreased by 5644.39 km2 from 1990 to 2015), followed by increasing (increased by 255.02 km2 between 2015 and 2020), and decreased overall from 1990 to 2020 (Table 3). The area of shrub land increased by 6616.83 km2 in 30 years. The area of cultivated land increased by 32% overall, with an increase of 795.79 km2 (Table 3). The area of artificial surface showed a significant increase from 184.88 km2 in 1990 to 764.04 km2 in 2020, with a total increase of 579.16 km2 (about 3.13 times). The change in mangrove showed the characteristic of decreasing first (from 1990 to 2015) and then increasing (from 2015 to 2020) (Figure 4).
Figure 5a shows that 42.66% of the pixels did not change over the 30 years—mainly, these were for water body and forest areas. In total, 22.10% of the land changed once, which was the second-highest percentage. The pixels that changed three or four times accounted for 12.16% and 3.55% of the total area, respectively. These were mainly distributed in the mountainous and hilly areas, in mixed areas of forest, grassland, and shrubland, and in the area around the Ira Lalaro Lake (the largest lake in Timor-Leste, which has seen frequent changes in water levels over the past 30 years).
As shown in Figure 5b, we found that the area of forest was decreasing, mainly being converted to shrub land in each period. The new shrub land in each period had mainly been converted from forest and grassland. Additionally, the grassland changed actively and was largely mutually converted with shrub land. The reduced forest, cultivated land, and grassland in 1990 mainly became shrub land by 2020, with specific areas of 5493.65 km2, 942.13 km2, and 2622.99 km2, respectively. The new artificial surface in 2020 had mostly been transferred from cultivated land, grassland, and shrub land, while the new cultivated land had mainly been transferred from shrub land (1123.54 km2, accounting for 34.20% of the total cultivated land in 2020).
3.1.3. Palawan
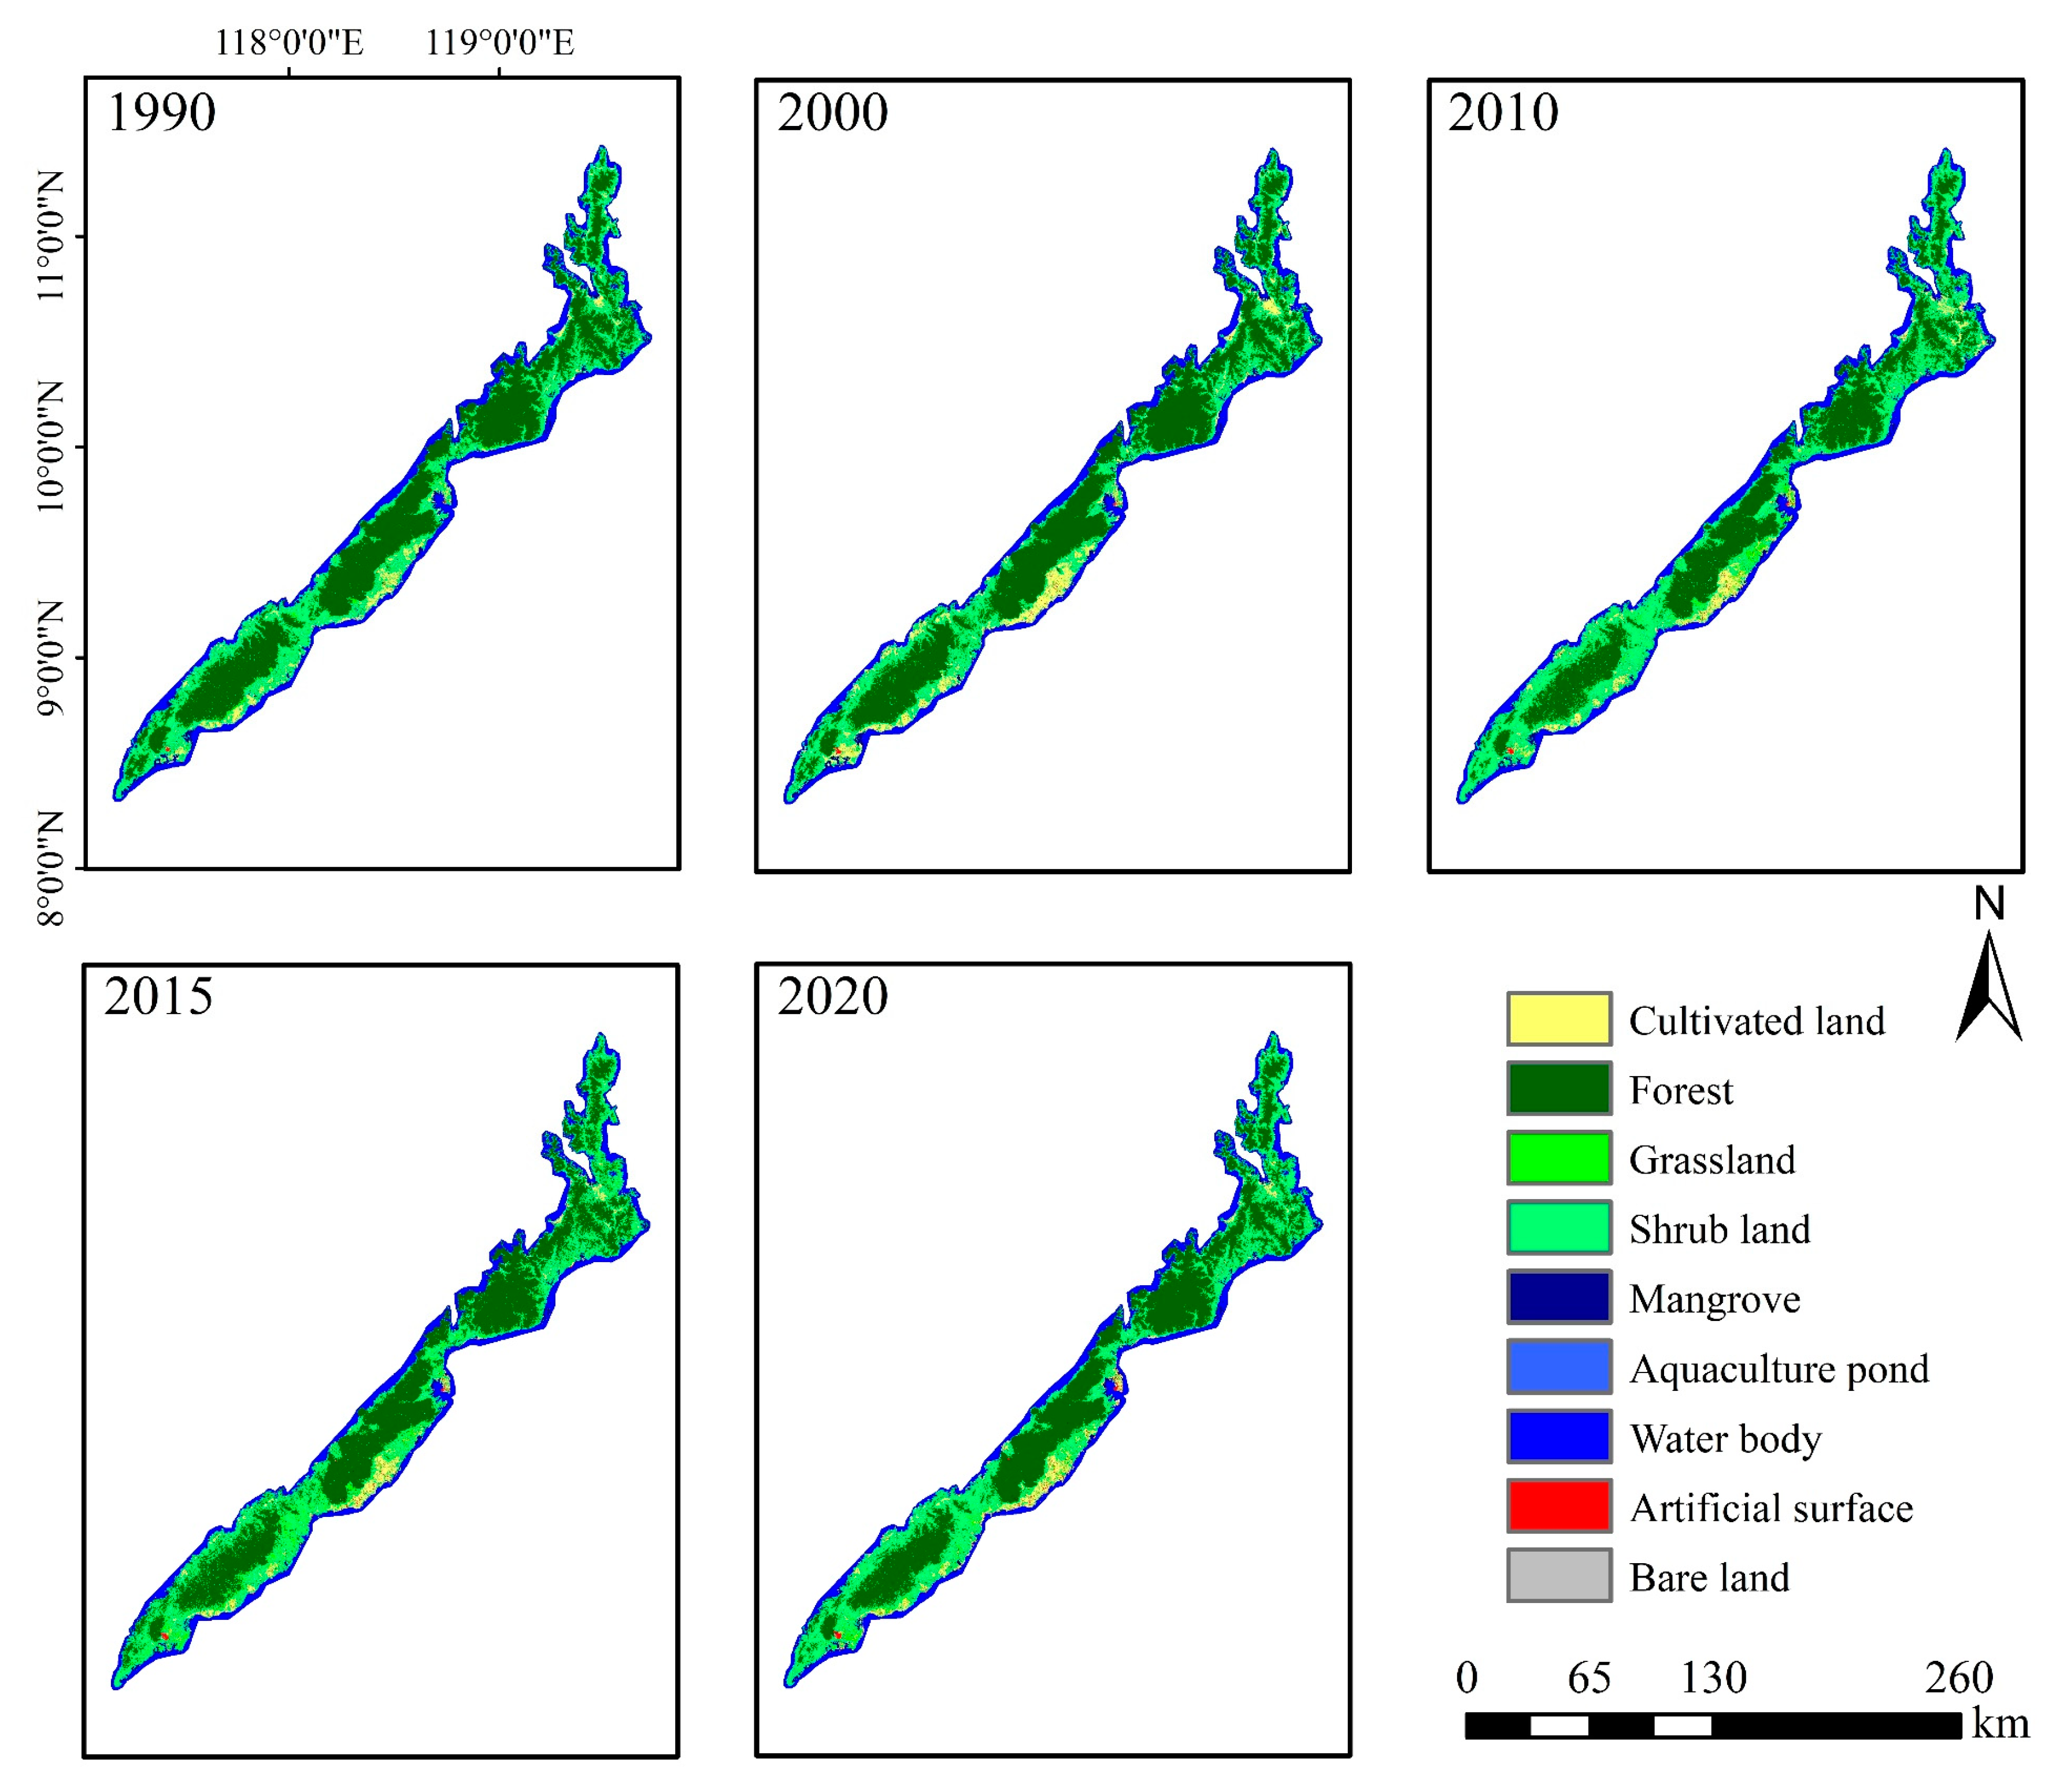
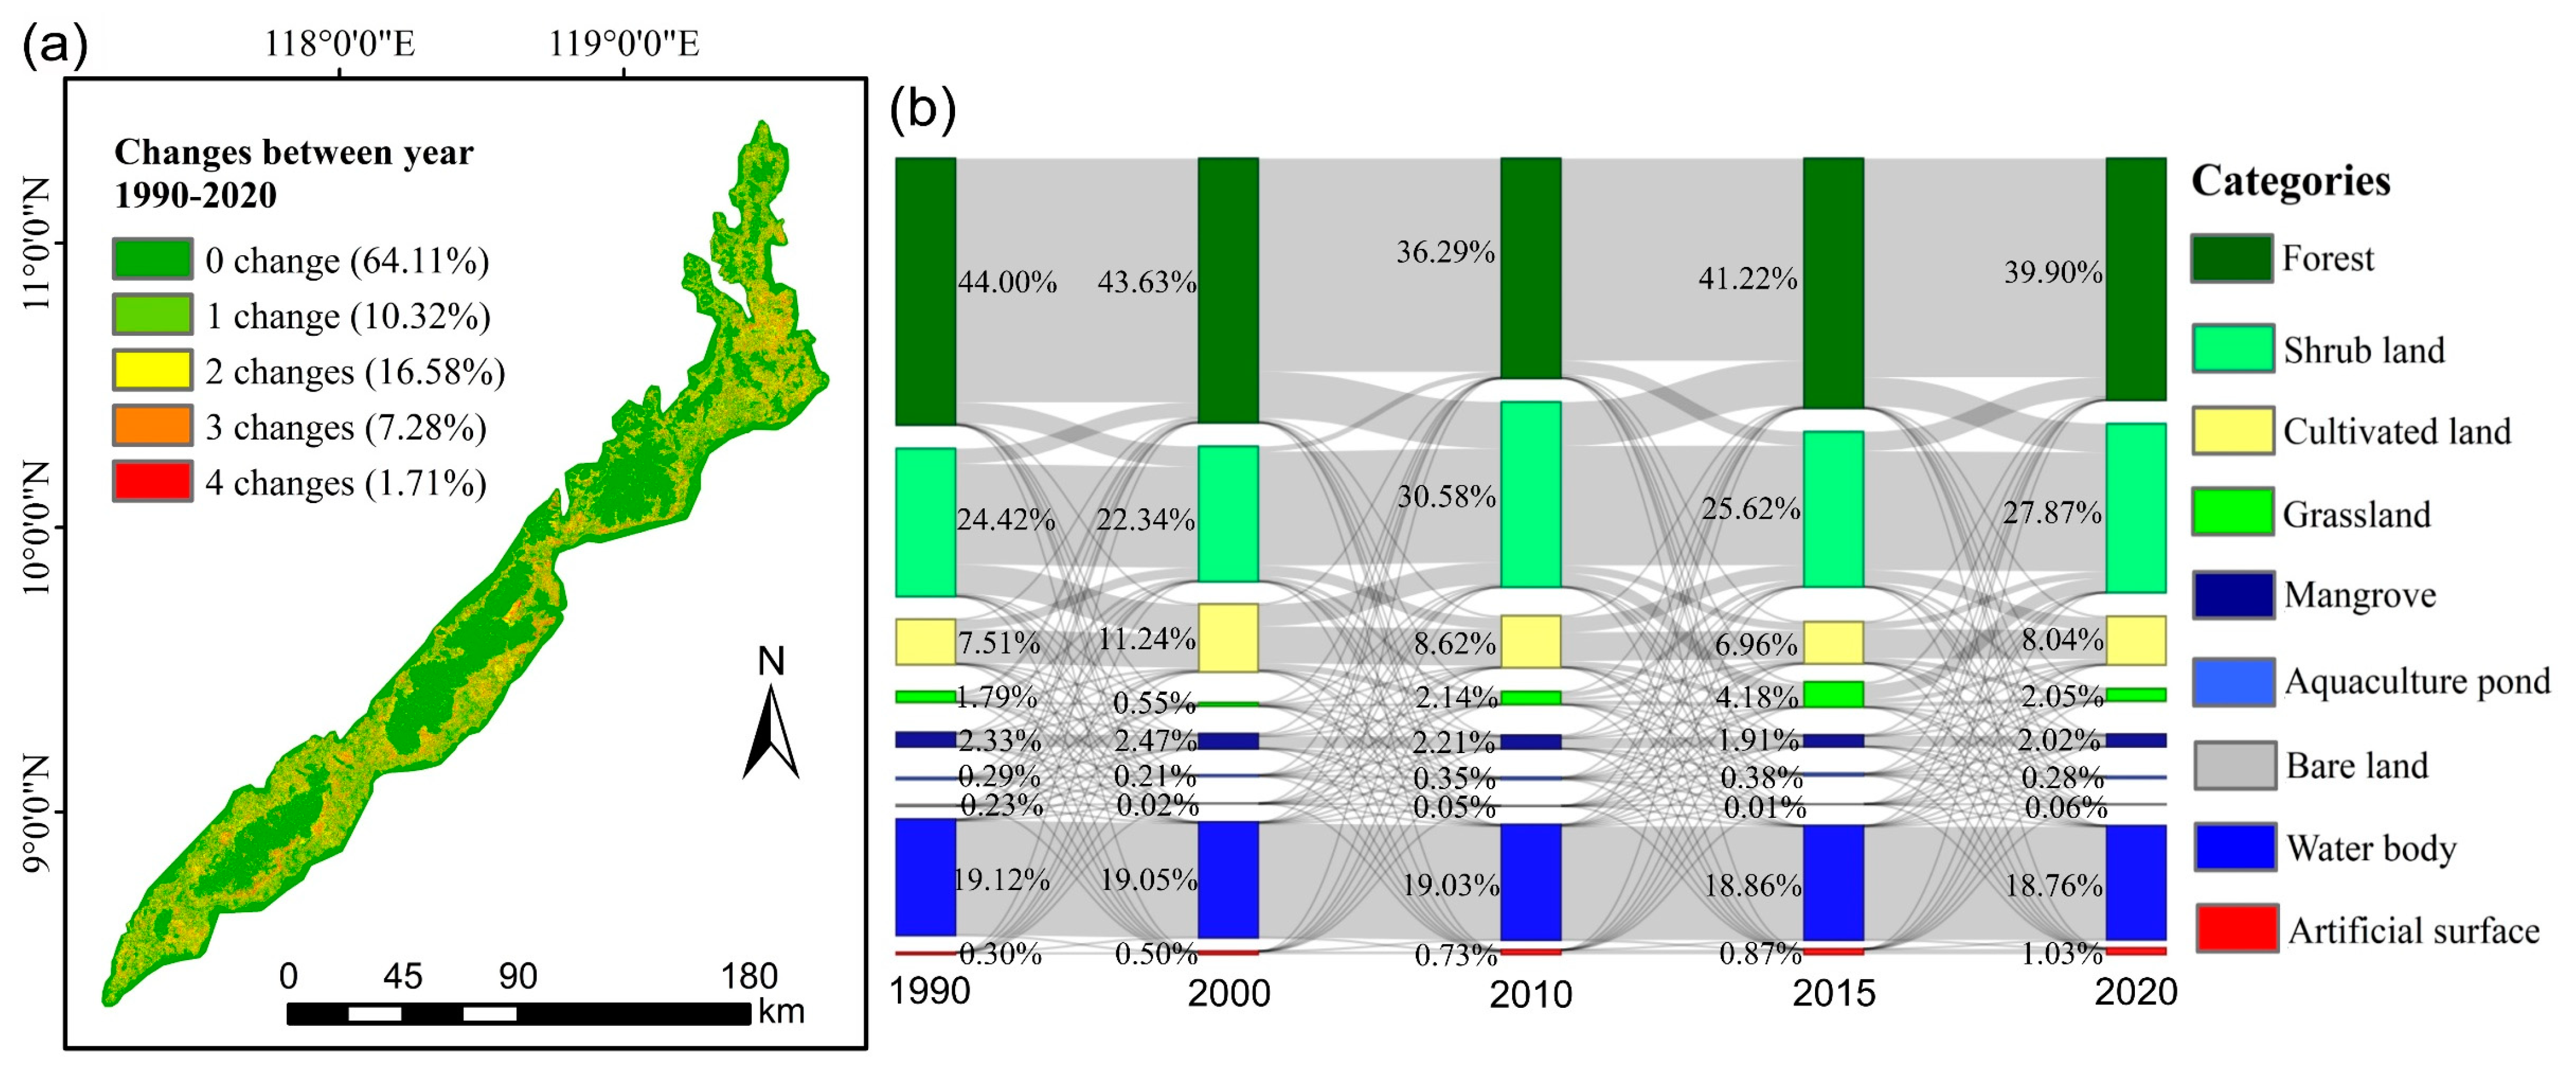
Table A3 shows the area statistics of land cover types in Palawan Island between 1990 and 2020. The land cover of Palawan (Figure 6) was dominated by forest (accounting for 39.90% in 2020) and shrub land (accounting for 27.87% in 2020), which remained the main land cover type between 1990 and 2020. The area of forest showed the characteristic of decreasing first and then increasing, with a decrease of 590.48 km2 in general (Table 3). The area of shrub land constantly fluctuated, and the overall area increased by 496.47 km2 (grew by 14%). The area of cultivated land as a whole showed an increasing trend (Table 3), with an increase of 376.26 km2 (grew by 7%). The area of artificial surface showed a significant increase from 43.51 km2 in 1990 to 148.31 km2 in 2020, representing an increase of 104.80 km2 (about 2.41 times). The area of mangrove decreased by 14% overall (from 336.07 km2 in 1990 to 290.55 km2 in 2020).
In total, 64.11% of the land did not change during the 30-year period (Figure 7a), mainly being covered with forest and water bodies. A total of 16.58% of the land changed twice, which is the second-highest percentage; this land was mostly distributed in the plains. The pixels that changed three or four times accounted for 7.28% and 1.71% of the total, respectively, and were mainly distributed in the marginal areas of forest and bordered by shrub land and grassland.
Figure 7b illustrates that the main change was from forest to shrub land from 1990 to 2020. The cultivated land was also frequently converted to shrub land. The forest and cultivated land from 1990 were mainly converted to shrub land, with areas of 844.16 km2 and 385.33 km2, respectively. Additionally, the changed mangrove was largely turned into cultivated land and shrub land. In 2020, the new artificial surface was mainly transferred from cultivated land (43.19 km2) and shrub land (27.95 km2), while the new cultivated land was mostly transferred from shrub land (494.21 km2, accounting for 42.69% of the total cultivated land in 2020).
3.2. Coastline Changes of the Three Tropical Islands
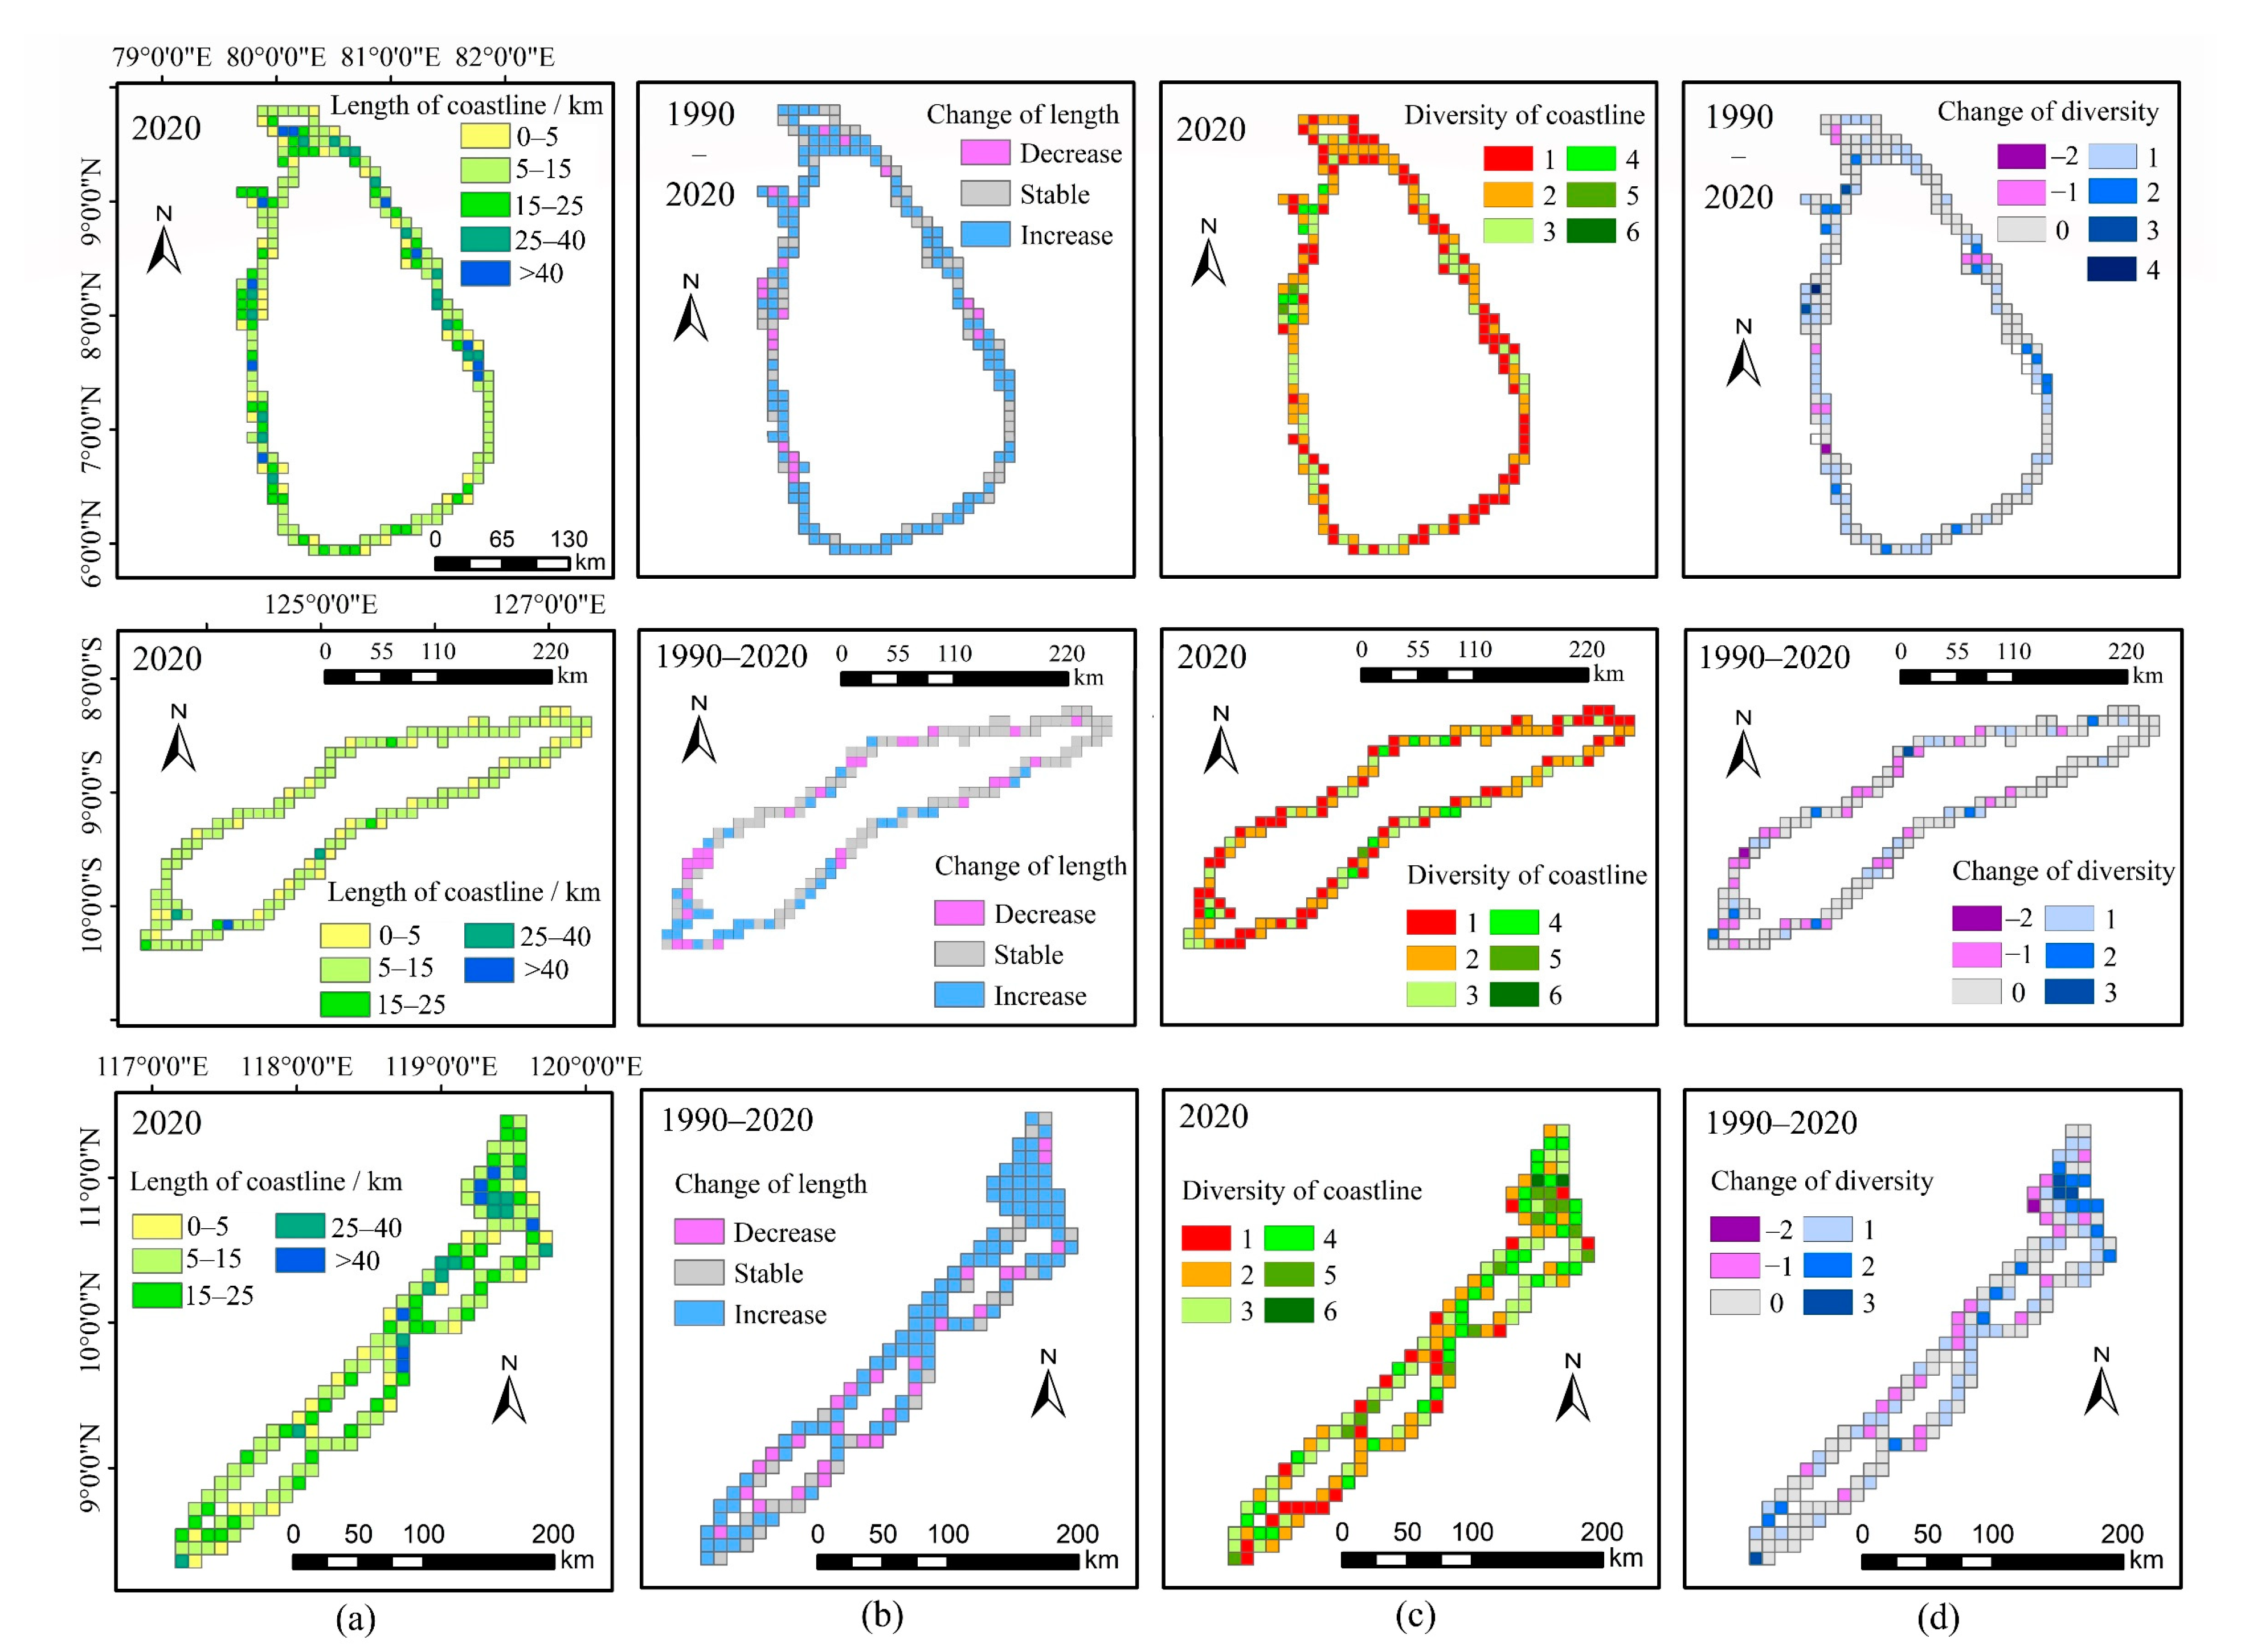
According to the extraction results obtained for the coastline in 2020 in the three islands (Figure 8, Figure 9 and Figure 10a), we obtained statistical information on the different coastline types (Figure 8, Figure 9 and Figure 10b) and overall changes (Table 4). To further analyze the spatial distribution and change characteristics of the coastline length and diversity, we calculated the lengths of the coastline in grids (one square pixel represents a 10 by 10 km area) (Figure 11a), as well as the changes over the past 30 years (Figure 11b). The coastline diversity map (Figure 11c) reflects the number of coastline types in each grid in 2020—for example, 1 represents one kind of coastline in this grid and 6 represents six kinds of coastline in this grid. Figure 11d reflects the increase or decrease in the number of coastline types in each grid from 1990 to 2020—e.g., −2 represents a decrease in two coastline types in 2020 compared to 1990 and 3 represents an increase in three coastline types in 2020 compared to 1990.
3.2.1. Sri Lanka
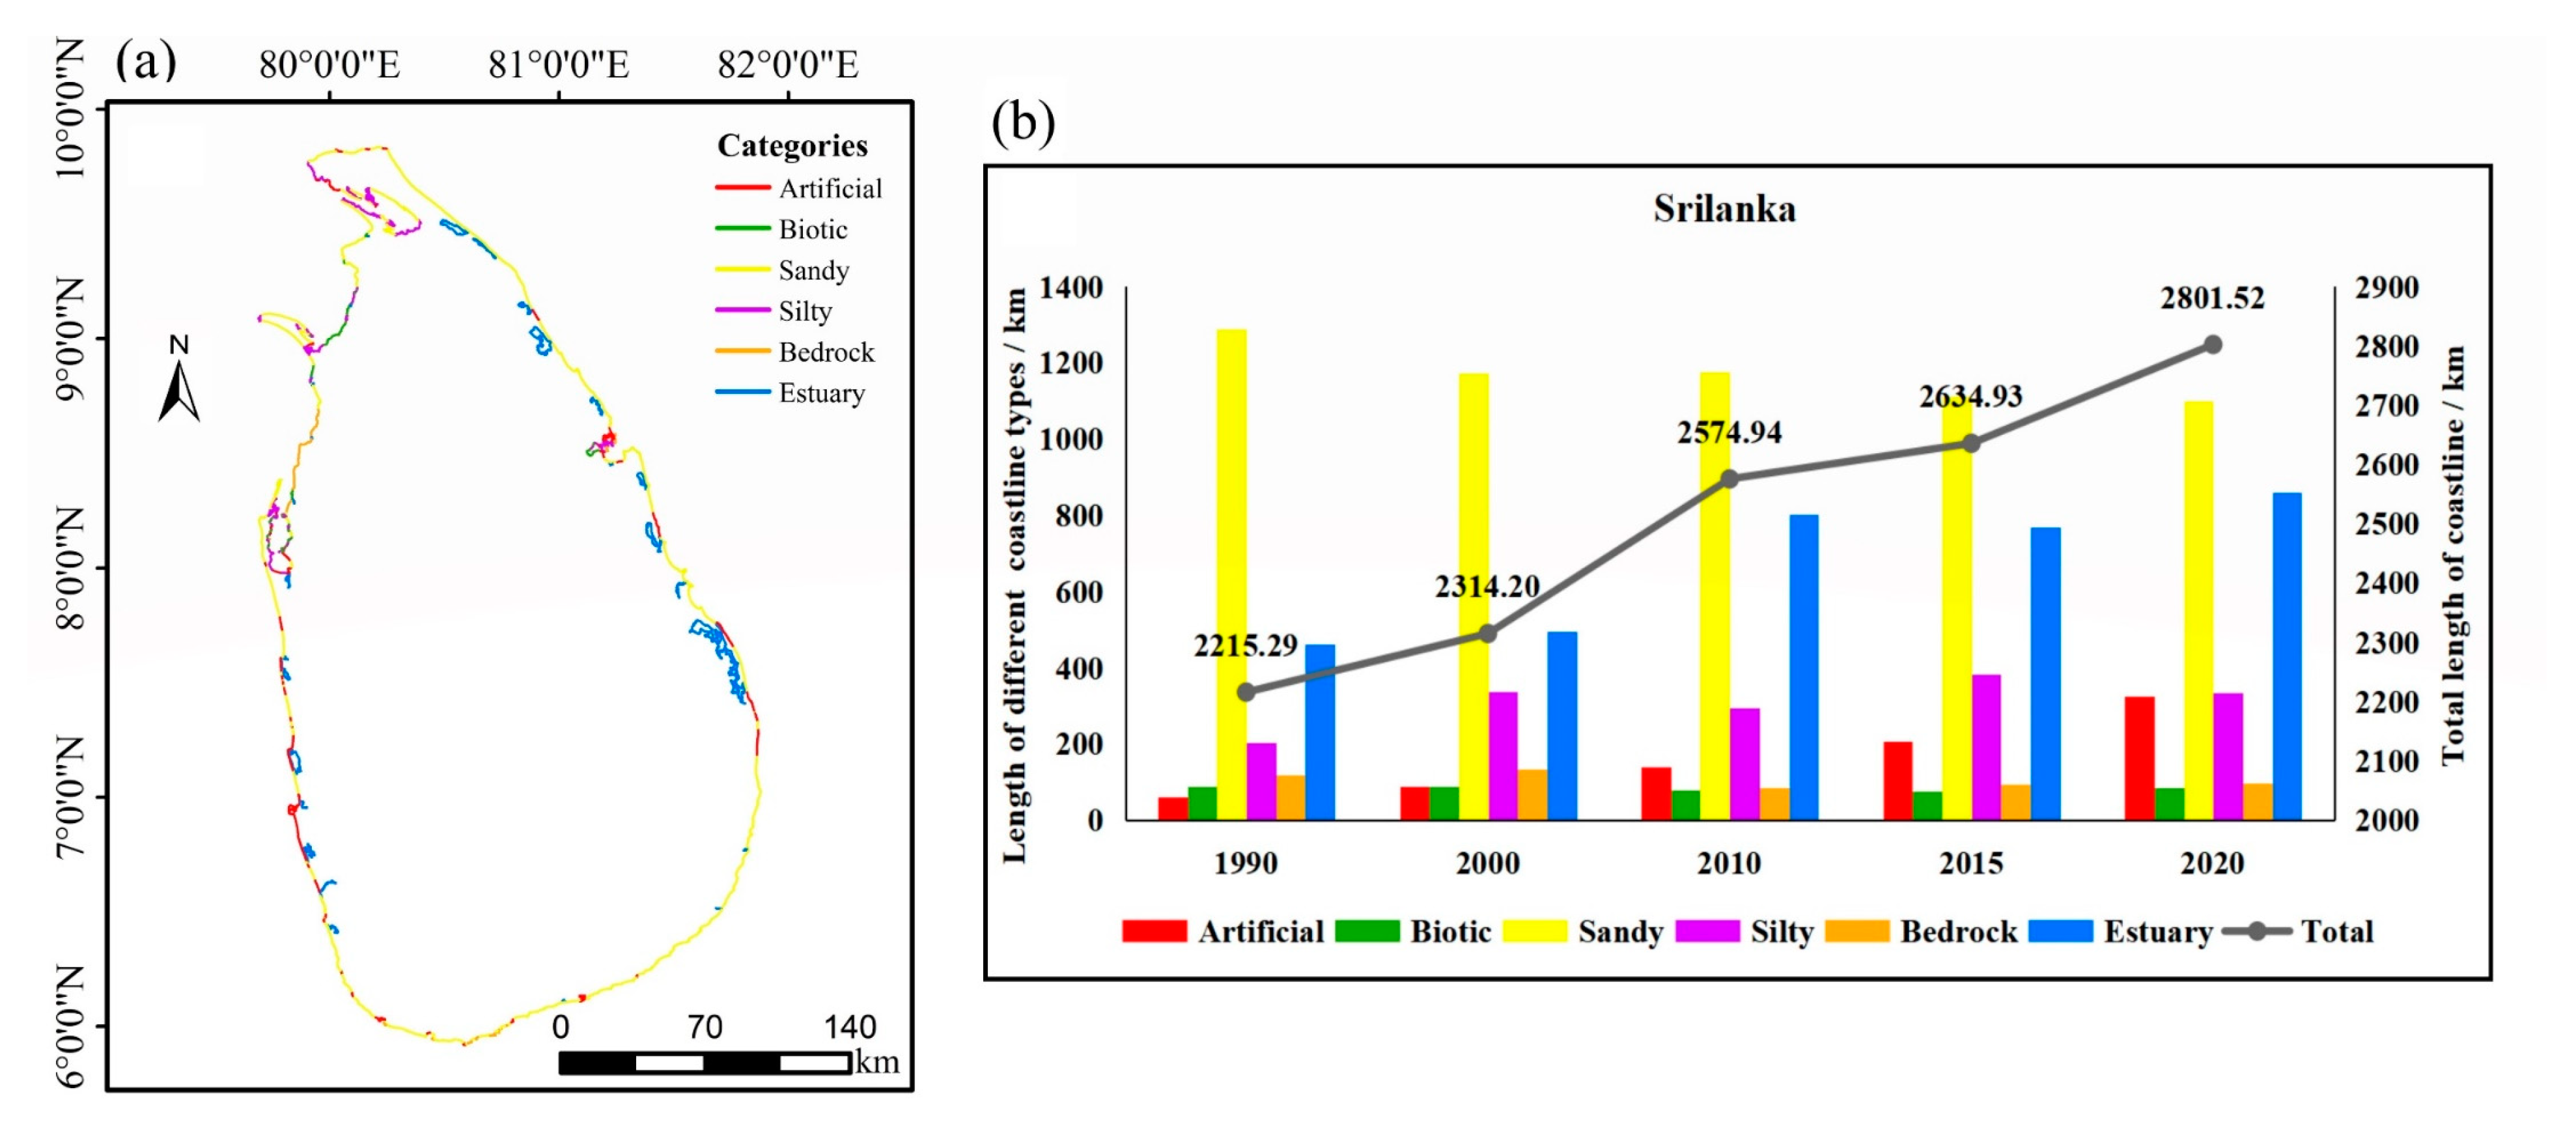
The coastline length of Sri Lanka showed an increasing trend from 1990 (2215.29 km) to 2020 (2801.52 km), with an increase of 586.23 km (with an average length change rate of 19.54 km/a), as shown in Figure 8b. In 2020, the length of artificial coastline and natural coastline was 325.39 km (accounting for 11.61%) and 2476.12 km (88.39%), respectively. The artificial coastline increased by 266.01 km from 1990 to 2020 (5.48 times), with a growth rate of 8.87 km/a. The length of the natural coastline increased by 320.22 km (10.67 km/a) over the past 30 years (Table 4). In particular, sandy coastlines and estuary coastlines were dominant (Figure 8a), with a length of 1101.06 km (39.30%) and 859.96 km (30.70%) in 2020, respectively. Sandy coastline showed a decreasing trend and estuary coastline showed an increasing trend from 1990 to 2020, but the sandy coastline was still the longest coastline type in Sri Lanka. The length of the silty coastline (accounting for 11.87% in 2020) increased by 130.52 km, while the bedrock and biotic coastline decreased a little in the past 30 years.
The spatial distribution and change characteristics of the coastline were as follows: a total of 44.02% of the grids in Sri Lanka had a coastline length of 5–15 km in 2020, only 5.98% of the grids had a coastline length of over 40 km, and 17.93% of the grids had a length of 0–5 km (Figure 11a). The coastline length increased in general from 1990 to 2020 (Table 4), with 65.22% of the grids showing increases and 7.98% showing decreases (Figure 11b). The coastline diversity of most grids in Sri Lanka was 1 (40.77%) or 2 (35.89%) (Figure 11c), and the regional structure of the coastline type was relatively homogeneous. During the period 1990–2020, the coastline diversity in Sri Lanka showed an overall increase, with the diversity of 56.04% of the grids remaining unchanged, while 38.84% and 5.12% of the grids showing an increase and decrease in coastline diversity, respectively (Figure 11d).
3.2.2. Timor
The coastline length of Timor first decreased and then increased, with an overall decrease of 26.44 km (with an average length change rate of −0.88 km/a) from 1990 (1376.29 km) to 2020 (1349.85 km), as shown in Figure 9b and Table 4. In 2020, the lengths of the artificial coastline and natural coastline were 81.32 km (accounting for 6.02%) and 1268.53 km (93.98%), respectively (Figure 9b). The length of the artificial coastline increased approximately threefold (increased by 54.22 km) from 1990 to 2020 (Table 4), with a growth rate of 1.81 km/a. Meanwhile, the length of the natural coastline decreased by 80.65 km (−2.69 km/a) (Table 4). Additionally, the sandy coastline was the dominant type (508.80 km in 2020, accounting for 37.69% of the total length), followed by biotic coastline (243.89 km in 2020, accounting for 18.07%) and bedrock coastline (238.97 km in 2020, accounting for 17.73%). From 1990 to 2020, the sandy coastline and bedrock coastline changed relatively little, while the biotic coastline changed a lot, showing a decrease of 77.62 km (average change rate of −2.59 km/a). In addition, the amount of silty coastline increased by 17.45 km and the amount of estuary coastline decreased by 32.37 km over the past 30 years.
The spatial distribution and change characteristics of the coastline were as follows: in total, in 2020, 74.83% of the grids had a coastline length of 5–15 km, 20.28% of the grids had one of 0–5 km, and only 0.70% of the grids had one of over 40 km (Figure 11a). From 1990 to 2020, 22.76% of the grids showed an increase in coastline length and 17.93% showed a decrease in coastline length; thus, the coastline length increased in general (Figure 11b). Most of the grids in Timor Island had the coastline diversity of 1 (40.58%) or 2 (33.54%), and only 0.70% of the area had 5 kinds of coastline types, making the regional structure of the coastline types relatively homogeneous (Figure 11c). During the period 1990–2020, the coastline diversity in Timor decreased slightly in general (Table 4), with the diversity of 64.80% of the grids being unchanged, while 16.92% and 18.28% of the grids showed an increase and decrease in coastline diversity, respectively (Figure 11d).
3.2.3. Palawan
The coastline length generally showed an increasing trend (Table 4), with it increasing by 66.13 km from 1990 (3164.87 km) to 2020 (2231.00 km), having an average rate of 2.20 km/a (Figure 10b). Furthermore, the growth of the coastline occurred mainly between 2000 and 2010 (increasing by 39.54 km) and 2010 and 2015 (increasing by 23.73 km). In 2020, the length of the artificial coastline and natural coastline was 112.37 km (accounting for 5.04%) and 2118.64 km (94.96%), respectively (Figure 10b). The length of the artificial coastline increased by approximately 91.58 km (5.41 times) from 1990 to 2020, with an average growth rate of 3.05 km/a. Meanwhile, the natural coastline fluctuated throughout the past 30 years, decreasing by 25.45 km in general (with an average change rate of −0.85 km/a). In addition, the coastline types of Palawan were dominated by biotic and bedrock coastline (Figure 10a), with lengths of 686.15 km (30.76%) and 611.34 km (27.40%) in 2020, respectively. From 1990 to 2020, the amount of biotic coastline decreased by 9.72 km, whereas the amount of bedrock coastline increased by 31.74 km. The length of silty coastline decreased from 508.99 km in 1990 (accounting for 23.51%) to 385.26 km in 2020 (accounting for 17.26%), with an average change rate of −4.13%. However, it still was the third main type of coastline in Palawan. The change in the length of the sandy coastline was the second highest, with an increase of 112.42 km over 30 years (average change rate of 3.75 km/a). Additionally, the length of the estuary coastline was 187.33 km in 2020, showing a decrease of 35.98 km.
The spatial distribution and change characteristics of the coastline were as follows: in total, 46.31% of the grids had a coastline length of 5–15 km in 2020, 15.44% of the grids had one of 0–5 km, and 4.69% of the grids had one of over 40 km (Figure 11a). From 1990 to 2020, 65.10% of the grids increased in terms of coastline length and 17.45% decreased (Figure 11b). Most of the grids in Palawan had three (26.19%), two (25.49%), and four (22.82%) kinds of different coastline, while 14.78% of the grids had only one type of coastline (Figure 11c). In addition, 1.34% of the grids had six kinds of different coastlines in 2020; thus, the regional coastline types were more diverse in Palawan Island. During the period 1990–2020, the coastline diversity in Palawan increased in general (Table 4), with the diversity of 45.60% of the grids remaining unchanged, while 40.10% and 14.30% of the grids showed an increase and decrease in coastline diversity, respectively (Figure 11d).
4. Discussion
Islands have limited natural resources and their environment is fragile, with them facing threats such as sea-level rises and extreme weather events [7]. Therefore, sustainable development (including of social, economic, and environmental aspects) is critical for the future of the planet, especially in SIDS and island regions [8]. From a remote sensing perspective, the basic land surface changes seen across the three islands were similar, with increases seen in the amount of artificial surface, cultivated land, and artificial coastline, and decreases seen in the forest and mangrove areas (Table 3 and Table 4). Table 5 shows the socioeconomic statistics of related countries based on data from the World Bank. We noticed that these changes were mainly caused by social and economic development, and that they had had impacts on the development of the natural environment. These changes reflect the pursuit of socioeconomic development in these island regions (Section 4.1) at the expense of the natural environment (Section 4.2), which may be an unbalanced development strategy. Thus, it is necessary to find means of the sustainable development for islands.
4.1. Land Surface Changes for Social and Economic Development
With the growth of their population and the need for a living and developing economy (Table 5), human disturbance has played an important role in the land surface changes of islands according to our observations.
- Urbanization:
We found that all three tropical islands showed a significant increase in artificial surface from 1990 to 2020, and the growth of artificial surface in these islands mainly occurred in one or two cities, which are basically the political and economic centers of the regions (e.g., Colombo city in Sri Lanka, Kupang city and Dili city in Timor Island, and Puerto Princesa in Palawan Island). In addition, the urbanization of tropical islands has a common geographical characteristic, being concentrated in the coastal zones and extending along the coast, since these areas are easily accessible, rich in resources, and conducive to economic development. The expansion of artificial surface is an indication of the rapid urbanization that has taken place in South and Southeast Asia [35,36]. It has been shown that the urbanization in islands and coastal areas is growing rapidly, and urban expansion is influenced by population growth and economic activity [37,38,39], which is also suitable for island regions (Table 5).
Urbanization represents the development of the local economy and society, but also brings about a series of environmental problems, such as air pollution, floodplains, and a reduction in vegetation [35,40]. In addition, anthropogenic activities related to urbanization, such as artificial landfill, urban construction, and groundwater exploitation, which is an important factor in coastal subsidence and submersion [41]. Moreover, we noticed that the expansion of artificial surface in the three islands took place mainly by the conversion of cultivated land (Section 3.1), which confirmed that this conversion is notable in developing countries [42]. However, this conversion is irreversible and has caused an indirect loss of natural areas, leading to a loss of ecosystem services and biodiversity, as well as an increase in global greenhouse gas emissions [43,44].
- Expansion of agriculture:
Agriculture is of great significance for developing and underdeveloped countries in terms of food security and economic development [45]. Previous studies carried out in South and Southeast Asia have mainly concentrated on agriculture at the regional and national levels, as well as special types of agriculture, such as shifting cultivation or Swidden agriculture (which is the dominant land use system in the mountainous areas of South and Southeast Asia) [46,47]. Our results provide more detailed information for monitoring the changes in cultivated land on tropical islands. The cultivated land area across these three islands showed an obvious trend of increasing between 1990 and 2020 (Table 3), which is consistent with the trends of agricultural area in related countries (Table 5).
The dominant factors of cultivated land increase are likely to be related to the residents and their farming practices. The growing populations of these islands (Table 5) and their immigration policies (mainly in Timor and Palawan) have increased the demand for food and economic development; thus, agriculture is an essential aspect of the livelihoods of people living in these three tropical islands [48]. In addition, shifting cultivation is popular in the mountains of Southeast Asia, which is known as ‘slash and burn agriculture’, because farmers cut down and burn forests or shrubs every few years [49]. Furthermore, the cultivated land in our study contained cropland, paddy, as well as plantations (which is difficult to distinguish from forest and shrub land). There are possible reasons to explain the fluctuating changes of this cultivated land area. Although the area of cultivated land increased, some agricultural land near the urban centers was converted to artificial surface (Figure 6). This situation can be interpreted as land use displacement [43] and needs to be addressed, especially in SIDS, as it is important for the future of food security [8].
- Increase in artificial coastline:
Driven by the impacts of long-term and slow natural changes, as well as short-term but strong human activities, the world’s coastlines have faced huge threats in recent years, which will affect the coastal environment [34]. We noticed that the increasing trend towards artificial coastline was obvious in all three tropical islands due to the urban construction and the development of coastal aquaculture caused by population and economy growth, which is in line with the land use changes seen in these areas (Section 3.1) and previous findings [34,50,51]. The factors affecting the coastline changes in Southeast Asian islands include artificial factors (population growth, urbanization, mangrove deforestation, and aquaculture expansion) and natural factors (topography, ecological ecosystems, wave systems, storms, and sea-level rises) [19,34,52]. Based on the extracted coastline data, the influence of human factors on the artificial coastline is relatively clear, while the impact of natural factors is complex and more detailed data are needed to analyze it.
Moreover, the land area of Sri Lanka Island decreased by 149.11 km2 from 1990 to 2020 according to the extracted coastline data (Table 3), which illustrated that the changing trend of land–sea pattern for the Sri Lanka was mainly eroded. This is likely related to the coastal erosion, which if a long-term problem in Sri Lanka that is mainly driven by natural sea waves, sand mining, tourism, and related human activities [50,53]. However, the land area increased a little in Timor and Palawan (Table 3), implying that the land–sea pattern is showing an expansion into the sea. This is similar to a study on the Indonesian coastline [34], but is in conflict with Zhang’s findings (the land area and coastline length of Palawan decreased slightly, while that of Timor increased slightly) [54]. Possible reasons for this are differences in the datasets (annual synthesized images and contrast with single-scene images), the coastline classification systems used, and the dynamic characteristic of the coastlines.
4.2. Land Surface Changes Led to Natural Ecosystem Loss
Human disturbance to the land surface environment of islands led to the loss of forest and mangrove areas, as well as changes in the natural coastline and land area, which had an adverse effect on the development of the natural environment.
- Loss of Forest:
The loss of forest cover (including deforestation and forest degradation) is the largest threat to the forest ecosystem worldwide, especially in tropical forests. Tropical forests are important for the environmental ecosystem, and over half of them have been destroyed since 1960 [55]. We found that the forest area of all three tropical islands decreased from 1990 to 2020 (Table 3), which is consistent with the trends seen in related countries (Table 5) and relevant studies [48,56,57,58]—for example, the results of Stibig et al. [56] showed a drop in the total forest cover of Southeast Asia from 1990 to 2010 (loss of 320,000 km2). However, there has been a tiny increase in forest area in Sri Lanka and Timor Island since 2015, while the forest area of Palawan Island has increased since 2010. This is similar to the finding that the annual rate of deforestation has slowed down in the most recent five-year period (2015–2020), according to the main report of the Global Forest Resources Assessment in 2020 [59].
In general, agricultural expansion (including cropland, paddy, and plantation), the timber industry, increased population density (including natural population growth and migration) (Table 5), as well as rapid infrastructure development and government forest policies are the main factors affecting tropical forest changes in South and Southeast Asia according to the findings of previous research [48,56,57,60,61]. We found that the conversion of forest to cultivated land ranked as the dominant driver of forest loss in Sri Lanka, whereas the forest was mainly converted to shrub land in Timor and Palawan. Thus, our results further suggest that the deforestation seen in Sri Lanka is mainly due to agricultural expansion and rapid infrastructure development, which is in line with related findings [57,62]. The forest change seen in Timor is likely due to transmigration and translocation policies, the timber industry, and the poor governance of forested land [48,58]. Additionally, the major factors affecting forest destruction in Palawan are destructive logging, migration from lowland to upland [63], and shifting agriculture.
- Loss of mangrove:
As one special form of forest in coastal zones, mangrove forests are highly important to coastal ecosystems for protecting coastlines from storms and floods, reducing coastal erosion, retaining sediment and nutrients, as well as biodiversity protection and pollution control [64,65,66,67,68]. Furthermore, mangroves are effective for carbon sequestration and storage [69], and the Asian mangroves are among the most carbon-rich forests in the tropics [66]. However, mangrove forests are under extreme threat from climate processes such as sea-level rises and anthropogenic stressors, including conversion to agriculture and aquaculture and pollution [66,70,71]. We found that the mangrove areas of these three tropical islands had decreased in the past 30 years, especially in Sri Lanka. The lost mangrove area was mainly transformed into cultivated land, shrub land, and forest, followed by aquaculture ponds and artificial surfaces. However, there was also a slight increase in mangrove areas of the three islands from 2015 to 2020, indicating that the conservation policies and increased community attention given to mangrove conservation were effective.
- Changes in natural coastline:
We found that the coastline length of Sri Lanka and Palawan increased on both the local grid scale and the overall island scale (Table 4). This does not necessarily mean that these changes are positive because the length increases when the coastline zigzags more, expands seaward, or erodes landward. However, the results showed that the natural coastline length and coastline diversity both increased in Sri Lanka (Table 4), which could suggest that the ability of coastlines to withstand risks has increased. Although Palawan Island performed significantly well in terms of the diversity of the coastline (Figure 11, Table 4), the total length of the natural coastline decreased by 25.45 km. As for Timor, the changing pattern of the coastline was not promising, with the total length, natural length, and diversity all decreasing between 1990 and 2020, mainly related to the decrease in biotic and estuary coastline in Timor. There is no doubt that the coastline of Timor is changing in a negative direction.
4.3. Options for Sustainable Development of Island Regions
Small islands share similar characteristics in terms of sustainable development, though they are by no means homogenous in their geography, economy, social, cultural, and political contexts [72]. These characteristics had increasingly come to be associated with the concept of the ‘vulnerability’ of SIDS. As typical representatives of small islands, SIDS have received more and more attention with regard to their vulnerability in economy and ecology [72]. Based on the analysis and discussion on the changes in land surface environment in these three tropical islands, combined with relevant studies on common issues of SIDS, we further provided some suggestions on the sustainable development for island regions.
In Section 4.1 and Section 4.2, we show that human activities undertaken for the development of society and the economy have led to a loss of natural resources, implying that there is a trade-off between the social economy and the natural environment. In order to achieve the sustainable and balanced development of islands, the expansion of artificial surface and cultivated land should take into account the protection of natural resources such as forests, mangroves, and coastal areas. Regarding the aspect of urbanization, the compact urban form has been suggested to be an effective means of utilization and management of urban land [73,74]. Moreover, the development of built-up areas (artificial surfaces) can be redirected to less productive areas instead of transforming fertile cultivated land [43]. In terms of agriculture, island regions should not only focus on producing adequate food, but also on producing high-quality and nutritious food according to UNEP [8,75], as well as providing more support for sustainable agriculture and adaption policies relating to land degradation according to the UN [75]. In addition, the Swidden agriculture used in the mountains of South and Southeast Asia has been considered as a destructive type of farming [63] that is environmentally and economically unsuitable [47]. Thus, replacing Swidden with more productive and sustainable intensive agriculture is important for the protection of forest land.
With regard to economic development, harnessing renewable energy (such as biomass, wind, sun, ocean, wave, and hydro), developing an ocean-based green economy, and devoting resources to sustainable tourism are suitable opportunities for small islands based on their characteristics [8,75]. For example, the Solar Water Heater Program of Barbados is a successful case of the use of renewable energy. Although tourism can potentially damage the natural environment and has been influenced by the COVID-19 pandemic, it contributes to the economic growth in SIDS, providing employment and spurring development in related industries [75]. Thus, expanding specialized tourism sectors, collecting tourist property tax, and reinforcing the management of the tourist business district are suitable options for the sustainable development of the economy in islands [8,76], especially for Palawan Island and Timor Island. In terms of environmental protection, SIDS have taken important actions to address the issues of environmental governance and management, such as building up sustainable land management capacity in Mauritius, the implementation of the atoll ecosystem conservation project in the Maldives, and natural resource management to combat desertification in Cape Verde [76]. In addition, sea-level rise is one of the most serious effects of global climate change [75]; thus, monitoring and protecting the coastline of islands are crucial. Additionally, we can use other remote sensing techniques to monitor the vertical land movement and topographic changes in order to realize the cognizant management of the coastal zone in response to sea-level rise [77]. Protecting the land from the sea by constructing hard structures such as sea walls and using soft measures such as beach nourishment are feasible options for dealing with the issues of coastal erosion and inundation and should be suitable for Sri Lanka considering its coastline changes [72,78].
5. Conclusions
In our study, we found that the area of artificial surface and cultivated land increased obviously over the past 30 years in all three islands, whereas the forest and mangrove areas decreased. The main reasons for this are likely related to population growth, immigration policies, food security, and human activities in pursuit of economic profits. In addition, the changes in coastline of the three islands are different; the coastline condition of Timor Island is becoming worse, while that of Sri Lanka is becoming better in terms of ecology. The driving factors for these coastline changes include natural processes (topography, ecological ecosystems, sea-level rise, sea waves, and storms) and human activities (sand mining, tourism, port construction, aquaculture expansion, and mangrove deforestation). We noticed that the main land surface changes were all associated with human disturbance, relating to the development of society and economy, but also causing the loss of the natural environment. Furthermore, we offered some advice on the development of urban and agricultural areas while maintaining the protection of forests and mangroves. Additionally, we suggest that islands should strengthen their governance and management of natural resources and coastal regions and develop renewable energy, an ocean-based green economy, and sustainable tourism.
Our results provide efficient technical methods and detailed baseline data that will be helpful for monitoring the environmental changes of tropical islands; this will be meaningful for tropical islands and coastal zones due to climate change and the sustainable development challenges they are facing, especially in SIDS. The data on the spatio-temporal dynamics of land cover and coastline and the suggestions provided by this study can help governments of island regions to formulate suitable policies for achieving the sustainable development.
Author Contributions
T.F. was responsible for the concept and methodology of the study, as well as writing the manuscript. L.Z. supported the methodology development and the design of the experiment, and contributed to the review and editing of the manuscript. B.C. and M.Y. supported the concept development and the design of the experiment. All authors have read and agreed to the published version of the manuscript.
Funding
This research was funded by the Strategic Priority Research Program of the Chinese Academy of Sciences, grant number XDA19030105, and Finance Science and Technology Project of Hainan Province, grant number ZDKJ2019006.
Data Availability Statement
The data presented in this study are available on request from the corresponding author (L.Z.).
Acknowledgments
The authors appreciate the valuable comments and constructive suggestions from the anonymous referees and the editors who helped to improve the manuscript.
Conflicts of Interest
The authors declare no conflict of interest.
Appendix A

Table A1.
Area statistics of land cover types in Sri Lanka between 1990 and 2020.
| Area (km2) | 1990 | 2000 | 2010 | 2015 | 2020 |
|---|---|---|---|---|---|
| Cultivated land | 17,794.95 | 18,471.35 | 19,593.92 | 17,469.88 | 21,747.66 |
| Forest | 33,850.32 | 33,305.18 | 29,601.67 | 25,543.46 | 31,377.36 |
| Grassland | 4451.34 | 5731.86 | 4176.79 | 6824.54 | 3359.90 |
| Shrub land | 7937.07 | 6551.84 | 10,435.04 | 13,263.98 | 6553.60 |
| Mangrove | 428.97 | 325.79 | 307.19 | 230.65 | 307.54 |
| Aquaculture pond | 326.67 | 474.83 | 469.52 | 565.83 | 436.97 |
| Water body | 8285.05 | 8086.72 | 8176.08 | 8332.49 | 8273.42 |
| Artificial surface | 205.23 | 356.10 | 759.93 | 1173.81 | 1321.67 |
| Bare land | 553.75 | 529.68 | 311.68 | 428.71 | 455.23 |
Table A2.
Area statistics of land cover types in Timor Island between 1990 and 2020.
| Area (km2) | 1990 | 2000 | 2010 | 2015 | 2020 |
|---|---|---|---|---|---|
| Cultivated land | 2488.96 | 3383.80 | 2028.96 | 2840.22 | 3284.74 |
| Forest | 11,616.17 | 8974.47 | 8784.92 | 5971.78 | 6226.80 |
| Grassland | 4663.54 | 4841.96 | 5562.28 | 4191.09 | 2089.94 |
| Shrub land | 9581.20 | 11,153.58 | 11,906.35 | 14,974.19 | 16,198.03 |
| Mangrove | 139.00 | 127.78 | 110.26 | 106.48 | 130.73 |
| Aquaculture pond | 77.86 | 57.41 | 90.44 | 43.71 | 89.78 |
| Water body | 5502.24 | 5546.48 | 5543.83 | 5616.94 | 5543.04 |
| Artificial surface | 184.88 | 226.91 | 297.78 | 532.44 | 764.04 |
| Bare land | 398.46 | 336.63 | 327.47 | 375.44 | 325.20 |
Table A3.
Area statistics of land cover types in Palawan Island between 1990 and 2020.
| Area (km2) | 1990 | 2000 | 2010 | 2015 | 2020 |
|---|---|---|---|---|---|
| Cultivated land | 1081.49 | 1618.84 | 1241.62 | 1002.77 | 1157.74 |
| Forest | 6338.72 | 6285.95 | 5228.69 | 5938.49 | 5748.23 |
| Grassland | 258.46 | 79.70 | 307.97 | 602.42 | 295.21 |
| Shrub land | 3518.64 | 3218.55 | 4405.89 | 3690.73 | 4015.11 |
| Mangrove | 336.07 | 355.20 | 317.87 | 275.72 | 290.55 |
| Aquaculture pond | 42.14 | 30.50 | 50.50 | 54.21 | 40.12 |
| Water body | 2754.81 | 2744.09 | 2741.26 | 2716.60 | 2703.05 |
| Artificial surface | 43.51 | 71.77 | 105.78 | 124.93 | 148.31 |
| Bare land | 33.44 | 2.70 | 7.53 | 1.41 | 8.96 |
References
- Halpern, B.S.; Walbridge, S.; Selkoe, K.A.; Kappel, C.V.; Micheli, F.; D’Agrosa, C.; Bruno, J.F.; Casey, K.S.; Ebert, C.; Fox, H.E.; et al. A Global Map of Human Impact on Marine Ecosystems. Science 2008, 319, 948–952. [Google Scholar] [CrossRef] [Green Version]
- Onat, Y.; Marchant, M.; Francis, O.P.; Kim, K. Coastal Exposure of the Hawaiian Islands Using GIS-Based Index Modeling. Ocean Coast. Manag. 2018, 163, 113–129. [Google Scholar] [CrossRef]
- Islam, M.A.; Hossain, M.S.; Murshed, S. Assessment of Coastal Vulnerability Due to Sea Level Change at Bhola Island, Bangladesh: Using Geospatial Techniques. J. Indian Soc. Remote Sens. 2015, 43, 625–637. [Google Scholar] [CrossRef]
- Scardino, G.; Sabatier, F.; Scicchitano, G.; Piscitelli, A.; Milella, M.; Vecchio, A.; Anzidei, M.; Mastronuzzi, G. Sea-Level Rise and Shoreline Changes along an Open Sandy Coast: Case Study of Gulf of Taranto, Italy. Water 2020, 12, 1414. [Google Scholar] [CrossRef]
- Scicchitano, G.; Scardino, G.; Monaco, C.; Piscitelli, A.; Milella, M.; de Giosa, F.; Mastronuzzi, G. Comparing Impact Effects of Common Storms and Medicanes along the Coast of South-Eastern Sicily. Mar. Geol. 2021, 439, 106556. [Google Scholar] [CrossRef]
- Hoeke, R.K.; McInnes, K.L.; Kruger, J.C.; McNaught, R.J.; Hunter, J.R.; Smithers, S.G. Widespread Inundation of Pacific Islands Triggered by Distant-Source Wind-Waves. Glob. Planet. Chang. 2013, 108, 128–138. [Google Scholar] [CrossRef] [Green Version]
- Scandurra, G.; Romano, A.A.; Ronghi, M.; Carfora, A. On the Vulnerability of Small Island Developing States: A Dynamic Analysis. Ecol. Indic. 2018, 84, 382–392. [Google Scholar] [CrossRef]
- UNEP. Emerging Issues for Small Island Developing States; Results of the UNEP/UN DESA Foresight Process; United Nations Environment Programme (UNEP): Nairobi, Kenya, 2014. [Google Scholar]
- Zhang, X. Monitoring and Evaluation of Island Ecological Environment Based on Remote Sensing: A Case Study of the Zhoushan Islands. Ph.D. Dissertation, Wuhan University, Wuhan, China, 2014. [Google Scholar]
- Olehowski, C.; Naumann, S.; Fischer, D.; Siegmund, A. Geo-Ecological Spatial Pattern Analysis of the Island of Fogo (Cape Verde). Glob. Planet. Chang. 2008, 64, 188–197. [Google Scholar] [CrossRef]
- Ford, M. Shoreline Changes on an Urban Atoll in the Central Pacific Ocean: Majuro Atoll, Marshall Islands. J. Coast. Res. 2012, 28, 11–22. [Google Scholar] [CrossRef]
- O’Connor, B.; Dwyer, E.; Cawkwell, F.; Eklundh, L. Spatio-Temporal Patterns in Vegetation Start of Season across the Island of Ireland Using the MERIS Global Vegetation Index. ISPRS J. Photogramm. Remote Sens. 2012, 68, 79–94. [Google Scholar] [CrossRef]
- Li, Y. Change Detection and Analysis of Surface Coverage on Island and Reefs Via High Resolution Remote Sensing Image. Master’s Dissertation, Lanzhou Jiaotong University, Lanzhou, China, 2015. [Google Scholar]
- Mujabar, P.S.; Chandrasekar, N. Shoreline Change Analysis along the Coast between Kanyakumari and Tuticorin of India Using Remote Sensing and GIS. Arab. J. Geosci. 2013, 6, 647–664. [Google Scholar] [CrossRef]
- Zhang, L. Analysis Change on the Surface Coverage of Island Based on Object-Oriented-Take Tongpan Island as Example. Master’s Dissertation, Hangzhou Normal University, Hangzhou, China, 2015. [Google Scholar]
- Chen, J.; Pan, D.; Mao, Z.; Chen, N.; Zhao, J.; Liu, M. Land-Cover Reconstruction and Change Analysis Using Multisource Remotely Sensed Imageries in Zhoushan Islands since 1970. J. Coast. Res. 2014, 30, 272–282. [Google Scholar] [CrossRef]
- Mageswaran, T.; Sachithanandam, V.; Sridhar, R.; Thirunavukarasu, E.; Ramesh, R. Mapping and Monitoring of Land Use/Land Cover Changes in Neil Island (South Andaman) Using Geospatial Approaches. Indian J. Geo-Mar. Sci. 2015, 44, 1762–1768. [Google Scholar]
- Cao, Z.; Lin, N.; Xu, W.; Lu, W.; Zahng, X. Classification of the Remotely Sensed Image for the Dongyu Island Based on Back-Propagation Neural Network. Mar. Sci. Bull. 2016, 35, 587–593. [Google Scholar] [CrossRef]
- Zhang, Y.; Li, D.; Fan, C.; Xu, H.; Hou, X. Southeast Asia Island Coastline Changes and Driving Forces from 1990 to 2015. Ocean Coast. Manag. 2021, 215, 105967. [Google Scholar] [CrossRef]
- Hou, X.; Wu, T.; Wang, Y.; Xu, X.; Chen, Q.; Yu, L. Extraction and Accuracy Evaluation of Multi-Temporal Coastlines of Main-Land China since 1940s. Mar. Sci. 2014, 38, 66–73. [Google Scholar] [CrossRef]
- Kuleli, T.; Guneroglu, A.; Karsli, F.; Dihkan, M. Automatic Detection of Shoreline Change on Coastal Ramsar Wetlands of Turkey. Ocean Eng. 2011, 38, 1141–1149. [Google Scholar] [CrossRef]
- Zhang, X.; Zhuang, Z.; Zhang, X.; Yang, B. Coastline Extraction and Change Monitoring by Remote Sensing Technology in Qinhuangdao City. Remote Sens. Technol. Appl. 2014, 29, 625–630. [Google Scholar] [CrossRef]
- Puissant, A.; Lefèvre, S.; Weber, J. Coastline Extraction in VHR Imagery Using Mathematical Morphology with Spatial and Spectral Knowledge. SPRS Congress Beijing 2008. Available online: https://halshs.archives-ouvertes.fr/halshs-00467552 (accessed on 3 March 2022).
- Gorelick, N.; Hancher, M.; Dixon, M.; Ilyushchenko, S.; Thau, D.; Moore, R. Google Earth Engine: Planetary-Scale Geospatial Analysis for Everyone. Remote Sens. Environ. 2017, 202, 18–27. [Google Scholar] [CrossRef]
- United Nations Development Programme, Human Development Report 2020: The Next Frontier—Human Development and the Anthropocene. Available online: Http://Hdr.Undp.Org/En/2020-Report (accessed on 12 December 2020).
- Joshua Calder’s World Island Info-Largest Islands of the World. Available online: Http://Www.Worldislandinfo.Com/LARGESTV1.Html (accessed on 3 March 2022).
- Sri Lanka Annual GDP at Current Prices and GDP Shares. Department of Census and Statistics. Available online: Www.Census.Gov.Lk (accessed on 8 February 2021).
- Jun, C.; Ban, Y.; Li, S. Open Access to Earth Land-Cover Map. Nature 2014, 514, 434. [Google Scholar] [CrossRef] [Green Version]
- Hou, W.; Hou, X. Remote Sensing Classification System of Land Use and Land Cover for Global Coastal Zone Considering Fine Classification of Wetlands. Trop. Geogr. 2018, 38, 866–873. [Google Scholar] [CrossRef]
- Gislason, P.O.; Benediktsson, J.A.; Sveinsson, J.R. Random Forests for Land Cover Classification. Pattern Recognit. Lett. 2006, 27, 294–300. [Google Scholar] [CrossRef]
- Breiman, L. Random Forests. Mach. Learn. 2001, 45, 5–32. [Google Scholar] [CrossRef] [Green Version]
- Haralick, R.M.; Dinstein, I.; Shanmugam, K. Textural Features for Image Classification. IEEE Trans. Syst. Man Cybern. 1973, SMC-3, 610–621. [Google Scholar] [CrossRef] [Green Version]
- Hou, X.; Wu, T.; Hou, W.; Chen, Q.; Wang, Y.; Yu, L. Characteristics of Coastline Changes in Mainland China since the Early 1940s. Sci. China Earth Sci. 2016, 59, 1791–1802. [Google Scholar] [CrossRef]
- Sui, L.; Wang, J.; Yang, X.; Wang, Z. Spatial-Temporal Characteristics of Coastline Changes in Indonesia from 1990 to 2018. Sustainability 2020, 12, 3242. [Google Scholar] [CrossRef] [Green Version]
- Qayyum, U.; Sabir, S.; Anjum, S. Urbanization, Informal Economy, and Ecological Footprint Quality in South Asia. Environ. Sci. Pollut. Res. 2021, 28, 67011–67021. [Google Scholar] [CrossRef]
- Zhao, M.; Cheng, W.; Zhou, C.; Li, M.; Huang, K.; Wang, N. Assessing Spatiotemporal Characteristics of Urbanization Dynamics in Southeast Asia Using Time Series of DMSP/OLS Nighttime Light Data. Remote Sens. 2018, 10, 47. [Google Scholar] [CrossRef] [Green Version]
- Small, C.; Nicholls, R.J. A Global Analysis of Human Settlement in Coastal Zones. J. Coast. Res. 2003, 19, 584–599. [Google Scholar]
- Neumann, B.; Vafeidis, A.T.; Zimmermann, J.; Nicholls, R.J. Future Coastal Population Growth and Exposure to Sea-Level Rise and Coastal Flooding—A Global Assessment. PLoS ONE 2015, 10, e0131375. [Google Scholar] [CrossRef] [Green Version]
- Zheng, Z.; Wu, Z.; Chen, Y.; Yang, Z.; Marinello, F. Exploration of Eco-Environment and Urbanization Changes in Coastal Zones: A Case Study in China over the Past 20 Years. Ecol. Indic. 2020, 119, 106847. [Google Scholar] [CrossRef]
- Dissanayake, P.; Hettiarachchi, S.; Siriwardana, C. Increase in Disaster Risk Due to Inefficient Environmental Management, Land Use Policies and Relocation Policies. Case Studies from Sri Lanka. Procedia Eng. 2018, 212, 1326–1333. [Google Scholar] [CrossRef]
- Solari, L.; Ciampalini, A.; Raspini, F.; Bianchini, S.; Moretti, S. PSInSAR Analysis in the Pisa Urban Area (Italy): A Case Study of Subsidence Related to Stratigraphical Factors and Urbanization. Remote Sens. 2016, 8, 120. [Google Scholar] [CrossRef] [Green Version]
- Serasinghe Pathiranage, I.S.; Kantakumar, L.N.; Sundaramoorthy, S. Remote Sensing Data and SLEUTH Urban Growth Model: As Decision Support Tools for Urban Planning. Chin. Geogr. Sci. 2018, 28, 274–286. [Google Scholar] [CrossRef] [Green Version]
- Van Vliet, J. Direct and Indirect Loss of Natural Area from Urban Expansion. Nat. Sustain. 2019, 2, 755–763. [Google Scholar] [CrossRef]
- Tubiello, F.N.; Salvatore, M.; Ferrara, A.F.; House, J.; Federici, S.; Rossi, S.; Biancalani, R.; Condor Golec, R.D.; Jacobs, H.; Flammini, A.; et al. The Contribution of Agriculture, Forestry and Other Land Use Activities to Global Warming, 1990–2012. Glob. Chang. Biol. 2015, 21, 2655–2660. [Google Scholar] [CrossRef] [Green Version]
- Teluguntla, P.; Thenkabail, P.S.; Xiong, J.; Gumma, M.K.; Giri, C.; Milesi, C.; Ozdogan, M.; Congalton, R.G.; Tilton, J. Global Food Security Support Analysis Data at Nominal 1 Km (GFSAD1km) Derived from Remote Sensing in Support of Food Security in the Twenty-First Century: Current Achievements and Future Possibilities. In Land Resources Monitoring, Modeling, and Mapping with Remote Sensing; CRC Press: Boca Raton, FL, USA, 2015. [Google Scholar]
- Gumma, M.K.; Thenkabail, P.S.; Teluguntla, P.G.; Oliphant, A.; Xiong, J.; Giri, C.; Pyla, V.; Dixit, S.; Whitbread, A.M. Agricultural Cropland Extent and Areas of South Asia Derived Using Landsat Satellite 30-m Time-Series Big-Data Using Random Forest Machine Learning Algorithms on the Google Earth Engine Cloud. GIScience Remote Sens. 2020, 57, 302–322. [Google Scholar] [CrossRef] [Green Version]
- Rasul, G.; Thapa, G.B. Shifting Cultivation in the Mountains of South and Southeast Asia: Regional Patterns and Factors Influencing the Change. Land Degrad. Dev. 2003, 14, 495–508. [Google Scholar] [CrossRef]
- Fisher, R. Tropical Forest Monitoring, Combining Satellite and Social Data, to Inform Management and Livelihood Implications: Case Studies from Indonesian West Timor. Int. J. Appl. Earth Obs. Geoinf. 2012, 16, 77–84. [Google Scholar] [CrossRef]
- Li, P.; Feng, Z.; Jiang, L.; Liao, C.; Zhang, J. A Review of Swidden Agriculture in Southeast Asia. Remote Sens. 2014, 6, 1654–1683. [Google Scholar] [CrossRef] [Green Version]
- Song, Y.; Zhang, Y.; Hou, X. Characteristics of Mainland Shoreline Position Changes of Maritime Silk Road in the Early 21st Century. Mar. Sci. 2021, 45, 18–28. [Google Scholar] [CrossRef]
- Primavera, J.H. Overcoming the Impacts of Aquaculture on the Coastal Zone. Ocean Coast. Manag. 2006, 49, 531–545. [Google Scholar] [CrossRef]
- Arns, A.; Wahl, T.; Wolff, C.; Vafeidis, A.T.; Haigh, I.D.; Woodworth, P.; Niehüser, S.; Jensen, J. Non-Linear Interaction Modulates Global Extreme Sea Levels, Coastal Flood Exposure, and Impacts. Nat. Commun. 2020, 11, 1918. [Google Scholar] [CrossRef] [PubMed] [Green Version]
- Ratnayakage, S.M.S.; Sasaki, J.; Suzuki, T.; Jayaratne, R.; Ranawaka, R.A.S.; Pathmasiri, S.D. On the Status and Mechanisms of Coastal Erosion in Marawila Beach, Sri Lanka. Nat. Hazards 2020, 103, 1261–1289. [Google Scholar] [CrossRef]
- Zhang, Y.; Hou, X. Characteristics of Coastline Changes on Southeast Asia Islands from 2000 to 2015. Remote Sens. 2020, 12, 519. [Google Scholar] [CrossRef] [Green Version]
- Deforestation and Forest Degradation. Available online: Https://Www.Iucn.Org/Resources/Issues-Briefs/Deforestation-and-Forest-Degradation (accessed on 1 March 2022).
- Stibig, H.J.; Achard, F.; Carboni, S.; Raši, R.; Miettinen, J. Change in Tropical Forest Cover of Southeast Asia from 1990 to 2010. Biogeosciences 2014, 11, 247–258. [Google Scholar] [CrossRef] [Green Version]
- Ranagalage, M.; Gunarathna, M.H.J.P.; Surasinghe, T.D.; Dissanayake, D.; Simwanda, M.; Murayama, Y.; Morimoto, T.; Phiri, D.; Nyirenda, V.R.; Premakantha, K.T.; et al. Multi-Decadal Forest-Cover Dynamics in the Tropical Realm: Past Trends and Policy Insights for Forest Conservation in Dry Zone of Sri Lanka. Forests 2020, 11, 836. [Google Scholar] [CrossRef]
- Bouma, G.A.; Kobryn, H.T. Change in Vegetation Cover in East Timor, 1989–1999. Nat. Resour. Forum 2004, 28, 1–12. [Google Scholar] [CrossRef] [Green Version]
- FAO. Global Forest Resources Assessment 2020: Main Report. Rome. 2020. Available online: Https://Doi.Org/10.4060/Ca9825en (accessed on 3 March 2022).
- Sunderlin, W.D.; Resosudarmo, I.A.P. Rates and Causes of Deforestation in Indonesia: Towards a Resolution of the Ambiguities; CIFOR: Bogor, Indonesia, 1996. [Google Scholar]
- Contreras-Hermosilla, A.; Fay, C.; Thamrin, J.; Sembiring, S. Strengthening Forest Management in Indonesia through Land Tenure Reform: Issues and Framework Action. 2005. Available online: https://www.worldagroforestry.org/publication/strengthening-forest-management-indonesia-through-land-tenure-reform-issues-and (accessed on 3 March 2022).
- Sudhakar Reddy, C.; Manaswini, G.; Jha, C.S.; Diwakar, P.G.; Dadhwal, V.K. Development of National Database on Long-Term Deforestation in Sri Lanka. J. Indian Soc. Remote Sens. 2017, 45, 825–836. [Google Scholar] [CrossRef]
- Dressler, W.; Pulhin, J. The Shifting Ground of Swidden Agriculture on Palawan Island, the Philippines. Agric. Hum. Values 2010, 27, 445–459. [Google Scholar] [CrossRef]
- Danielsen, F.; Sørensen, M.K.; Olwig, M.F.; Selvam, V.; Parish, F.; Burgess, N.D.; Hiraishi, T.; Karunagaran, V.M.; Rasmussen, M.S.; Hansen, L.B.; et al. The Asian Tsunami: A Protective Role for Coastal Vegetation. Science 2005, 310, 643. [Google Scholar] [CrossRef] [PubMed] [Green Version]
- Duke, N.C.; Meynecke, J.-O.; Dittmann, S.; Ellison, A.M.; Anger, K.; Berger, U.; Cannicci, S.; Diele, K.; Ewel, K.C.; Field, C.D.; et al. A World Without Mangroves? Science 2007, 317, 41–42. [Google Scholar] [CrossRef] [Green Version]
- Giri, C.; Long, J.; Abbas, S.; Murali, R.M.; Qamer, F.M.; Pengra, B.; Thau, D. Distribution and Dynamics of Mangrove Forests of South Asia. J. Environ. Manag. 2015, 148, 101–111. [Google Scholar] [CrossRef] [PubMed]
- Winterwerp, J.C.; Borst, W.G.; de Vries, M.B. Pilot Study on the Erosion and Rehabilitation of a Mangrove Mud Coast. J. Coast. Res. 2005, 21, 223–230. [Google Scholar] [CrossRef]
- Das, S. Does Mangrove Plantation Reduce Coastal Erosion? Assessment from the West Coast of India. Reg. Environ. Chang. 2020, 20, 58. [Google Scholar] [CrossRef]
- Kauffman, J.B.; Donato, D.C. Protocols for the Measurement, Monitoring and Reporting of Structure, Biomass and Carbon Stocks in Mangrove Forests; Working Paper 86; CIFOR: Bogor, Indonesia, 2012. [Google Scholar]
- Friess, D.A.; Rogers, K.; Lovelock, C.E.; Krauss, K.W.; Hamilton, S.E.; Lee, S.Y.; Lucas, R.; Primavera, J.; Rajkaran, A.; Shi, S. The State of the World’s Mangrove Forests: Past, Present, and Future. Annu. Rev. Environ. Resour. 2019, 44, 89–115. [Google Scholar] [CrossRef] [Green Version]
- Cornforth, W.A.; Fatoyinbo, T.E.; Freemantle, T.P.; Pettorelli, N. Advanced Land Observing Satellite Phased Array Type L-Band SAR (ALOS PALSAR) to Inform the Conservation of Mangroves: Sundarbans as a Case Study. Remote Sens. 2013, 5, 224. [Google Scholar] [CrossRef] [Green Version]
- Ghina, F. Sustainable Development in Small Island Developing States: The Case of the Maldvies. In The World Summit on Sustainable Development: The Johannesburg Conference; Springer: Dordrecht, The Netherlands, 2005. [Google Scholar]
- UN-Habitat. Urbanization and Climate Change in Small Island Developing States; UN-Habitat: Nairobi, Kenya, 2015. [Google Scholar]
- Chen, H.; Jia, B.; Lau, S.S.Y. Sustainable Urban Form for Chinese Compact Cities: Challenges of a Rapid Urbanized Economy. Habitat Int. 2008, 32, 28–40. [Google Scholar] [CrossRef]
- UNDESA. Trends in Sustainable Development Small Island Developing States (SIDS). In Trends in Sustainable Development; UNDESA: New York, NY, USA, 2014. [Google Scholar]
- Nath, S.; Roberts, J.L.; Madhoo, Y.N. Saving Small Island Developing States Environmental and Natural Resource Challenges; Commonwealth Secretariat: London, UK, 2010. [Google Scholar]
- Anzidei, M.; Scicchitano, G.; Scardino, G.; Bignami, C.; Tolomei, C.; Vecchio, A.; Serpelloni, E.; de Santis, V.; Monaco, C.; Milella, M.; et al. Relative Sea-Level Rise Scenario for 2100 along the Coast of South Eastern Sicily (Italy) by Insar Data, Satellite Images and High-Resolution Topography. Remote Sens. 2021, 13, 1108. [Google Scholar] [CrossRef]
- Thornes, J.E. IPCC, 2001: Climate Change 2001: Impacts, Adaptation and Vulnerability, Contribution of Working Group II to the Third Assessment Report of the Intergovernmental Panel on Climate Change, Edited by J. J. McCarthy, O. F. Canziani, N. A. Leary, D. J. Dokken. Int. J. Climatol. 2002, 22, 1285–1286. [Google Scholar] [CrossRef]
Figure 1.
Location map of the study areas. (a) Sri Lanka Island, (b) Timor Island, and (c) Palawan Island. The background map is the normalized vegetation index map derived from MOD13Q1 in 2020.
Figure 1.
Location map of the study areas. (a) Sri Lanka Island, (b) Timor Island, and (c) Palawan Island. The background map is the normalized vegetation index map derived from MOD13Q1 in 2020.

Figure 2.
Spatial distribution of land cover in Sri Lanka from 1990 to 2020.

Figure 3.
Changes in Sri Lanka from 1990 to 2020. (a) Land cover changes and (b) change flows between different land cover types.
Figure 3.
Changes in Sri Lanka from 1990 to 2020. (a) Land cover changes and (b) change flows between different land cover types.

Figure 4.
Spatial distribution of land cover in Timor from 1990 to 2020.

Figure 5.
Changes in Timor from 1990 to 2020. (a) Land cover changes and (b) change flows between different land cover types.
Figure 5.
Changes in Timor from 1990 to 2020. (a) Land cover changes and (b) change flows between different land cover types.

Figure 6.
Spatial distribution of land cover in Palawan from 1990 to 2020.

Figure 7.
Changes in Palawan from 1990 to 2020. (a) Land cover changes and (b) change flows between different land cover types.
Figure 7.
Changes in Palawan from 1990 to 2020. (a) Land cover changes and (b) change flows between different land cover types.

Figure 8.
The coastline in Sri Lanka. (a) Spatial distributions of coastline in 2020 and (b) length statistics of different coastline types from 1990 to 2020.
Figure 8.
The coastline in Sri Lanka. (a) Spatial distributions of coastline in 2020 and (b) length statistics of different coastline types from 1990 to 2020.

Figure 9.
The coastline of Timor Island. (a) Spatial distributions of coastline in 2020 and (b) length statistics of different coastline types from 1990 to 2020.
Figure 9.
The coastline of Timor Island. (a) Spatial distributions of coastline in 2020 and (b) length statistics of different coastline types from 1990 to 2020.

Figure 10.
The coastline of Palawan Island. (a) Spatial distributions of coastline in 2020 and (b) length statistics of different coastline types from 1990 to 2020.
Figure 10.
The coastline of Palawan Island. (a) Spatial distributions of coastline in 2020 and (b) length statistics of different coastline types from 1990 to 2020.

Figure 11.
Length and diversity of coastline for three islands. (a) Spatial distributions of the coastline length in 2020. (b) Map showing the increase and decrease in coastline length from 1990 to 2020, where stable stands for changes in the range of −0.1 km to 0.1 km, decrease stands for changes of less than −0.1 km, and increase stands for changes of over 0.1 km. (c) Spatial distributions of coastline diversity in 2020. (d) Change in coastline diversity from 1990 to 2020.

Table 1.
Equations of index features used in the Random Forest algorithm.
| Index | Equation |
|---|---|
| Normalized Difference Vegetation Index | |
| Enhanced Vegetation Index | |
| Green Chlorophyll Vegetation Index | |
| Normalized Difference Water Index | |
| Land Surface Water Index | |
| Normalized Difference Built-up Index |
LMIR, LSWIR, LNIR, LRED, LGREEN, and LBLUE represent the mid-infrared, short-wave infrared, near-infrared, red, green, and blue bands of Landsat images, respectively.
Table 2.
Accuracy assessment for land cover classification.
| Study Areas | Year | Sample Points | OA (%) | Kappa |
|---|---|---|---|---|
| Sri Lanka | 1990 | 1376 | 90.93 | 0.90 |
| 2000 | 1243 | 90.57 | 0.89 | |
| 2010 | 1530 | 93.26 | 0.92 | |
| 2015 | 1496 | 87.77 | 0.86 | |
| 2020 | 1452 | 92.20 | 0.91 | |
| Average | -- | 90.95 | 0.90 | |
| Timor | 1990 | 1129 | 84.5 | 0.82 |
| 2000 | 1463 | 86.97 | 0.85 | |
| 2010 | 1301 | 86.52 | 0.85 | |
| 2015 | 2524 | 84.95 | 0.83 | |
| 2020 | 1824 | 89.26 | 0.88 | |
| Average | -- | 86.44 | 0.85 | |
| Palawan | 1990 | 1154 | 87.6 | 0.86 |
| 2000 | 888 | 85.26 | 0.83 | |
| 2010 | 1017 | 86.98 | 0.85 | |
| 2015 | 1126 | 84.96 | 0.83 | |
| 2020 | 1003 | 87.19 | 0.85 | |
| Average | -- | 86.40 | 0.85 |
Table 3.
Overall changes in area for the main land cover types for three tropical islands from 1990 to 2020.
Table 3.
Overall changes in area for the main land cover types for three tropical islands from 1990 to 2020.
| Overall Changes (km2) | Area of Artificial Surface | Area of Cultivated Land | Area of Forest | Area of Mangrove | Land Area (According to the Coastline) |
|---|---|---|---|---|---|
| Sri Lanka | 1116.45 | 3952.71 | −2472.96 | −121.13 | −149.11 |
| Timor | 579.16 | 795.79 | −5389.37 | −8.27 | 13.68 |
| Palawan | 104.80 | 76.25 | −590.49 | −45.52 | 2.06 |
The green means increase, the red means decrease.
Table 4.
Overall changes of coastline in three tropical islands from 1990 to 2020.
| Overall Coastlines Changes | Total Length of Coastline (km) | Length of Artificial Coastline (km) | Length of Natural Coastline (km) | Length of Coastline (Grids) | Diversity of Coastline (Grids) |
|---|---|---|---|---|---|
| Sri Lanka | 586.23 | 266.01 | 320.22 | Increase | Increase |
| Timor | −26.44 | 54.22 | −80.65 | Decrease slightly | Decrease |
| Palawan | 66.13 | 91.58 | −25.45 | Increase | Increase |
The green means increase, the red means decrease.
Table 5.
Social and economic statistics of related countries from 1990 to 2020.
| Country | Year | Population | GDP (Million Dollars) | Area of Agriculture (km2) | Area of Forest (km2) |
|---|---|---|---|---|---|
| Sri Lanka | 1990 | 17,325,769 | 8032.55 | 23,390 | 23,503.30 |
| 2000 | 18,777,606 | 16,330.81 | 23,500 | 21,664.20 | |
| 2010 | 20,261,738 | 56,725.75 | 26,200 | 21,036.20 | |
| 2015 | 20,970,000 | 80,604.08 | 27,400 | 21,288.20 | |
| 2020 | 21,919,000 | 80,676.68 | 28,116 | 21,130.20 | |
| Changes (1990–2020) | 4,593,231 | 72,644.13 | 4726 | −2373.10 | |
| Timor-Leste | 1990 | 737,814 | -- | 3180 | 9631.00 |
| 2000 | 884,366 | 367.09 | 3370 | 9491.00 | |
| 2010 | 1,093,517 | 881.83 | 3720 | 9351.00 | |
| 2015 | 1,196,294 | 1594.41 | 3800 | 9281.00 | |
| 2020 | 1,318,442 | 1902.16 | 3800 | 9211.00 | |
| Changes (1990–2020) | 580,628 | 1535.07 | 620 | −420.00 | |
| Indonesia | 1990 | 181,413,398 | 106,140.73 | 450,830 | 1,185,450.00 |
| 2000 | 211,513,822 | 165,021.01 | 471,770 | 1,012,800.00 | |
| 2010 | 241,834,226 | 755,094.16 | 556,000 | 996,592.00 | |
| 2015 | 258,383,257 | 860,854.24 | 573,000 | 950,279.00 | |
| 2020 | 273,523,621 | 1,058,423.84 | 623,000 | 921,332.00 | |
| Changes (1990–2020) | 92,110,223 | 952,283.11 | 172,170 | −264,118.00 | |
| Philippines | 1990 | 61,895,169 | 50,508.29 | 111,400 | 77,788.10 |
| 2000 | 77,991,757 | 83,669.69 | 112,340 | 73,092.60 | |
| 2010 | 93,966,784 | 208,368.73 | 121,000 | 68,397.20 | |
| 2015 | 102,113,206 | 306,446.14 | 124,400 | 70,141.50 | |
| 2020 | 109,581,085 | 361,489.33 | 124,400 | 71,885.90 | |
| Changes (1990–2020) | 47,685,916 | 310,981.04 | 13,000 | −5902.20 |
Date source: World Bank; the number in blue means data from 2018.
Publisher’s Note: MDPI stays neutral with regard to jurisdictional claims in published maps and institutional affiliations. |
© 2022 by the authors. Licensee MDPI, Basel, Switzerland. This article is an open access article distributed under the terms and conditions of the Creative Commons Attribution (CC BY) license (https://creativecommons.org/licenses/by/4.0/).
Share and Cite
MDPI and ACS Style
Fu, T.; Zhang, L.; Chen, B.; Yan, M. Human Disturbance on the Land Surface Environment in Tropical Islands: A Remote Sensing Perspective. Remote Sens. 2022, 14, 2100. https://doi.org/10.3390/rs14092100
AMA Style
Fu T, Zhang L, Chen B, Yan M. Human Disturbance on the Land Surface Environment in Tropical Islands: A Remote Sensing Perspective. Remote Sensing. 2022; 14(9):2100. https://doi.org/10.3390/rs14092100
Chicago/Turabian StyleFu, Tianmeng, Li Zhang, Bowei Chen, and Min Yan. 2022. "Human Disturbance on the Land Surface Environment in Tropical Islands: A Remote Sensing Perspective" Remote Sensing 14, no. 9: 2100. https://doi.org/10.3390/rs14092100
Note that from the first issue of 2016, this journal uses article numbers instead of page numbers. See further details here.