
Construction of Regional Ecological Security Patterns Based on Multi-Criteria Decision Making and Circuit Theory


1
Key Laboratory of Poyang Lake Wetland and Watershed Research, School of Geography and Environment, Jiangxi Normal University, Nanchang 330022, China
2
School of Landscape Architecture, Nanjing Forestry University, Nanjing 210037, China
3
School of Architecture and Planning, Anhui Jianzhu University, Hefei 230022, China
4
State Key Laboratory of Hydraulic Engineering Simulation and Safety, School of Civil Engineering, Tianjin University, Tianjin 300072, China
5
School of Public Administration, China University of Geosciences (Wuhan), Wuhan 430074, China
6
Hydrology Bureau of Xinjiang Uygur Autonomous Region, Urumqi 830099, China
*
Author to whom correspondence should be addressed.
†
These authors contributed equally to this work.
Remote Sens. 2022, 14(3), 527; https://doi.org/10.3390/rs14030527
Submission received: 21 November 2021
/
Revised: 17 January 2022
/
Accepted: 17 January 2022
/
Published: 22 January 2022
(This article belongs to the Special Issue Remote Sensing of Coastal Waters, Land Use/Cover, Lakes, Rivers and Watersheds II)
Abstract
:The scientific identification of key areas for regional ecological protection represents an important basis for maintaining regional ecological stability and enhancing regional development. It is also a developing methodology of landscape ecology (LE) research. The strategic ecological protection and integrated development of the Yangtze River Delta region is of critical significance for promoting the construction of ecological civilization in the watershed and improving societal health. Here, we analyze Anhui Province and select important ecosystem service functions (biodiversity, carbon fixation, soil conservation function, and water retention) in the study area. We construct a spatial pattern of ecosystem services for multiple scenarios based on the multi-criteria decision-making method ordered weighted averaging (OWA), calculate the trade-off degree and conservation efficiency of each scenario, identify ecological priority conservation areas, use circuit theory to explore ecological corridors and key areas and to construct regional ecological corridors, and identify regional pinch points and barrier points which may impede the construction of regional ecological security patterns. The study area is divided into an ecological protection zone, ecological buffer zone, ecological transition zone, ecological optimization zone, and ecological governance zone. Our results show that: (1) the four types of ecosystems in the study area have similar spatial distribution patterns, with an overall spatial characteristic of “high in the southwest and low in the northeast”; (2) the four types of ecosystem services in the study area show synergistic relationships at the provincial scale, but in areas with different natural and geographical characteristics, there are both synergistic and trade-off relationships between different ecosystem services; (3) a total of 121 ecological source sites were identified in the study area based on multi-criteria decision making which cover an area of 43,222.26 km2, accounting for 30.87% of the total area of the study area; and (4) a total of 250 ecological corridors, 54 pinch points, and 24 barrier points were identified in the study area based on circuit theory. Our results may provide decision support for ecological restoration and land use structure optimization in Anhui Province and other regions.
1. Introduction
The dramatic expansion of human activity and rapid urbanization has led to dramatic changes in land use worldwide and an increasingly homogenous distribution of species on the planet. This has accelerated the rate of species extinction by a factor of 1000 compared to the typical background rate in Earth’s history. A total of 10–30% of mammals, birds, and amphibians are on the verge of extinction [1]. The degradation of ecosystem services has also had a significant impact on societal well-being [2]. In the 1980s, due to the intense exploitation and ecological destruction of global land, the theory of ecological safety patterns was proposed, which found traction in ecology [3,4,5], landscape science, planning, and geography. The essence of ecological safety patterns is the identification, restoration, and reconstruction of nodes and corridors which play an important role in the structure and function of regional ecosystems [6]. It is thus necessary to achieve effective regulation of ecological processes by ecological safety patterns and to ensure a sustainable supply of regional ecosystem services, which may subsequently enhance societal well-being [7,8].
Ecological security patterns have been analyzed and discussed in the context of concepts [3,9,10], technical methods [11,12,13,14], multi-level network construction [15,16,17], and areas with different physical and geographical characteristics [18,19,20], which have enriched the theoretical and practical framework of the theory. Most previous efforts which were concerned with the identification of source sites or protected areas in the construction of ecological safety patterns employed morphological spatial pattern analysis (MSPA) [21,22], superimposed the main ecosystem services in the study area, or directly selected ecological wetlands or forest parks [23,24]. There may be synergies and trade-offs between ecosystem services [25,26,27], and these synergies and trade-offs of ecosystem services vary greatly between different scales or regions [28]. As ecological security patterns are constructed to protect regional ecological security and enhance societal health [29], unhealthy ecosystem service relationships can seriously affect the sustainable development of regional economies and societies [15,30]. A more scientific approach to source selection is therefore particularly important in balancing competing relationships between multiple ecosystem services. The multicriteria decision-making approach ordered weighted averaging (OWA) has been shown in a variety of studies to address trade-offs between multiple ecosystem services when identifying areas for conservation intervention. In 2007, MaRce et al. [31] proposed a method for the restoration and identification of the connectivity of biological habitats such as barrier areas and ecological pinch points. Circuit theory complements the commonly used connectivity model since it is linked to random walk theory and enables the simultaneous assessment of the contributions of multiple discrete paths. In the circuit theory model, where landscape types are used as conductive surfaces, landscape types with low resistance that promote biological flow are assigned high resistance. This methodology has been widely applied in wildlife corridor design, landscape gene flow, sports ecology, disease transmission, and other applications [31]. Therefore, the use of OWA to identify the ecological source with the highest protection efficiency combined with the methods of circuit theory to identify areas in the ecological corridor that need to be protected and restored provides a new decision-making method and technical path for building a regional ecological security pattern in the future.
Anhui Province is located in the Yangtze River Delta city cluster, one of the six largest urban areas in the world, and its economy has rapidly developed in the 21st century. The province has seen extensive and frequent construction of cities, highways, and high-speed railways, which has inevitably damaged the habitats of many species and the living environment of the people themselves. Recently, the concept of “ecological civilization” has been introduced, which refers to high-quality regional development and ecological restoration.
In this article, we study Anhui Province with the intention of: (1) assessing the comprehensive ecosystem service functions based on four indicators (habitat quality, water conservation, carbon fixation, and soil retention); (2) measuring the synergy and trade-offs between different scales and regional ecosystem services; (3) constructing a multi-scenario ecosystem service pattern, identifying priority protected areas for each scenario, and determining the final ecological source sites by measuring the conservation efficiency and trade-offs of each scenario based on OWA methodology; and (4) constructing ecological corridors, simulating the extent of species migration corridors using circuit theory, and identifying key areas that are important for maintaining ecological security. This is carried out in order to provide decision support for land use development and ecosystem management.
2. Materials and Methods
2.1. Study Site
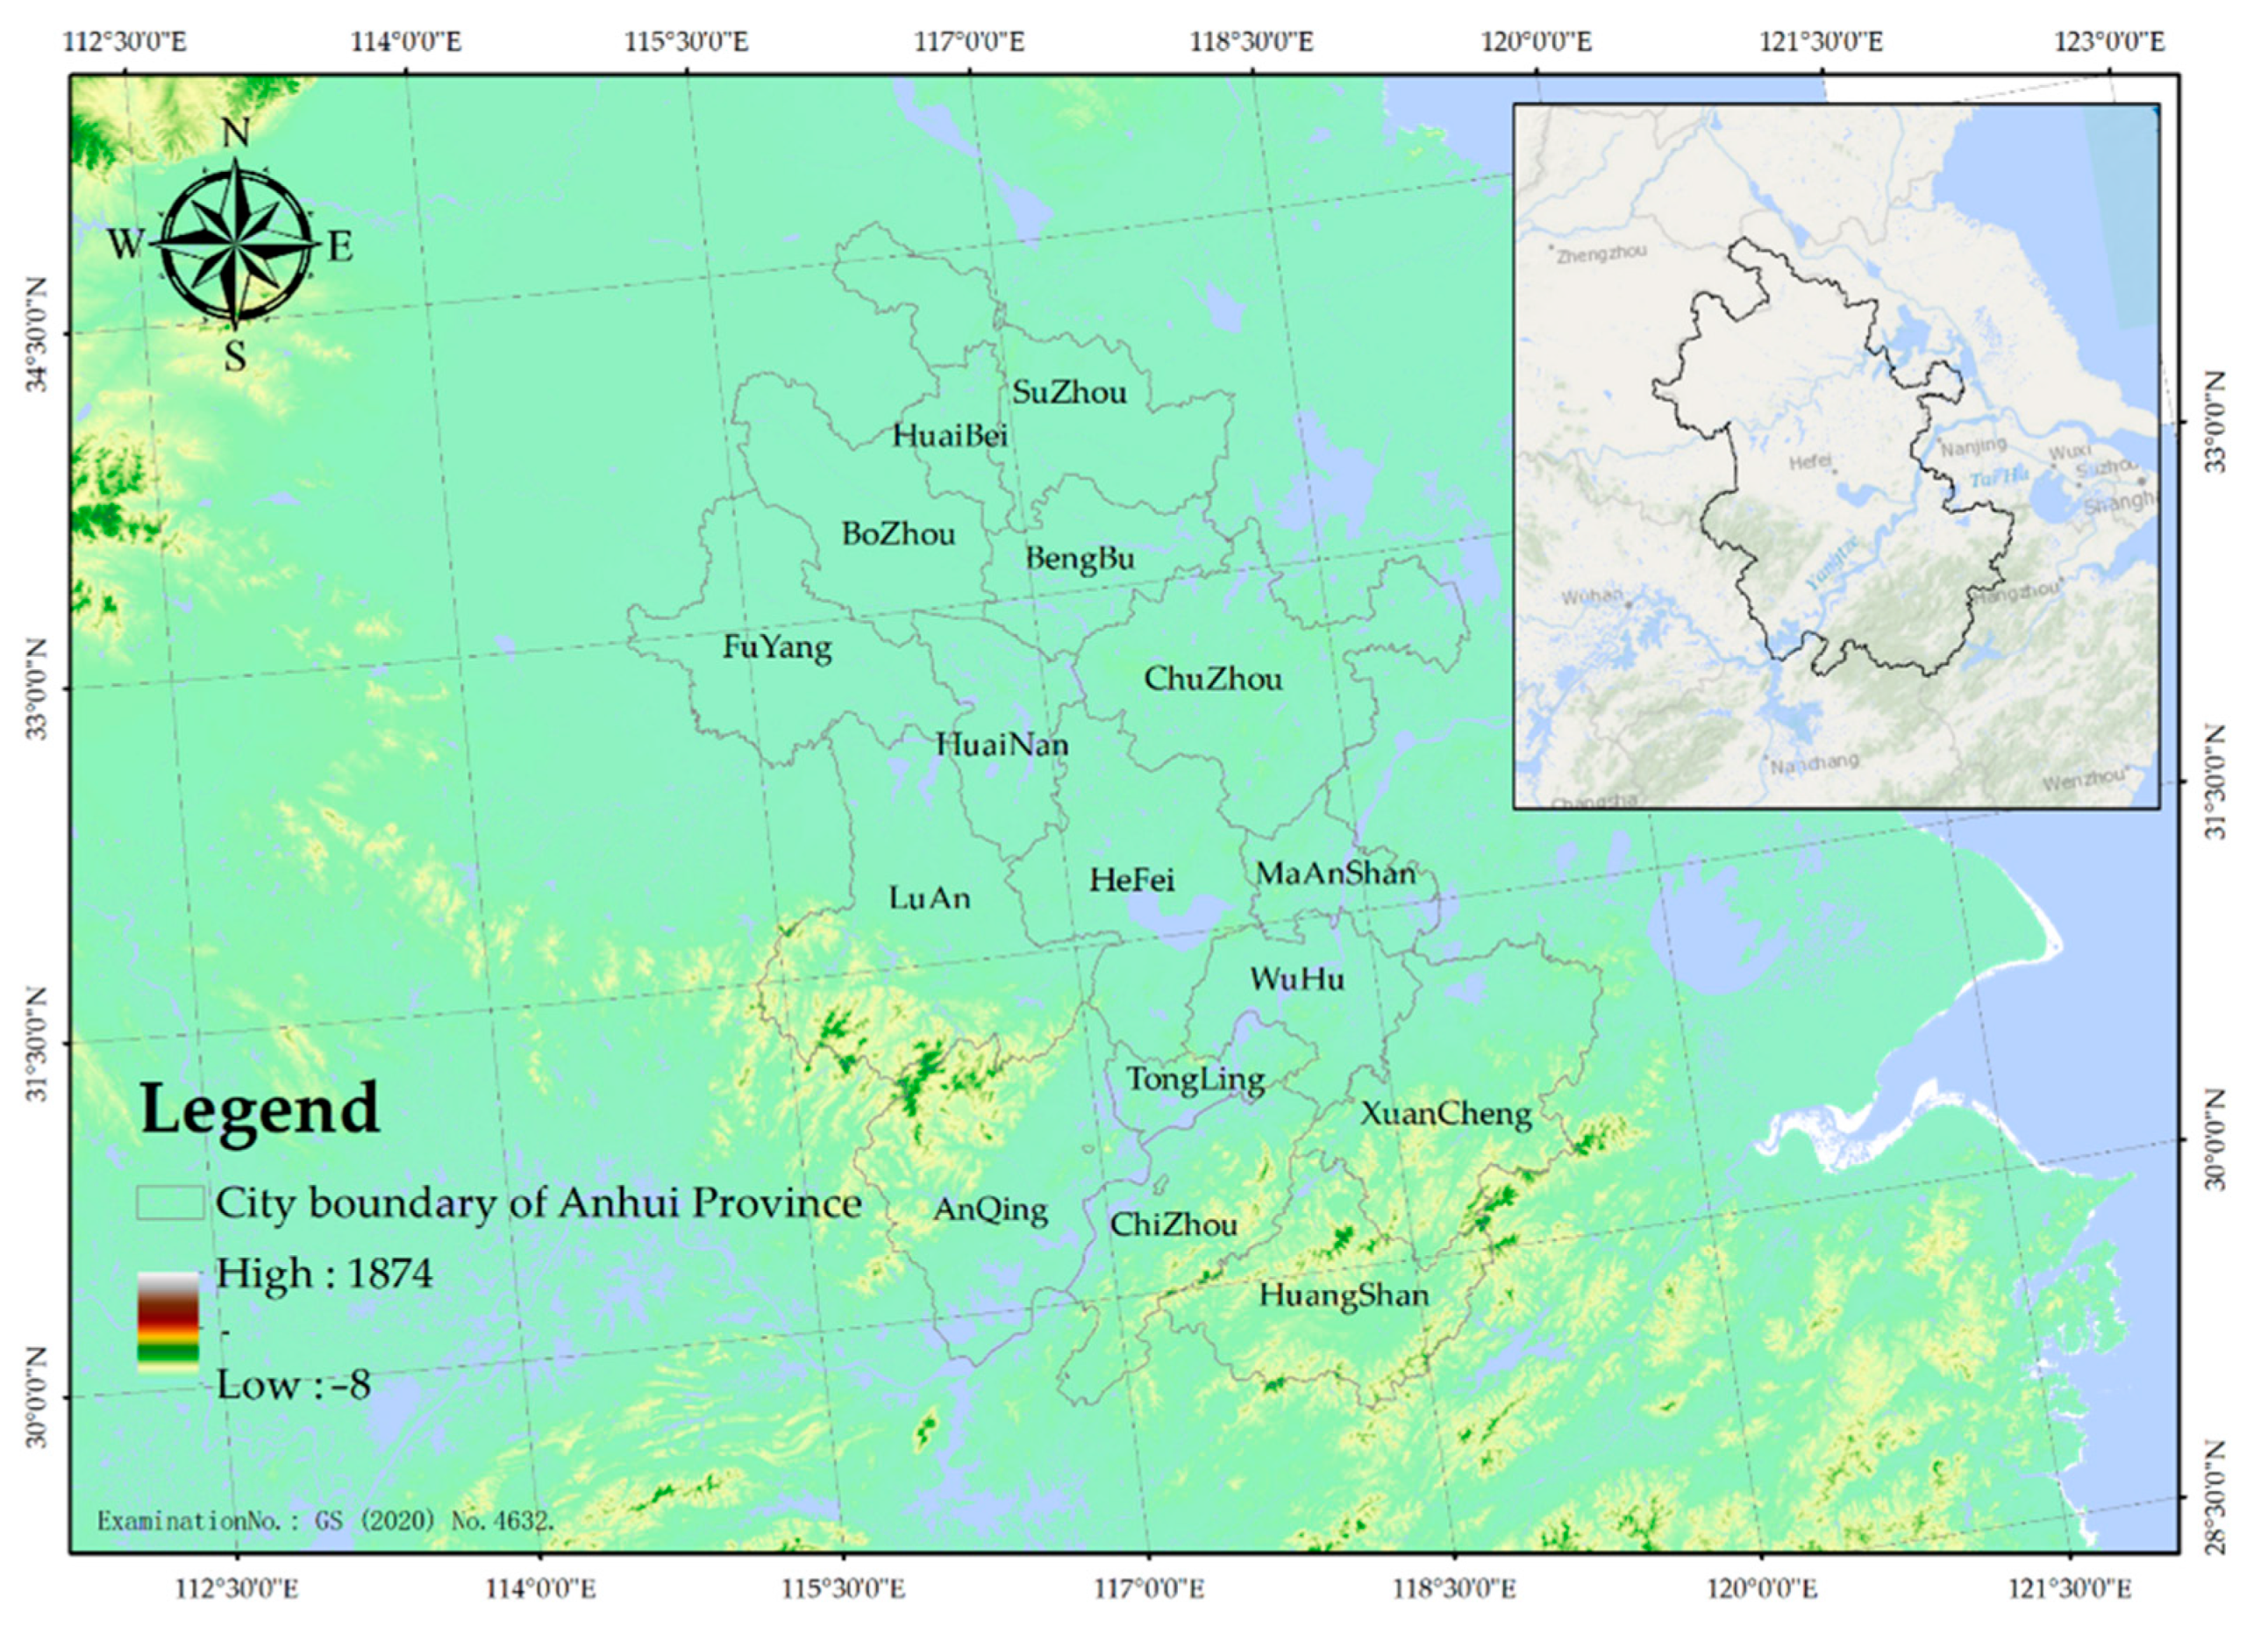
Anhui Province is located in the central region of China, and has the 12th largest economy in China as of 2020. The province is located between 114°54′ and 119°37′ E longitude and between 29°41′ and 34°38′ N latitude, with a total area of 140,100,000 km2 and a population of about 61 million (Figure 1). The Yangtze and Huai rivers cross the province from west to east. Traditionally, Anhui province is divided into northern, central, and southern Anhui, with northern Anhui referring to the area north of the Huai River, including the six cities of ShuZhou, HuaiBei, BengBu, FuYang, HuaiNan, and BoZhou. Central Anhui refers to the area north of the Yangtze River and south of the Huai River, including the four cities of HeFei, LuAn, ChuChou and AnQing. South Anhui refers to the area south of the Yangtze River, including HuangShan, WuHu, MaAnShan, TongLing, XuanCheng, and ChiZhou. To the north of the Huai River, the terrain is vast and open, and is part of the Great North China Plain. The central region is between the rivers, with mountainous hills; the banks of the Yangtze River and the area around ChaoHu Lake are low and flat, part of the middle and lower reaches of the Yangtze River Plain; and the south is dominated by mountains and hills. Anhui is located in the transition area between the warm temperate zone and the subtropical zone. North of the Huai River has a warm-temperate semi-humid monsoon climate, while south of the Huai River has a subtropical humid monsoon climate, compatible from north to south. In China, ecological red line delineation is an important means of maintaining regional ecological security. In Anhui Province this ecological red line includes biodiversity, water conservation, soil conservation, and carbon fixation as the main ecosystem service functions.
2.2. Data Sources
Land use data for the study area were acquired from Landsat 8 OLI remote sensing imagery for July-August 2020, which were downloaded from the United States Geological Survey website (https://earthexplorer.usgs.gov/, accessed on 8 July 2021). These data have a spatial resolution of 30 m and is based on the ENVI 5.2 platform, geometrically corrected and interpreted using a combination of maximum likelihood supervised classification and manual visual interpretation. The results of this land use interpretation were validated in the field using high resolution imagery, with an interpretation accuracy of 86.25%.
Meteorological data were obtained from the China Meteorological Science Data Sharing Service (http://data.cma.cn, accessed on 10 October 2021). Evapotranspiration data were obtained from the National Ecosystem Observation and Research Network Science and Technology Resource Service. Ecosystem type datasets were obtained from the results of the National Ecological Condition Remote Sensing Survey and Assessment. Basic data such as administrative boundaries of the study area were obtained from the Resource and Environment Science and Data Centre of the Chinese Academy of Sciences (https://www.resdc.cn/, access on 20 July 2021). The Digital Elevation Model (DEM) was obtained from the Geospatial Data Cloud website (http://www.gscloud.cn/, accessed on 20 July 2021) with a raster size of 90 m. Soil data were obtained from the Chinese Soil Dataset (v1.1) at the Cold and Dry Zone Science Data Centre (http://data.casnw.net/portal/, accessed on 5 May 2021). The Normalized Difference Vegetation Index (NDVI) data was obtained from the National Aeronautics and Space Administration NASA (https://ladsweb.modaps.eosdis.nasa.gov/search/, accessed on 20 July 2021), with a spatial resolution of 250 m. Socio-economic data were obtained from the Statistical Bulletin of National Economic and Social Development of Anhui Province 2020.
All data were interpolated to a uniform size of 100 m and the coordinates were unified as WGS_1984_UTM_Zone_50N to facilitate spatial operations and to ensure the accuracy of the calculation results.
2.3. Research Methodology
2.3.1. Research Framework
This study focuses on the construction of an ecosystem security pattern, a specific measure to achieve ecological security, and the construction of a system of indicators to address the goal of the security of terrestrial organisms and societal livelihood and production.
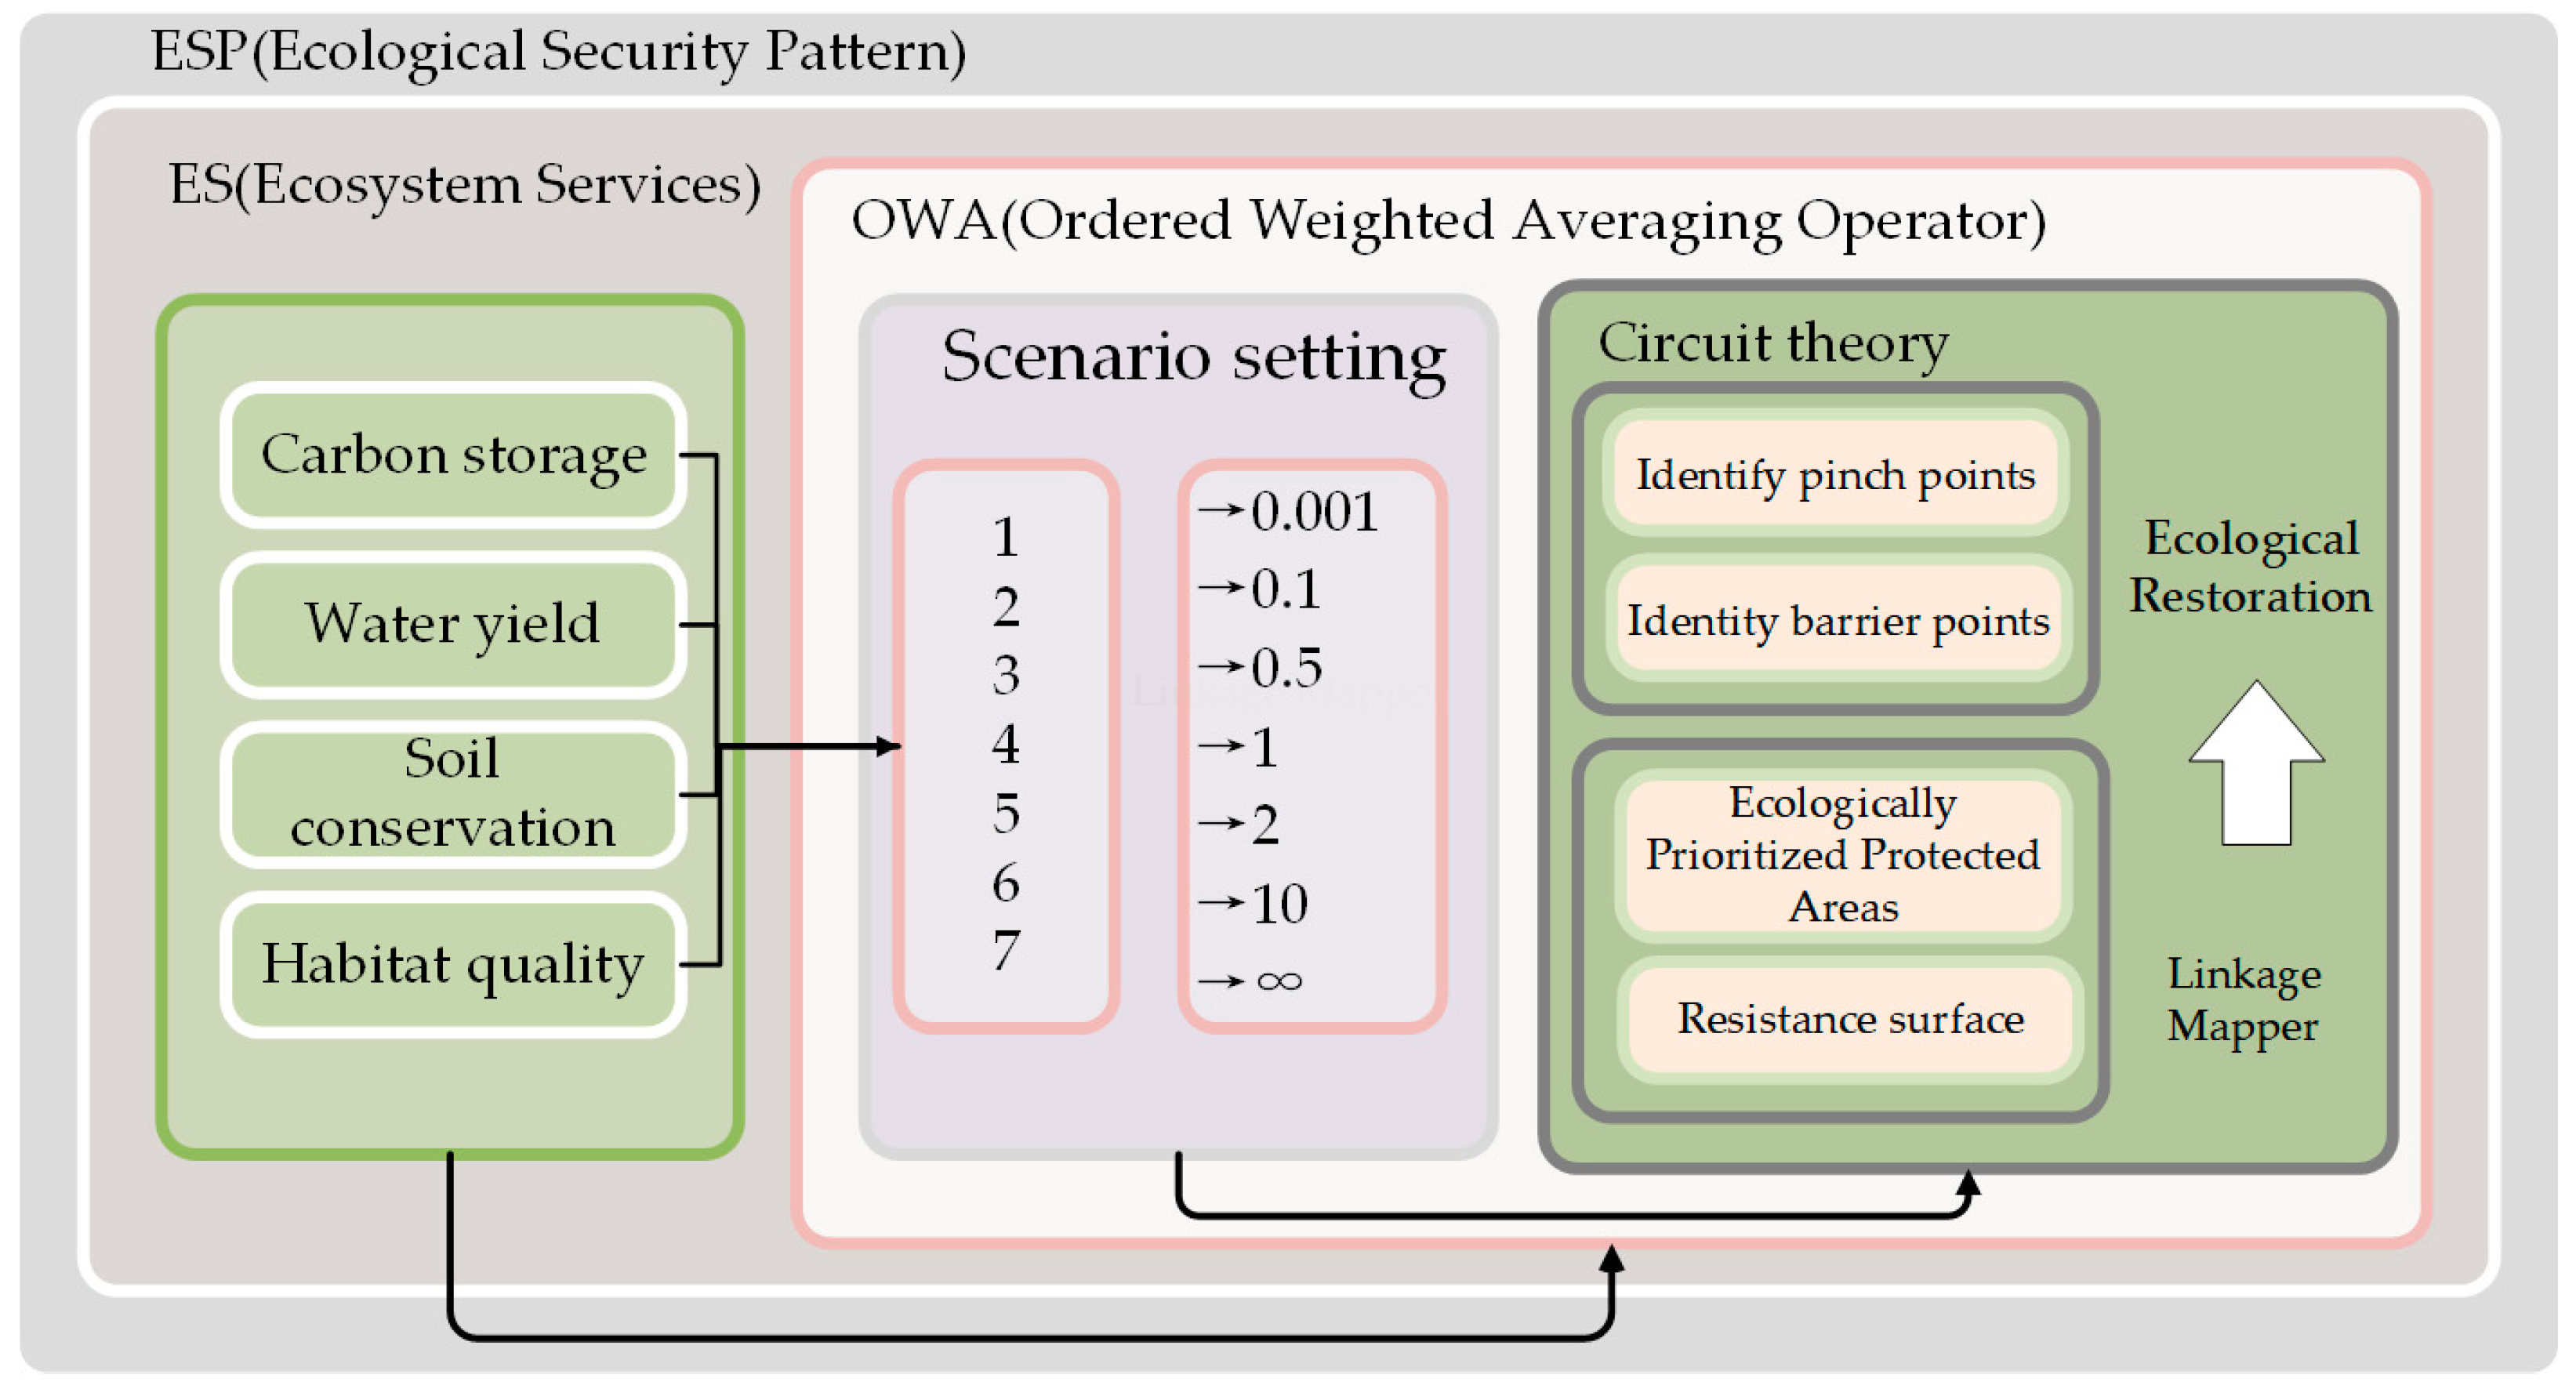
The main ecosystem services in the study area are selected and the trade-offs and synergies between the ecosystem services are calculated. The multi-criteria decision tool (IDRISI 17.0) [32] was used to identify the integrated ecosystem services raster with the highest conservation efficiency and trade-offs by calculating the criteria weights and order weights. The ecological corridors in the study area were identified based on the ecosystem services raster using the least-cost path. Circuit theory was used to identify ecological corridors using the least-cost pathway based on the integrated ecosystem services raster [31]. The migration corridor space was simulated using circuit theory to identify pinch points and barriers in the migration corridors of species to safeguard regional ecological security and enhance ecosystem service functions. The framework of our approach is shown in Figure 2.
2.3.2. Evaluation of Ecosystem Service Functions
Four types of ecosystems were selected as the screening indicators for this study’s ecological reserve: habitat quality, soil retention, water retention, and carbon fixation.
In the InVEST model, habitat quality reflects the diversity of species in the study area and the ability of the ecosystem to provide living conditions for individuals, populations, and communities, and soil retention indicates the ability of the ecosystem to prevent erosion and control soil erosion, as well as the ability to store and maintain sediment. In our approach, water retention refers to the amount of water produced on the surface of a certain area, reflecting the ability of the ecosystem to maintain water, and carbon fixation reflects the ability of the regional ecosystem to regulate climate and improve regional air quality.
- (1)
- Habitat Quality
The InVEST model is a model used to assess the function of ecosystem services. Its habitat quality evaluation module can calculate the threat intensity of a source by considering the radius of stress, spatial weights and spatial attenuation types, based on the link between land cover and habitat threat sources combined with the habitat adaptation of other land types and sensitivity to the threat source to obtain the habitat quality of the area [3]. This is calculated by:
where: represents the habitat quality index of raster in landscape type ; the value range of is [0, 1], representing the habitat suitability score of landscape type ; is the half-saturation constant, which is set according to the accuracy of the data, which is set to 50 in this study; and is a scale constant, which is generally taken as 2.5. This research is based on the InVEST model manual and related research which can be found in the Habitat Quality module parameter table [33].
- (2)
- Water conservation
Water conservation service refers to the amount of water produced on the surface within a certain area. The current assessment using the water yield module of the InVEST model is based on the Budyko water-heat coupled equilibrium assumption equation [33]:
where: is the annual water production of each grid cell in the basin (mm); is the actual annual evapotranspiration of grid cell (mm); is the annual precipitation of grid cell (mm).
- (3)
- Soil retention
The assessment of the soil retention function is based on the sediment retention module of the InVEST model, which is calculated mainly from the USLE (Universal Soil Loss Equation) [21]:
where is the soil retention amount (), determined by the difference between potential soil erosion and actual soil erosion ; is the rainfall erosion factor (this paper is limited by rainfall process data), values are estimated and verified according to different types of rainfall data; is the soil erodibility factor; and is the slope length slope factor; is the vegetation cover and management factor; and is the soil retention measure factor. In the model, and are fixed values used to reconcile the actual deviations in the calculation of soil retention, see Table 1 and [21].
- (4)
- Carbon Fixation
The scientific assessment of carbon sequestration services can provide a basis for decision making on regional carbon management for climate change mitigation and is important for the analysis of climate change [33,34]. The Global Production Efficiency Model (GLO-PEM)-Carbon Exchange in the Vegetation-Soil-Atmosphere Model (CEVSA) coupled model was used to estimate the net primary productivity of vegetation to reflect the regional carbon fixation capacity [35]:
where: represents the net primary productivity of vegetation (), is the total primary productivity () and is the autotrophic respiration of vegetation ().
2.3.3. Screening of Ecologically Prioritized Protected Areas
OWA is a multi-criteria decision model with superimposed combinations of control factor weights, first proposed by Yager [36], which has been shown to perform well in balancing the trade-offs between ecosystem services, thus facilitating decision makers to select the most appropriate scenario for their needs and expectations. Here, we set seven decision risk factors (α) t at 0.0001, 0.1, 0.5, 1, 2, 10, and 10,000 to obtain seven different risk factors for the lower ecological priority conservation area screening scenarios. The details of these calculations can be found in [37,38], and are expressed here as:
where is the order weight over the range (0, 1); is the decision risk factor over the range (0, ∞), indicating the decision risk perception of the decision maker based on the difference in indicator values and subjective weight differences; is the order weight calculated using the monotonic increasing rule; is the attribute value corresponding to an evaluation indicator at any geospatial location ; is the the criterion level weights and is the order weight.
The evaluation results were classified into three levels based on the quantile classification method, and the highest level of the evaluation layer was used as the priority protected area under different risk scenarios. The final priority protected area for ecosystem services was determined by calculating the conservation efficiency and trade-offs of the priority protected areas under each risk scenario, according to:
where is the conservation efficiency of the ith ecosystem service in the priority protected area; is the average value of the ith service in the ecological protected area; is the average value of the i ecosystem services in the whole study area. When , the conservation efficiency in the priority protected area is higher than that of the study area as a whole; conversely, when , the conservation efficiency in the priority protected area is lower than that of the study area as a whole.
2.3.4. Construction of Ecological Security Patterns in Anhui Province
- (1)
- Landscape resistance surface construction
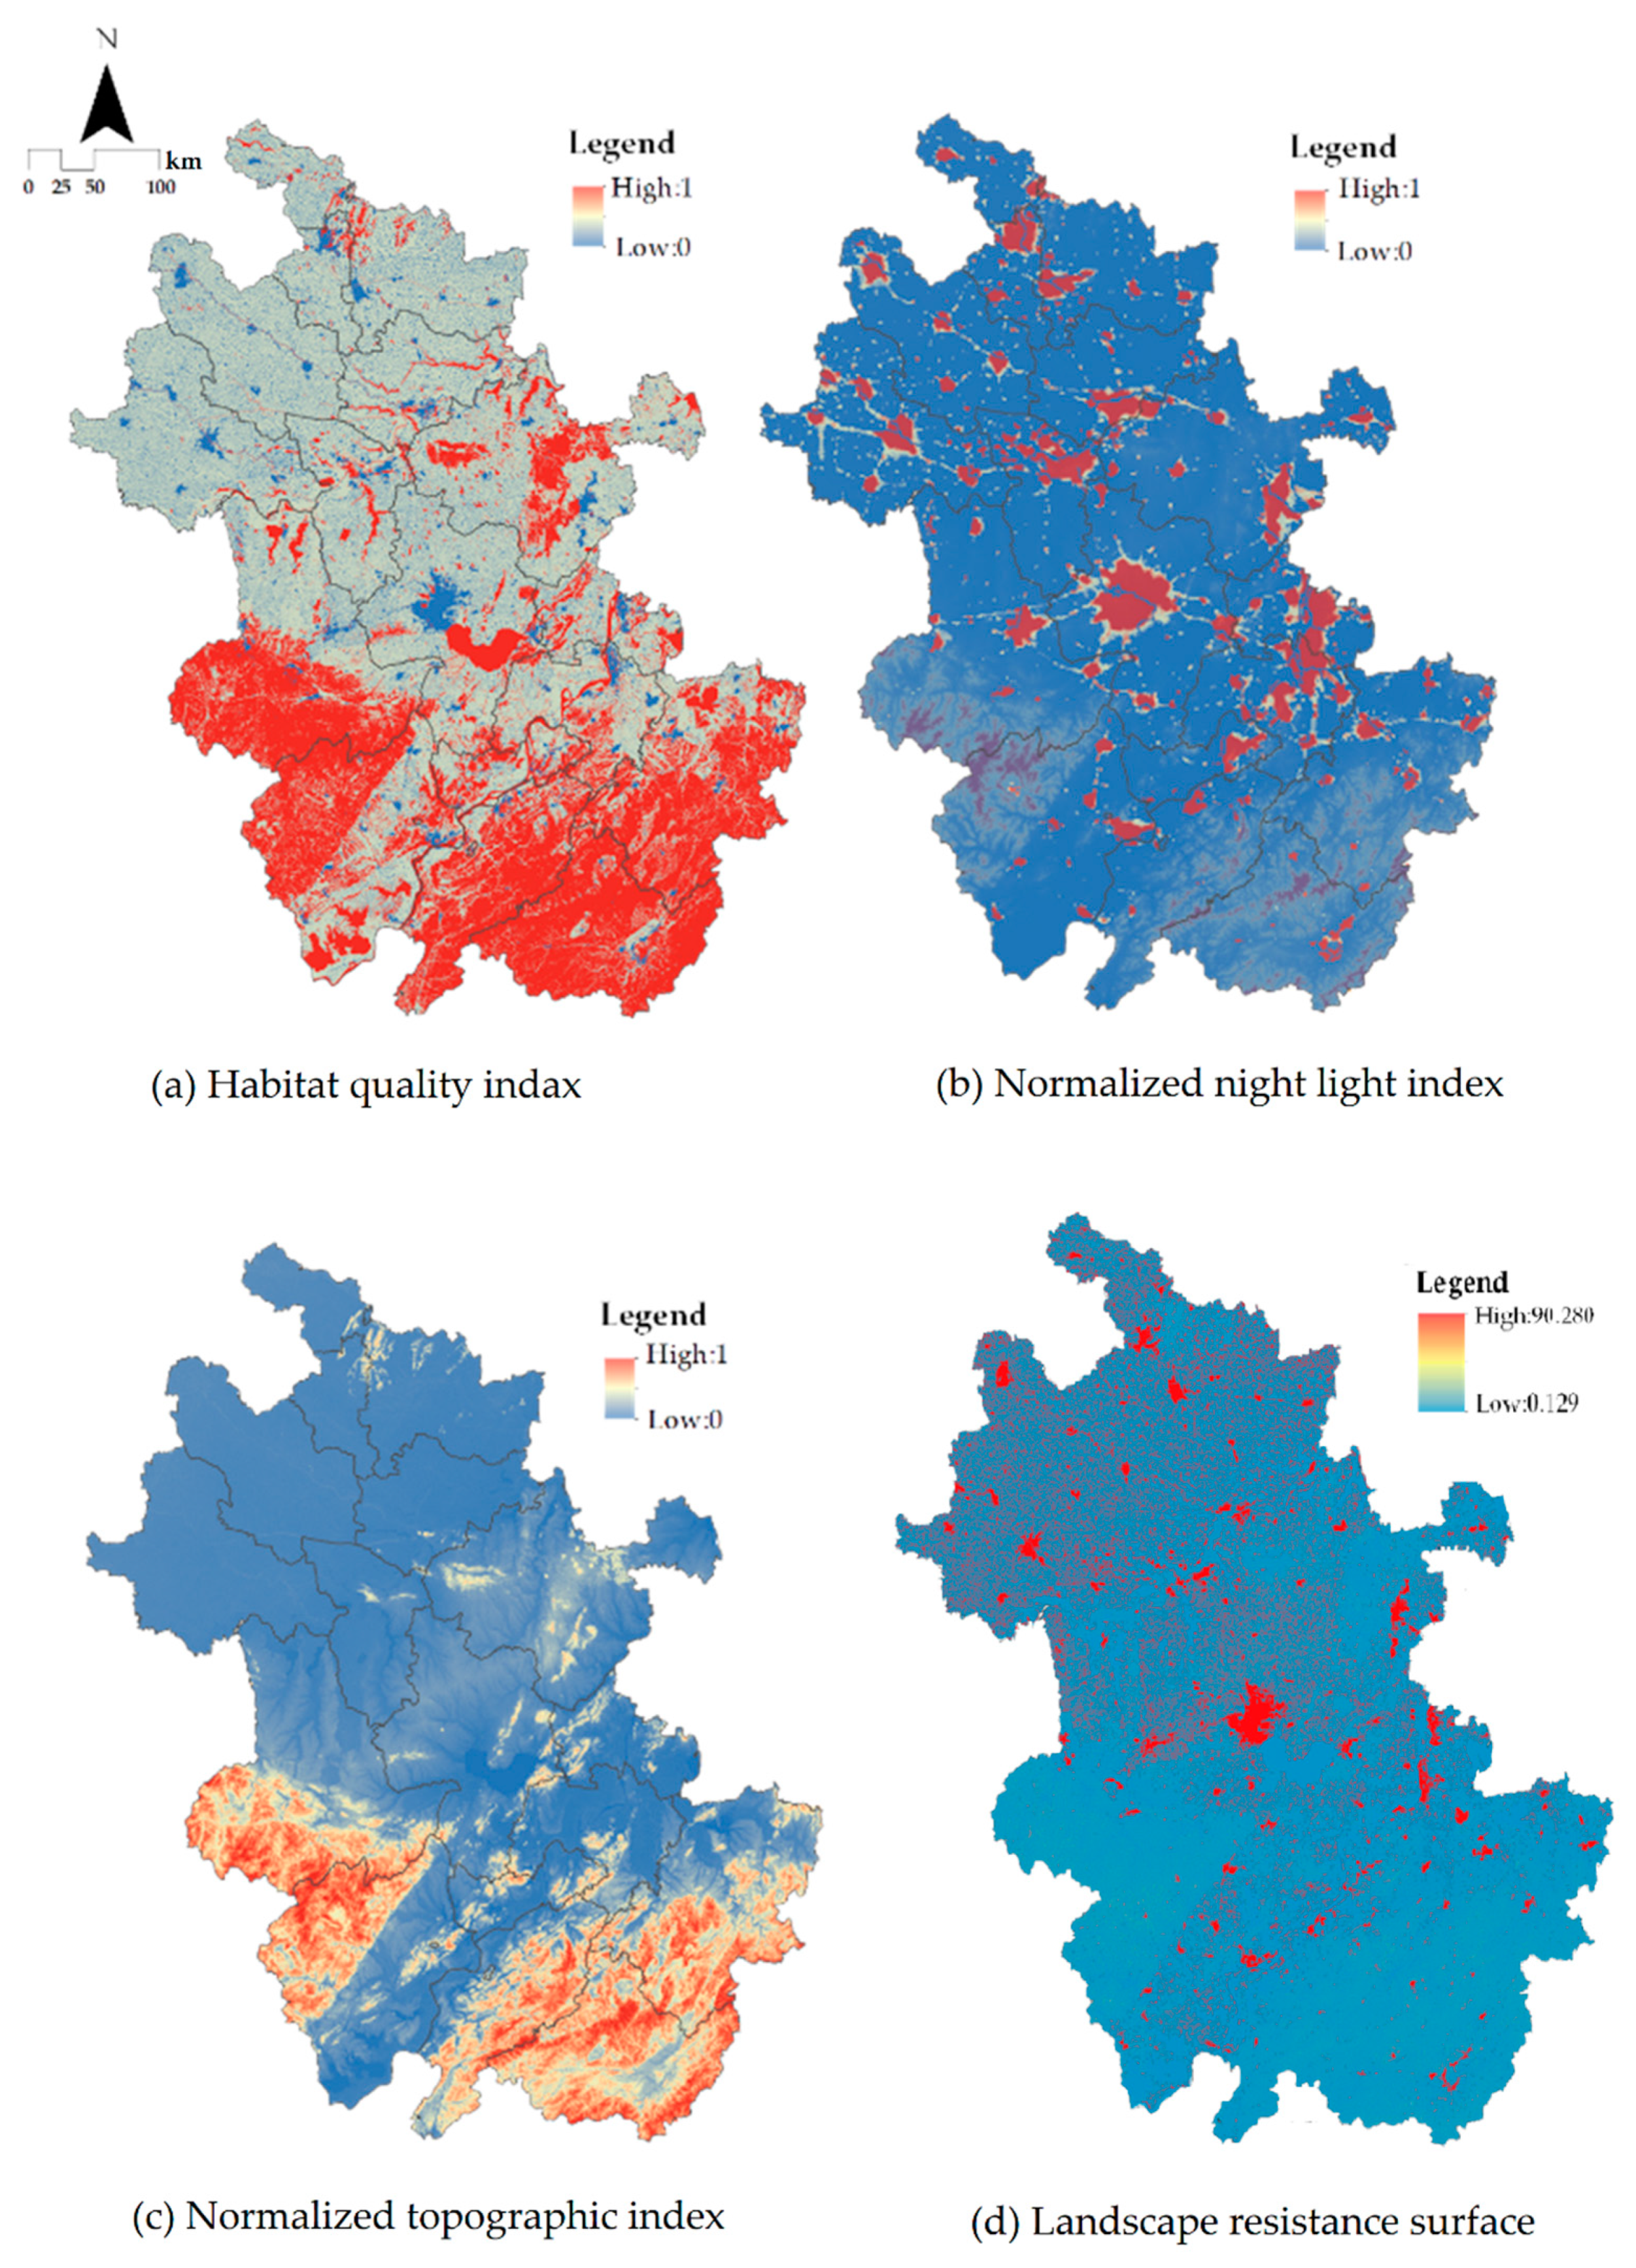
Landscape resistance surfaces are an important step in the calculation of regional ecological corridors and are used to reflect the degree of difficulty that species have in migrating between regions [7]. We use the inverse of habitat quality to construct the landscape resistance surface in Anhui Province, and the nighttime light data and topographic position index were used as factors to correct the landscape resistance surface. The nocturnal light data reflects human economic activities, and the terrain position index reflects the ability of species to move over natural barriers during migration. The data were processed to non-zero values that do not affect the actual resistance surface composition as follows:
where is the corrected resistance value for each raster in the study area, is the initial resistance value based on the inverse of the habitat quality, NTL is the nighttime light index, TL is the topographic position index, E and represent the elevation value of any raster and the average elevation value of the study area, respectively, and S and represent the slope value of any raster and the average slope value of the study area, respectively.
- (2)
- Ecological security pattern construction
The effective construction and maintenance of regional ecological safety patterns can contribute to the integrity of ecosystem structure and function, the conservation of biodiversity and the maintenance of ecosystem services, and can also lead to an enhancement of societal well-being, the achievement of sustainable development, and, ultimately, the safeguarding of regional ecological safety.
Circuit theory has been demonstrated to simulate the spatial movement of organisms, identify ecological corridors, and identify pinch points and barriers which have a significant impact on regional ecological security patterns [39,40]. The circuit theory-based Linkage Mapper 2.0.0 (https://linkagemapper.org/, accessed on 20 July 2021) and Circuitscape 4.05 (https://circuitscape.org/about/, accessed on 20 July 2021) software are based on circuit theory and model the connectivity of different landscapes. This model uses the statistical properties of electrical charges to link circuit theory to the ecology of movement. The software integrates the LCP (last-cost path) method for the construction of ecological corridors. The ‘pinch point mapper’ and ‘barrier mapper’ modules are used to identify the pinch point and barrier point, respectively. The pinch point identifies areas important for the connectivity of the study area by obtaining the current flow between the source sites. The barrier points represent important barriers to species translocation. Restoration of these areas will enhance regional ecological stability and facilitate species migration.
The identification of important ecological source sites is useful for researchers or policy makers to assess the scientific validity of relevant ecological policies, and the importance of ecological source sites in maintaining the overall connectivity of the region can be quantified by using Circuitscape’s Centrality Mapper tool to calculate centrality, which quantifies the contribution of ecological source sites. Here, we construct a landscape resistance surface based on land use data, nighttime light index (NTL), and topographic relief (TL), and construct regional ecological corridors using circuit theory to identify key areas affecting regional ecological stability, and finally construct a regional ecological safety pattern.
3. Results
3.1. Spatial Distribution Patterns of Ecosystems
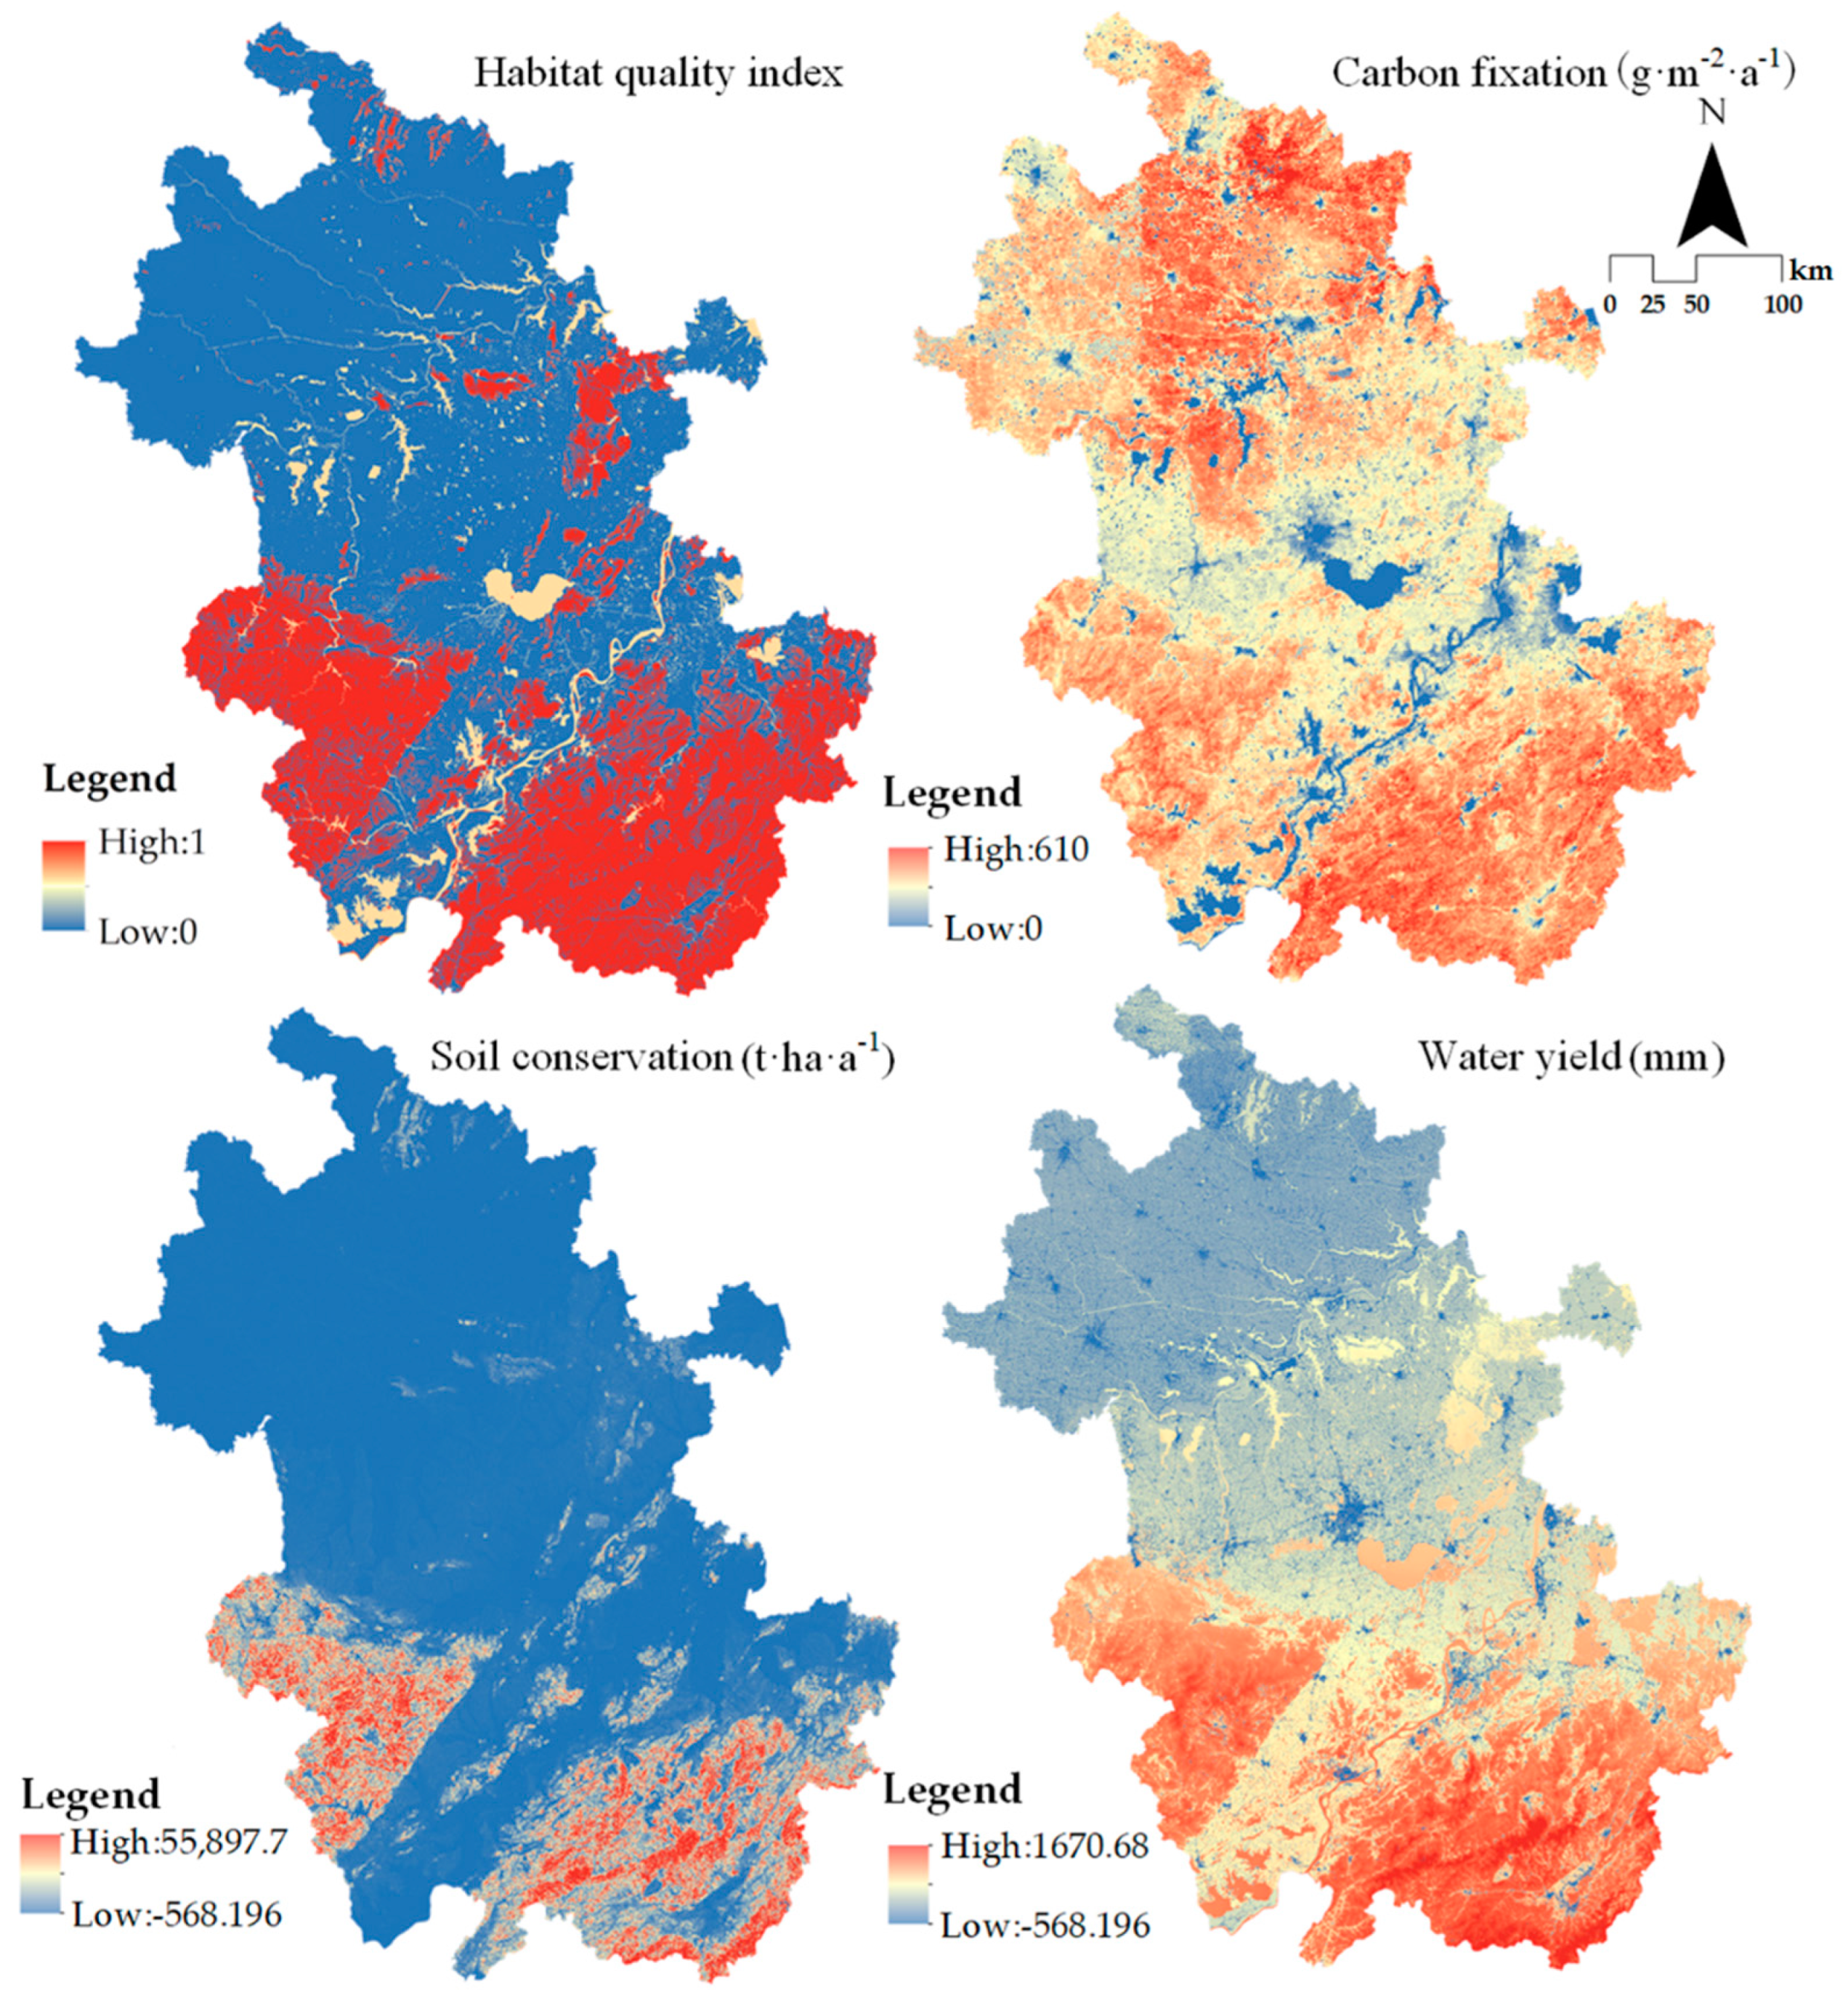
The spatial pattern of ecosystem services in the study area is shown in Figure 3. The four types of ecosystems have similar spatial distribution patterns, with an overall spatial divergence of “high in the southwest and low in the northeast”, which is closely related to the regional geographical context. The average habitat quality index in the study area is 0.487 and the average carbon fixation value is 338.58 . The overall distribution pattern is mainly related to land use types, with high values for forest and grassland and low values for construction land and unused land. The difference in soil retention function in the study area is more obvious, with a maximum value of 55,897.7 and a mean value of 717.67 . The average value of water content is 247.40 mm, which is significantly influenced by climatic conditions and tends to decrease from south to north. This is related to the fact that Anhui Province is located in a region where the temperate semi-humid monsoon climate interacts with the sub-humid monsoon climate.
3.2. Trade-Offs and Synergies between Ecosystem Services
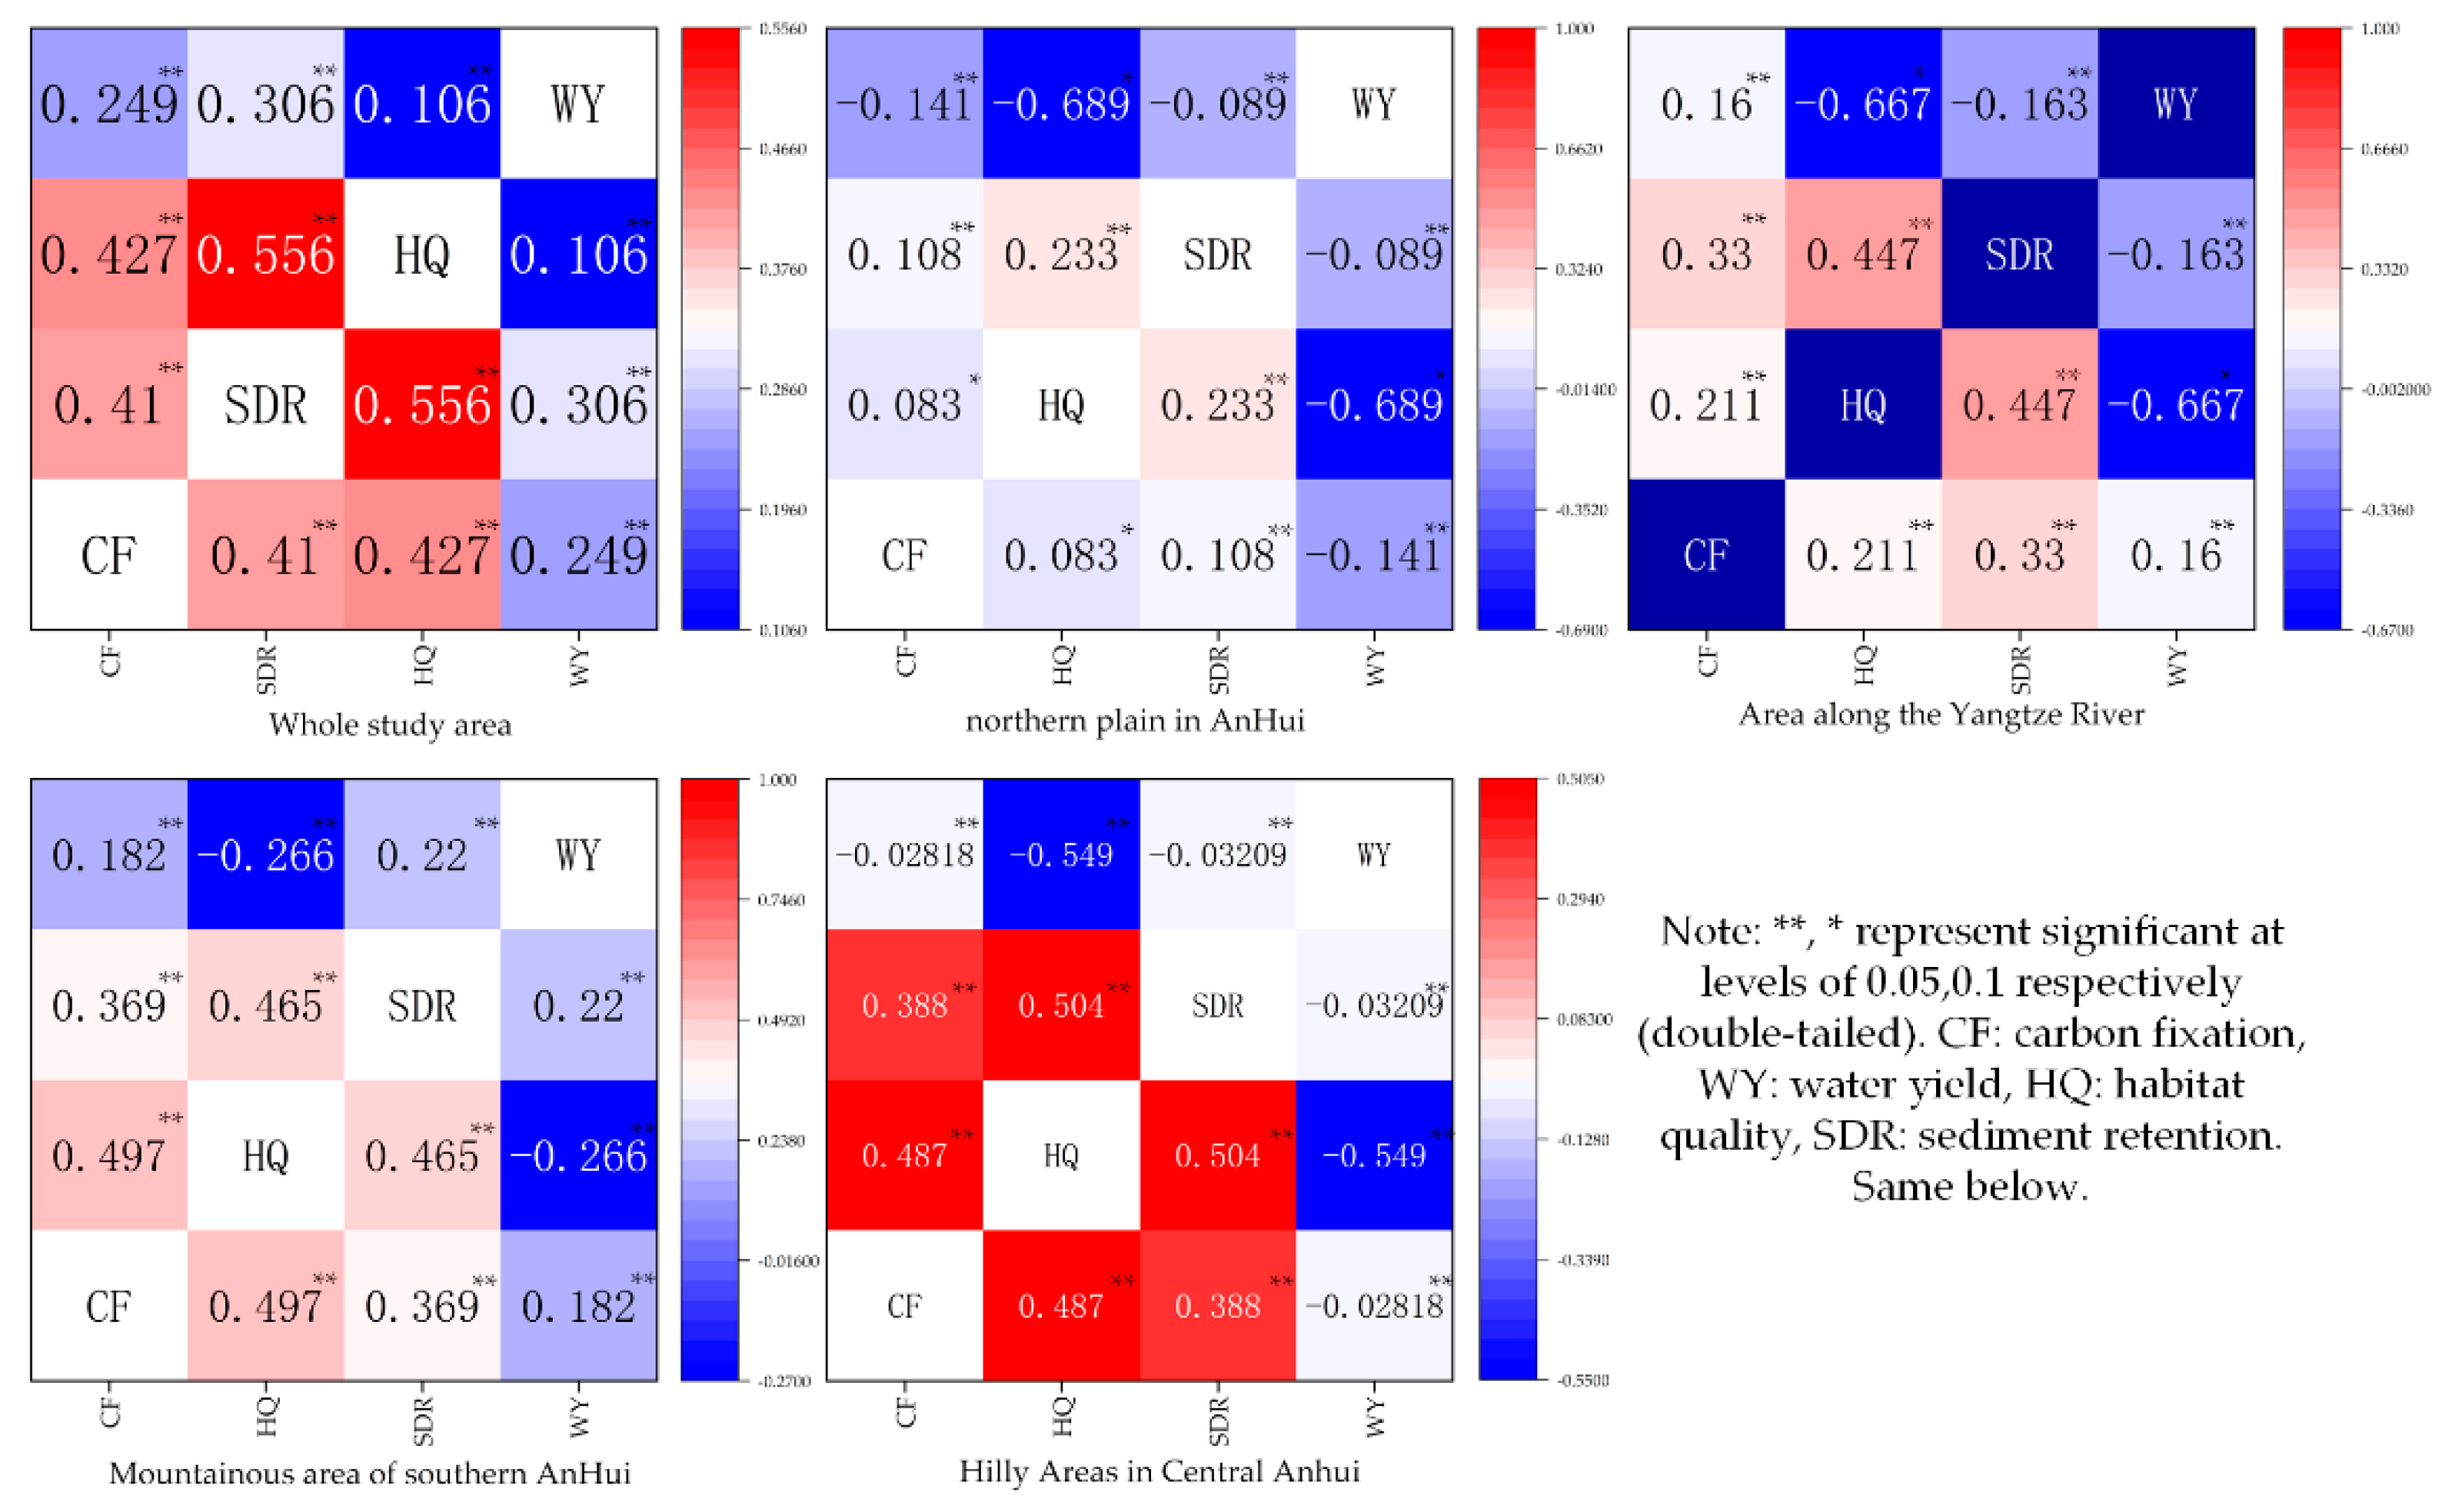
20,000 attribute points in the study area were randomly selected and the normalized values of the four ecosystem services were extracted to the attribute table by ArcGIS tools [41]. Pearson’s correlation analysis was used to investigate the synergy and trade-offs between the four ecosystem services at multiple scales, including the whole of Anhui province, the plain area in northern Anhui, the hilly area in central Anhui, the mountainous area in southern Anhui, and the Anhui section of the Yangtze River basin (Figure 4).
These results show that the four types of ecosystem services were synergistic at the provincial scale, with a high synergistic relationship between HQ and SDR (0.556). The synergistic relationship between HQ and WY (0.106) was weaker than that between other ecological synergistic services. There is a high trade-off between HQ and WY in the northern Anhui Plain, with a correlation coefficient of −0.689, a relatively weak trade-off between SDR and WY (−0.089), and synergistic relationships between WY and CF (−0.141) and HQ and CF (0.083). There is a high trade-off between HQ and WY (−0.667), a relatively weak trade-off between SDR and WY (−0.163), and a synergistic relationship between the rest of the ecosystem services in the region around the Yangtze River Basin. It is noteworthy that in the central Anhui Hills region, there are trade-offs between WY and SDR (−0.03209), HQ and CF (0.487), and the trade-offs between HQ and WY (−0.549) are relatively strong in different regions.
3.3. Identification of Ecological Reserves under Multi-Criteria Decision Evaluation
We now take the synergies and trade-offs between ecosystem services to select suitable ecological reserves to maintain regional ecological security to the maximum extent possible. The bit-order weights for each scenario were obtained by setting seven different levels of risk coefficients based on the ecosystem services in Anhui Province in 2020 (Table 1).
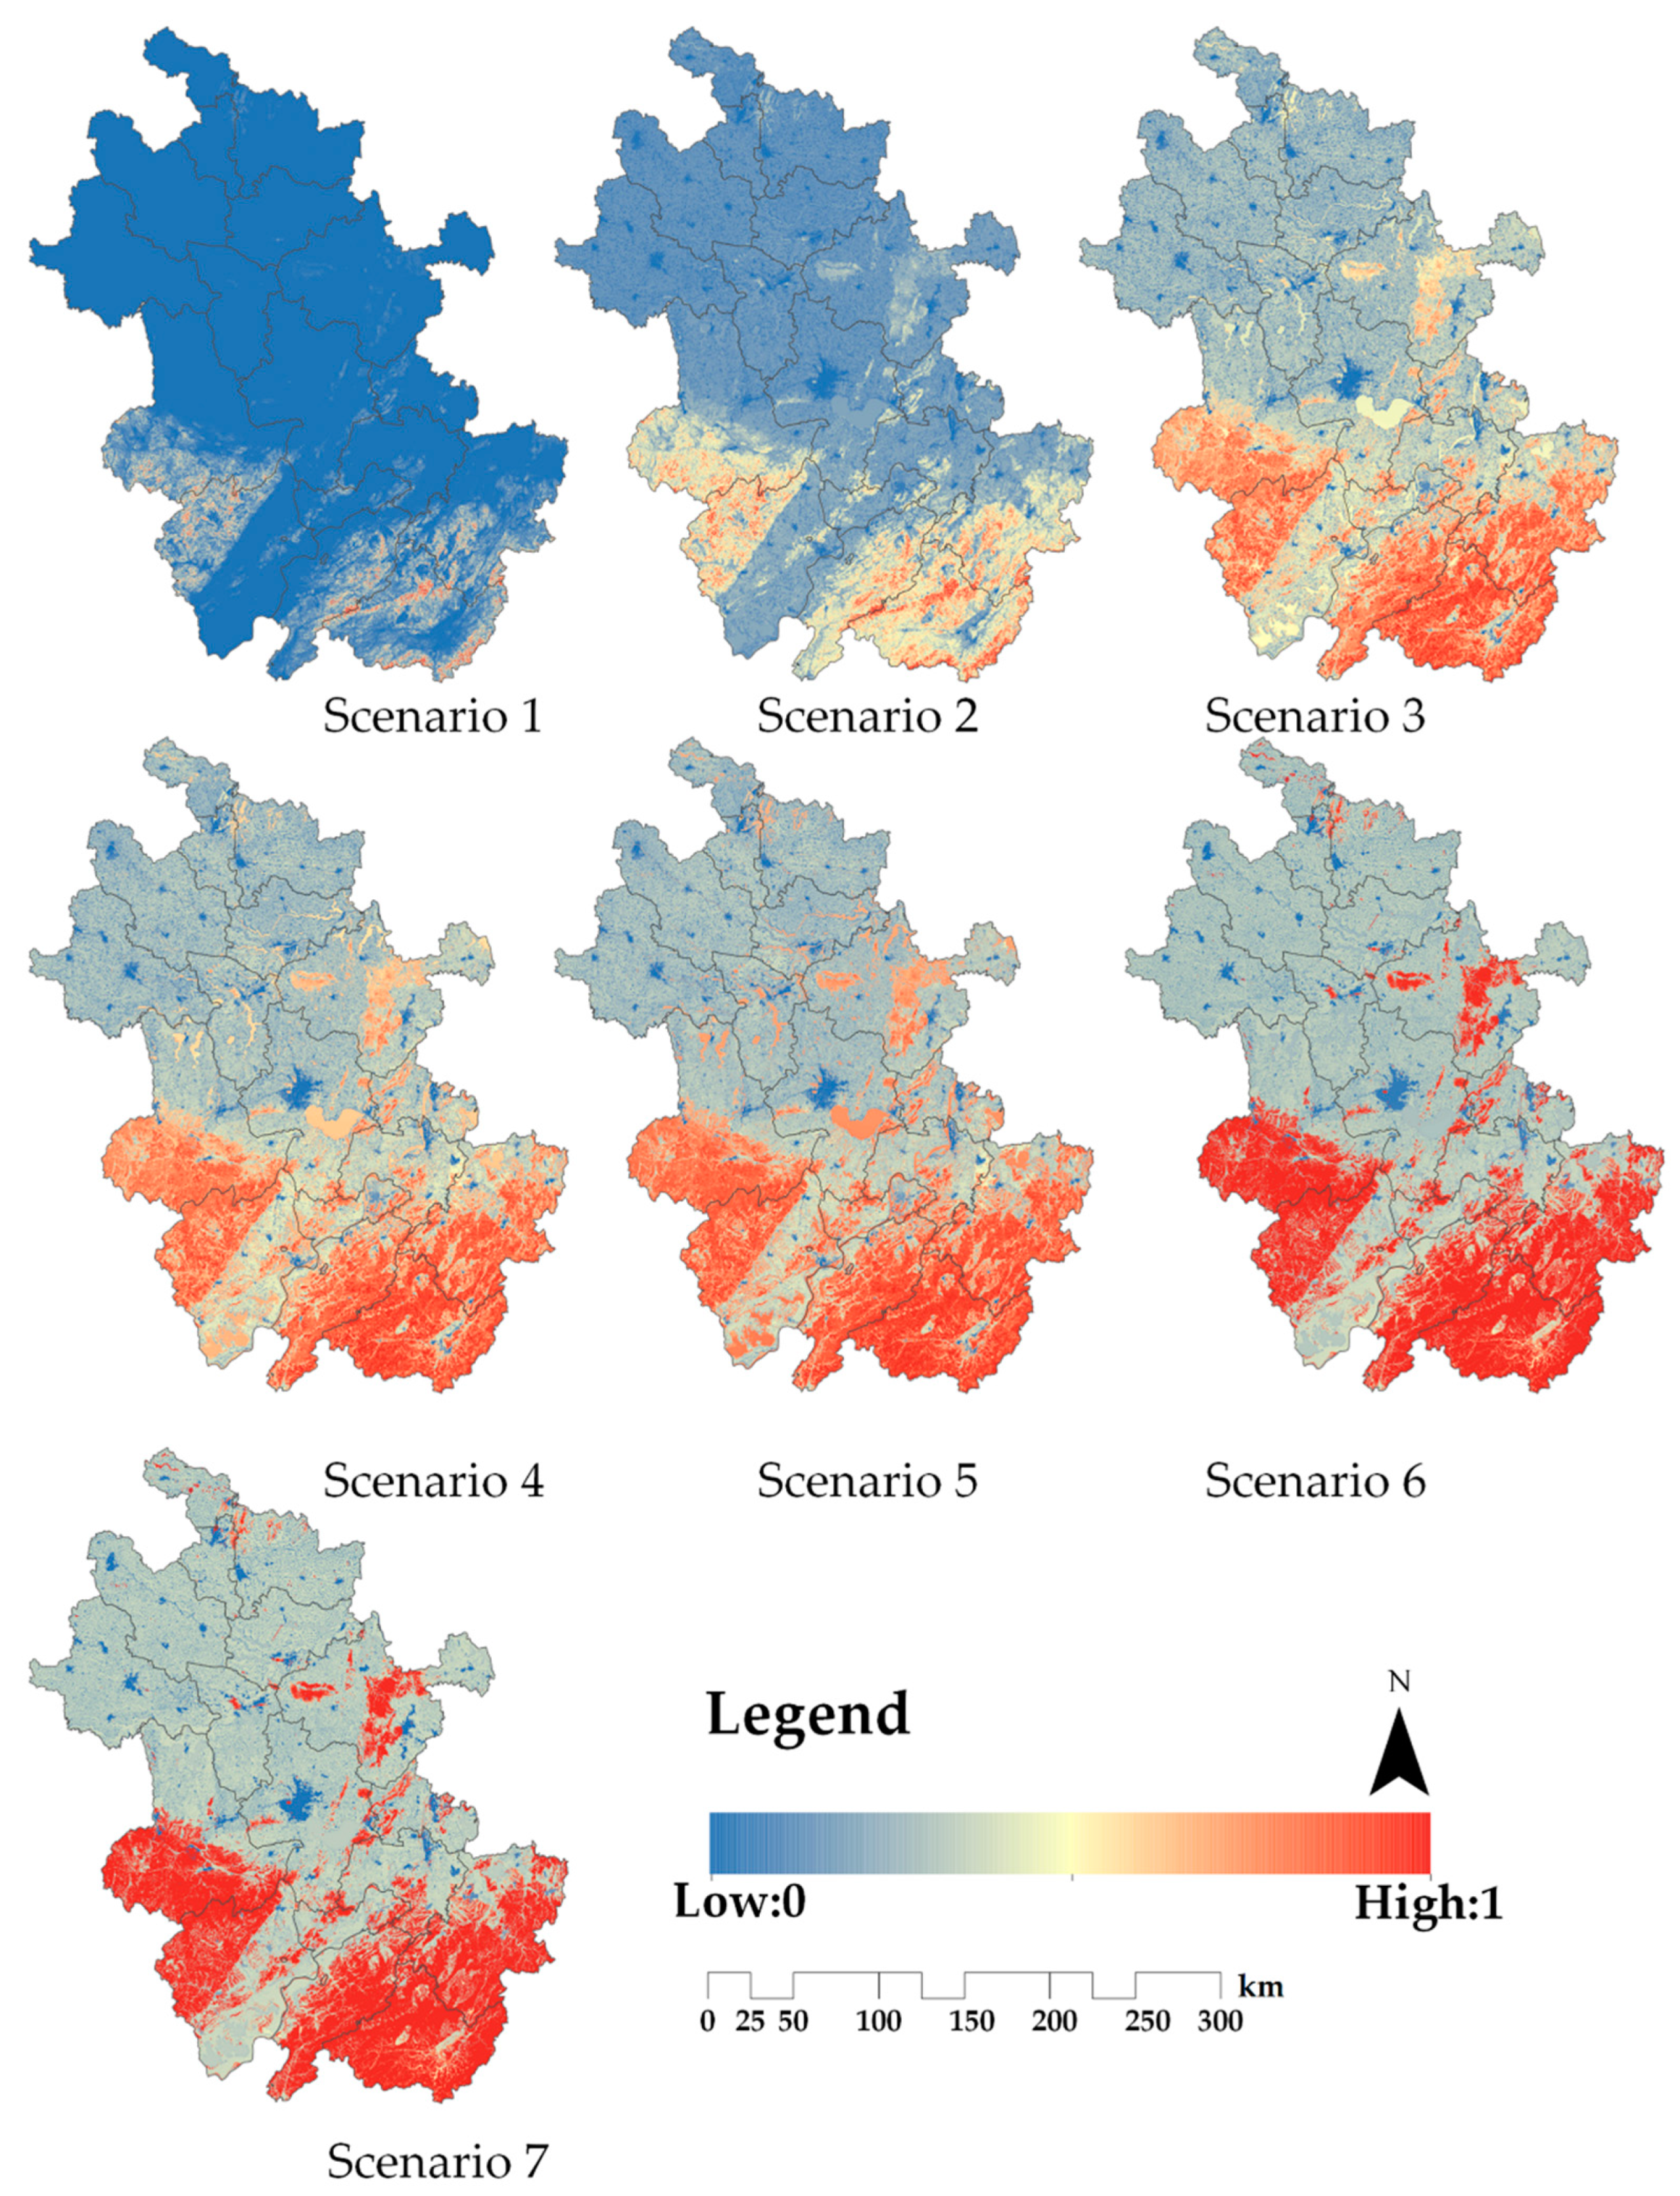
Model operations were performed using the MCE (multi-criteria evaluation) module of the IDRISI platform based on the ordered weight operator in Table 1 to obtain the integrated ecosystem service raster layers under different risk scenarios (Figure 5). This was carried out to maximize the selection of suitable ecological reserves and maintaining regional ecological security under the presence of synergies and trade-offs in ecosystem services.
The order weights are calculated for a risk factor of 0.0001 to reflect the situation when α approaches a zero limit. In this case, the order weight of is 1, and the decision maker will get the most optimistic evaluation result, but also the highest risk. The order weights of the other three ecosystem services are 0 (i.e., the ecological reserve is selected only considering the carbon fixation function, and the spatial pattern of integrated ecosystem services is obtained as shown in Figure 5). As the risk factor gradually increases, the order weights of the four ecosystem services gradually change, resulting in seven scenarios.
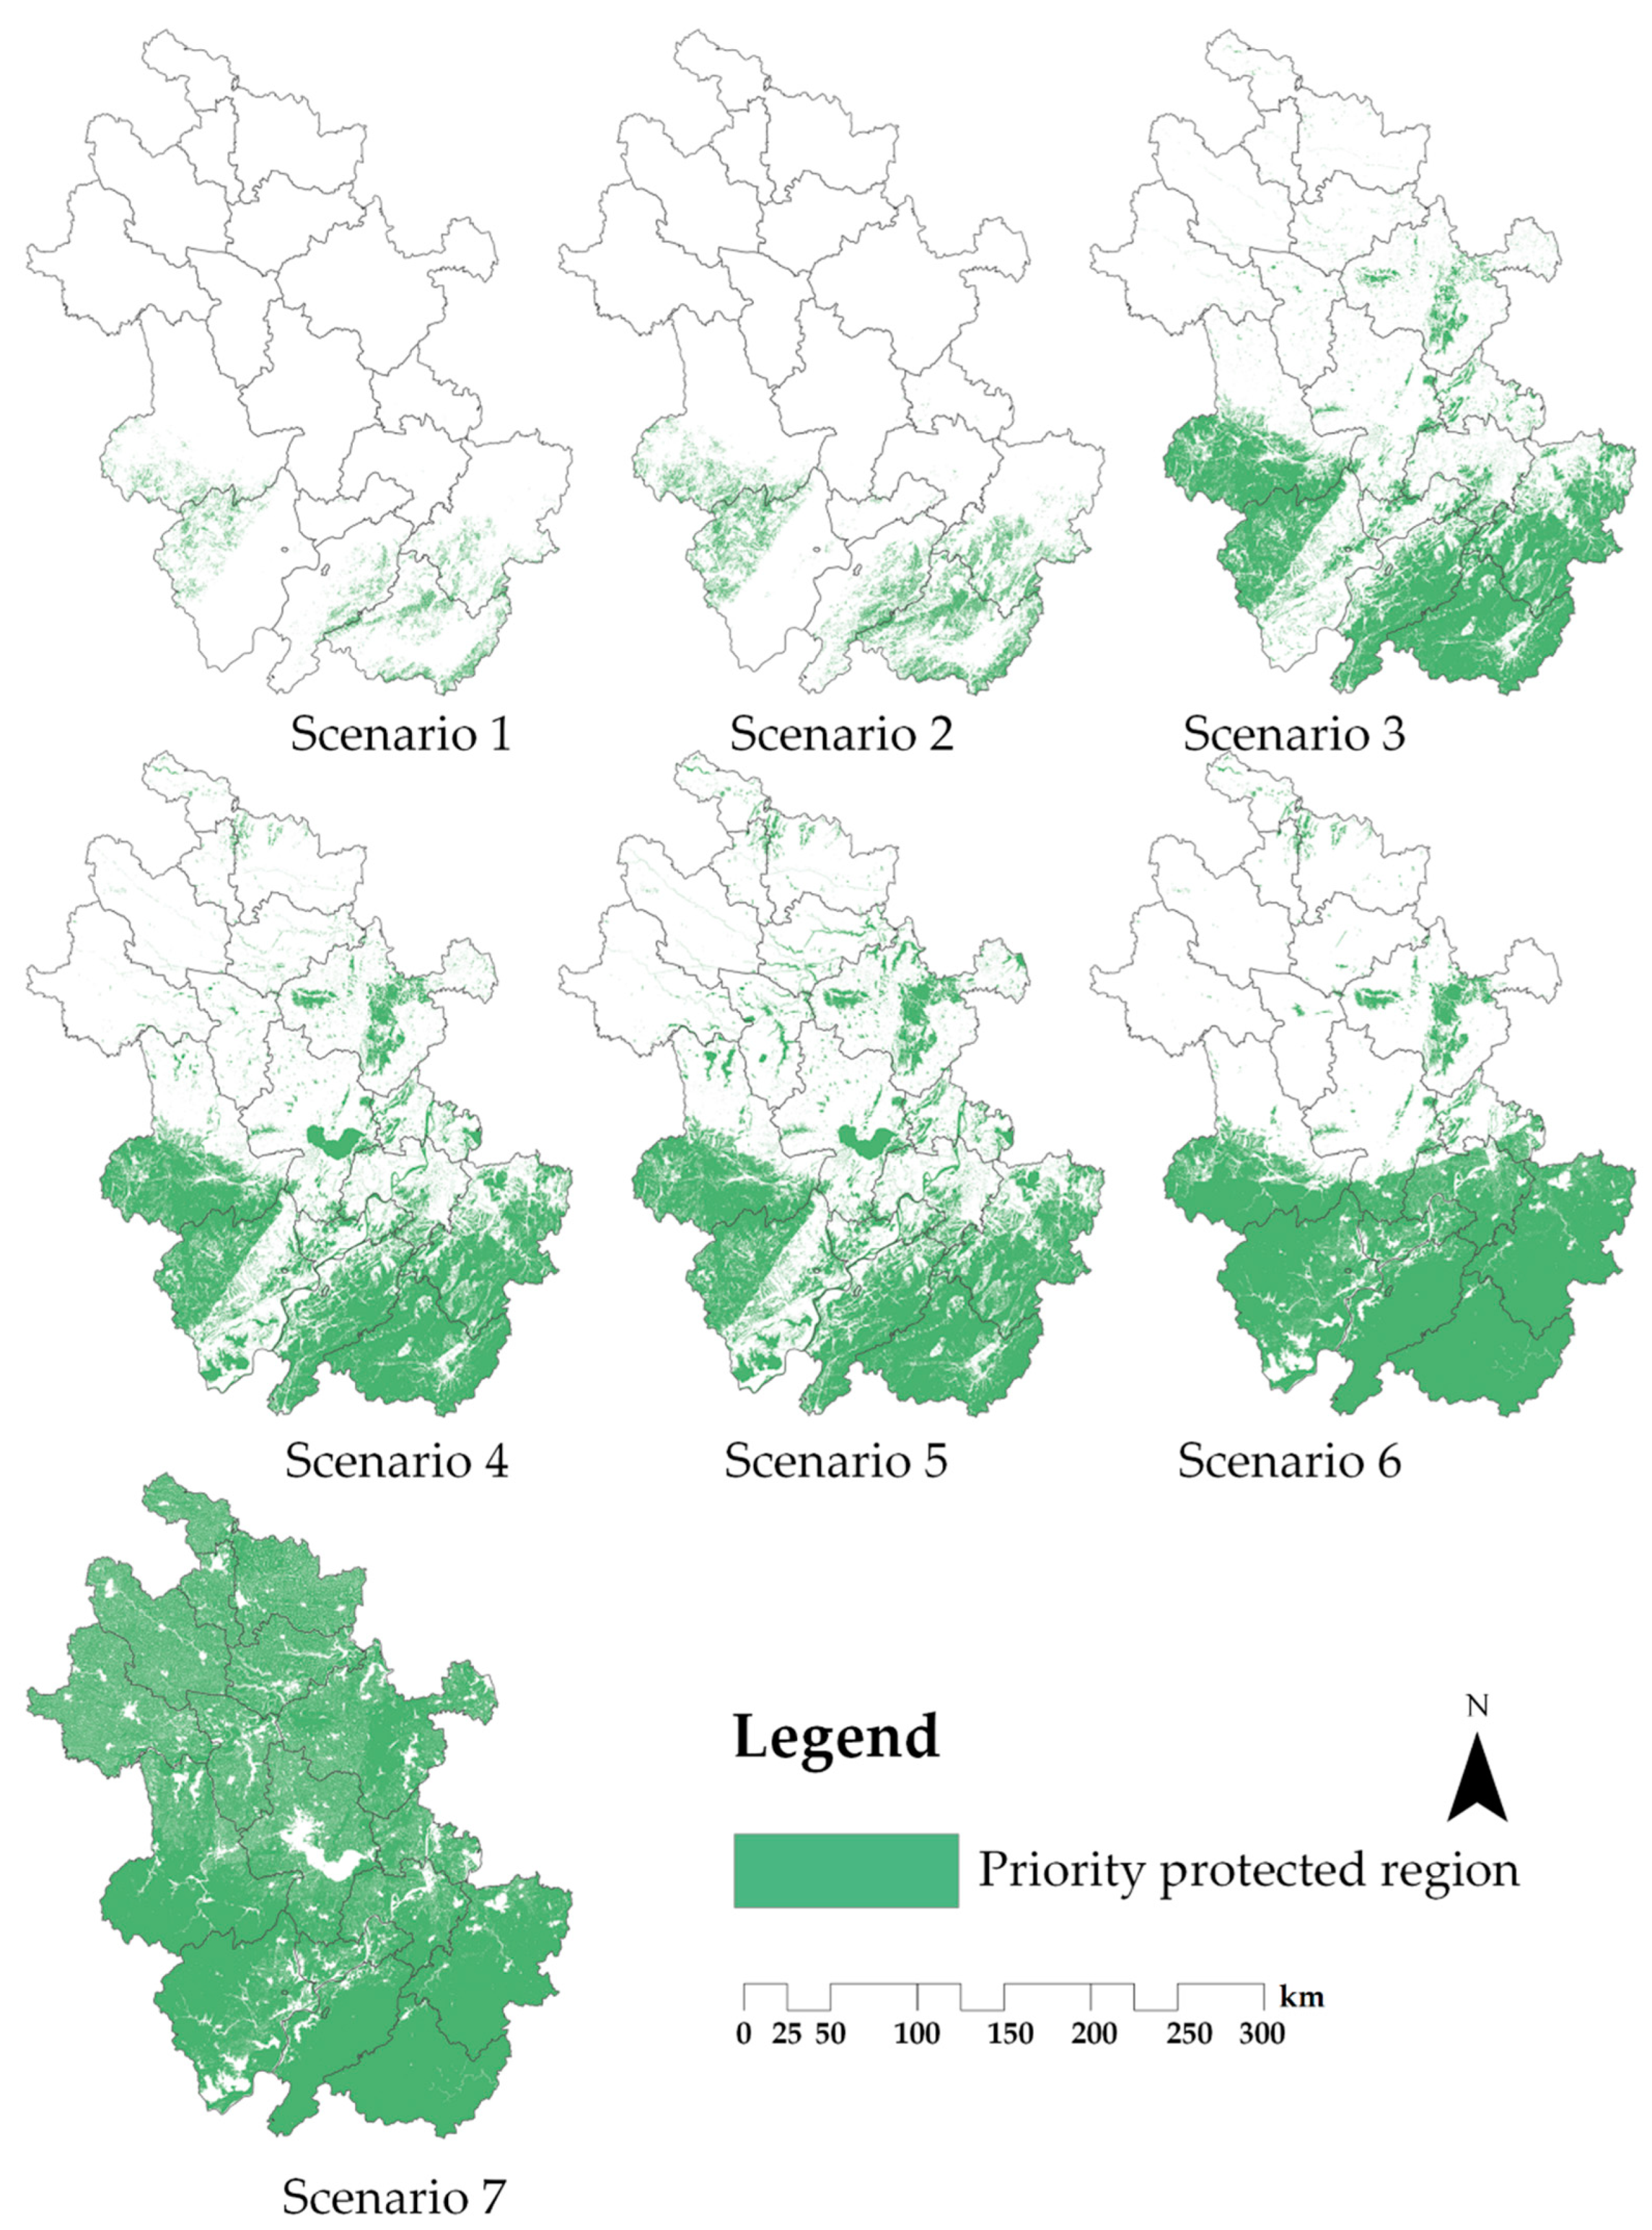
The evolution from Scenario 1 to Scenario 7 can be regarded as the evolution from a better state to an extremely poor state. The evaluation results were classified into three levels by the quantile classification method, and the highest level of evaluation results was used as the priority conservation area under different risk scenarios (Figure 6).
For the screening of ecological reserves, it is important to consider both the functions provided by the ecological source sites themselves and the human demand for ecosystem services. We find here that synergies and trade-offs between ecosystem services exist in the study area, so protection efficiency and trade-offs were calculated for priority protected areas under each risk scenario (Table 2 and Table 3). The higher protection efficiency and trade-off scenarios were selected to ensure the highest synergies and lowest trade-offs between ecosystem services for the re-occurrence scenarios.
Scenarios 1, 4, and 7 represent three classical scenarios. Scenarios 1 and 7 represent a decision maker who is only concerned with one ecosystem service, while Scenario 4 reflects a completely neutral decision-making objective, where the decision maker considers all ecosystem services to be equally important (this is an ideal scenario). Scenario 5 was found to have the highest overall conservation efficiency and trade-offs, so Scenario 5 was used as the basis for screening ecological reserves. Scenario 5 ecological reserves are mainly located in the eastern part of Anhui and the southern part of the Yangtze River, two areas with more woodland and grassland distribution and excellent ecological environment, while the ecological source areas in the northern Anhui Plain have a greater disadvantage in terms of quantity and quality compared to the first two areas.
Using ArcGIS software to perform raster transfer and aggregation operations, we selected protected areas greater than 5 km2 as ecological source sites in the study area, and obtained 121 ecological source sites. The average patch area of ecological source sites in the study area is 357.21 km2, and the largest patch area is 22,072.11 km2. Most ecological source sites are located in the area south of the Yangtze River, followed by the hilly area in central Anhui, while the number and scale of ecological source sites in the northern Anhui Plain are quite small.
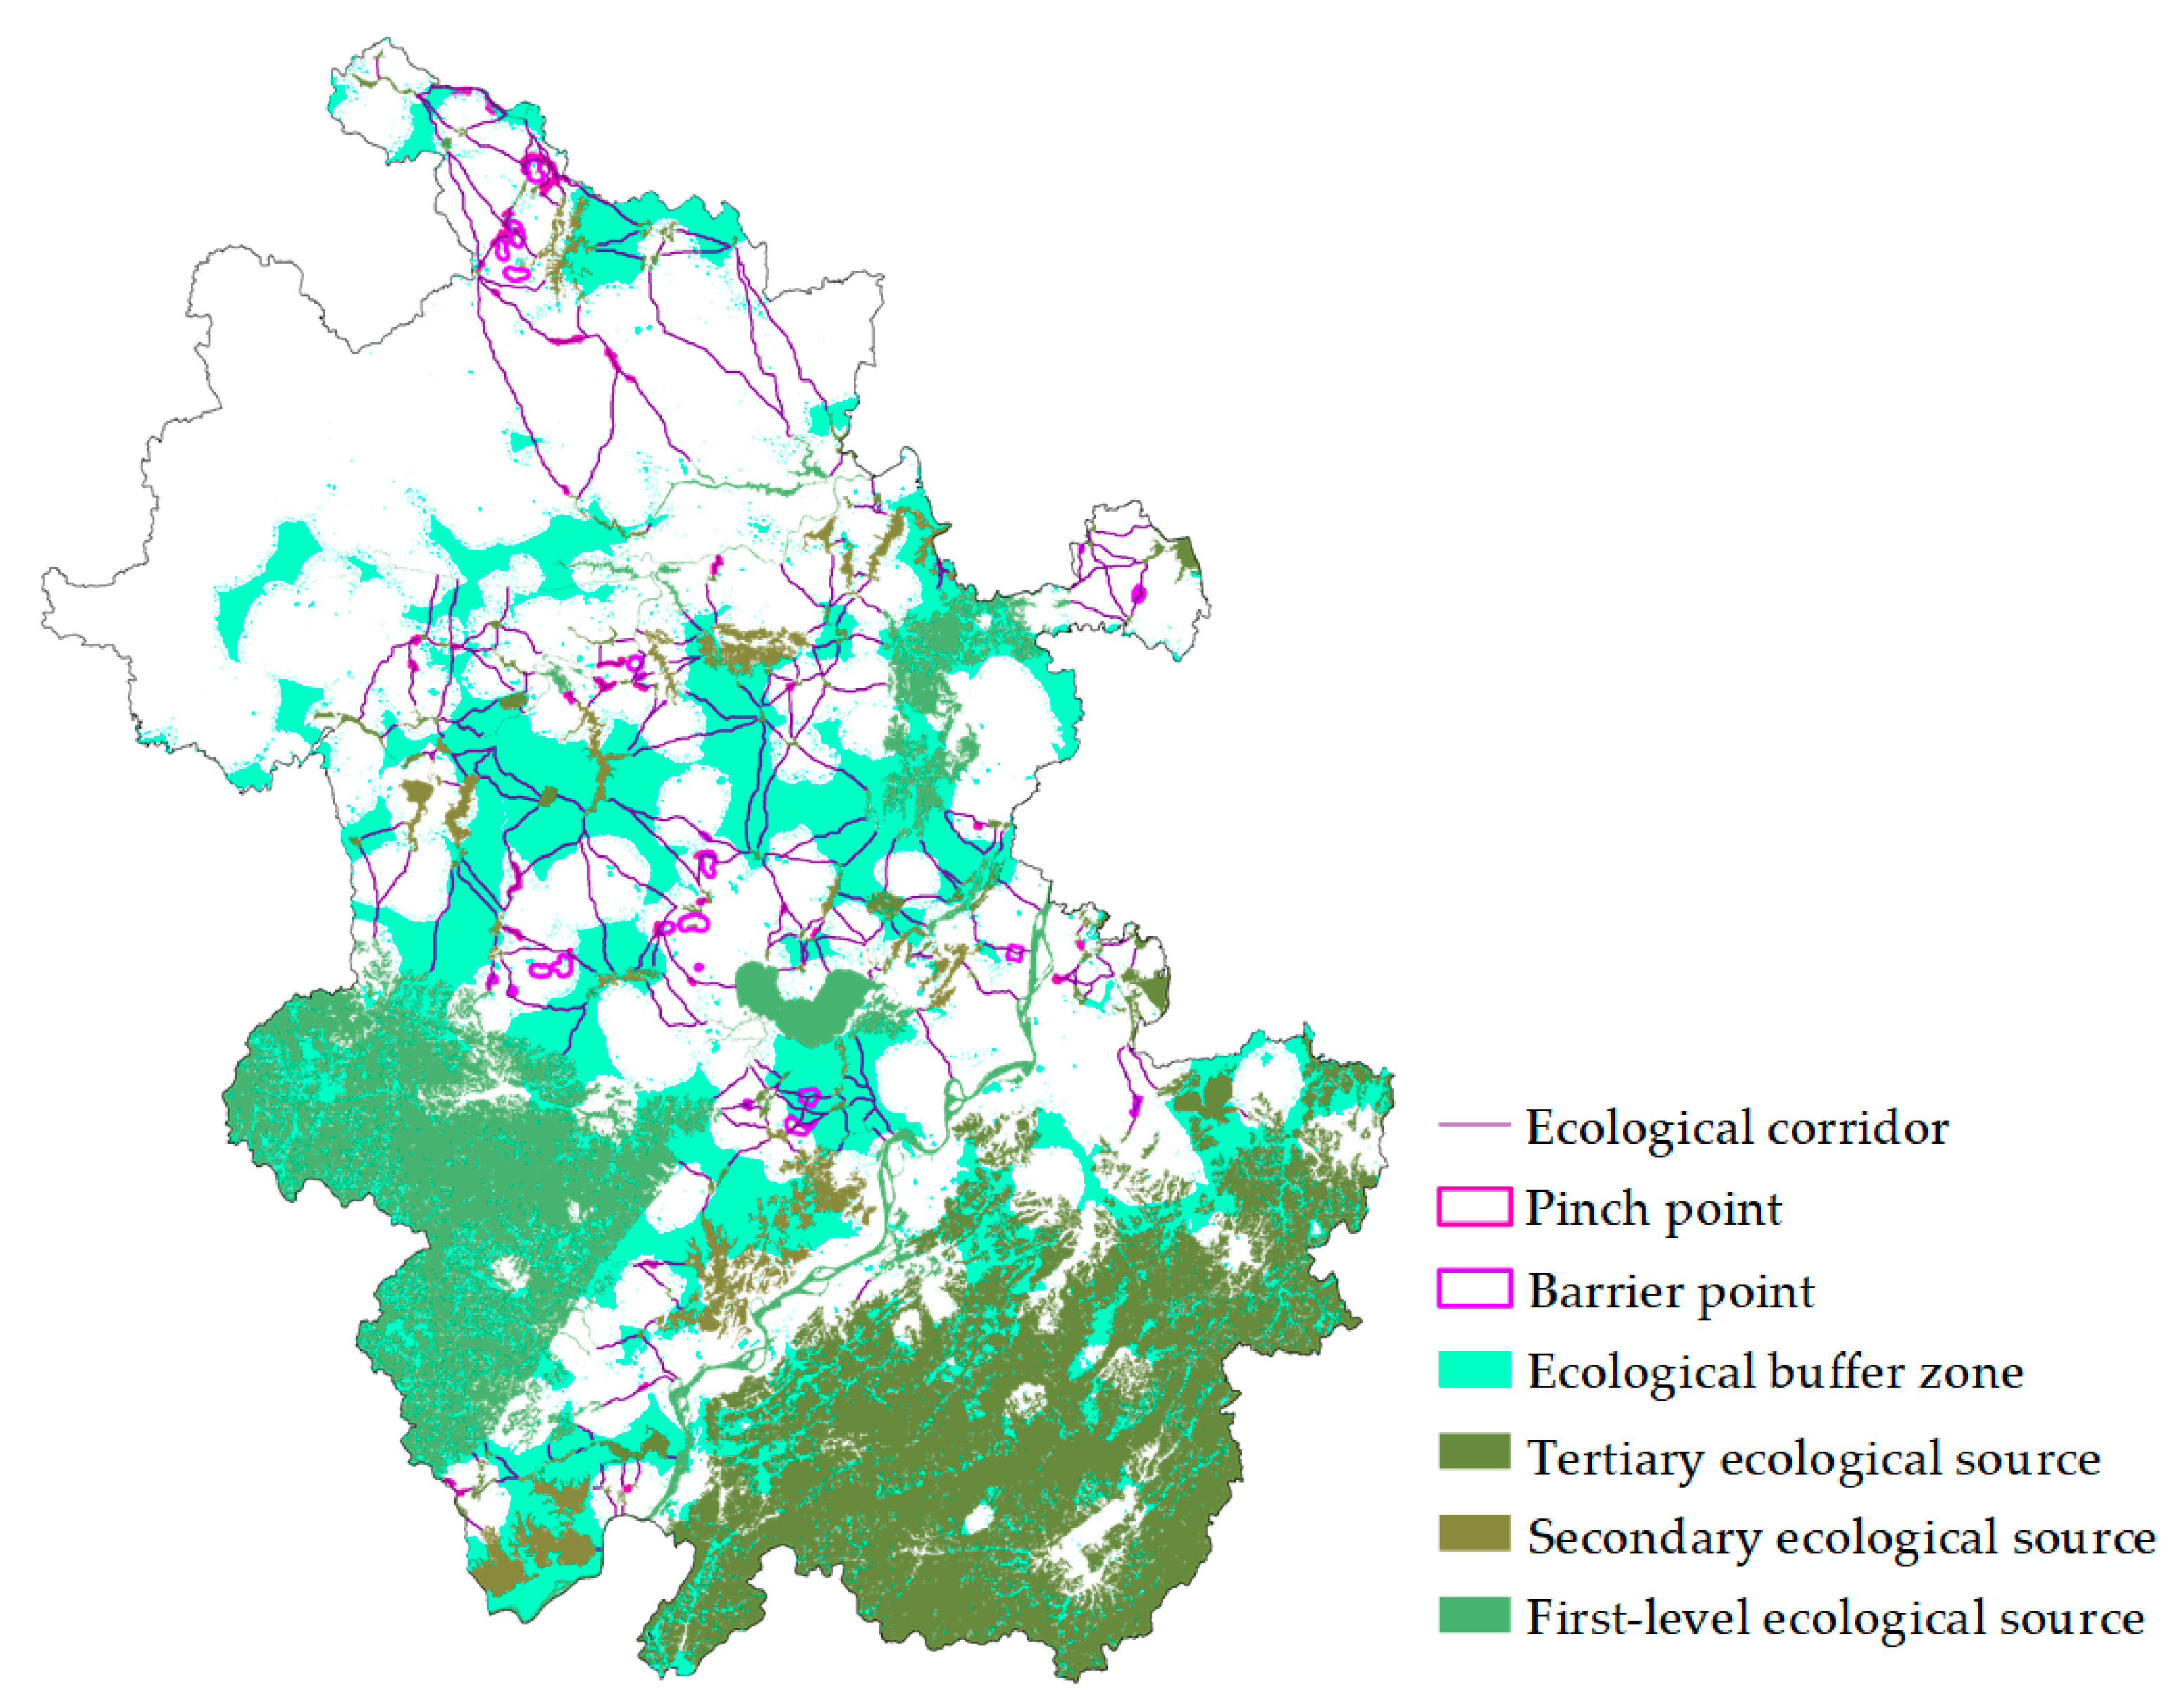
3.4. Identification of the Elements of the Ecological Safety Pattern
The basis for the construction of ecological safety patterns consists of four types of elements: ecological reserves, ecological corridors, pinch points, and barrier points. The resistance surface was calculated based on high biodiversity (the higher the biodiversity, the lower the resistance value). Results were corrected by the nighttime light index and the topographic position index (Figure 7), and the spatial extent of the corridor for terrestrial migration was simulated using circuit theory (Figure 8).
The simulated corridors varied in width (Figure 8b), with narrower corridors representing fewer alternative pathways for organisms to pass through. The narrowest corridors are located around the city of HeFei, where the land use type is mainly construction land and ecological resistance is high. The ecological corridors are basically distributed along the protective forests on both sides of rivers and highways, and there is strong interference from human construction activities around the corridors, which has a high risk of ecological degradation.
In addition, the ecological corridor is short and narrow due to the high concentration of human activities near the built-up area, which leads to a high degree of fragmentation of ecological sources and a high level of ecological resistance (Figure 8). Potential ecological corridors of greater width are mainly located in the areas south of the Yangtze River, between the Dabie Mountains and the ecological source lands near the Langya Mountains in ChuZhou, while those of greater width face less ecological pressure.
The Linkage Mapper identified 250 ecological corridors in the study area, with a total length of 4500.09 km. 151 corridors with a length of more than 10 km and 11 corridors with a length of more than 50 km were identified, mainly in the area north of the Yangtze River. The Dabie Mountains, the Southern Anhui Mountains, and the Yangtze River form a special geographic environment, resulting in significant differences in the ecological environment between the north and the south of Anhui.
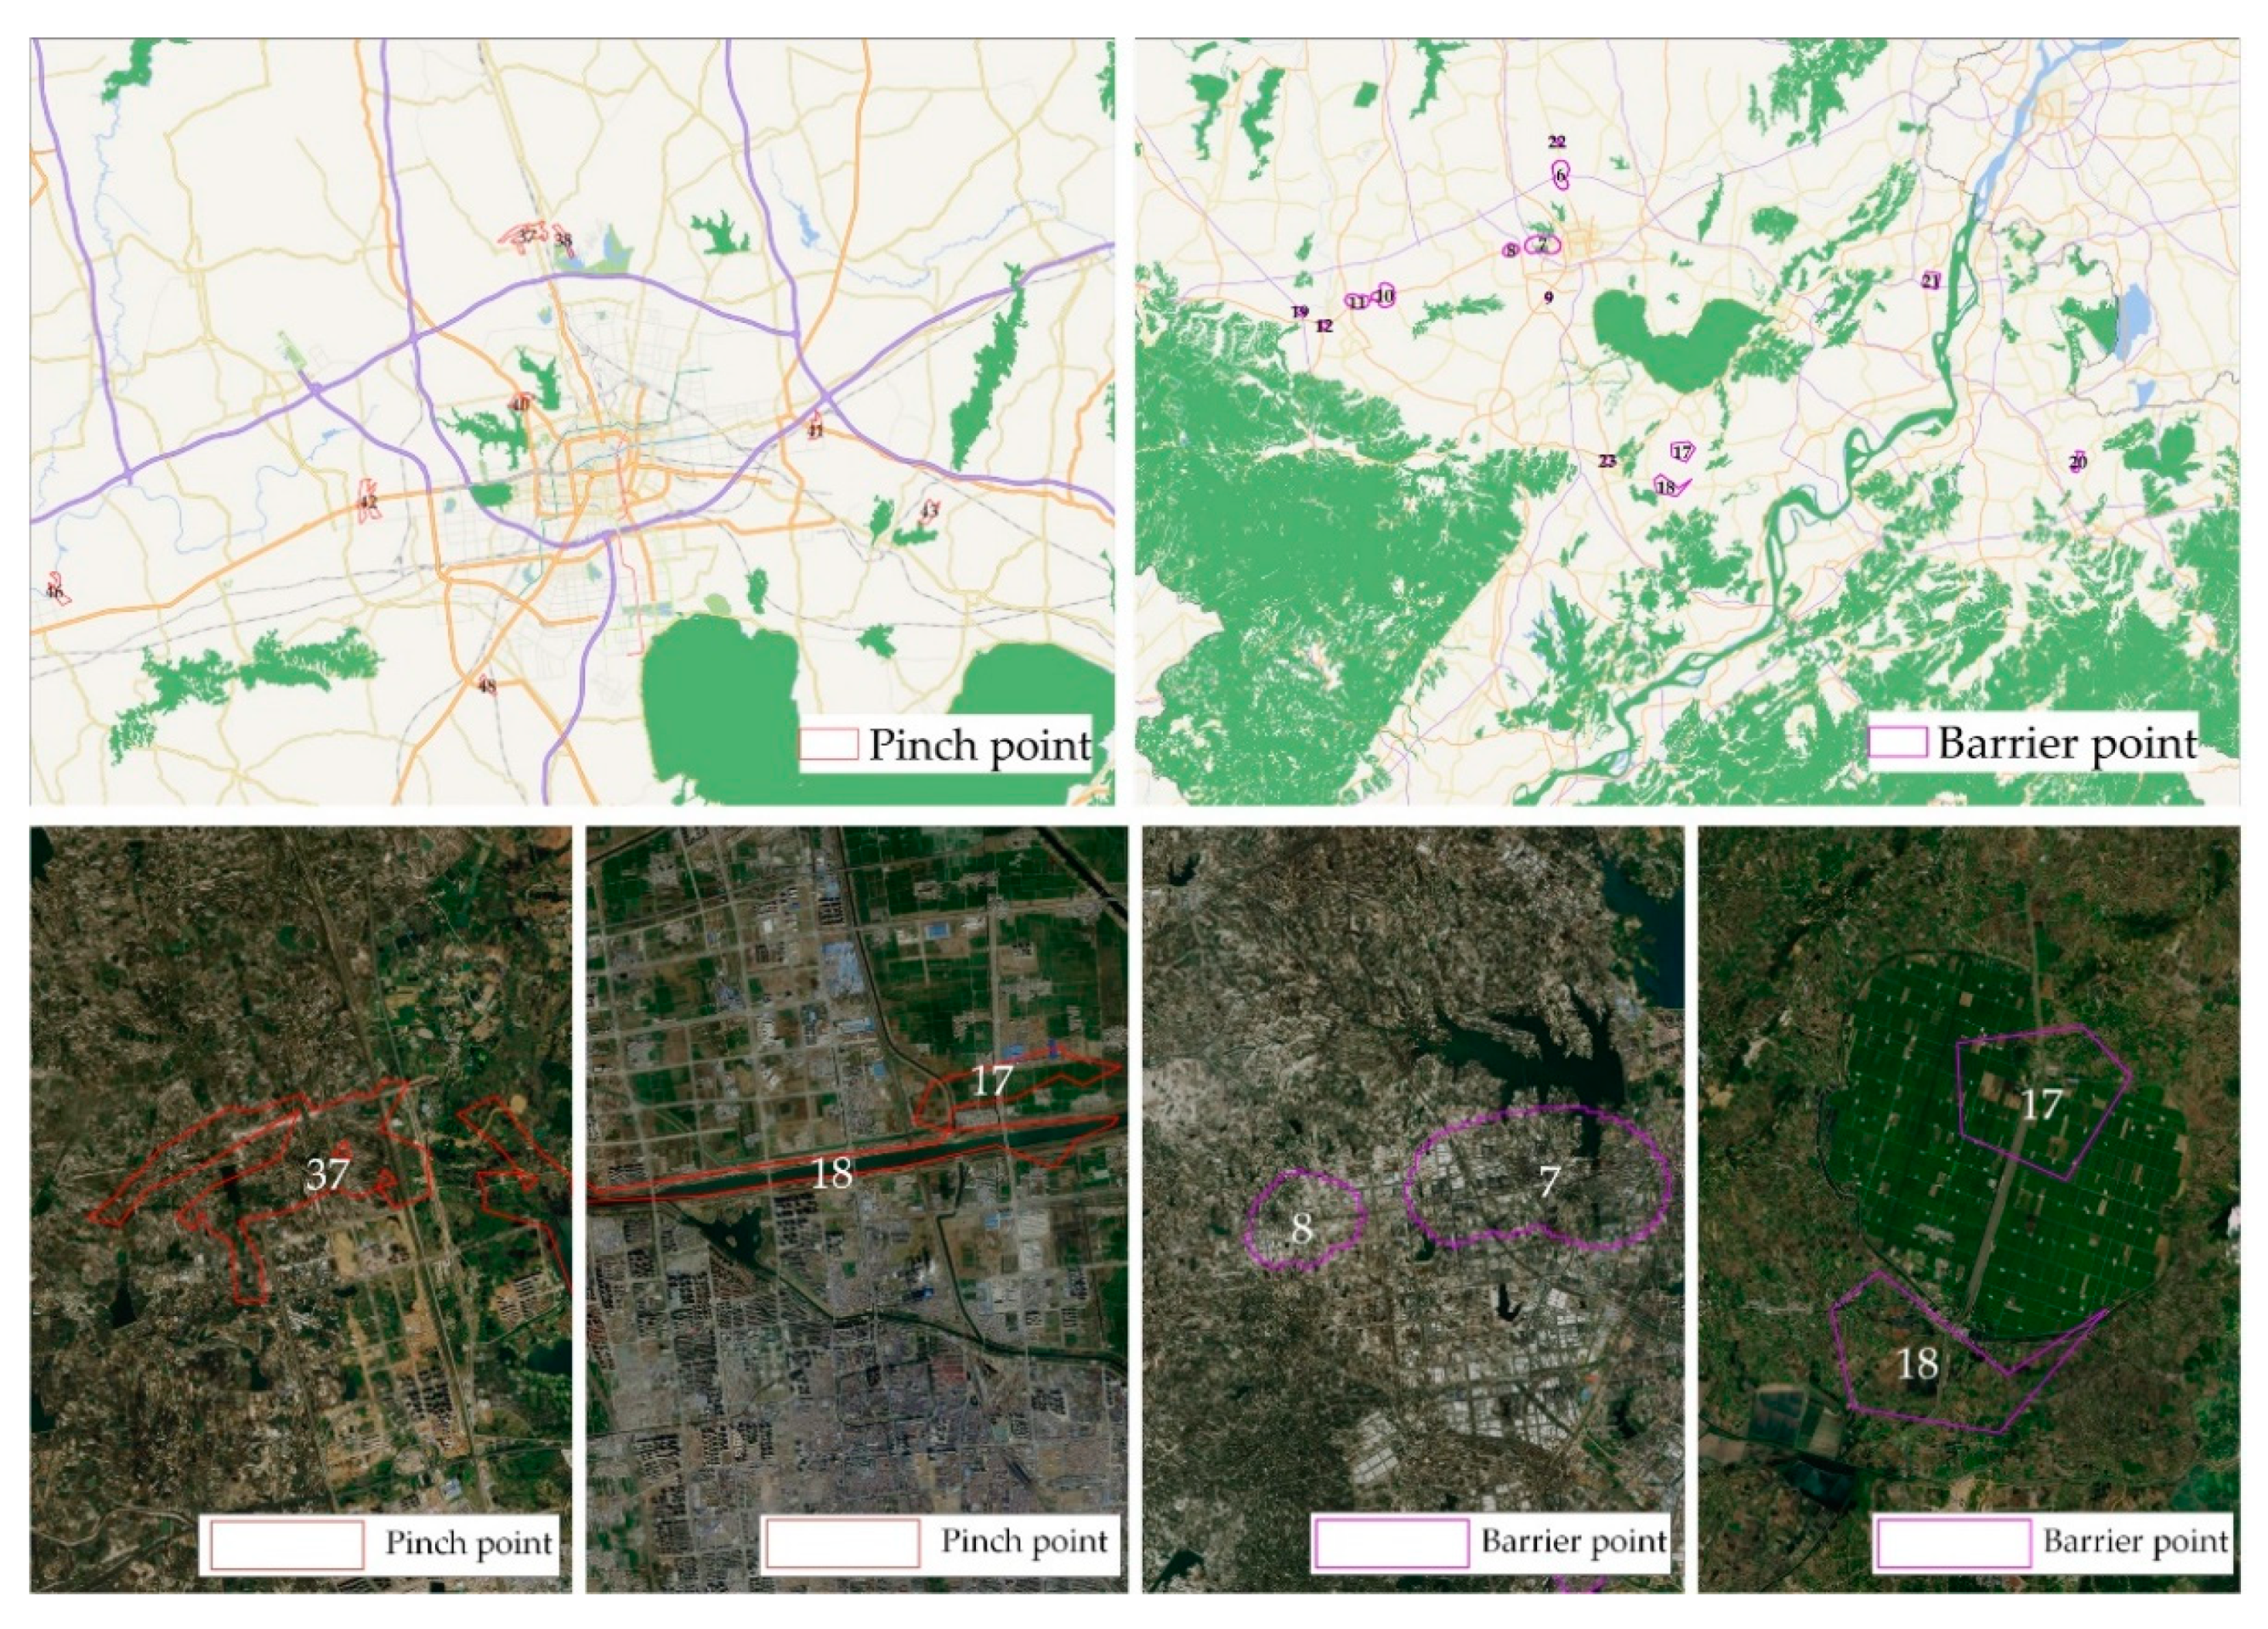
The Centrality Mapper was used to identify the important ecological source sites with the highest regional centrality scores, and found that the Dabie Mountains and Chao Lake in western Anhui Province are important patches connecting the north-south ecological source sites in Anhui Province (Figure 8a). The pinch point Mapper was used to identify important pinch points (54) which may affect the connectivity of regional ecological corridors (Figure 8c), mainly found in the hilly areas in central Anhui and the mountainous areas in southern Anhui. The main composition of the pinch points in these areas is woodland and grassland, while the main composition of the pinch points in the northern Anhui plain is arable land and woodland. Overall, the spatial distribution is point-like. The Barrier Mapper module was used to identify barrier points (24) which may affect the transfer of terrestrial species (Figure 8d), with the main land composition being construction land and water. The average area of the barrier points is 16.15 km2, and the largest barrier point area is 29.76 km2.
Spatial analysis using ArcGIS found that the main land type is construction land especially around the main urban area of HeFei. The overall distribution of the barrier point area is cluster-like (mainly composed of construction land and farmland (Figure 9)).
3.5. Ecological Security Patterns in Anhui Province
We calculate the difference between the minimum cumulative resistance surface of ecological source land expansion and the minimum cumulative resistance surface of town expansion based on ecological protection zones and towns. The natural breakpoint classification method was used to extract ecological buffers, which, together with the ecological corridors and pinch points identified in the study area, form the ecological security pattern of the study area (Figure 10).
The area of ecological reserves in southwest Anhui and south of the Yangtze River is much larger than that in central and northern Anhui, and has more dense ecological corridors, which is closely related to the excellent natural background of Anhui Province. The densest corridors are found in the hilly areas of central Anhui, where the ecological source areas play an important role in linking the plains of northern Anhui with the mountainous areas of southern Anhui and where the protection of ecological source areas and ecological buffers should be increased in order to prevent the effectiveness of species movement in the province. Another large number of pinch points and barrier points occur in the hilly areas of central Anhui, such as around the city of HeFei. This is a region of rapid economic development and high anthropogenic activity, but superior natural conditions are in conflict with economic construction, so an ecological corridor is critical here to maintain the ecological stability of the region and prevent the uncontrolled expansion of construction land. The ecological sources that play an important role in the connectivity of the study area are identified and classified into primary, secondary, and tertiary ecological sources. Primary ecological sources are key areas that influence the connectivity of all ecological sources, including those that provide the basis for human economic development, animal and plant survival, and those which provide important habitats for the migration of species. The ecological buffer zone is an important barrier to human activity, acting as a back-up resource for the expansion of ecological source sites, but also separating them from external disturbances and serving to reconcile economic and social activities with ecological conservation. It covers 19.7% of the study area, and the intensity of construction in the ecological buffer zone needs to be controlled in an orderly manner in the future to prevent its barrier role from weakening or disappearing.
4. Discussion
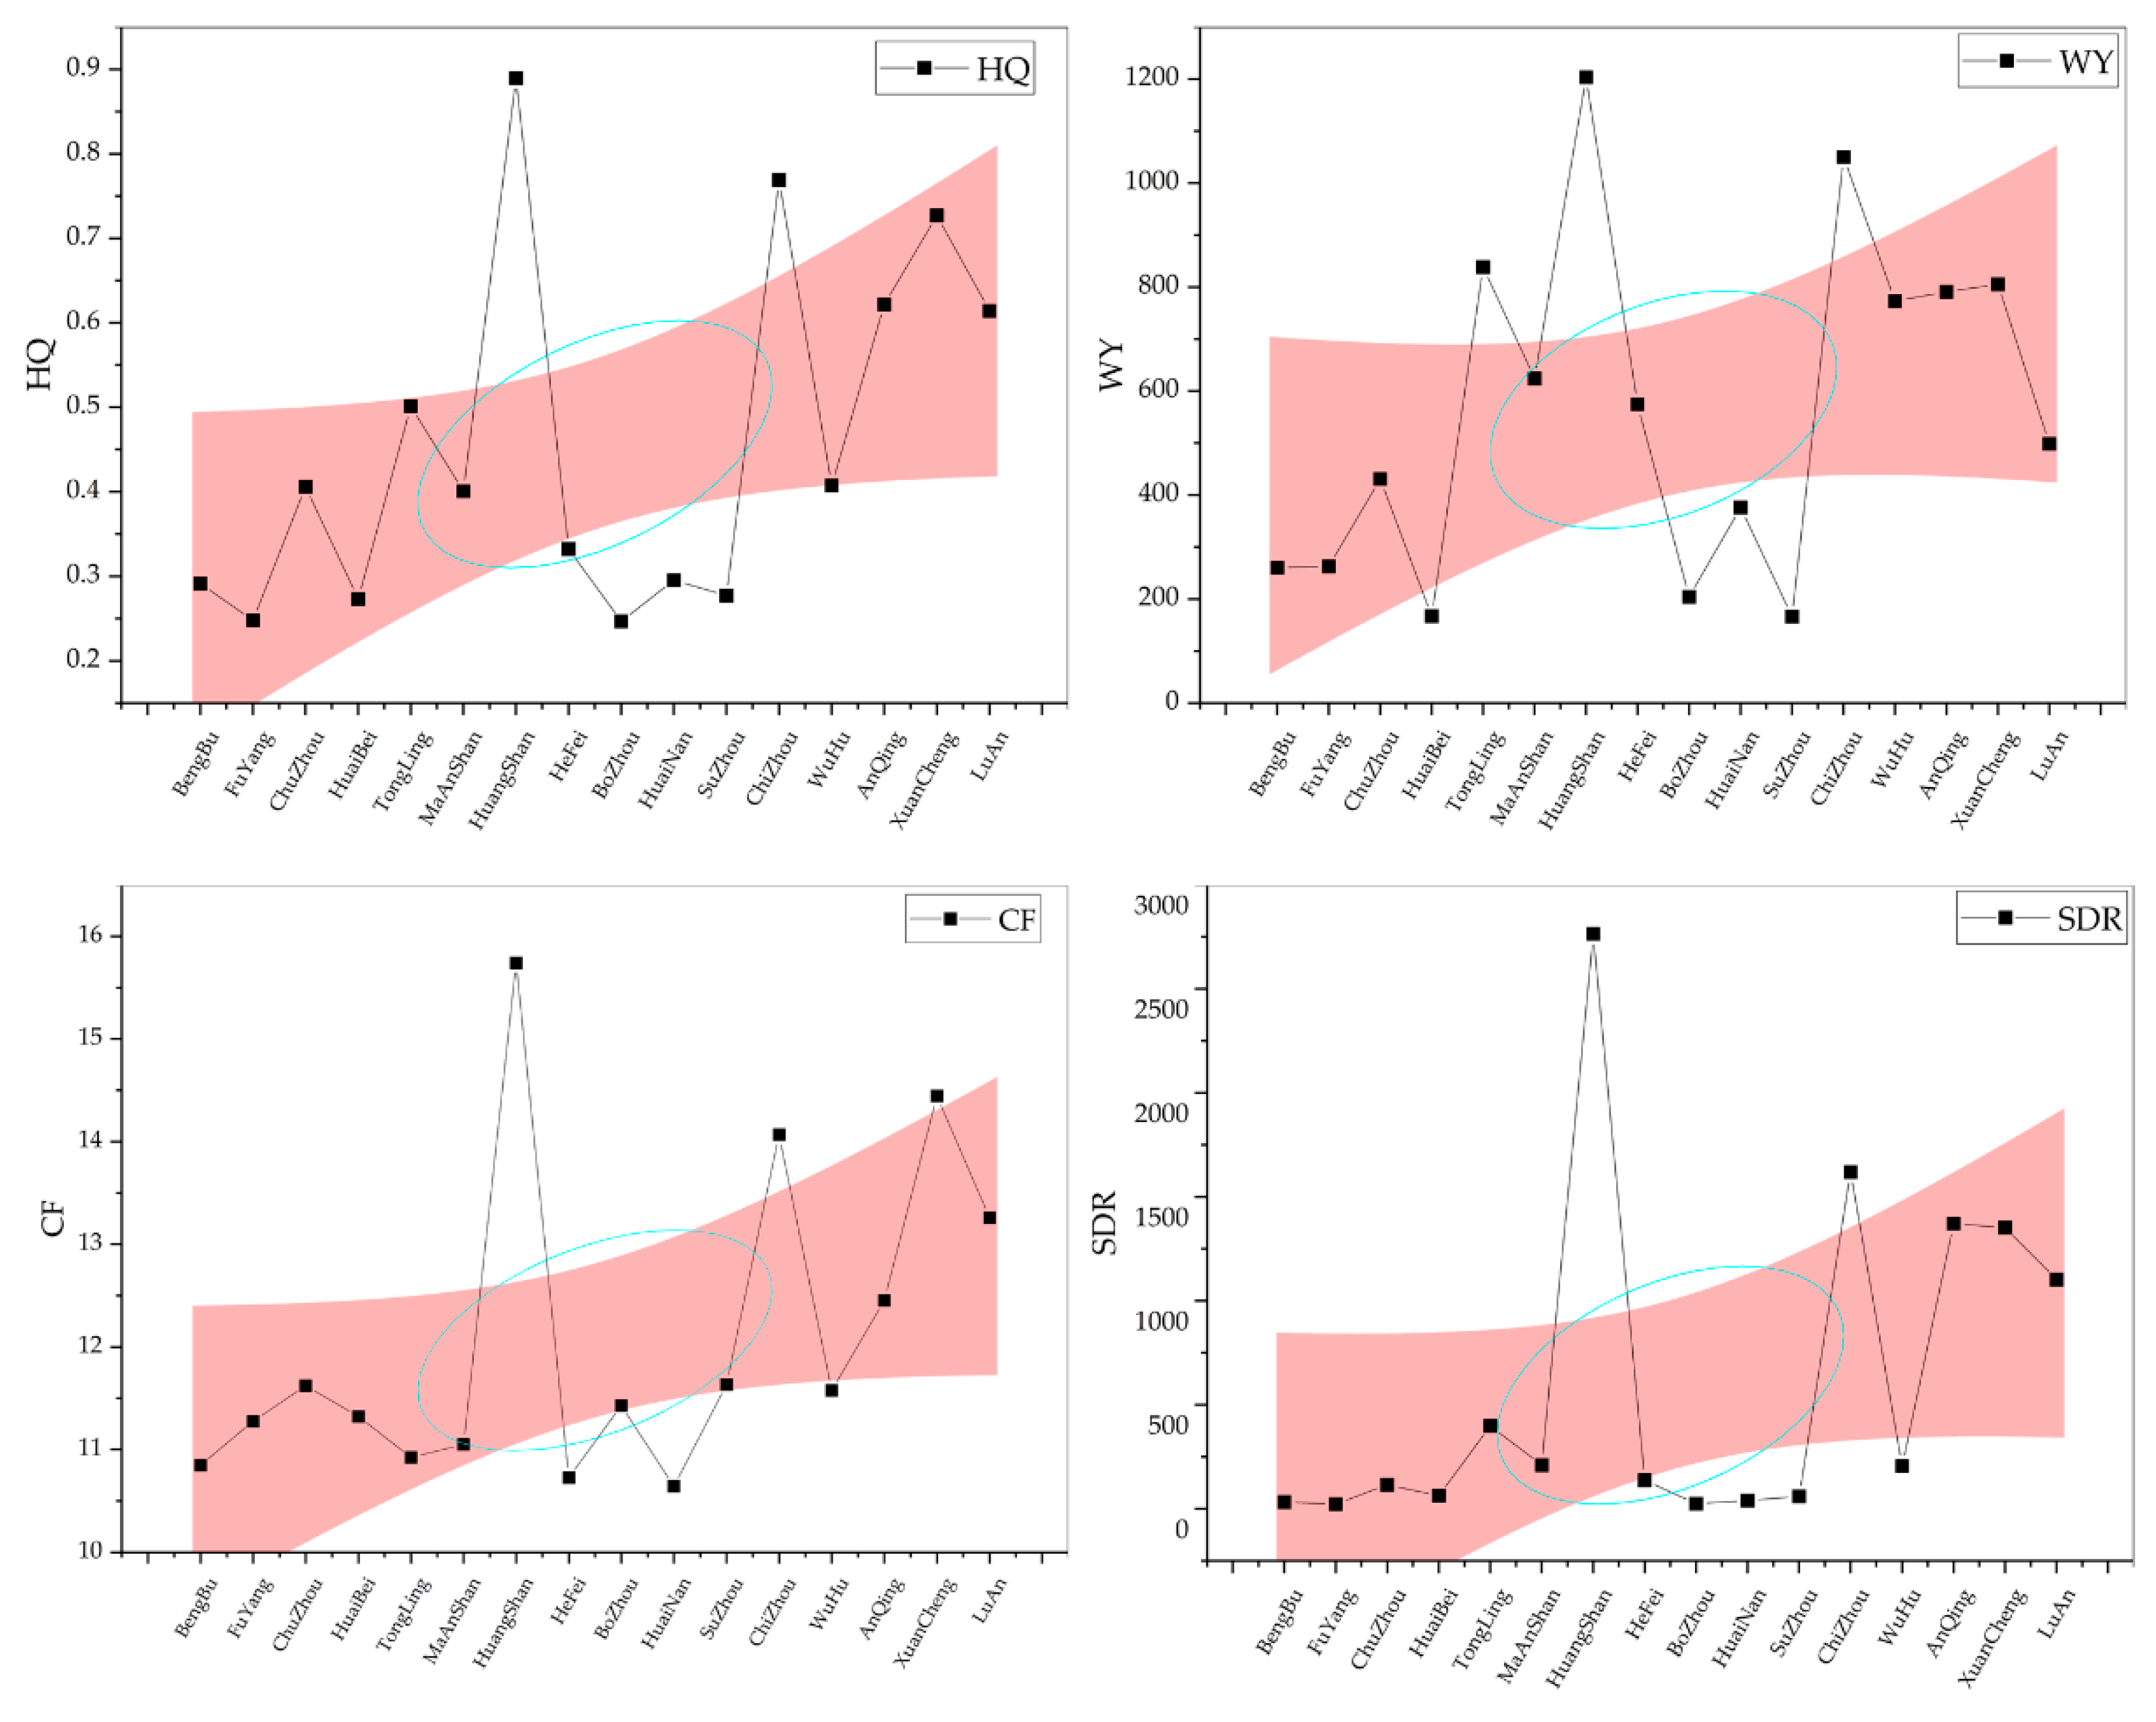
4.1. A Model for Collaborative Governance of Ecological Security Patterns in the Context of Regional Differences in Ecosystem Services
Ecological co-governance is a relatively new term which is increasingly mentioned in China and around the world [42,43]. Ecological governance considers understanding the ecological environment while simultaneously emphasizing complexity and adaptability [44]. The lack of effectiveness in ecological governance between different regions is often due to the decentralization of powers between governments and the lack of synergy of efforts, which can lead to degradation of the ecological environment in different regions, watersheds, and localities.
The special natural environment of Anhui Province has created different spatial patterns of ecosystem services. The distribution of each ecosystem service by city in Anhui Province is shown in Figure 11. The differences in ecosystem services between regions in southern Anhui are clear. There are higher levels of ecosystem services in southern Anhui, where the overall ecological environment of HuangShan City is at the highest level in Anhui Province. Conversely, urban ecosystem services in northern Anhui are at a lower level. The differences in ecological environment between different regions result in different policy governance, and ecological damage is often transregional, common for cities along the Huai River and the Yangtze River [45].
Long-term externalities such as unpaid or low-paid use of the water ecosystem and inadequate investment return mechanisms can make the negative externalities of cross-border pollution between upstream and downstream particularly serious. For example, in a related study [46,47], it was shown that the mean values of Pb, Cd, Cr, Hg, As, Zn, Ni, and Cu in mining soils in the Yangtze River Economic Zone exceeded the background values, while agricultural non-point source pollution such as COD, TN, and TP in the hilly areas of the upper Yangtze River Plain increased substantially between 2005 and 2015. The root cause of this phenomenon is a failure of the market and the absence of the government [48]. Therefore, it is necessary to strengthen cross-regional ecological governance to promote the internalization of the social costs of negative externalities in the river basin, and to transform the private environmental costs of individual regional governments into social environmental costs for the entire river basin by constructing an effective governmental cooperation system and emphasizing inter-governmental accountability. In this way, regional ecological construction becomes a shared responsibility between governments. Different regions have different natural geographical characteristics, resulting in different starting points for the ecological environment [49].
Anhui Province is region with complex physical geography of plains, hills, and mountains, which woodlands and grasslands mainly in the Dabie Mountains and around the HuangShan Mountains, and arable land in the areas north of the Yangtze River. The spatial differences in ecosystem services are apparent, and therefore the management measures and strategies for maintaining ecological security patterns may vary from region to region. In this regard, different strategies are proposed for the construction of ecological security patterns in Anhui Province. The buffer zones around ecological source areas in southern Anhui Province and in the Yangtze River Delta region need to be strengthened in the future, and corridors and buffer zones should be built on the basis of the existing scale of ecological source areas. In central Anhui Province, the proportion of water areas is higher than that in southern Anhui Province, so the construction of wetland parks around large water areas such as Chaohu Lake can be strengthened in response to regional characteristics. The ecological corridor in northern Anhui is mainly composed of arable land, which is less stable and lacks a place for species to stay during migration, so the construction of the ecological corridor should focus on the maintenance of the ecological reserve itself. The construction of ecological corridors should therefore focus on the maintenance of the ecological reserves themselves [50].
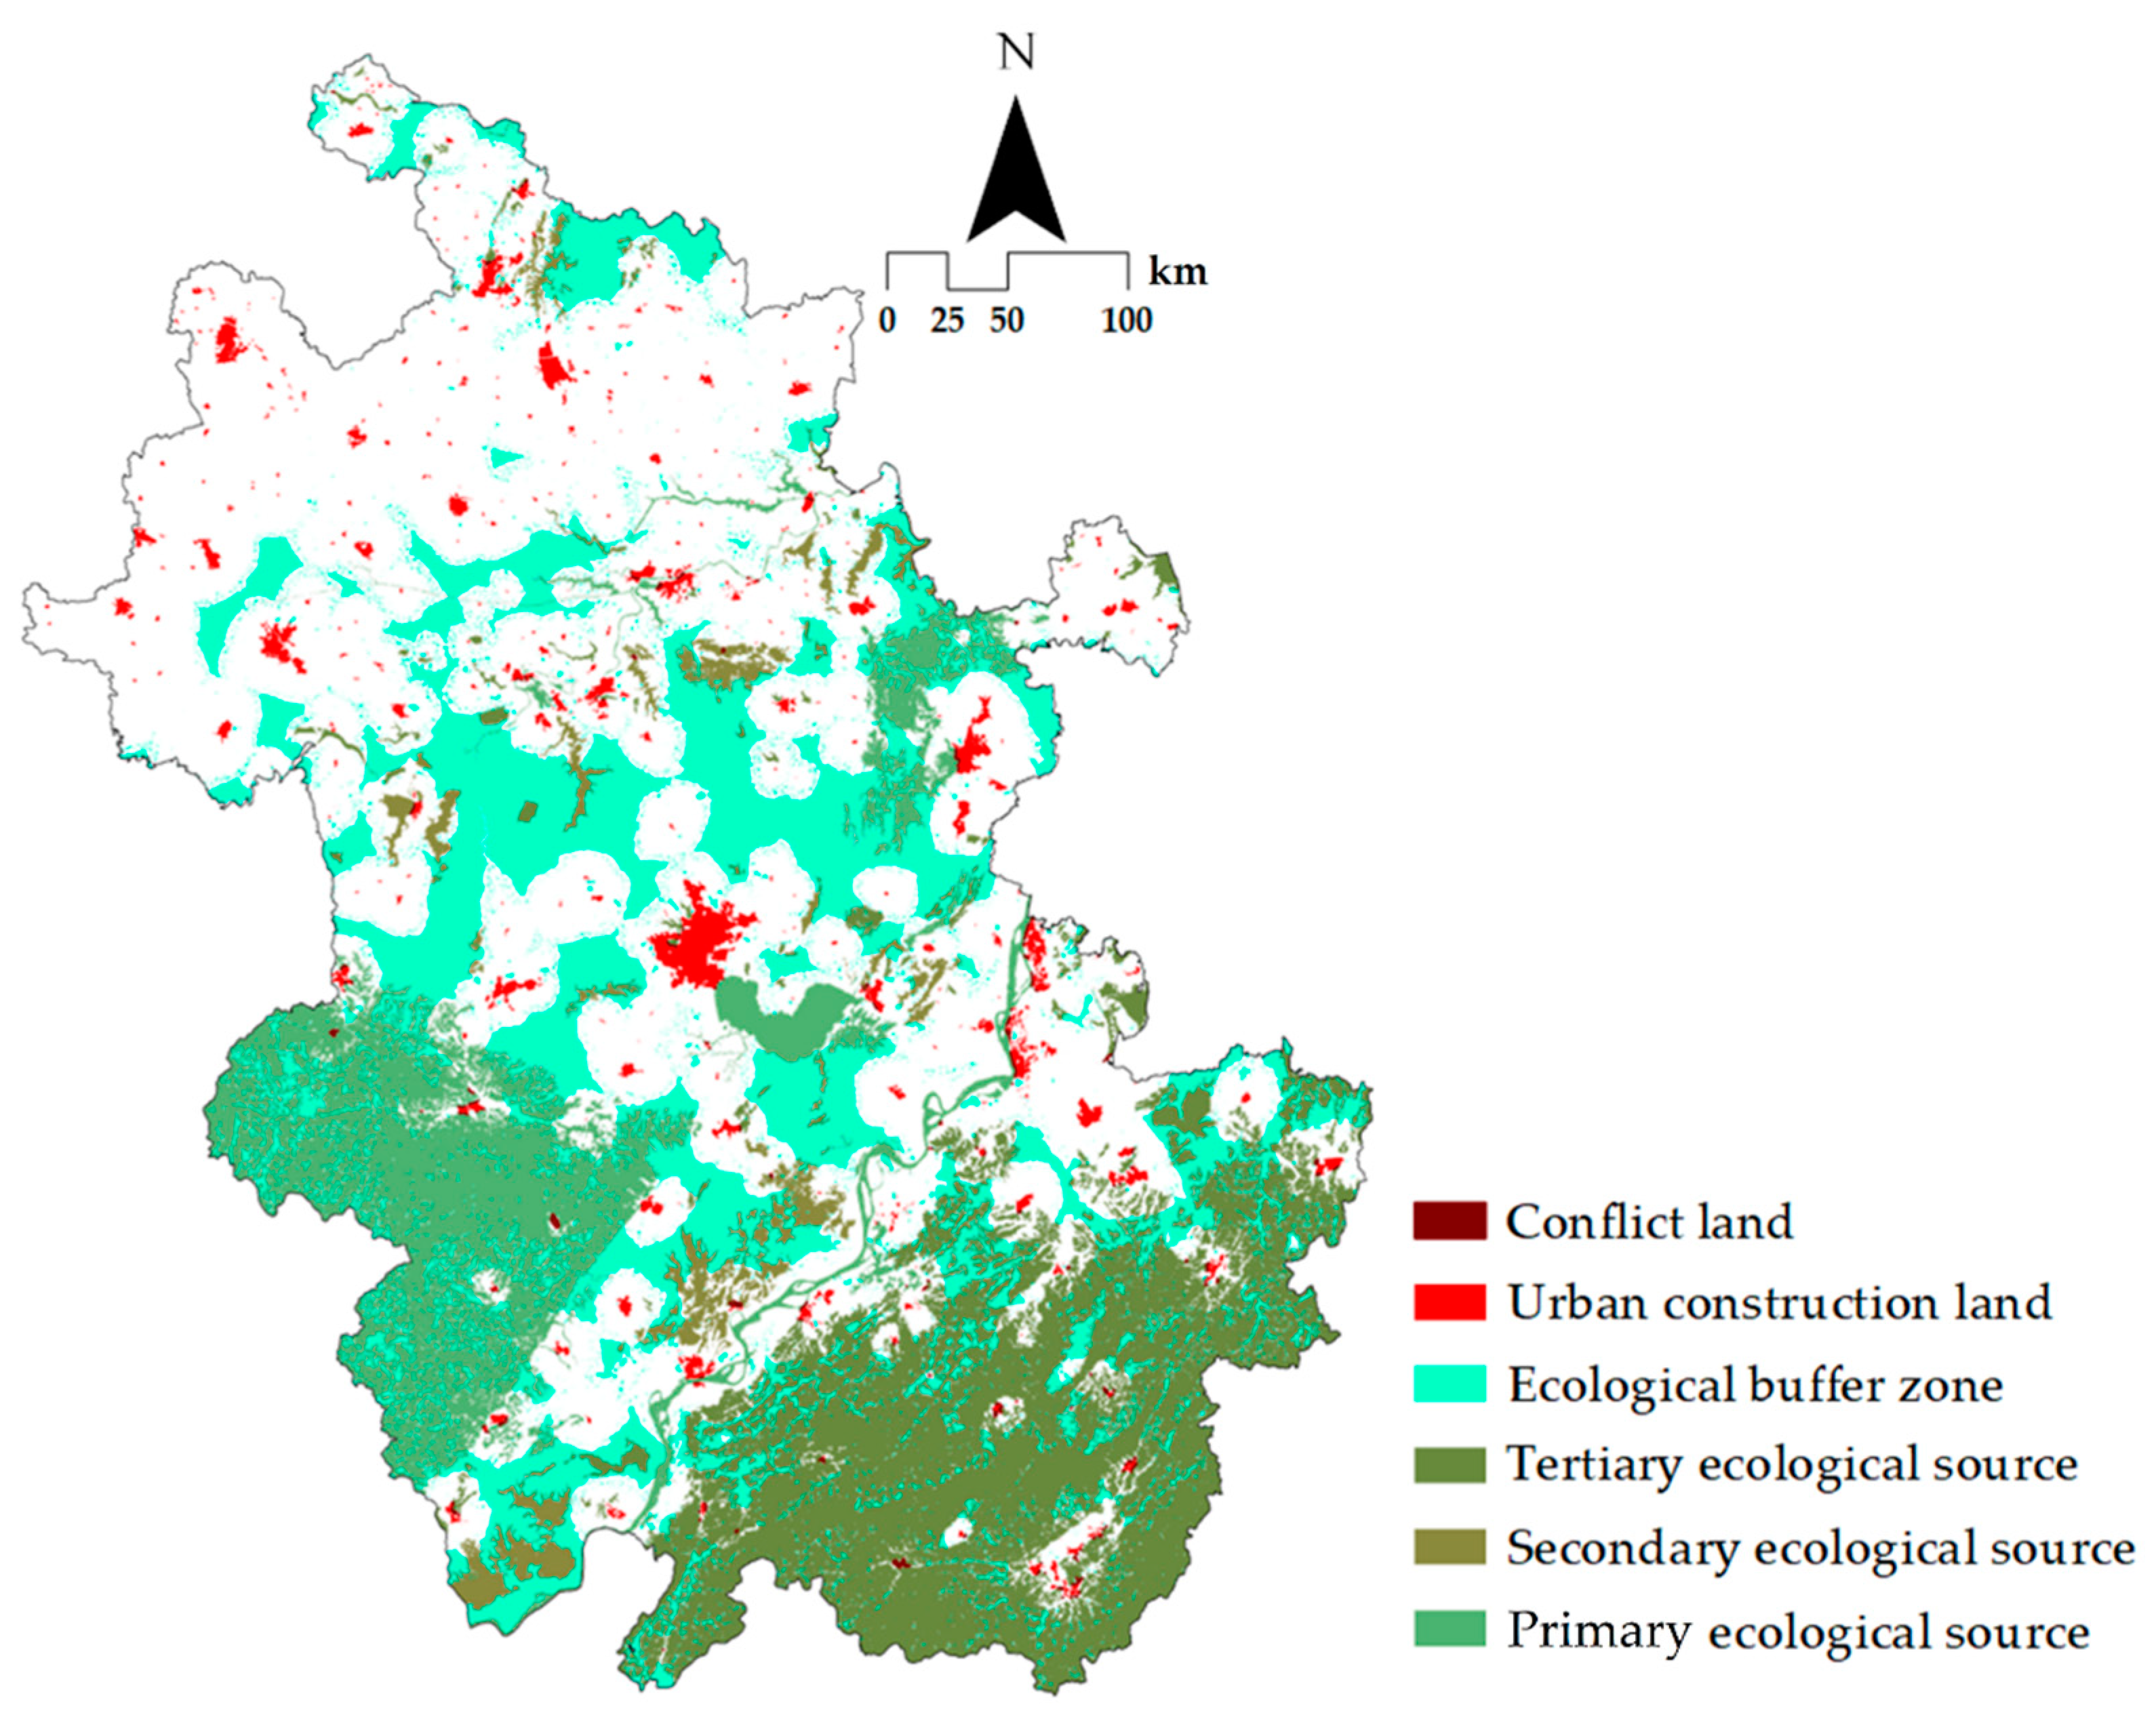
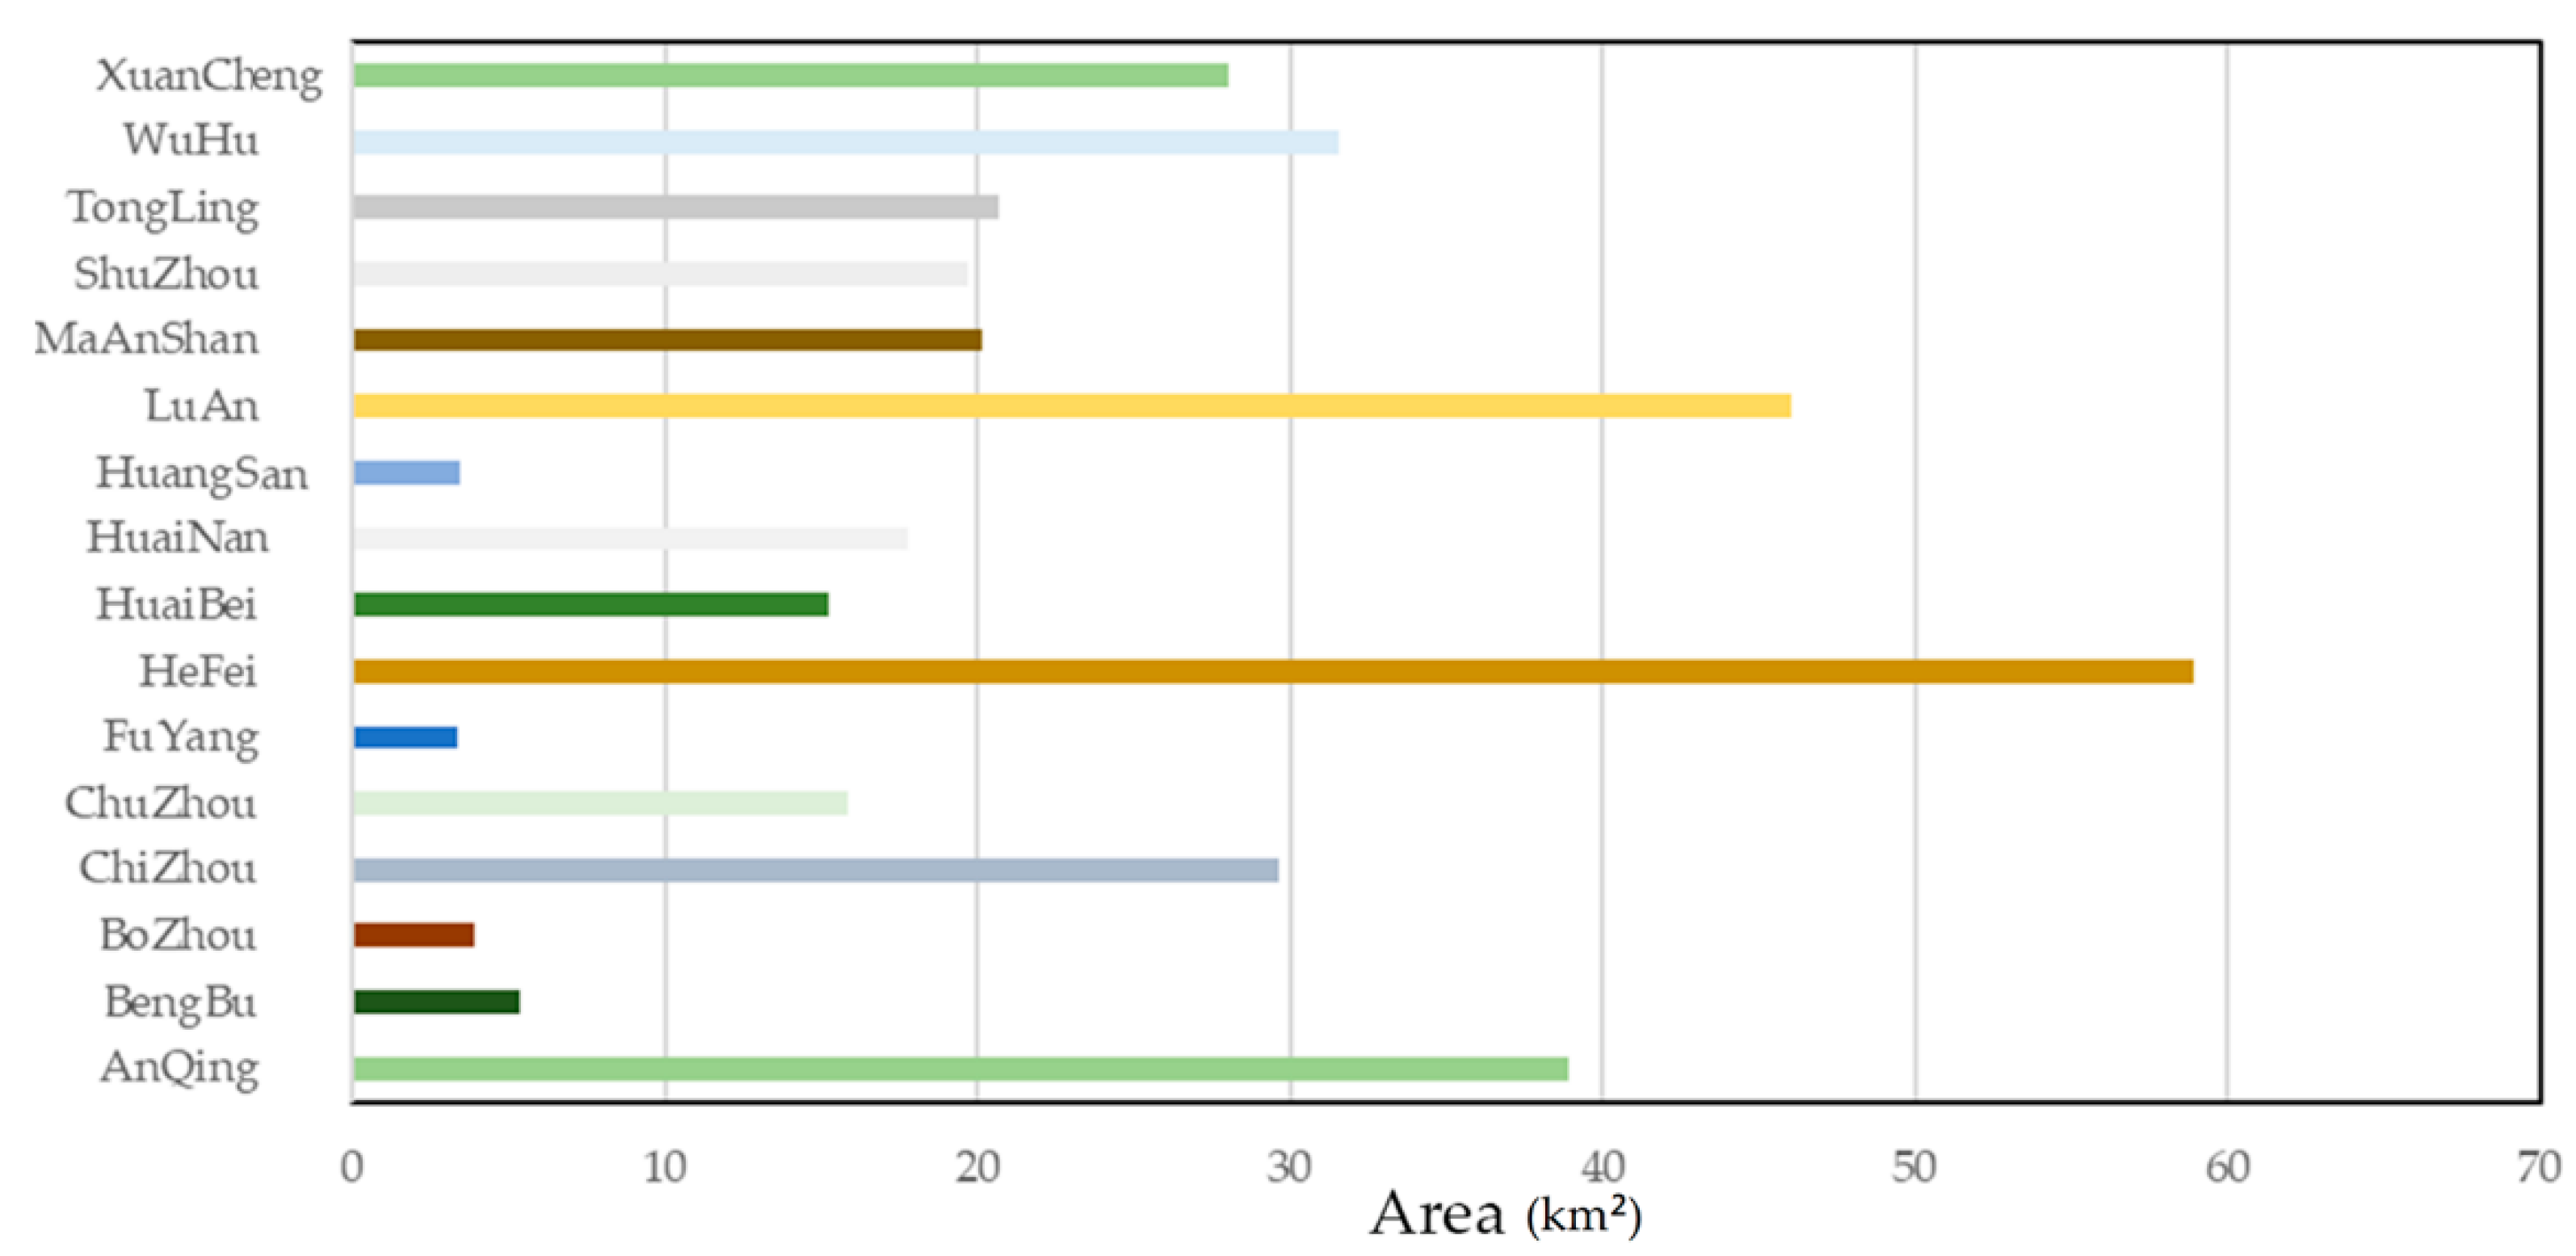
4.2. Identification of Sites in Conflict between Ecological Protection and Urban Expansion
Rapid urbanization can lead to a conflict between ecological protection and urban construction land expansion, and habitat patches are strongly influenced by changes in surrounding land use, becoming increasingly fragmented and islanded and seriously threatening regional biodiversity. Development and construction should be strictly prohibited in source areas, and should be restricted in buffer zones as a protective barrier for the ecological source areas. We show the current land use map of Anhui Province and overlay the urban construction land with the source lands and buffer zones for analysis in order to identify conflicting land use between ecological protection and urban expansion (Figure 12). This conflict zone is 358.73 km2, indicating that the current urban expansion has caused some disturbances to habitat protection.
The conflict areas are mainly concentrated along the Yangtze River, near HeFei, and around the Dabie Mountains. These areas are where human economic activities are frequent and many highways and railway lines exist. Three regions, HeFei, LuAn, and AnQing, have a large proportion of conflict areas (Figure 13), accounting for 16.4%, 12.8% and 10.8% of the total, respectively. HeFei is the capital of Anhui Province and has a high rate of urban expansion and spillover to the surrounding districts and counties, with more conflict patches surrounding it. The Dabie Mountains in LuAn are an important water-conserving area for Anhui Province and the Yangtze River Delta region, but urban construction in the past 20 years has encroached on a large amount of woodland and grassland, causing a decline in the quality of the internal ecological environment, and causing damage to human well-being in the region. This has also caused some encroachment on the surrounding wetlands. The city of HuangShan, on the other hand, has a smaller area of conflict. HuangShan is the core city of HuiZhou and is developing rapidly with a particularly strong tourism industry but is less affected by human activities and maintains a good overall ecological quality.
4.3. Discussion on Weakness of This Research
There are different levels of ecosystem service trade-offs between different regions and scales, so the screening of ecological reserves may not be comprehensive. The width of ecological corridors has been the focus here, and we only simulated the spatial movement of species migration with the help of circuit theory. Further research is needed to determine more detailed corridor widths, as these pathways effectively link ecological space for wildlife to land use policy. In times of conflict between ecological protection and economic development, unsuitable corridors may cost more in terms of economic and human resources to create and are more likely to be impossible to implement [51]. At the same time, screening and calculating the structural indicators and functional connectivity indicators of the ecological corridor on the overall, internal horizontal and vertical scales of the corridor will help to improve the theory and method of regional ecological corridor construction.
5. Conclusions
We selected and analyzed four ecosystem services (habitat quality, carbon storage, soil and water conservation, water retention) in Anhui Province, and a multi-criteria decision-making method, OWA, was introduced to construct a multi-scenario spatial pattern of ecosystem services. We calculated the trade-offs and conservation efficiency of each scenario and determined the spatial extent of the priority ecological reserves. We also employed circuit theory to construct regional ecological corridors and identify regional pinch points and barrier points, and to construct regional ecological safety patterns for pinch points and barrier points. Our main conclusions are as follows:
- (1)
- The four types of ecosystems in Anhui Province have similar spatial distribution patterns, with an overall spatial variation of “high in the southwest and low in the northeast”, an average habitat quality index of 0.487, an average carbon fixation of 338.58 , an average soil retention of 717.67 , and an average of 247.40 mm for water retention. The main reason for the spatial pattern of the four types of ecosystem services is the physical geography of the province.
- (2)
- The results of the Pearson correlation analysis revealed that the four types of ecosystem services were synergistic at the provincial scale, but in areas with different natural geographical characteristics, there were synergies and trade-offs between various ecosystem services. The results of the study provide support for the introduction of ordered weighted averaging to construct a spatial pattern of ecosystem services in multiple scenarios and validate the need to consider the trade-offs between different ecosystem services in determining ecological source areas.
- (3)
- Seven integrated ecosystem service scenarios were constructed using OWA, and ecological reserves were selected based on conservation efficiency and trade-offs. A total of 150 ecological source sites were selected and retained, which cover an area of 47,344.59 km2 and account for 33.77% of the total area. In addition, 355 ecological corridors, 686 pinch points, and 248 barrier points were identified using circuit theory. The regional ecological security pattern was constructed by dividing ecological protection zones, ecological buffer zones, ecological transition zones, ecological optimization zones, and ecological management zones.
Author Contributions
Conceptualization, X.G.; methodology, G.L.; software, H.Y.; validation, X.F.; formal analysis, X.G.; investigation, X.G.; resources, H.Y.; data curation, H.Y.; writing—original draft preparation, H.Y.; writing—review and editing, Q.Z. (Qiang Zhang); visualization, Q.Z. (Qi Zhao); supervision, G.L.; project administration, G.L.; funding acquisition, G.L. All authors have read and agreed to the published version of the manuscript.
Funding
This research was funded by the National Natural Science Foundation of China (Project Number: 41961004); Anhui University Collaborative Innovation Fund (Project Number: GXXT-2019-047).
Institutional Review Board Statement
Not applicable.
Acknowledgments
We thank Adam Thomas Devlin for its linguistic assistance during the preparation of this manuscript.
Conflicts of Interest
The authors declare no conflict of interest.
References
- Carpenter, S.R.; Mooney, H.A.; Agard, J.; Capistrano, D.; DeFries, R.S.; Diaz, S.; Dietz, T.; Duraiappah, A.K.; Oteng-Yeboah, A.; Pereira, H.M.; et al. Science for managing ecosystem services: Beyond the Millennium Ecosystem Assessment. Proc. Natl. Acad. Sci. USA 2009, 106, 1305–1312. [Google Scholar] [CrossRef] [PubMed] [Green Version]
- Program, M.E.A. Ecosystems and Human Well-Being: Wetlands and Water Synthesis: A Report of the Millennium Ecosystem Assessment; World Resources Institute: Washington, DC, USA, 2005. [Google Scholar]
- Mao, X.; Meng, J.; Xiang, Y. Cellular automata-based model for developing land use ecological security patterns in semi-arid areas: A case study of Ordos, Inner Mongolia, China. Environ. Earth Sci. 2013, 70, 269–279. [Google Scholar] [CrossRef]
- Franklin, J.F.; Forman, R. Creating landscape patterns by forest cutting: Ecological consequences and principles. Landsc. Ecol. 1987, 1, 5–18. [Google Scholar] [CrossRef]
- Su, Y.; Chen, X.; Liao, J.; Zhang, H.; Wang, C.; Ye, Y.; Wang, Y. Modeling the optimal ecological security pattern for guiding the urban constructed land expansions. Urban For. Urban Green. 2016, 19, 35–46. [Google Scholar] [CrossRef]
- Yu, K. Security patterns and surface model in landscape ecological planning. Landsc. Urban Plan. 1996, 36, 1–17. [Google Scholar] [CrossRef]
- Li, J.; Xu, J.; Chu, J. The Construction of a Regional Ecological Security Pattern Based on Circuit Theory. Sustainability 2019, 11, 6343. [Google Scholar] [CrossRef] [Green Version]
- Gu, X.; Yang, G.; He, X.; Zhao, L.; Li, X.; Li, P.; Liu, B.; Gao, Y.; Xue, L.; Long, A. Hydrological process simulation of Manas River Basin based on CMADS and SWAT model. J. Water Resour. Water Eng. 2021, 32, 116–123. [Google Scholar]
- Peng, J.; Zhao, H.; Liu, Y. Urban ecological corridors construction: A review. Acta Ecol. Sin. 2017, 37, 23–30. [Google Scholar] [CrossRef]
- Wang, C.; Yu, C.; Chen, T.; Feng, Z.; Wu, K. Can the establishment of ecological security patterns improve ecological protection? An example of Nanchang, China. Sci. Total Environ. 2020, 740, 140051. [Google Scholar] [CrossRef]
- Xu, W.; Yin, H.; Kong, F. Development of ecological control boundaries in Nanjing metropolis district based on ecological security patterns. Acta Ecol. Sin. 2017, 37, 4019–4028. [Google Scholar]
- Chen, Y.; Li, X.; Shi, P.; Gong, A.; Dou, W. Land cover pattern optimization for local ecological security using remotely sensed data. Int. J. Remote Sens. 2006, 27, 2003–2010. [Google Scholar] [CrossRef]
- Su, X.; Zhou, Y.; Li, Q. Designing Ecological Security Patterns Based on the Framework of Ecological Quality and Ecological Sensitivity: A Case Study of Jianghan Plain, China. Int. J. Environ. Res. Public Health 2021, 18, 8383. [Google Scholar] [CrossRef] [PubMed]
- Guo, R.; Wu, T.; Liu, M.; Huang, M.; Stendardo, L.; Zhang, Y. The Construction and Optimization of Ecological Security Pattern in the Harbin-Changchun Urban Agglomeration, China. Int. J. Environ. Res. Public Health 2019, 16, 1190. [Google Scholar] [CrossRef] [PubMed] [Green Version]
- Jongman, R.H.G.; Kulvik, M.; Kristiansen, I. European ecological networks and greenways. Landsc. Urban Plan. 2004, 68, 305–319. [Google Scholar] [CrossRef]
- Montoya, J.M.; Pimm, S.L.; Sole, R.V. Ecological networks and their fragility. Nature 2006, 442, 259–264. [Google Scholar] [CrossRef]
- Sole, R.V.; Montoya, J.M. Complexity and fragility in ecological networks. Proc. R. Soc. B-Biol. Sci. 2001, 268, 2039–2045. [Google Scholar] [CrossRef]
- Wang, Y.; Zhou, C. Landscape Ecological Security Pattern in Central Guizhou Urban Agglomeration. J. Ecol. Rural Environ. 2019, 35, 1111–1117. [Google Scholar]
- Han, Y.; Yu, C.; Feng, Z.; Du, H.; Huang, C.; Wu, K. Construction and Optimization of Ecological Security Pattern Based on Spatial Syntax Classification-Taking Ningbo, China, as an Example. Land 2021, 10, 380. [Google Scholar] [CrossRef]
- Gu, X.; Yang, G.; He, X.; Zhao, L.; Li, X.; Li, P.; Liu, B.; Gao, Y.; Xue, L.; Long, A. Hydrological process simulation in Manas River Basin using CMADS. Open Geosci. 2020, 12, 946–957. [Google Scholar] [CrossRef]
- Peng, J.; Pan, Y.; Liu, Y.; Zhao, H.; Wang, Y. Linking ecological degradation risk to identify ecological security patterns in a rapidly urbanizing landscape. Habitat Int. 2018, 71, 110–124. [Google Scholar] [CrossRef]
- Miao, Z.; Pan, L.; Wang, Q.; Chen, P.; Yan, C.; Liu, L. Research on Urban Ecological Network Under the Threat of Road Networks—A Case Study of Wuhan. ISPRS Int. J. Geo-Inf. 2019, 8, 342. [Google Scholar] [CrossRef] [Green Version]
- Wang, Y.-C.; Shen, J.-K.; Xiang, W.-N. Ecosystem service of green infrastructure for adaptation to urban growth: Function and configuration. Ecosyst. Health Sustain. 2018, 4, 132–143. [Google Scholar] [CrossRef]
- Peng, J.; Yang, Y.; Liu, Y.; Hu, Y.; Du, Y.; Meersmans, J.; Qiu, S. Linking ecosystem services and circuit theory to identify ecological security patterns. Sci. Total Environ. 2018, 644, 781–790. [Google Scholar] [CrossRef] [PubMed] [Green Version]
- Karimi, J.D.; Corstanje, R.; Harris, J.A. Understanding the importance of landscape configuration on ecosystem service bundles at a high resolution in urban landscapes in the UK. Landsc. Ecol. 2021, 36, 2007–2024. [Google Scholar] [CrossRef]
- Wang, L.; Zheng, H.; Wen, Z.; Liu, L.; Robinson, B.E.; Li, R.; Li, C.; Kong, L. Ecosystem service synergies/trade-offs informing the supply-demand match of ecosystem services: Framework and application. Ecosyst. Serv. 2019, 37, 100939. [Google Scholar] [CrossRef]
- Howe, C.; Suich, H.; Vira, B.; Mace, G.M. Creating win-wins from trade-offs? Ecosystem services for human well-being: A meta-analysis of ecosystem service trade-offs and synergies in the real world. Glob. Environ. Chang. 2014, 28, 263–275. [Google Scholar] [CrossRef] [Green Version]
- Samways, M.J.; Bazelet, C.S.; Pryke, J.S. Provision of ecosystem services by large scale corridors and ecological networks. Biodivers. Conserv. 2010, 19, 2949–2962. [Google Scholar] [CrossRef]
- Gu, X.; Long, A.; Liu, G.; Yu, J.; Wang, H.; Yang, Y.; Zhang, P. Changes in Ecosystem Service Value in the 1 km Lakeshore Zone of Poyang Lake from 1980 to 2020. Land 2021, 10, 951. [Google Scholar] [CrossRef]
- Aronson, J.; Clewell, A.F.; Blignaut, J.N.; Milton, S.J. Ecological restoration: A new frontier for nature conservation and economics. J. Nat. Conserv. 2006, 14, 135–139. [Google Scholar] [CrossRef] [Green Version]
- McRae, B.H.; Beier, P. Circuit theory predicts gene flow in plant and animal populations. Proc. Natl. Acad. Sci. USA 2007, 104, 19885–19890. [Google Scholar] [CrossRef] [Green Version]
- Li, Y.; Zhao, X.; Guo, X.; Zhou, B.; Huang, X.; Yi, D.; Ding, H. Optimization of ecological red line in the hilly region of Southern China based on In VEST and MCR model. J. Nat. Resour. 2021, 36, 2980–2994. [Google Scholar]
- Burke, T.; Rowland, C.; Whyatt, J.D.; Blackburn, G.A.; Abbatt, J. Achieving national scale targets for carbon sequestration through afforestation: Geospatial assessment of feasibility and policy implications. Environ. Sci. Policy 2021, 124, 279–292. [Google Scholar] [CrossRef]
- De Oliveira, M.L.; dos Santos, C.A.; de Oliveira, G.; Perez-Marin, A.M.; Santos, C.A. Effects of human-induced land degradation on water and carbon fluxes in two different Brazilian dryland soil covers. Sci. Total Environ. 2021, 792, 148458. [Google Scholar] [CrossRef] [PubMed]
- Chen, Z.; Shao, Q.; Liu, J.; Wang, J. Analysis of net primary productivity of terrestrial vegetation on the Qinghai-Tibetan Plateau, based on MODIS remote sensing data. Sci. Sin. Terrae 2012, 42, 402–410. [Google Scholar]
- Yager, R. Quantifier guided aggregation using OWA operators. Int. J. Intell. Syst. 1998, 11, 49–73. [Google Scholar] [CrossRef]
- Liu, Y.; Peng, J.; Han, Y.; Wei, H.; Du, Y. Suitability assessment for building land consolidation on gentle hillside based on OWA operator: A case in Dali Bai Nationality Borough in Yunnan, China. Acta Ecol. Sin. 2014, 34, 3188–3197. [Google Scholar]
- Zhao, W.; Han, Z.; Yan, X.; Zhong, J. Ecological security pattern construction based on multi-scenario trade-off of ecosystem services: A case study of Wafangdian, Dalian. J. Nat. Resour. 2020, 35, 546–562. [Google Scholar]
- Liu, J.; Yin, H.; Kong, F.; Li, M. Structure optimization of circuit theory-based green infrastructure in Nanjing, China. Acta Ecol. Sin. 2018, 38, 4363–4372. [Google Scholar]
- Yue, D.; Yu, Q.; Zhang, Q.; Su, K.; Huang, Y.; Ma, H. Progress in Research on Regional Ecological Security Pattern Optimization. Trans. Chin. Soc. Agric. Mach. 2017, 48, 1–10. [Google Scholar]
- Yu, Y.; Li, J.; Zhou, Z.; Ma, X.; Zhang, C. Multi-scale representation of trade-offs and synergistic relationship among ecosystem services in Qinling-Daba Mountains. Acta Ecol. Sin. 2020, 40, 5465–5477. [Google Scholar]
- Zhang, W. Dilemma of Multisubject Co-Governance of Global Marine Ecological Environment and Implementation Path. Sustainability 2021, 13, 11145. [Google Scholar] [CrossRef]
- Aguila, Y. Toward a Global Pact for the Environment. Proc. ASIL Annu. Meet. 2020, 114, 217–219. [Google Scholar] [CrossRef]
- Zhong, Q.; Zhang, L.; Zhu, Y.; Konijnendijk van den Bosch, C.; Han, J.; Zhang, G.; Li, Y. A conceptual framework for ex ante valuation of ecosystem services of brownfield greening from a systematic perspective. Ecosyst. Health Sustain. 2020, 6, 17. [Google Scholar] [CrossRef] [Green Version]
- Liu, J.; Li, W. Environmental Pollution and Intergovernmental Tax Competition in China: Based on Spatial Panel Data Model. China Popui Ation Resour. Environ. 2013, 23, 8. [Google Scholar]
- Zhang, Z.; Lu, R.; Wu, S.; Jia, Z.; Wang, N. Heavy Metal Pollution and Health Risk Assessment of Mine Soil in the Yangtze River Economic Belt. Environ. Sci. 2022, 1–15. [Google Scholar] [CrossRef]
- Tan, S.; Liu, Y.; Zhu, X.; Liu, H.; Shao, J.; Deng, H. Output characteristics and driving mechanism of agricultural non-point source (AGNPS) pollutant in plain and valley region of upper Yangtze River, China. Environ. Sci. 2022, 1–17. [Google Scholar] [CrossRef]
- Sun, J.; LI, S.; Zhang, H. The Impact of Urban Issues on Loss of Urban Economic Efficiency. Res. Econ. Manag. 2015, 36, 9. [Google Scholar]
- Chen, W.; Chi, G. Urbanization and ecosystem services: The multi-scale spatial spillover effects and spatial variations. Land Use Policy 2022, 114, 105964. [Google Scholar] [CrossRef]
- Zheng, Q.; Zeng, J.; Luo, J.; Cui, J.; Sun, X. Spatial Structure and Space Governance of Ecological Network in Wuhan City. Econ. Geogr. 2018, 38, 191–199. [Google Scholar]
- Chen, W. A multi-scale assessment of ecosystem health based on the Pressure-State-Response framework: A case in the Middle Reaches of the Yangtze River Urban Agglomerations, China. Environ. Sci. Pollut. Res. 2022. [Google Scholar] [CrossRef]
Figure 1.
Location of Anhui Province.

Figure 2.
Methodology framework and design.

Figure 3.
Spatial patterns of ecosystem services in Anhui Province.

Figure 4.
Ecosystem services correlations in Anhui Province.

Figure 5.
Spatial patterns of integrated ecosystem service values for seven different scenarios in Anhui Province.
Figure 5.
Spatial patterns of integrated ecosystem service values for seven different scenarios in Anhui Province.

Figure 6.
Priority protected areas in Anhui Province under each scenario.

Figure 7.
Spatial pattern of landscape resistance surface in Anhui Province.

Figure 8.
Analysis of the elements of ecological security patterns in Anhui Province.

Figure 9.
Examples of land use composition of pinch points and barrier points.

Figure 10.
Construction of ecological security patterns in Anhui Province.

Figure 11.
Ecosystem service functions of each city in Anhui Province.

Figure 12.
Conflict areas between ecological land and urban expansion.

Figure 13.
Statistical plot of conflict land area between ecological land protection and urban expansion by region.
Figure 13.
Statistical plot of conflict land area between ecological land protection and urban expansion by region.


Table 1.
P and C values of different land use types.
| Land Use Type | Cropland | Forest Land | Grassland | Water Bodies | Construction Land | Bare Land |
|---|---|---|---|---|---|---|
| P | 0.29 | 0.7 | 0.5 | 0.2 | 0.16 | 0.27 |
| C | 0.27 | 0.01 | 0.06 | 0 | 0.2 | 0.35 |
Table 2.
Order layer weight under multiple scenarios.
| Scenario | Risk Factor a | Decision Maker’s Risk Attitude | |||||
|---|---|---|---|---|---|---|---|
| OWA | 1 | 0.0001 | Extremely optimistic | 1.000 | 0.000 | 0.000 | 0.000 |
| 2 | 0.1 | Optimistic | 0.871 | 0.062 | 0.039 | 0.028 | |
| 3 | 0.5 | Relatively optimistic | 0.500 | 0.207 | 0.159 | 0.134 | |
| 4 | 1 | No preference | 0.250 | 0.250 | 0.250 | 0.250 | |
| 5 | 2 | Relative pessimism | 0.063 | 0.187 | 0.313 | 0.437 | |
| 6 | 10 | pessimistic | 0.000 | 0.001 | 0.055 | 0.944 | |
| 7 | 1000 (∞) | Extremely pessimistic | 0.000 | 0.000 | 0.000 | 1.000 |
Note: After standardization, the ecosystem service layers are arranged in descending order of the mean value to obtain w1–w4
Table 3.
Protection efficiency and trade-off of priority conservation areas for ecosystem services.
| Scenario | Risk Factor | Protection Efficiency | Trade-Off | |||
|---|---|---|---|---|---|---|
| Habitant Quality | Carbon Fixation | Water Conservation | Soil Retention | |||
| 1 | 0.0001 | 0.86 | 0.79 | 1.22 | 1.23 | 0 |
| 2 | 0.1 | 0.51 | 0.75 | 1.02 | 2.06 | 0.17 |
| 3 | 0.5 | 2.52 | 0.98 | 1.56 | 0.68 | 0.63 |
| 4 | 1 | 2.44 | 1.32 | 1.70 | 0.79 | 1 |
| 5 | 2 | 1.28 | 2.31 | 1.06 | 1.05 | 0.68 |
| 6 | 10 | 0.56 | 1.66 | 0.44 | 1.88 | 0.07 |
| 7 | 1000 | 0.92 | 1.67 | 0.42 | 1.73 | 0 |
Publisher’s Note: MDPI stays neutral with regard to jurisdictional claims in published maps and institutional affiliations. |
© 2022 by the authors. Licensee MDPI, Basel, Switzerland. This article is an open access article distributed under the terms and conditions of the Creative Commons Attribution (CC BY) license (https://creativecommons.org/licenses/by/4.0/).
Share and Cite
MDPI and ACS Style
Yu, H.; Gu, X.; Liu, G.; Fan, X.; Zhao, Q.; Zhang, Q. Construction of Regional Ecological Security Patterns Based on Multi-Criteria Decision Making and Circuit Theory. Remote Sens. 2022, 14, 527. https://doi.org/10.3390/rs14030527
AMA Style
Yu H, Gu X, Liu G, Fan X, Zhao Q, Zhang Q. Construction of Regional Ecological Security Patterns Based on Multi-Criteria Decision Making and Circuit Theory. Remote Sensing. 2022; 14(3):527. https://doi.org/10.3390/rs14030527
Chicago/Turabian StyleYu, Haoran, Xinchen Gu, Guihua Liu, Xin Fan, Qi Zhao, and Qiang Zhang. 2022. "Construction of Regional Ecological Security Patterns Based on Multi-Criteria Decision Making and Circuit Theory" Remote Sensing 14, no. 3: 527. https://doi.org/10.3390/rs14030527
Note that from the first issue of 2016, this journal uses article numbers instead of page numbers. See further details here.