
Effect of Moisture Content on Calculated Dielectric Properties of Asphalt Concrete Pavements from Ground-Penetrating Radar Measurements


Illinois Center for Transportation, University of Illinois at Urbana-Champaign, Rantoul, IL 61866, USA
*
Author to whom correspondence should be addressed.
Remote Sens. 2022, 14(1), 34; https://doi.org/10.3390/rs14010034
Submission received: 25 November 2021
/
Revised: 19 December 2021
/
Accepted: 20 December 2021
/
Published: 22 December 2021
(This article belongs to the Special Issue Advances in Signal Processing Techniques for Ground Penetrating Radar Applications)
Abstract
:Moisture presence in asphalt concrete (AC) pavement is a major cause of damage to the pavement. In recent decades, an increasing need exists for non-destructive detection and monitoring of the moisture content in AC pavement. This paper provides a simulated approach to quantify the effect of internal moisture content on AC pavement dielectric properties using ground-penetrating radar (GPR). A heterogeneous numerical model was developed to simulate AC pavement with internal moisture at various saturation levels. The numerical model was validated using GPR surveys on cold-in-place recycling treated pavements. An empirical formula was derived from the simulation to correlate the dielectric constant with the moisture content for non-dry AC pavement. The results validated the proposed model and, hence, demonstrated the ability of GPR to monitor moisture variation in AC pavements.

1. Introduction
One of the most influential factors contributing to the deterioration of asphalt concrete (AC) pavements is moisture within the pavement structure [1,2]. Moisture in pavements may enter the pavement structure in ways such as infiltration through the pavement surface at cracks, joints, and shoulders, as well as through interrupted aquifers, springs, and drainage. Excessive moisture in AC pavements can cause stripping, which leads to the breaking of the adhesive bond between the aggregate surface and asphalt binder film, resulting in pavement weakness and disintegration, including potholes, cracking, and raveling [3]. In some cases, such as the cold-in-place recycling (CIR) treatment of asphalt pavements, monitoring the moisture content until it drops to a specific threshold value is necessary before opening the road for traffic and/or placing the pavement overlay [4,5]. Thus, a need exists for moisture content monitoring in the asphalt pavement.
Two methods—coring and nuclear gauge—are traditionally used to measure the moisture content of pavement [6,7]. Both methods have limitations. Coring is destructive to the pavement, and it reflects the moisture information only at the locations where the cores are taken. The nuclear density gauge uses radioactive material. It requires special licensing to transport and operate, which leads to increased operational costs. In addition, the measurement accuracy of the moisture content by the nuclear gauge was affected by the asphalt content of the pavement [1]; hence, it has not been commonly used for this application.
Ground-penetrating radar (GPR), on the other hand, has a potential for such application. It is a non-destructive testing method based on the propagation and reflection of electromagnetic (EM) waves. It has been widely applied in geoscience and civil engineering [8,9,10,11,12,13,14,15,16,17]. Over the last decades, many studies have already demonstrated the high sensitivity of GPR to water in soil and building materials [18,19]. The relative permittivity or relative dielectric constant, which is commonly used as the dielectric constant, is a critical material property in the practical application of GPR measurements. The dielectric constant is 1 for air and approximately 81 for pure water at 20 ℃. For AC pavement, the dielectric constant is in the range of 3–12. Therefore, a relatively small increase in moisture content could alter the bulk dielectric constant of AC materials. Hence, GPR could be feasible for moisture prediction in AC pavements [20,21].
One challenge arises for AC pavement moisture content monitoring—the complicated nature of water inside asphalt pavement. The dielectric properties of water change with the environment temperature and the frequency of GPR [22,23]. In addition, free water may not be evenly distributed along the pavement layer [24,25]. The non-uniform moisture distribution makes the accurate estimation of moisture content more difficult.
Given the complexity of estimating moisture content using GPR, numerical modelling and simulations were used to better understand the effect of internal moisture content in AC pavements. The finite-difference time-domain (FDTD) method, to simulate EM wave propagation, has been successfully used to interpret GPR data [26,27,28]. The simulations include underground objects, such as faults and caves, tunnels, pipes, and landmines as well as the assessment and inspection of railroad ballast and bridge decks [26,29,30,31,32]. The FDTD method allows simulation of a considerable number of samples from the same initial mixture components and properties. Recently, Al-Qadi et al. applied the FDTD method to evaluate the dry AC pavement dielectric properties [28], asphalt pavement compaction monitoring and pavement surface moisture removal [33]. This work extends the aforementioned effort to predict the internal moisture of AC mixture.
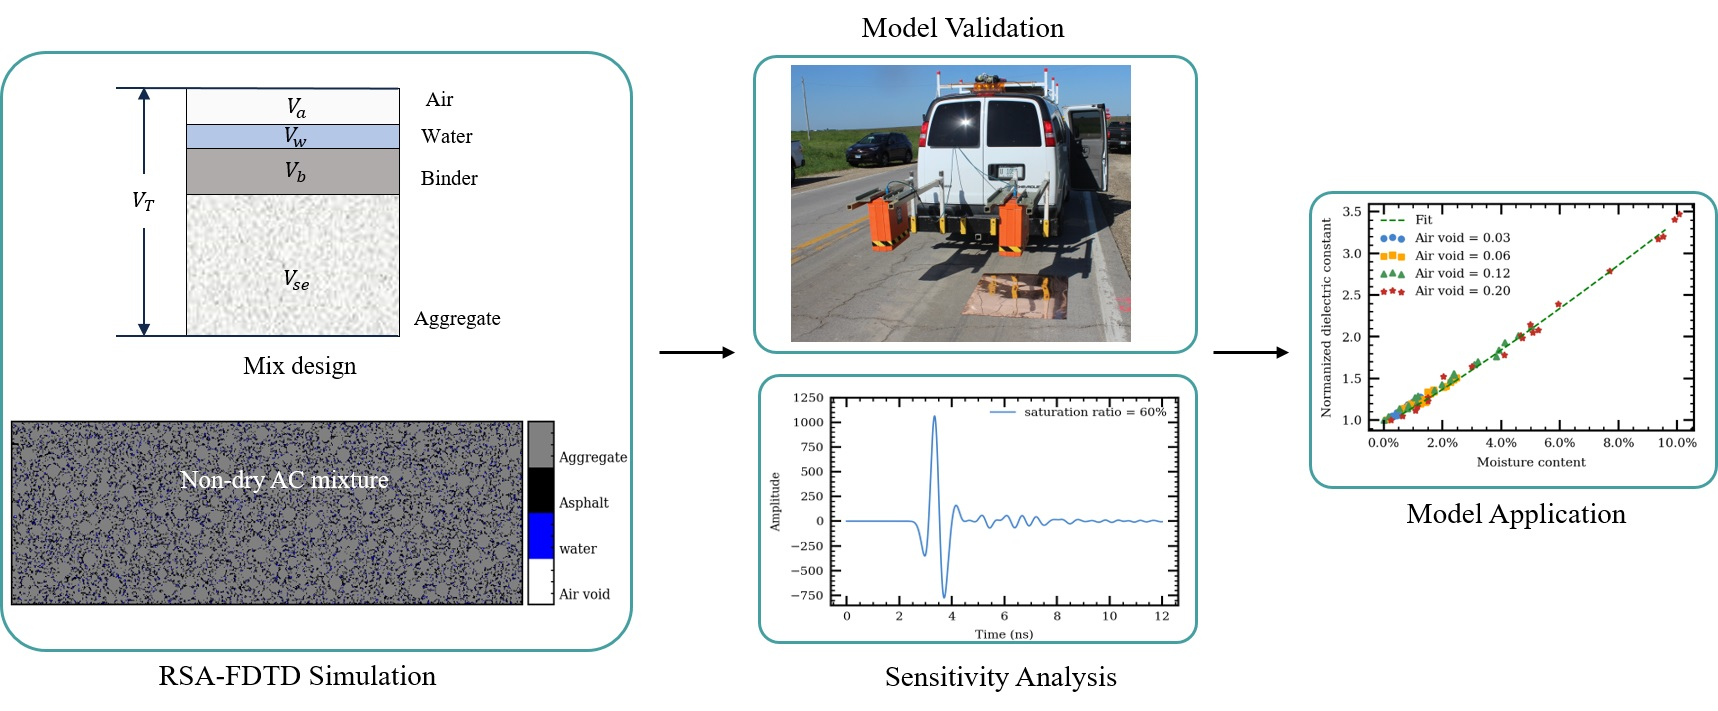
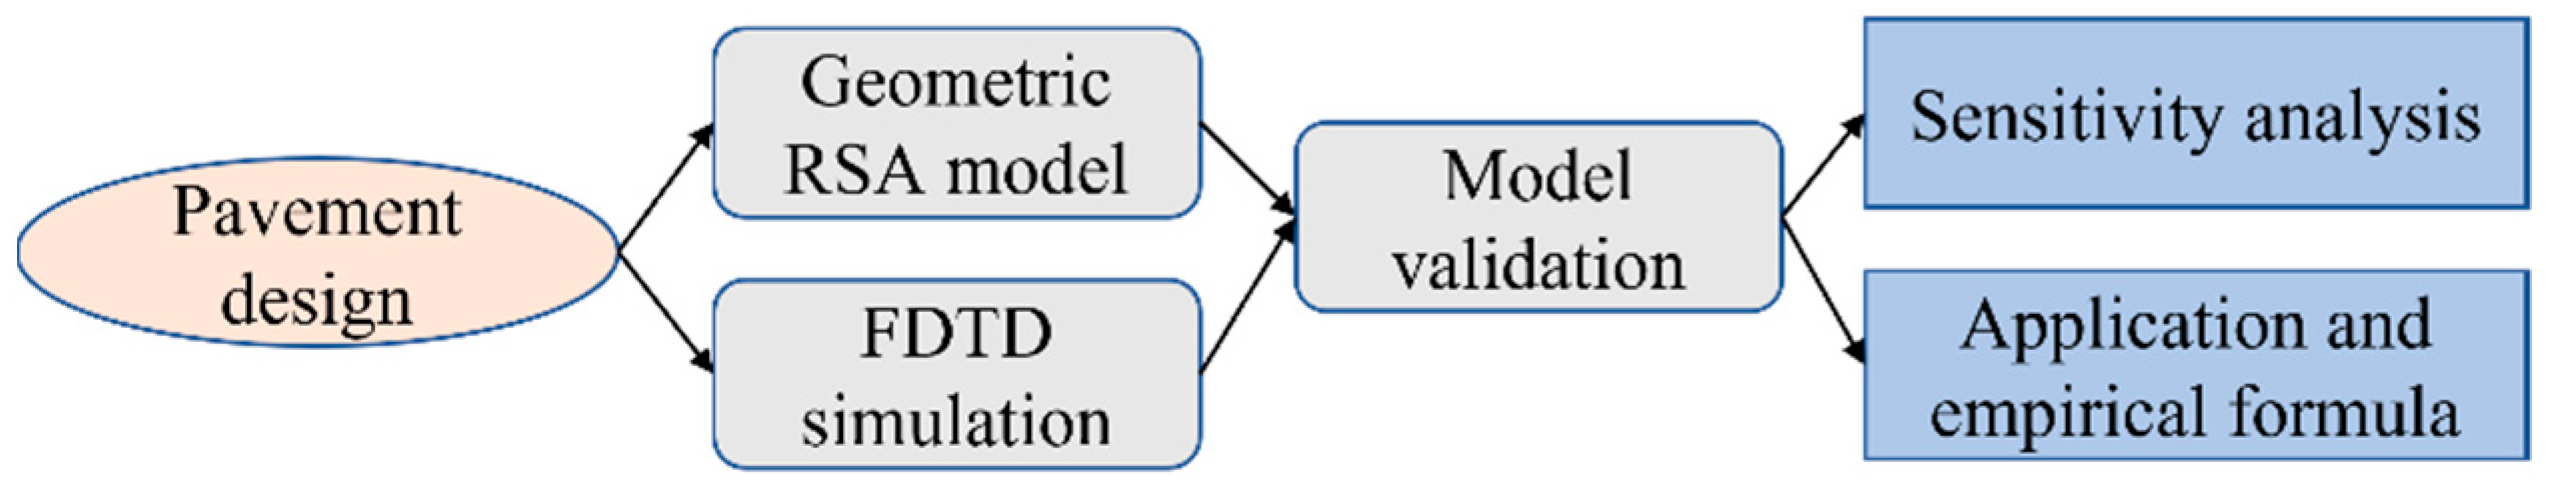
The objective of this paper is to develop and validate a simulation model of GPR surveys on a heterogeneous and non-dry AC mixture to allow studying the effect of internal moisture content on reflected GPR signals. To achieve that, a four-phase heterogeneous model—aggregate, binder, water, and air voids—of AC pavement was randomly generated based on the mixture volumetric properties. An FDTD model was developed to simulate virtual GPR surveys on AC pavement. Experimental data from field tests were used to validate the simulation model. The effects of moisture content on GPR signals and mixture dielectric constant were investigated. In addition, a quantitative relationship between moisture content and bulk dielectric constant was derived from simulation and an application for moisture content prediction was presented herein. A flowchart of the proposed method is shown in Figure 1.
2. Simulation of Ground-Penetrating Radar Surveys on Non-Dry Asphalt Pavement
Discrete element method (DEM) and finite element method (FEM) are two numerical techniques that are widely used to conduct micromechanical analysis of heterogeneous materials such as AC mixture. The DEM and FEM are mostly used to study the mechanical properties of AC mixture [34]. The finite-difference time-domain (FDTD) method, on the other hand, concentrates on the simulation of electromagnetic (EM) wave propagating in the material, and not the mechanics of the aggregates’ interlocking. Hence, the model needs to provide an effective and accurate simulation of volumetric properties of each component in a 2D space. The theoretical background of the heterogeneous FDTD model is the dielectric mixing theory, which uses volume fractions and the dielectric constant of each component of the heterogeneous material to derive an approximate of the material’s bulk dielectric constant. An accurate density prediction method for dry asphalt pavement has been extensively studied by Al-Qadi and coworkers [11,15,27,28,33,35], based on the dielectric mixing theory. The presented work shows a numerical implementation of mixing theory in FDTD simulation and extends the numerical model from simulating dry asphalt mixture to wet asphalt mixture.
Among the limited studies on heterogeneous numerical models of construction material using the FDTD method, Lachowicz and Rucka [36], and Zadhoush et al. [37] developed heterogeneous numerical models of concrete materials. However, simulated aggregates in concrete overlapped; thus, precise volumetric properties of components cannot be guaranteed, hence hindering their application for investigating dielectric properties of AC mixture. Benedetto et al. [26] proposed a random sequential adsorption (RSA) method for railway ballast simulation, which allows non-overlapping particle generation. Cao and Al-Qadi [28] later developed a similar method for generating a heterogeneous numerical model of dry asphalt mixture, which is composed of aggregate, asphalt binder, and air voids. The presented work extends the model to simulate GPR surveys on non-dry asphalt pavement.
In this paper, the development of a heterogeneous AC mixture dielectric model was performed in two steps. First, a geometric model of a heterogeneous AC mixture was developed based on the RSA method. Then, the geometric information of the generated model was imported to GprMax [38]. A FDTD method was used to simulate GPR surveys on AC pavement. The AC dielectric constants were calculated from the received GPR signals.
2.1. Geometric Model of a Heterogeneous AC Pavement with Internal Moisture
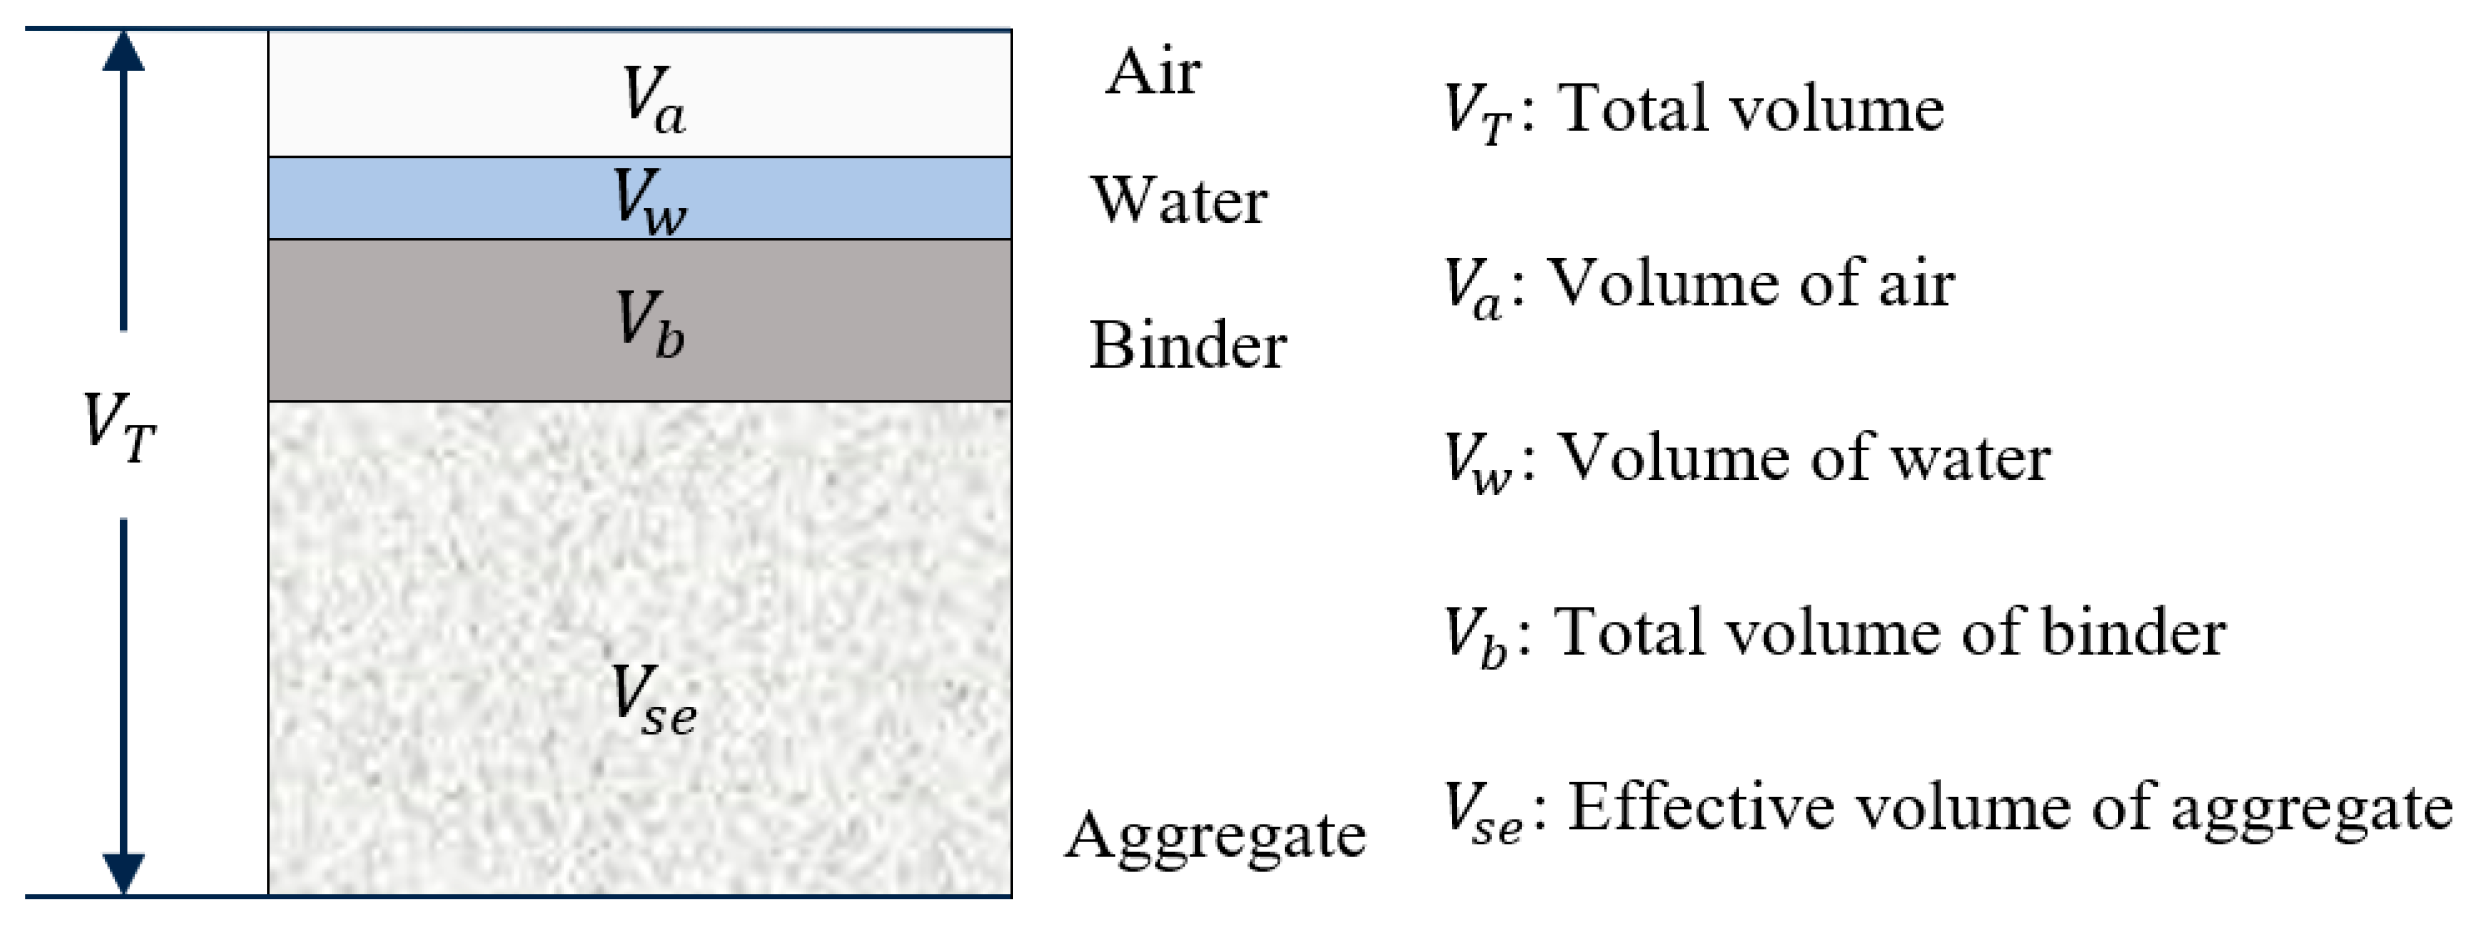
The dry AC mixture is composed of aggregate, asphalt binder, and air voids. Once the AC mixture is saturated, the air void space is replaced by water. Figure 1 shows a phase diagram of the AC mixture with internal moisture. The volumetric contributions of each component to the entire mixture are represented by .
The saturation ratio, , is defined as the ratio between the volumes of water and all voids (water and air voids) (Equation (1)). From Figure 2, the volume of voids in AC mixtures is the summation of the volumes of the air voids, , and water, .
Moisture content indicates the quantity of water contained in the AC mixture. It is defined as the ratio between the weights of water, , and the dry asphalt mixture, . The relationship and its derivation between the moisture content, , and saturation ratio is shown in Equation (2).
Here, is the density of water, and is the density of the dry AC mixture. is the percentage of air voids before moisture saturation. is the bulk specific gravity of the AC, and is the theoretical maximum of the specific gravity of AC.
The geometry of heterogeneous AC mixture model was developed based on the RSA method [26,28,39]. Sets of spherical particles were randomly generated in a way that the distribution of the sphere diameters is coherent to the distribution of the aggregate gradation. Given that aggregate shape has no effect on GPR measurement at the considered central frequency and AC aggregate size, aggregate can be safely simulated as spheres [28,37]. Then, each particle was positioned in the geometrical domain following the RSA algorithm so that no particles were overlapped. The detailed development procedures are summarized as follows:
According to the prescribed pavement layer thickness, aggregate gradation, and sample size, calculate the number of particles corresponding to each sieve fraction.
The 2D coordinates of the spherical particles within the simulation domain are randomly generated. The radii of the particles are chosen as the mean values between the adjoining sieve sizes. If an attempt to deposit a particle would result in an overlap with any already deposited particles, the attempt is rejected. Otherwise, the particle is irreversibly adsorbed. Thus, its position becomes fixed and cannot be moved from the model. Its coordinates and radius are stored in a list of adsorbed particles. For particle with its coordinates , , and radius , and particle with its coordinates , and radius , the nonoverlap condition required .
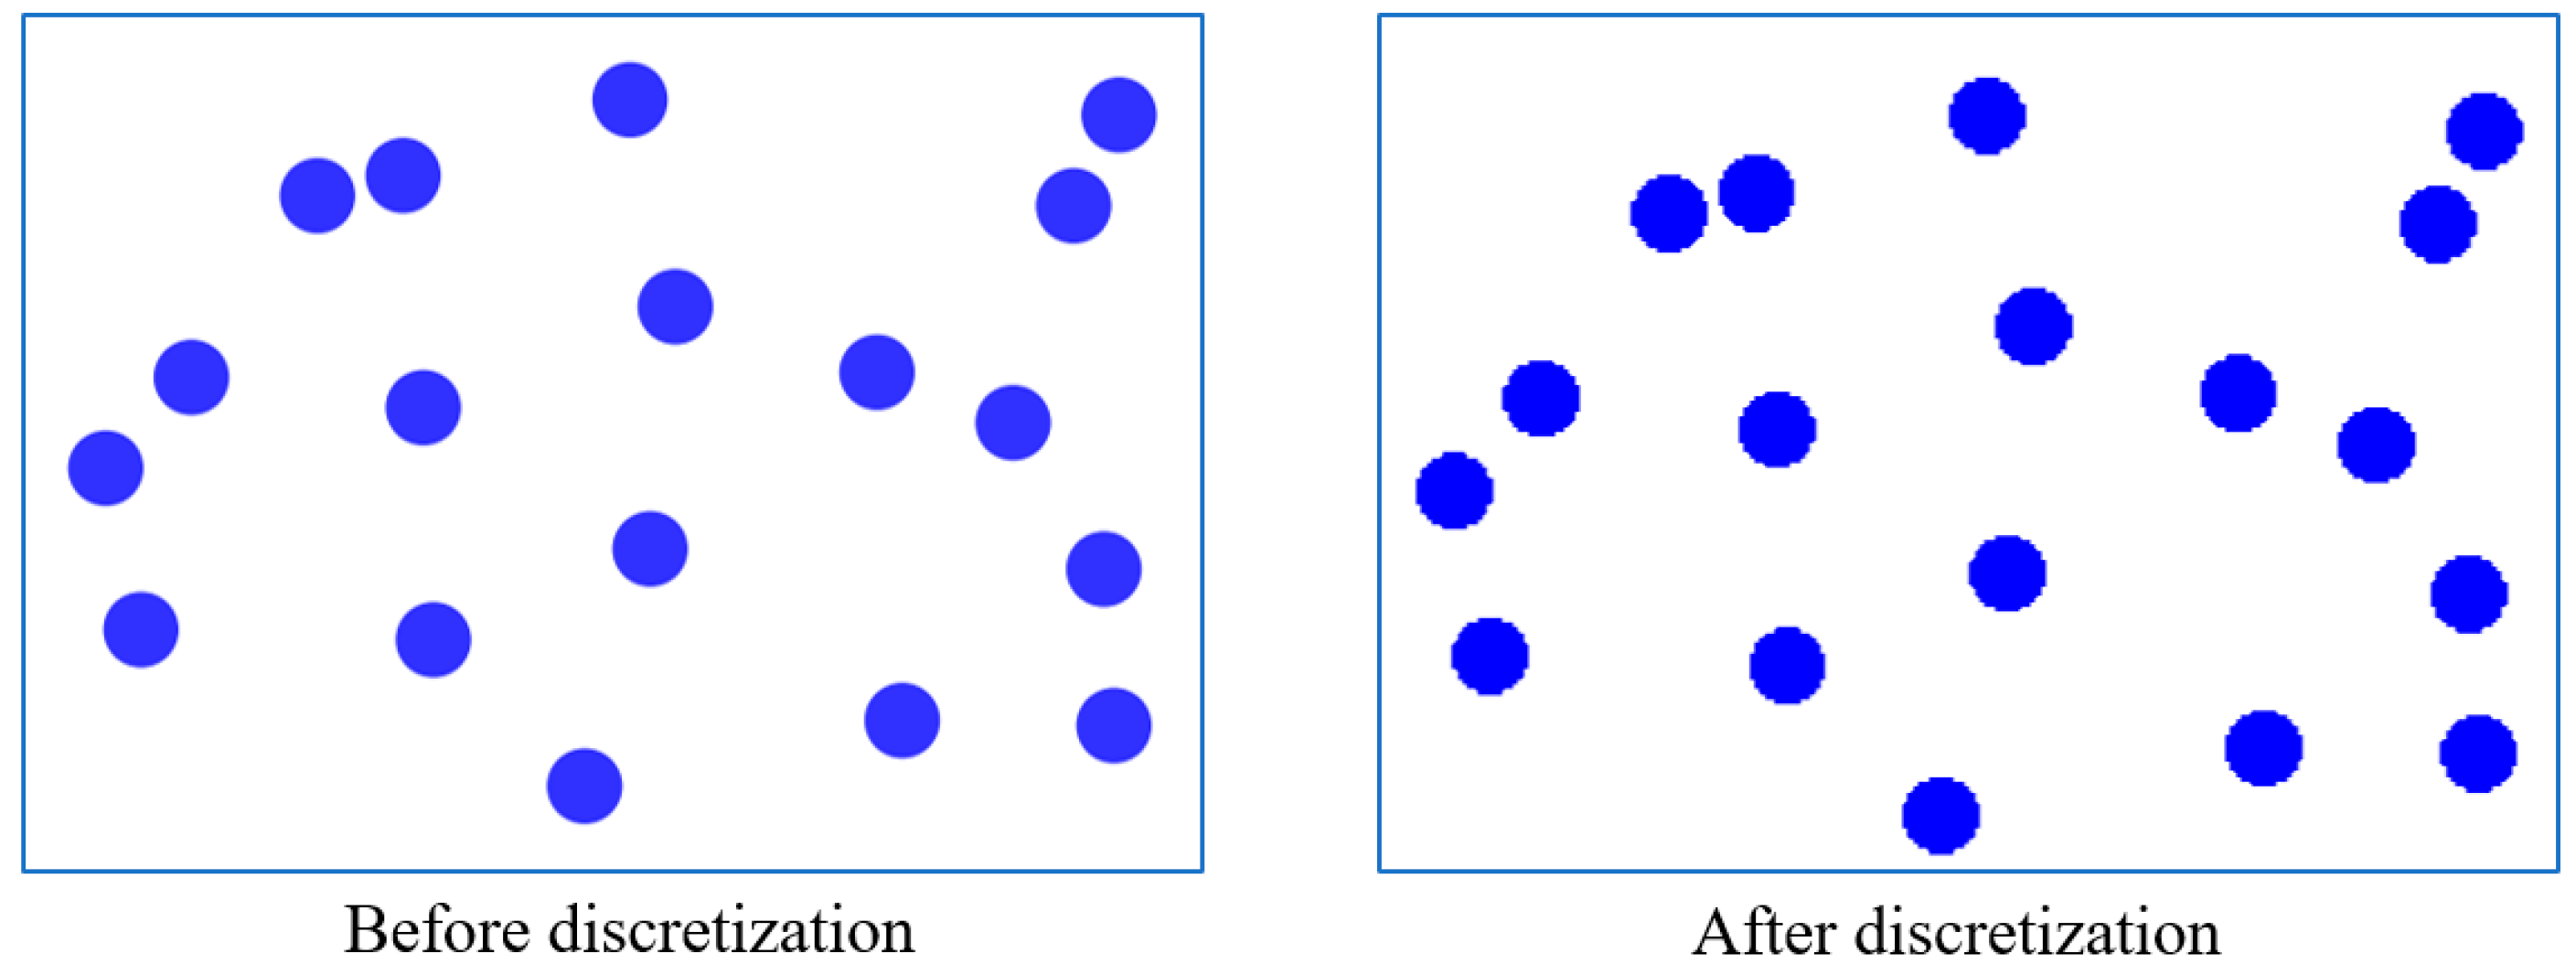
To accommodate to the grid shape in the FDTD model in the next step, the simulation domain is discretized using elements of a unit square, and the generated spherical particles are approximated using the unit squares. Figure 3 shows an example of the particles before and after the discretization. According to the RSA algorithm, the simulation domain will reach to a jamming limit in which no particles can be adsorbed any more [39]. Given that the depositing particles are polydisperse, the jamming usually occurs during the generation of fine aggregate. Once the jamming limit is reached, the aggregate gradation is checked, and unit squares are complemented as fine aggregate. After the generation of aggregates, the positions of unit squares are stored and labeled as aggregate.
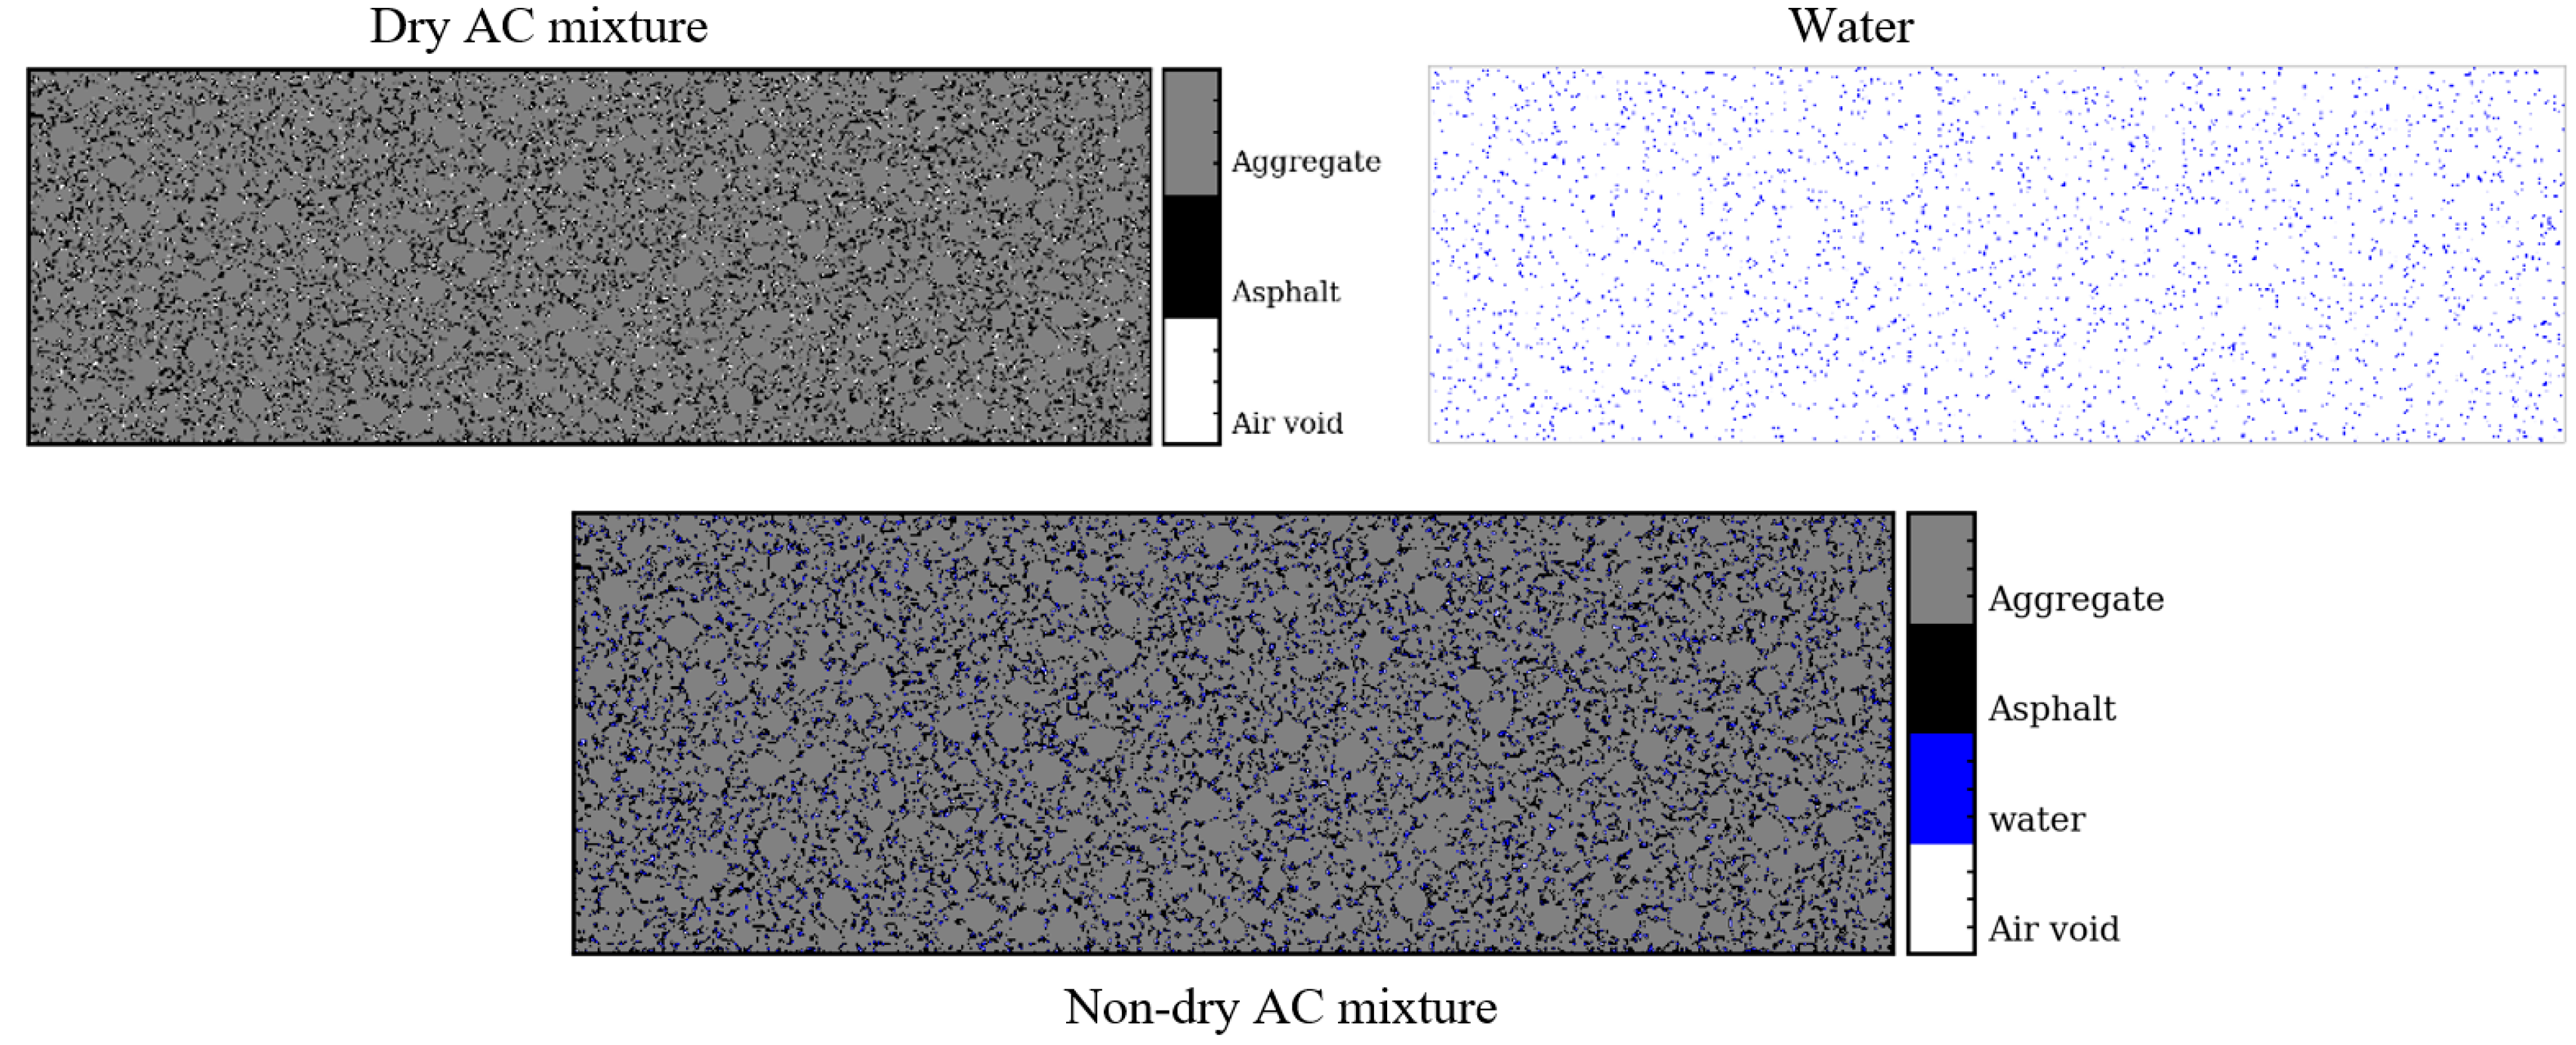
The region in the simulation domain, not occupied by aggregates, is set as the “effective” asphalt binder, which is not adsorbed by the aggregate. It should be noted that the actual volume of aggregate is greater than the one used in the model because of the adsorbed portion of the asphalt binder by the aggregate. Air voids are generated by deleting the asphalt binder elements randomly. Then, parts of air voids are converted into moisture elements according to the saturation ratio. The positions of unit squares belonging to each material are stored and labeled.
Figure 4 shows the generated dry AC mixture, water distribution, and compound of these two—an AC mixture with internal moisture. The output of the numerical modeling was encoded in a zipped data file. The file includes all the geometric information of every component in AC pavement and the label information of geometric coordinates. It can be read into the FDTD model without losing accuracy in the next stage.
2.2. Simulation Using Finite-Difference Time-Domain Method
To simulate EM waves interacting with heterogeneous AC pavement, the aforementioned geometric model of the AC mixture was embedded into a numerical model that reproduces GPR surveys by the FDTD technique [40]. The FDTD method, also known as Yee’s algorithm, is a differential equation-based solver that provides numerical solutions for Maxwell’s equations in complex geometries. The FDTD method uses the second order accurate derivatives in space and time. It utilizes a mesh built from the rectangular, or Yee, cells in which field values are updated time-step by time-step as EM waves propagate through a structure. In this paper, 2D FDTD simulations were performed considering the computational intensity of 3D simulations. Two-dimensional FDTD simulations have been proven to have similar results as those of 3D simulations for the considered application [26,27].
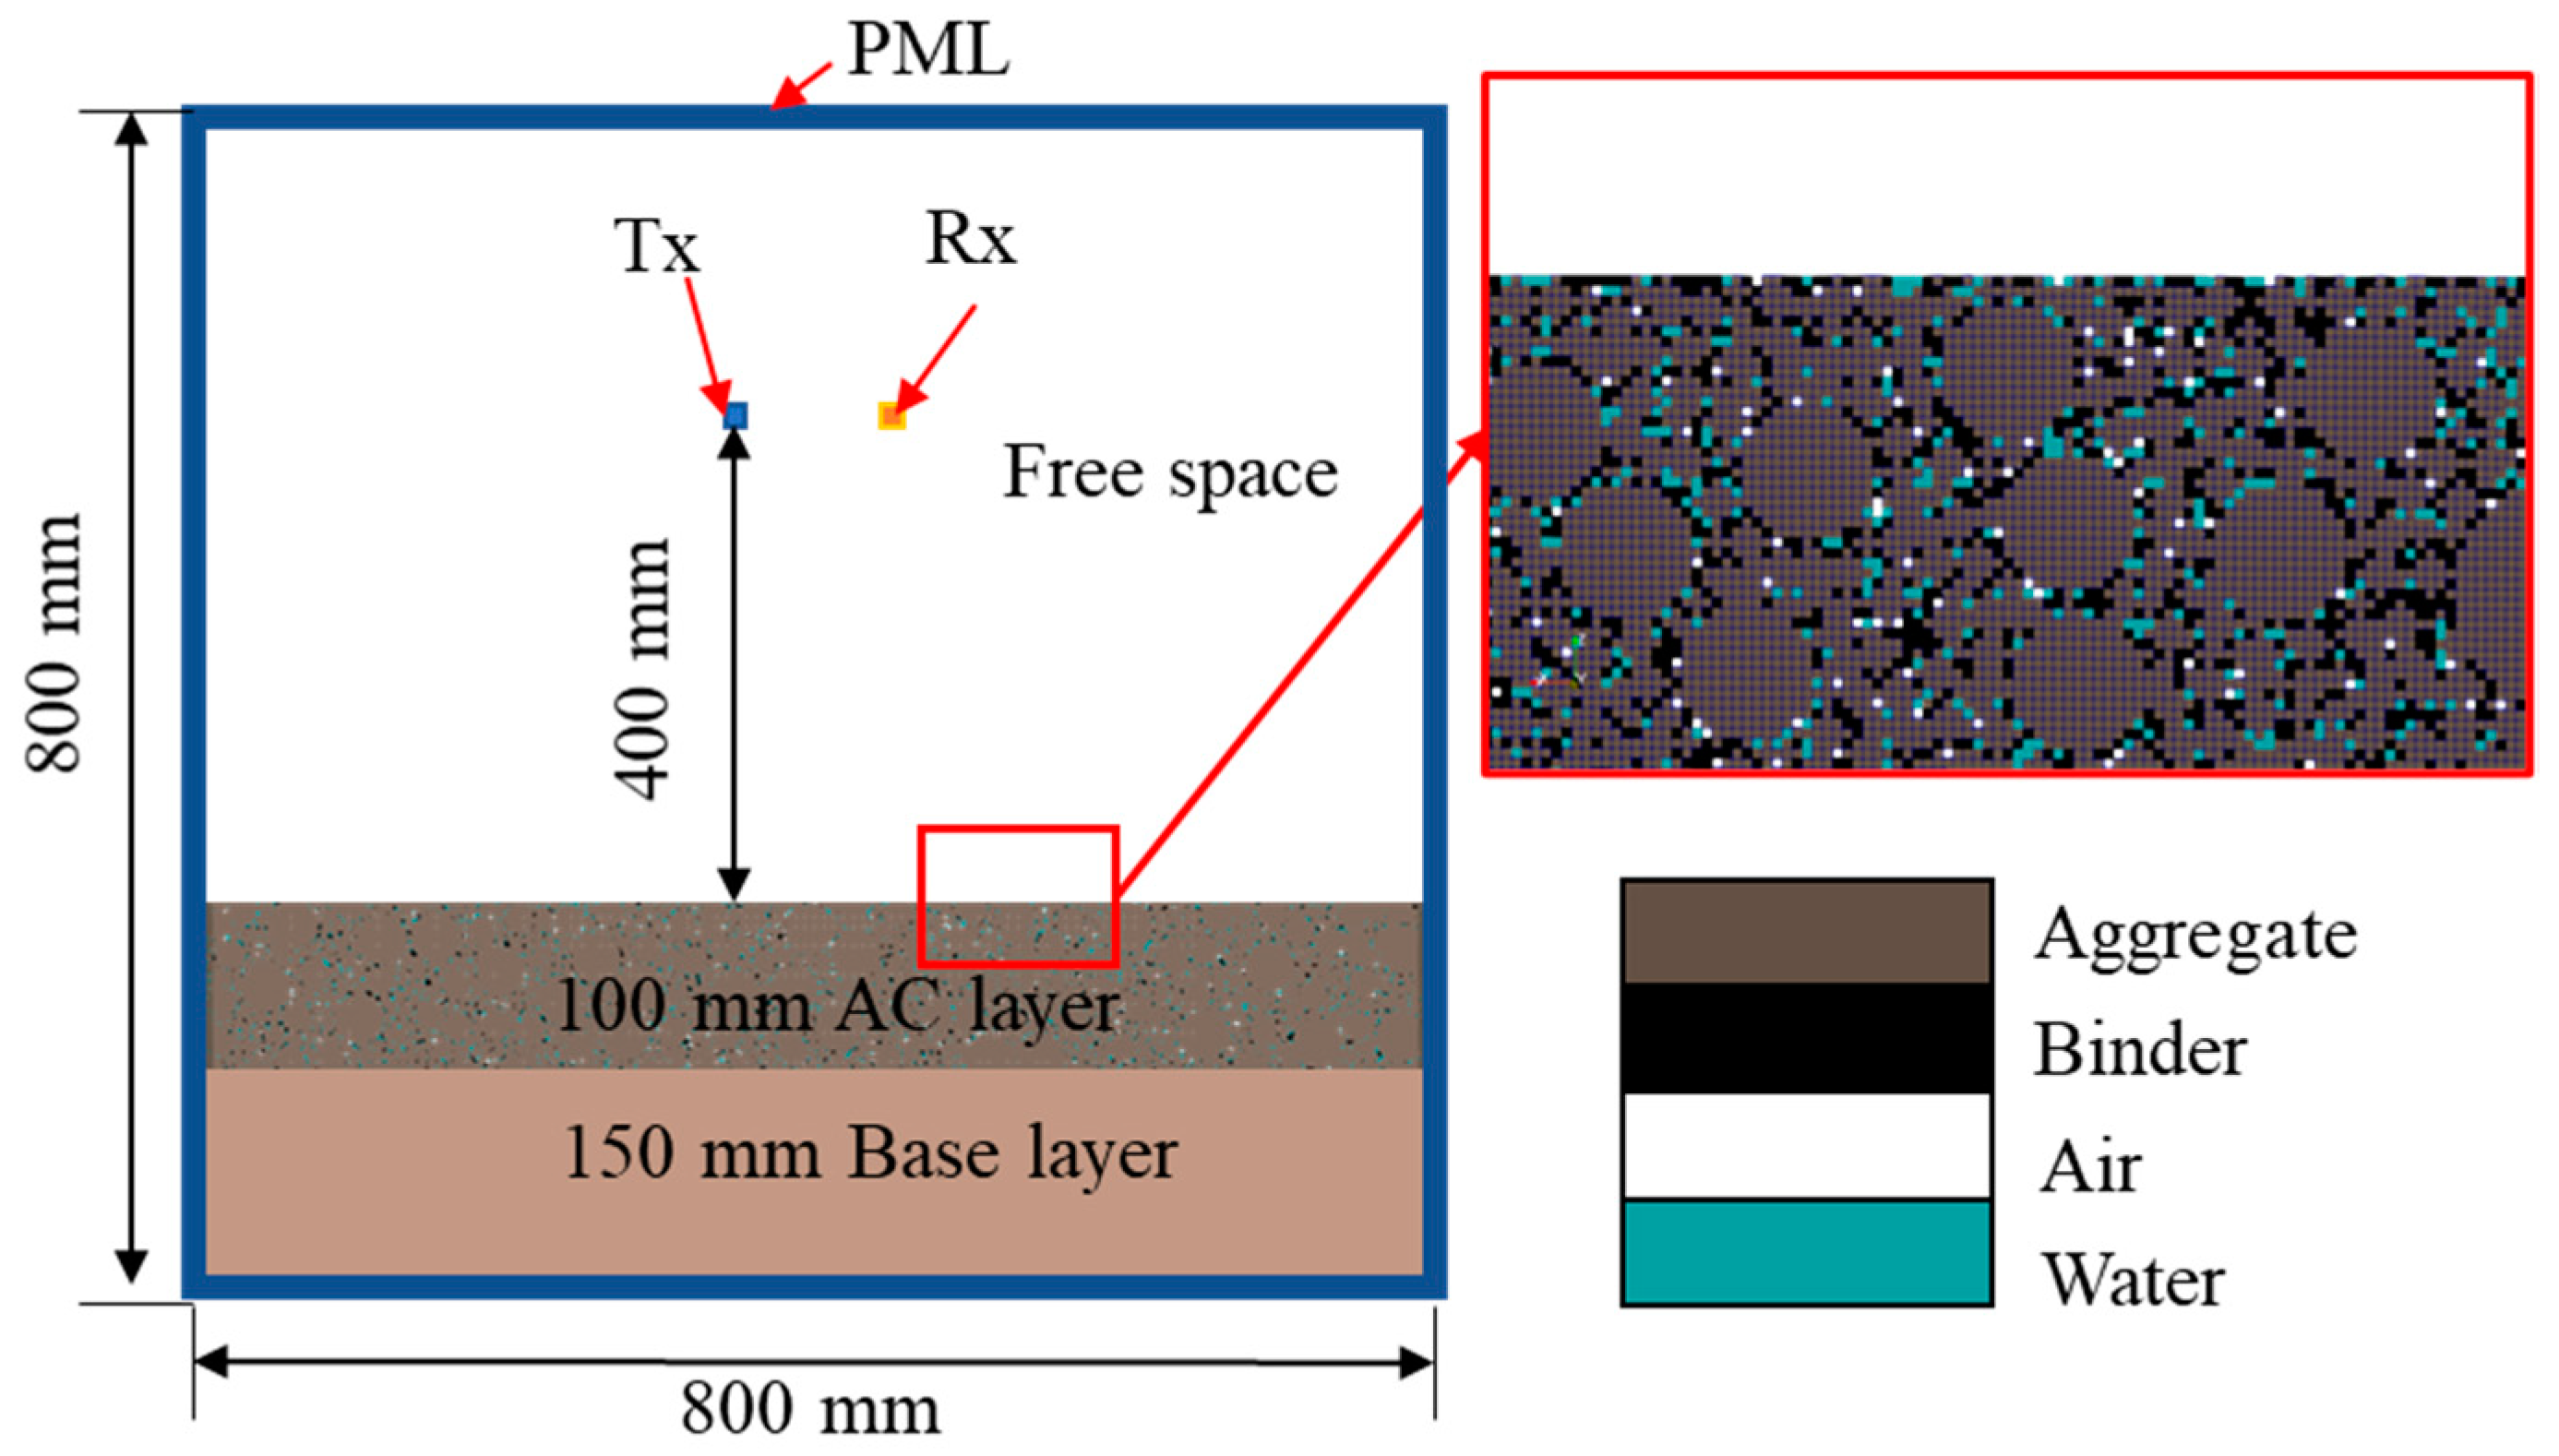
A virtual 2D AC pavement with AC surface and base layers was constructed in GprMax. The AC layer was replaced with the heterogeneous model generated by the RSA method. The diagram of the FDTD model is shown in Figure 4. Tx is the transmitter antenna, and Rx is the receiver antenna. Depicting the actual distance between the transmitter and receiver, the distance between the transmitter and receiver antennas was set at 0.38 m in the simulation. The excitation of the antenna was a hertzian dipole with the Ricker function as the excitation signal. The model was discretized using a grid with spatial steps of . The perfect matched layer (PML) was used to cancel out any reflections upon its interface. The model with PML can simulate the EM wave propagation in an infinite space [41]. Model dimensions are shown in Figure 5.
After the geometry of the FDTD model was determined, dielectric properties of the materials were assigned to the model. The AC layer contains the elements of aggregate, binder, water, and air voids generated using the RSA method. Dielectric properties of aggregate, binder, and air are not subjected to the change of temperature and frequency in the GPR frequency range. Thus, they are assumed to be constant. The dielectric constants are 3 and 1 for the binder and air, respectively [11]. The dielectric constant of the aggregate can be back calculated from the field samples through an iterative process to minimize the deviation between real and virtual GPR measurements [28] or it could be obtained from a database [35].
Different from aggregate, binder, and air, which are non-lossy materials, the dielectric property of water, , is more complicated as it is a lossy material. The dielectric property of pure water, subjected to variation in frequency and temperature, can be well represented by the Debye relaxation function (see Equation (3)) [22,23]. The real part, , is a dielectric constant, which shows the ability of an object to store electrical energy in an electric field. The imaginary part, , is called a loss factor, which is associated with the dielectric loss. The loss factor can be related to the conductivity, , of the material. Their relations are shown in Equation (3).
Here, is the frequency, provided in Hz. is the zero-frequency relative dielectric constant, and is the dielectric constant at infinite frequency. is the Debye relaxation time, and .
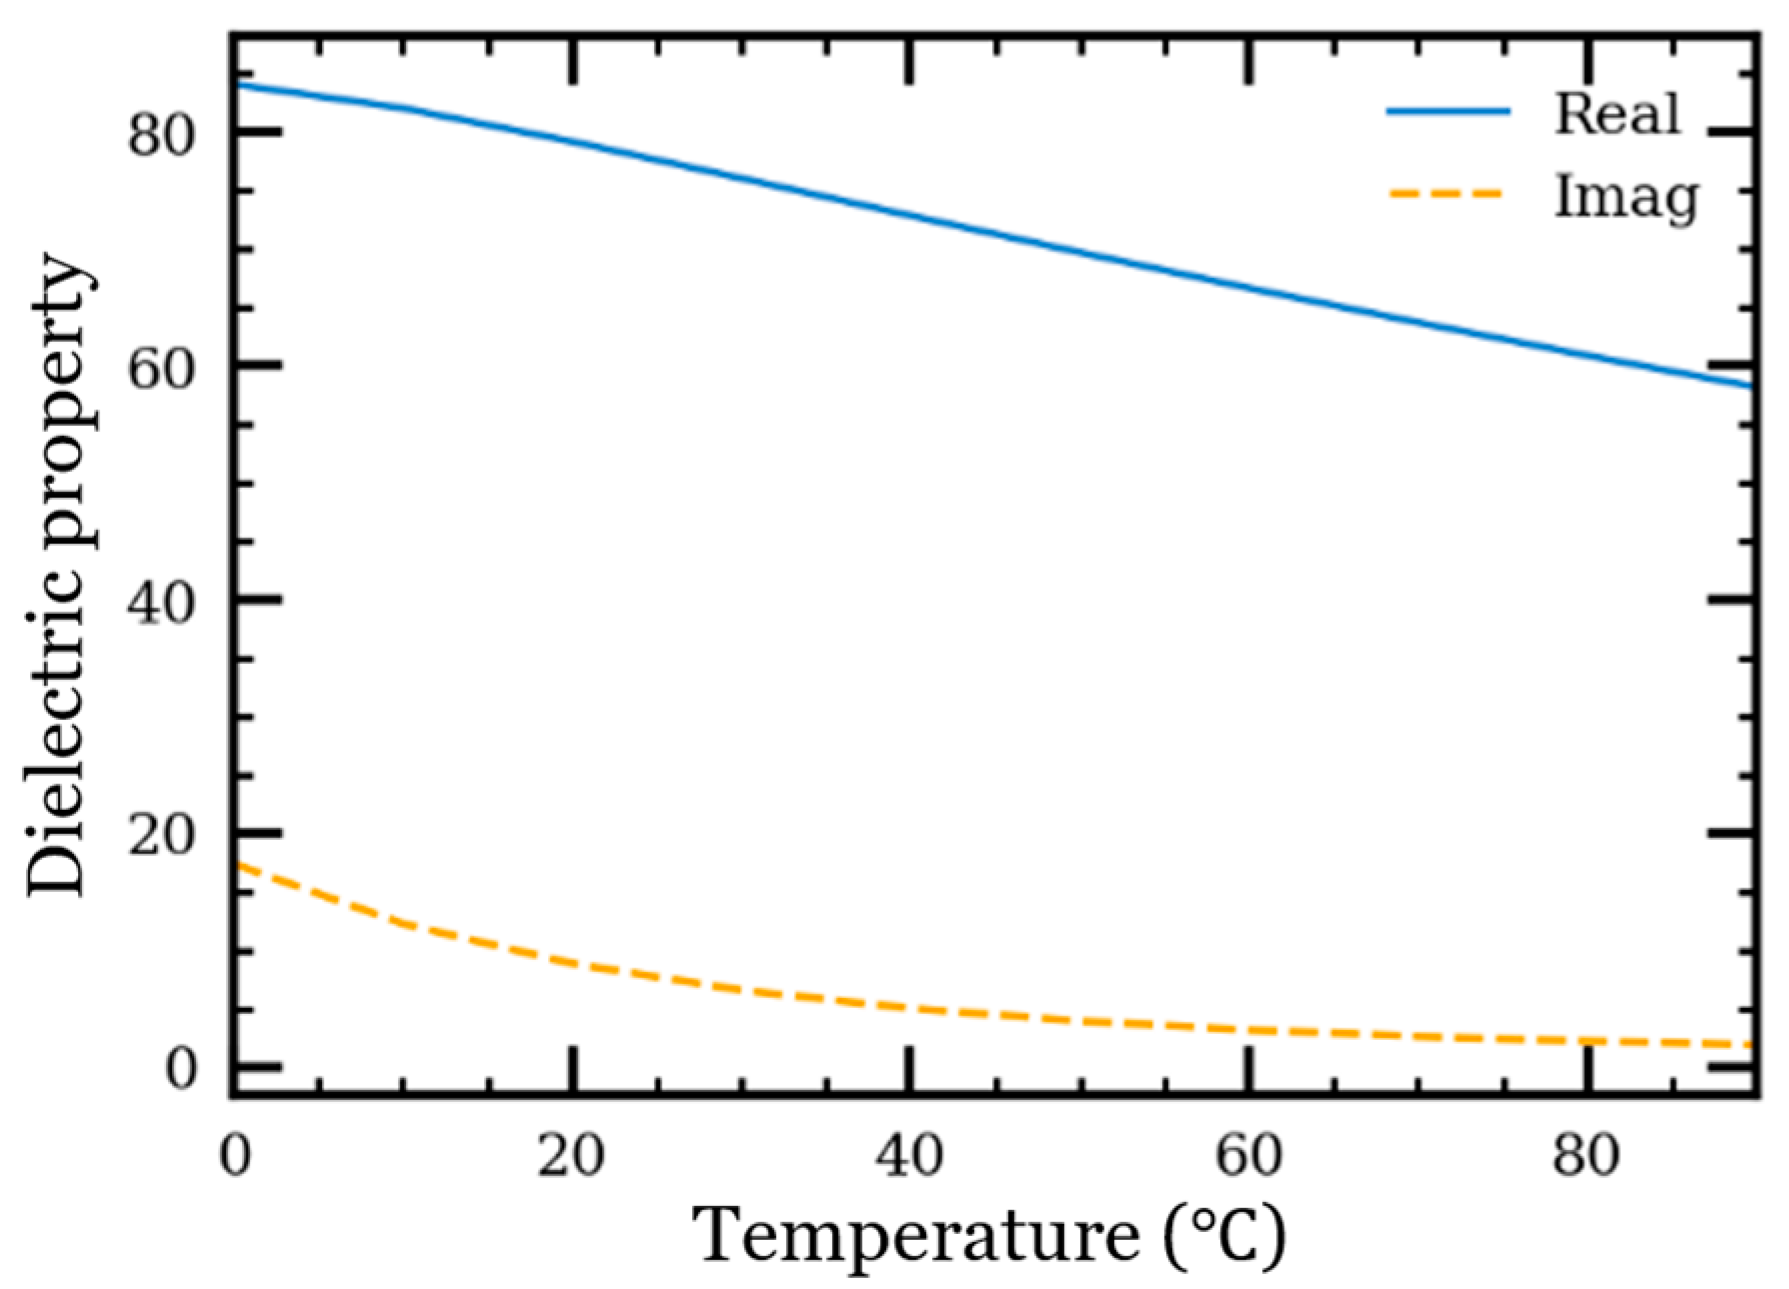
, , and are temperature-dependent. Using the empirical formulas derived by Kaatze, the dielectric property of pure water as a function of temperature in 2 GHz is shown in Figure 6 [18]. The loss factor of pure water is much smaller than the dielectric constant, and it remains almost constant when the temperature is higher than 40.
2.3. Dielectric Constant Calculation
The reflection amplitude (RA) and two-way travel time (TWTT) methods were used to calculate the dielectric constant of the AC mixture. For the RA method, simulations were performed on the numerical models of AC pavement and pavement with a prefect electricity conductor on the top. The amplitude of the EM wave reflected from the top of the AC layer and the copper plate are recorded as and , respectively. The dielectric constant of the AC pavement layer can be calculated using Equation (4), according to the Fresnel theory [35].
The TWTT method derives the material’s dielectric constant from the average velocity of EM waves in the material. The travel speed of EM waves in AC pavement is calculated using the known pavement layer thickness, , and the time interval, , between pulses reflected from the top and the bottom of the pavement layers, where c is the speed of light (see Equation (5)). The TWTT method uses the average speed of an EM wave within the material, so the dielectric constant measured using this method is the average or bulk dielectric constant of the material [9].
3. Numerical Model Validation
3.1. Construction Site for GPR Investigation
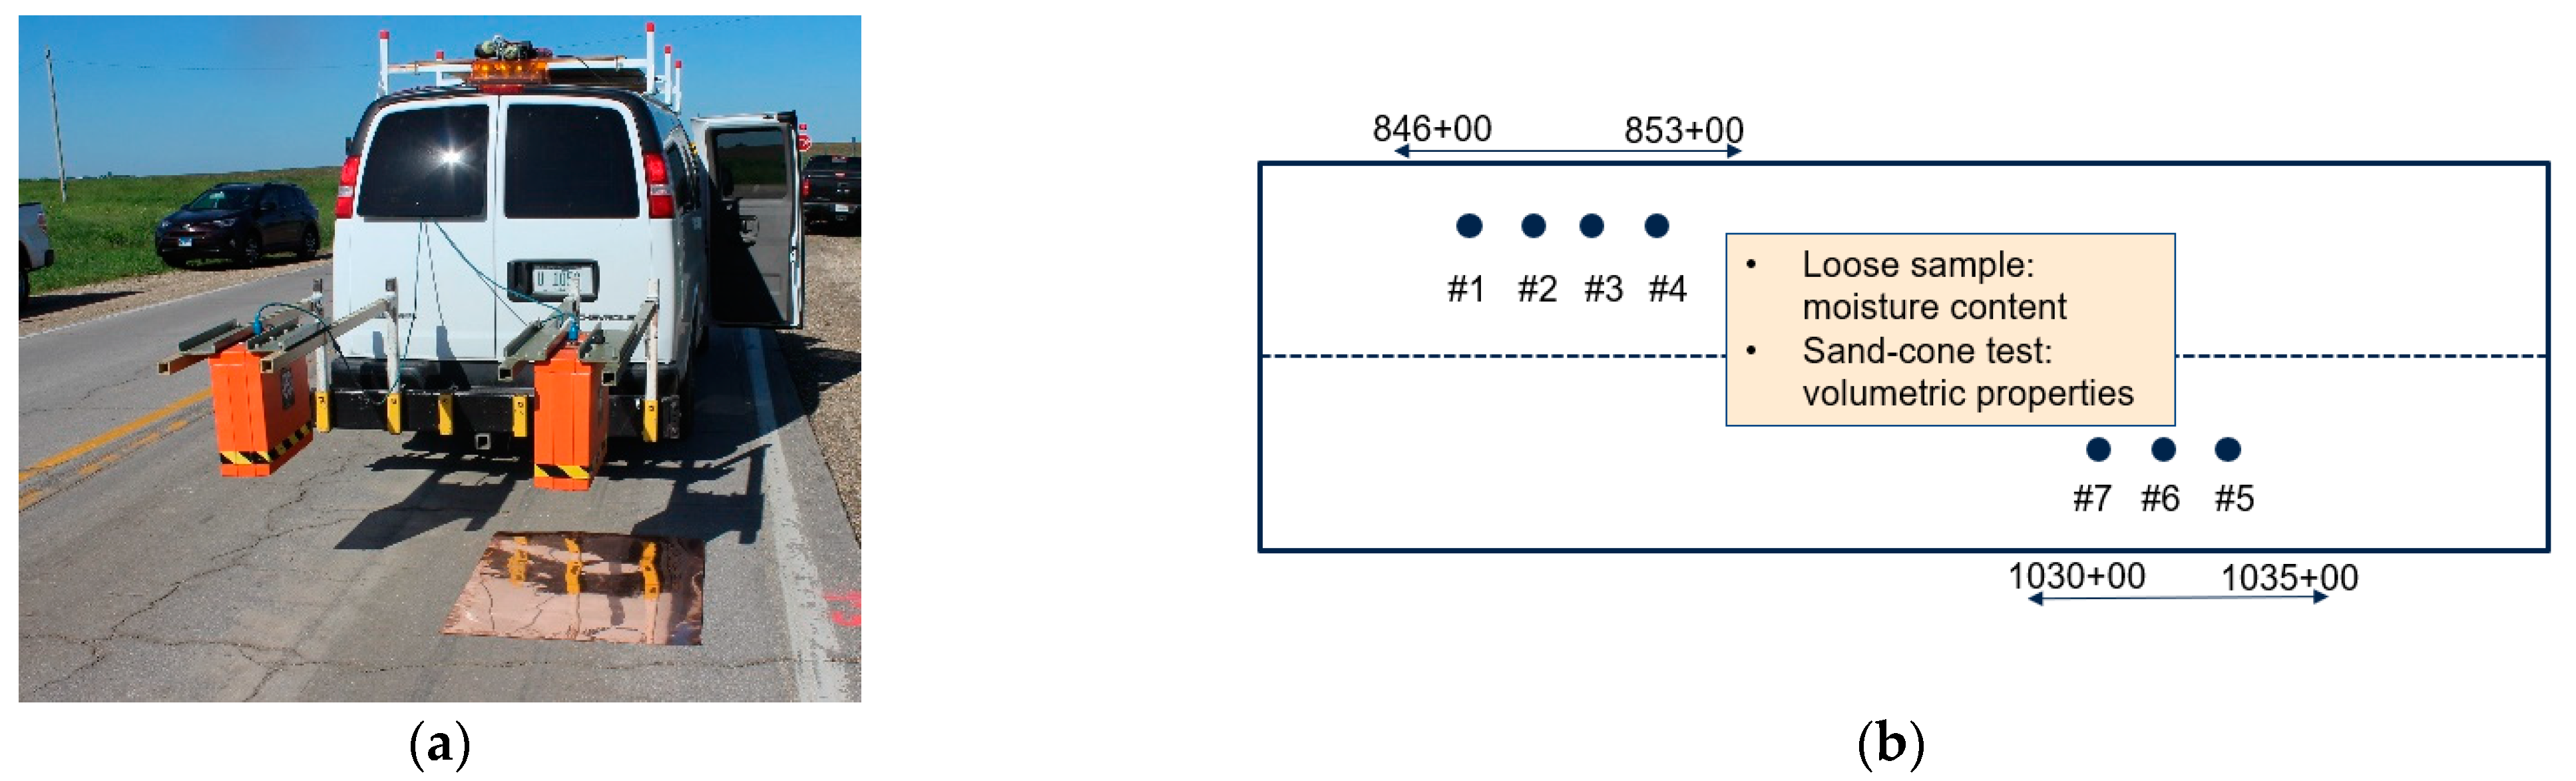
To validate the numerical model, an investigation was performed on Illinois Route 61 cold-in-place recycling (CIR) construction site in May 2020 (Figure 7a). GPR surveys were performed after the paving and compaction of the CIR layer. Air-coupled horn antennas with a central frequency of 2 GHz, manufactured by Geophysical Survey Systems, Inc., were used in the study. The testing parameters are summarized in Table 1. During the CIR treatment, emulsions were added to ease the mixing and placement of the aged reclaimed asphalt pavement (RAP) [4,5]. Once an asphalt emulsion is mixed with the RAP, the water would start to break away from the emulsion, behaving as free water. The emulsion residue would behave like asphalt binder after the evaporation of the free water during the curing process. GPR measurements were taken during the curing process, which allowed monitoring the evaporation of internal moisture. The CIR layer moisture content evaporation is an important indicator of pavement strength-gaining [5].
The existing pavement was Portland cement concrete (PCC) pavement overlayed by AC overlay. The proposed CIR treatment included AC surface removal, 100 mm cold in place recycling, followed by 38-mm AC overlay. The information from the field test is summarized in Table 1. The aggregate gradation of CIR mixture is shown in Table 2. After compacting the CIR pavement layer and before the AC overlay surface placement, static GPR measurements were conducted on seven locations until the moisture content of CIR threshold was reached (Figure 7b). Sand cone tests were also conducted at the same locations to obtain the volumetric information of the CIR mixture and used for the validation of the numerical model.
According to the test and mixture information, the geometry of heterogeneous CIR pavement layer was generated and input into the FDTD model. Two sand cone samples from Location 2 were used to calibrate the material dielectric properties of numerical model. Air voids and moisture content were obtained from the sand cone test results. The dielectric constants of AC pavement were predicted at the adjacent locations where the two samples were taken. Using Equations (1) and (2), the volume of the air voids and the water inside the pavement could be calculated. The volumetric data were incorporated into the numerical model to obtain a simulated dielectric constant of AC pavement in virtual GPR measurements. This process allowed the back-calculation of water dielectric constant, , and the substitute dielectric constant of the aggregate-binder component, . The back-calculated dielectric constant of water is close to the value used in the previous simulation study [36]. The loss factor of water, , is chosen from Figure 5 because of the small change in the loss factor in the field temperature range, like the ambient temperature being around .
3.2. Validation of the Numerical Model
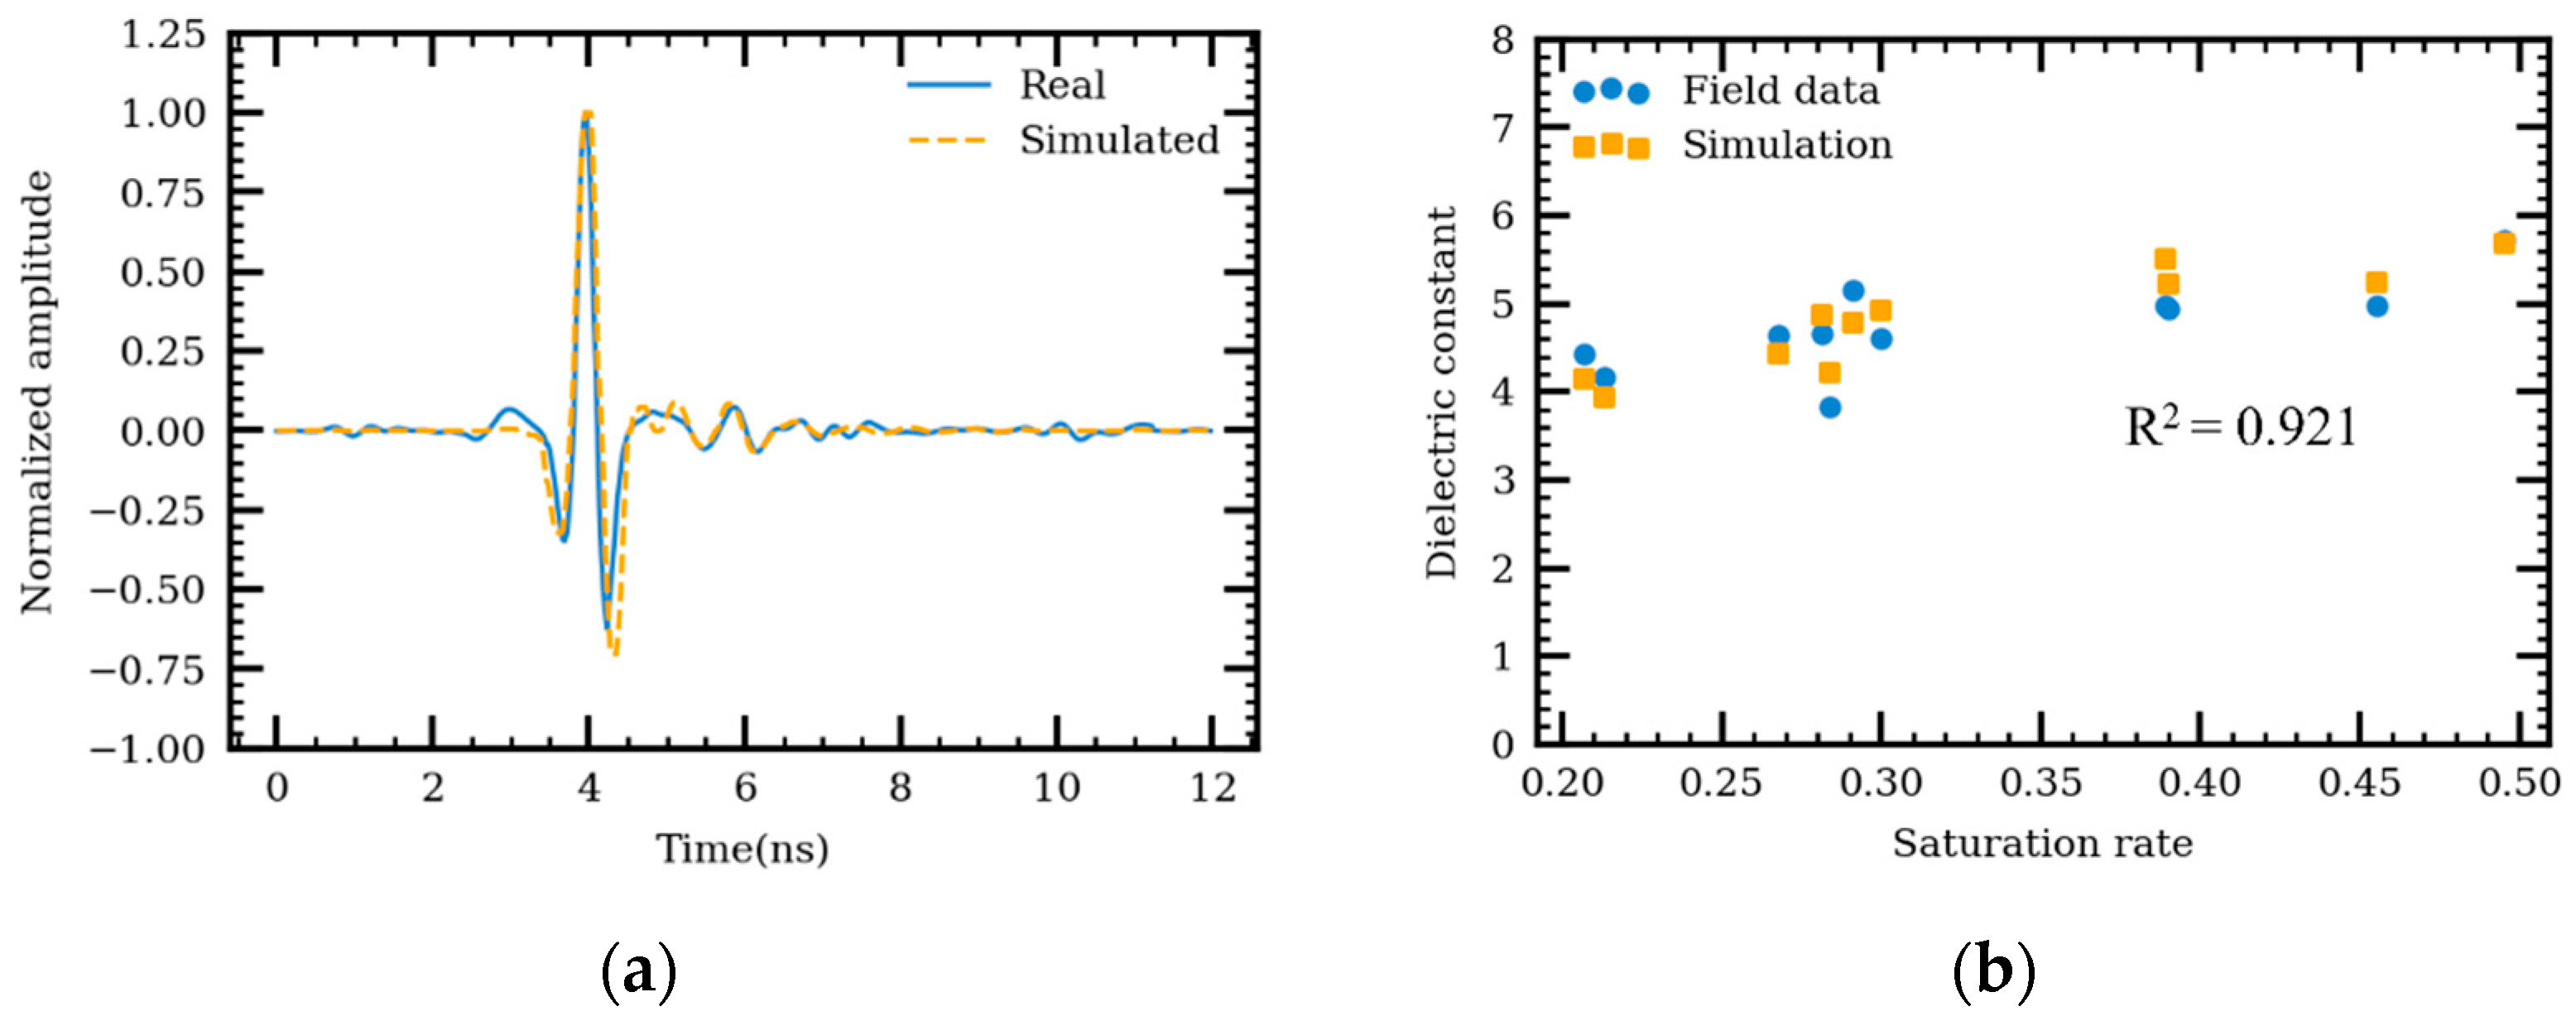
Other sand cone samples from Locations 1 and 3–7 are used to validate the simulation model. Figure 8a shows the comparison between the simulated and measured GPR reflected amplitudes with direct coupling removal. The simulated GPR signals are well matched with measured GPR signals in field. Comparisons were performed between the dielectric constants from the field tests and simulations (Figure 8b). The sand cone samples were taken from different locations and at various times, resulting in different saturation ratios and densities. It is observed that the simulated dielectric constant of non-dry AC mixture matches well with the field data. The average relative error between the simulated and measured results is 5.1%. Thus, it is feasible to analyze the effect of moisture content on dielectric properties using the simulation models developed in this study.
4. Sensitivity Analysis and Model Application
The effect of moisture on GPR signals was investigated in terms of amplitude and travel time features. The effect of aggregate gradation and saturation ratio on the AC pavement dielectric constants was discussed using reflection amplitude (RA) and two-way travel time (TWTT) methods, respectively. Finally, an empirical formula was derived to correlate moisture and dielectric constants of non-dry AC pavement, and an application of the derived formula on internal moisture content prediction was introduced.
4.1. Effect of Moisture Content on Reflected GPR Signal
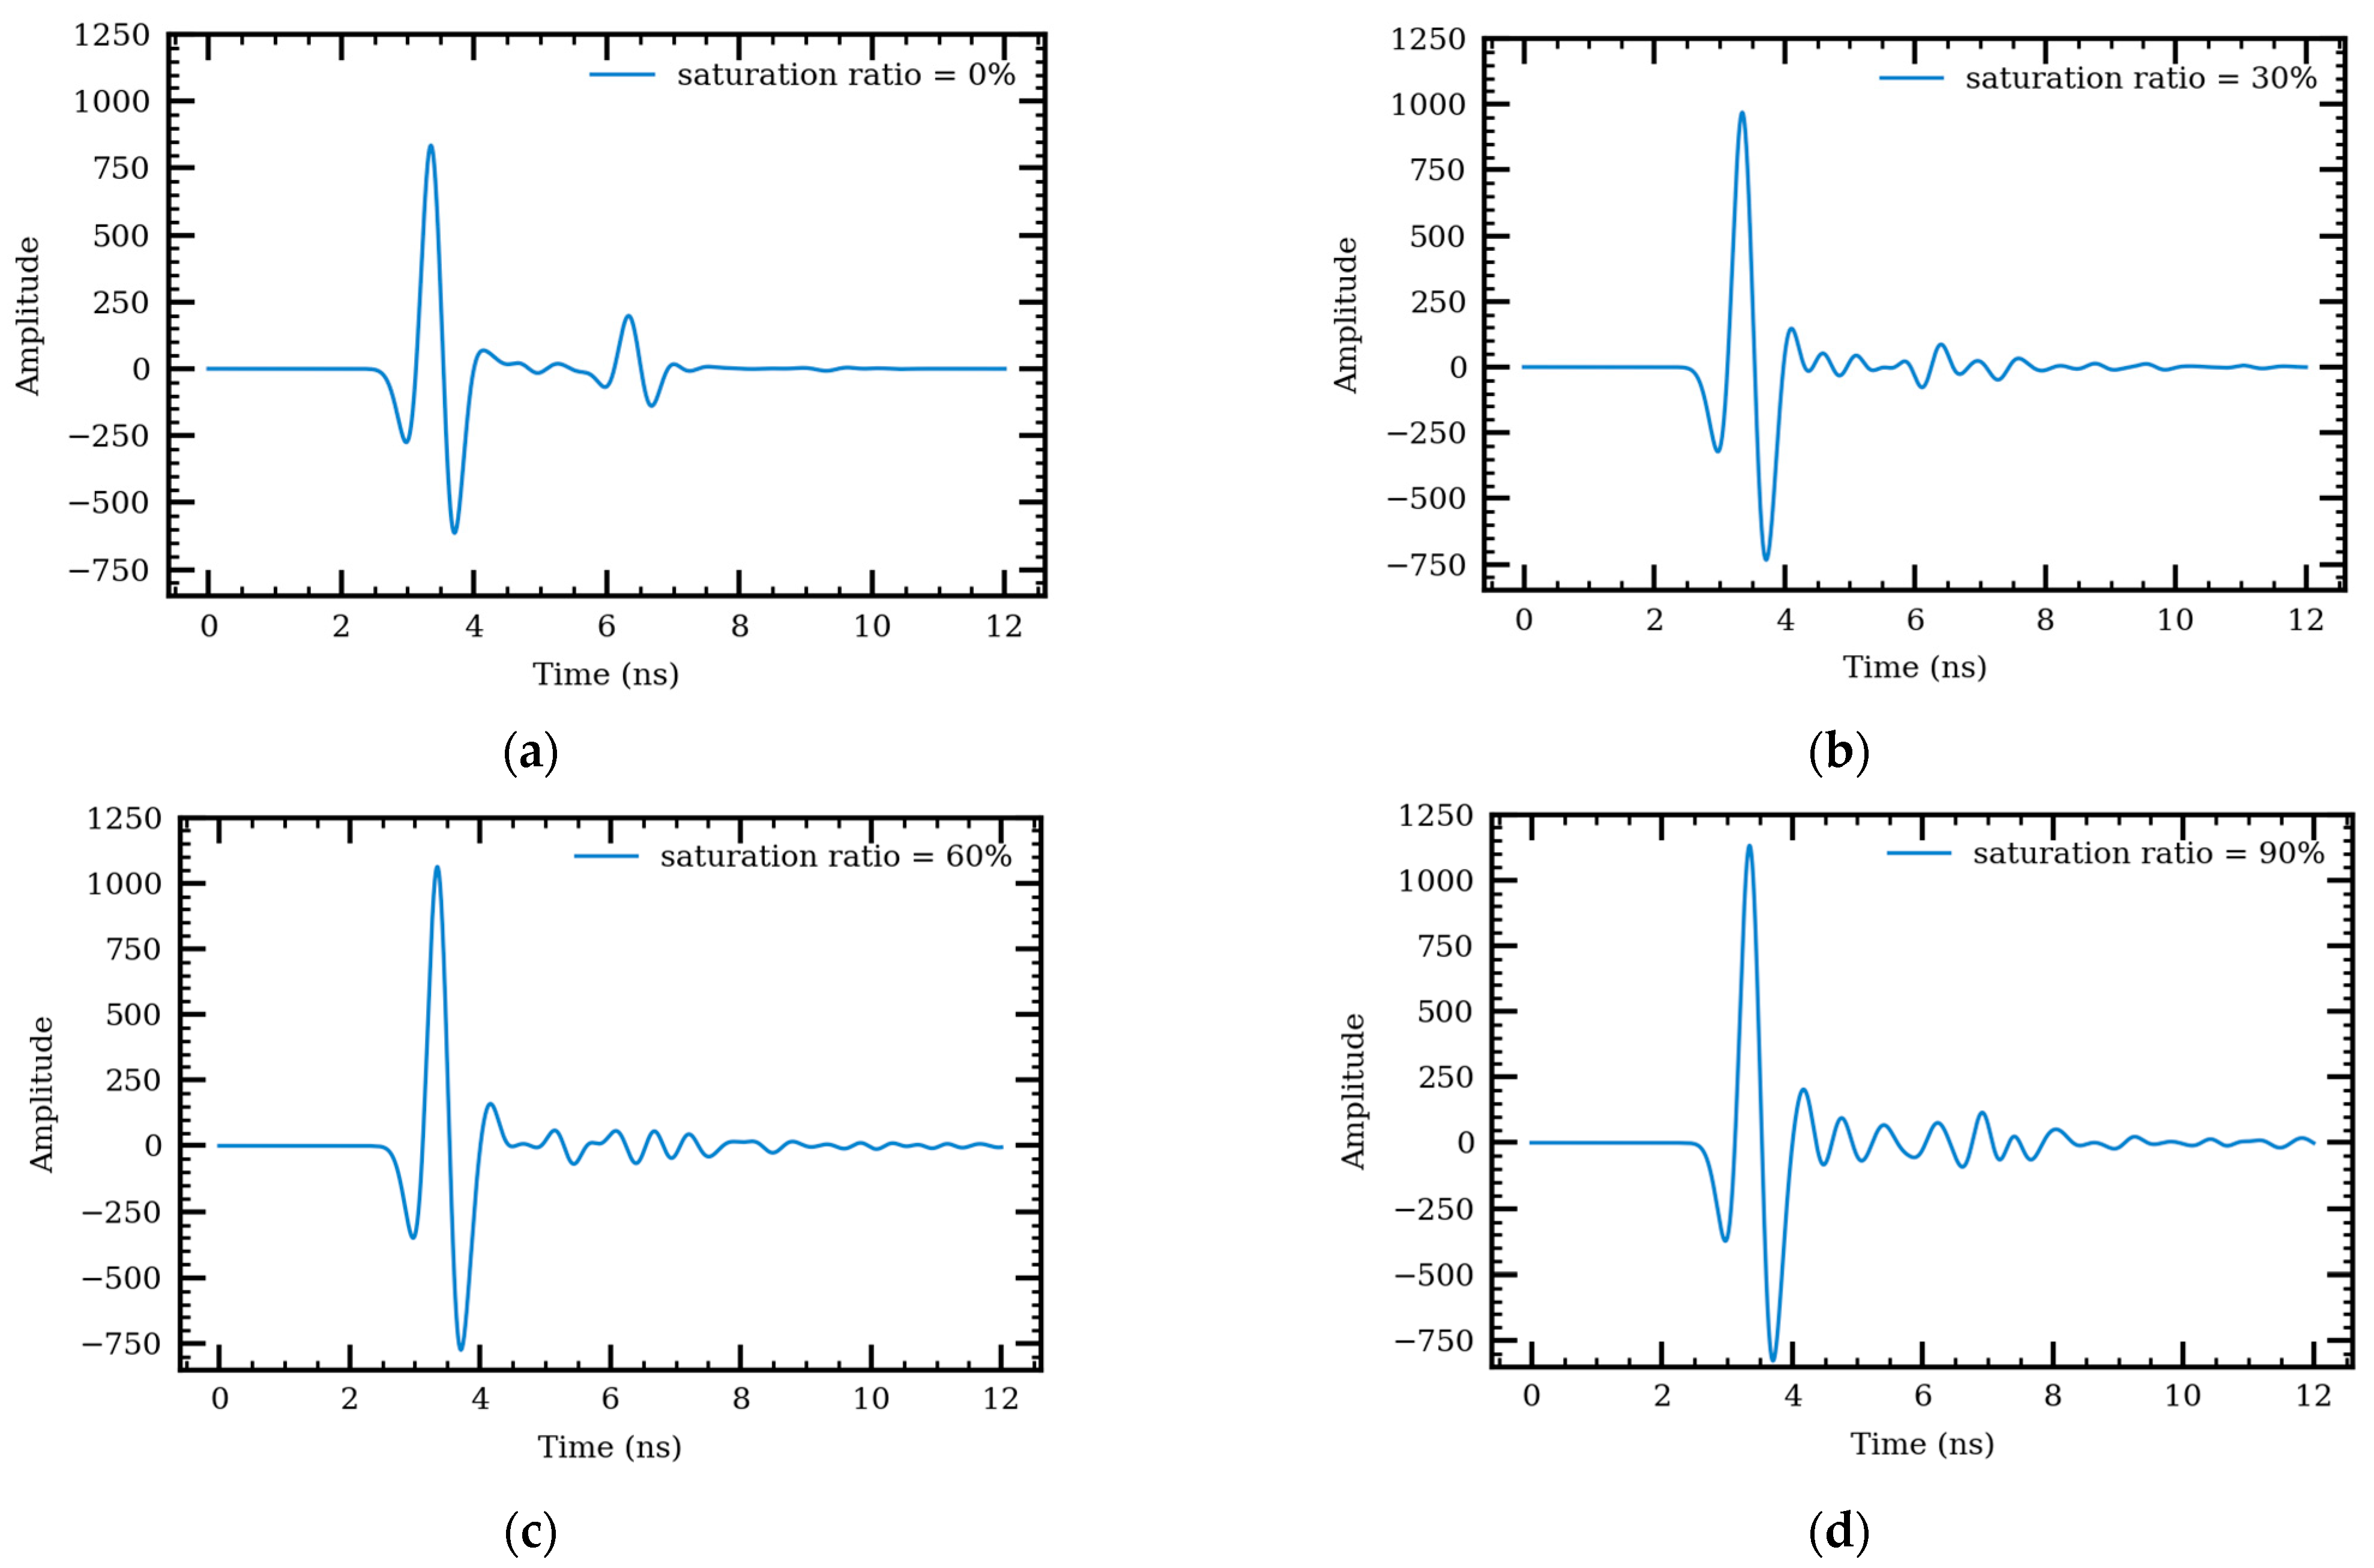
The numerical models were utilized to investigate the effect of moisture on GPR signals. To differentiate the reflection from the surface and bottom of surface layer, a numerical model was constructed with a 200 mm heterogeneous AC layer and a 100 mm base layer. The area of the calculation model was 800 × 800 mm, and the antennas were 400 mm above the pavement surface. Aggregate dielectric constant , water dielectric constant and loss factor were used in the simulation. Figure 9 shows the received GPR signals on pavement with different saturation ratios.
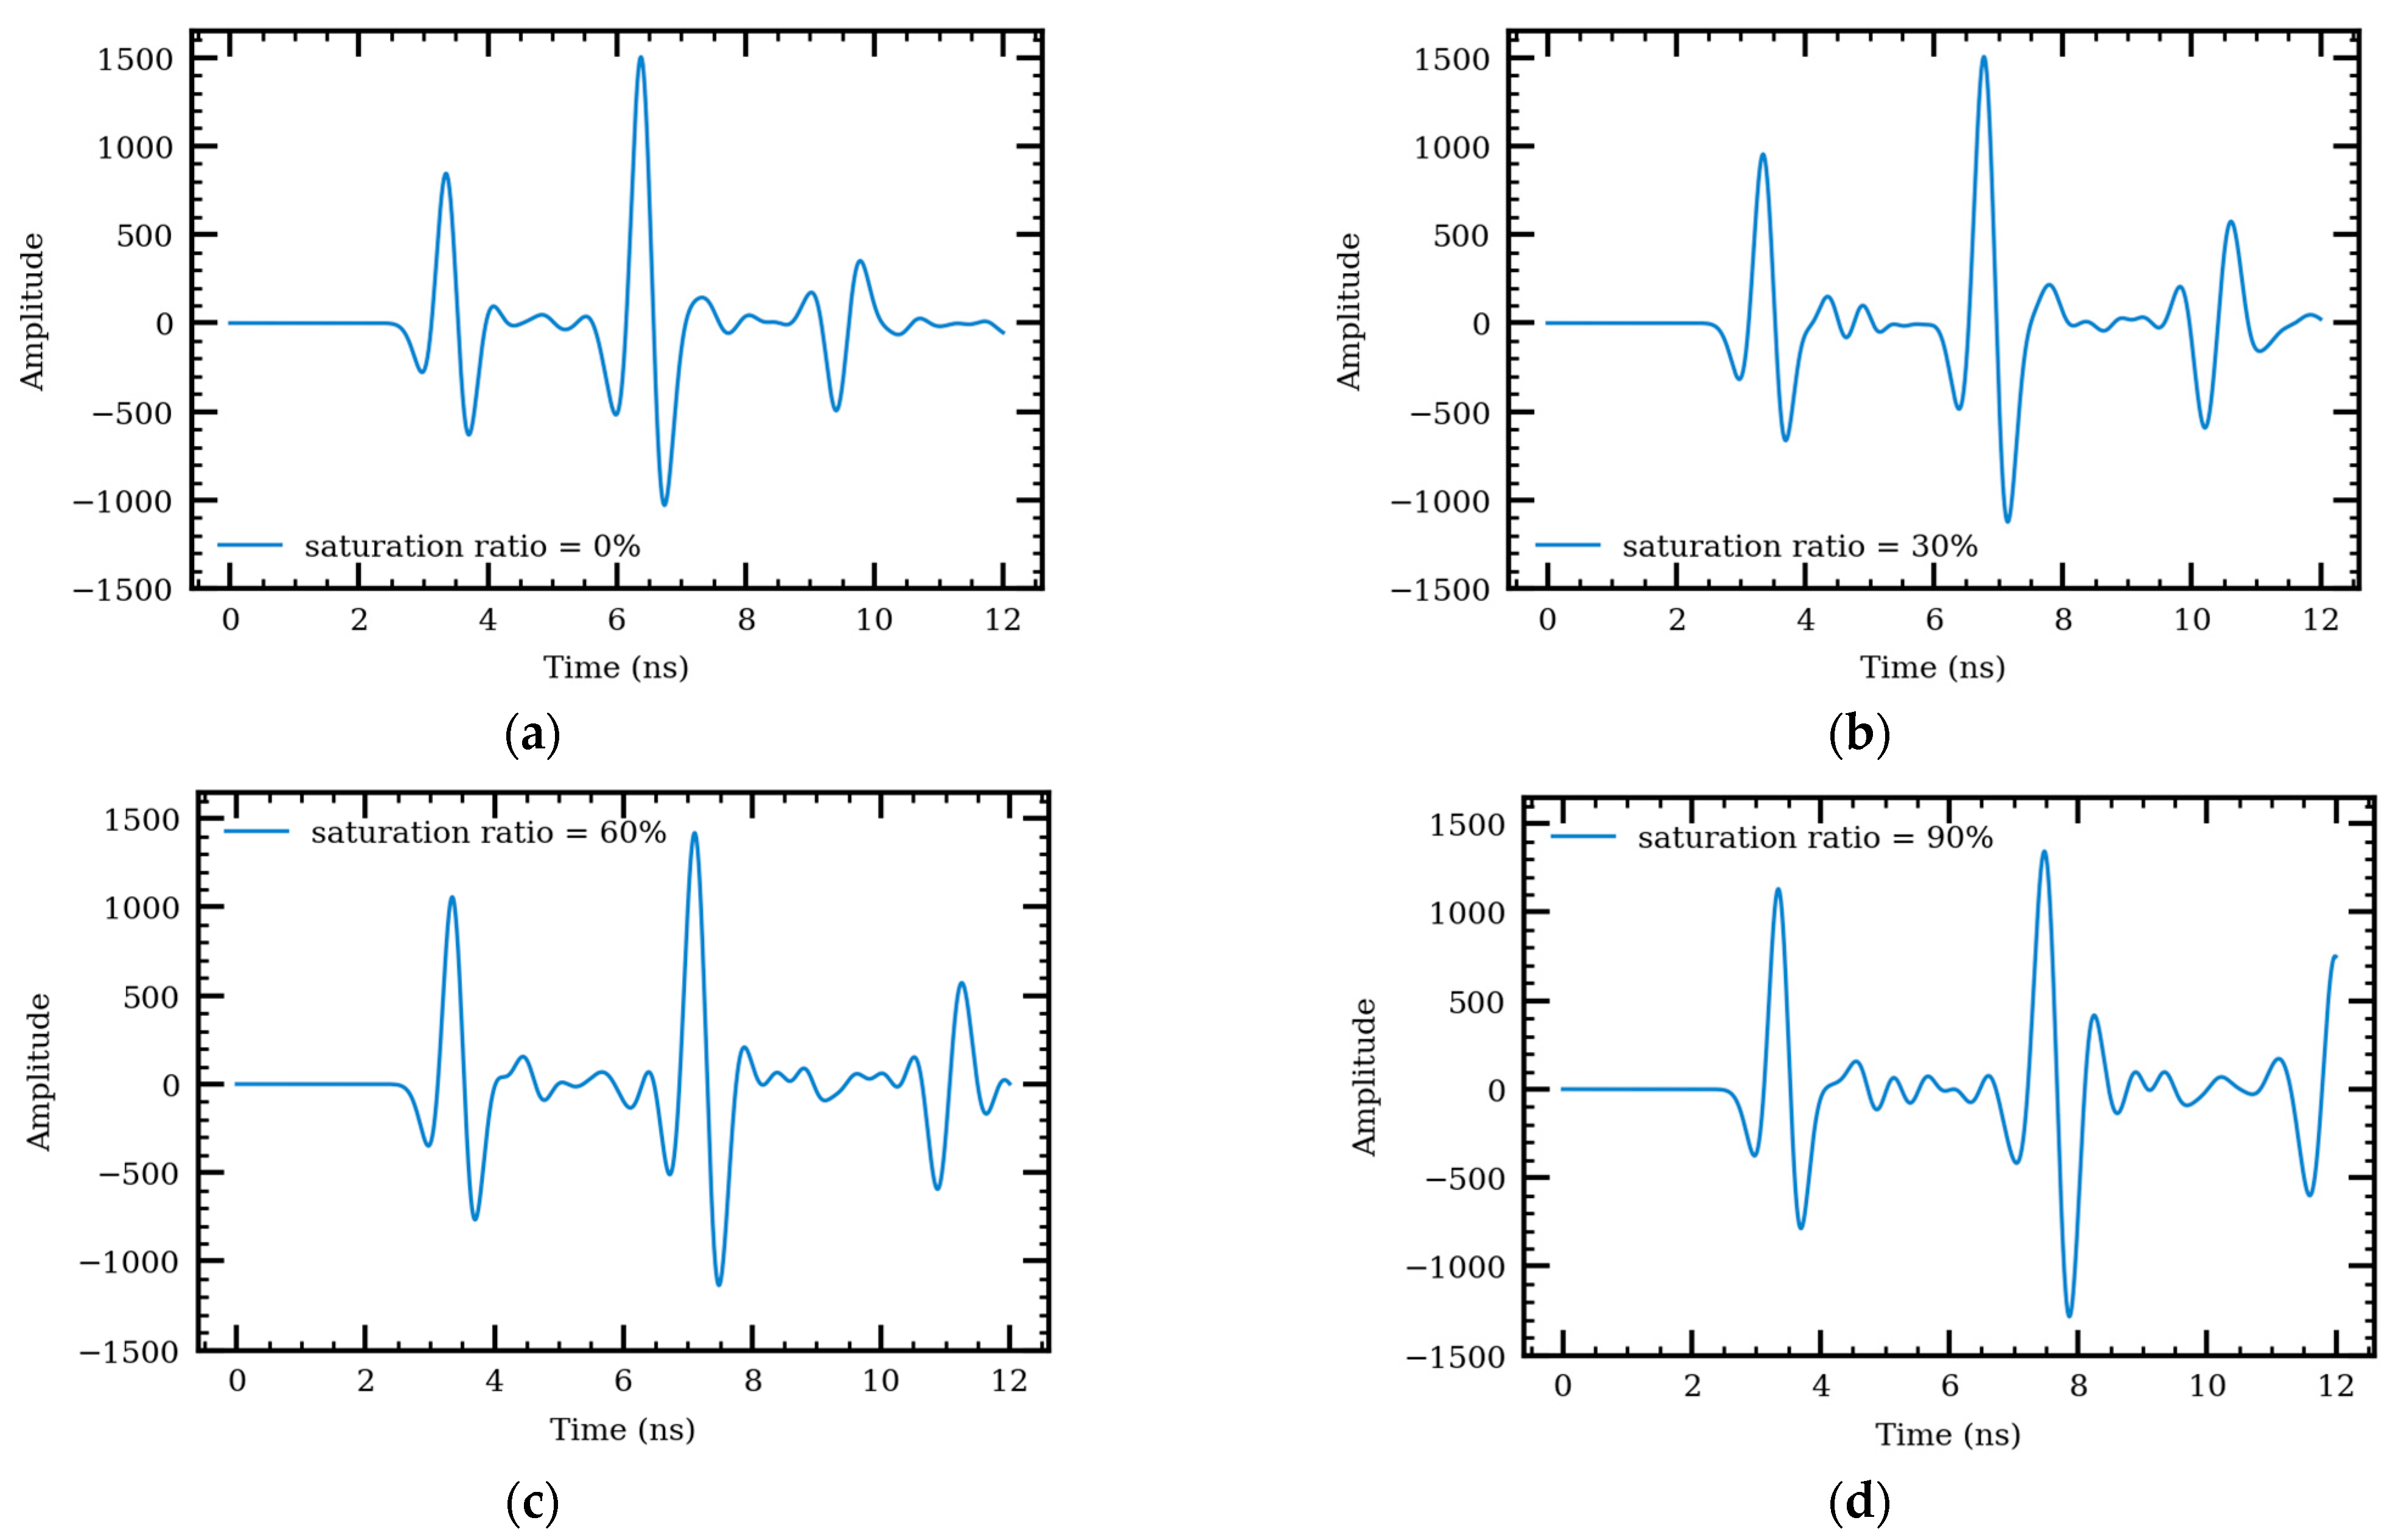
When the AC pavement is dry, or the saturation ratio is 0, the reflection from the top of the AC pavement layer, bottom of AC pavement layer, and top of base layer are clearly shown at around 3 and 6.5 ns, respectively. As the saturation ratio increases, the amplitude of reflection from the top of the pavement layer is amplified while the reflection from the bottom of pavement layer is attenuated. The amplification of surface reflection explains the increasing dielectric constants with more internal water in the medium, as indicated from Equation (4) and reported in previous studies [24,42]. At the same time, more distortions are observed for signals reflected from medium underneath the pavement surface. The signal attenuation and distortion observed from the simulation are consistent with previous studies [36,43]. Additionally, the EM depth of penetration in wet AC is smaller than that in the dry AC material and difference increases with higher saturation [1]. Hence, it is more difficult to detect the bottom of AC. To overcome this issue, a perfect electric reflector (PEC) was inserted on the top of the base layer, or the bottom of the AC pavement layer, to enhance the signal reflection in the simulation. The simulation results are shown in Figure 10.
The reflection from the bottom of the surface layer has been amplified with the reflector (Figure 10). The third pulse is caused by the signals reflected twice from the bottom of the pavement layer. The time interval between the first and second pulse is the TWTT of the EM wave in the AC pavement layer. As the saturation ratio increases, travel time increases and the velocity of the EM wave in the medium decreases. The effects of moisture on the dielectric constant and on the EM travel time in AC pavement are square root reciprocal, as indicated in Equation (5). A recent study has utilized this feature to detect water-pipe leakages by observing significant velocity drops compared to the undamaged dry area [44].
4.2. Effects of Aggregate Gradation and Saturation Ratio on Calculated AC Dielectric Constant
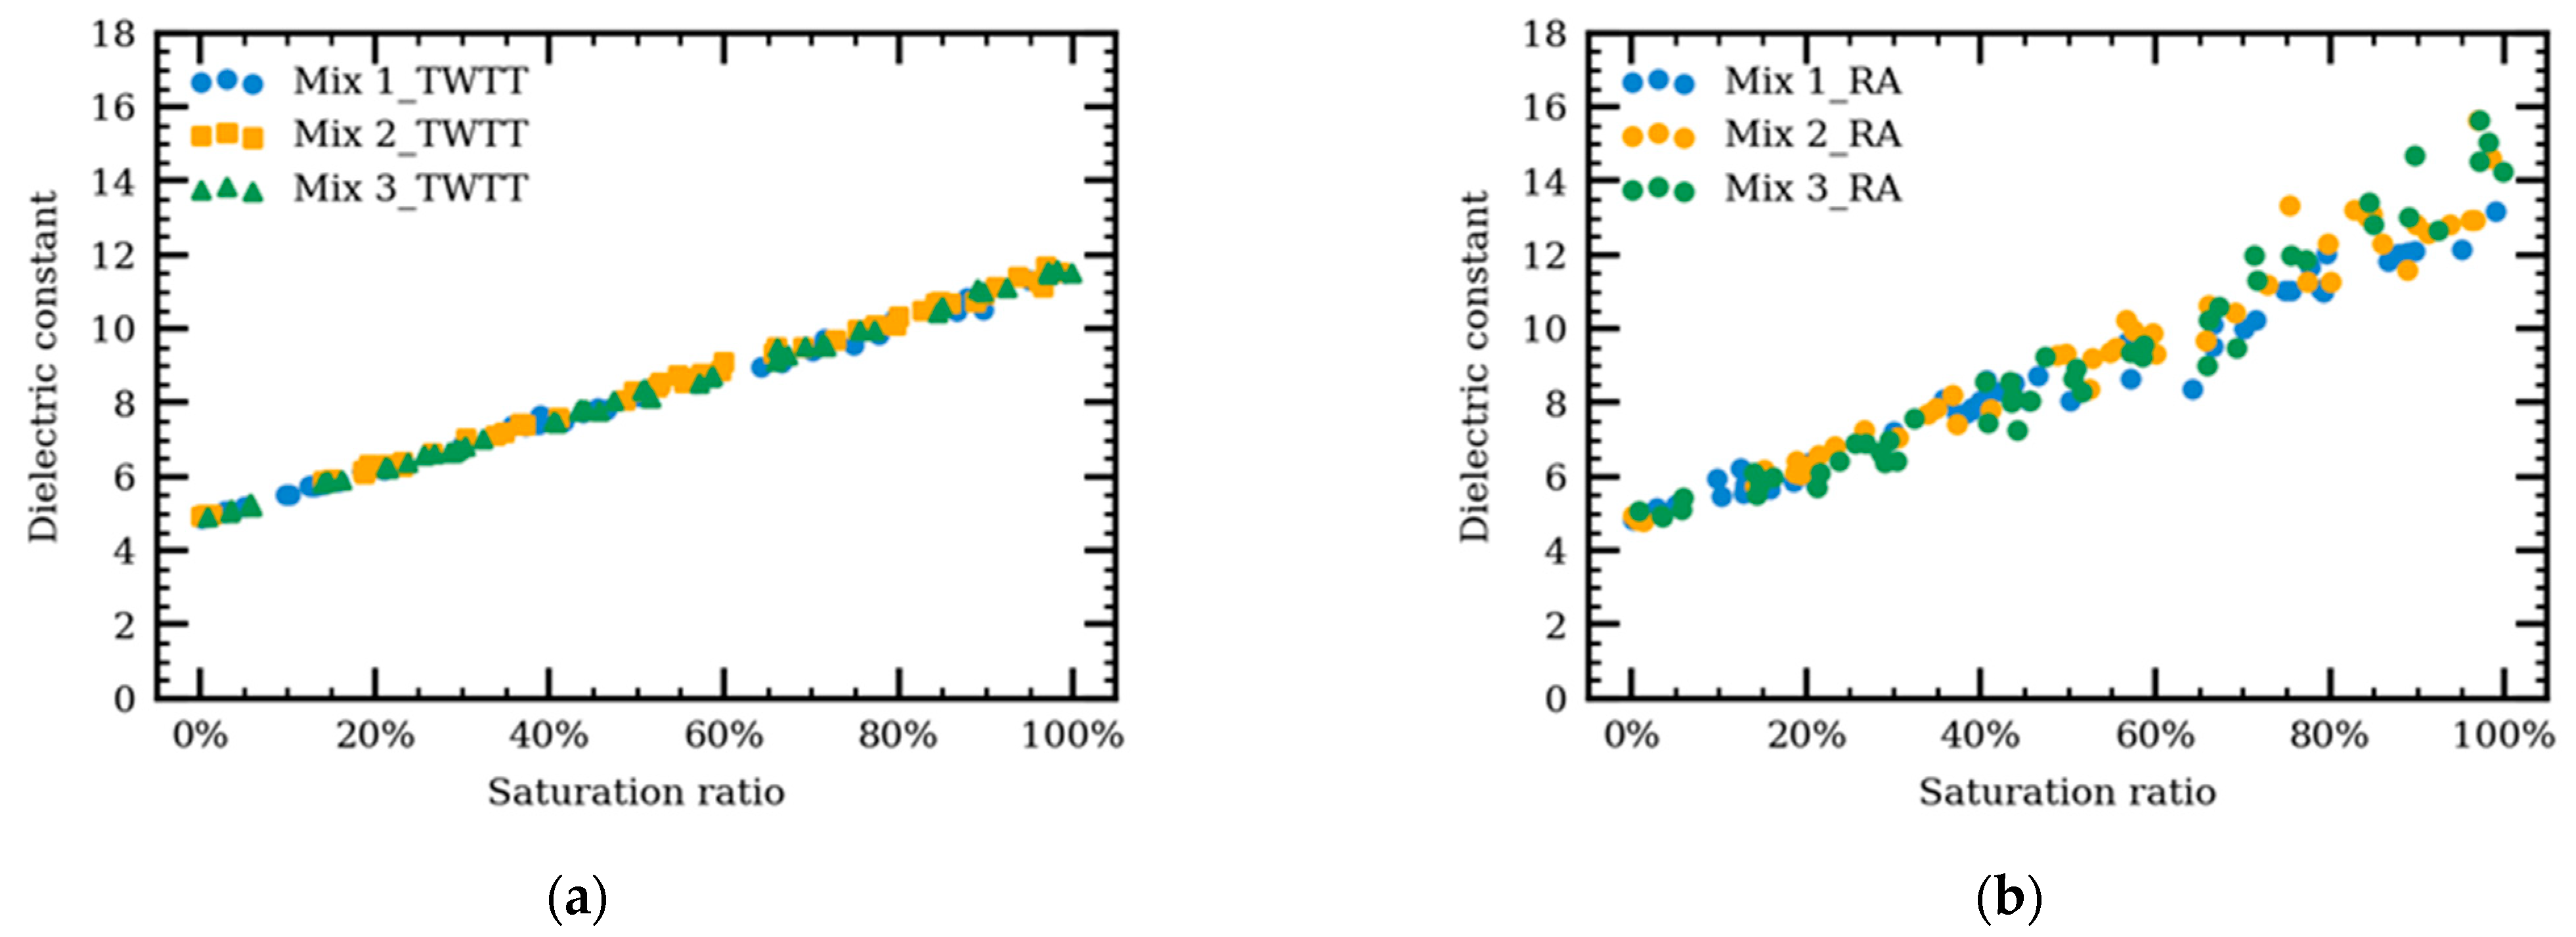
Sensitivity analysis was performed to investigate the effects of aggregate gradation and the saturation ratio on the AC dielectric constants using the Monte Carlo method [26]. Three aggregate gradations—dense- (Mix 1), gap- (Mix 2), and open-graded (Mix 3) AC mixtures—were simulated in the numerical models (see Table 3). Simulation parameters were the same as in Section 4.1. The results are shown in Figure 11.
It is evident that aggregate gradation has no effect on the TWTT and, accordingly, the calculated dielectric constant regardless of the water saturation level, similar to the simulation results on dry AC pavement [28]. The dielectric constant increases from 5 to 12 when the saturation ratio increases from 0% to 100%. The dielectric constant calculated by the RA method, however, suffers from large variation when the saturation ratio is high. An increased moisture content leads to the presence of more water-filled voids and thus more heterogeneities [25]. Thus resulted in inaccuracy in the RA method [20,24].
4.3. Relationship between Moisture Content and Dielectric Constant
To quantify the effect of internal moisture on the dielectric constant, numerical models were generated with different air voids and saturation ratios. The dielectric constants were calculated using the RA method. Using the same simulation parameters as that on IL 61, the results are shown in Figure 12. From the previous studies, the dielectric constant of the AC mixture decreases with air void increase [11,24]. For same air void content, as moisture increases, the AC dielectric constant increases. The dielectric constant of the AC mixture with the highest air voids, however, exceeds the dielectric constant of the AC mixture with lower air voids when the saturation ratio is more than 20% (Figure 12). This is because the effect of the water exceeds that of the air voids on the dielectric constant. Additionally, larger air voids lead to larger water volume when saturation ratios are the same.
To exclude the effect of air voids on the quantitative relationship between the dielectric constant and the moisture content, the dielectric constant of the AC is normalized using Equation (6), where the reference is the dielectric constant of a dry AC mixture. The moisture content is converted from the saturation ratio using Equation (2), and was assumed.
After the normalization and the conversion from the saturation ratio to the moisture content, the relationship between the normalized dielectric constant, , and moisture content, , could be fitted using a power function with different air voids (see Equation (7)). Parameters , , and depend on the asphalt binder content and the dielectric properties of each component in the numerical model. Using the calibrated model from Illinois Route 61, the parameters in Equation (7) are and . Compared with an exponential function or an inverse function, the power function has a higher value at 0.997 for the curve fitting.
4.4. Prediction of AC Moisture Content from GPR Data
Over the last four decades, many studies have demonstrated the high sensitivity of GPR to water in soil and building materials. There are two existing methods to estimate the underlying moisture content. The first method is to correlate the moisture content with the material dielectric constant. For example, Topp’s equation [45] is the most commonly used model in geophysics to estimate soil moisture [18,19] from dielectric constant. However, there is no established universe model for asphalt pavement. The relationship between the moisture content and dielectric constant is site-dependent, which requires regression from a large amount of collected samples [25]. Another method is to correlate the moisture content with the GPR signal features on the frequency domain [46]. This method is usually used to make a qualitative rather than a quantitative estimation of moisture contents. In this paper, an example of predicting internal moisture content from GPR measurements is presented as the application of the developed numerical model. Compared with the aforementioned methods in estimating moisture contents, the proposed relationship between the dielectric constant and moisture content is derived from the FDTD simulations. It requires only two samples in the calibration process. Compared with existing regression models, this numerical model is time- and cost-efficient and can also be easily applied to different project sites.
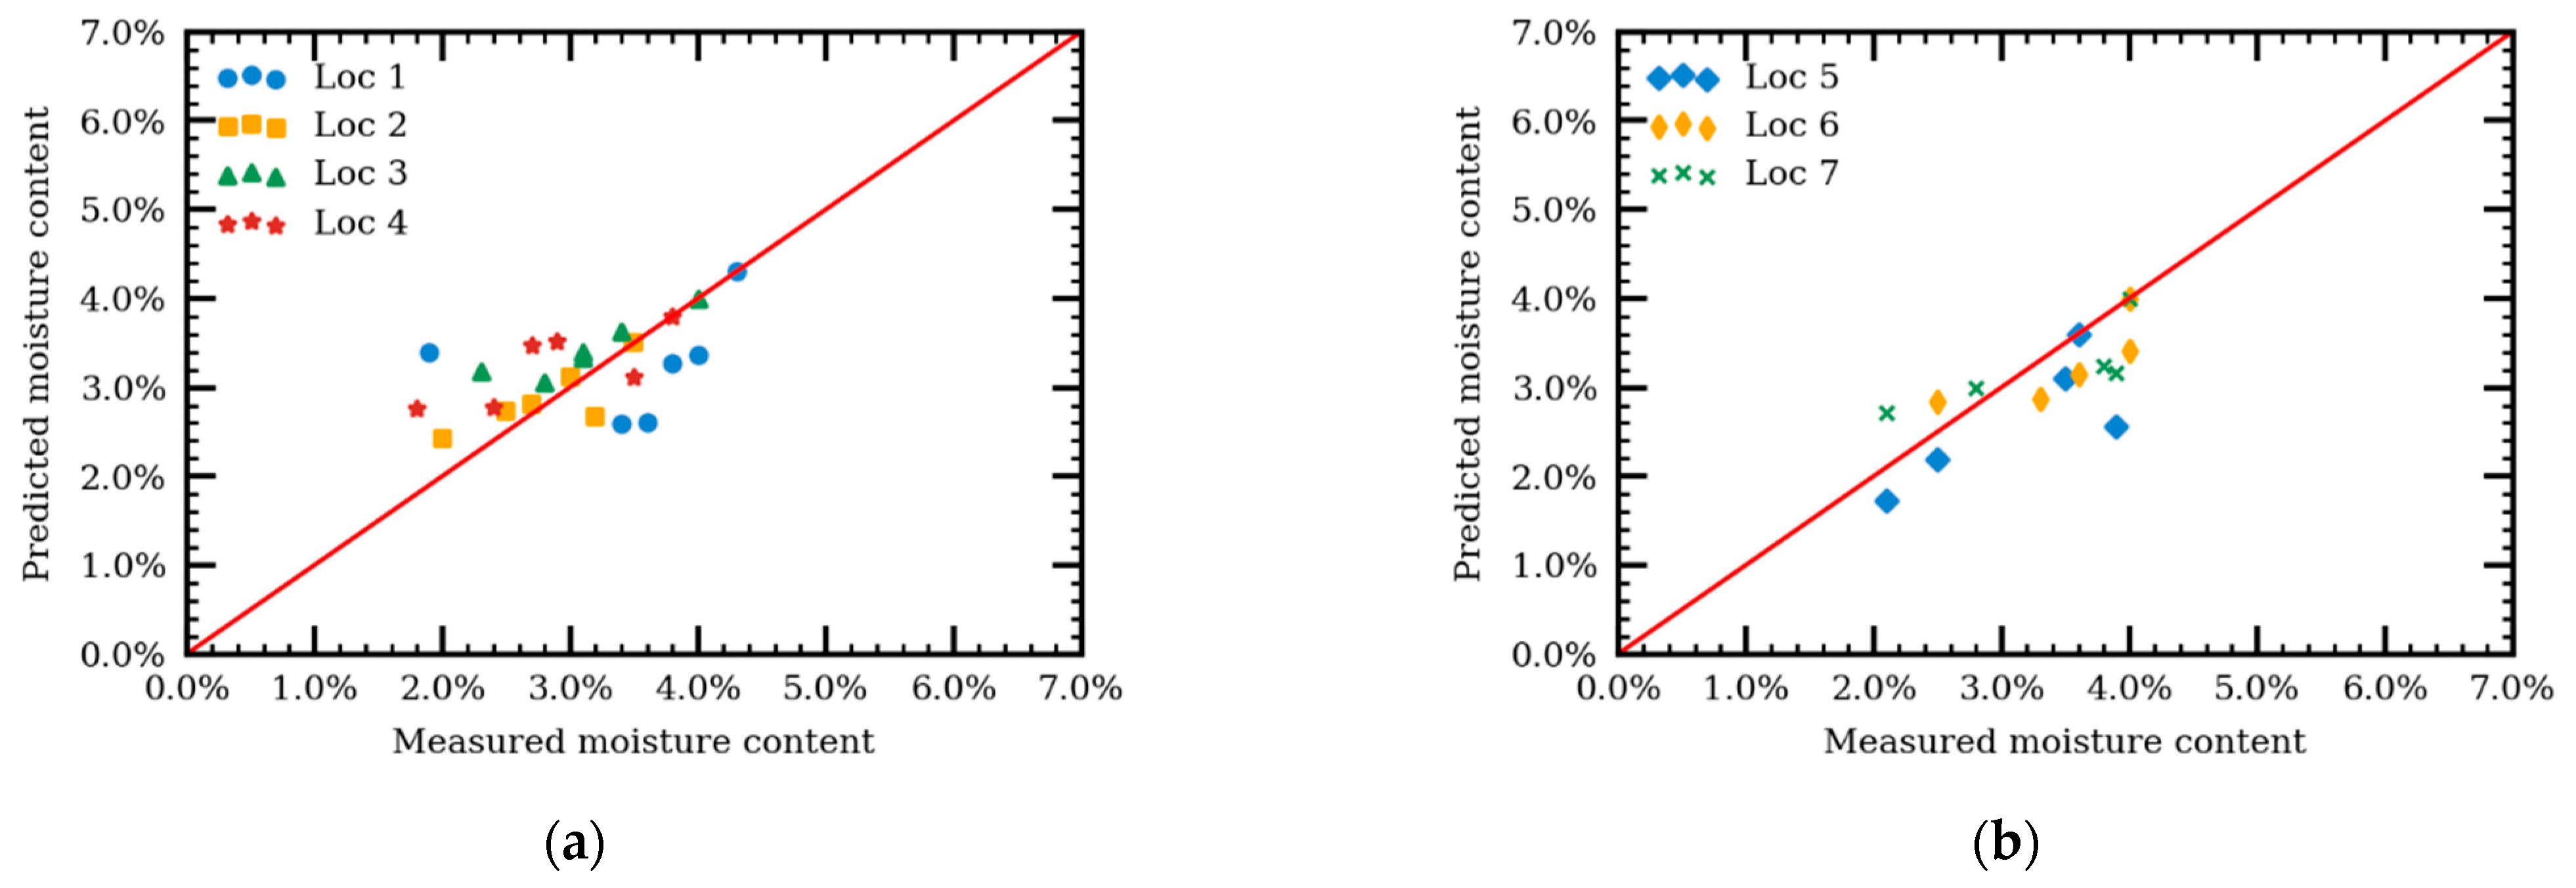
Results from the loose sample tests on IL 61 were used in this subsection. Loose samples were collected seven days after the placement of the CIR-treatment, and their moisture contents were measured using the drying oven method. The moisture contents of the pavement on the first day, first hour were used to back-calculate the reference dielectric constant in the field. The other measured moisture contents were used as a ground truth to be compared with the predicted moisture contents. The positions of Locations 1–7 are the same as Figure 6 shows. Moisture contents were predicted using Equation (8), which is the inverse of Equation (7).
Figure 13 shows the comparison between the predicted moisture contents and the moisture contents measured in the field. In Locations 2–7, the moisture content prediction absolute errors ranged from 0.24% to 0.52%. The large error at Location 1, 0.74%, may resulted from the unevenly distribution of moisture inside the pavement. The overall average absolute error for moisture content prediction from Locations 1–7 is 0.44%. This error value suggests that predicted moisture content may vary in the range of 2.50 ± 0.44%.
The proposed numerical model allows better control of AC mixture’s structure and material properties. The model was validated using GPR surveys on cold-in-place recycling pavement in this study. However, the numerical model can be further extended and applied to different types of asphalt pavement with different types of bases. However, it may not be applicable to cement-treated bases because of the chemically-constrained water during the cement hydration. It can also be further used to study the GPR surveys on the unevenly compacted pavement and the nonuniformly distributed moisture content.
A limitation of the study is the need to calibrate model using lab- or field-measured aggregate dielectric constant. A database of available aggregate can be generated to overcome this limitation.
5. Summary and Conclusions
The developed simulation method has a great potential for analyzing GPR responses from non-dry asphalt pavement and provides an accurate prediction of moisture content. In this study, the effect of internal moisture on AC pavement dielectric properties was analyzed by implementing a numerical approach. The heterogeneous dielectric model of AC pavement was generated using the random sequential adsorption (RSA) method, followed by a finite-difference time-domain (FDTD) simulation. The findings of this paper are summarized as follows:
- 1.
- The heterogeneous numerical model was validated using GPR surveys on cold-in-place recycling pavement. The average relative error between the simulated and measured dielectric constants was 5.1%.
- 2.
- The sensitivity analysis showed that high moisture content inside the AC pavement causes an increase of reflection amplitude from the pavement surface and an attenuation and reduced speed of electromagnetic (EM) waves in the pavement layer. Additionally, aggregate gradation of AC surface layer has no effect on calculated AC dielectric contact due to the relatively large wavelength to aggregate size ratio.
A power function relationship derived from the numerical model was applied to predict moisture contents in the field. The average absolute error of moisture content prediction using this relationship was 0.44%. The results demonstrated the ability of the proposed method of using GPR for monitoring moisture variations in AC pavements.
Author Contributions
The authors Q.C. and I.L.A.-Q. confirm contribution to the paper in regard to the study conception and design, data collection, analysis, and interpretation of results, and draft manuscript preparation. All authors also reviewed the results and approved the final version of the manuscript. The authors do not have any conflicts of interest to declare. All authors have read and agreed to the published version of the manuscript.
Funding
This research received no external funding.
Institutional Review Board Statement
Not applicable.
Informed Consent Statement
Not applicable.
Data Availability Statement
Data are contained within the article.
Acknowledgments
The authors are representatives of the Illinois Center for Transportation (ICT). The contents of this paper reflect the view of the authors, who are responsible for the facts and the accuracy of the data presented herein. The contents do not necessarily reflect the official view or policies of ICT. This paper does not constitute a standard, specifications, or regulations. This publication is based on the results conducted in cooperation with Illinois Center for Transportation (ICT), Illinois Department of Transportation (IDOT), U.S. Department of Transportation, and Federal Highway Administration. The authors would like to acknowledge the assistance provided by many individuals including John Senger, TRP chair, Steve Worsfold and Ron Wagoner, TRP members, Jason Wielinski from Heritage Research Group, Greg Renshaw and Uthman M. Ali, ICT’s senior research engineers, along with Siqi Wang, Lama Abufares, Punit Singhvi, Javier García Mainieri, and José Julian Rivera-Perez—all of whom are University of Illinois at Urbana-Champaign graduate students.
Conflicts of Interest
The authors declare no conflict of interest.
References
- Al-Qadi, I.; Ghodgaonkar, D.; Varada, V.; Varadan, V. Effect of moisture on asphaltic concrete at microwave frequencies. IEEE Trans. Geosci. Remote Sens. 1991, 29, 710–717. [Google Scholar] [CrossRef]
- Al-Qadi, I.L.; Sebaaly, P.E. New Technique to Measure Moisture in Hot-Mix Asphalt Concrete Nondestructively. Transp. Res. Rec. 1991, 1317, 0361–1981. [Google Scholar]
- Mehrara, A.; Khodaii, A. A review of state of the art on stripping phenomenon in asphalt concrete. Constr. Build. Mater. 2013, 38, 423–442. [Google Scholar] [CrossRef]
- Kim, Y.; Im, S.; Lee, H. Impacts of Curing Time and Moisture Content on Engineering Properties of Cold In-Place Recycling Mixtures Using Foamed or Emulsified Asphalt. J. Mater. Civ. Eng. 2011, 23, 542–553. [Google Scholar] [CrossRef]
- Kim, Y.; Lee, H. “David” Development of Mix Design Procedure for Cold In-Place Recycling with Foamed Asphalt. J. Mater. Civ. Eng. 2006, 18, 116–124. [Google Scholar] [CrossRef]
- ASTM D7497-09. Standard Practice for Recovering Residue from Emulsified Asphalt Using Low-Temperature Evaporative Techniques; ASTM International: West Conshohocken, PA, USA, 2016. [Google Scholar]
- Li, C.; Miao, L.; Yue, J. Research on Detection to Moisture Content of Flexible Pavement by GPR. In Paving Materials and Pavement Analysis; American Society of Civil Engineers: Shanghai, China, 2010; pp. 420–426. [Google Scholar] [CrossRef]
- Huisman, J.A.; Hubbard, S.S.; Redman, J.D.; Annan, A.P. Measuring Soil Water Content with Ground Penetrating Radar: A Review. Vadose Zone J. 2003, 2, 476–491. [Google Scholar] [CrossRef]
- Benedetto, A.; Pajewski, L. (Eds.) Civil Engineering Applications of Ground Penetrating Radar; Springer: Cham, Germany, 2015. [Google Scholar] [CrossRef]
- Lai, W.W.-L.; Dérobert, X.; Annan, P. A review of Ground Penetrating Radar application in civil engineering: A 30-year journey from Locating and Testing to Imaging and Diagnosis. NDT E Int. 2018, 96, 58–78. [Google Scholar] [CrossRef]
- Leng, Z.; Al-Qadi, I.L.; Lahouar, S. Development and validation for in situ asphalt mixture density prediction models. NDT E Int. 2011, 44, 369–375. [Google Scholar] [CrossRef]
- Lahouar, S.; Al-Qadi, I. Automatic detection of multiple pavement layers from GPR data. NDT E Int. 2008, 41, 69–81. [Google Scholar] [CrossRef]
- Al-Qadi, I.L.; Lahouar, S. Measuring layer thicknesses with GPR–Theory to practice. Constr. Build. Mater. 2005, 19, 763–772. [Google Scholar] [CrossRef]
- Al-Qadi, I.L.; Xie, W.; Roberts, R.; Leng, Z. Data Analysis Techniques for GPR Used for Assessing Railroad Ballast in High Radio-Frequency Environment. J. Transp. Eng. 2010, 136, 392–399. [Google Scholar] [CrossRef]
- Wang, S.; Al-Qadi, I.L.; Cao, Q. Factors Impacting Monitoring Asphalt Pavement Density by Ground Penetrating Radar. NDT E Int. 2020, 115, 102296. [Google Scholar] [CrossRef]
- Zhao, S.; Al-Qadi, I.L. Algorithm development for real-time thin asphalt concrete overlay compaction monitoring using ground-penetrating radar. NDT E Int. 2019, 104, 114–123. [Google Scholar] [CrossRef]
- Cao, Q.; Al-Qadi, I.L. Signal Stability and the Height-Correction Method for Ground-Penetrating Radar In Situ Asphalt Concrete Density Prediction. Transp. Res. Rec. J. Transp. Res. Board 2021, 2675, 835–847. [Google Scholar] [CrossRef]
- Liu, X.; Chen, J.; Cui, X.; Liu, Q.; Cao, X.; Chen, X. Measurement of soil water content using ground-penetrating radar: A review of current methods. Int. J. Digit. Earth 2017, 12, 95–118. [Google Scholar] [CrossRef]
- Tosti, F.; Slob, E.C. Determination, by using GPR, of the volumetric water content in structures, sub-structures, foundations and soil-ongoing activities in working project 2.5 of COST action TU1208. In Proceedings of the Geophysical Research Abstracts, 17, EGU General Assembly, Vienna, Austria, 12–17 April 2015. EGU2015-15199. [Google Scholar]
- Soutsos, M.; Bungey, J.; Millard, S.; Shaw, M.; Patterson, A. Dielectric properties of concrete and their influence on radar testing. NDT E Int. 2001, 34, 419–425. [Google Scholar] [CrossRef]
- Shang, J.Q.; Umana, J.A.; Bartlett, F.M.; Rossiter, J.R. Measurement of Complex Permittivity of Asphalt Pavement Materials. J. Transp. Eng. 1999, 125, 347–356. [Google Scholar] [CrossRef]
- Kaatze, U. Complex permittivity of water as a function of frequency and temperature. J. Chem. Eng. Data 1989, 34, 371–374. [Google Scholar] [CrossRef]
- Liebe, H.J.; Hufford, G.A.; Manabe, T. A model for the complex permittivity of water at frequencies below 1 THz. Int. J. Infrared Millim. Waves 1991, 12, 659–675. [Google Scholar] [CrossRef]
- Plati, C.; Loizos, A. Estimation of in-situ density and moisture content in HMA pavements based on GPR trace reflection amplitude using different frequencies. J. Appl. Geophys. 2013, 97, 3–10. [Google Scholar] [CrossRef]
- Klewe, T.; Strangfeld, C.; Kruschwitz, S. Review of moisture measurements in civil engineering with ground penetrating radar—Applied methods and signal features. Constr. Build. Mater. 2021, 278, 122250. [Google Scholar] [CrossRef]
- Benedetto, A.; Ciampoli, L.B.; Brancadoro, M.G.; Alani, A.M.; Tosti, F. A Computer-Aided Model for the Simulation of Railway Ballast by Random Sequential Adsorption Process. Comput. Civ. Infrastruct. Eng. 2017, 33, 243–257. [Google Scholar] [CrossRef]
- Shangguan, P.; Al-Qadi, I. Calibration of FDTD Simulation of GPR Signal for Asphalt Pavement Compaction Monitoring. IEEE Trans. Geosci. Remote Sens. 2014, 53, 1538–1548. [Google Scholar] [CrossRef]
- Cao, Q.; Al-Qadi, I. Development of a Numerical Model to Predict the Dielectric Properties of Heterogeneous Asphalt Concrete. Sensors 2021, 21, 2643. [Google Scholar] [CrossRef]
- Hu, R.; Lu, L.; Wang, S. The Numerical Simulation Study on Ground Penetrating Radar Detection of the Typical Adverse Geological Structure. In Proceedings of the 14th International Conference on Ground Penetrating Radar (GPR), Shanghai, China, 4–8 June 2012; pp. 243–247. [Google Scholar]
- He, X.; Zhu, Z.; Lu, G.; Lu, Q. The FDTD Modeling of GPR for Tunnel Inspection. In Proceedings of the 2009 International Conference on Information Engineering and Computer Science, Wuhan, China, 19–20 December 2009; pp. 1–4. [Google Scholar] [CrossRef]
- Giannakis, I.; Giannopoulos, A.; Warren, C. A Realistic FDTD Numerical Modeling Framework of Ground Penetrating Radar for Landmine Detection. IEEE J. Sel. Top. Appl. Earth Obs. Remote Sens. 2015, 9, 37–51. [Google Scholar] [CrossRef]
- Belli, K.; Rappaport, C.M.; Zhan, H.; Wadia-Fascetti, S. Effectiveness of 2-D and 2.5-D FDTD Ground-Penetrating Radar Modeling for Bridge-Deck Deterioration Evaluated by 3-D FDTD. IEEE Trans. Geosci. Remote Sens. 2009, 47, 3656–3663. [Google Scholar] [CrossRef]
- Shangguan, P.; Al-Qadi, I.; Coenen, A.; Zhao, S. Algorithm development for the application of ground-penetrating radar on asphalt pavement compaction monitoring. Int. J. Pavement Eng. 2014, 17, 189–200. [Google Scholar] [CrossRef]
- Xu, W.; Xu, B.; Guo, F. Elastic properties of particle-reinforced composites containing nonspherical particles of high packing density and interphase: DEM–FEM simulation and micromechanical theory. Comput. Methods Appl. Mech. Eng. 2017, 326, 122–143. [Google Scholar] [CrossRef]
- Leng, Z.; Al-Qadi, I.L. An innovative method for measuring pavement dielectric constant using the extended CMP method with two air-coupled GPR systems. NDT E Int. 2014, 66, 90–98. [Google Scholar] [CrossRef]
- Lachowicz, J.; Rucka, M. A novel heterogeneous model of concrete for numerical modelling of ground penetrating radar. Constr. Build. Mater. 2019, 227, 116703. [Google Scholar] [CrossRef]
- Zadhoush, H.; Giannopoulos, A.; Giannakis, I. Optimising the Complex Refractive Index Model for Estimating the Permittivity of Heterogeneous Concrete Models. Remote Sens. 2021, 13, 723. [Google Scholar] [CrossRef]
- Warren, C.; Giannopoulos, A.; Giannakis, I. gprMax: Open source software to simulate electromagnetic wave propagation for Ground Penetrating Radar. Comput. Phys. Commun. 2016, 209, 163–170. [Google Scholar] [CrossRef] [Green Version]
- Feder, J. Random sequential adsorption. J. Theor. Biol. 1980, 87, 237–254. [Google Scholar] [CrossRef]
- Yee, K.S.; Chen, J.S. The finite-difference time-domain (FDTD) and the finite-volume time-domain (FVTD) methods in solving Maxwell’s equations. IEEE Trans. Antennas Propag. 1997, 45, 354–363. [Google Scholar] [CrossRef]
- Giannopoulos, A. Modelling ground penetrating radar by GprMax. Constr. Build. Mater. 2005, 19, 755–762. [Google Scholar] [CrossRef]
- Fernandes, F.; Fernandes, A.; Pais, J. Assessment of the density and moisture content of asphalt mixtures of road pavements. Constr. Build. Mater. 2017, 154, 1216–1225. [Google Scholar] [CrossRef]
- Kaplanvural, I.; Peksen, E.; Özkap, K. Volumetric water content estimation of C-30 concrete using GPR. Constr. Build. Mater. 2018, 166, 141–146. [Google Scholar] [CrossRef]
- Cheung, B.W.; Lai, W.W. Field validation of water-pipe leakage detection through spatial and time-lapse analysis of GPR wave velocity. Near Surf. Geophys. 2019, 17, 231–246. [Google Scholar] [CrossRef]
- Topp, G.C.; Davis, J.L. Measurement of Soil Water Content using Time-domain Reflectrometry (TDR): A Field Evaluation. Soil Sci. Soc. Am. J. 1985, 49, 19–24. [Google Scholar] [CrossRef]
- Benedetto, A.; Benedetto, F. Remote Sensing of Soil Moisture Content by GPR Signal Processing in the Frequency Domain. IEEE Sens. J. 2011, 11, 2432–2441. [Google Scholar] [CrossRef]
Figure 1.
Flowchart of proposed method.

Figure 2.
Composition and parameters of a non-dry asphalt mixture.

Figure 3.
Particles before and after discretization in the geometric model.

Figure 4.
Visualization of a heterogeneous dry AC mixture, water component, and a non-dry AC mixture numerical model.
Figure 4.
Visualization of a heterogeneous dry AC mixture, water component, and a non-dry AC mixture numerical model.

Figure 5.
Diagram of an FDTD model in GprMax.

Figure 6.
Dielectric property of water changing with temperature in 2 GHz.

Figure 7.
GPR testing vehicle (a) and plane view of the testing site (b).

Figure 8.
(a) A-scans from the field tests and simulations; (b) comparisons between the relative dielectric constants from the field tests and simulations.
Figure 8.
(a) A-scans from the field tests and simulations; (b) comparisons between the relative dielectric constants from the field tests and simulations.

Figure 9.
GPR signals on pavement with different saturation ratios of (a) 0% (b) 30% (c) 60% (d) 90%.
Figure 9.
GPR signals on pavement with different saturation ratios of (a) 0% (b) 30% (c) 60% (d) 90%.

Figure 10.
GPR signals on PEC-embedded pavement with different saturation ratios of (a) 0% (b) 30% (c) 60% (d) 90%.
Figure 10.
GPR signals on PEC-embedded pavement with different saturation ratios of (a) 0% (b) 30% (c) 60% (d) 90%.

Figure 11.
Effects of gradation and the saturation ratio on a dielectric constant (a) using the TWTT (a) and RA (b) methods.
Figure 11.
Effects of gradation and the saturation ratio on a dielectric constant (a) using the TWTT (a) and RA (b) methods.

Figure 12.
Effects of the saturation ratio and air voids on the dielectric constant (a) as well as the effects of the moisture content and air voids on the normalized dielectric constant (b).
Figure 12.
Effects of the saturation ratio and air voids on the dielectric constant (a) as well as the effects of the moisture content and air voids on the normalized dielectric constant (b).

Figure 13.
Comparisons between predicted and measured moisture contents for Locations 1–4 (a) and 5–7 (b).
Figure 13.
Comparisons between predicted and measured moisture contents for Locations 1–4 (a) and 5–7 (b).


Table 1.
Summary of test information.
| Information | Value | Information | Value |
|---|---|---|---|
| Antenna central frequency | 2 GHz | Samples/scan | 512 |
| Scans/s | 100 | Time range | 12 ns |
| CIR layer thickness | 100 mm | Binder residue content | 64.5% |
| Maximum theoretical specific gravity | 2.38 | Emulsion target (based on dry weight) | 2.5% |
| Bulk specific gravity | 2.05 | Optimum water for mixing | 2.0% |
Table 2.
Aggregate gradation of CIR mixture.
| Sieve Size (mm) | 37.5 | 25 | 19 | 12.5 | 9.5 | 4.75 | 2.36 | 1.18 | 0.6 | 0.35 | 0.15 | 0.075 |
|---|---|---|---|---|---|---|---|---|---|---|---|---|
| % Passing | 100 | 99.0 | 90.8 | 77.3 | 63.8 | 45.9 | 33.1 | 18.1 | 8.2 | 4.1 | 2.7 | 1.9 |
Table 3.
Aggregate gradation of three AC mixtures.
| Sieve Size (mm) | Percent Passing (%) | ||
|---|---|---|---|
| Mix 1 | Mix 2 | Mix 3 | |
| 16 | 100.0 | 100.0 | 100.0 |
| 13.2 | 95.0 | 97.9 | 97.8 |
| 9.5 | 76.5 | 63.5 | 63.3 |
| 4.75 | 53.0 | 29.0 | 18.8 |
| 2.36 | 37.0 | 25.8 | 15.0 |
| 1.18 | 26.5 | 22.7 | 11.5 |
| 0.6 | 19.0 | 19.5 | 8.7 |
| 0.3 | 13.5 | 16.3 | 6.1 |
| 0.15 | 10.0 | 13.2 | 5.4 |
| 0.075 | 6.0 | 10.0 | 4.6 |
Publisher’s Note: MDPI stays neutral with regard to jurisdictional claims in published maps and institutional affiliations. |
© 2021 by the authors. Licensee MDPI, Basel, Switzerland. This article is an open access article distributed under the terms and conditions of the Creative Commons Attribution (CC BY) license (https://creativecommons.org/licenses/by/4.0/).
Share and Cite
MDPI and ACS Style
Cao, Q.; Al-Qadi, I.L. Effect of Moisture Content on Calculated Dielectric Properties of Asphalt Concrete Pavements from Ground-Penetrating Radar Measurements. Remote Sens. 2022, 14, 34. https://doi.org/10.3390/rs14010034
AMA Style
Cao Q, Al-Qadi IL. Effect of Moisture Content on Calculated Dielectric Properties of Asphalt Concrete Pavements from Ground-Penetrating Radar Measurements. Remote Sensing. 2022; 14(1):34. https://doi.org/10.3390/rs14010034
Chicago/Turabian StyleCao, Qingqing, and Imad L. Al-Qadi. 2022. "Effect of Moisture Content on Calculated Dielectric Properties of Asphalt Concrete Pavements from Ground-Penetrating Radar Measurements" Remote Sensing 14, no. 1: 34. https://doi.org/10.3390/rs14010034
Note that from the first issue of 2016, this journal uses article numbers instead of page numbers. See further details here.