
On a Data-Driven Approach for Detecting Disturbance in the Brazilian Savannas Using Time Series of Vegetation Indices


Abstract
:
1. Introduction
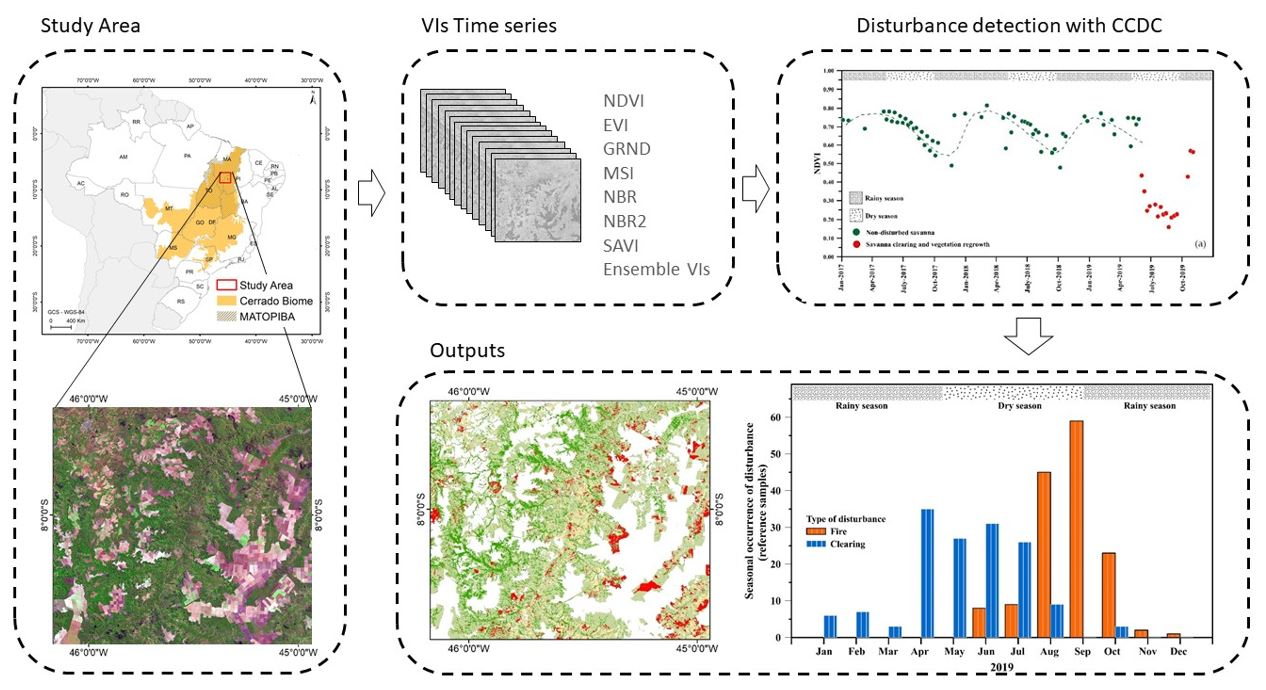
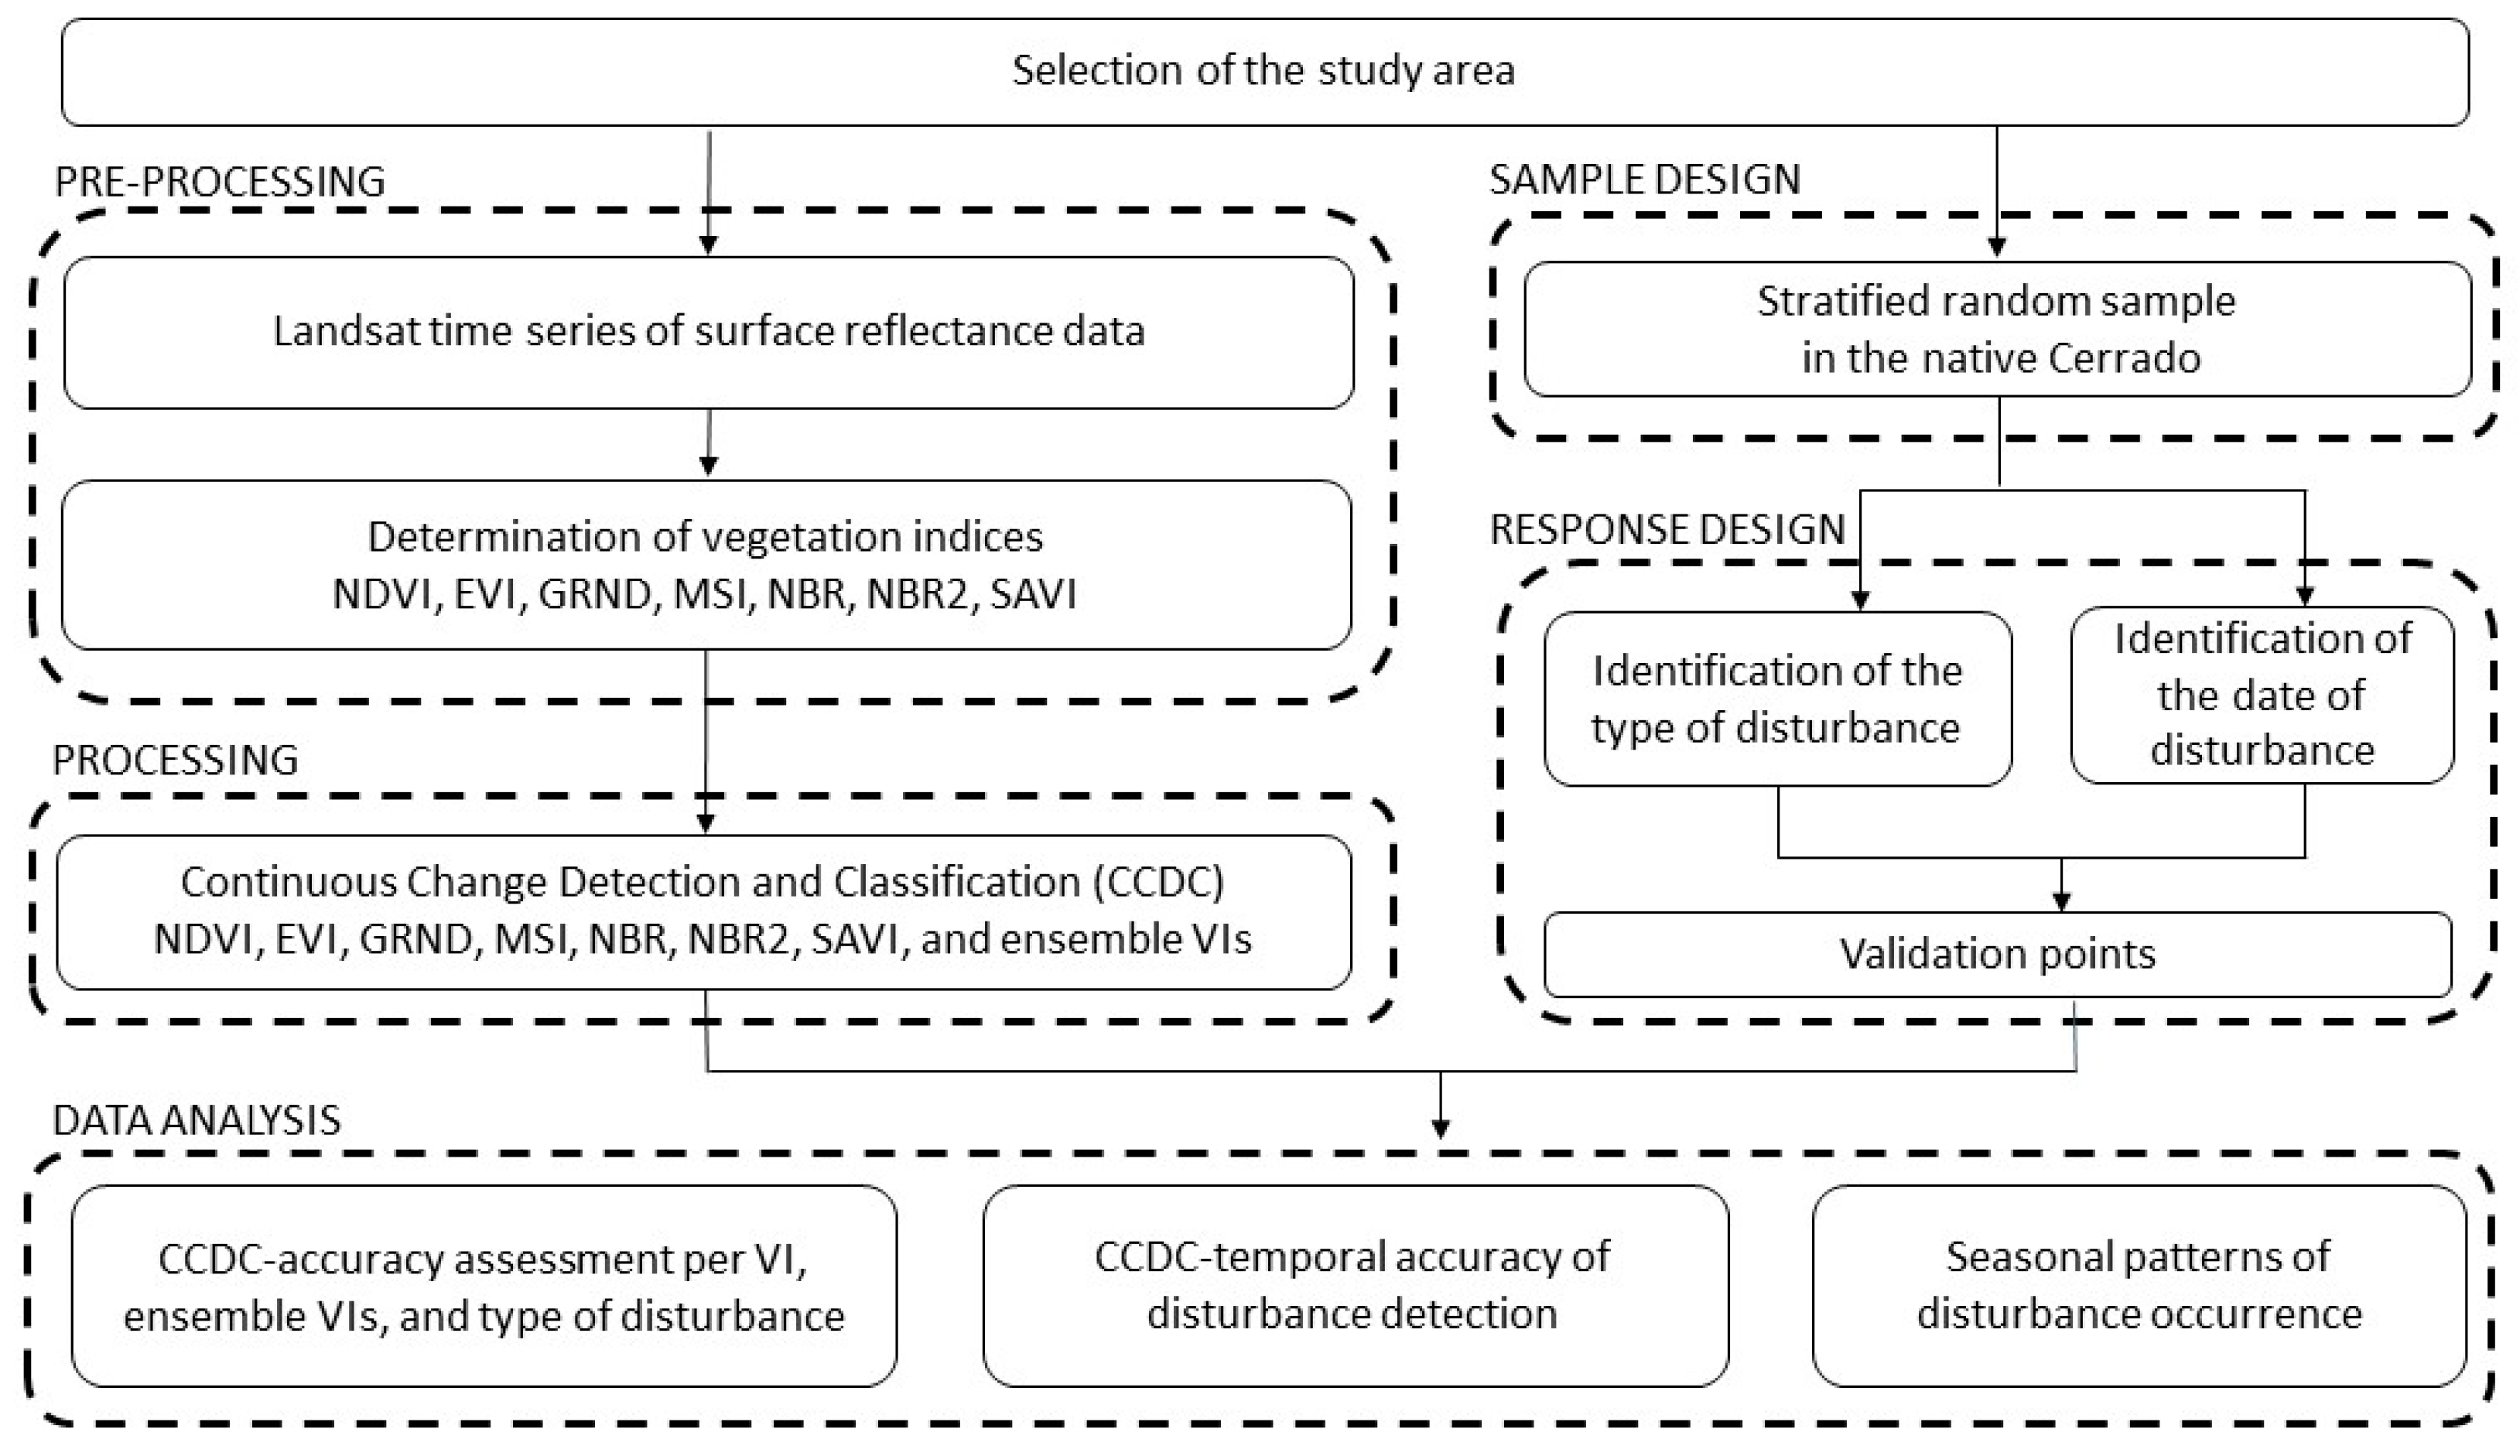
2. Data and Methodology
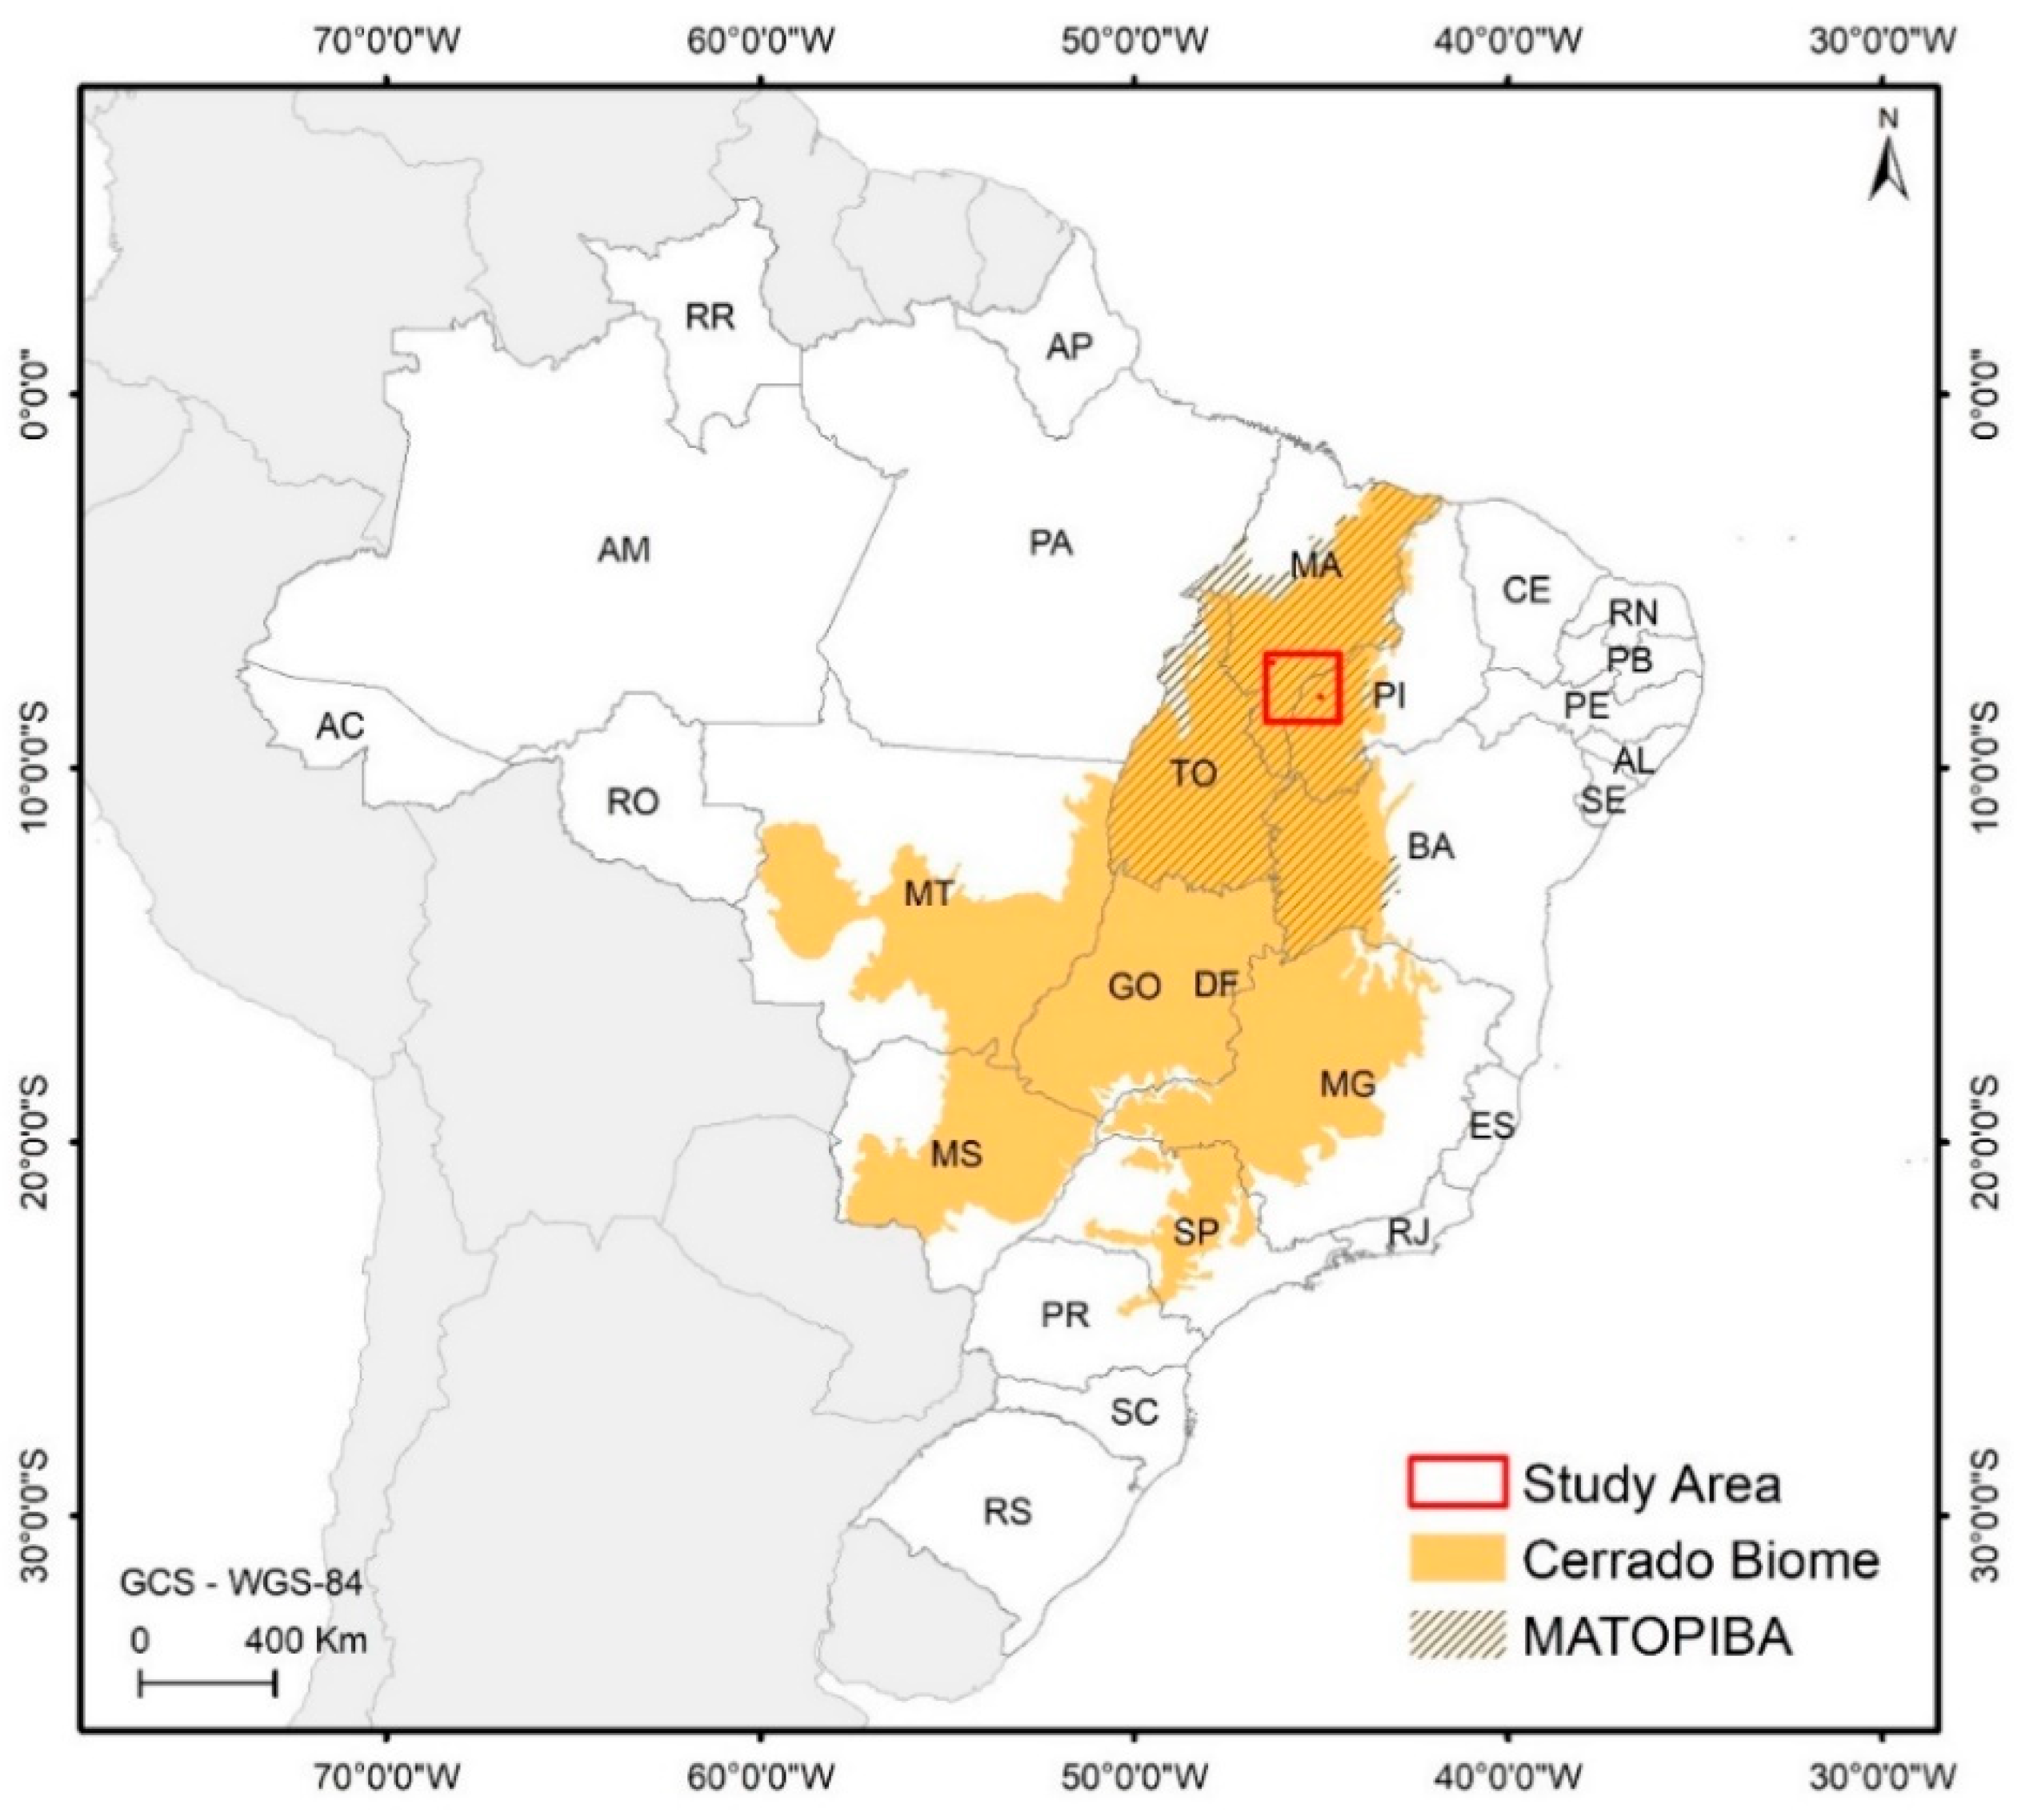
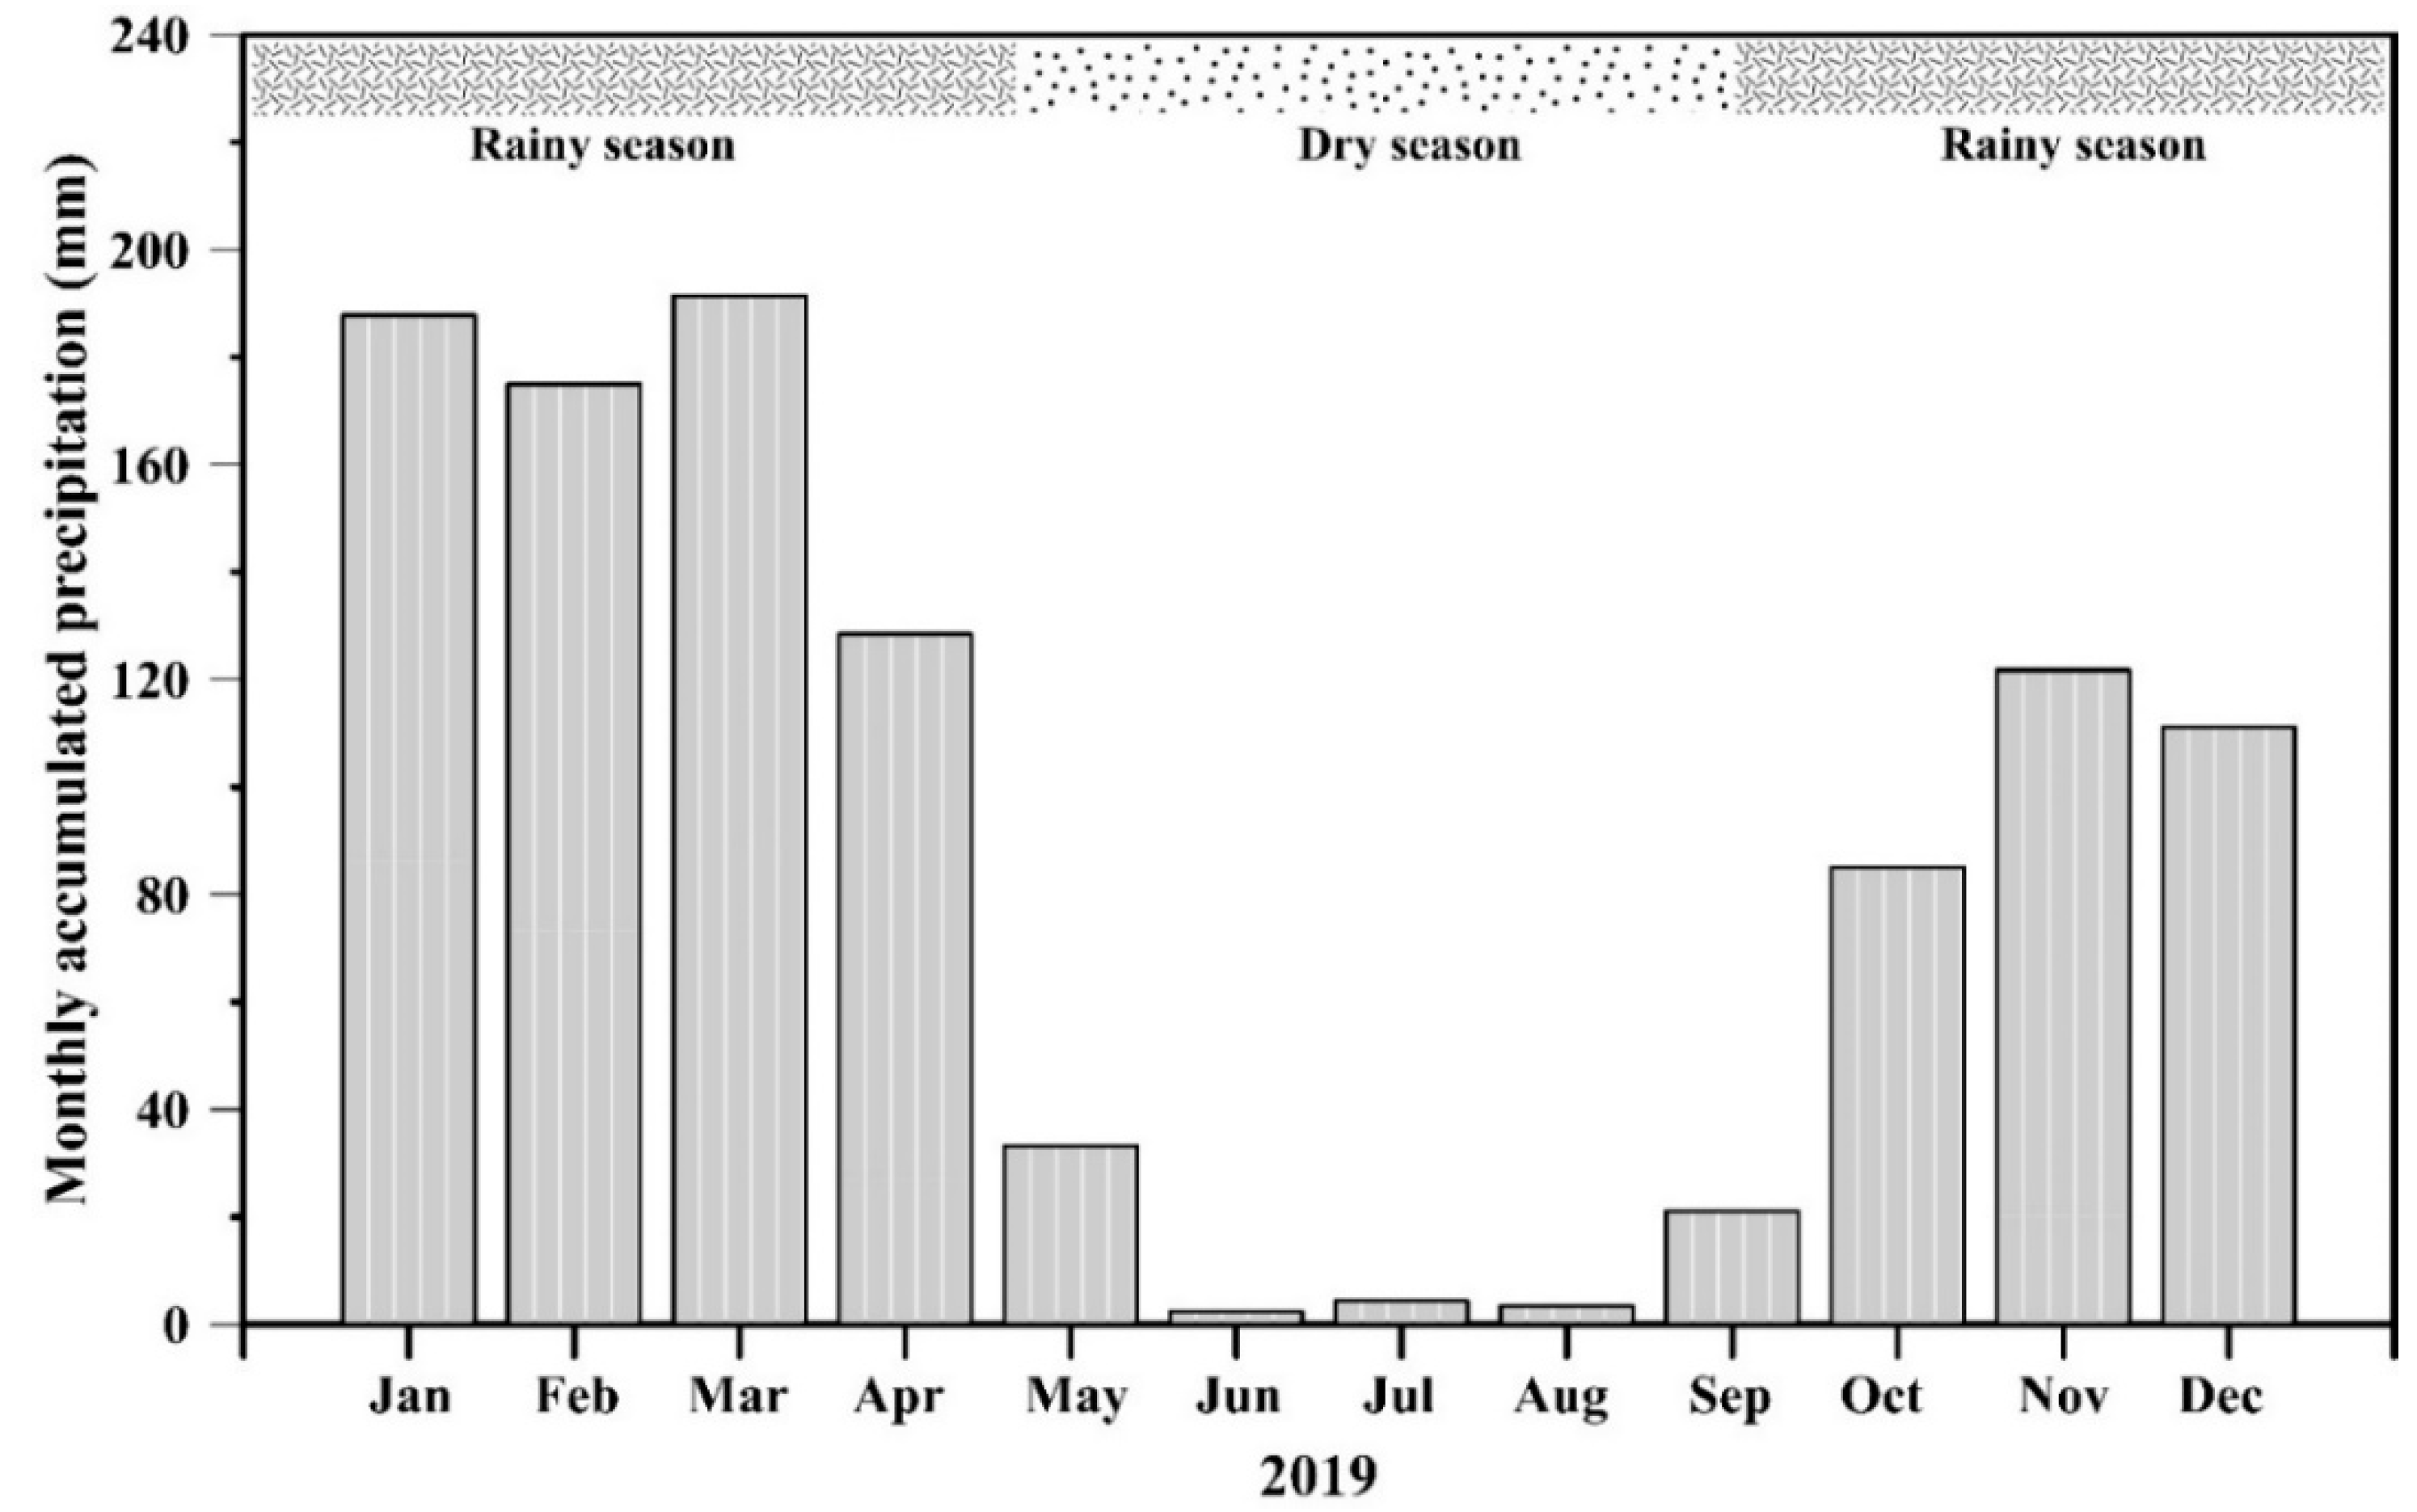
2.1. Selection of the Study Area
2.2. Pre-Processing of Landsat Time Series and Selection of VIs for CCDC
2.3. Continuous Change Detection and Classification (CCDC)
2.4. Data Analysis from Sampling and Response Designs
2.4.1. Accuracy Assessment per VI, Ensemble VIs, and Type of Disturbance
2.4.2. Accuracy of the Detected Time of Disturbance
2.4.3. Seasonal Patterns of Savanna Clearing and Fire Events
3. Results
3.1. Time Series of Vegetation Indices and the Detection of Disturbance
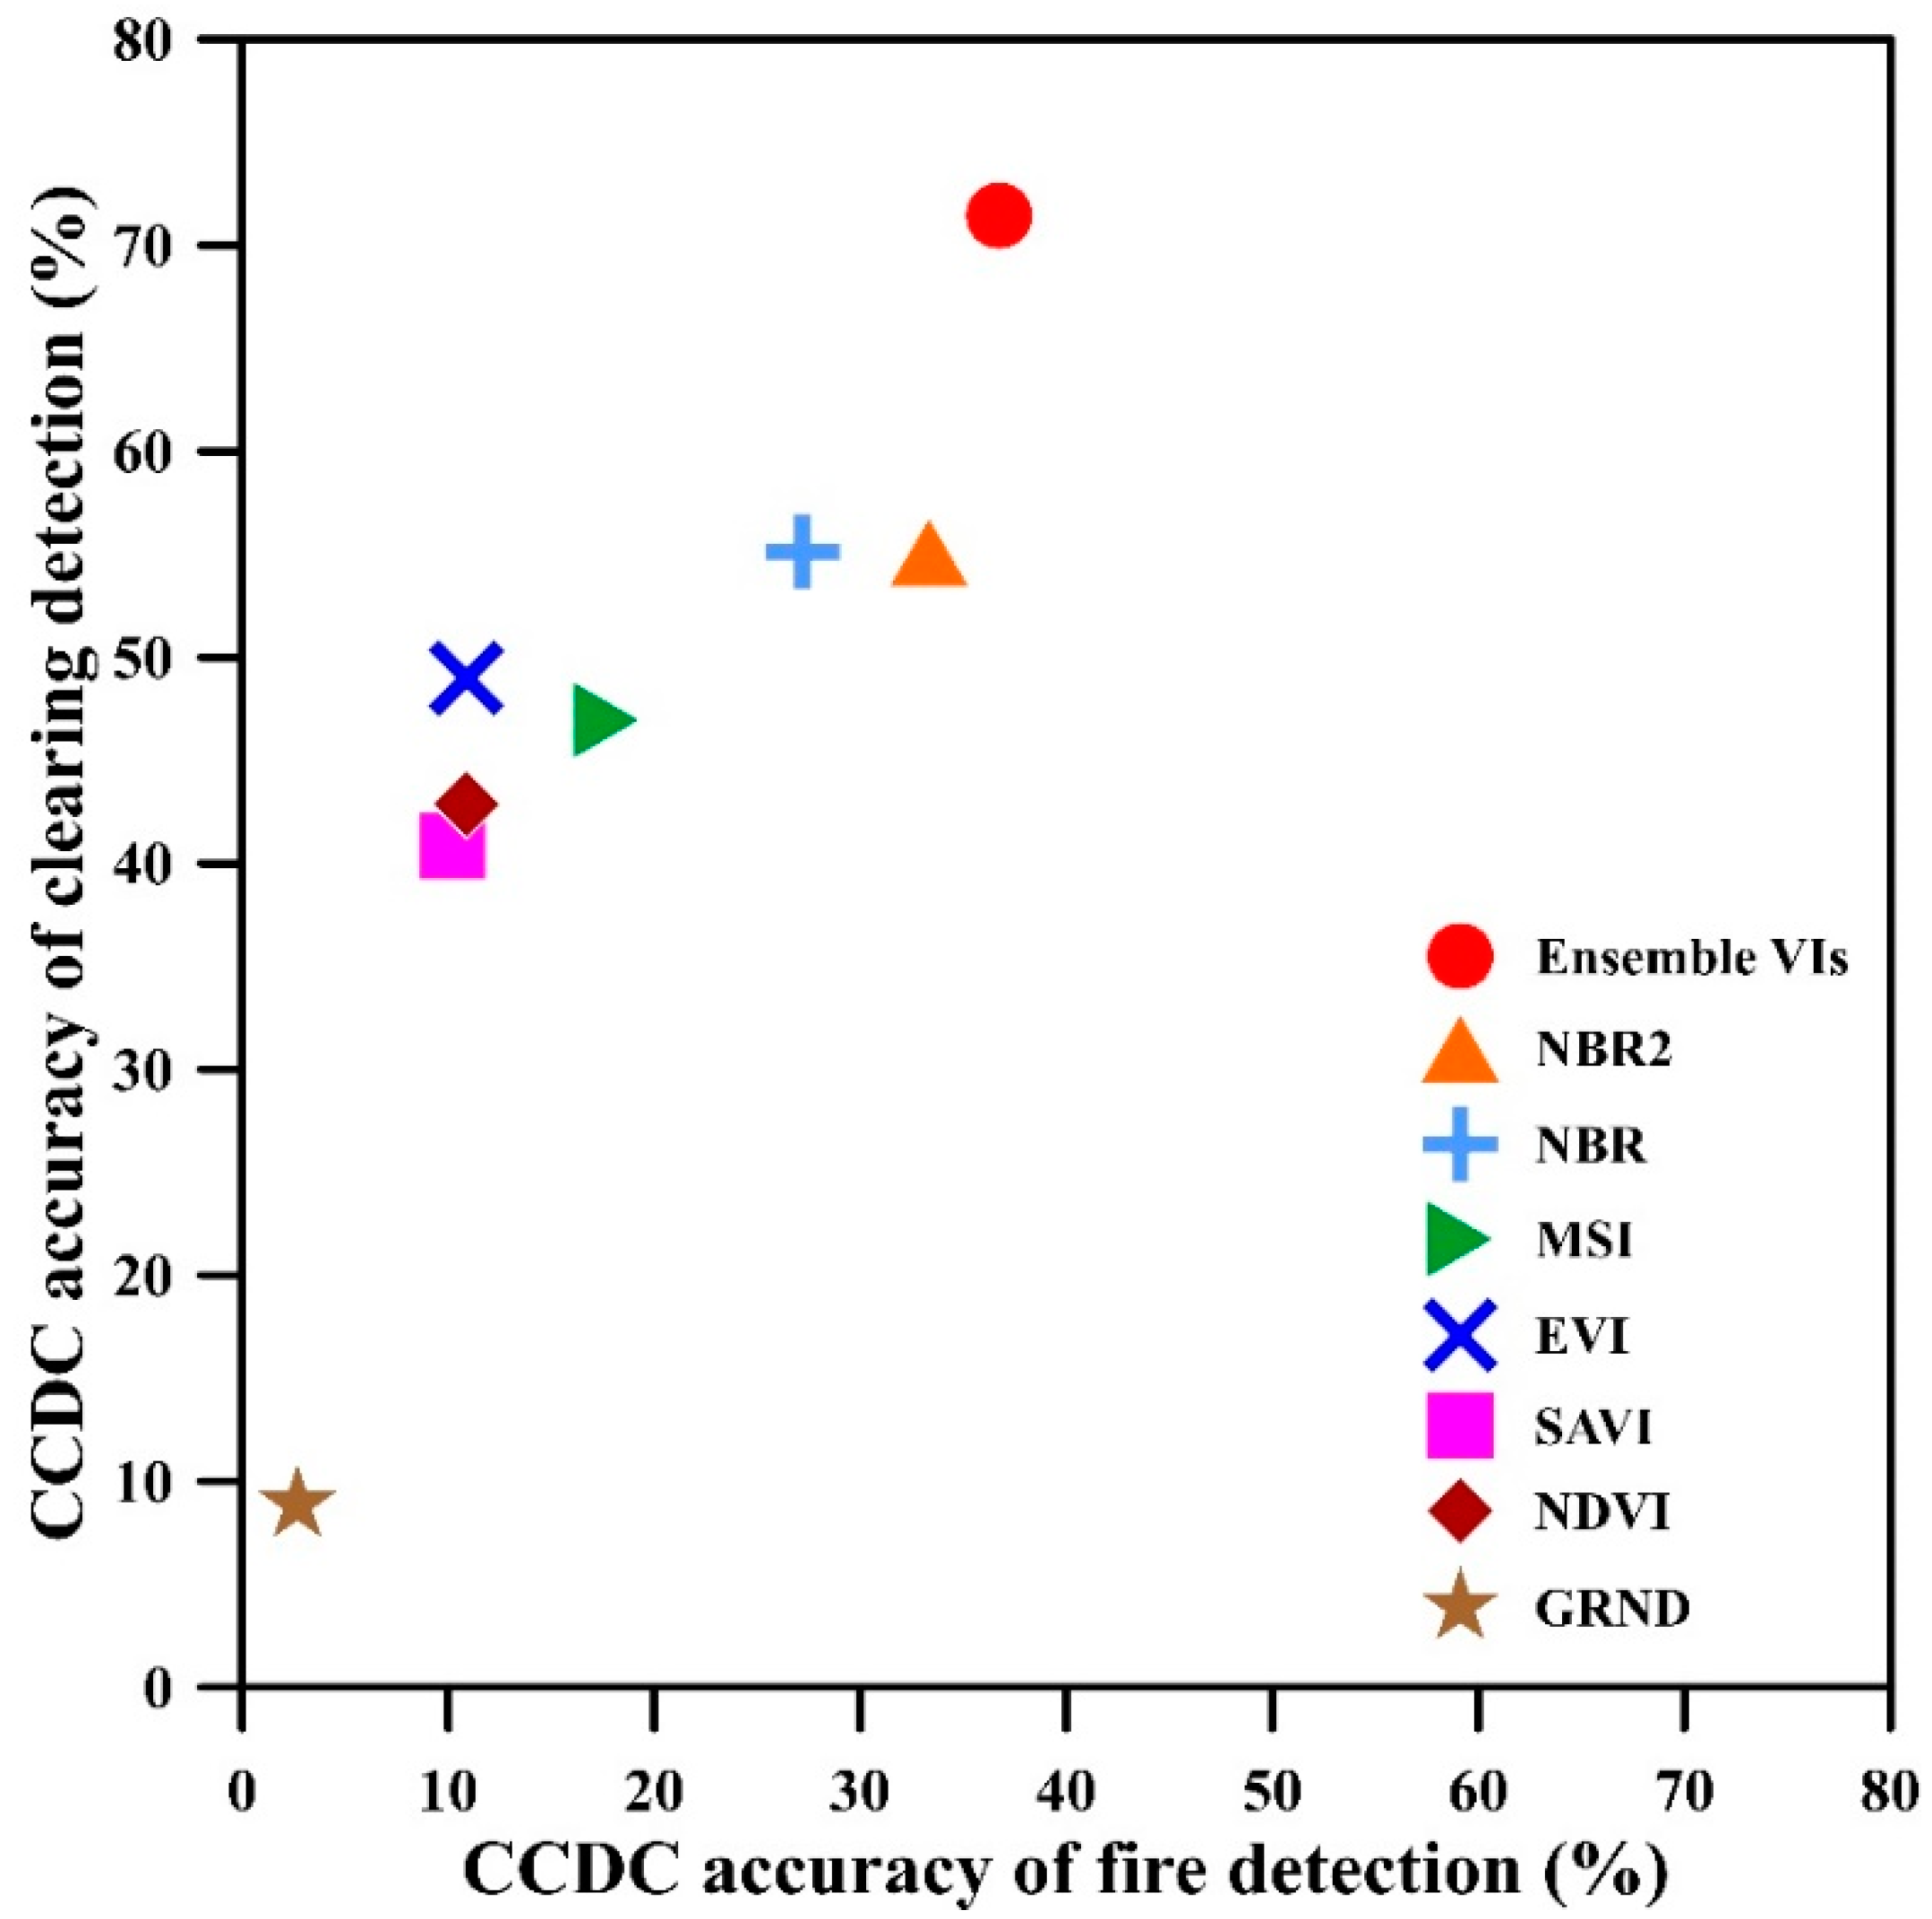
3.2. Variations in Accuracy Metrics per VI, Ensemble VIs, and Type of Disturbance
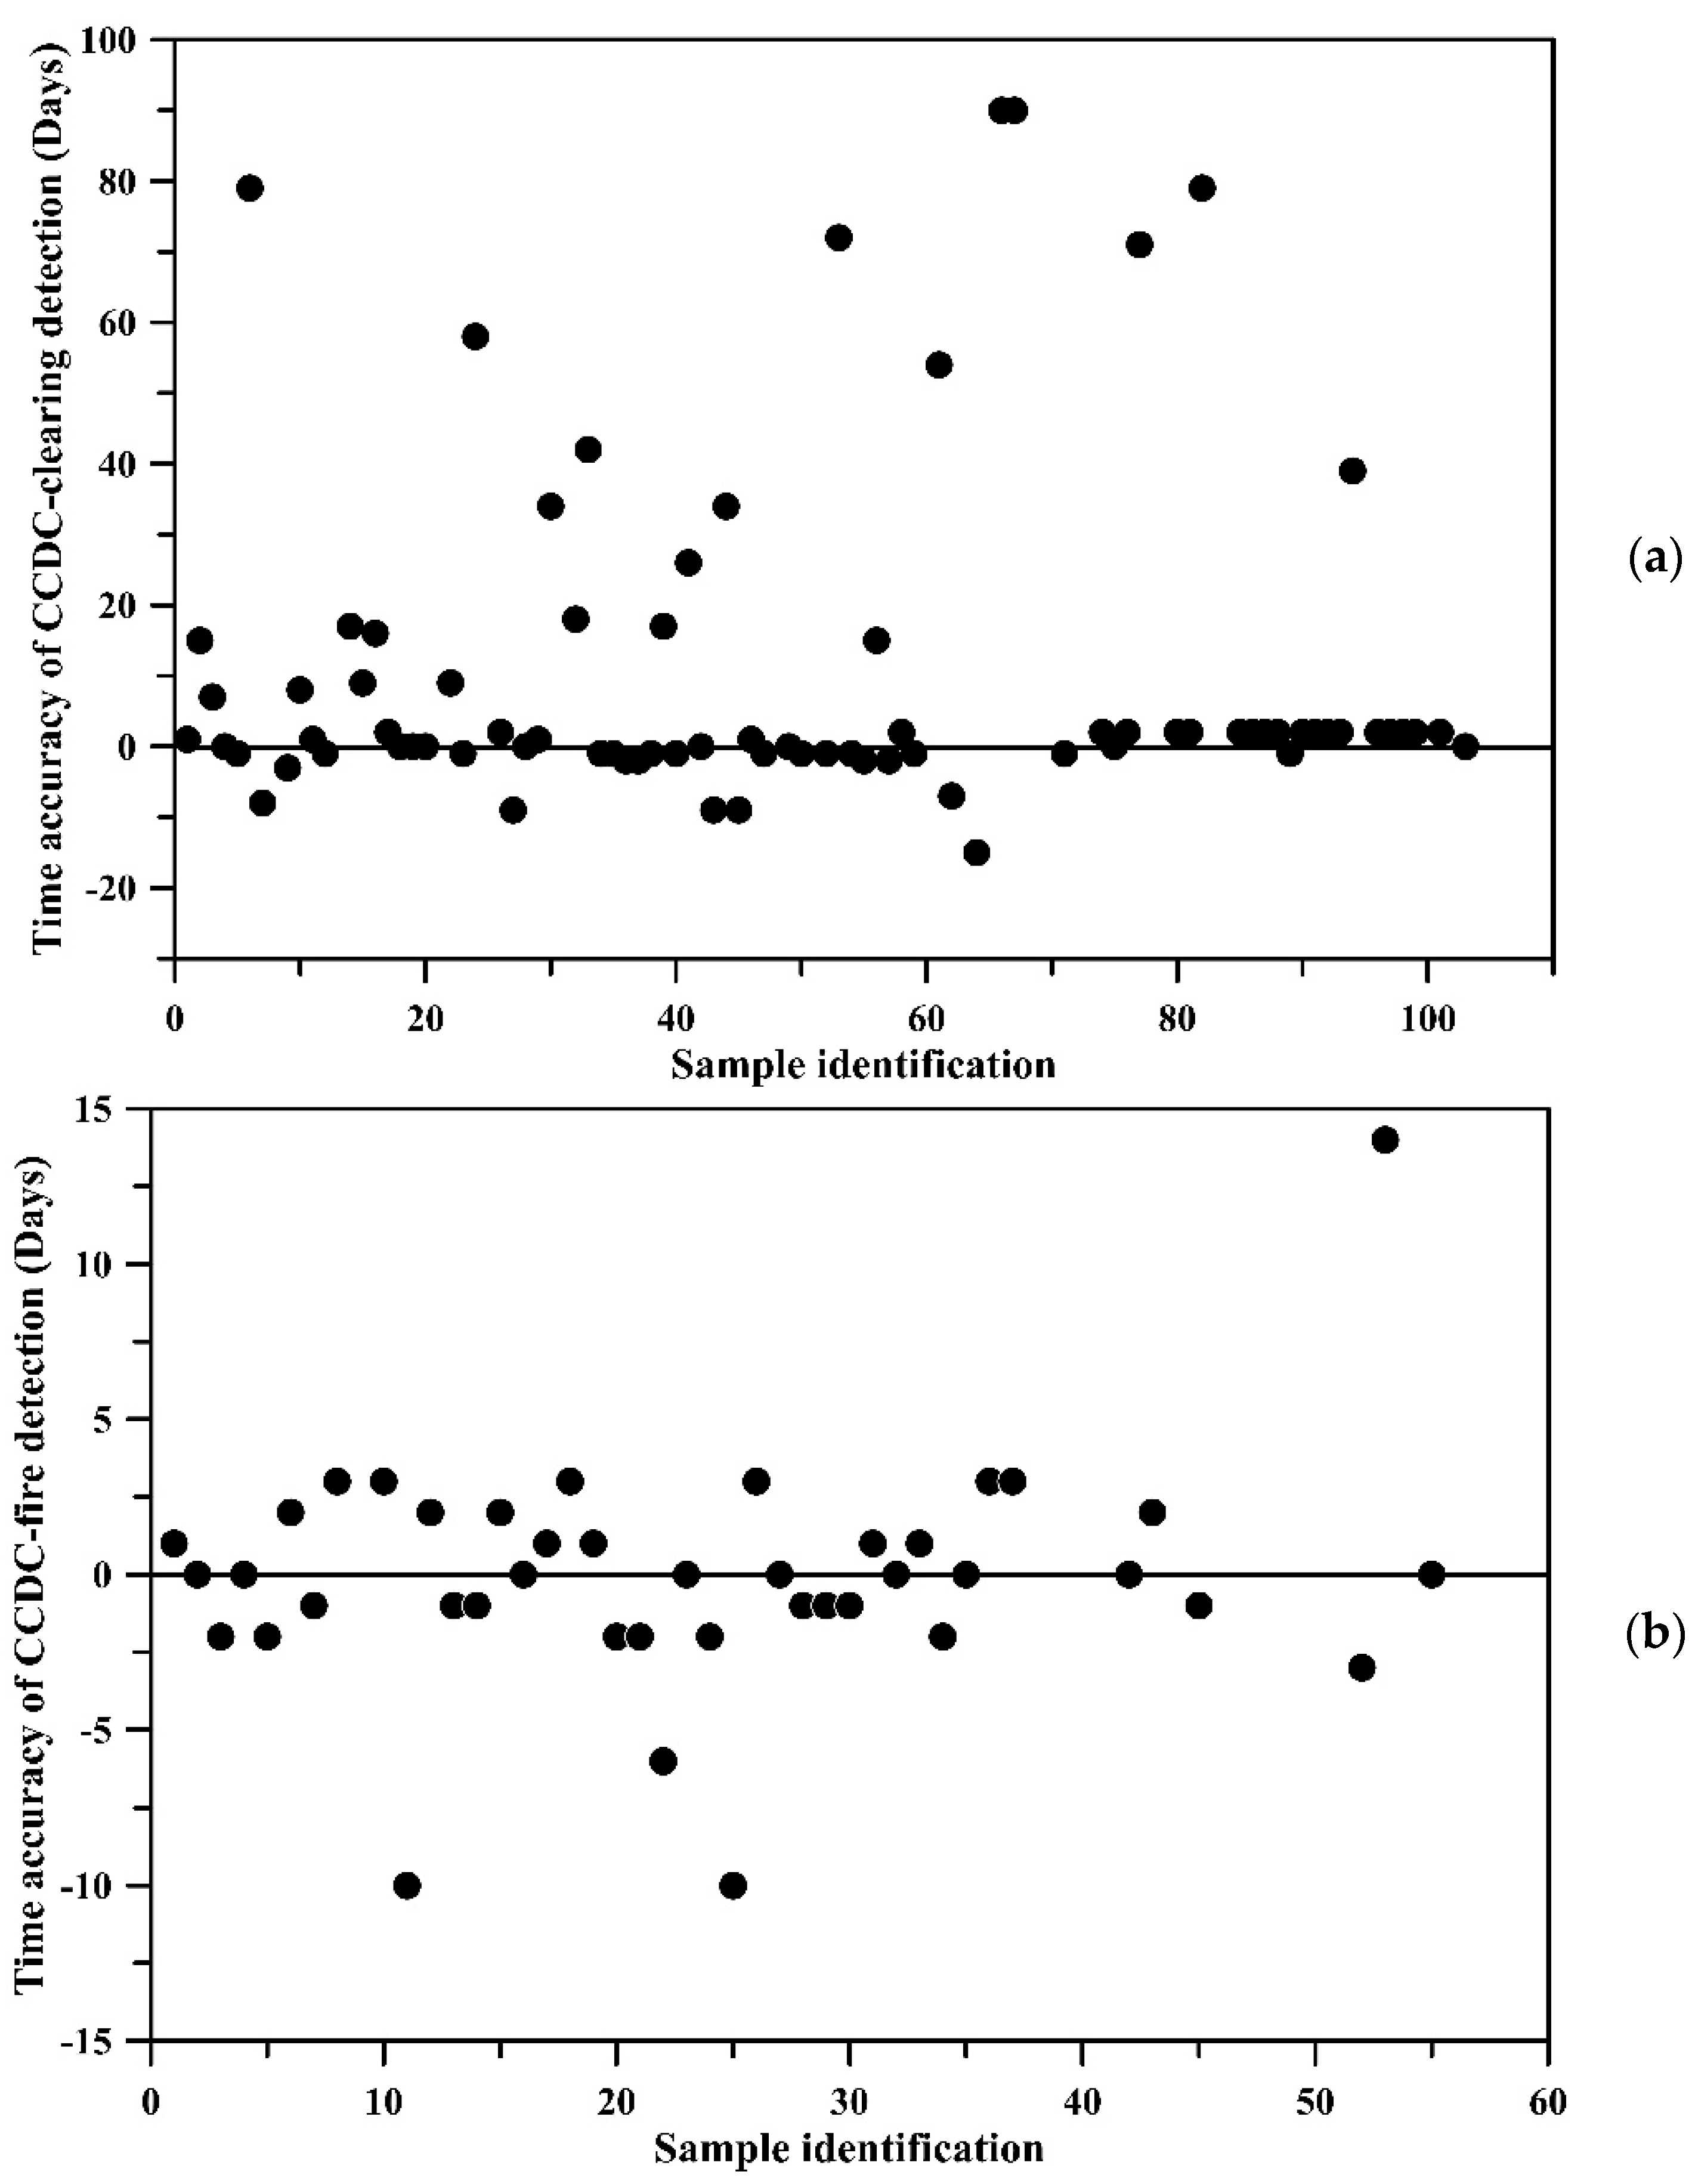
3.3. Assessment of the Correct Time of Disturbance
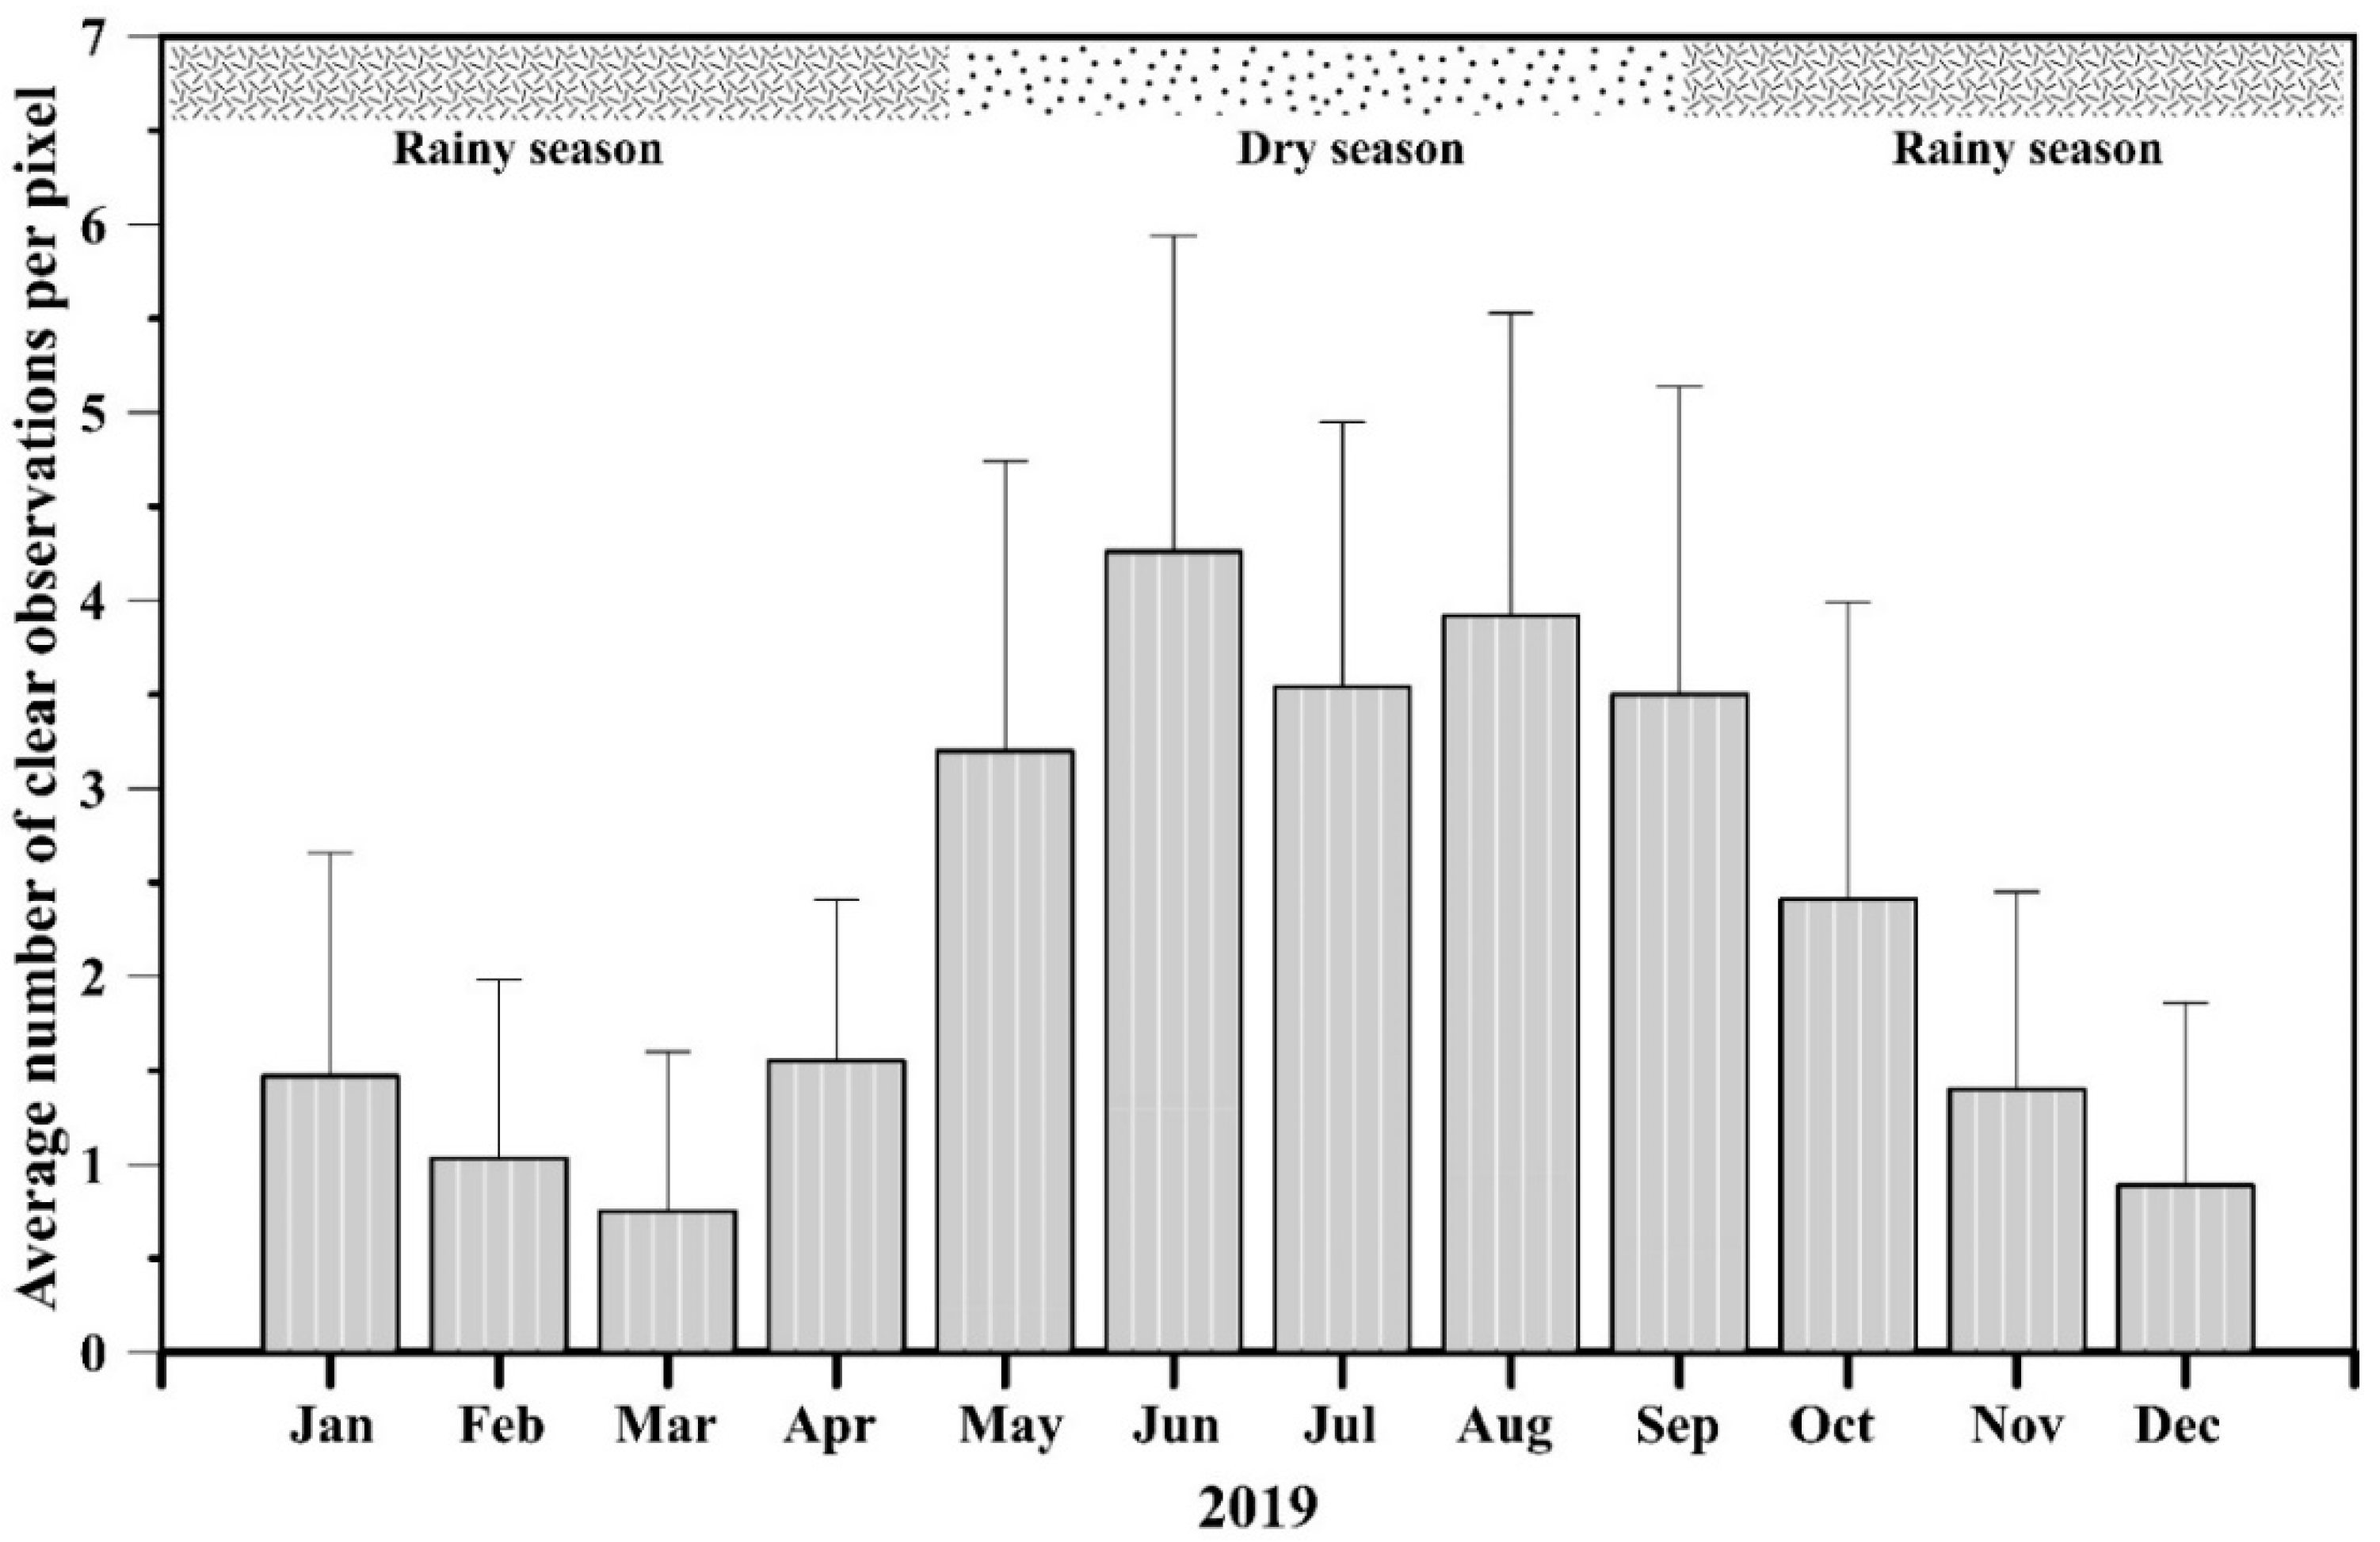
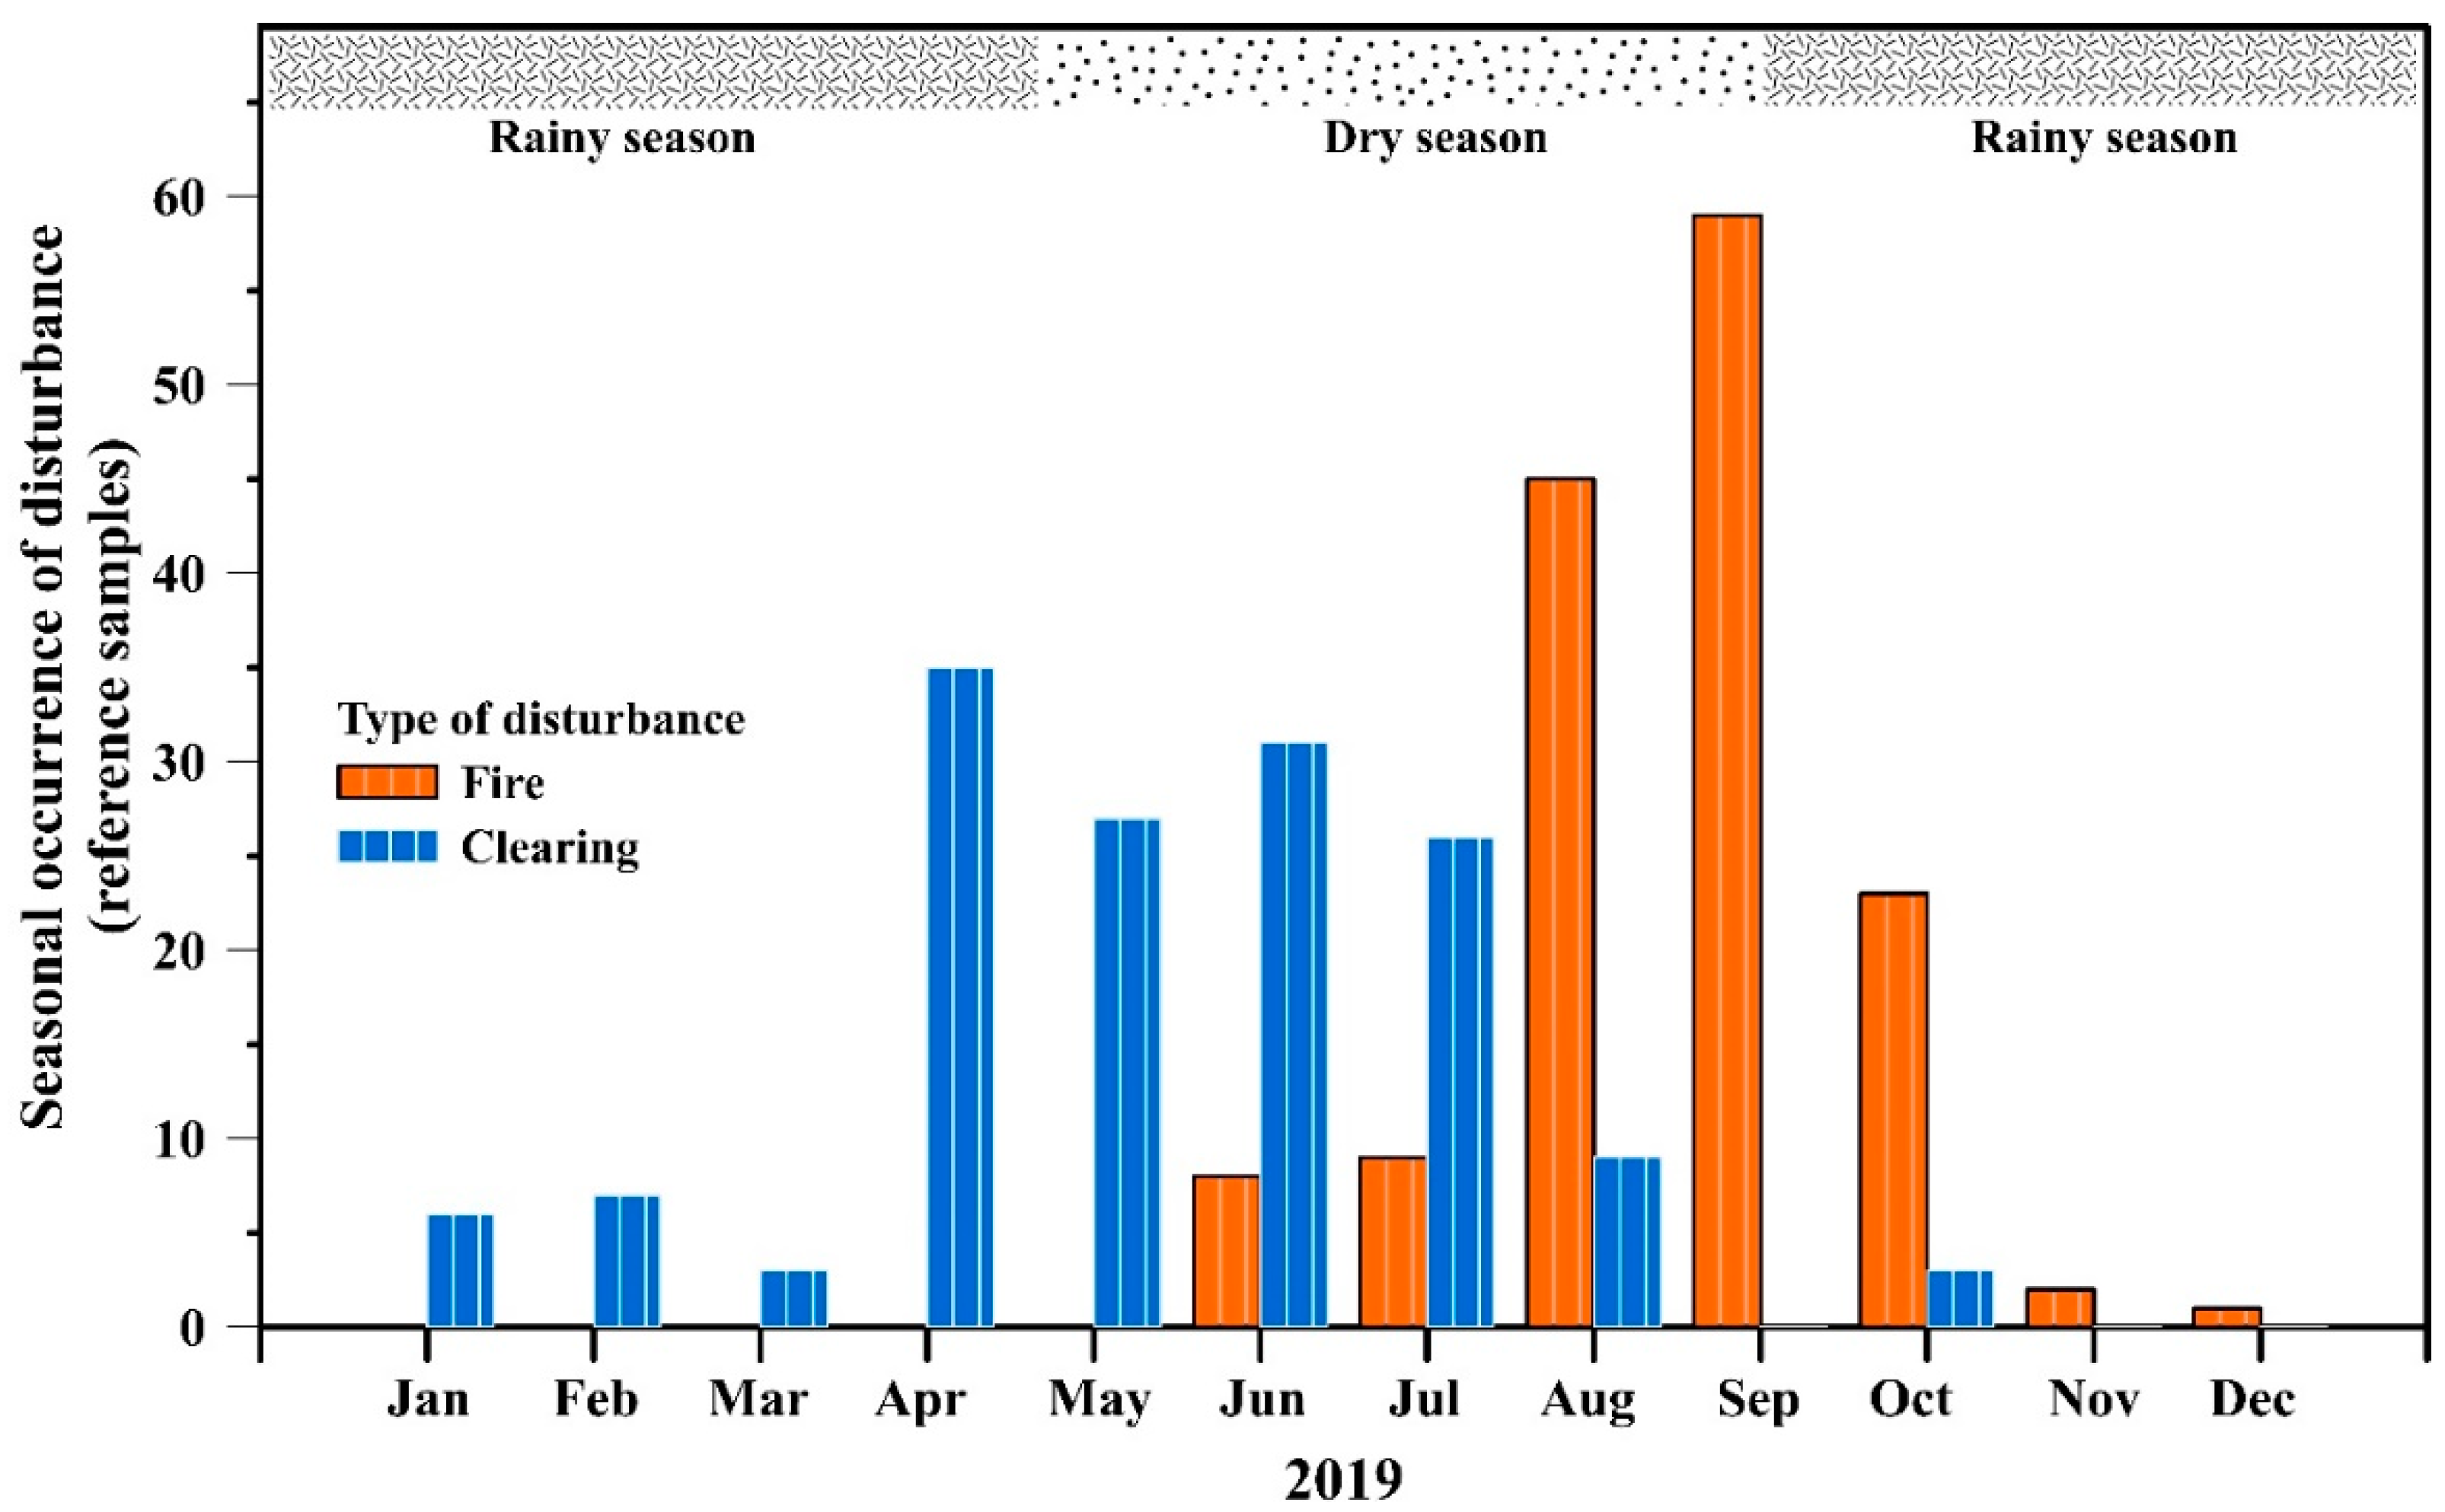
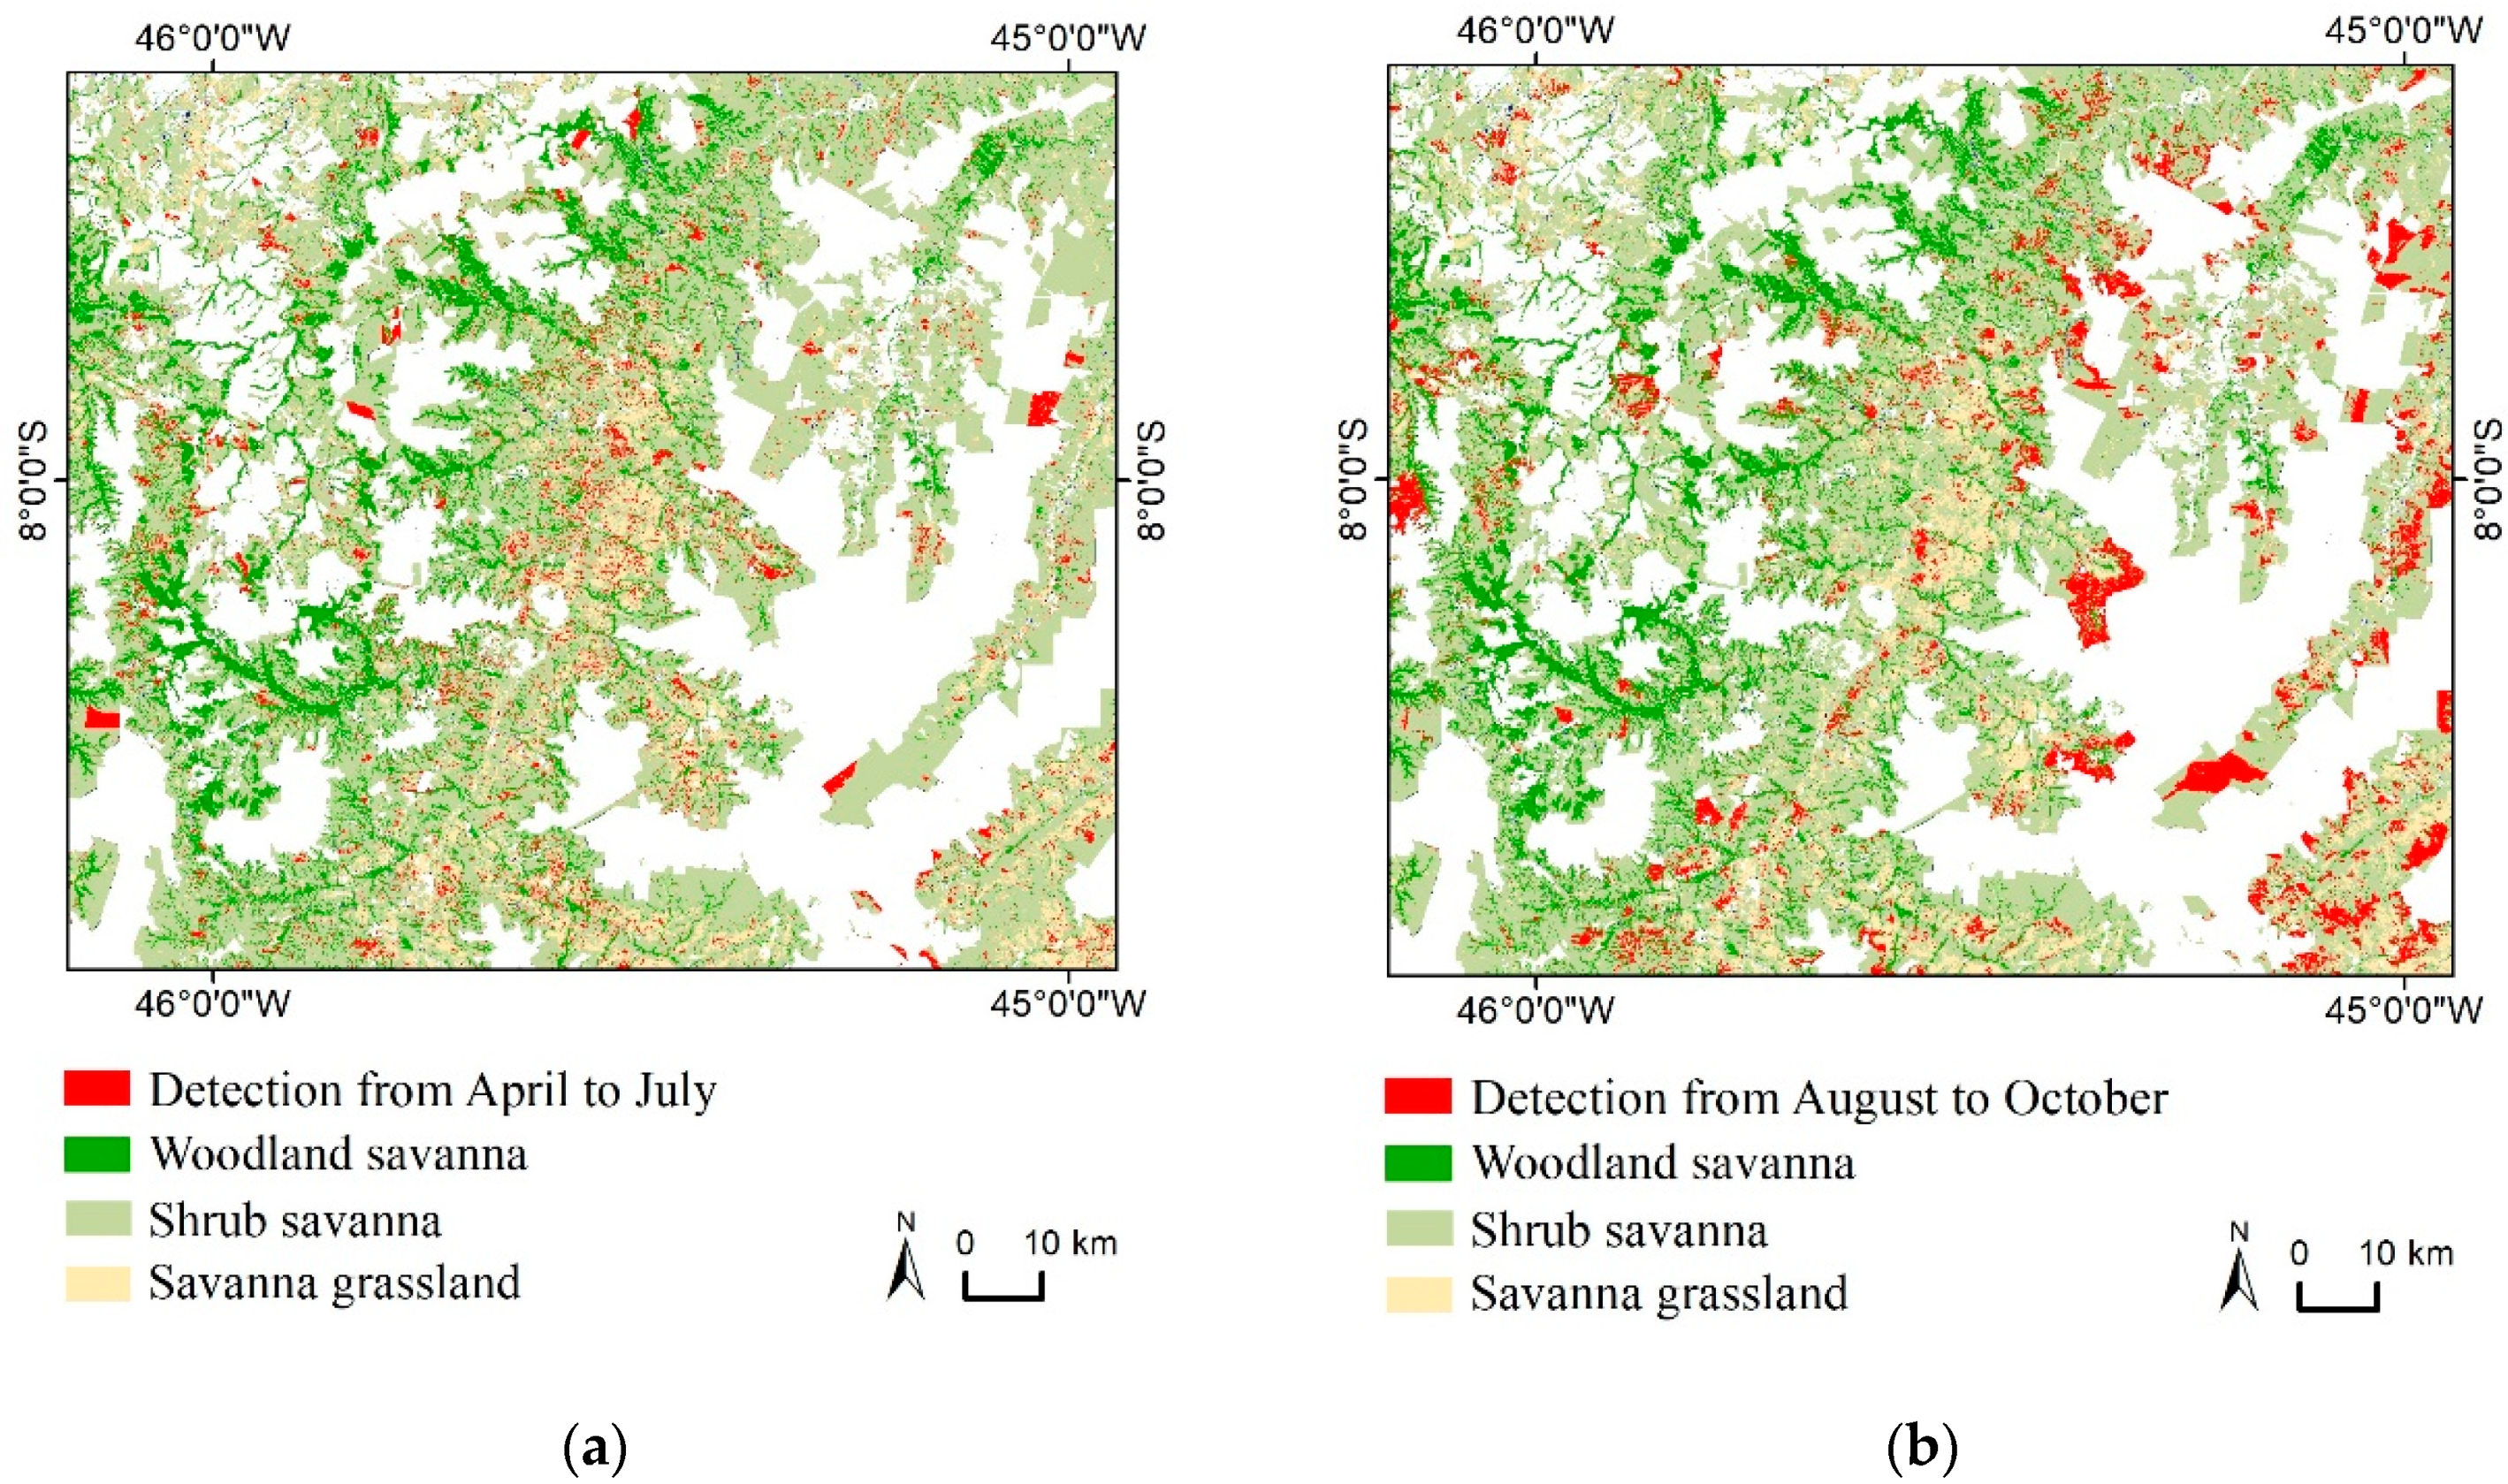
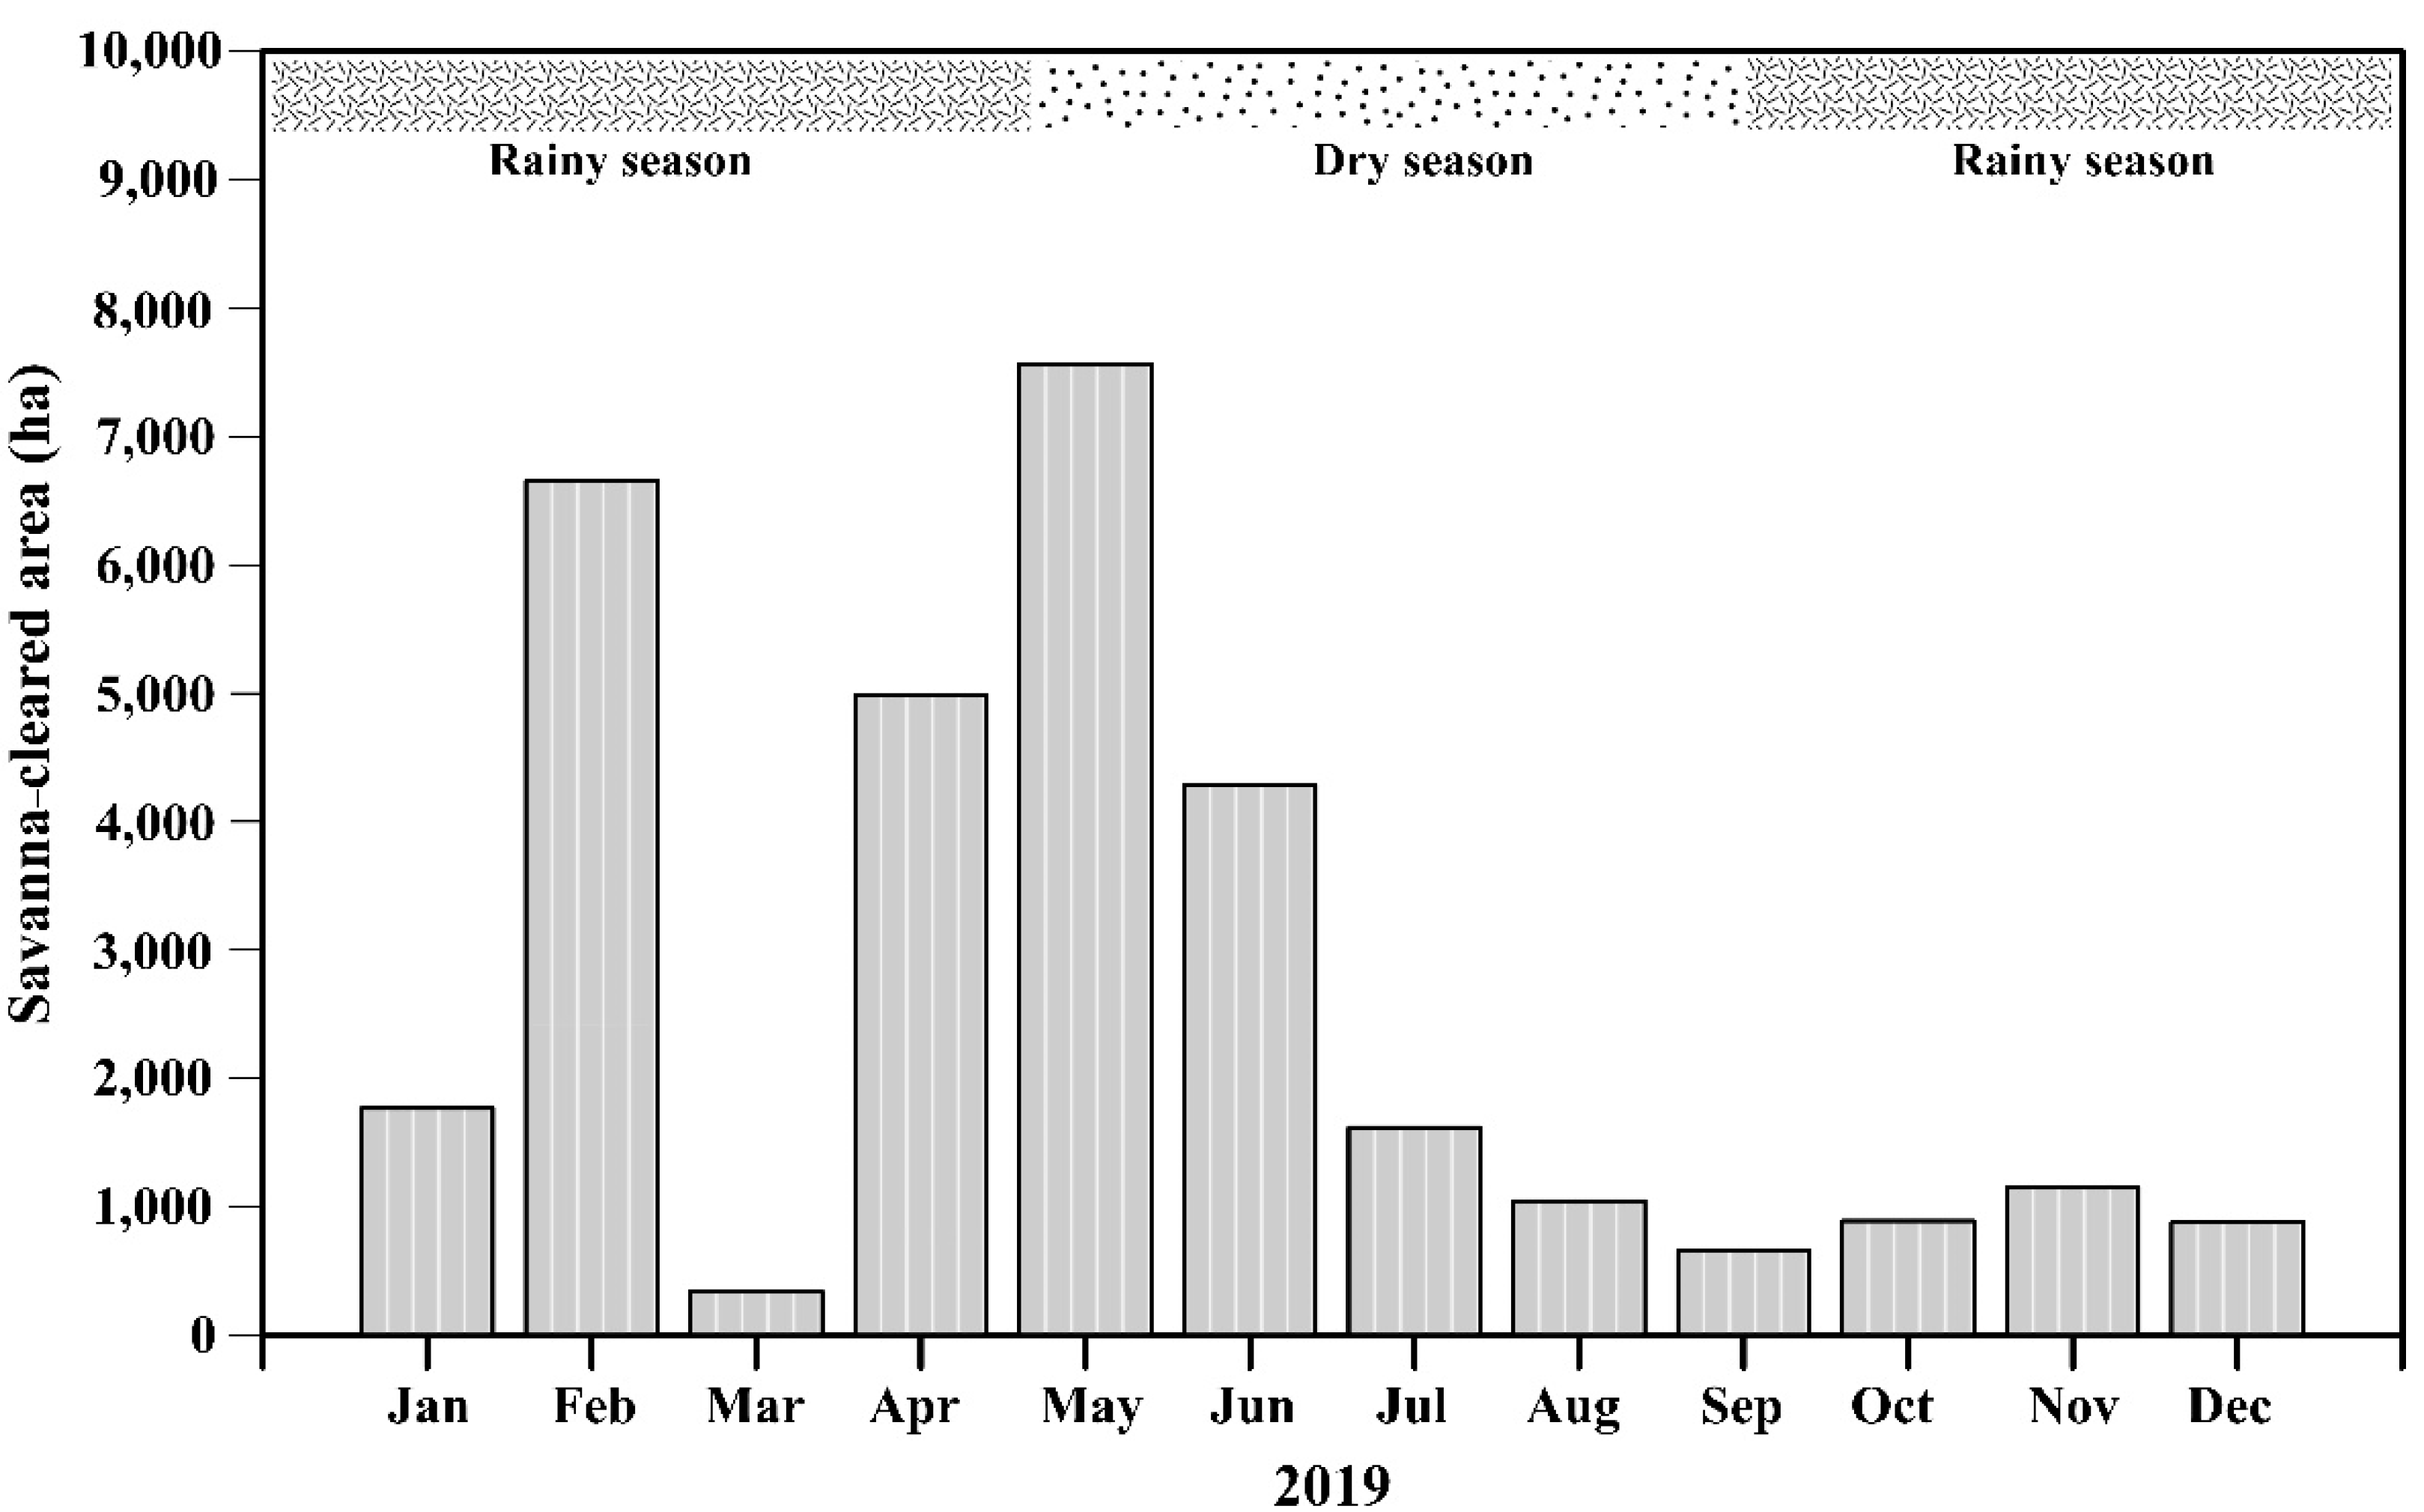
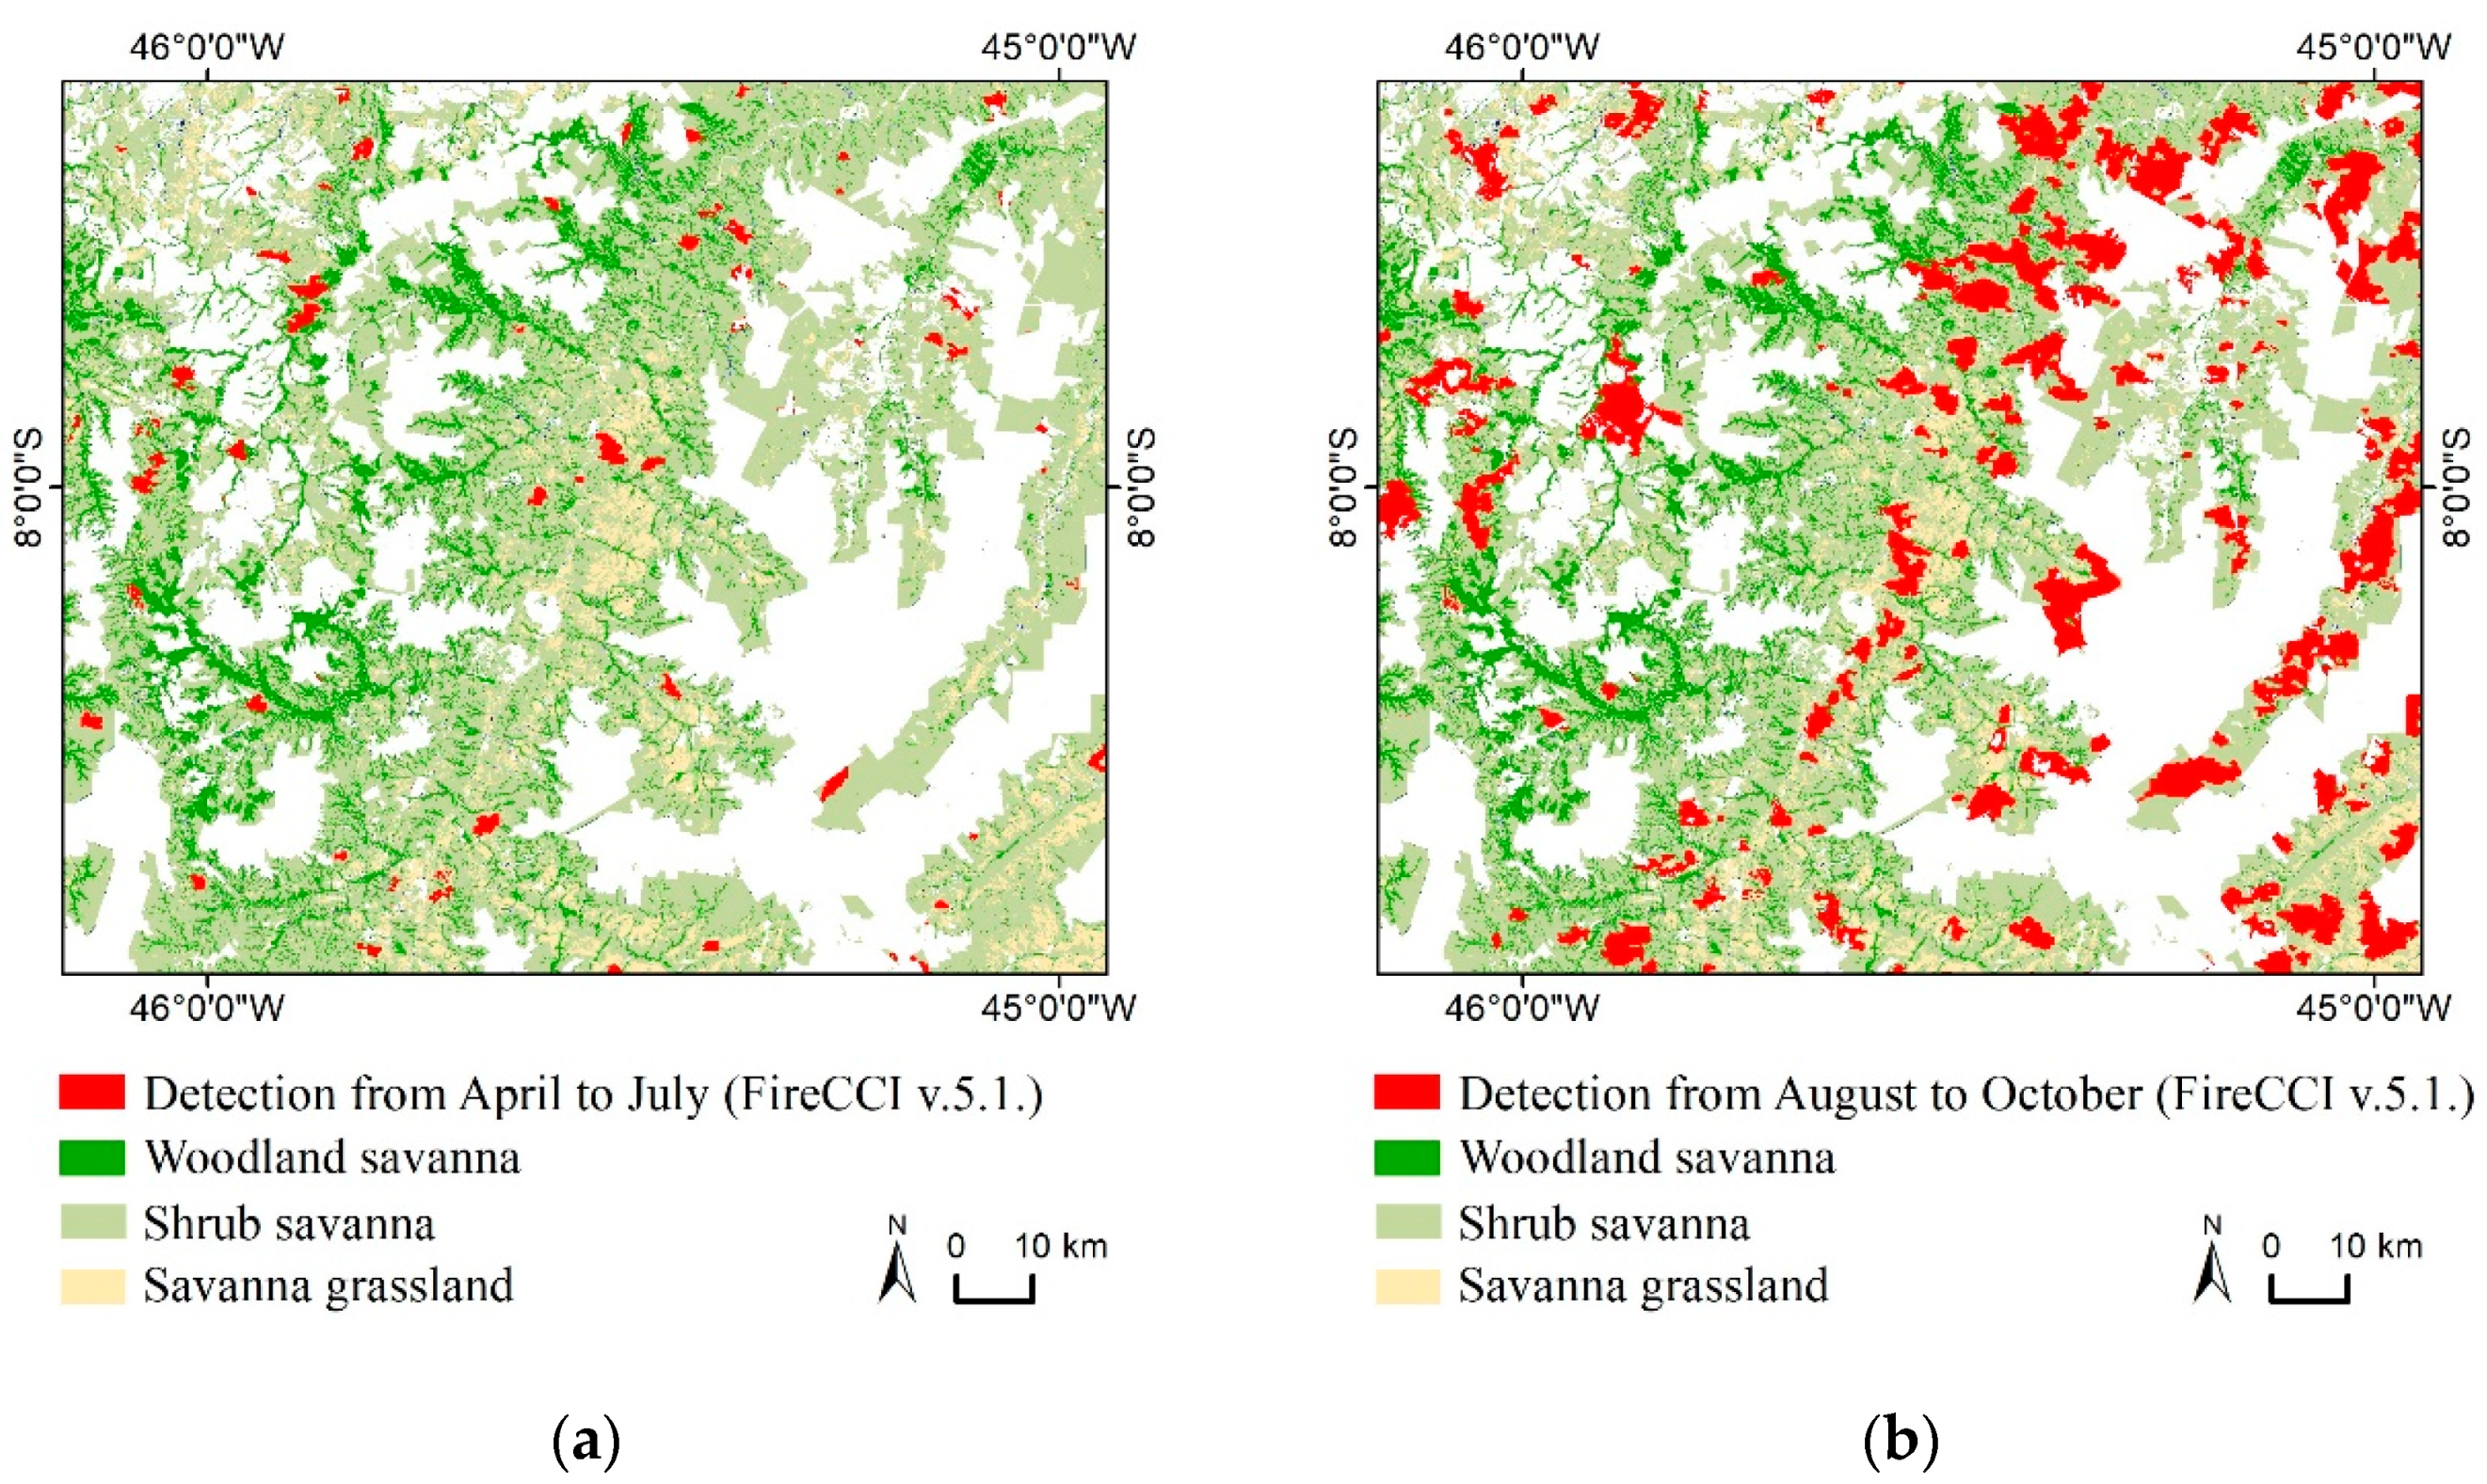
3.4. Seasonal Patterns of Occurrence between Savanna Clearing and Fire
4. Discussion
5. Conclusions
Author Contributions
Funding
Conflicts of Interest
Appendix A


References
- Sano, E.E.; Rosa, R.; Brito, J.L.S.; Ferreira, L.G. Land cover mapping of the tropical savanna region in Brazil. Environ. Monit. Assess. 2010, 166, 113–124. [Google Scholar] [CrossRef]
- Bispo, P.d.C.; Rodríguez-Veiga, P.; Zimbres, B.; Miranda, S.C.; Cezare, C.H.G.; Fleming, S.; Baldacchino, F.; Louis, V.; Rains, D.; Garcia, M.; et al. Woody aboveground biomass mapping of the Brazilian savanna with a multi-sensor and machine learning approach. Remote Sens. 2020, 12, 2685. [Google Scholar] [CrossRef]
- Ferreira, L.G.; Asner, G.P.; Knapp, D.E.; Davidson, E.A.; Coe, M.; Bustamante, M.M.C.; Oliveira, E.L. Equivalent water thickness in savanna ecosystems: MODIS estimates based on ground and EO-1 Hyperion data. Int. J. Remote Sens. 2011, 32, 7423–7440. [Google Scholar] [CrossRef]
- De Miranda, S.d.C.; Bustamante, M.; Palace, M.; Hagen, S.; Keller, M.; Ferreira, L.G. Regional variations in biomass distribution in Brazilian Savanna Woodland. Biotropica 2014, 46, 125–138. [Google Scholar] [CrossRef] [Green Version]
- Silva, J.M.C.d.; Bates, J.M. Biogeographic patterns and conservation in the South American Cerrado: A tropical savanna hotspot. Bioscience 2002, 52, 225. [Google Scholar] [CrossRef]
- Ratter, J.A.; Bridgewater, S.; Ribeiro, J.F. Biodiversity patterns of the woody vegetation of the Brazilian Cerrados. In Neotropical Savannas and Seasonally Dry Forests; Penington, T., Ratter, J.A., Eds.; Taylor & Francis: London, UK, 2006; pp. 31–66. [Google Scholar]
- Jacon, A.D.; Galvão, L.S.; Dalagnol, R.; dos Santos, J.R. Aboveground biomass estimates over Brazilian savannas using hyperspectral metrics and machine learning models: Experiences with Hyperion/EO-1. GISci. Remote Sens. 2021, 58, 1129. [Google Scholar] [CrossRef]
- Spera, S. Agricultural intensification can preserve the Brazilian Cerrado: Applying lessons from Mato Grosso and Goiás to Brazil’s last agricultural frontier. Trop. Conserv. Sci. 2017, 10, 1940082917720662. [Google Scholar] [CrossRef] [Green Version]
- Graesser, J.; Aide, T.M.; Grau, H.R.; Ramankutty, N. Cropland/pastureland dynamics and the slowdown of deforestation in Latin America. Environ. Res. Lett. 2015, 10, 034017. [Google Scholar] [CrossRef]
- Rausch, L.L.; Gibbs, H.K.; Schelly, I.; Brandão, A.; Morton, D.C.; Filho, A.C.; Strassburg, B.; Walker, N.; Noojipady, P.; Barreto, P.; et al. Soy expansion in Brazil’s Cerrado. Conserv. Lett. 2019, 12, e12671. [Google Scholar] [CrossRef]
- Dou, Y.; da Silva, R.F.B.; Yang, H.; Liu, J. Spillover effect offsets the conservation effort in the Amazon. J. Geogr. Sci. 2018, 28, 1715–1732. [Google Scholar] [CrossRef] [Green Version]
- Lima, M.; da Silva, C.A., Jr.; Rausch, L.; Gibbs, H.K.; Johann, J.A. Demystifying sustainable soy in Brazil. Land Use Policy 2019, 82, 349–352. [Google Scholar] [CrossRef]
- Nepstad, L.S.; Gerber, J.S.; Hill, J.D.; Dias, L.C.P.; Costa, M.H.; West, P.C. Pathways for recent Cerrado soybean expansion: Extending the soy moratorium and implementing integrated crop livestock systems with soybeans. Environ. Res. Lett. 2019, 14, 044029. [Google Scholar] [CrossRef]
- Zalles, V.; Hansen, M.C.; Potapov, P.V.; Stehman, S.V.; Tyukavina, A.; Pickens, A.; Song, X.P.; Adusei, B.; Okpa, C.; Aguilar, R.; et al. Near doubling of Brazil’s intensive row crop area since 2000. Proc. Natl. Acad. Sci. USA 2019, 116, 428–435. [Google Scholar] [CrossRef] [PubMed] [Green Version]
- Miranda, H.S.; Sato, M.N.; Neto, W.N.; Aires, F.S. Fires in the Cerrado, the Brazilian savanna. Trop. Fire Ecol. 2009, 2, 427–450. [Google Scholar] [CrossRef]
- Almeida de Souza, A.; Galvão, L.S.; Korting, T.S.; Prieto, J.D. Dynamics of savanna clearing and land degradation in the newest agricultural frontier in Brazil. GISci. Remote Sens. 2020, 57, 965–984. [Google Scholar] [CrossRef]
- Pivello, V.R. The use of fire in the Cerrado and Amazonian rainforests of Brazil: Past and present. Fire Ecol. 2011, 7, 24–39. [Google Scholar] [CrossRef]
- Sano, E.E.; Ferreira, L.G.; Asner, G.P.; Steinke, E.T. Spatial and temporal probabilities of obtaining cloud-free Landsat images over the Brazilian tropical savanna. Int. J. Remote Sens. 2007, 28, 2739–2752. [Google Scholar] [CrossRef]
- Parente, L.; Nogueira, S.; Baumann, L.; Almeida, C.; Maurano, L.; Affonso, A.G.; Ferreira, L. Quality assessment of the PRODES Cerrado deforestation data. Remote. Sens. Appl. Soc. Environ. 2021, 21, 100444. [Google Scholar] [CrossRef]
- De Oliveira, L.M.; Galvão, L.S.; Ponzoni, F.J. Topographic effects on the determination of hyperspectral vegetation indices: A case study in Southeastern Brazil. Geocarto Int. 2019, 36, 2186–2203. [Google Scholar] [CrossRef]
- Eduarda Martiniano de Oliveira, S.; Espírito-Santo, F.D.B.; Acerbi-Júnior, F.W.; Galvão, L.S.; Withey, K.D.; Blackburn, G.A.; de Mello, J.M.; Shimabukuro, Y.E.; Domingues, T.; Scolforo, J.R.S. Reducing the effects of vegetation phenology on change detection in tropical seasonal biomes. GISci. Remote Sens. 2019, 56, 699–717. [Google Scholar] [CrossRef]
- Galvão, L.S.; De Souza, A.A.; Breunig, F.M. A hyperspectral experiment over tropical forests based on the EO-1 orbit change and PROSAIL simulation. GISci. Remote Sens. 2020, 57, 74–90. [Google Scholar] [CrossRef]
- Kennedy, R.E.; Yang, Z.; Cohen, W.B. Detecting trends in forest disturbance and recovery using yearly Landsat time series: 1. LandTrendr–Temporal segmentation algorithms. Remote Sens. Environ. 2010, 114, 2897–2910. [Google Scholar] [CrossRef]
- Zhu, Z.; Woodcock, C.E. Continuous change detection and classification of land cover using all available Landsat data. Remote Sens. Environ. 2014, 144, 152–171. [Google Scholar] [CrossRef] [Green Version]
- Awty-Carroll, K.; Bunting, P.; Hardy, A.; Bell, G. An evaluation and comparison of four dense time series change detection methods using simulated data. Remote Sens. 2019, 11, 2779. [Google Scholar] [CrossRef] [Green Version]
- Shimizu, K.; Ota, T.; Mizoue, N. Detecting forest changes using dense Landsat 8 and Sentinel-1 time series data in tropical seasonal forests. Remote Sens. 2019, 11, 1889. [Google Scholar] [CrossRef] [Green Version]
- Tang, X.; Bullock, E.L.; Olofsson, P.; Estel, S.; Woodcock, C.E. Near real-time monitoring of tropical forest disturbance: New algorithms and assessment framework. Remote Sens. Environ. 2019, 224, 202–218. [Google Scholar] [CrossRef]
- Jacon, A.D.; Galvão, L.S.; dos Santos, J.R.; Sano, E.E. Seasonal characterization and discrimination of savannah physiognomies in Brazil using hyperspectral metrics from Hyperion/EO-1. Int. J. Remote. Sens. 2017, 38, 4494–4516. [Google Scholar] [CrossRef]
- Key, C.H.; Benson, N.C. Landscape Assessment: Remote Sensing of Severity, the Normalized Burn Ratio. In FIREMON: Fire Effects Monitoring and Inventory System; Lutes, D.C., Ed.; General Technical Report: RMRS GTR-164-CD:LA1-LA51; USDA Forest Service, Rocky Mountain Research Station: Ogden, UT, USA, 2005. [Google Scholar]
- Souza, C.M.; Shimbo, J.Z.; Rosa, M.R.; Parente, L.L.; Alencar, A.A.; Rudorff, B.F.T.; Hasenack, H.; Matsumoto, M.; Ferreira, L.G.; Souza-Filho, P.W.M.; et al. Reconstructing three decades of land use and land cover changes in brazilian biomes with landsat archive and earth engine. Remote Sens. 2020, 12, 2735. [Google Scholar] [CrossRef]
- Sano, E.E.; Rodrigues, A.A.; Martins, E.S.; Bettiol, G.M.; Bustamante, M.M.C.; Bezerra, A.S.; Couto, A.F.; Vasconcelos, V.; Schüler, J.; Bolfe, E.L. Cerrado ecoregions: A spatial framework to assess and prioritize Brazilian savanna environmental diversity for conservation. J. Environ. Manag. 2019, 232, 818–828. [Google Scholar] [CrossRef]
- Gorelick, N.; Hancher, M.; Dixon, M.; Ilyushchenko, S.; Thau, D.; Moore, R. Google Earth Engine: Planetary-scale geospatial analysis for everyone. Remote Sens. Environ. 2017, 202, 18–27. [Google Scholar] [CrossRef]
- Roy, D.P.; Kovalskyy, V.; Zhang, H.K.; Vermote, E.F.; Yan, L.; Kumar, S.S.; Egorov, A. Characterization of Landsat-7 to Landsat-8 reflective wavelength and normalized difference vegetation index continuity. Remote Sens. Environ. 2016, 185, 57–70. [Google Scholar] [CrossRef] [Green Version]
- Zhu, Z.; Woodcock, C.E.; Olofsson, P. Continuous monitoring of forest disturbance using all available Landsat imagery. Remote Sens. Environ. 2012, 122, 75–91. [Google Scholar] [CrossRef]
- Foga, S.; Scaramuzza, P.L.; Guo, S.; Zhu, Z.; Dilley, R.D.; Beckmann, T.; Schmidt, G.L.; Dwyer, J.L.; Joseph Hughes, M.; Laue, B. Cloud detection algorithm comparison and validation for operational Landsat data products. Remote Sens. Environ. 2017, 194, 379–390. [Google Scholar] [CrossRef] [Green Version]
- Huete, A.; Didan, K.; Miura, T.; Rodriguez, E.; Gao, X.; Ferreira, L. Overview of the radiometric and biophysical performance of the MODIS vegetation indices. Remote Sens. Environ. 2002, 83, 195–213. [Google Scholar] [CrossRef]
- Moura, Y.M.; Galvão, L.S.; Hilker, T.; Wu, J.; Saleska, S.; do Amaral, C.H.; Nelson, B.W.; Lopes, A.P.; Wiedeman, K.K.; Prohaska, N.; et al. Spectral analysis of amazon canopy phenology during the dry season using a tower hyperspectral camera and modis observations. ISPRS J. Photogramm. Remote Sens. 2017, 131, 52–64. [Google Scholar] [CrossRef]
- Hunt, E.R.; Rock, B.N. Detection of changes in leaf water content using Near- and Middle-Infrared reflectances. Remote Sens. Environ. 1989, 30, 43–54. [Google Scholar] [CrossRef]
- Rouse, J.W.; Hass, R.H.; Schell, J.A.; Deering, D.W. Monitoring vegetation systems in the great plains with ERTS. Third Earth Resour. Technol. Satell. Symp. 1973, 1, 309–317. [Google Scholar]
- Huete, A.R. A Soil-Adjusted Vegetation Index (SAVI). Remote Sens. Environ. 1988, 25, 295–309. [Google Scholar] [CrossRef]
- Bullock, E. Gee-assessment-tools Documentation. Tech Rep. 2020, 1, 49. [Google Scholar]
- Bueno, I.T.; Acerbi Júnior, F.W.; Silveira, E.M.O.; Mello, J.M.; Carvalho, L.M.T.; Gomide, L.R.; Withey, K.; Scolforo, J.R.S. Object-based change detection in the Cerrado biome using Landsat time series. Remote Sens. 2019, 11, 570. [Google Scholar] [CrossRef] [Green Version]
- Bueno, I.T.; McDermid, G.J.; Silveira, E.M.O.; Hird, J.N.; Domingos, B.I.; Acerbi Júnior, F.W. Spatial agreement among vegetation disturbance maps in tropical domains using Landsat time series. Remote Sens. 2020, 12, 2948. [Google Scholar] [CrossRef]
- Brooks, E.B.; Yang, Z.; Thomas, V.A.; Wynne, R.H. Edyn: Dynamic signaling of changes to forests using exponentially weighted moving average charts. Forests 2017, 8, 304. [Google Scholar] [CrossRef] [Green Version]
- Hughes, J.M.; Douglas Kaylor, J.S.; Hayes, D.J. Patch-based forest change detection from Landsat time series. Forests 2017, 8, 166. [Google Scholar] [CrossRef]
- Verbesselt, J.; Zeileis, A.; Herold, M. Near real-time disturbance detection using satellite image time series. Remote Sens. Environ. 2012, 123, 98–108. [Google Scholar] [CrossRef]
- Schmidt, I.B.; Eloy, L. Fire regime in the Brazilian Savanna: Recent changes, policy and management. Flora 2020, 268, 151613. [Google Scholar] [CrossRef]
- Bullock, E.L.; Woodcock, C.E.; Holden, C.E. Improved change monitoring using an ensemble of time series algorithms. Remote Sens. Environ. 2020, 238, 111165. [Google Scholar] [CrossRef]


| VIs | Equation | Reference |
|---|---|---|
| Enhanced Vegetation Index (EVI) | 2.5 × ((NIR − Red)/(NIR + 6 × Red − 7.5 × Blue + 1)) | [36] |
| Green-Red Normalized Difference (GRND) | (Green − Red)/(Green + Red) | [37] |
| Moisture Stress Index (MSI) | (NIR − SWIR1)/(NIR + SWIR1) | [38] |
| Normalized Burn Ratio (NBR) | (NIR − SWIR2)/(NIR + SWIR2) | [29] |
| Normalized Burn Ratio2 (NBR2) | (SWIR1 − SWIR2)/(SWIR1 + SWIR2) | [29] |
| Normalized Difference Vegetation Index (NDVI) | (NIR − Red)/(NIR + Red) | [39] |
| Soil-Adjusted Vegetation Index (SAVI) | 1.5 × ((NIR − Red)/NIR + Red + 0.5)) | [40] |
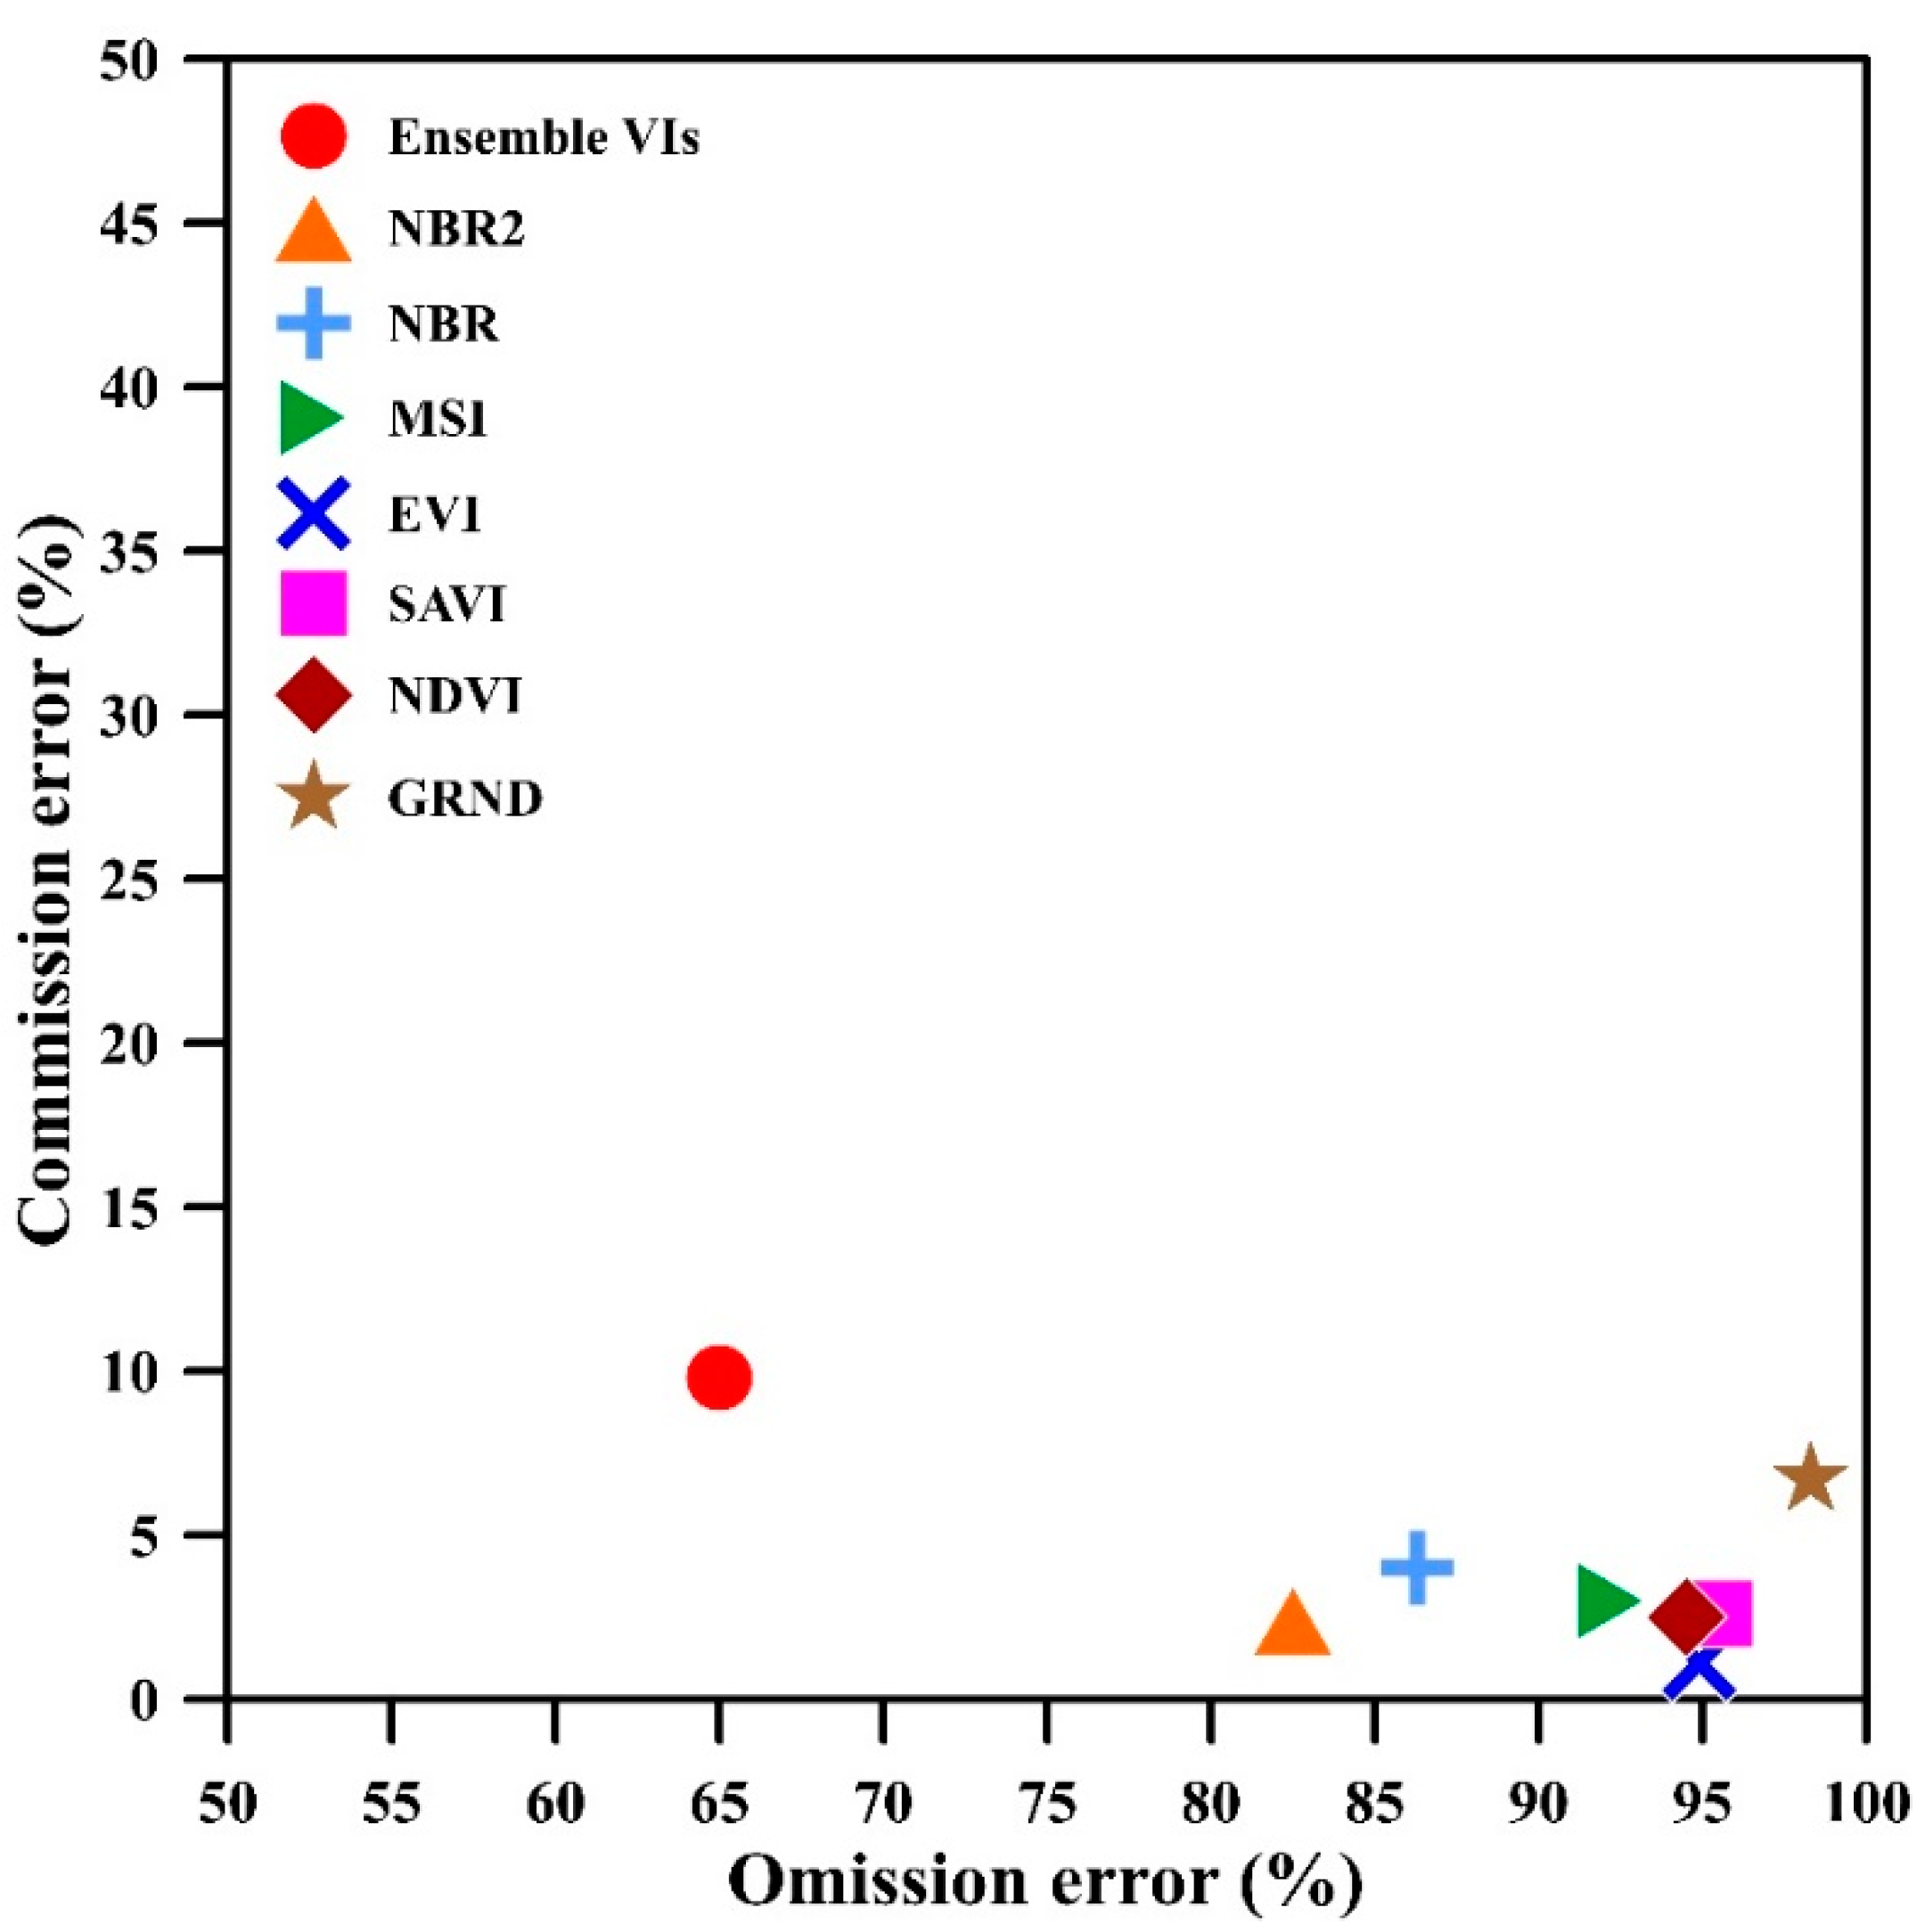
| Input Data | OA (%) | 95% CI | PA (%) Disturbance Class | UA (%) Disturbance Class | PA (%) Non-Disturbance Class (%) | UA (%) Non-Disturbance Class |
|---|---|---|---|---|---|---|
| Ensemble VIs | 71.2 | 4.0 | 35.0 | 90.2 | 97.3 | 67.5 |
| NBR2 | 65.9 | 4.2 | 17.5 | 97.6 | 99.7 | 63.4 |
| NBR | 64.9 | 4.3 | 13.7 | 96.0 | 99.6 | 63.0 |
| MSI | 61.0 | 4.3 | 7.8 | 97.0 | 99.8 | 59.7 |
| EVI | 59.6 | 4.4 | 5.1 | 98.9 | 100 | 58.7 |
| SAVI | 57.9 | 4.3 | 4.5 | 97.4 | 99.9 | 57.1 |
| NDVI | 57.9 | 4.3 | 4.5 | 97.4 | 99.9 | 57.1 |
| GRND | 51.2 | 4.2 | 1.7 | 93.3 | 99.9 | 50.8 |
Publisher’s Note: MDPI stays neutral with regard to jurisdictional claims in published maps and institutional affiliations. |
© 2021 by the authors. Licensee MDPI, Basel, Switzerland. This article is an open access article distributed under the terms and conditions of the Creative Commons Attribution (CC BY) license (https://creativecommons.org/licenses/by/4.0/).
Share and Cite
Souza, A.A.d.; Galvão, L.S.; Korting, T.S.; Almeida, C.A. On a Data-Driven Approach for Detecting Disturbance in the Brazilian Savannas Using Time Series of Vegetation Indices. Remote Sens. 2021, 13, 4959. https://doi.org/10.3390/rs13244959
Souza AAd, Galvão LS, Korting TS, Almeida CA. On a Data-Driven Approach for Detecting Disturbance in the Brazilian Savannas Using Time Series of Vegetation Indices. Remote Sensing. 2021; 13(24):4959. https://doi.org/10.3390/rs13244959
Chicago/Turabian StyleSouza, Alana Almeida de, Lênio Soares Galvão, Thales Sehn Korting, and Cláudio Aparecido Almeida. 2021. "On a Data-Driven Approach for Detecting Disturbance in the Brazilian Savannas Using Time Series of Vegetation Indices" Remote Sensing 13, no. 24: 4959. https://doi.org/10.3390/rs13244959