
Air Quality Estimation in Ukraine Using SDG 11.6.2 Indicator Assessment

1
Department of Mathematical Modelling and Data Analysis, National Technical University of Ukraine “Igor Sikorsky Kyiv Polytechnic Institute”, 03056 Kyiv, Ukraine
2
Department of Space Information Technologies and Systems, Space Research Institute NAS Ukraine & SSA Ukraine, 03187 Kyiv, Ukraine
*
Author to whom correspondence should be addressed.
Remote Sens. 2021, 13(23), 4769; https://doi.org/10.3390/rs13234769
Submission received: 6 October 2021
/
Revised: 18 November 2021
/
Accepted: 23 November 2021
/
Published: 25 November 2021
(This article belongs to the Special Issue Satellite Remote Sensing for Air Quality and Health)
Abstract
:Ukraine is an associate member of the European Union, and in the coming years, it is expected that all the data and services already used by European Union countries will become available for Ukraine. An important program, which is the basis for building European monitoring services for smart cities, is the Copernicus program. The two most important services of this program are the Copernicus Land Monitoring Service (CLMS) and the Copernicus Atmosphere Monitoring Service (CAMS). CLMS provides important information on land use in Europe. In the context of smart cities, the most valuable tool is the Urban Atlas service, which is related to local CLMS services and provides a detailed digital city plan in vector form, which is segmented into small functional areas classified by Coordinate Information on the Environment (CORINE) nomenclature. The Urban Atlas is a geospatial layer with high resolution, built for all European cities with a population of more than 100,000. It combines high-resolution satellite data, city segmentation by blocks and functional urban areas (FUAs), important city infrastructure, etc. This product is used as a basis for city planning and obtaining analytics on the most important indicators of city development, including air quality monitoring. For Ukraine, such geospatial products are not provided under the Copernicus program. In this article, FUAs are developed for Ukrainian cities using European technology. It is important to start work on this program’s implementation as early as possible so that when the first city atlas appears, Ukraine will be ready to work with it together with the European community. This requires preparing the basis for national research and training national stakeholders and consumers to use this product. To make this happen, it is necessary to have a national geospatial product that can be used as an analogue of the city atlas. In this article, the authors analyzed the existing methods of air quality assessment and the Global Sustainable Development Goal (SDG) indicator 11.6.2, “Annual mean levels of fine particulate matter (e.g., PM2.5 and PM10) in cities (population weighted)”, achieved for European cities. Based on this, indicator 11.6.2 was then evaluated for the first time in Ukraine, considering the next 5 years. For the correct use of global products for Ukraine, CAMS global satellite data and population data (Global Human Settlement Layer and NASA population data) for Ukrainian cities were validated. These studies showed a statistically significant result and, therefore, demonstrated that global products can be used to monitor air quality both at the city level and for Ukraine as a whole. The obtained results were analyzed, and the values of indicator 11.6.2 for Ukraine were compared with those for other European countries.
1. Introduction
There are currently many projects in the world that develop and use information technology to aggregate, analyze, and visualize information about air pollution in cities, these provide urban residents with timely information about possible dangers. The information sources for such monitoring systems are ground air quality measurement stations and satellite information. There are also projects that monitor air quality not only for a particular country but for many countries or regions. One of these such projects is Smart Urban Solutions for Air Quality, Disasters and City Growth (SMURBS), part of the Horizon-2020 ERA-Planet program, within which the National Observatory of Athens has developed a platform for monitoring indicator 11.6.2, “Annual mean levels of fine particulate matter in cities”, for 800 cities and 37 European countries [1]. Unfortunately, Ukraine is not included in the list of countries monitored on this platform, and that is why the question of the development of a similar product for Ukraine arises.
This article describes the analysis of existing technologies and data in the world, which can be used to monitor air quality in cities and countries as a whole. We also propose an algorithm for creating similar, high-quality products for the territory of Ukraine. For Ukraine, there are currently two sources of information on air quality monitoring—ground stations, which are equipped with appropriate sensors, and satellite data. We first consider ground measurements.
In recent years, Ukraine has significantly increased its network of ground stations and the creation of air quality monitoring systems in large cities. This is confirmed by the growing number of monitoring stations of various sensor providers in Ukraine. For example, in 2018, the current largest air quality networks, EcoCity [2] and SaveDnipro [3], appeared, and the total number of sensors from all stations in 2020 was 1183, a number which had already reached 1568 by 2021, i.e., the number of sensors per year increased by 385. It is the large cities that make the biggest contribution to air pollution, where the number of stations for air pollution measurement has significantly increased. However, the greatest activity still occurs in large cities, and questions regarding the absence of a small number of ground posts for air quality indicator measurement, in less populated cities or villages, remain open. In this paper, we propose using satellite or model open data to fill the gaps in those places where there are no ground measurements. The issue of the validation of satellite and model data on the basis of ground measurements for the territory of Ukraine was considered in [4].
The world’s largest aggregator of air pollution data is the AQICN resource [5], which uses the air quality index, the standards of which are calculated by the United States Environmental Protection Agency, and visualizes all sensors and information using API. It integrates networks of smart cities around the world, as well as national and public air quality monitoring systems. Western Europe, Southeast Asia, North America, and India have the largest sources of information. The estimated number of operating stations of different types is roughly 13,000 units.
In Western Europe, one of the most popular air quality monitoring initiatives, and the most common provider of air pollution data, is the Sensor Community [6], whose developers launched the Luftdaten.info public project in 2015 in Stuttgart, Germany [7]. This project has become a catalyst for the development of similar networks of public air quality monitoring in Ukraine.
Another portal used by the residents of smart cities in the European Union is Airly [8]. It applies its own technological solutions and provides an opportunity to predict the levels of dust concentrations of fractions PM2.5 and PM10 for 1 day ahead. The service works with more than 300 local authorities, and more than 4000 devices around the world are integrated into it.
The Swiss commercial project IQAir [9] uses devices to measure air pollution levels both outdoors and indoors, offering appropriate sensors and a mobile application for control and notification. IQAir operates on the world’s largest free real-time air quality information platform and attracts a growing number of global citizens, organizations, and governments. The IQAir AirVisual platform integrates data collected by governments, companies, and individuals around the world.
In the context of smart cities, the most valuable tool is the Urban Atlas service, which is related to local CLMS services and provides a detailed digital city plan in vector form. This plan is segmented into small functional areas classified by Coordinate Information on the Environment (CORINE) nomenclature [10]. The Urban Atlas is a geospatial layer with high resolution, which is built for all European cities with a population of more than 100,000 and combines high-resolution satellite data, city segmentation by blocks and functional urban areas (FUAs), important city infrastructure, etc. This product is used as a basis for city planning and obtaining analytics on the most important indicators of city development, including air quality monitoring.
There are many other global air quality monitoring services that are designed and operated for the territories of the European Union [11,12], Great Britain [13], and the United States [14], etc. By analyzing them, we can conclude that they publish information in the form of levels of concentrations of pollutants. Almost all smart city monitoring systems include web portals that combine a large amount of environmental and urban data, which are directly or indirectly related to air quality and determine the comfort of the urban environment. The unequivocal advantage of such systems is the use of a large number of high-density measuring equipment in urban areas. In particular, one of the most common projects, which includes air quality analysis and the evaluation of the Sustainable Development Goal 11.6.2 indicator, quality of life, analysis of urban growth, and many other important applications, is the SMURBS project [15]. For the most part, almost all air quality monitoring projects involve the Copernicus Atmosphere Monitoring Service (CAMS), global data based on satellite measurements.
The CAMS service for air quality monitoring and forecasting completely covers the territory of Ukraine, which is a good sign for the national developers of air quality monitoring services. However, these data are still not used properly in Ukraine, as applications for cities can be implemented only with the presence of an active network of ground stations, which allow one to clarify the values of pollution concentrations in urban areas and increase the spatial resolution of global raster products. At the same time, over the last three years, public air quality monitoring initiatives and public networks, such as EcoCity and others, have been developing very rapidly in Ukraine. In the future, such data sources may become alternatives to governmental air quality monitoring networks, which can be obtained using Citizen Science. Thus, using these data, Ukrainian cities can already obtain the same opportunities in the implementation of Copernicus data. with regard to air quality monitoring throughout its cities, as other European cities. Despite the fact that the ground air quality monitoring networks have grown significantly, large cities still have one or two monitoring stations each, which do not cover all the variability of air quality in a large city. Examples of such cities are Chernihiv (one station), Sumy (one station), Donetsk and Luhansk (no stations), Kherson (four stations), and Zhytomyr (four stations). The lack of quality national products for urban planning and the monitoring of air quality indicators in cities makes it impossible to assess the impact of cities on the environment and human health, and to calculate important indicators for achieving Sustainable Development Goals (SDGs) such as 11.6.2, “Annual mean levels of fine particulate matter in cities”.
The National Research Foundation of Ukraine’s project aims to create information technology for air quality monitoring in Ukraine based on satellite and in situ data and the development of Urban Atlas for the cities of Ukraine. In the future, this will provide opportunities for the qualitative use of new tools for urban planning. Currently, the impact of cities on environmental quality is very large, and the assessment of this impact makes it possible to reduce the negative effects of human activities.
2. Methods
The methodology for calculating the Sustainable Development Goal Indicator 11.6.2 is based on the methodology proposed by the UN and used within the SMURBS project [15], the main goal of which was to collect best practices to promote the concept of the “smart city” and use it for as many cities as possible by integrating satellite observations to increase the resilience of the environment and society to urban impact. These European activities brought together a large consortium of experts from around the world, who were divided into the three main areas of the project: air quality, urban growth, natural or human-made disasters and their consequences. The countries represented in this consortium were Greece, Italy, France, Spain, Germany, Switzerland, Slovenia, the Czech Republic, Romania, and Finland, as well as Ukraine, represented by the Space Research Institute of the National Academy of Sciences of Ukraine and the State Space Agency of Ukraine [16,17].
SMURBS project countries that have monitored and developed air quality monitoring systems for pilot cities have developed 22 technical solutions that are currently at different stages of development, depending on the country, city, and data available for the pilot area. Typically, all participants use the same type of input to carry out their research and air quality monitoring projects in pilot cities: data from portable sensor ground stations, satellite data, and CAMS model data [18] (or other model data that is local to the pilot territories). The National Observatory of Athens has developed a platform for monitoring indicator 11.6.2 for 800 cities and 37 European countries. Ground data are used as the input data, on the basis of which models are extended over a larger area. The most common indicator for assessing sustainable development in terms of air quality is 11.6.2, which is the average annual concentration of PM2.5 in functional urban areas (FUAs) and in global urban centers (GUCs) in terms of population. It is estimated using advanced modeling through the integration of satellite monitoring data, population estimates, topography, and ground-based measurements [19]. FUAs, therefore, consist of a densely inhabited city and a less densely populated commuting zone whose labor market is highly integrated with the city.
There are two main methodologies for calculating indicator 11.6.2 (UN methodology and the methodology developed within the SMURBS project), which are based on different data sets. According to these methodologies, all air quality indicators are calculated within the FUA and GUC. The general calculation equation is the same for the two methodologies and is as follows:
where Cn represents the estimated average value of PM2.5 for the functional urban areas or global urban centers, and Pn represents the population (calculated for the FUAs and GUCs). This equation is used for countries with available data from ground-based PM2.5 measurements.
SDG11.6.2 = ΣCn*Pn/ΣPn
The main input data, as can be seen from Equation (1), for the calculation of SDG indicator 11.6.2, are ground stations, which measure the concentration of PM2.5 in FUAs and GUCs, and statistics on urban populations. The big problem is the low quality and availability of the required data. In particular, for Ukraine, there is not enough data available, which should be used for air quality monitoring. That is why, in cases where there are not enough necessary data, it is necessary to use alternative methods, in particular using the corresponding satellite data instead.
Many developed methodologies within the SMURBS project consider model data of air quality CAMS with a low spatial resolution of 11 km. In this article, according to the methodology of the SMURBS project, SDG 11.6.2 indicators for the years 2014–2018 are calculated for Ukraine.
3. Study Area and Data Analysis
The main problem for the development of air quality monitoring technologies for the territory of Ukraine, which would be similar for other European territories, is the insufficient number of ground stations with which to measure air quality indicators in less populated cities (for example, in those cities that are part of an FUA). Therefore, the use of satellite data, their validation on the basis of ground data, and the development of a methodology to improve the spatial resolution of satellite data, is still the best method for air quality monitoring in all settlements of Ukraine. Furthermore, this method can be used for the active calculation of the sustainable development indicator 11.6.2 based on the results.
Given the fact that the Ukrainian authorities and the population need qualitative and reliable information on the impact of cities on air quality, within this work, based on European practices and methodologies, SDG 11.6.2 was obtained for Ukraine in 7 years, from 2014 to 2020, with the ability to compare the obtained values with the open access SMURBS SDG Indicator 11.6.2 Earth Observation Platform for the years 2014–2018 [1].
3.1. Study Area and Network of Ground Stations for Air Quality Measurement
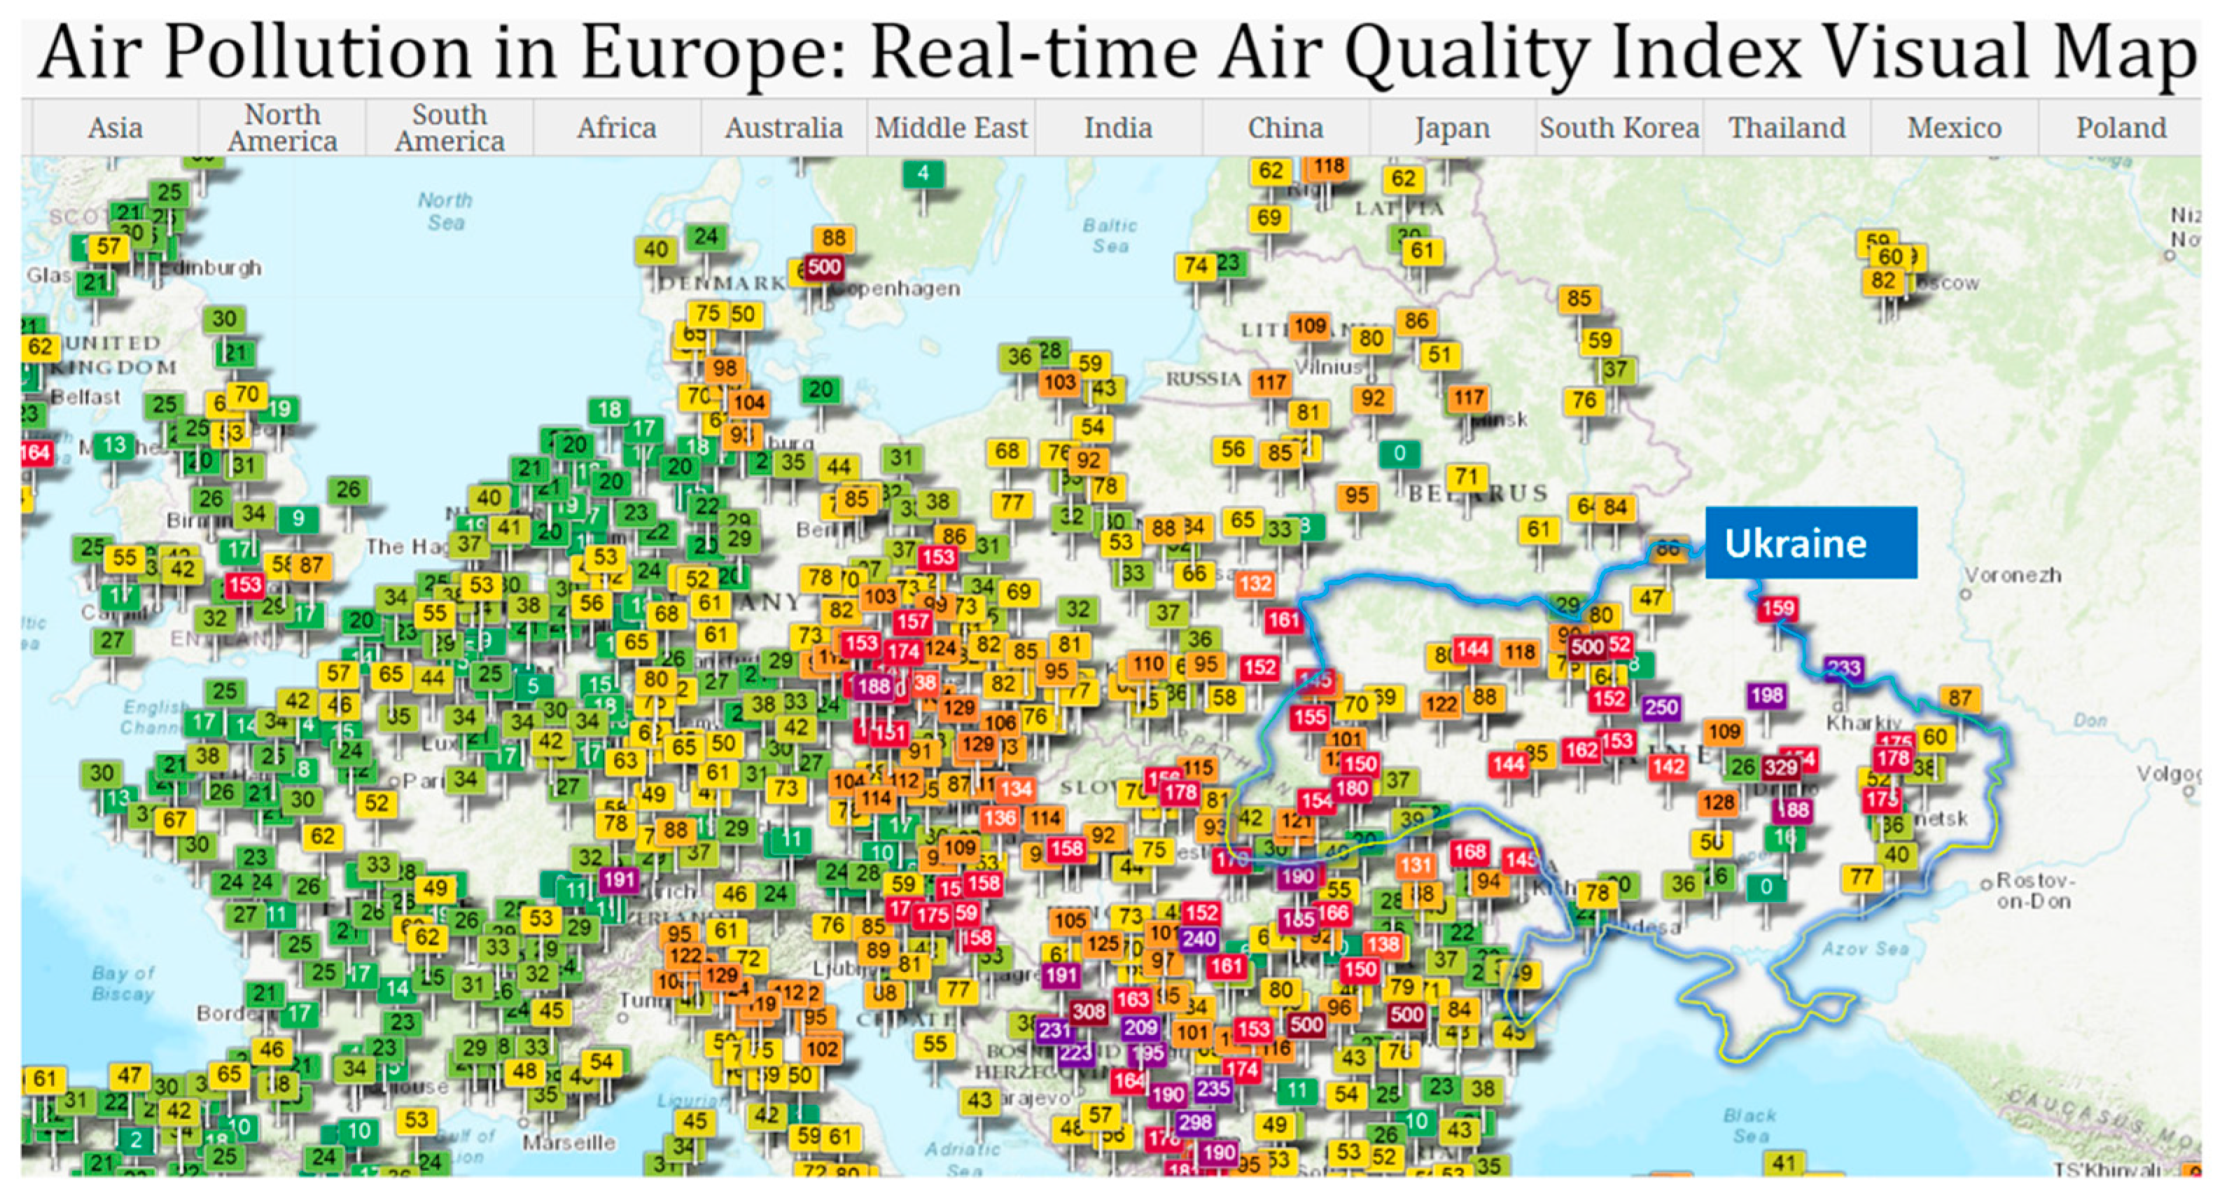
The first step towards creating air monitoring systems in large cities of Ukraine is significantly increasing the number of stations for measuring air pollution [20]. However, most activities are still related to large cities. This is very important, as they make the largest contribution to air pollution. However, the question of the absence, or the small number, of ground posts for air quality measurement indicators in less populated cities or villages remains open. Figure 1 shows the study area (Ukraine) and significant difference in the uniformity of the coverage of the territory of countries by ground stations for air quality measurement in Europe and Ukraine [21]. The main providers of air quality data in Ukraine are EcoCity, Lun Air, and Save Dnipro, which we briefly consider below.
The EcoCity project [2] was founded in June 2018 as an initiative of students in the city of Ivano-Frankivsk, Ukraine. Subsequently, public air quality monitoring by EcoCity as a social and environmental project was extended to the whole territory of Ukraine, especially to cities of industrial agglomerations (Kryvyi Rih, Zaporizhia, Dnipro, Kharkiv, Mariupol) with a high level of environmental pollution. Currently, this service is the only one in Ukraine that has developed the public monitoring of pollution levels, not only of fine dust particles PM10 and PM2.5, but also of toxic pollutants—nitrogen dioxide, carbon monoxide, formaldehyde, ammonia, ground-level ozone, and radiation background. To monitor the background radiation, the project developers created a simple separate device for reading pulses from a Geiger tube. Currently, the EcoCity network aggregates data on its website [2] from 515 stations performing the public monitoring of air quality from EcoCity, 387 from SaveDnipro, and 90 AirPollution stations. The largest numbers of stations are located in Kyiv, Ivano-Frankivsk, and the cities in the Zaporizhia and Dnipropetrovsk regions.
LUN’s social initiative [22] was developed by teams from the Faculty of Radiophysics, Electronics, and Computer Systems of Taras Shevchenko National University of Kyiv (Ukraine) and started its work in September 2020 as an air quality monitoring network. The sensors for PM1.0, PM2.5, and PM10 (Plantower PMS 3003/5003/7003/A003) are used to monitor air quality, which work on the basis of laser scattering, as in professional calibrated sensors. These sensors are used in devices that have been tested by the American program for assessing the effectiveness of air quality sensors, “Air Quality Sensor Performance Evaluation Center” (AQ-SPEC) [23], as well as being calibrated with each other and with Vaisala AQT420 [24], which is included in the “Register of approved types of measuring instruments” in Ukraine [25]. In addition to air quality indicators, the LUN stations also measure humidity and temperature. There are more than 80 stations in Kyiv and the suburbs on the map, and the team is working to increase this number.
SaveDnipro [3] is a non-governmental organization that in 2018–2019 actively distributed dust analyzers of the PM2.5 and PM10 fractions of its own production based on the Nova SDS011 laser sensor. Due to the integrated temperature–humidity–pressure sensor, it is possible to automatically adjust the received information depending on weather conditions. The heating module allows one to obtain reliable information during fog, precipitation, and sub-zero temperatures. Today, there are 387 stations, 36 are located in Kyiv, which provide information on the following air parameters: PM2.5, PM10, temperature, relative humidity, and atmospheric pressure.
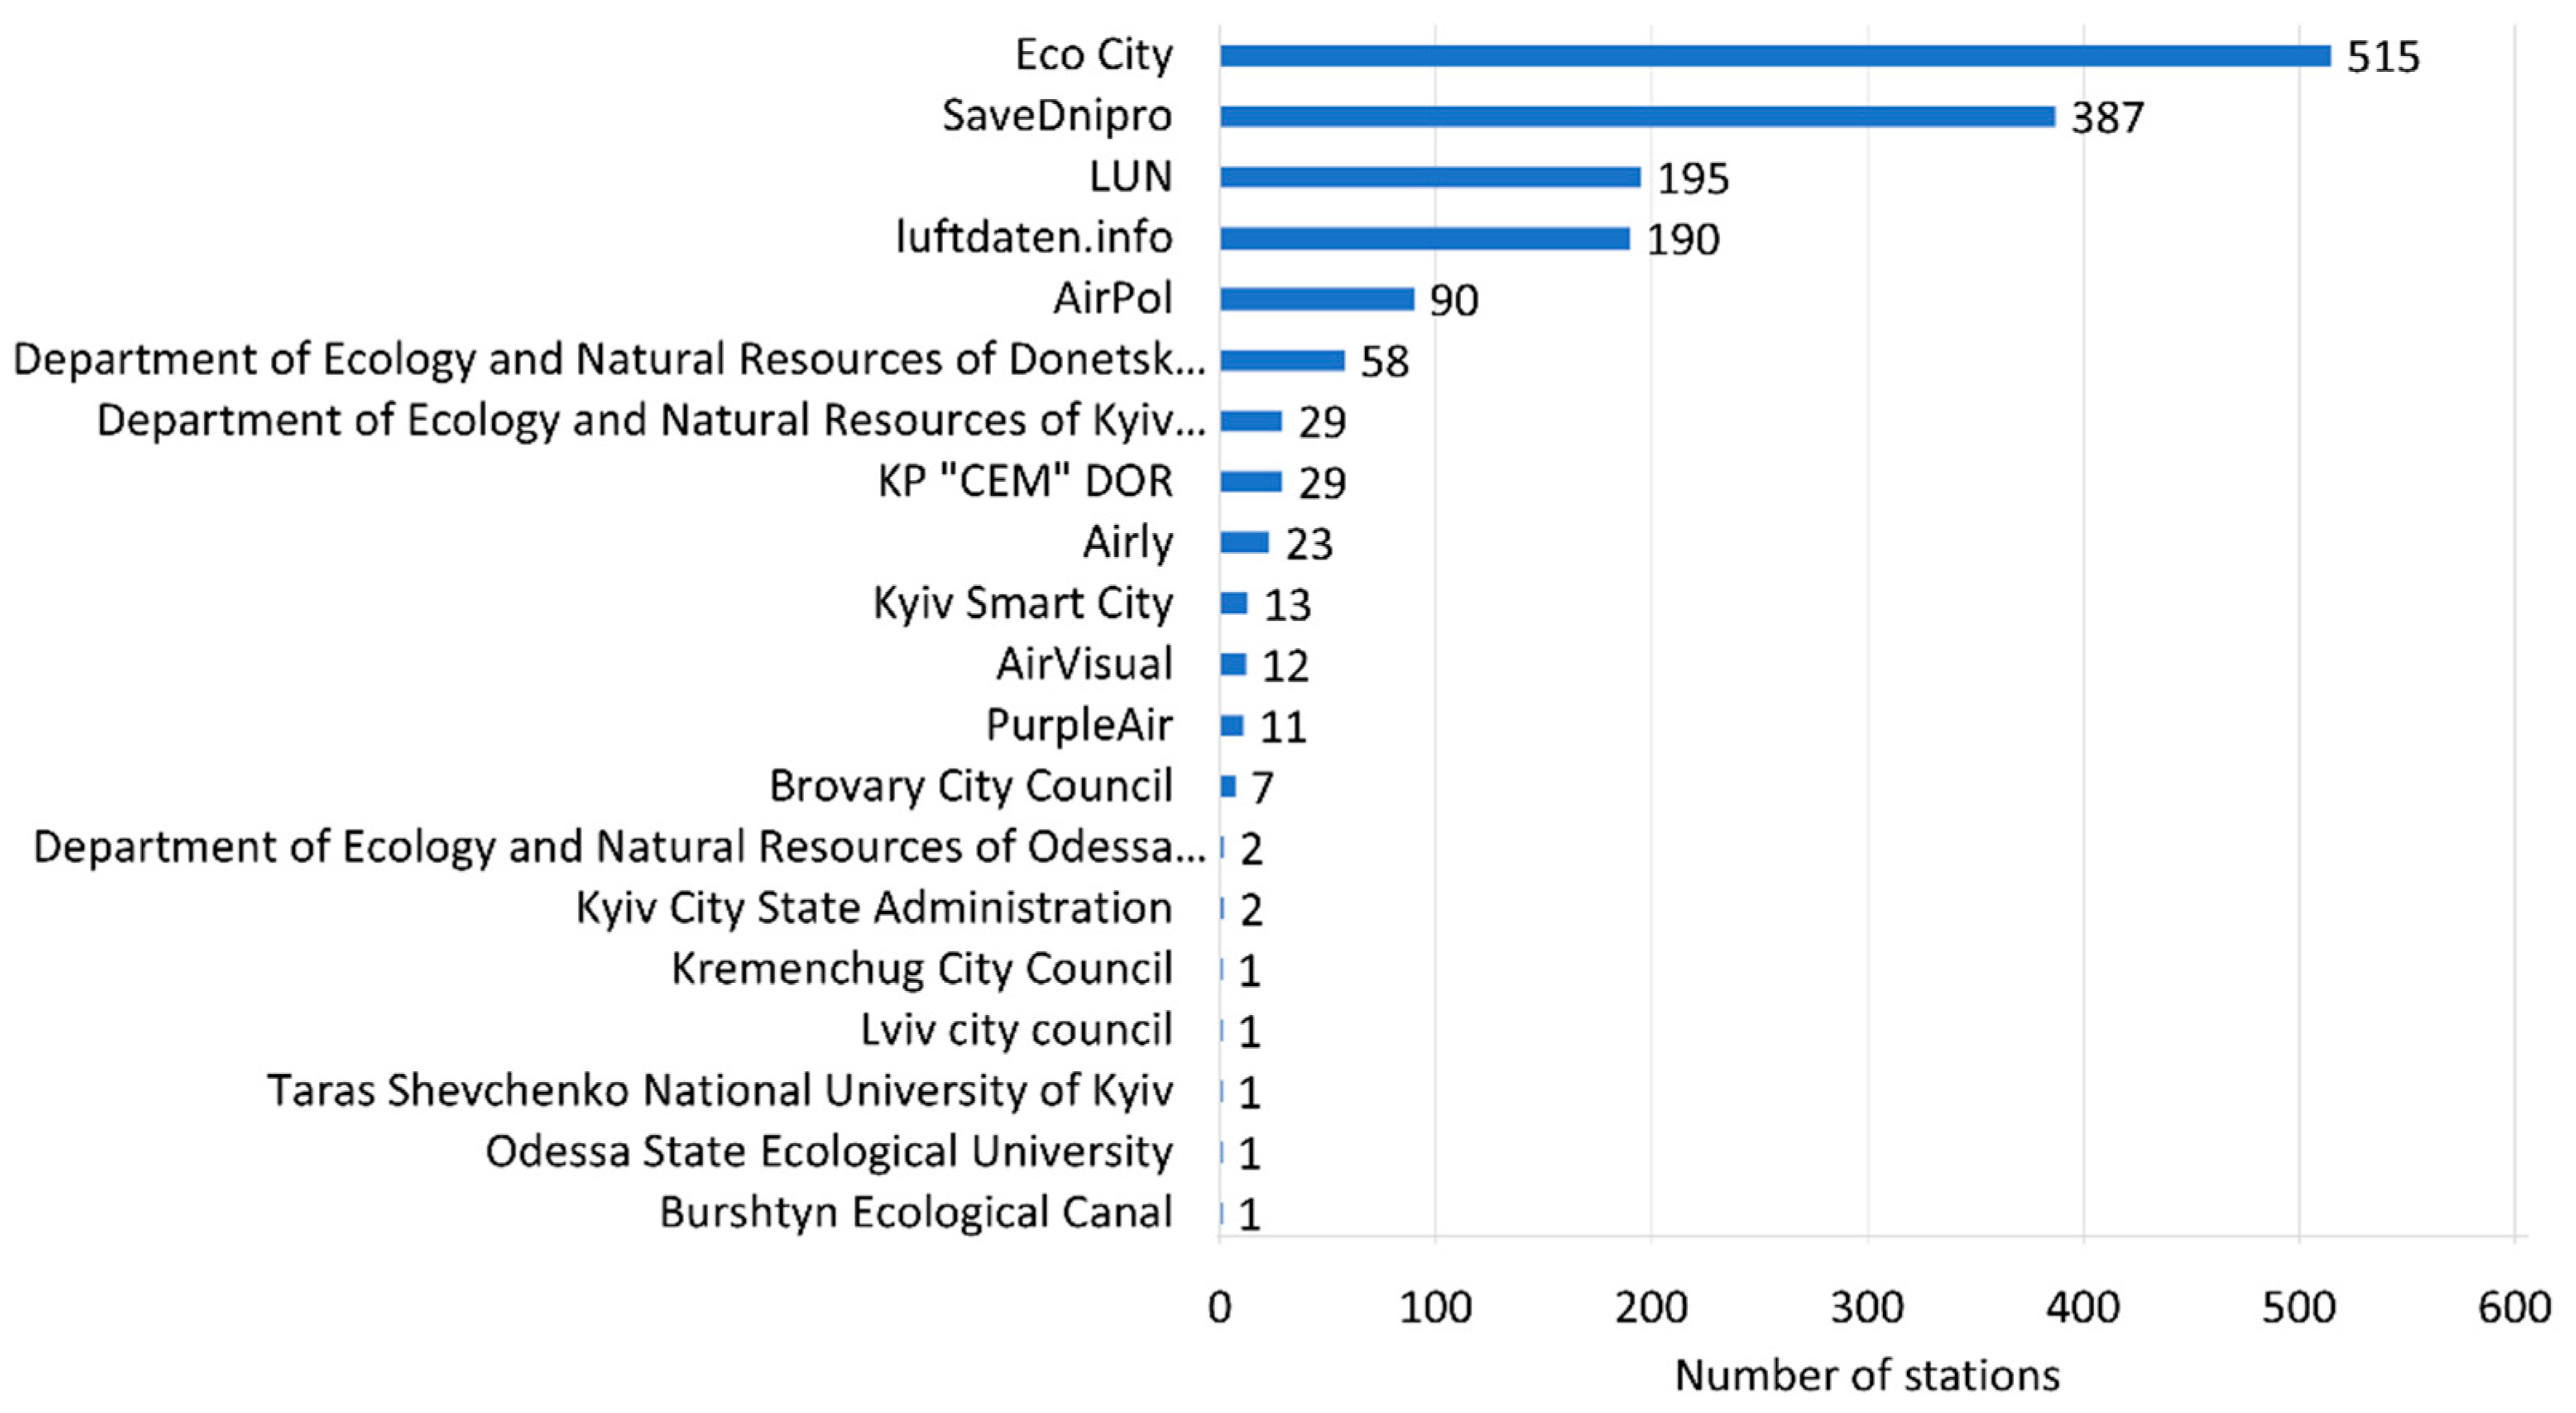
The only ecological chatbot in Ukraine is the SaveEcoBot service, which aggregates data from different providers within a single platform [20] (Figure 2). The main indicators of air pollution provided by the posts are the concentration of particular matter in the air (PM2.5, PM10). Additionally, almost all posts provide meteorological data—temperature, relative humidity, and atmospheric pressure. Some stations measure indicators of air pollution, such as nitrogen dioxide, carbon monoxide, ozone, sulfur dioxide, and background radiation. According to the chatbot SaveEcoBot, there are 1568 observation posts at all levels (public, city, and regional) in the territory of Ukraine (327 ground stations are located in Kyiv, 118 of which are operational). Stations are considered operational if they have sent data to the system at least once in the last 48 h.
The state network of stationary air quality observation posts is the Central Geophysical Observatory [26]. In Kyiv, systematic observations of the content of harmful substances in the air are carried out at 16 stationary posts with a sampling frequency of 6 days a week. Therefore, there is no possibility of sampling on weekends, holidays, and other days, except for working days. The main disadvantage of the above monitoring system is the lack of public information on air pollution levels and non-real-time observations. The implementation of such monitoring depends on the availability of funds for the work and travel of specialists, consumables, technical conditions of the equipment, etc. Therefore, the objective risk of network operation is the fact that, in the case of technical failure of the equipment, for the analysis of the concentration of a certain contaminant, data on its presence are excluded from the general information.
3.2. Functional Urban Area
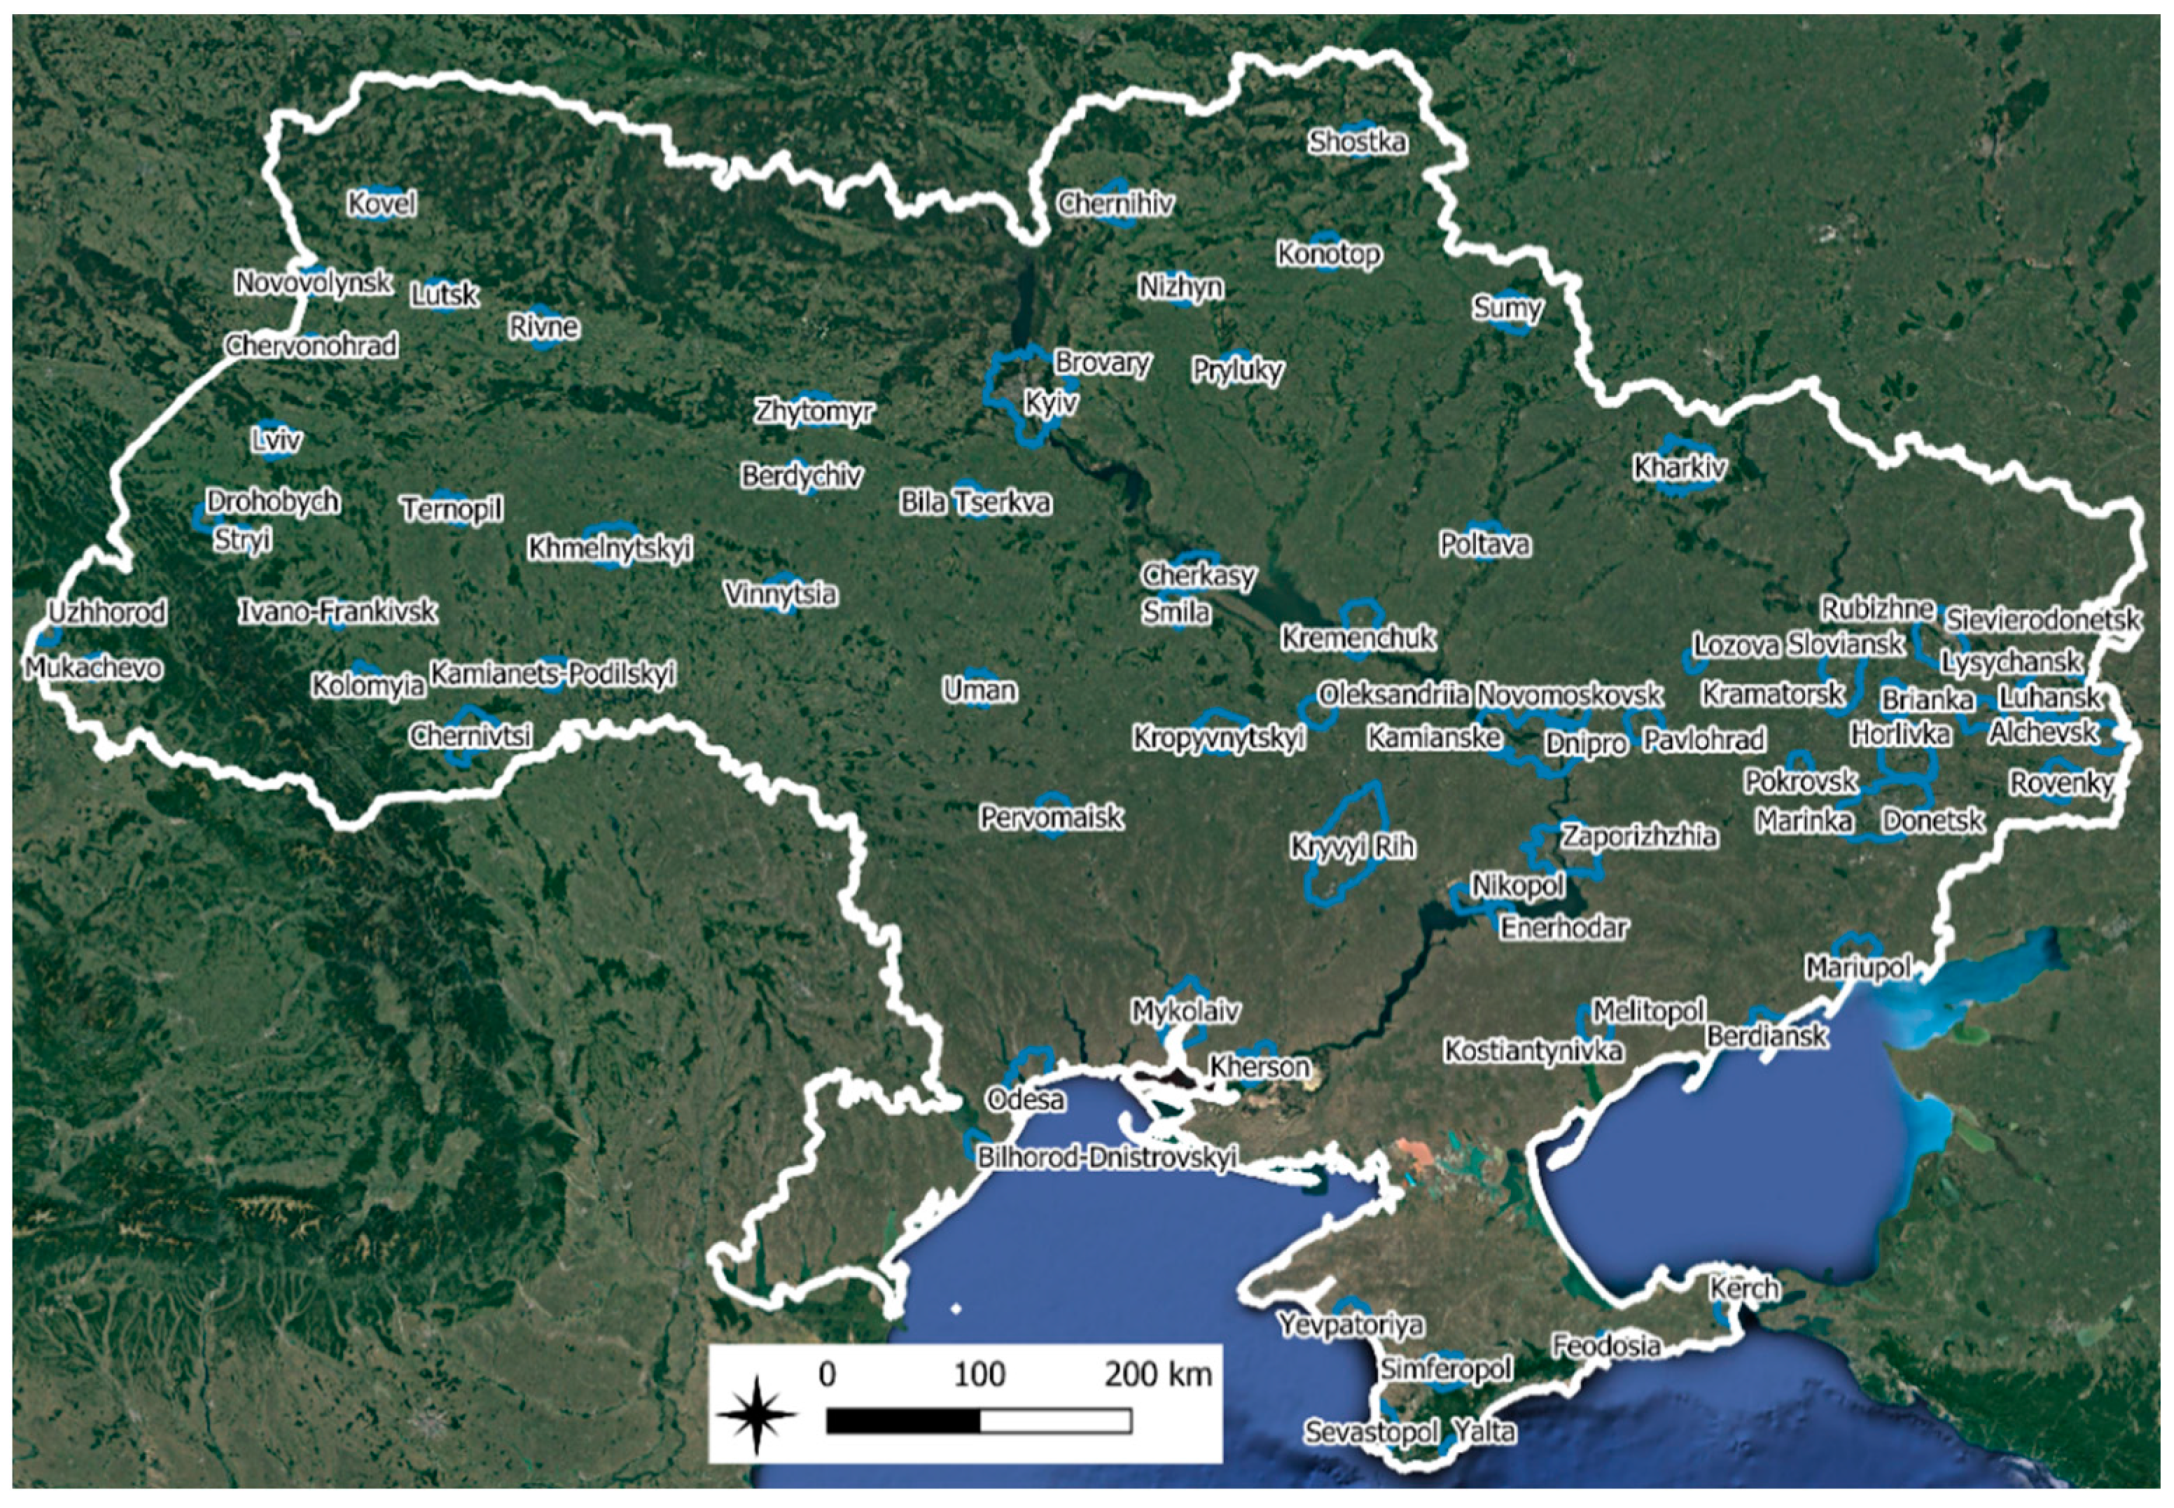
There is no standardized concept for the territory of Ukraine, such as the FUAs, which are used for SDG 11.6.2 indicator calculation in Europe, and so to adapt the methodology for assessing indicator 11.6.2 to this country, such zones were created for the main cities of Ukraine (Figure 3).
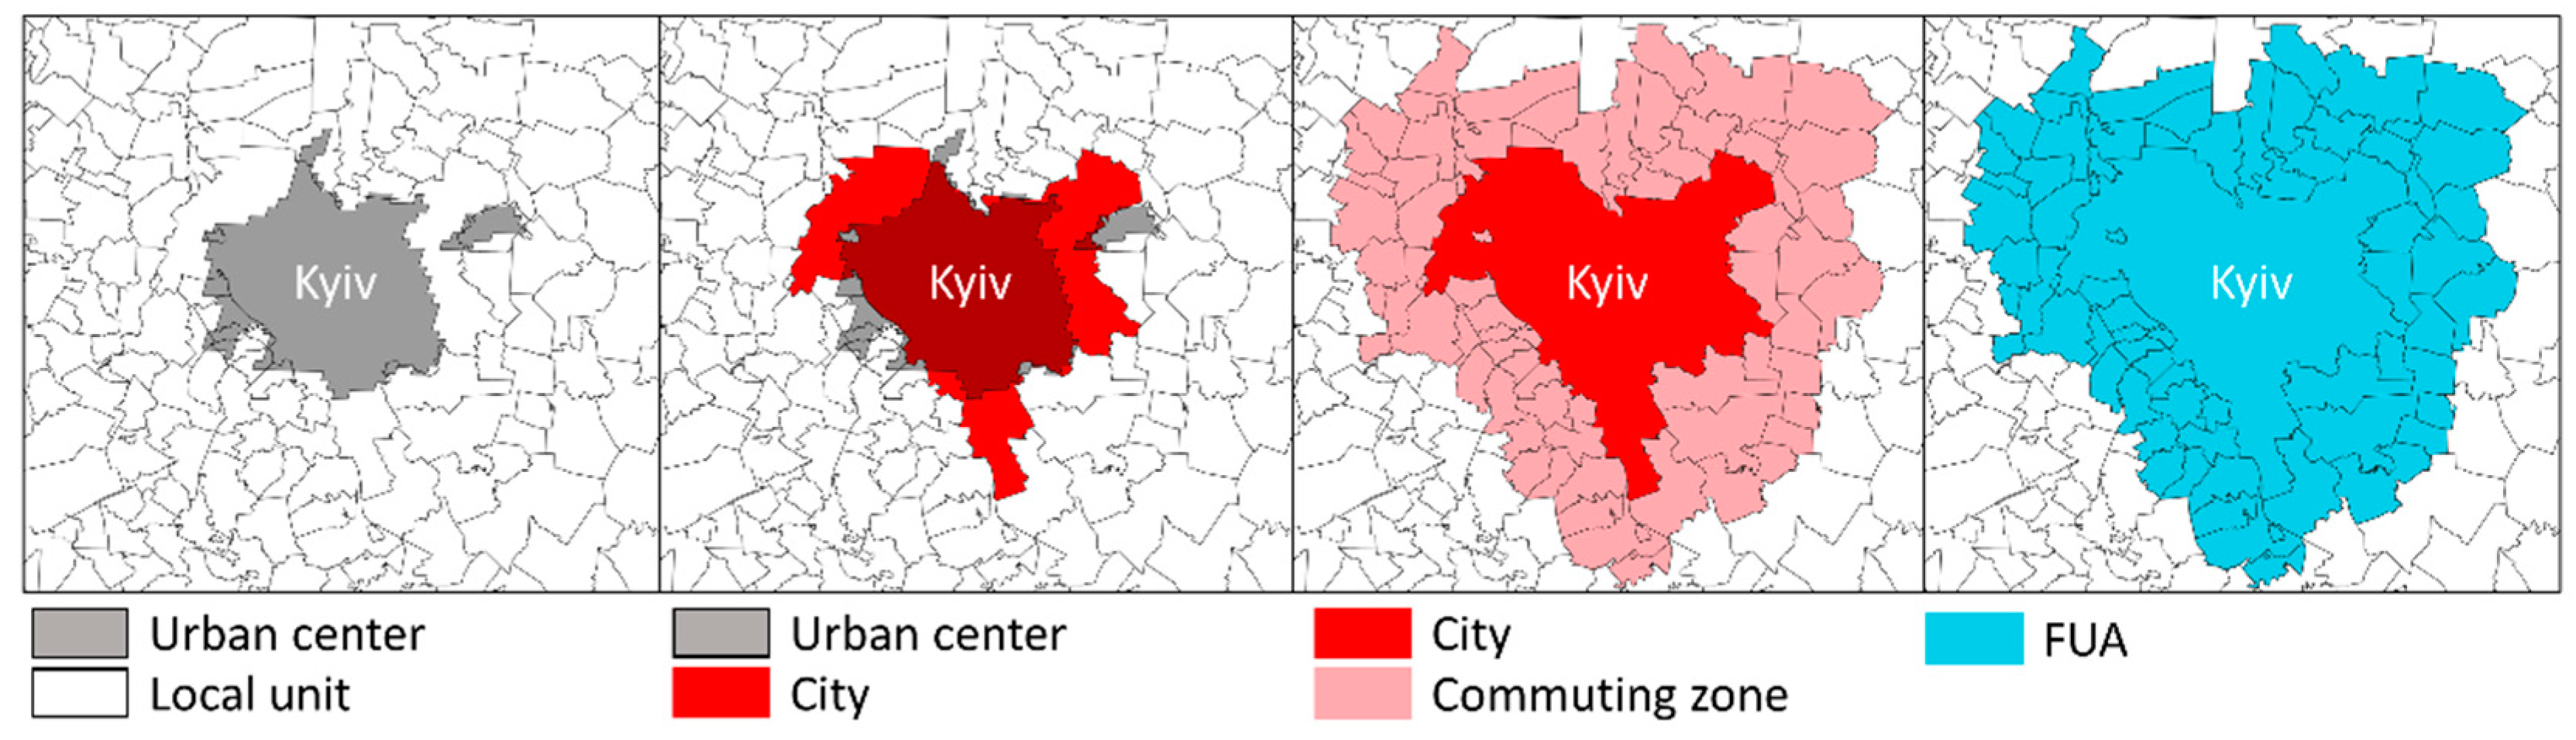
The methodology of the European Commission was chosen as the basis for obtaining FUA for the largest cities of Ukraine [27]. The FUA can be defined in four steps:
- Identifying an urban center: a set of contiguous, high-density (1500 residents per square kilometer) grid cells with a population of 50,000 in the contiguous cells. Global city centers were used, which were created by the Global Human Settlement Layer team in 2015 [28].
- Identifying a city: one or more local units that have at least 50% of their residents inside an urban center. The local units’ boundaries for items 2 and 3 for the territory of Ukraine were used from the Humanitarian Data Exchange (HDX) platform [29].
- Identifying a commuting zone: a set of contiguous local units that have at least 15% of their employed residents working in the city.
- An FUA is the combination of the city with its commuting zone.
Thus, we obtained FUAs similar to those in European territories, within which the SDG indicator was calculated. Figure 4 illustrates the different concepts that are used in the method and that compose a FUA for Kyiv city, notably the urban center, the city, and the commuting zone.
3.3. Data from Copernicus Atmosphere Monitoring Service
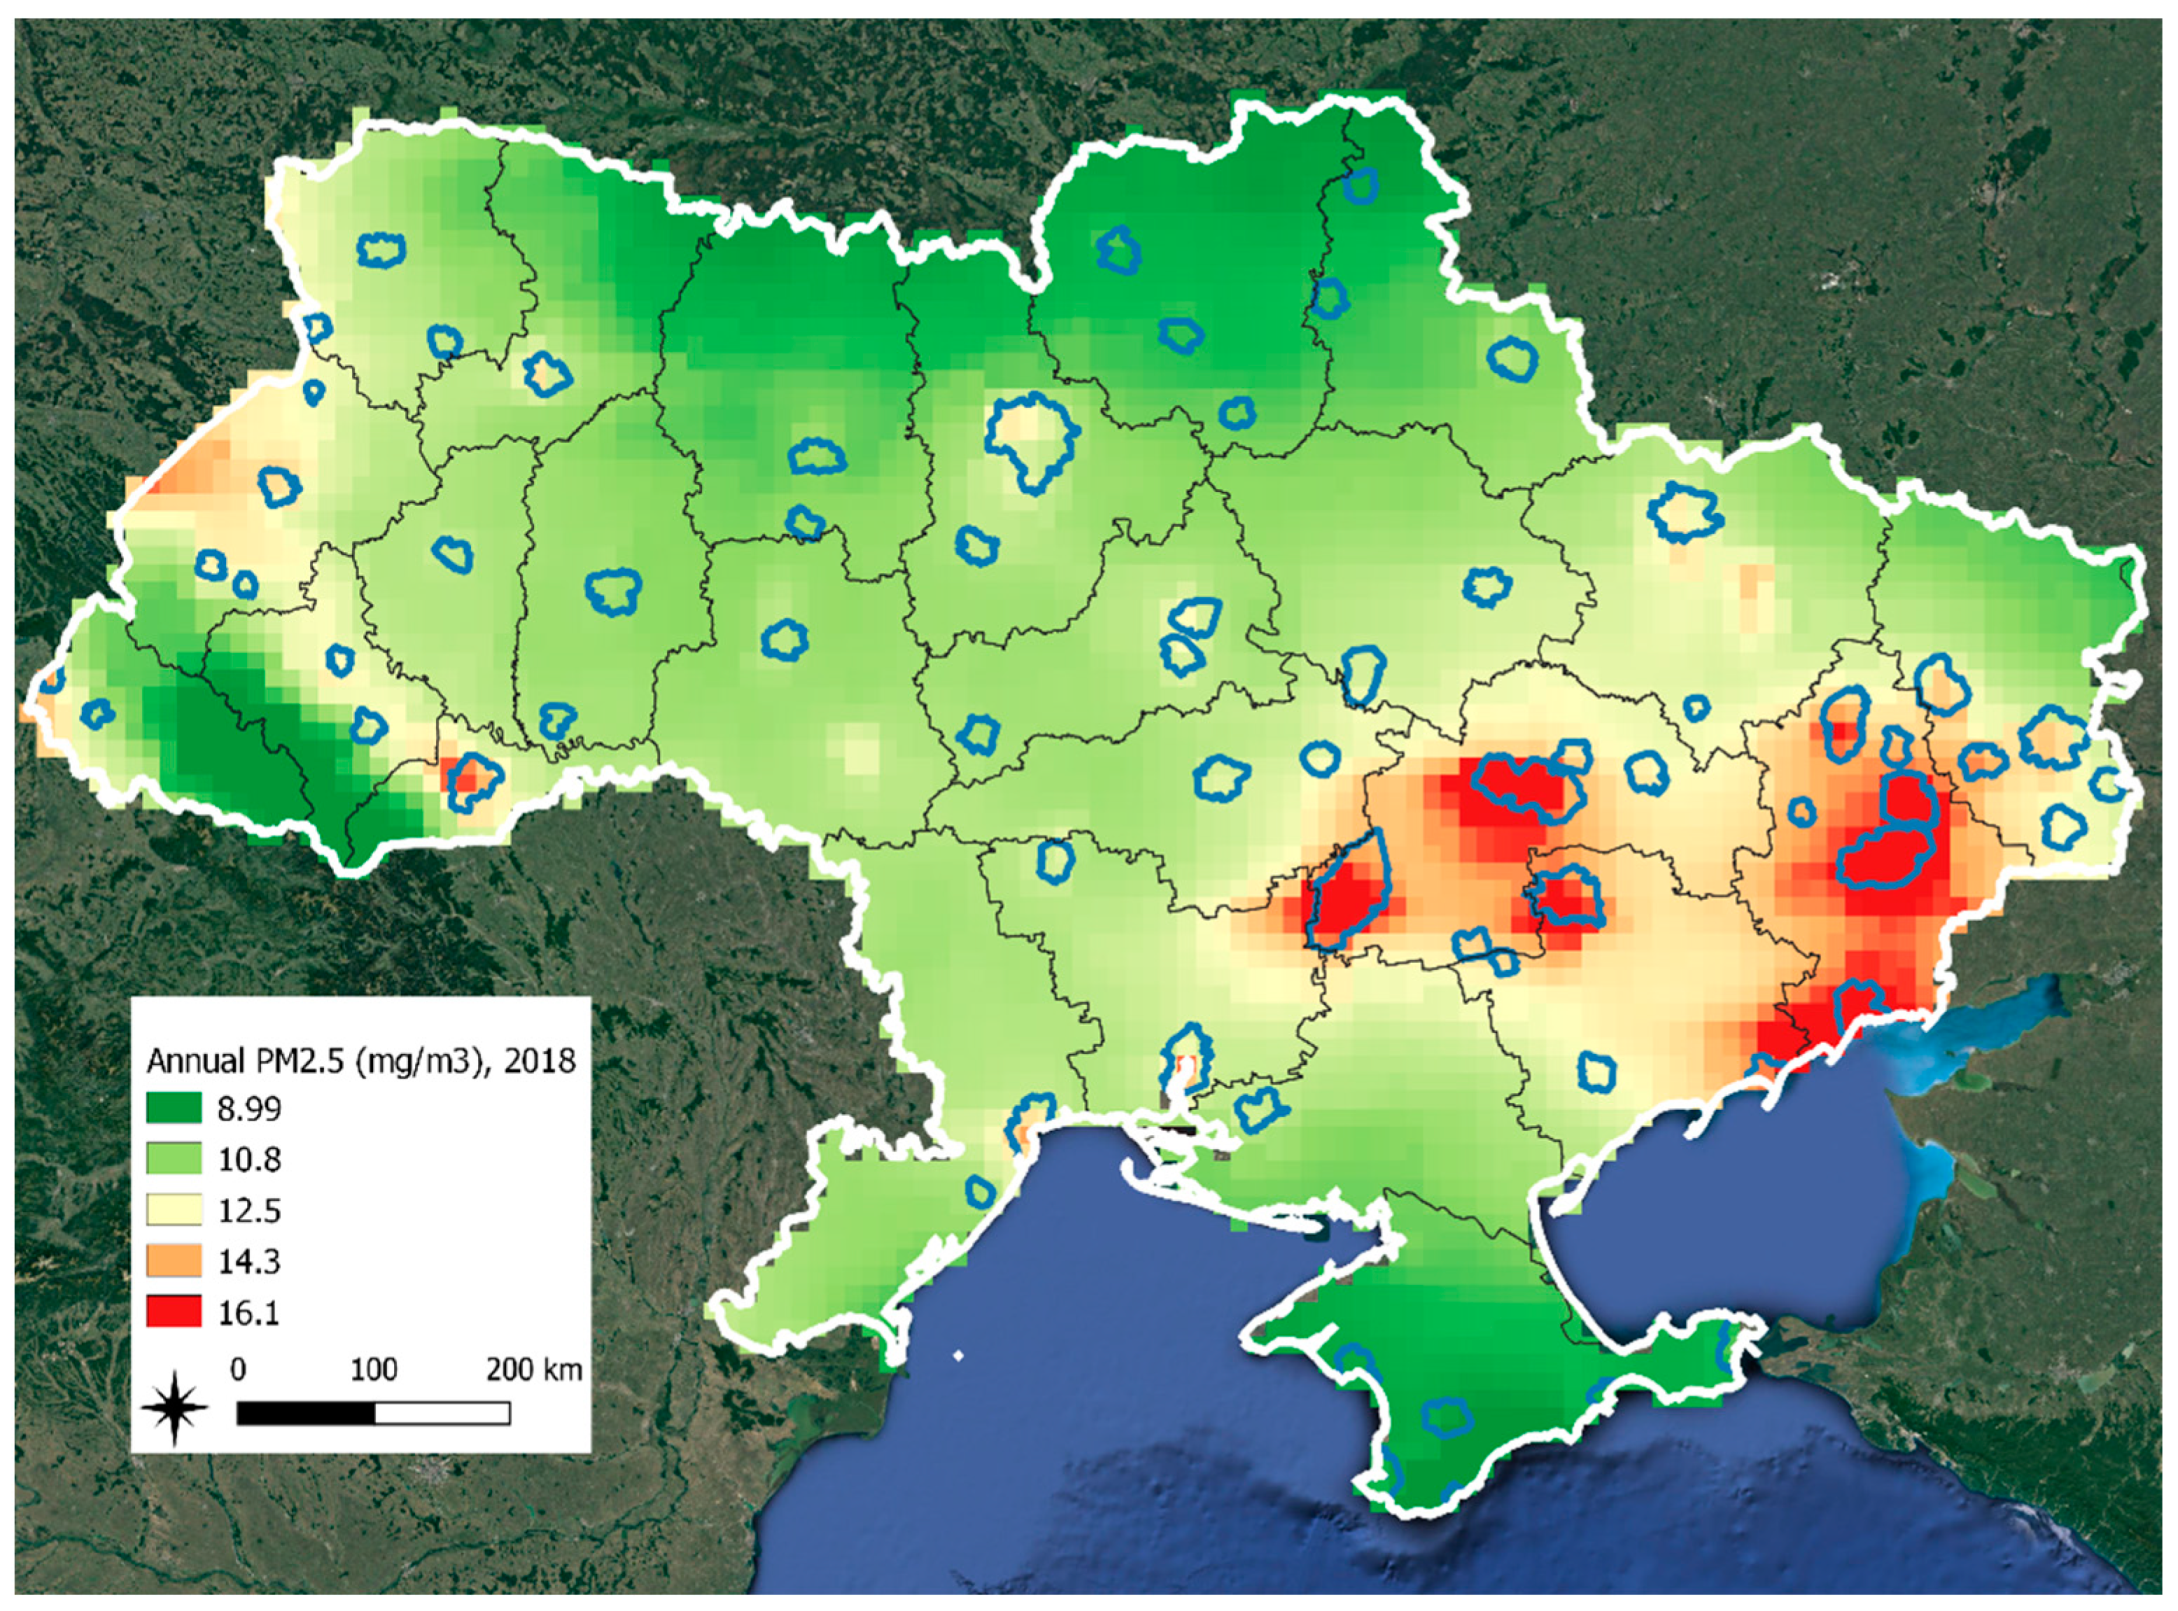
The Copernicus Atmosphere Monitoring Service (CAMS) was developed for sharing data and processing information about the Earth’s surface, aerosols, ozone, and other reactive gases, aiming to support policymakers, businesses, and citizens with enhanced atmospheric environmental information. In particular, this service provides daily hourly data regarding PM2.5 and PM10 in the form of close to real-time analysis for Europe and Ukraine with a spatial resolution of 11 km. Additionally, CAMS provides the average annual PM2.5 model data, which were selected as air quality data in this study (Figure 5) [18], but average annual PM2.5 data for the years 2019–2020 were not available, just daily data. To solve this problem, the average annual values based on daily data for these years were calculated by the authors. An example of annual PM2.5 data for Ukraine in 2018 is presented in (Figure 5).
Figure 6 shows the statistical information regarding waste generation in 2018 for the regions of Ukraine [30]. Such oblasts as Dnipropetrovska, Donetska, and Kirovohradska have the highest statistical indicators with regard to waste generation.
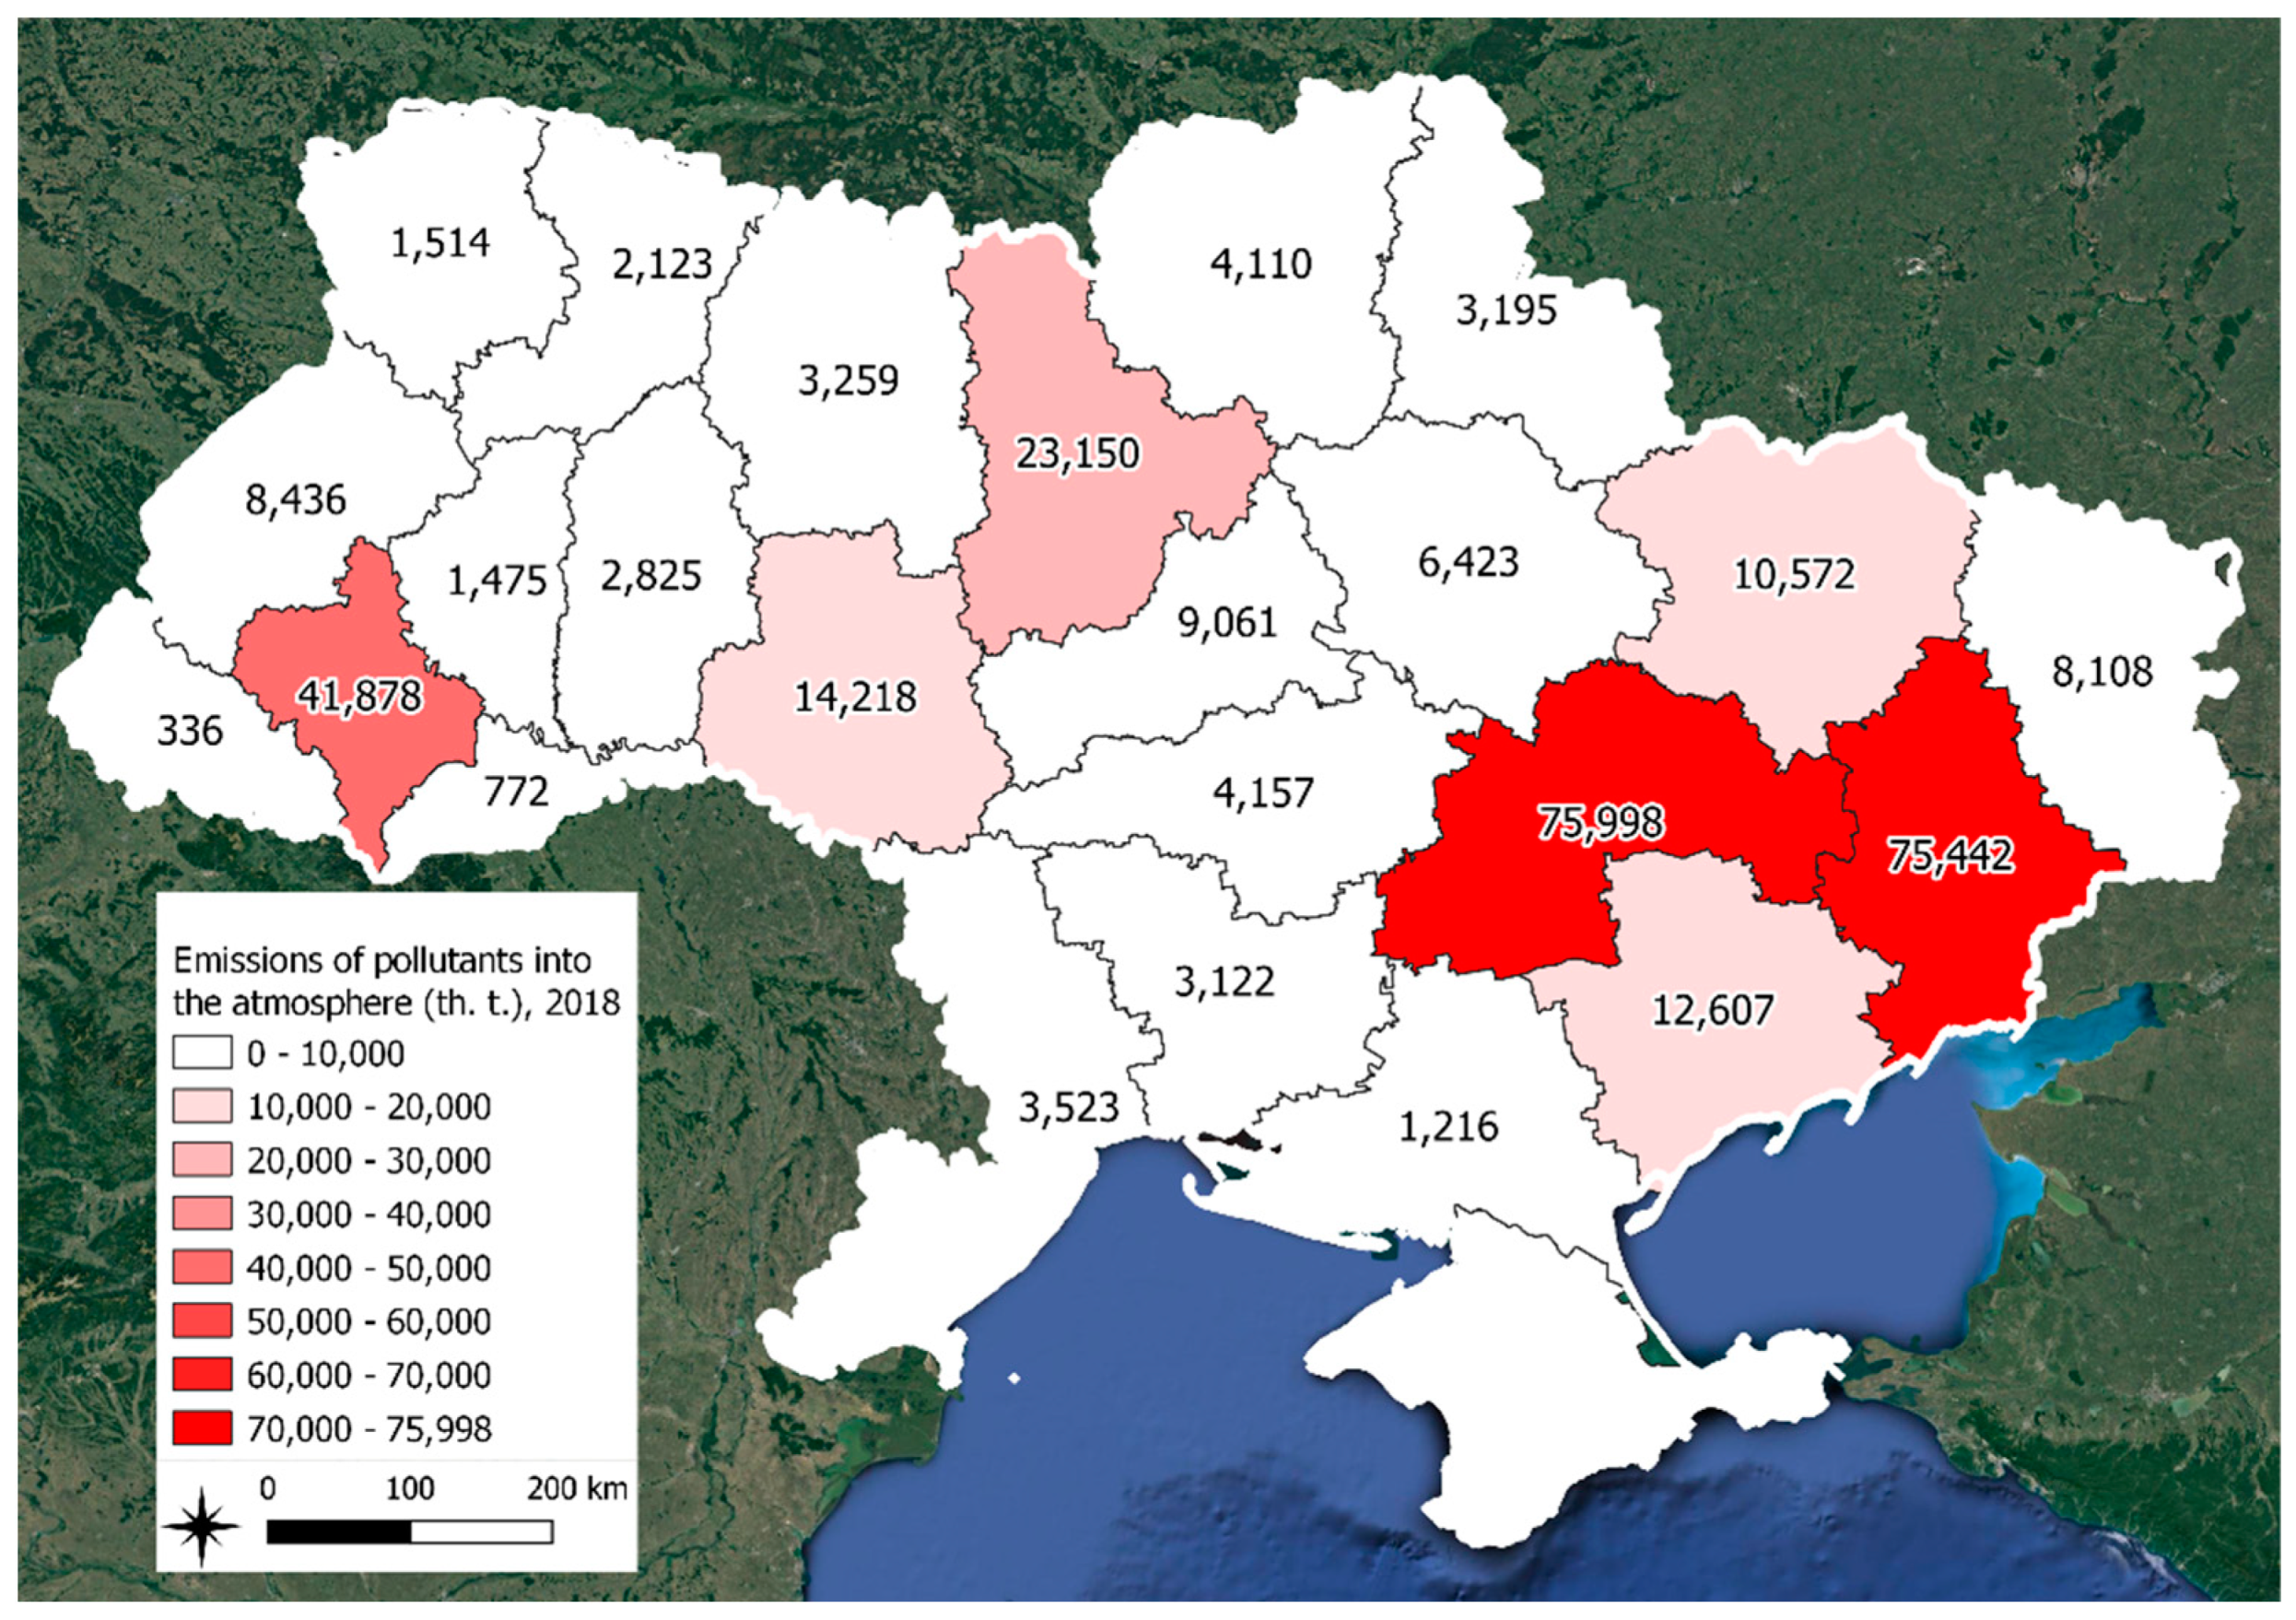
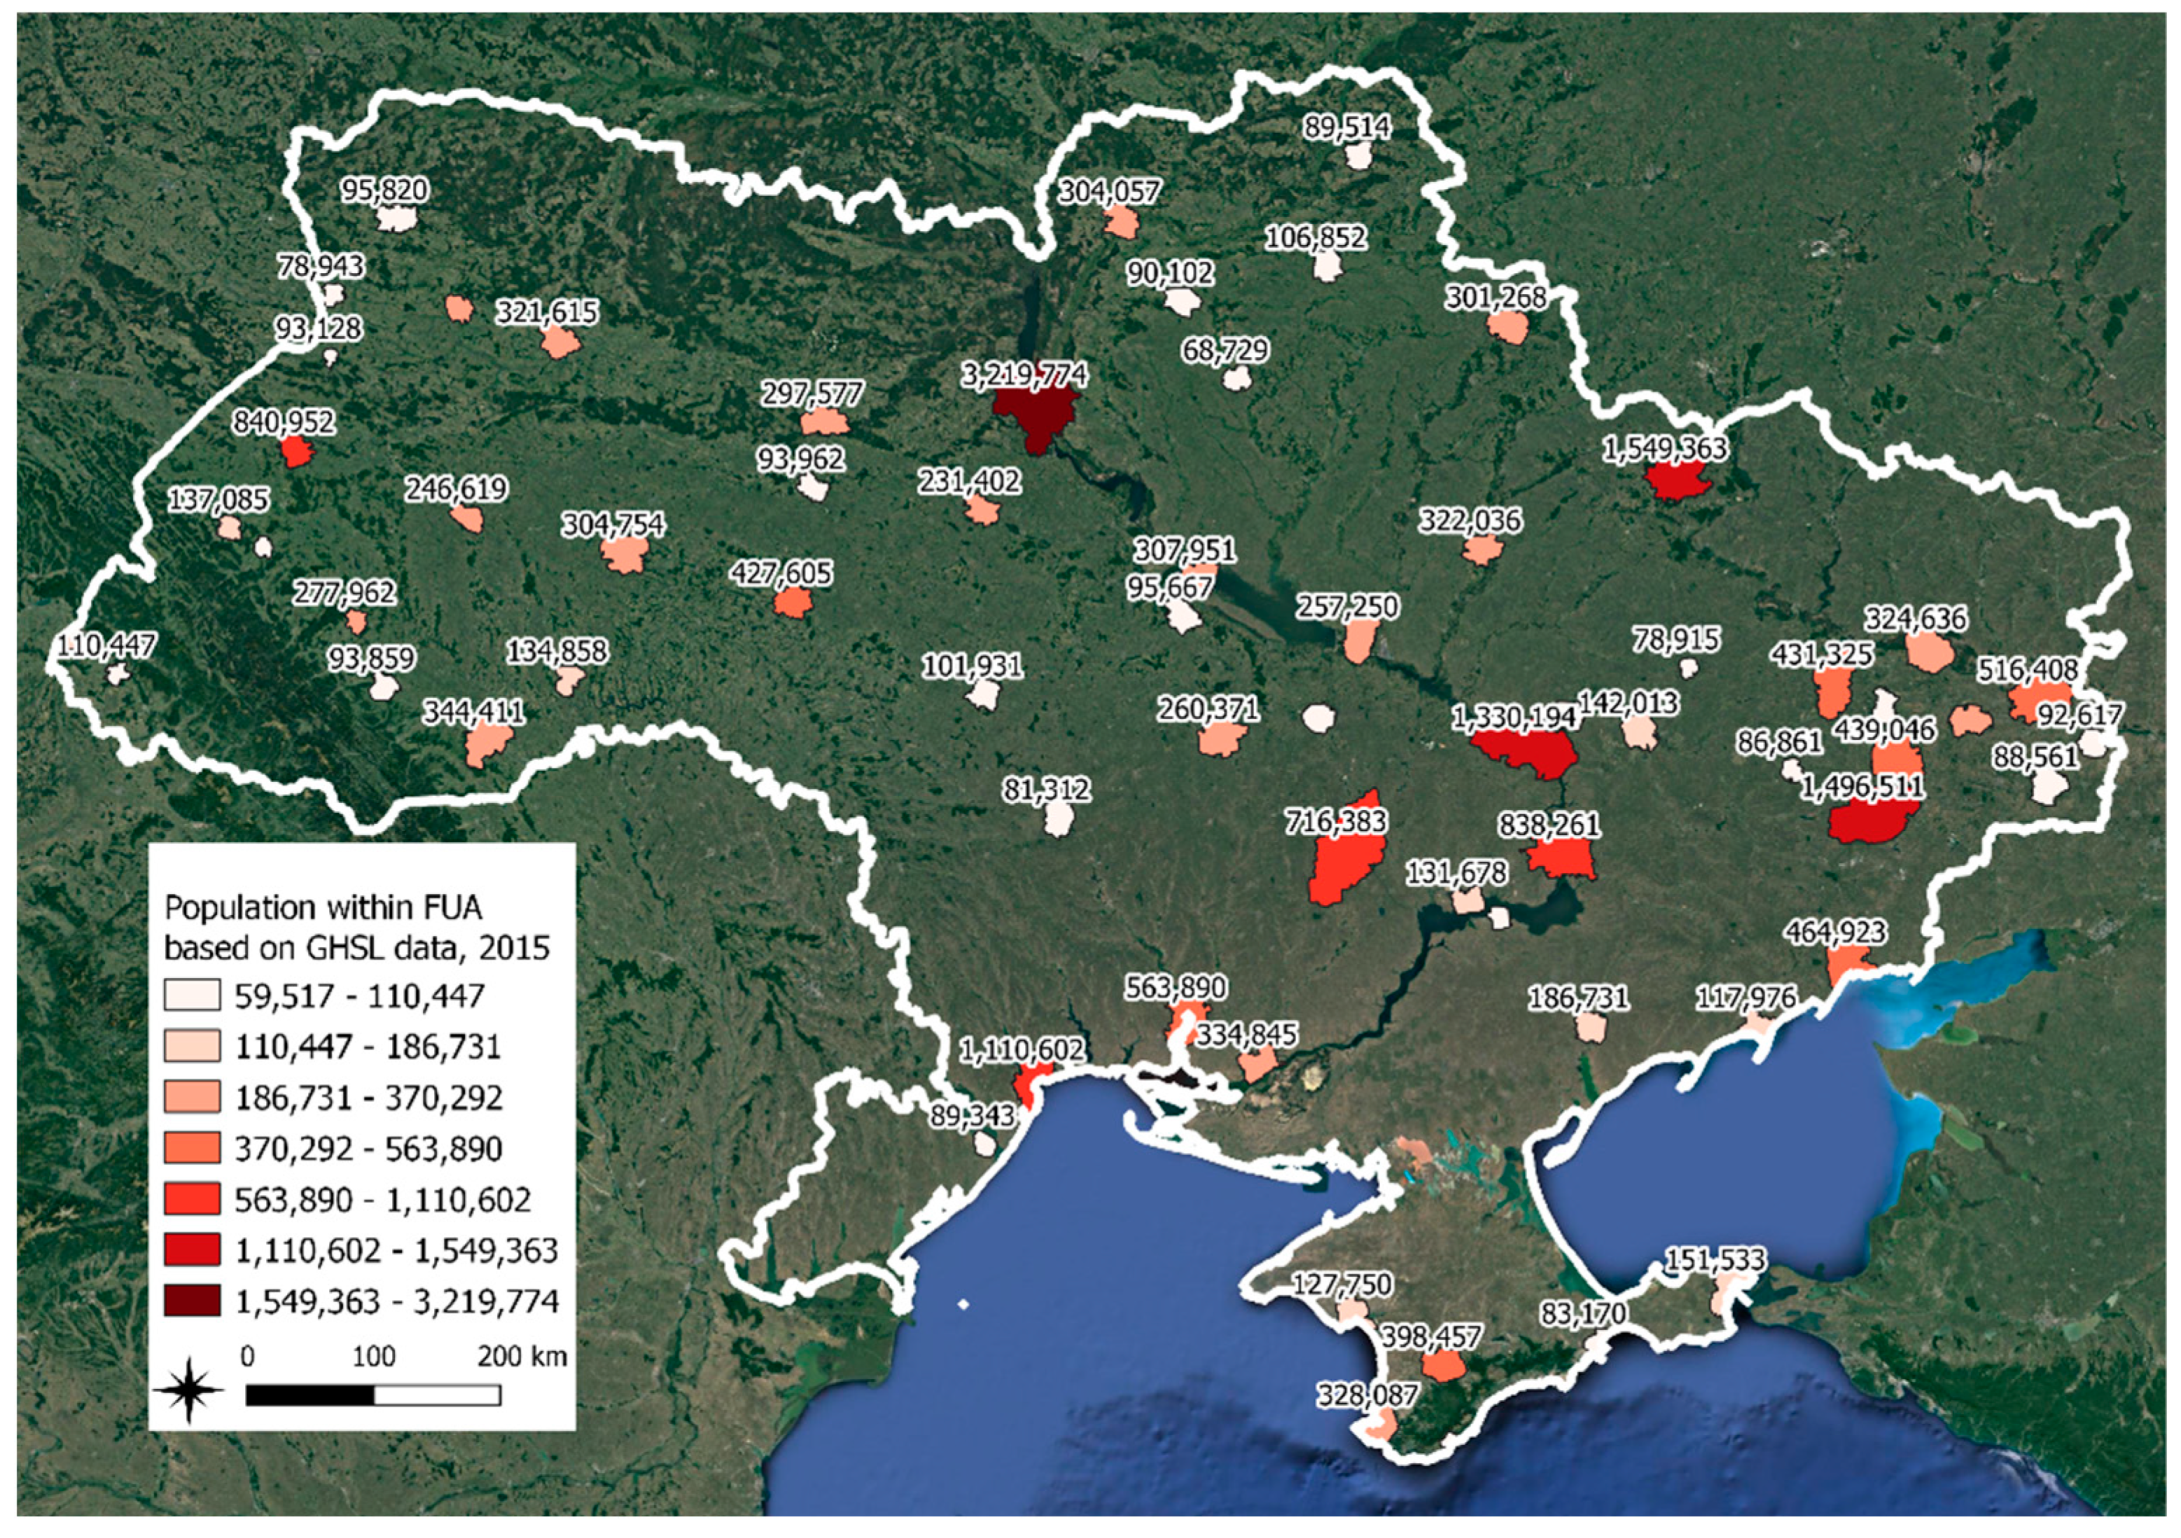
According to statistical emissions of pollutants into the atmosphere [31], two Ukrainian oblasts (Dnipropetrovska, Donetska) have the highest indicators (Figure 7). Figure 8 presents the population within the FUAs based on GHSL for 2015. The most populated city is the capital of Ukraine, the city of Kyiv, followed by the cities with the brightest red color. As can be seen from the figure, these cities are again mostly from the Donetsk and Dnipropetrovsk regions. All of these indicators, to a greater or lesser extent, affect air quality, which, accordingly, we can observe in Figure 5.
3.4. Population Data
For FUA calculation, the population data from two sources were used—the Global Human Settlement Layer (GHSL) by the European Commission (2015) [32] and NASA’s population density product (2015 and 2020) [33]. A separate study [34] was conducted to perform the validation of population data from these sources, and it was concluded that Global Human Settlement Layer data have a much higher correlation with statistical information on the population of Ukrainian cities. However, if the calculations are made at the level of the whole country, both products can be used.
4. Results
4.1. CAMS Air Quality Data Validation for Ukraine
The insufficient number of ground-based stations leads to the necessity of searching for additional data that allow one to analyze air quality across the whole country. In our case, satellite data or model data CAMS provide daily and hourly air quality data with a spatial resolution of 11 km. The Royal Netherlands Meteorological Institute (KNMI) validates different algorithms of CAMS data modelling for different parts of Europe on the basis of ground stations every day, and the root mean square error PM2.5 value, in general, does not exceed 10 mg/m3 [35]. Unfortunately, such validation is not performed for the territory of Ukraine. Within our investigations, CAMS data were validated based on the example of the city of Kyiv.
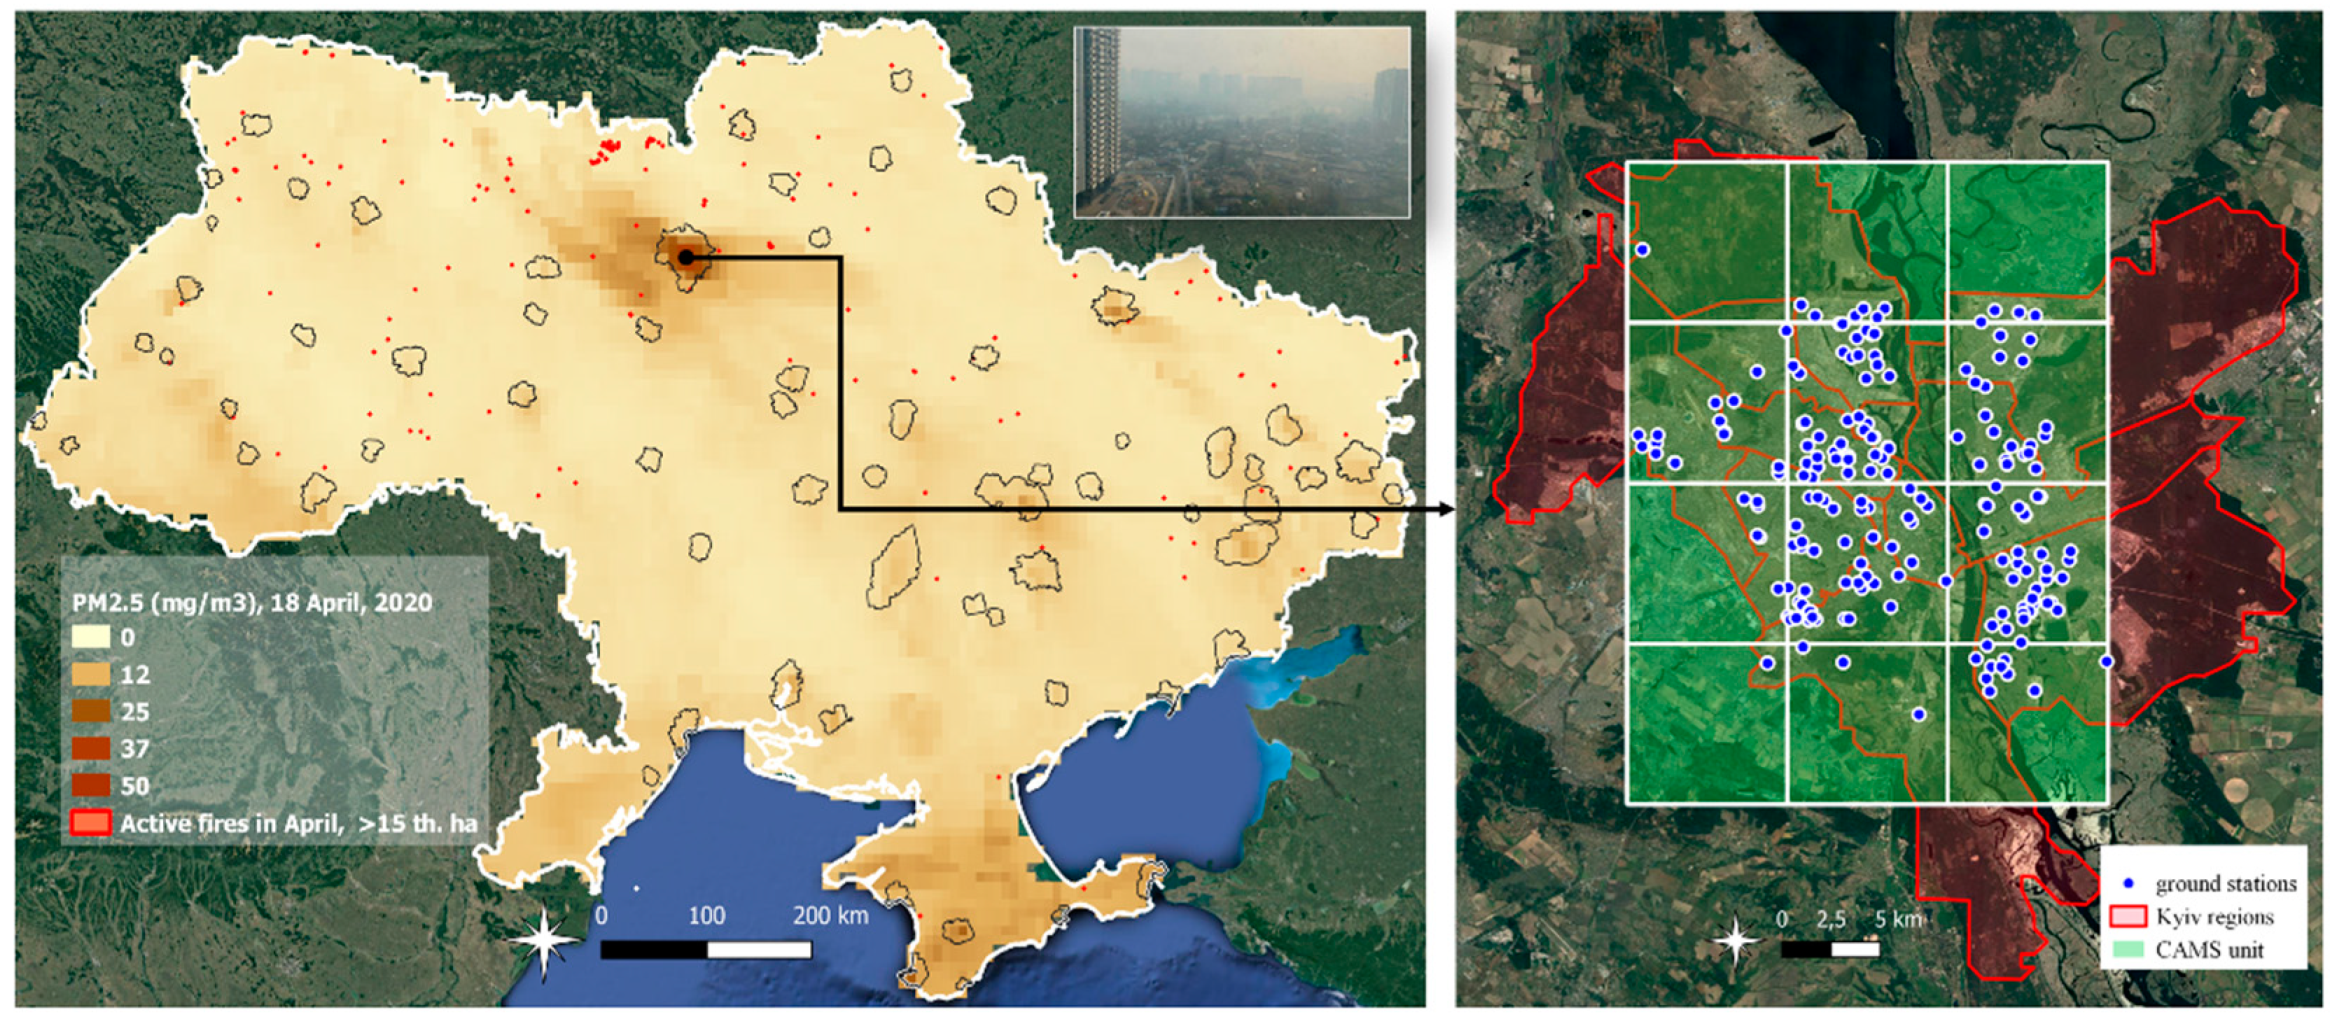
The left-hand panel of Figure 9 presents the coverage of the territory of Ukraine by CAMS data for 18 April 2020, including a period of active forest fires in the Zhytomyr region and the Chernobyl region. Active fires, which were determined according to our own methodology via satellite data with a high spatial resolution from Sentinel-2 of the European program Copernicus, are marked in red [36]. As can be seen from the right-hand panel of Figure 9, one pixel of CAMS data contains a large number of ground air quality measurement posts. This is why the aggregation of ground and satellite data, satellite data validation, as well as, in the future, increasing the spatial distinction of satellite data using deep learning algorithms, is an important task.
Before starting the validation of satellite data, we need to have an understanding of the reliability of the data that will be analyzed. In particular, the first step is to identify and eliminate the outliers observed in the data. These outliers can be caused by several factors—the failure of the ground station (error in determining the indicators of air pollution), as well as the high sensitivity of the sensor to sudden changes in the environment (sharp deterioration of air quality with subsequent rapid recovery). Such cases (outliers) were detected and eliminated from the data set using a boxplot or box-and-whisker diagram [37]. We also note that we validate rather rough global model data (with spatial resolution of 11 kilometers) with ground data, indicating that the major peaks in ground data physically cannot be identified based on global data.
The next step in data analysis is to compare the outlier-cleaned data with the CAMS model data. To do this, the ground data were aggregated so that they could be easily compared with the CAMS data, namely by calculating the average hourly values of the PM2.5 pollutant for each station.
Two commonly used statistical metrics, including the correlation coefficient (R) and root mean squared error (RMSE), were hereby calculated between spatially and temporally co-located ground PM2.5 measurements and CAMS PM2.5 to quantitatively evaluate the accuracy and uncertainty of the latter. Mathematically, these metrics can be derived from the following Equations (2) and (3):
where oi denotes ground-based PM2.5 measurements and pi represents the CAMS PM2.5 data, respectively. o and p are arithmetic means of the observed and forecasted PM2.5 concentrations, respectively, while n denotes the number of data pairs.
Since we are interested in how to predict or model ground observations with CAMS data, we will also be interested in the coefficient of determination R2 between ground data and CAMS data, which is determined by the following Equation (4) (in our case, the forecast data will be ground data):
where is the simulated value of air quality according to CAMS.
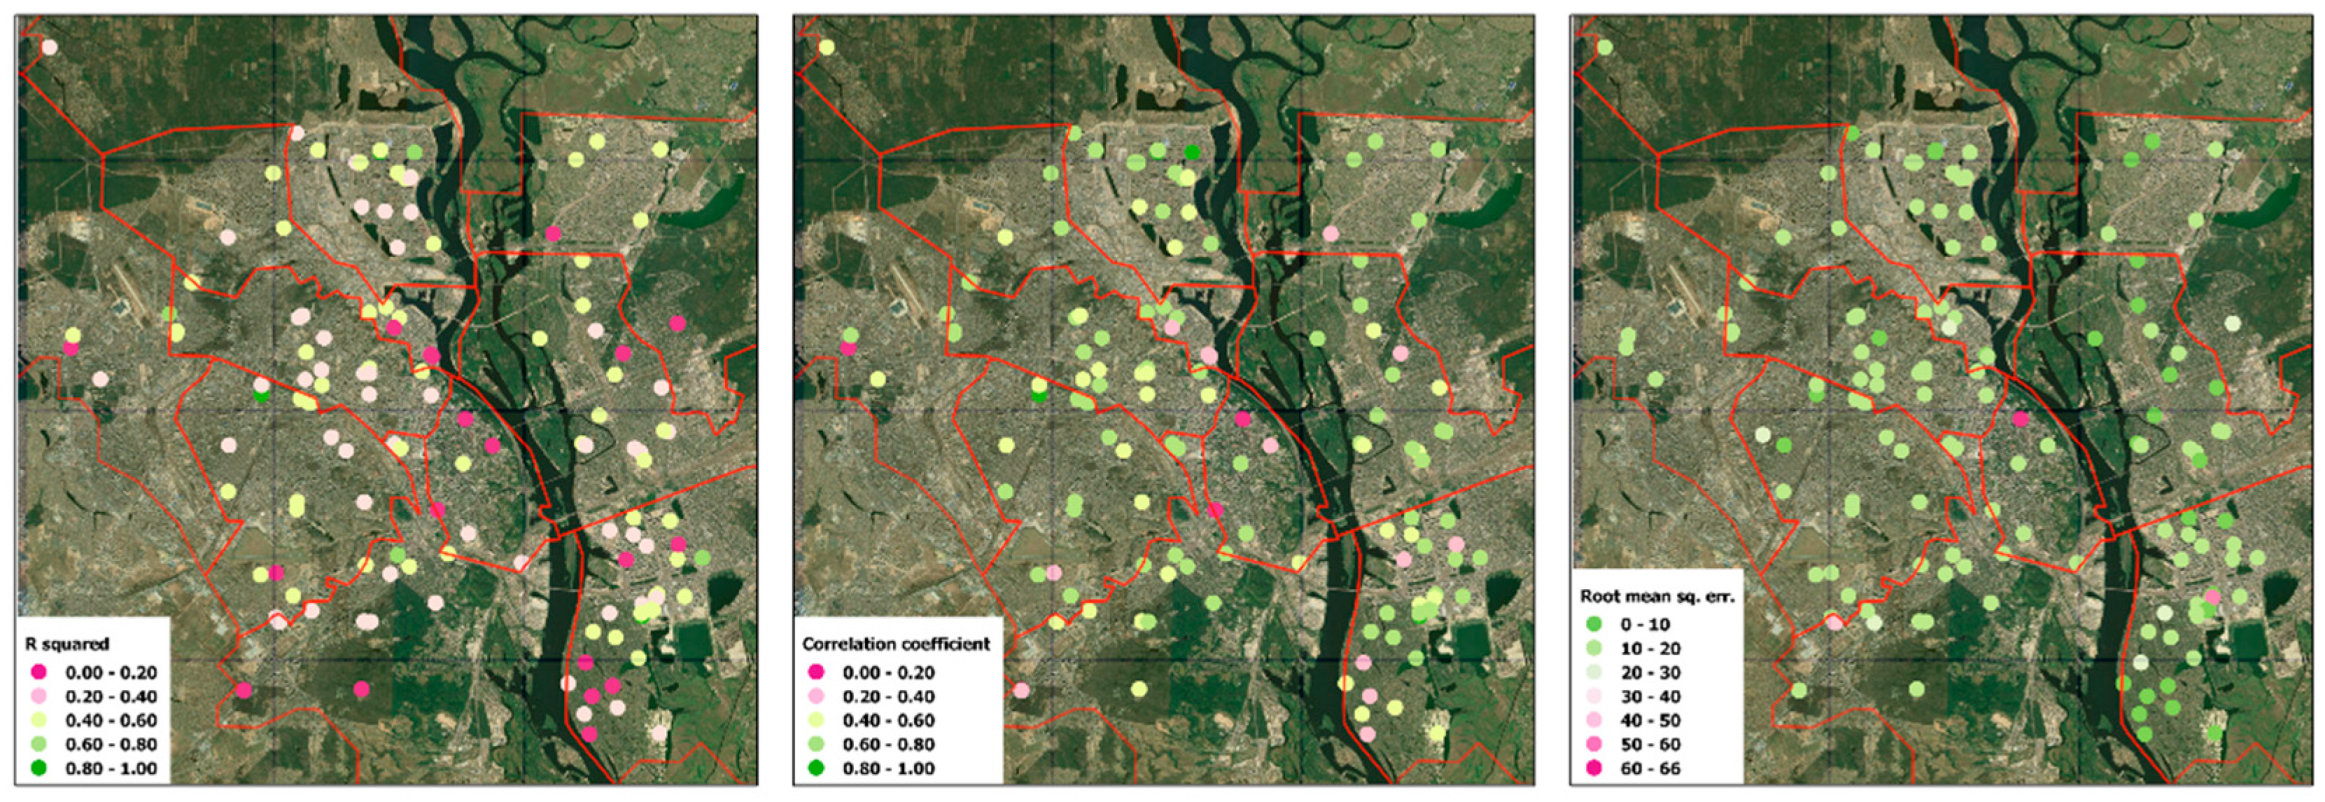
After identifying the outliers in the ground datasets, the statistical indicators (R, R2 and RMSE) were calculated, which are presented in Figure 10. For 107 stations, the correlation between ground data and CAMS is more than 0.5, which indicates a sufficiently high quality of CAMS model data. For 85 stations, the RMSE indicator does not exceed 15 mg/m3, and for 33 stations, it does not exceed 10 mg/m3.
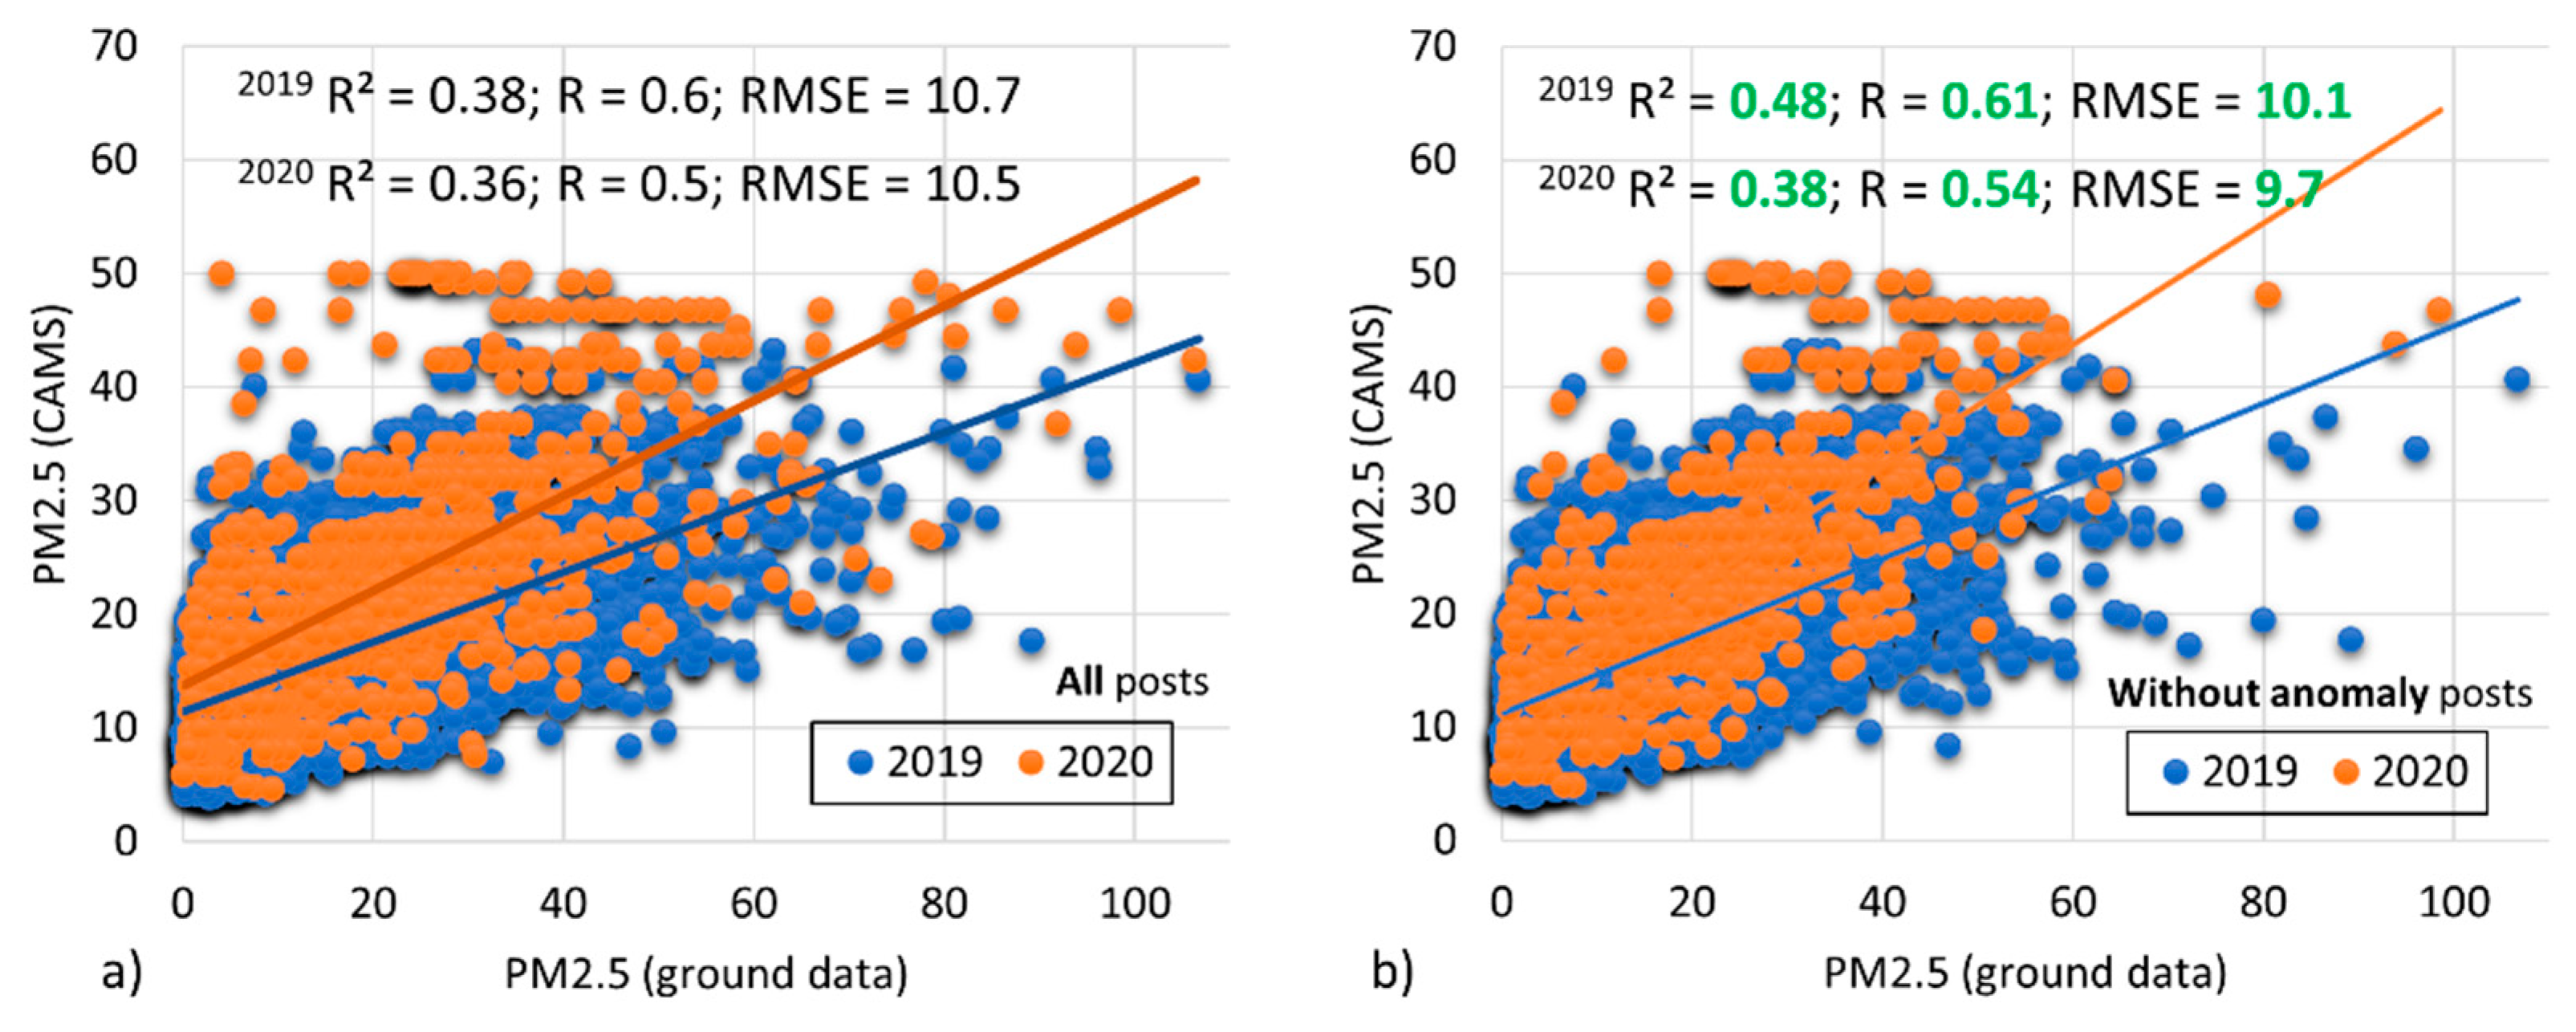
Figure 11 shows a comparison of daily data from all ground stations for 2019–2020 (the values are in mg/m3). The R-squared ratio is not very high (0.36–0.38) but is stable for both years. The correlation coefficient shows the best values (0.5–0.6), which allows us to conclude that CAMS data can be used for Kyiv as a reliable source of data in analytical tasks. Excluding from the survey those stations (Figure 11b) that are statistical outliers (their values are very different from neighboring stations), the correlation coefficient and R-squared coefficient were increased and the root mean squared error was decreased for both years (in 2019, the R-squared value increased from 0.38 to 0.48, the correlation values increased from 0.6 to 0.61, and the RMSE value decreased from 10.7 to 10.1 mg/m3; in 2020, the R-squared value increased from 0.36 to 0.38, the correlation values increased from 0.5 to 0.54, and the RMSE value decreased from 10.5 to 9.7 mg/m3).
Additionally, from the dependence graph, it is seen that the value of PM2.5 from ground stations mostly exceeds the data from CAMS. One of the logical explanations for this is the spatial resolution of CAMS data. It does not allow one to increase the variability of the values of the contaminant, and thus, increases the accuracy of CAMS products. A great advantage of satellite and model data for air quality monitoring is the continuous coverage of the study area with data, which cannot be guaranteed when using ground stations only. As a conclusion, we can say that CAMS data are reliable global data that can be used in scientific and practical research for the territory of Ukraine.
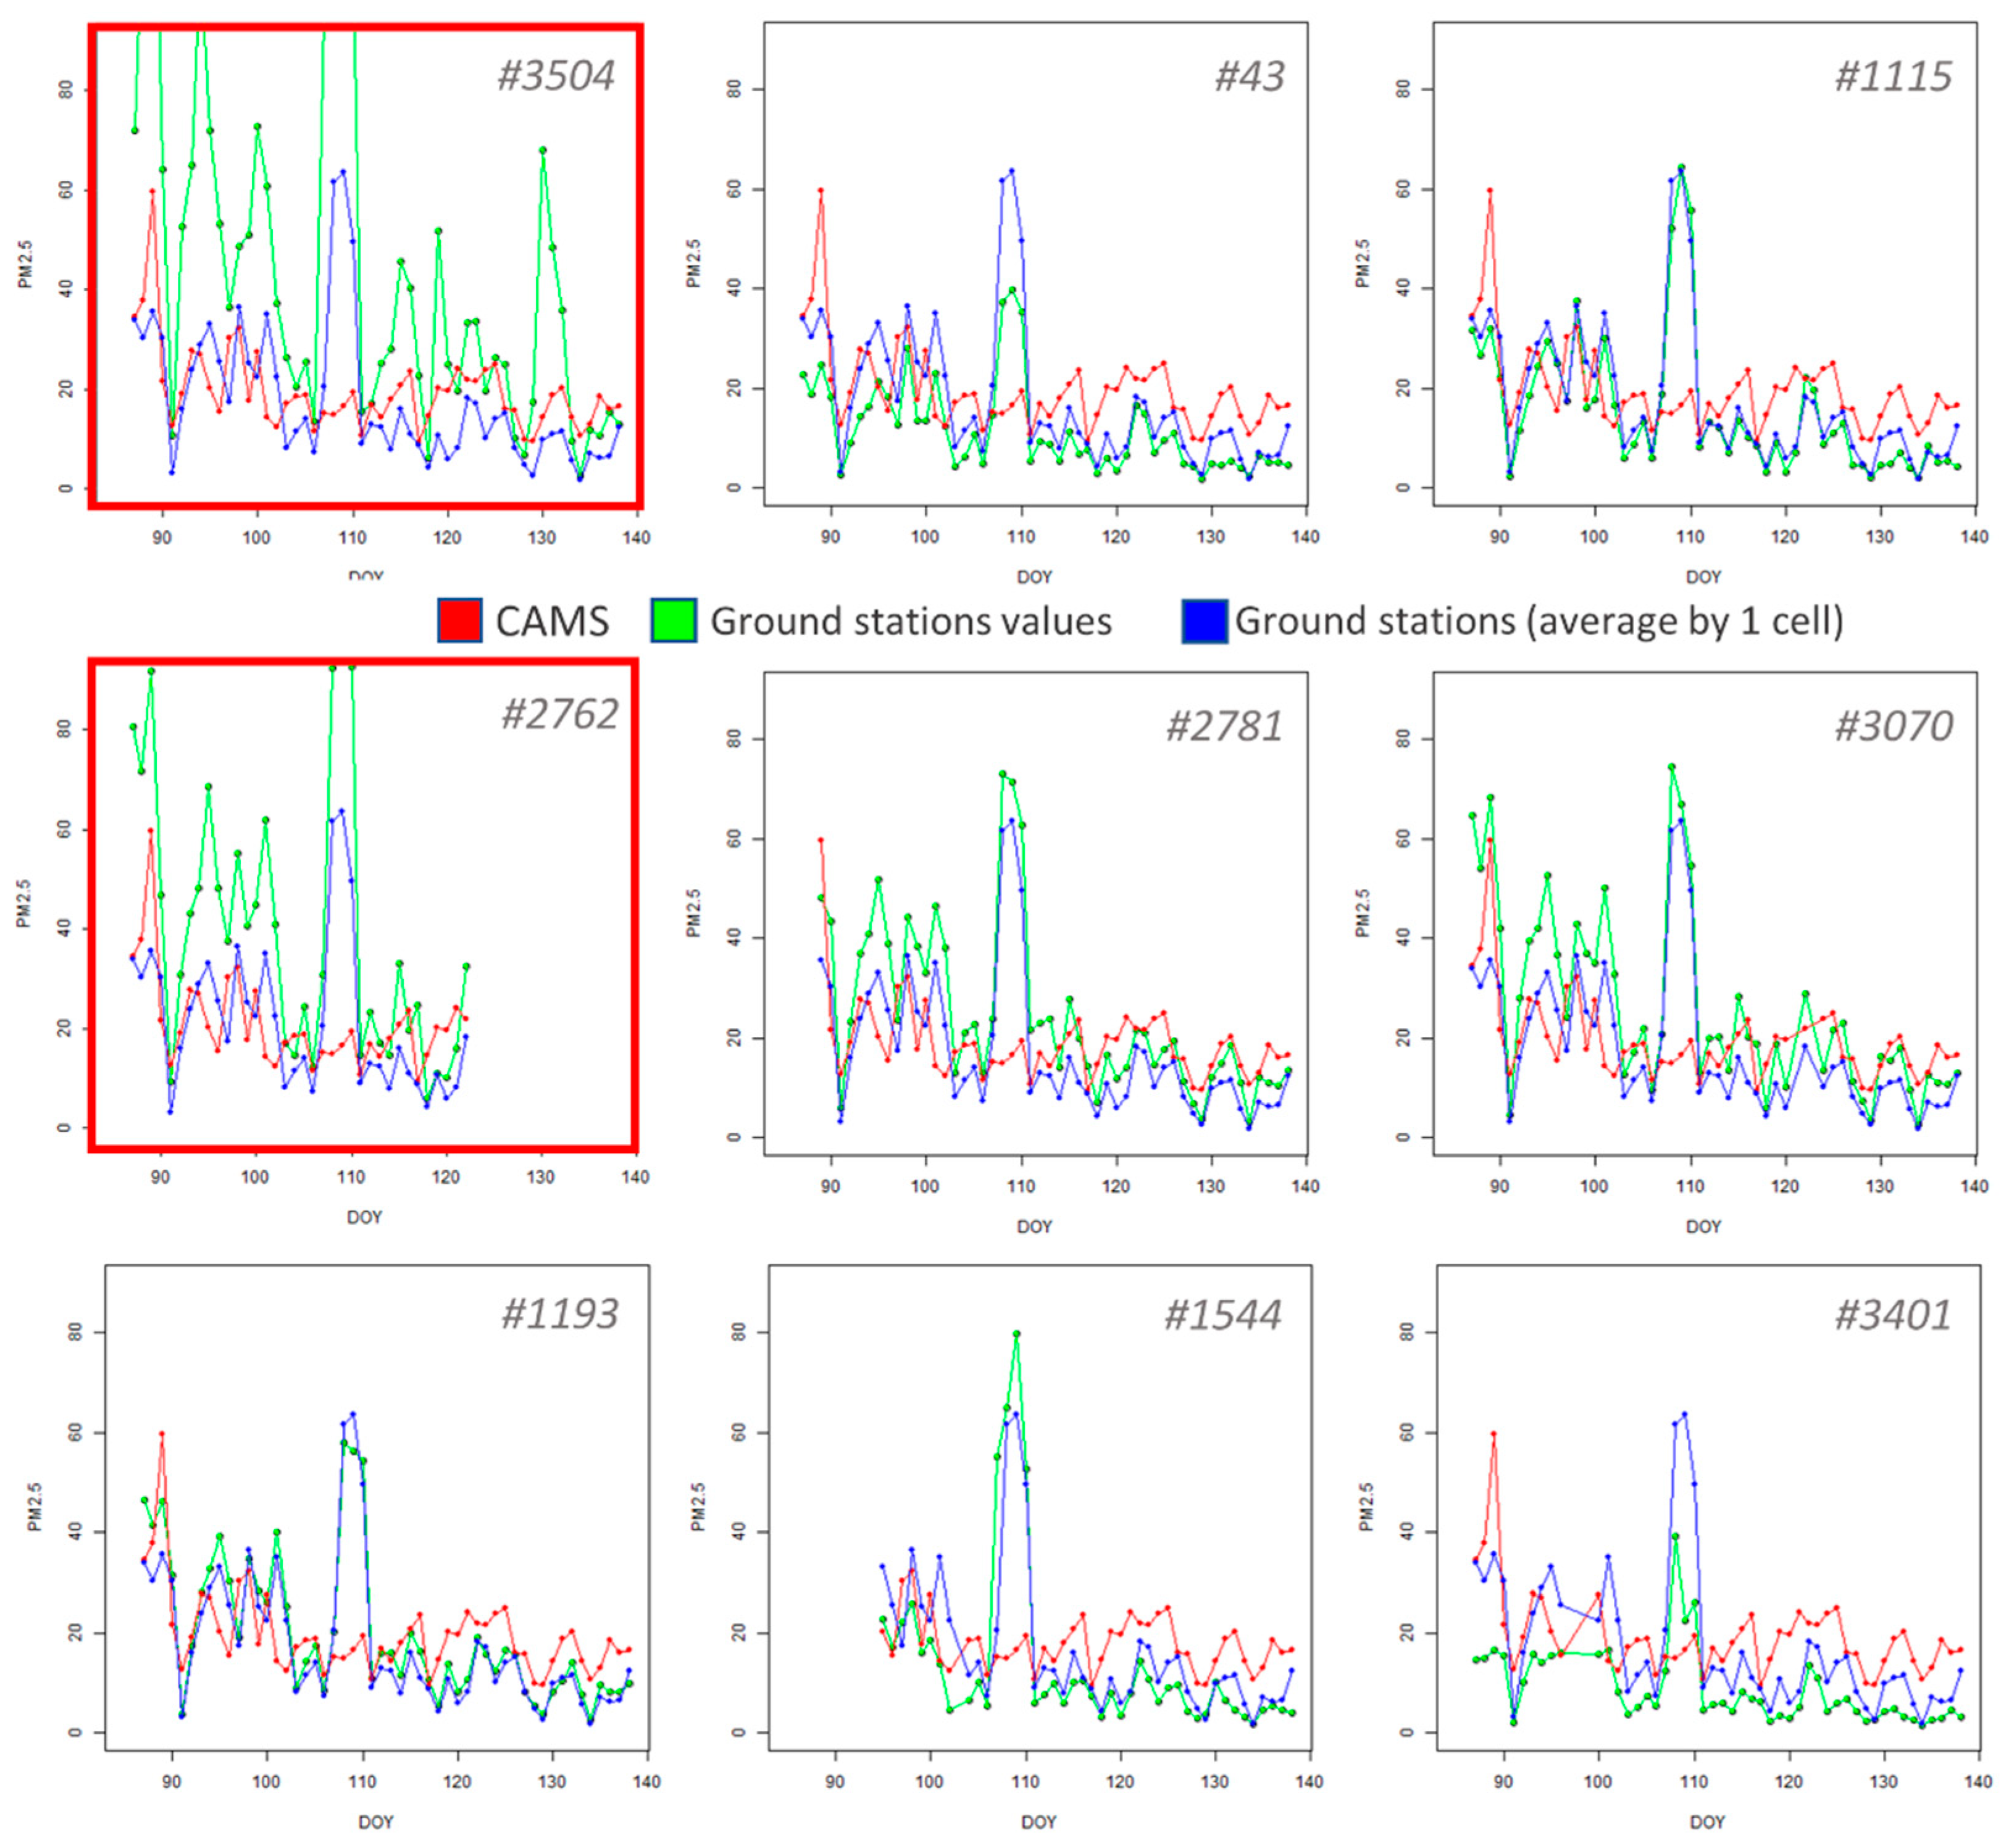
Figure 12 shows graphs comparing different ground stations within a single cell of CAMS data. Red shows CAMS data, green shows data from a specific ground station that is geographically within the investigated cell, and blue shows the average PM2.5 values for all ground stations within this cell. The characteristic jump for days 100–110 of the year (April 2020) is associated with a sharp deterioration in air quality in Kyiv due to fires in the Zhytomyr region and the Chornobyl zone. Stations with a red outline are defined as anomalies and are removed from the analysis because the values in them are much larger than the average value for all the stations within a given cell.
4.2. Population Data GHSL and NASA Validation for Ukraine
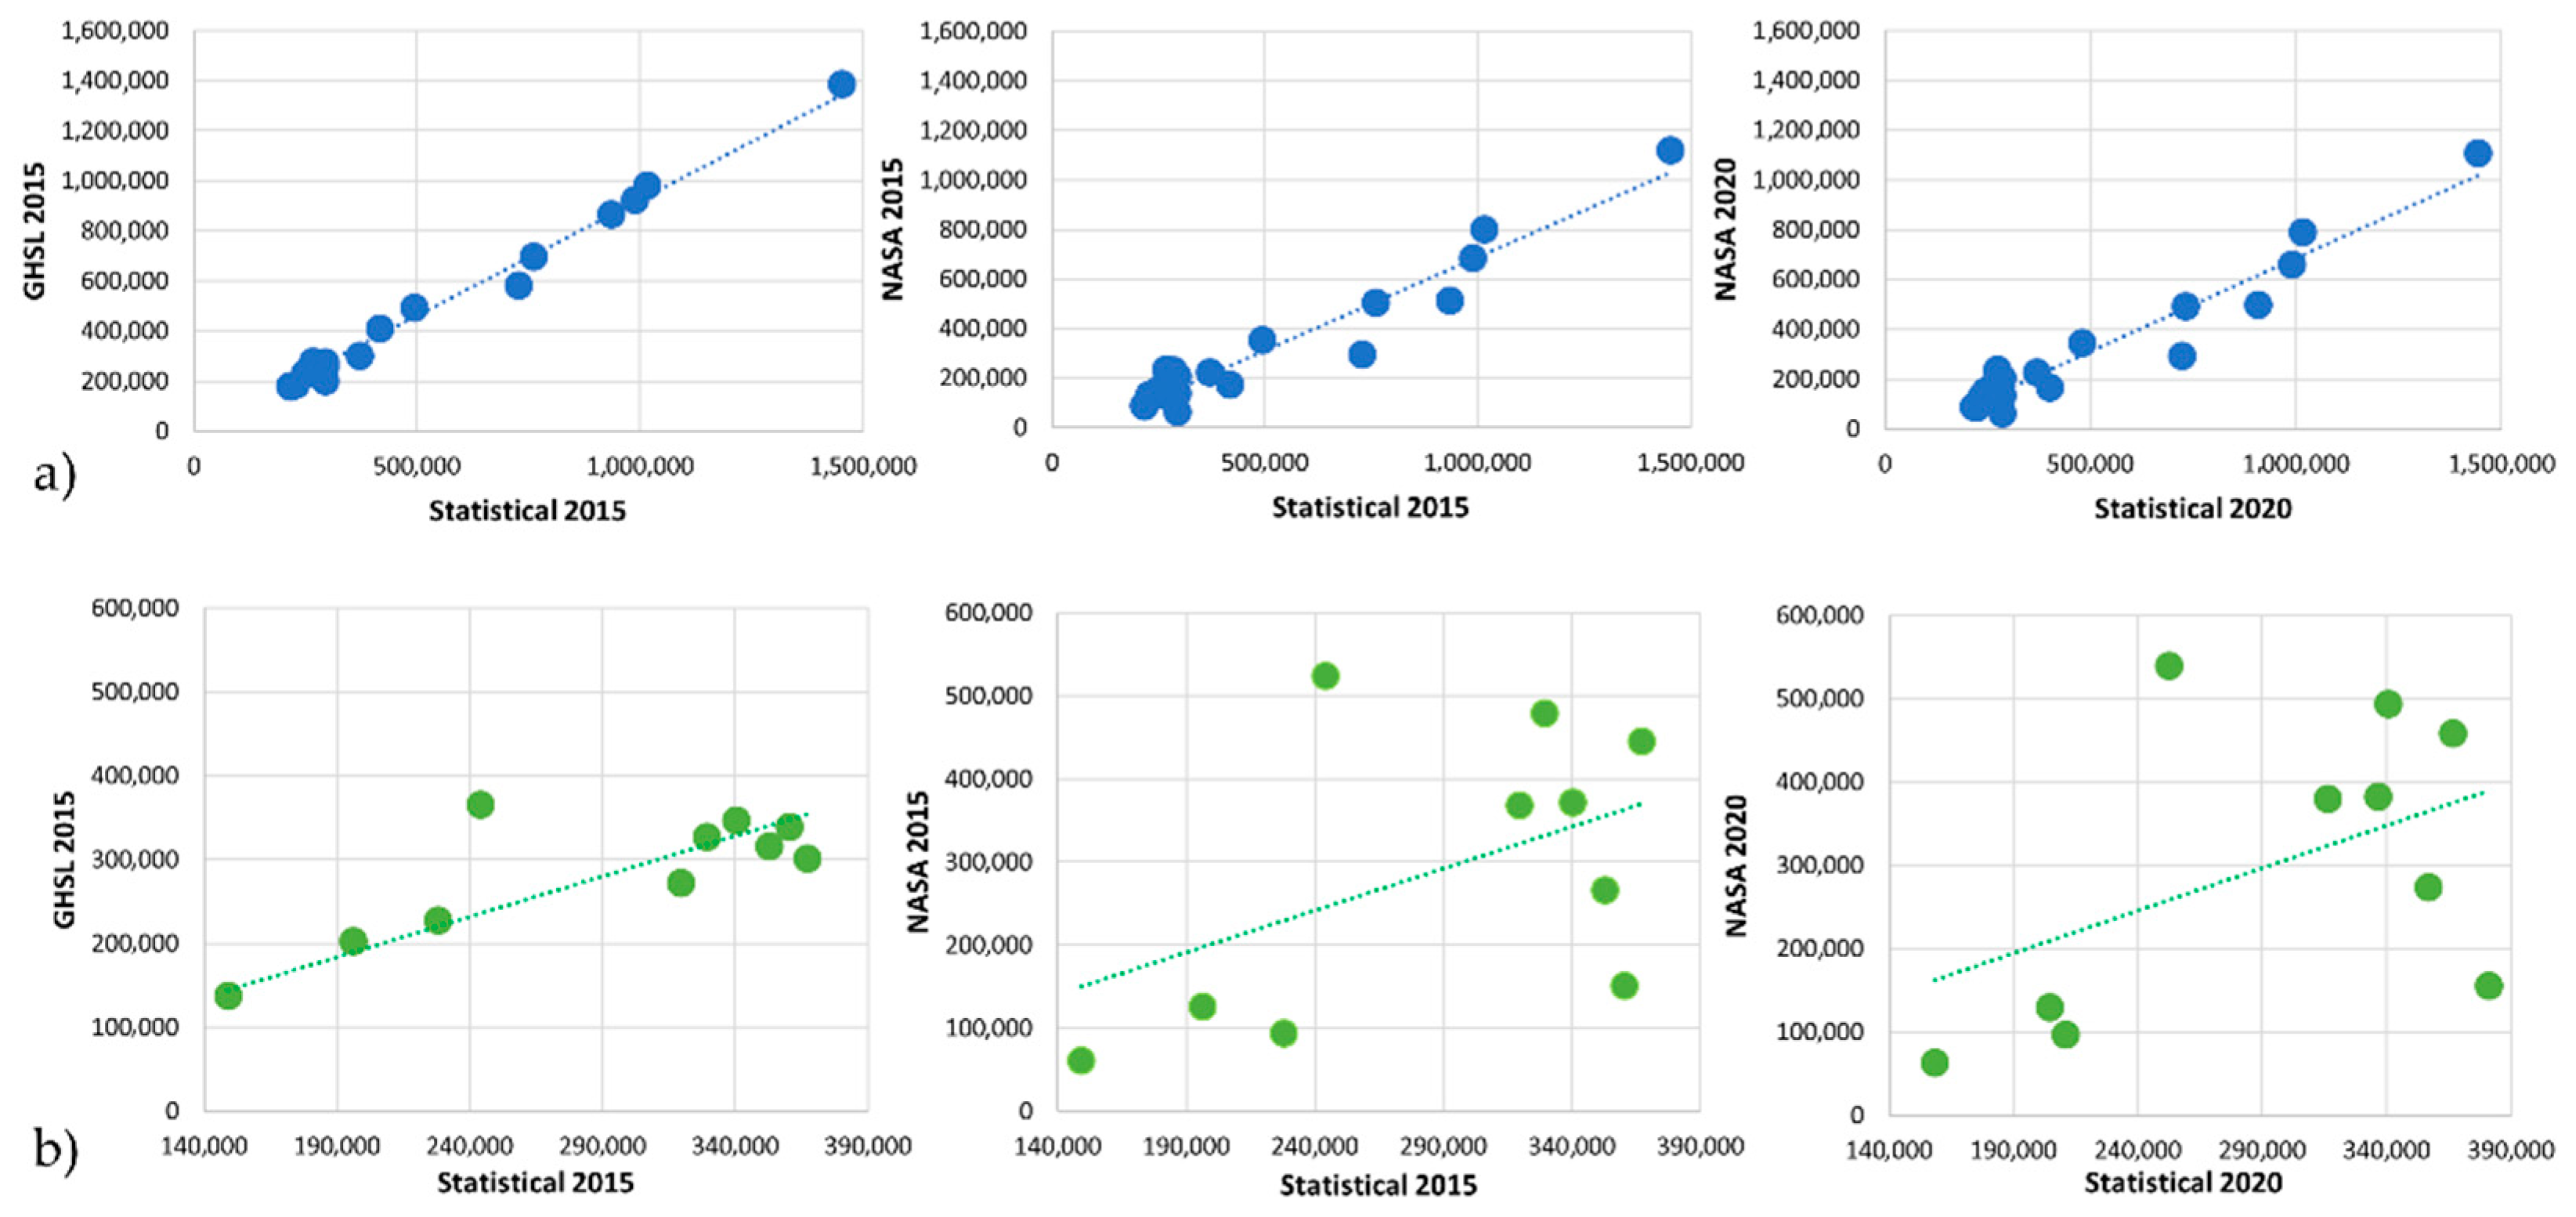
In this paper, the FUAs for Ukraine were defined, having not been defined for Ukraine previously. Accordingly, the question about the availability and accessibility of population data within the obtained FUA arose. This question is important, because population data are necessary for calculating the SDG indicator 11.6.2. In this case, the global products for around world can help, namely, the population data from the Global Human Settlement Layer (GHSL) and the global population data from NASA. Accordingly, the first question before using these data for the territory of Ukraine is the question of their verification. To validate GHSL and NASA population data, official population statistics for 2013–2020 were used for the 20 largest cities in Ukraine [38]. Separate validation was conducted in the districts of Kyiv, for which statistical information on the population is available for 2007–2020 [39].
Pearson’s correlation coefficient was calculated to verify the relationship between satellite population data and statistics (Table 1, Figure 13). The Global Human Settlement Layer data correlation coefficient for Kyiv districts is close to 0.77. This means that there is a strong directly linear relationship between GHSL data and statistics. NASA data for the districts of Kyiv show a correlation coefficient close to 0.52, which is characteristic of the direct linear dependence of the average intensity.
During the analysis, the absolute and relative deviations of GHSL and NASA data from statistical data were calculated. The maximum relative error according to GHSL is roughly 33% in the city of Kherson, while the minimum error is less than 1% in the city of Nikolaev. In the main part of the cities, the error does not exceed 10%. At the level of Kyiv districts, the relative deviation is mostly no more than 2–10%. Deviation of more than 10% is observed in the Desnyansky and Obolonsky districts. A particularly large deviation (about 50%) was recorded in the Holosiivskyi district.
According to NASA data, the situation is worse due to the lower spatial resolution of the product. The largest relative error is recorded in the city of Kherson and is about 80%. For other cities, the error exceeds 40%. At the level of districts of the city of Kyiv, a deviation of about 50% is observed. In the Holosiivskyi district, deviations reach more than 100%. However, when estimating data not separated by district but for the whole city, the deviation rates decreased significantly, in some years not even reaching 7% for NASA data.
According to the analysis, it can be concluded that there is a clear, directly linear relationship between GHSL and NASA product data and population statistics, and they can be used in studies to determine the SDG indicator 11.6.2 for Ukraine.
4.3. SDG Indicator 11.6.2
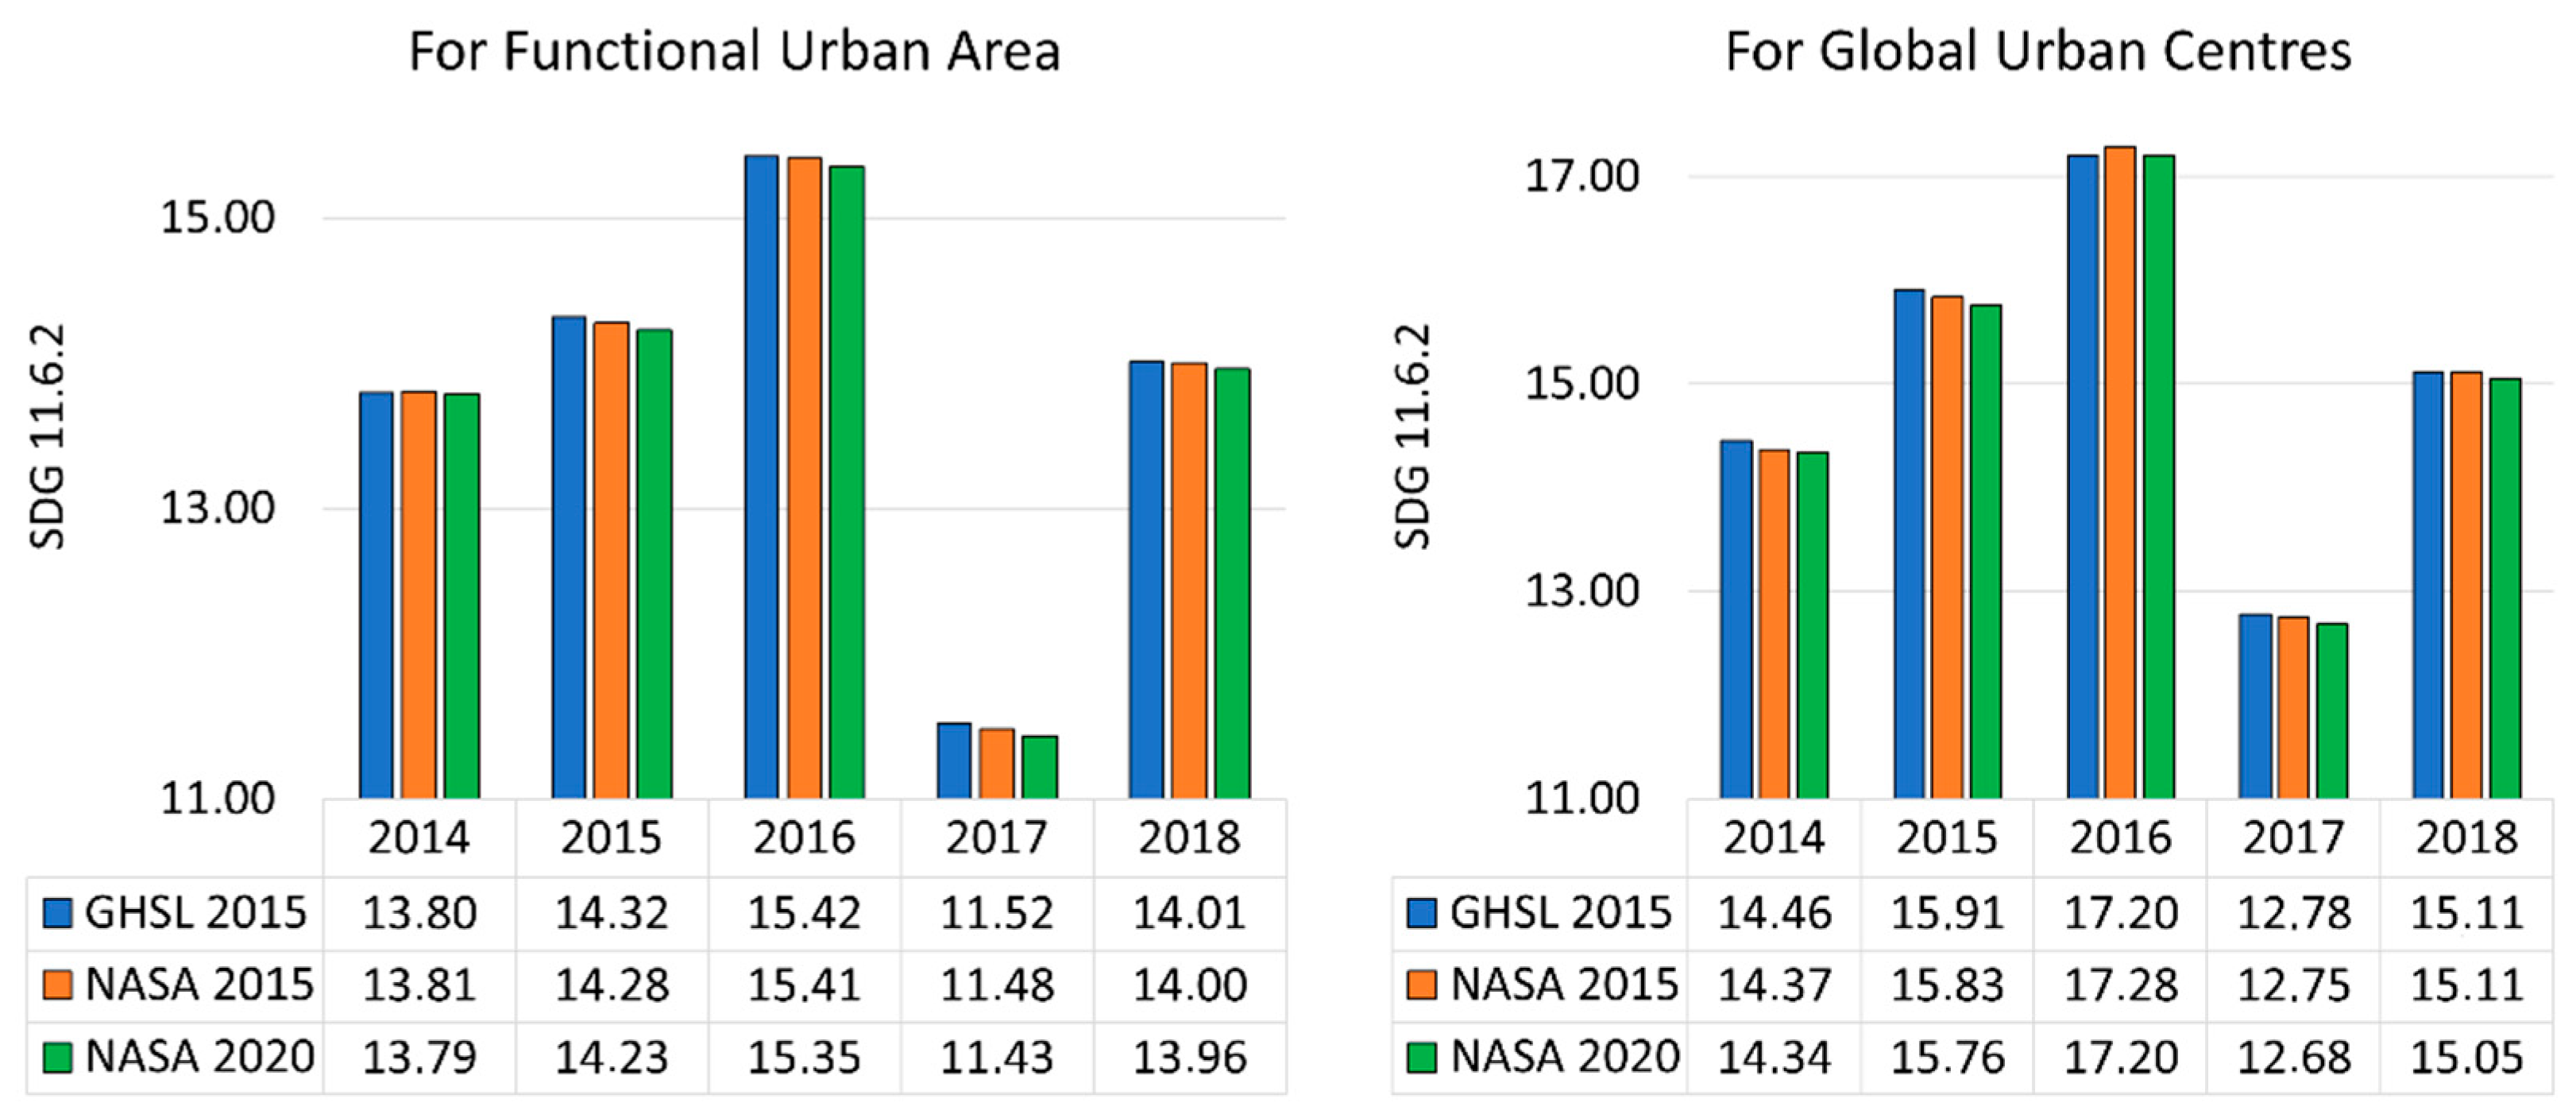
Figure 14 shows the obtained values of indicator 11.6.2 for Ukraine using different data on the population by FUA and GUC. Following on from Figure 14, in 2017, there was a significant decline in the indicator responsible for improving air quality in the country as a whole. It can also be noted that the chart shows that indicator 11.6.2 does not change much at the level of the whole country, depending on the provider of information on population. This once again confirms the possibility of using global population data to calculate this SDG indicator.
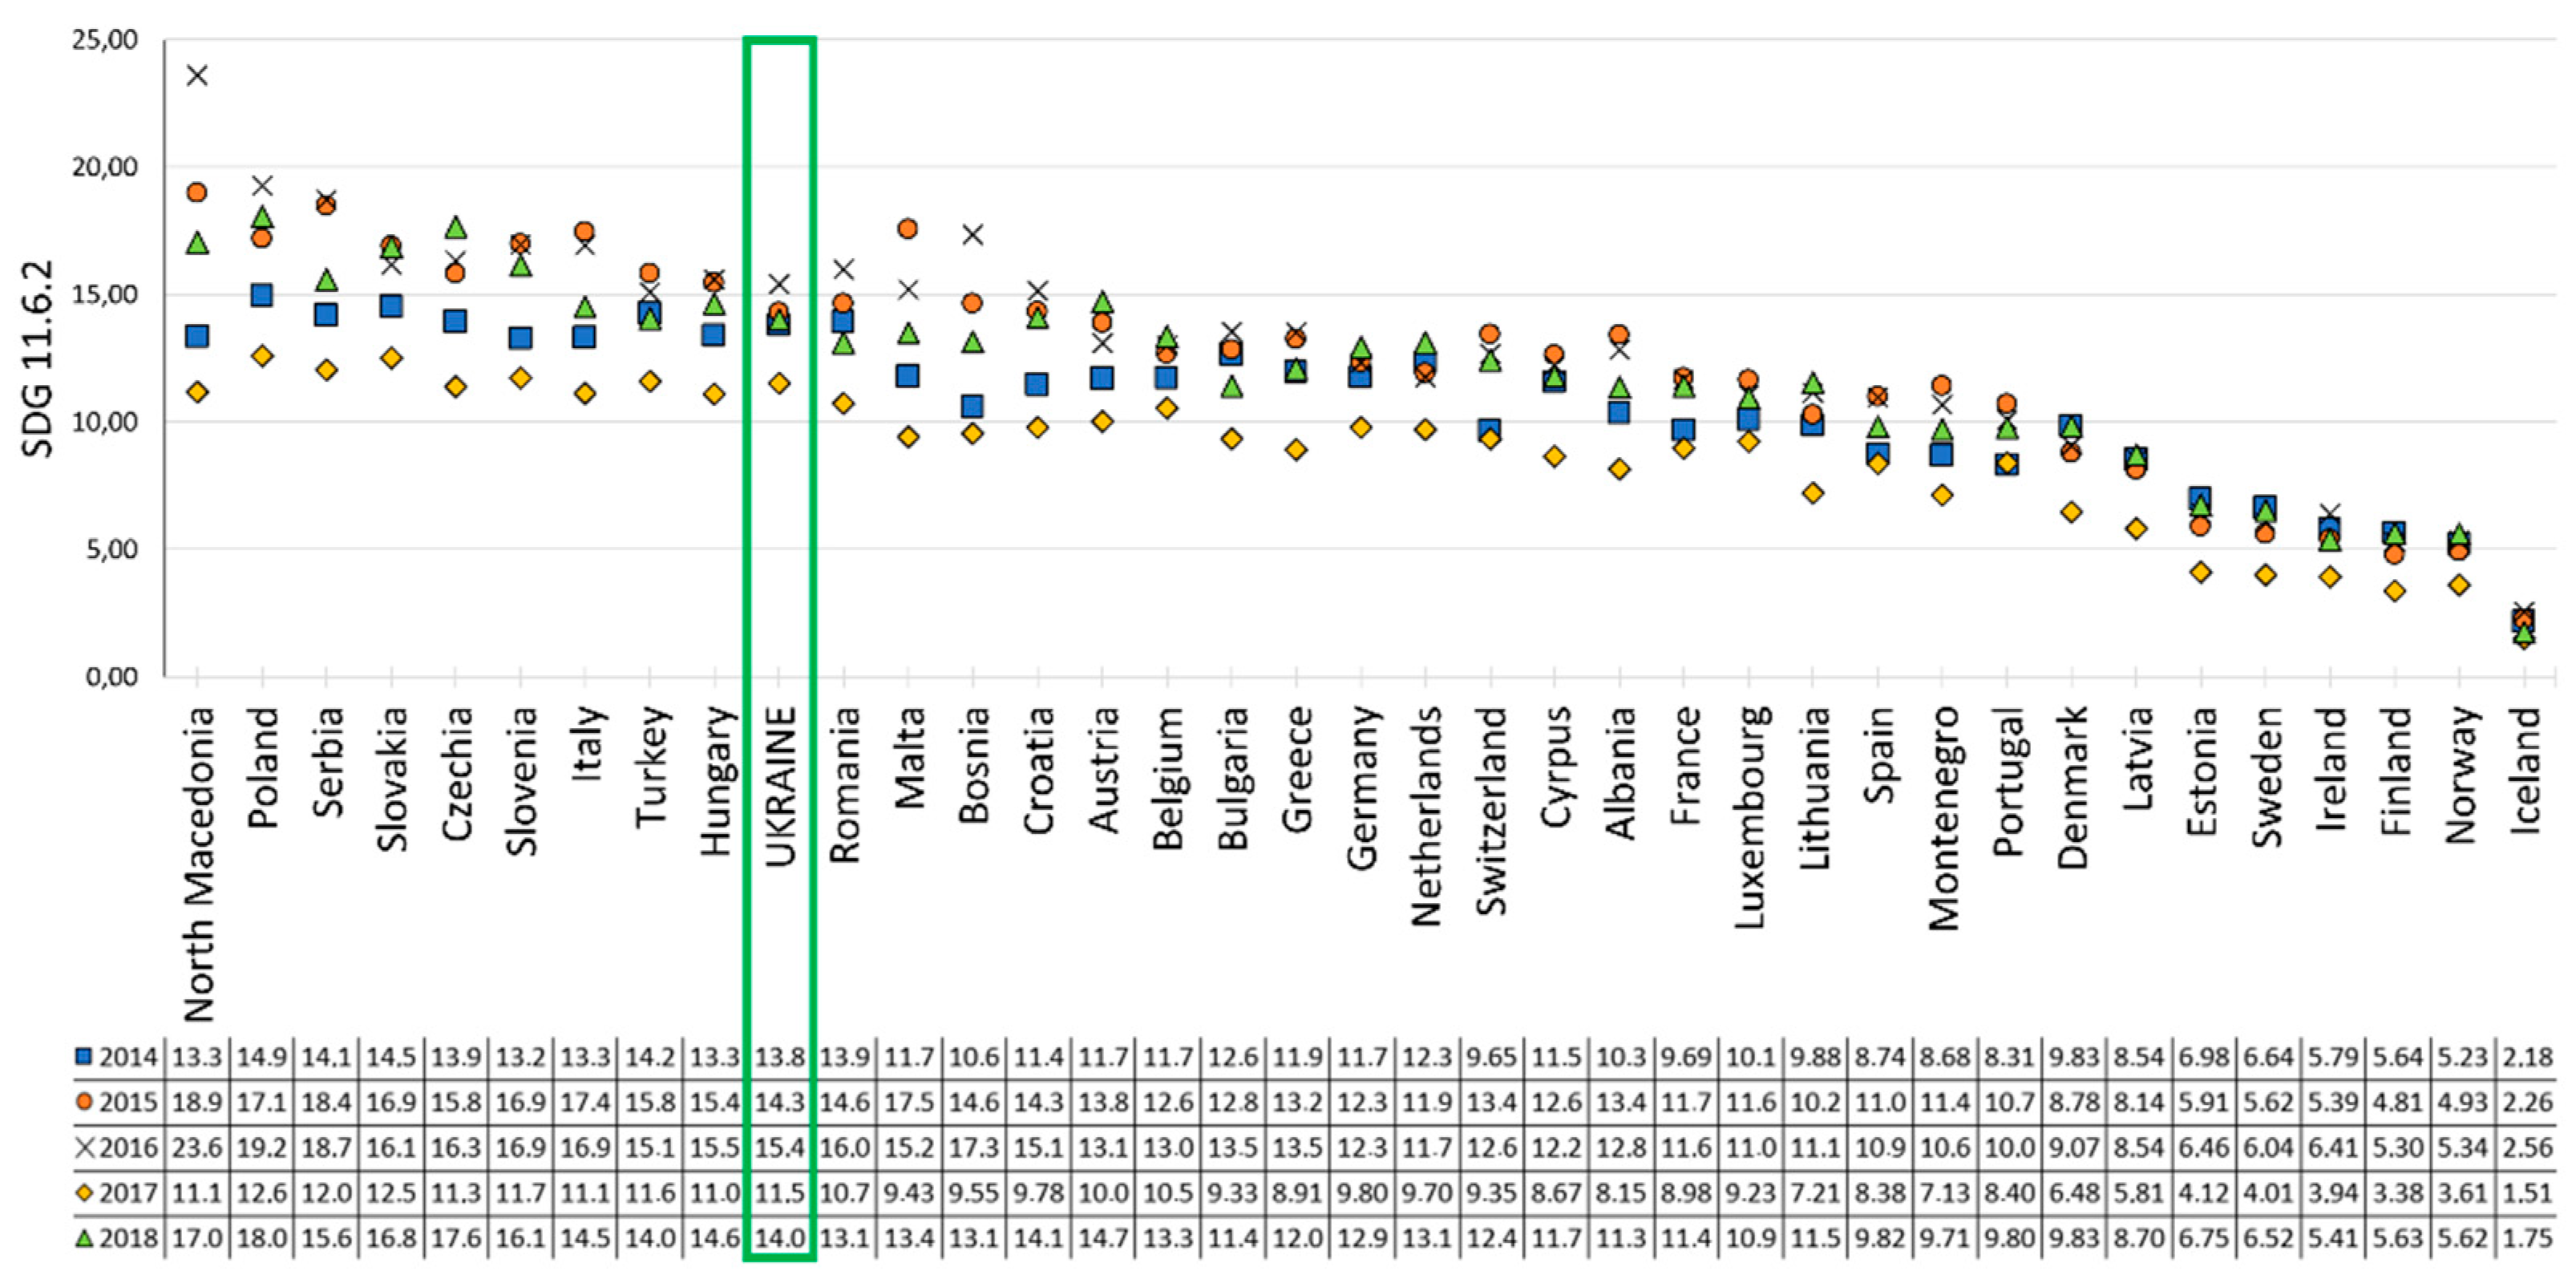
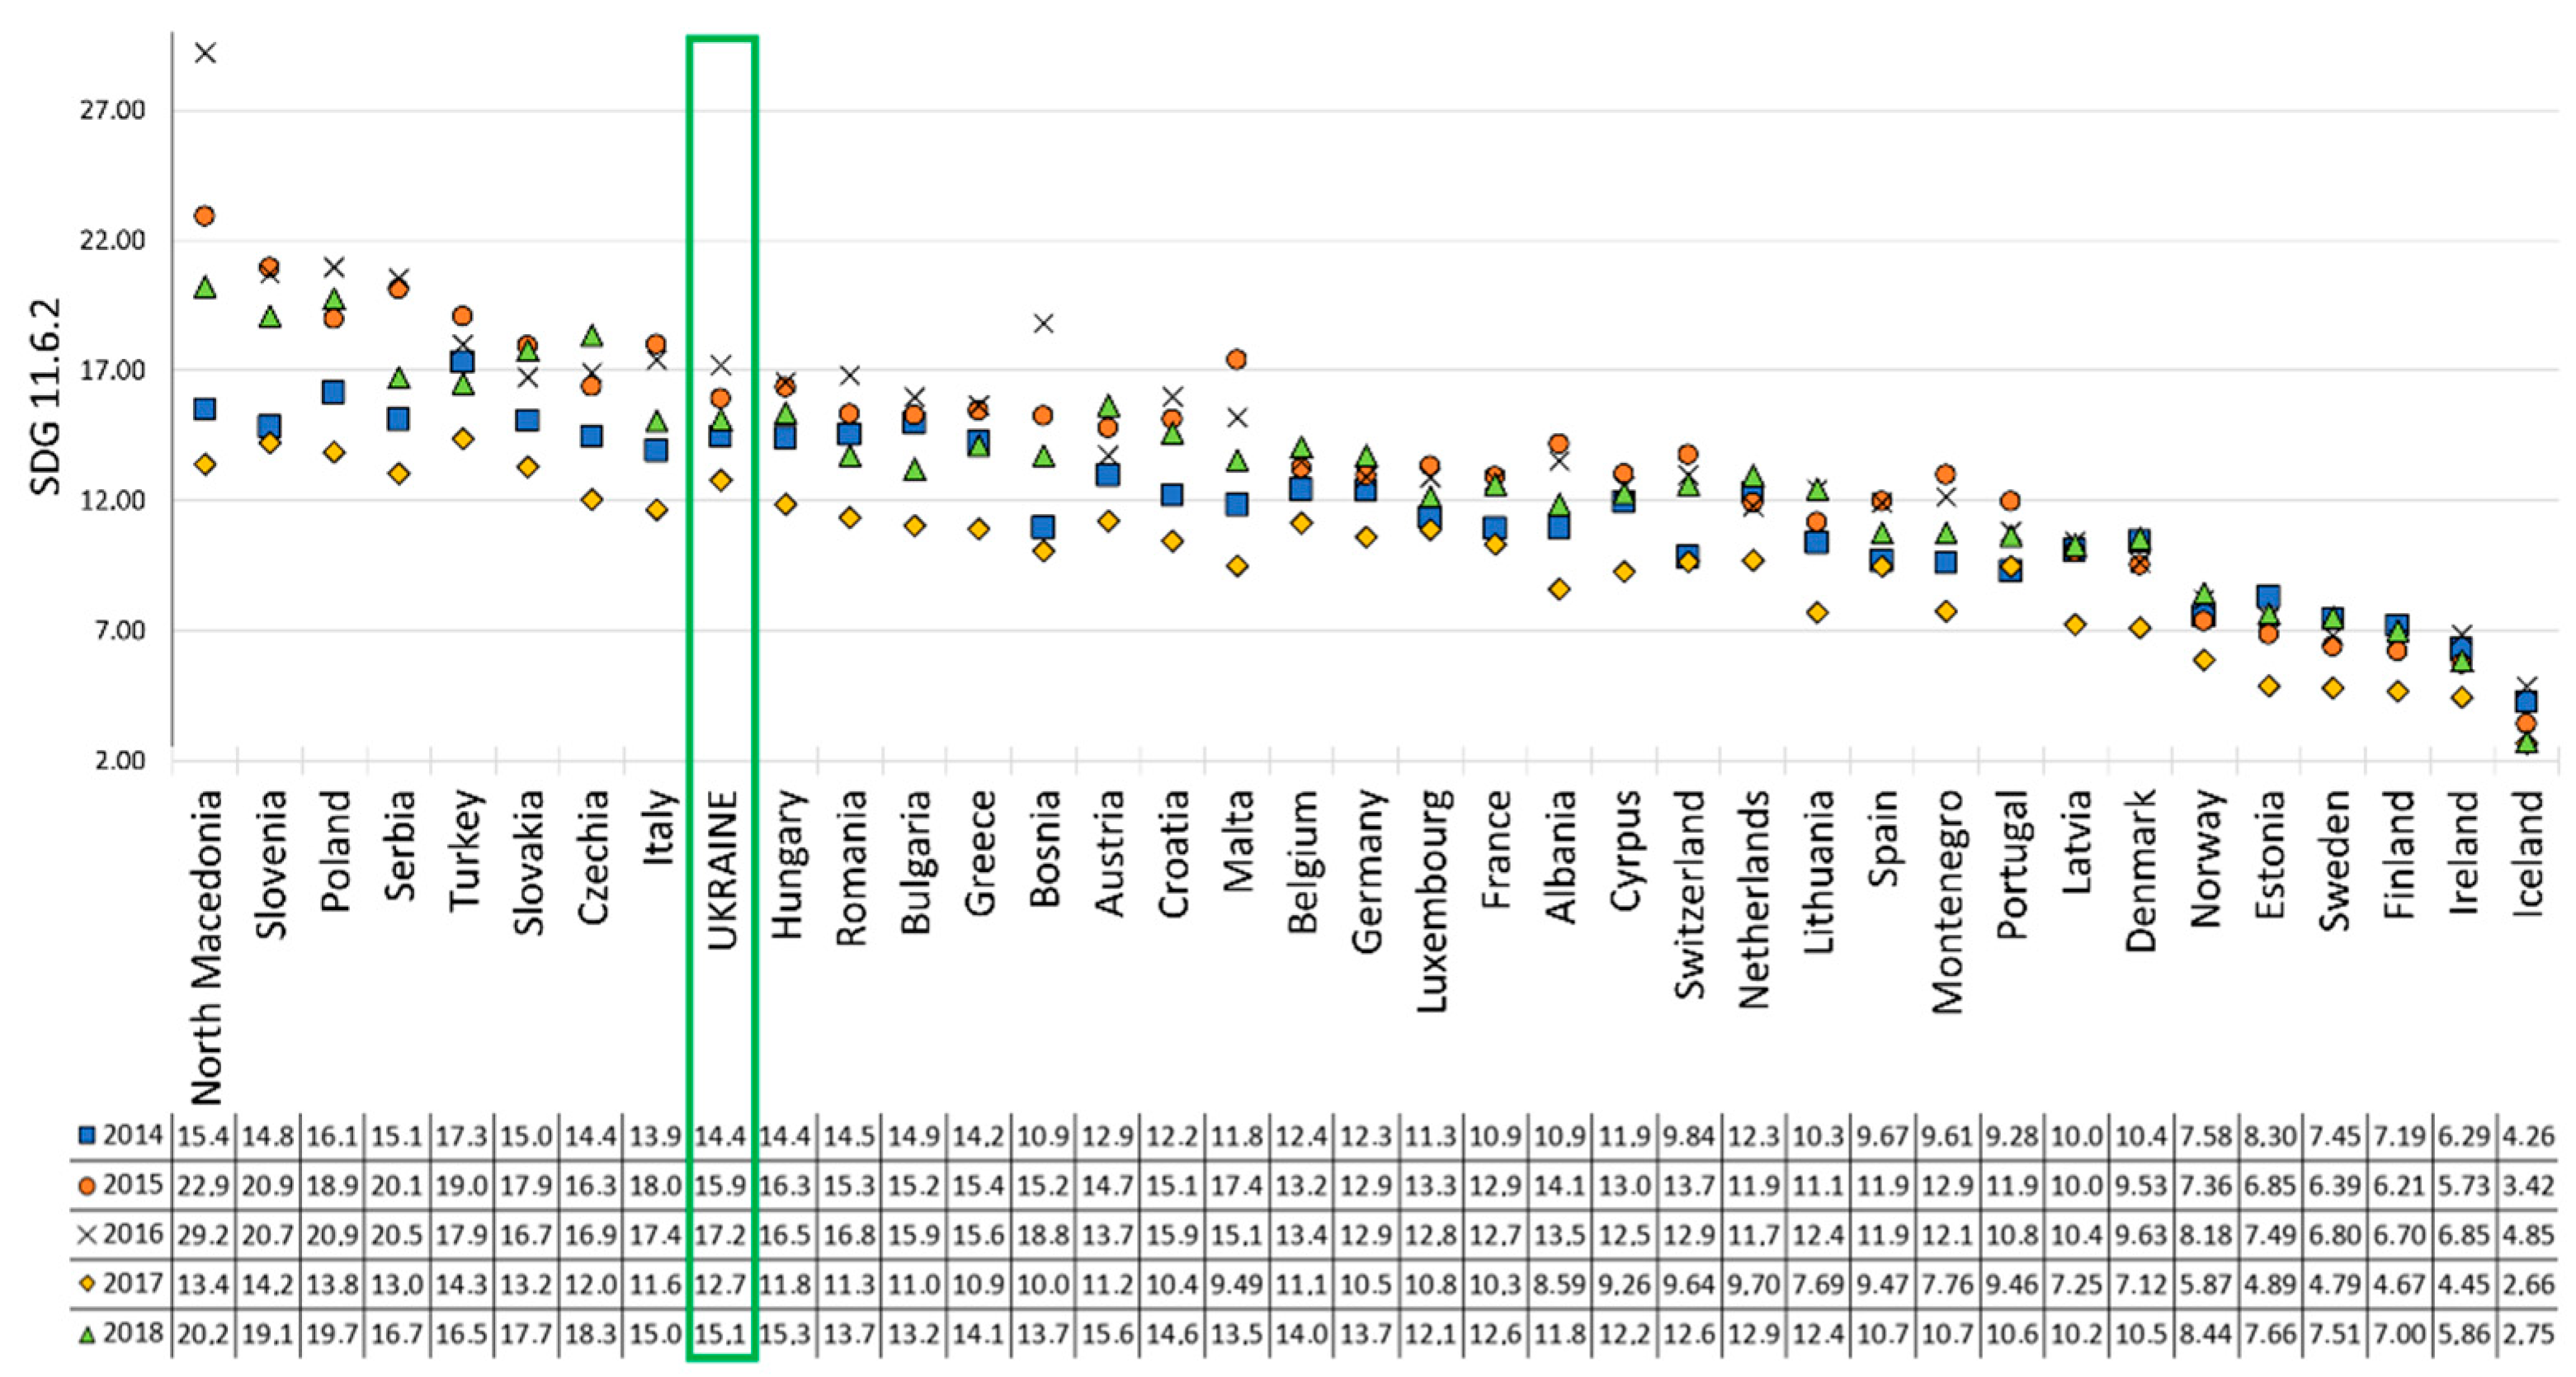
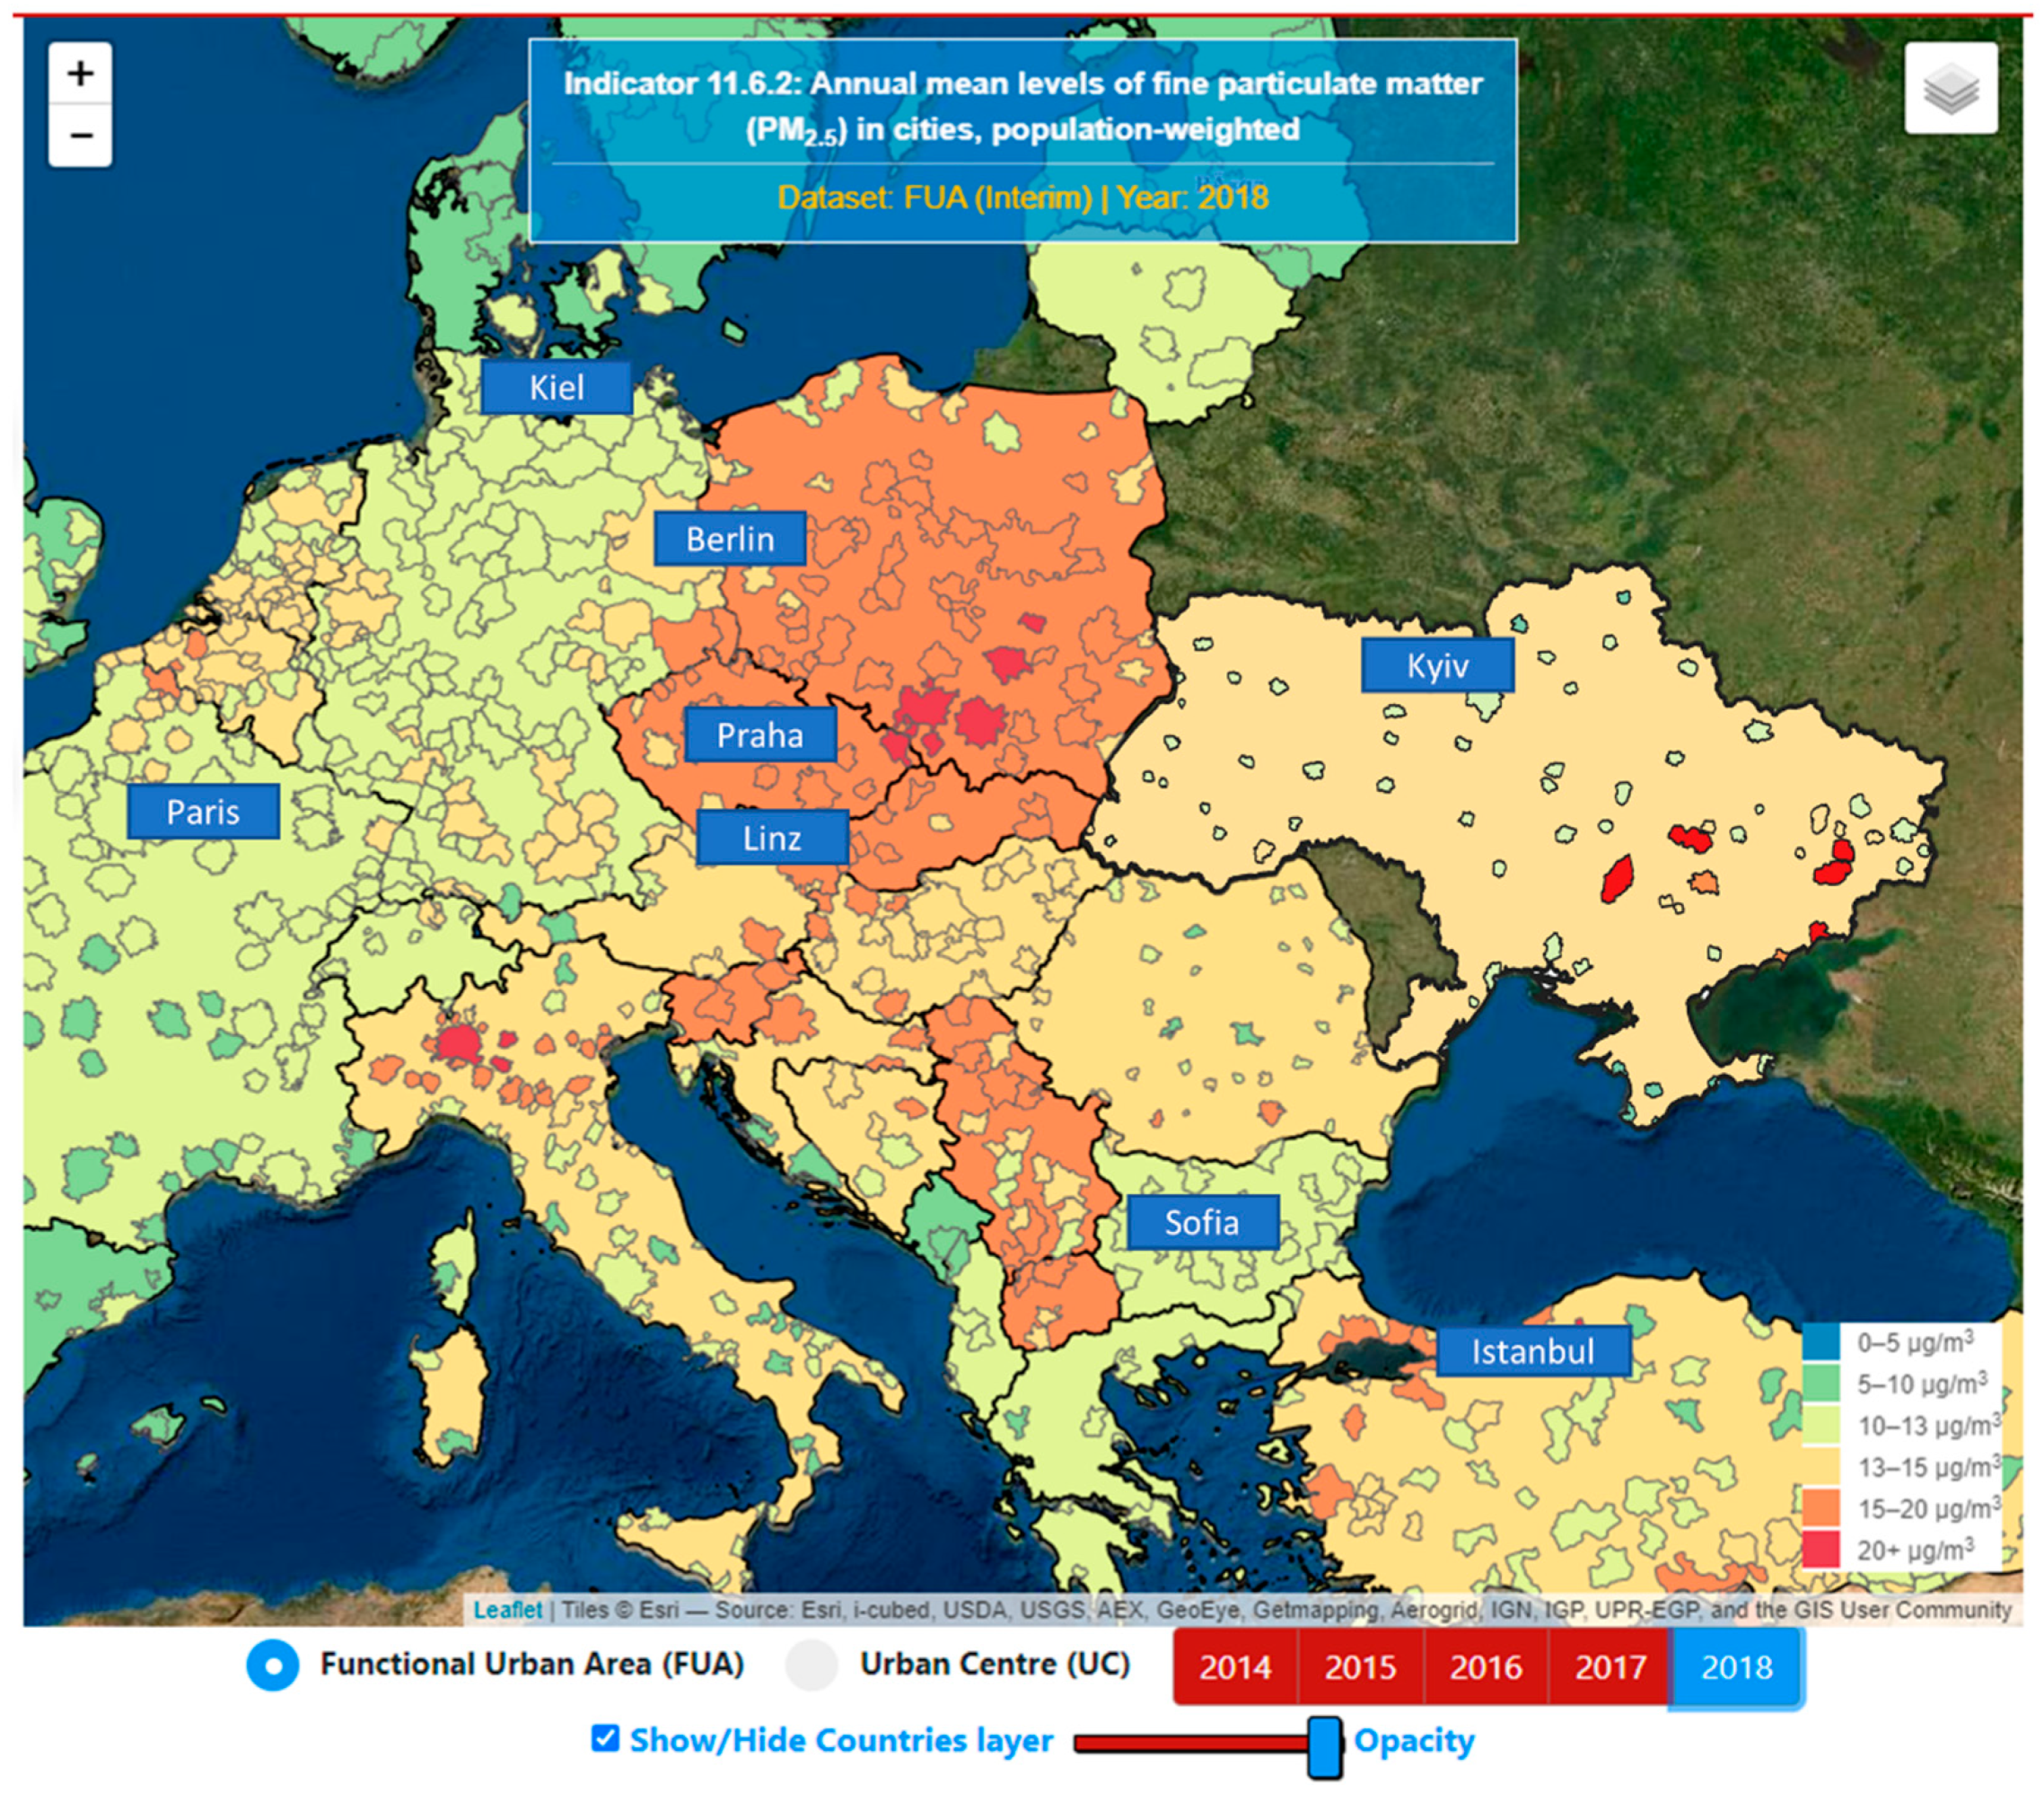
From a comparative analysis of all European countries, which also gave their values to the indicator 11.6.2, we can conclude that in 2017, all countries had better air quality than in all other years. Figure 15 and Figure 16 show the results of the evaluation of indicators 11.6.2 for Ukraine for the last 5 years in comparison with other European countries (for 2019 and 2020 years, there are no available data for this SDG indicator for Europe), which calculate this indicator centrally (for FUA and GUC). Figure 17 demonstrates the obtained indicators of 11.6.2 at the Ukraine level in comparison with other European countries in 2018.
It should be mentioned that the air quality monitoring product is based exclusively on open data sources.
Land cover maps have great potential for the analysis of urban areas, as they provide a reliable set of data that can be used for the planning and evaluation of various indicators of sustainable development, such as the indicator for achieving Sustainable Development Goal 11.6.2 and others.
5. Conclusions and Discussion
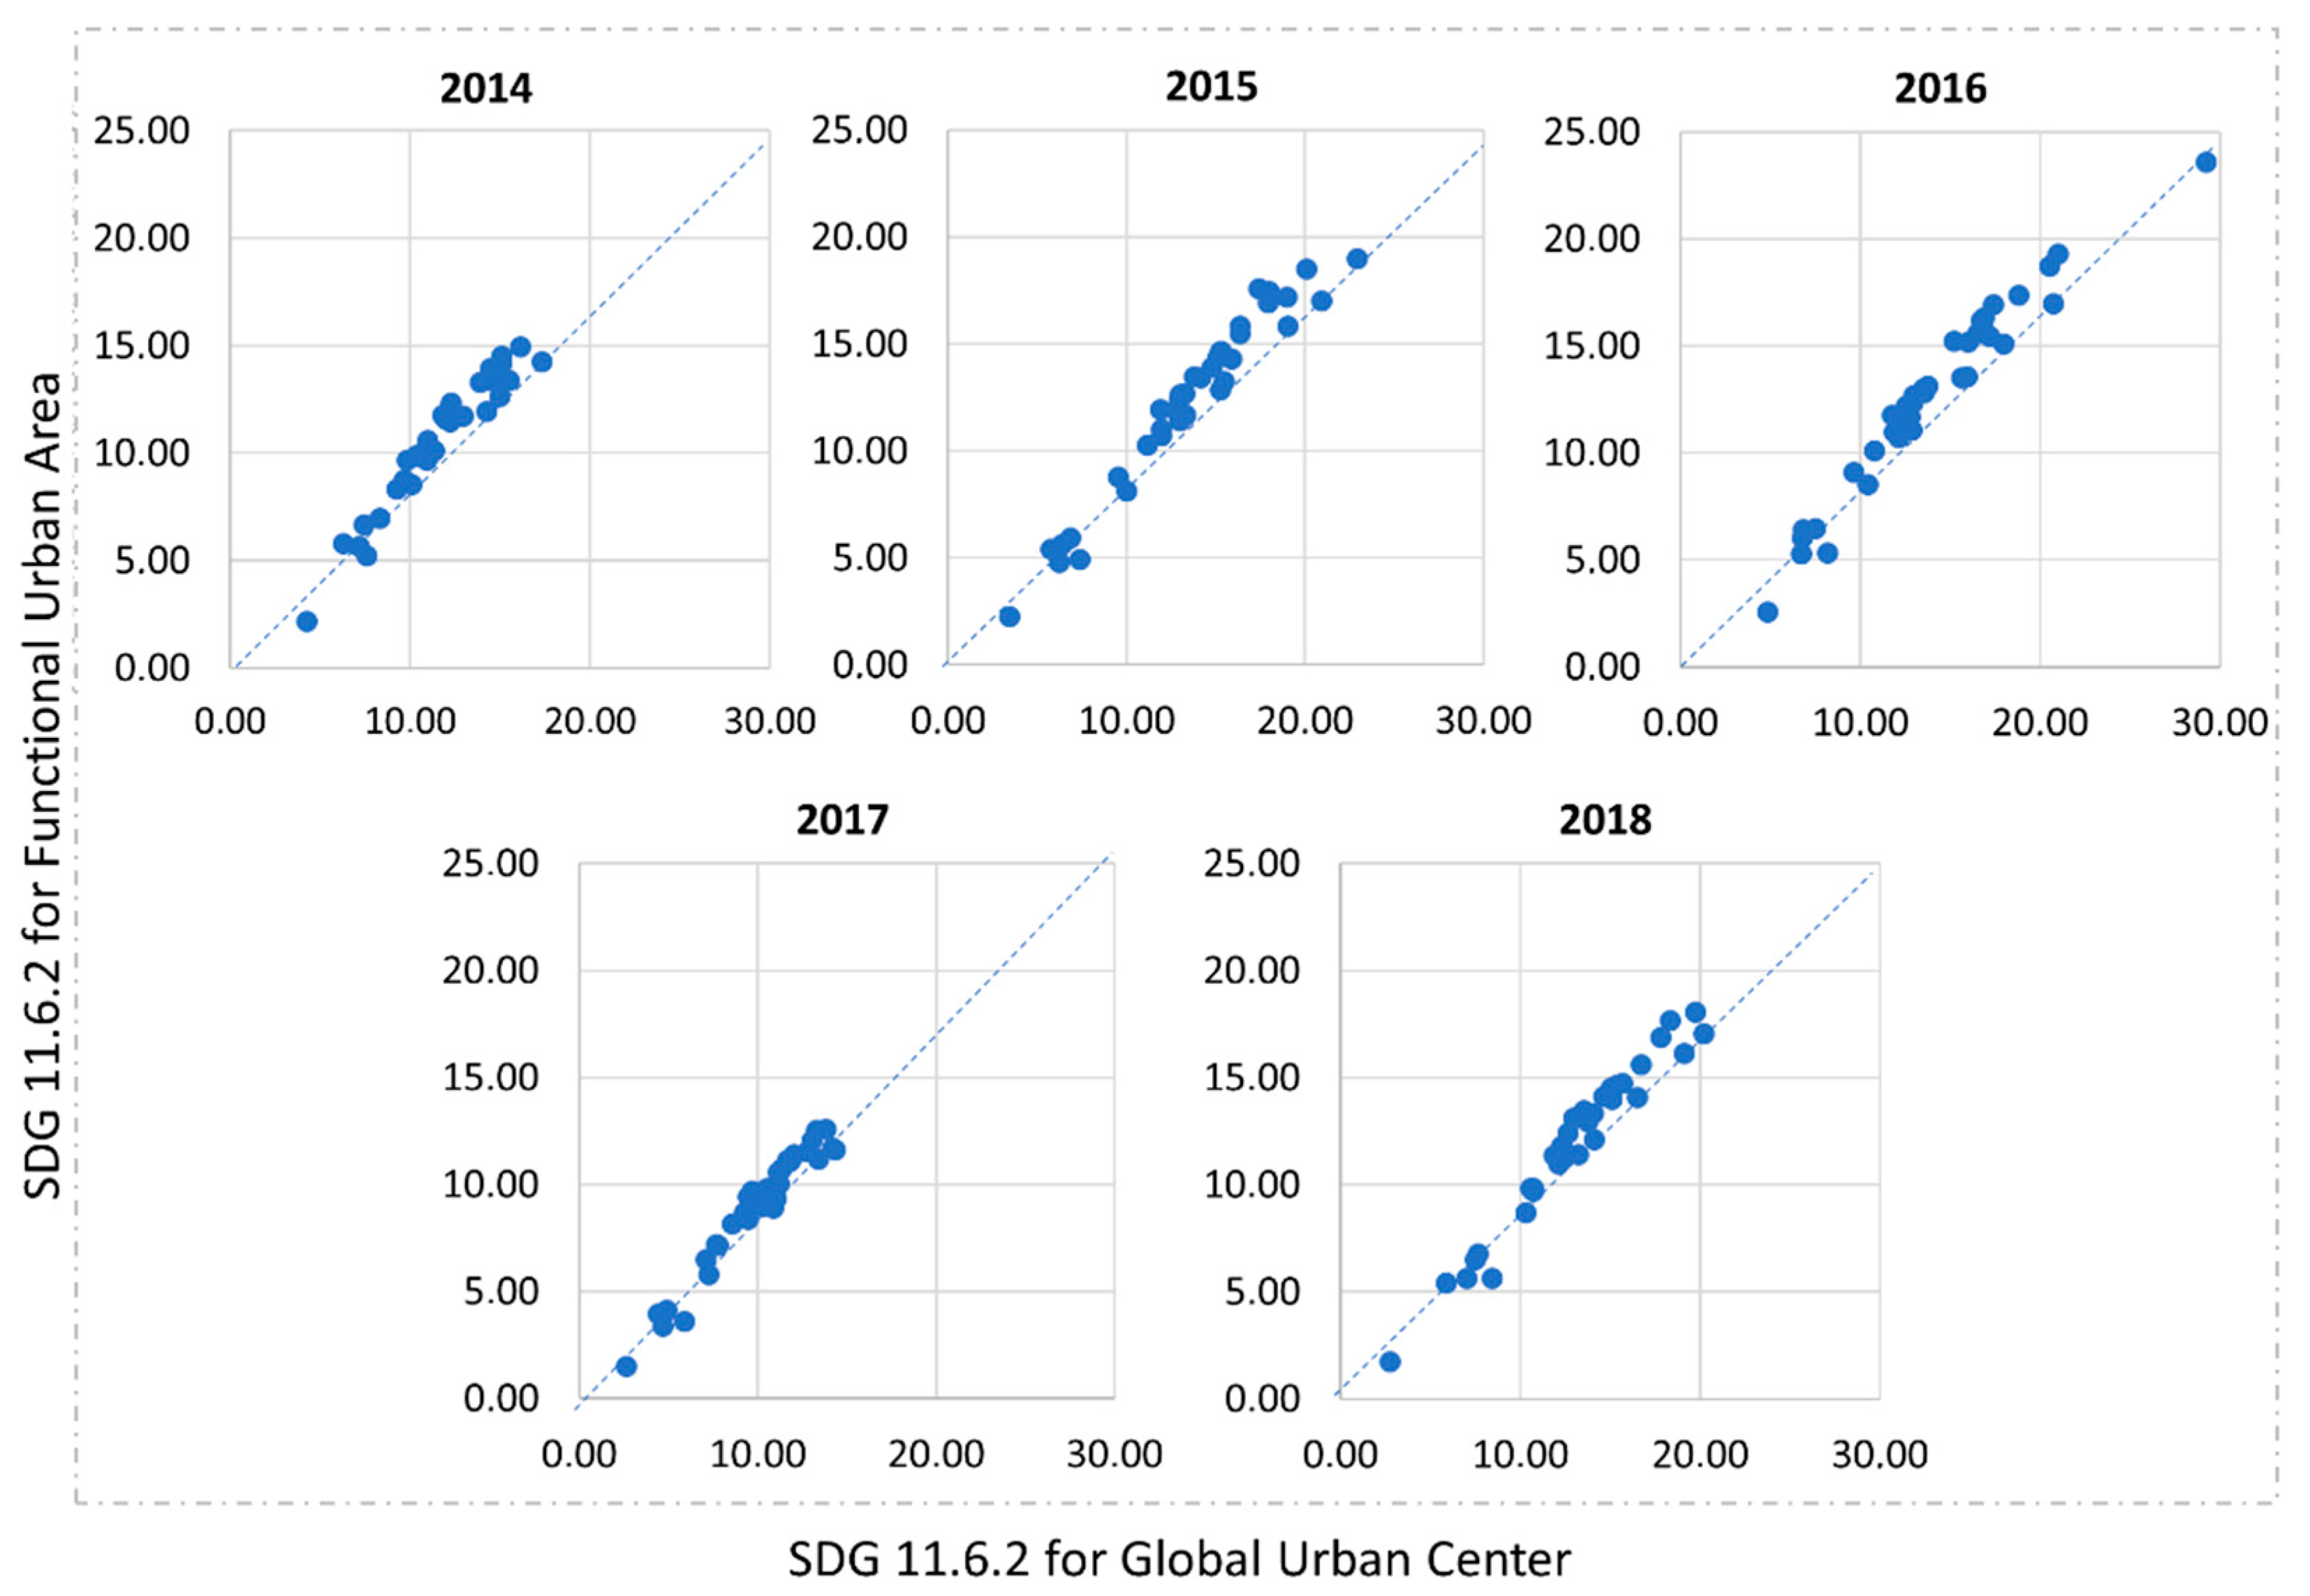
According to the obtained results, it is safe to say that cities have the greatest impact on air quality compared to suburban areas. This is shown in Figure 18, where, for European countries and for Ukraine, the value of the SDG 11.6.2 indicator for FUAs is lower than that for the GUCs. As a further step in the analysis, the authors propose using the land cover maps, which received their own algorithm for deep learning to classify the time series of satellite data [40,41] within the FUA. This will help to determine the contribution of cities and other types of land cover to air quality indicator assessment.
The considered air quality monitoring methodologies are just beginning to be adapted and used for the territory of Ukraine, in particular for Kyiv. The use of open access CAMS air quality model data is stable but requires increased spatial resolution because this product is too rough for cities. In addition, the ground-based monitoring system using air quality sensors is only beginning to grow in large cities but has not yet increased in other settlements and villages. This requires the development of technology that will allow the use of ground data for those cities where they exist and to build model values of air pollution based on satellite data in those cities where ground data are insufficient. Of course, a pre-important step is the validation of satellite data on the basis of ground data to understand the quality and accuracy of the data source.
To understand the meaning of the developed product in terms of air quality, it is compared with similar indicators for European cities. Unfortunately, for Ukraine, there is no modern database with the populations of different cities, which is an integral part of the assessment of the indicator of Sustainable Development Goal 11.6.2. Therefore, the global products of the Copernicus GHSL program and NASA are used, as in most EU countries. In addition to the PM2.5 data used in the UN and SMURBS methodologies for the assessment of indicator 11.6.2, in the future, all available data on air pollution (both ground and satellite) will be used.
The technology of indicator 11.6.2, “Annual mean levels of fine particulate matter (e.g., PM2.5 and PM10) in cities (population weighted)”, for the calculation for air quality assessment was adopted for the territory of Ukraine. The initial main workflow and relevant datasets were proposed by the United Nations and realized within the ERA-PLANET/SMURFS project for the territories of the European Union. During approach adaptation, all unavailable data for Ukraine were replaced by using other available datasets, in particular the population dataset from NASA and Copernicus. On the basis of the available data from in situ air quality estimation networks, these data were analyzed from an accuracy point of view and applicability. The obtained results are based on accuracy estimations for the available population data and satellite data, which can be used instead of inaccessible data on air quality.
As a further development, the authors plan to come to an agreement on the use of Meteosat satellite data [42], which will be a significant step towards the digitalization of air quality monitoring in Ukraine. We hope that the process of digitalization in Ukraine will provide great opportunities for access to additional sources of information that will allow the monitoring of air quality at the highest level.
Author Contributions
Conceptualization and methodology, A.S.; data curation, H.Y. and B.Y., validation, B.Y.; writing—original draft preparation, H.Y.; writing—review and editing, A.S. and N.K.; supervision, A.S. and N.K. All authors have read and agreed to the published version of the manuscript.
Funding
This research was funded by the National Research foundation of Ukraine within the project 2020.02/0284 «Geospatial models and information technologies of satellite monitoring of smart city problems», which won the competition “Leading and Young Scientists Research Support”.
Institutional Review Board Statement
Not applicable.
Informed Consent Statement
Not applicable.
Data Availability Statement
Not applicable.
Conflicts of Interest
The authors declare no conflict of interest.
References
- The SMURBS SDG Indicator 11.6.2 Earth Observation Platform. Available online: http://apcg.meteo.noa.gr/sdg1162/ (accessed on 4 October 2021).
- Air Quality Monitoring Map EcoCity. Available online: https://eco-city.org.ua/ (accessed on 4 October 2021).
- Air Pollution According to SaveDnipro. Available online: https://www.savednipro.org/about/ (accessed on 4 October 2021).
- Shelestov, A.; Yailymova, H.; Yailymov, B.; Samoilenko, O.; Volynskii, M.; Shumilo, L. Ground based validation of Copernicus atmosphere monitoring service data for Kyiv. In Proceedings of the IEEE EUROCON 2021—19th International Conference on Smart Technologies, Lviv, Ukraine, 6–8 July 2021; pp. 88–91. [Google Scholar]
- AQICN. Available online: https://aqicn.org/ (accessed on 4 October 2021).
- Sensor Community. Available online: https://sensor.community/ (accessed on 4 October 2021).
- Luftdaten Monitoring System. Available online: https://luftdaten.info/ (accessed on 4 October 2021).
- Airly. Available online: https://airly.eu/ (accessed on 4 October 2021).
- IQAIR. Available online: https://www.iqair.com/ (accessed on 4 October 2021).
- Heymann, Y. CORINE Land Cover: Technical Guide; Office for Official Publications of the European Communities: Luxembourg, 1994. [Google Scholar]
- Kosmidis, E.; Syropoulou, P.; Tekes, S.; Schneider, P.; Spyromitros-Xioufis, E.; Riga, M.; Charitidis, P.; Moumtzidou, A.; Papadopoulos, S.; Vrochidis, S.; et al. hackAIR: Towards raising awareness about air quality in Europe by developing a collective online platform. ISPRS Int. J. Geo-Inf. 2018, 7, 187. [Google Scholar] [CrossRef] [Green Version]
- Sarigiannis, D.A.; Soulakellis, N.; Schäfer, K.; Tombrou, M.; Sifakis, N.I.; Assimakopoulos, D.; Lointier, M.; Dantou, A.; Saisana, M. ICAROS: An integrated computational environment for the assimilation of environmental data and models for urban and regional air quality. Water Air Soil Pollut. Focus 2002, 2, 641–654. [Google Scholar] [CrossRef]
- Vohra, K.; Marais, E.A.; Suckra, S.; Kramer, L.; Bloss, W.J.; Sahu, R.; Gaur, A.; Tripathi, S.N.; Van Damm, M.; Clarisse, L.; et al. Long-term trends in air quality in major cities in the UK and India: A view from space. Atmos. Chem. Phys. 2021, 21, 6275–6296. [Google Scholar] [CrossRef]
- Ma, G.; Hofmann, E.T. Population, immigration, and air quality in the USA: A spatial panel study. Popul. Environ. 2019, 40, 283–302. [Google Scholar] [CrossRef]
- SMURBS. Available online: https://smurbs.eu/the-project/ (accessed on 4 October 2021).
- Shelestov, A.; Kolotii, A.; Borisova, T.; Turos, O.; Milinevsky, G.; Gomilko, I.; Bulanay, T.; Fedorov, O.; Shumilo, L.; Pidgorodetska, L.; et al. Essential variables for air quality estimation. Int. J. Digit. Earth 2019, 13, 278–298. [Google Scholar] [CrossRef]
- Shelestov, A.; Kolotii, A.; Lavreniuk, M.; Yailymov, B.; Shumilo, L.; Korsunska, Y. Smart city services for kiev city within ERA-PLANET SMURBS project. In Proceedings of the 2019 IEEE 39th International Conference on Electronics and Nanotechnology, Kyiv, Ukraine, 16–18 April 2019; pp. 784–788. [Google Scholar]
- Copernicus Atmospheric Monitoring Service. Available online: https://www.regional.atmosphere.copernicus.eu/ (accessed on 4 October 2021).
- Report Ambient Air Pollution: A Global Assessment of Exposure and Burden of Disease; World Health Organization: Geneva, Switzerland, 2016; Available online: https://www.who.int/phe/publications/air-pollution-global-assessment/en/ (accessed on 4 October 2021).
- Air Pollution in Ukraine. Available online: https://www.saveecobot.com/ (accessed on 4 October 2021).
- Air Pollution in Europe: Real-Time Air Quality Index Visual Map. Available online: https://aqicn.org/map/europe/ (accessed on 4 October 2021).
- LUN City Air Stations. Available online: https://misto.lun.ua/air (accessed on 4 October 2021).
- Air Quality Sensor Performance Evaluation Center. Available online: https://www.aqmd.gov/aq-spec/sensors (accessed on 4 October 2021).
- Air Quality Transmitter AQT420. Available online: https://www.vaisala.com/en/products/weather-environmental-sensors/air-quality-transmitter-aqt420 (accessed on 4 October 2021).
- Register of Approved Types of Measuring Instruments. Available online: https://legalzvt.kiev.ua/ (accessed on 4 October 2021).
- Data on Air Pollution in Kyiv from the Borys Sreznevsky Central Geophysical Observatory. Available online: http://cgo-sreznevskyi.kyiv.ua/index.php?fn=lsza&f=lsza (accessed on 4 October 2021).
- Dijkstra, L.; Poelman, H.; Veneri, P. The EU-OECD Definition of a Functional Urban Area; OECD iLibrary OECD Publishing: Paris, France, 2019. [Google Scholar]
- Global Urban Centers. Available online: https://ghsl.jrc.ec.europa.eu/download.php?ds=smod (accessed on 4 October 2021).
- The Humanitarian Data Exchange—Ukraine—Subnational Administrative Divisions. Available online: https://data.humdata.org/dataset/ukraine-administrative-boundaries-as-of-q2-2017 (accessed on 4 October 2021).
- Wastes Generation in 2018, by Region. Available online: http://www.ukrstat.gov.ua/operativ/operativ2018/ns/uv/uv_2018_u.htm (accessed on 4 October 2021).
- Emissions of Pollutants and Greenhouse Gases into the Atmosphere from Stationary Sources of Pollution. Available online: http://www.ukrstat.gov.ua/operativ/operativ2018/ns/vzap/arch_vzrap_u.htm (accessed on 4 October 2021).
- Global Human Settlement Layer. Available online: https://ghsl.jrc.ec.europa.eu/ (accessed on 4 October 2021).
- NASA Population Density. Available online: https://neo.sci.gsfc.nasa.gov/view.php?datasetId=SEDAC_POP (accessed on 4 October 2021).
- Kussul, N.; Yailymova, H.; Drozd, S.; Shelestov, A. Validation of the global human settlement layer and NASA population data for Ukraine. In Proceedings of the 11th IEEE International Conference on Intelligent Data Acquisition and Advanced Computing Systems: Technology and Applications, Cracow, Poland, 22–25 September 2021. [Google Scholar]
- Validation Report of the CAMS Near-Real Time Global Atmospheric Composition Service. Available online: https://atmosphere.copernicus.eu/sites/default/files/2021-01/23_CAMS84_2018SC2_D1.1.1_JJA2020.pdf (accessed on 4 October 2021).
- Shumilo, L.; Yailymov, B.; Shelestov, A. Active fire monitoring service for Ukraine based on satellite data. In Proceedings of the IGARSS 2020—2020 IEEE International Geoscience and Remote Sensing Symposium, Waikoloa, HI, USA, 26 September–2 October 2020; pp. 2913–2916. [Google Scholar]
- Kwak, S.K.; Kim, J.H. Statistical data preparation: Management of missing values and outliers. Korean J. Anesthesiol. 2017, 70, 407–411. [Google Scholar] [CrossRef] [PubMed]
- The Current Population of Ukraine. Available online: https://ukrstat.org/uk/druk/publicat/Arhiv_u/13/Arch_nnas_zb.htm (accessed on 4 October 2021).
- Population for Districts of Kyiv. Available online: http://www.kiev.ukrstat.gov.ua/p.php3?c=1123%26lang=1 (accessed on 4 October 2021).
- Shelestov, A.; Lavreniuk, M.; Vasiliev, V.; Shumilo, L.; Kolotii, A.; Yailymov, B.; Kussul, N.; Yailymova, H. Cloud approach to automated crop classification using Sentinel-1 imagery. IEEE Trans. Big Data 2019, 6, 572–582. [Google Scholar] [CrossRef]
- Kussul, N.; Lavreniuk, M.; Skakun, S.; Shelestov, A. Deep learning classification of land cover and crop types using remote sensing data. IEEE Geosci. Remote Sens. Lett. 2017, 14, 778–782. [Google Scholar] [CrossRef]
- Meteosat Series. Available online: https://www.eumetsat.int/our-satellites/meteosat-series (accessed on 4 October 2021).
Figure 1.
Air pollution in Europe: Real-Time Air Quality Index Visual Map (30 October 2021) [21].
Figure 1.
Air pollution in Europe: Real-Time Air Quality Index Visual Map (30 October 2021) [21].

Figure 2.
Distribution of the number of ground stations in Ukraine by sensor providers.

Figure 3.
Cities of Ukraine for which functional urban areas were created.

Figure 4.
Urban center, city, commuting zone, and functional urban area for Kyiv, Ukraine.

Figure 5.
Annual CAMS PM2.5 values, 2018.

Figure 6.
Statistical waste generation in Ukraine, 2018.

Figure 7.
Statistical emissions of pollutants into the atmosphere from stationary sources of pollution, 2018.
Figure 7.
Statistical emissions of pollutants into the atmosphere from stationary sources of pollution, 2018.

Figure 8.
Estimated population according to GHSL within FUA, 2015.

Figure 9.
On the left—the concentration of PM2.5 for the territory of Ukraine for 18 April 2020; on the right—coverage of the study area according to ground station and CAMS data.
Figure 9.
On the left—the concentration of PM2.5 for the territory of Ukraine for 18 April 2020; on the right—coverage of the study area according to ground station and CAMS data.

Figure 10.
Correlation coefficient, root mean squared error, and R-squared coefficient for each point of measurement in Kyiv compared to CAMS data.
Figure 10.
Correlation coefficient, root mean squared error, and R-squared coefficient for each point of measurement in Kyiv compared to CAMS data.

Figure 11.
Comparison of daily ground data and CAMS data for 2019 (blue) and 2020 (orange). (a) comparison of “raw” data from ground stations with CAMS data (b) comparison of data from ground stations with CAMS data after elimination of anomalous values.
Figure 11.
Comparison of daily ground data and CAMS data for 2019 (blue) and 2020 (orange). (a) comparison of “raw” data from ground stations with CAMS data (b) comparison of data from ground stations with CAMS data after elimination of anomalous values.

Figure 12.
Comparison of ground data (green), average ground data within one CAMS cell (blue) and CAMS data (red) for different ground stations.
Figure 12.
Comparison of ground data (green), average ground data within one CAMS cell (blue) and CAMS data (red) for different ground stations.

Figure 13.
Validation of satellite population data for the largest cities of Ukraine (a) and districts of Kyiv (b).
Figure 13.
Validation of satellite population data for the largest cities of Ukraine (a) and districts of Kyiv (b).

Figure 14.
SDG 11.6.2 for Ukraine from 2014 to 2020.

Figure 15.
Comparison of the calculated indicator 11.6.2 for Ukraine with the corresponding values for European countries for functional urban areas from 2014 to 2018.
Figure 15.
Comparison of the calculated indicator 11.6.2 for Ukraine with the corresponding values for European countries for functional urban areas from 2014 to 2018.

Figure 16.
Comparison of the calculated indicator 11.6.2 for Ukraine with the corresponding values for European countries for global urban centers from 2014 to 2018.
Figure 16.
Comparison of the calculated indicator 11.6.2 for Ukraine with the corresponding values for European countries for global urban centers from 2014 to 2018.

Figure 17.
Comparison of the calculated indicator 11.6.2 for Ukraine with the corresponding values for European countries for functional urban areas and global urban centers from 2014 to 2018.
Figure 17.
Comparison of the calculated indicator 11.6.2 for Ukraine with the corresponding values for European countries for functional urban areas and global urban centers from 2014 to 2018.

Figure 18.
The SDG indicator 11.6.2 for functional urban area and for global urban center comparison for different countries.
Figure 18.
The SDG indicator 11.6.2 for functional urban area and for global urban center comparison for different countries.


Table 1.
Pearson’s correlation coefficient for different population data providers.
| Population Data Provider | 20 Largest Cities | Districts of Kyiv | ||
|---|---|---|---|---|
| 2015 | 2020 | 2015 | 2020 | |
| GHSL | 0.995 | N/A | 0.776 | N/A |
| NASA | 0.963 | 0.963 | 0.529 | 0.523 |
Publisher’s Note: MDPI stays neutral with regard to jurisdictional claims in published maps and institutional affiliations. |
© 2021 by the authors. Licensee MDPI, Basel, Switzerland. This article is an open access article distributed under the terms and conditions of the Creative Commons Attribution (CC BY) license (https://creativecommons.org/licenses/by/4.0/).
Share and Cite
MDPI and ACS Style
Shelestov, A.; Yailymova, H.; Yailymov, B.; Kussul, N. Air Quality Estimation in Ukraine Using SDG 11.6.2 Indicator Assessment. Remote Sens. 2021, 13, 4769. https://doi.org/10.3390/rs13234769
AMA Style
Shelestov A, Yailymova H, Yailymov B, Kussul N. Air Quality Estimation in Ukraine Using SDG 11.6.2 Indicator Assessment. Remote Sensing. 2021; 13(23):4769. https://doi.org/10.3390/rs13234769
Chicago/Turabian StyleShelestov, Andrii, Hanna Yailymova, Bohdan Yailymov, and Nataliia Kussul. 2021. "Air Quality Estimation in Ukraine Using SDG 11.6.2 Indicator Assessment" Remote Sensing 13, no. 23: 4769. https://doi.org/10.3390/rs13234769
Note that from the first issue of 2016, this journal uses article numbers instead of page numbers. See further details here.