
Impacts of the Kuroshio and Tidal Currents on the Hydrological Characteristics of Yilan Bay, Northeastern Taiwan


1
Center for Space and Remote Sensing Research, National Central University, Taoyuan 320317, Taiwan
2
Department of Marine Environment Informatics, National Taiwan Ocean University, Keelung 202301, Taiwan
*
Author to whom correspondence should be addressed.
Remote Sens. 2021, 13(21), 4340; https://doi.org/10.3390/rs13214340
Submission received: 14 September 2021
/
Revised: 23 October 2021
/
Accepted: 24 October 2021
/
Published: 28 October 2021
(This article belongs to the Special Issue Diurnal to Decadal Observation of the Ocean with Geostationary Satellite Sensors)
Abstract
:Yilan Bay is in the northeast corner of Taiwan at the junction of the East China Sea (ECS) and the Pacific Ocean. This study clarified the composition of water masses adjacent to Yilan Bay. The upper seawater in the bay is characterized by Kuroshio surface water, Taiwan warm current water, and shelf mixed water masses. The flow field in this area is mainly determined by the inter-actions among the northeastern Taiwan countercurrent, Kuroshio Current (KC), and tidal currents. The fall season is the main rainfall period in Yilan Bay, which causes a large amount of river runoff and a further increase in chlorophyll concentration, and the salinity of the upper water layer is observed much lower than other seasons. Water with a high chlorophyll concentration can flow into the ECS with ebb currents and the KC with ebb and flood currents. Combining hourly geosynchronous ocean color imager data and numerical simulation flow field helps us understand short-term changes of chlorophyll concentration. The trajectories of the drifters and virtual particle simulations help us understand the sources and movement of ocean currents in Yilan Bay. The seasonal swing of the KC path outside the bay is an important factor affecting the flow field and hydrological characteristics.
1. Introduction
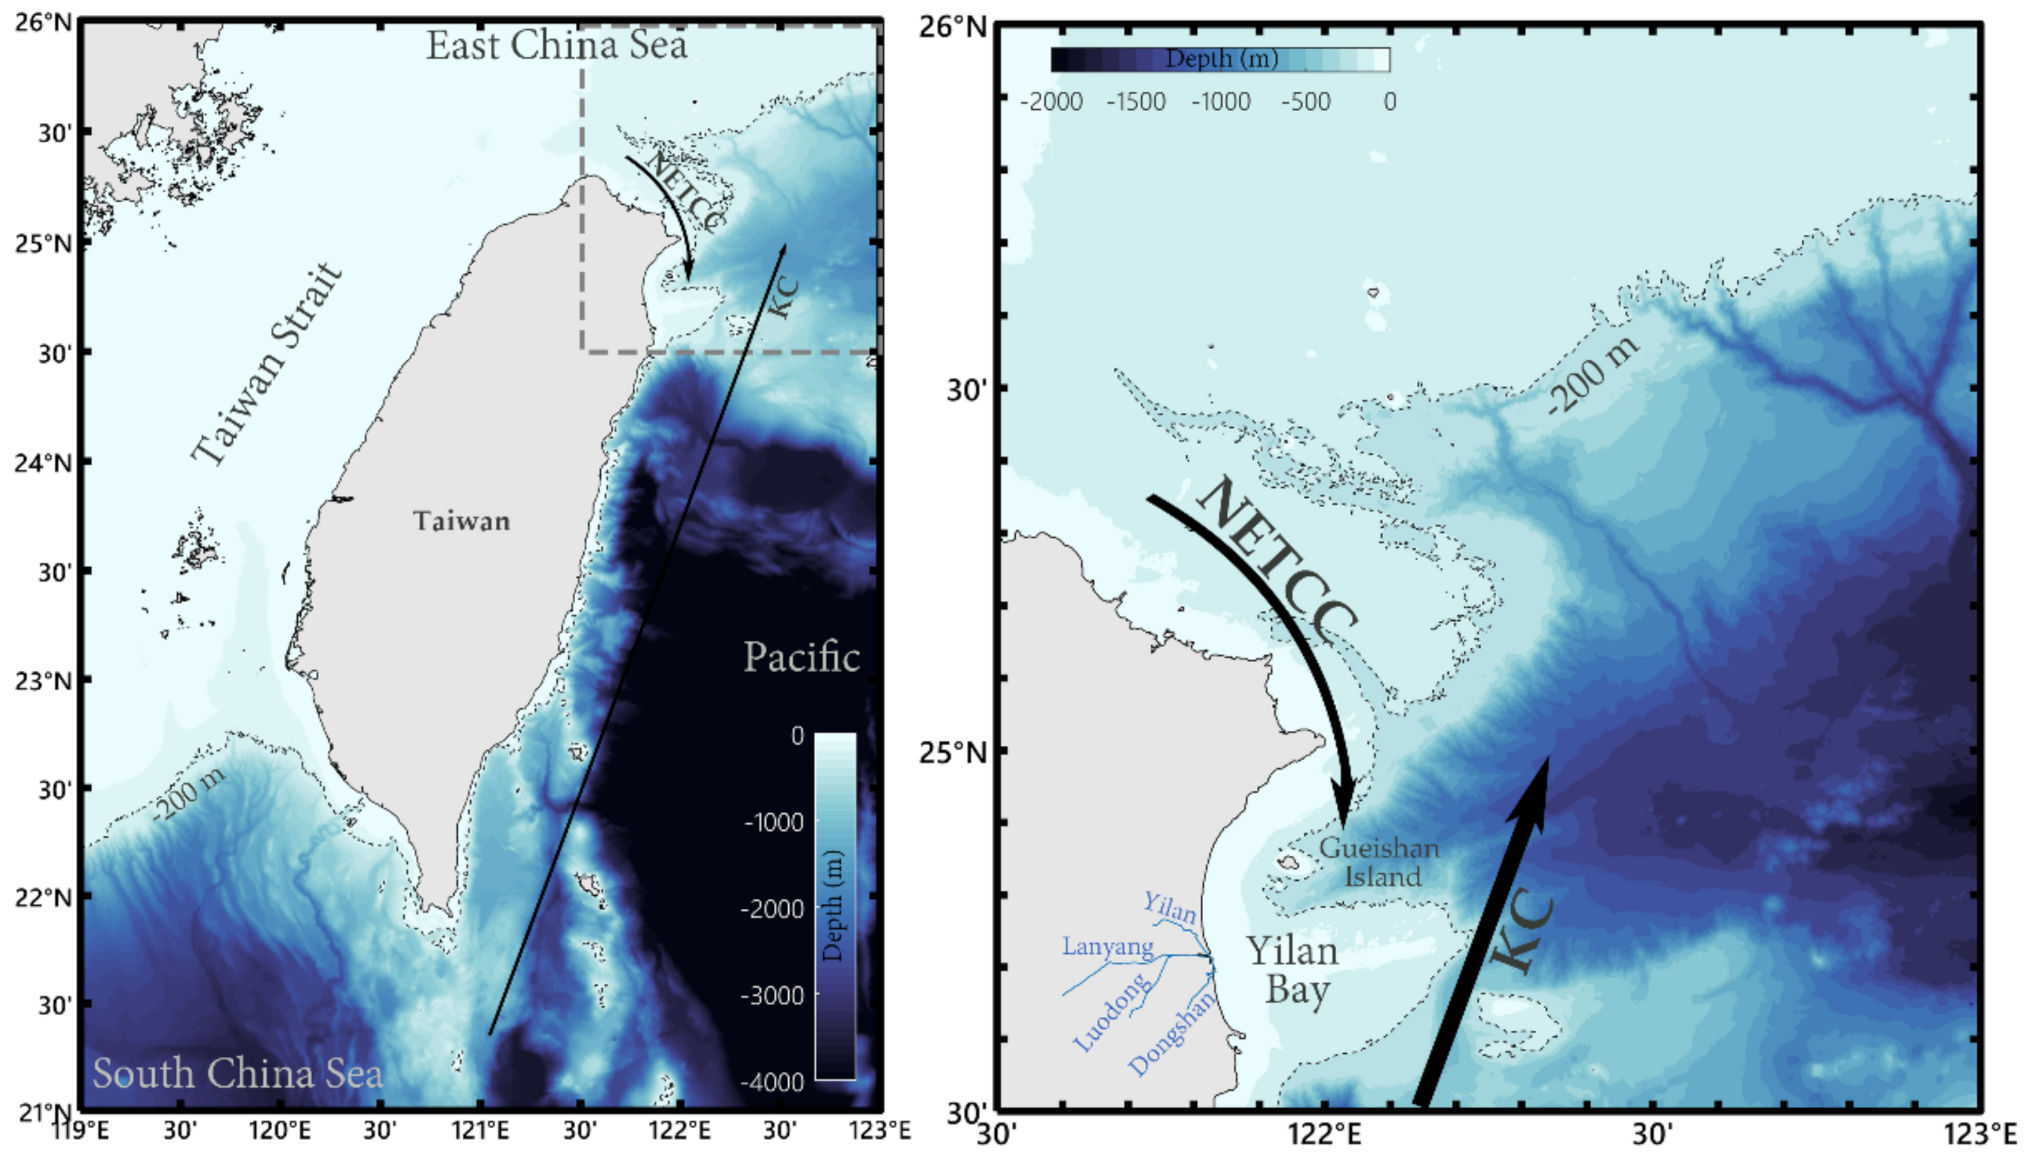
Yilan Bay, located in northeastern Taiwan, is affected by the interaction of the Kuroshio Current (KC), coastal current, tidal current and surface runoff (Figure 1). The Lanyang River discharges into the bay and is the only river in northeastern Taiwan, gathering runoff from the Yilan River, Luodong River, and Dongshan river. The diluted water and high concentration of chlorophyll brought by the river have considerable impacts on the marine biogeochemical cycle in the KC region and southern East China Sea (ECS). A volcanic island, Guishan Island, is in the bay; there are hydrothermal vents near the island [1,2], which discharge hydrothermal fluid containing sulfur particles [3], cause carbonate chemical changes in shallow water areas [4,5,6], and affect the habitat of crabs [7], shrimps [8], and fish [9]. In addition, the flow field in the bay also affect the pathways of eels [10,11].
Due to the rich marine biodiversity in this area, researchers in recent years have begun to pay attention to ocean physical phenomena and dynamic processes. Systematic ocean current measurements in the waters adjacent to Yilan Bay were carried out during the world ocean circulation experiment from 1994–1996 [12,13], which mainly measured the discharge of the KC in the southern part of the bay. Then, the tidal pattern in the waters adjacent to Yilan Bay was determined to be a mixed semidiurnal tide [14]. Through high-frequency radar measurements, a current that flows in the opposite direction to the KC was discovered in northeastern Taiwan [15]; it was recently confirmed by satellite observations [16] and is called the northeastern Taiwan countercurrent (NETCC). The NETCC has subsequently been measured by researchers using in situ observation instruments [17,18]. There are two main sources and dynamic mechanisms of the NETCC: counterclockwise flow in the cold dome off northeastern Taiwan and southward invasion of the coastal current in northern Taiwan. The flow field in Yilan Bay is also affected by the meandering and seasonal deviations of the KC [19,20].
Analyzing the tidal current and chlorophyll concentration variations can not only help in understanding the flow field at hourly temporal resolution but can also be of great value to investigate the dynamic characteristics of the flow field on the hydrological characteristics over a short time. In another important bay at the southern tip of Taiwan, researchers have discovered that counterclockwise eddies are generated by the influence of seabed topography and capes during tidal currents, and upwelling cold water is helpful to slow coral bleaching [21]. In addition, tidal currents transfer high concentrations of chlorophyll outside the estuary into the ocean current; thus, the chlorophyll concentration in coastal areas changes greatly over a few minutes to hours [22]. Rainfall will increase the flow of rivers, and runoff will be discharged into the water to form a river plume protruding toward the sea. In northwestern Taiwan, researchers have found that ocean currents transmit water with low salinity and high chlorophyll concentrations to the ECS [23]. Figure 2 shows an example of SPOT-6 images and geosynchronous ocean color imager (GOCI) chlorophyll concentrations in Yilan Bay. The images clearly show that the river plume produced by river runoff carries high concentrations of chlorophyll and other substances along with the flow field. Figure 2c,f shows that high river flow (169.76 cms) causes the chlorophyll concentration to extend to the boundary between Yilan Bay and the KC, forming an important chlorophyll front, which continues to extend to the ECS. Currently, researchers still do not understand the impacts of tidal movement, river runoff, coastal mixing, and the KC path in Yilan Bay. Therefore, we combined a variety of observational data to explore the influence of the KC and tidal currents on the hydrological characteristics of Yilan Bay in this study. The data include SPOT satellite images, sea surface temperature (SST) from AQUA and TERRA satellite, GOCI chlorophyll concentrations, Lagrangian drifter, historical hydrological observation data, river streamflow, and meteorological stations. Four scientific objectives are clarified and discussed: (1) temporal and spatial distributions of chlorophyll concentration; (2) effects of rainfall and river runoff on chlorophyll concentration; (3) tidal current and virtual particle drift paths adjacent to the bay; and (4) characteristics of water masses in the bay. The results of this study in physical oceanography are helpful to clarify the source of the water mass in the southern ECS and the interaction between the KC and the nearshore region and to understand the background flow field of marine chemical transfer and marine species distribution in the bay and Guishan Island in terms of biogeochemical cycles.
2. Data
2.1. Sea Surface Temperature and Chlorophyll Concentration
Day and night spatially gridded (4 km) skin SST products from the Moderate-resolution Imaging Spectroradiometer (MODIS) onboard the Aqua and Terra satellite were used in this study. The level-3 thermal infrared monthly data were obtained from the physical oceanography distributed active archive center, National Aeronautics and Space Administration (NASA). The level-2 GOCI chlorophyll concentrations in sea water based on the O’Reilly band ratio OC3 algorithm [24] with 500 m spatial resolution and hourly temporal resolution were obtained from the NASA ocean color web. The observation time in Yilan Bay was 0:00–7:00 (UTC), and the local time was 8:00–15:00 (UTC + 8). Herein, the SST and chlorophyll concentration data from April 2011 to December 2020 were selected.
2.2. In Situ Observations
2.2.1. River Runoff
The hourly streamflow data of Lanyang River was measured by the equipment setup at Lanyang bridge (121.772°E, 24.716°N) by the Water Resources Agency (WRA), Ministry of Economic Affairs, Taiwan. Streamflow refers to the volume of water flow passing through a section of a river per unit of time. The water level data are converted into streamflow data by establishing a relationship between the water level and stream flow rate.
2.2.2. Tidal Station
The 6-min tidal gauge data from the Wushi tidal station (121.8375°E, 24.8672°N) were observed by Aquatrak’s liquid-level sensor established by the Marine Disaster Prevention Information System of Taiwan, Central Weather Bureau (CWB). Tides are measured in centimeters from the instrument reference level of a tidal station.
2.2.3. Meteorological Station
The hourly rainfall data observed from three meteorological stations (Yilan, Sansing, and Wujie) were obtained from the observation data inquire System operated by the CWB. Precipitation, which is usually expressed in millimeters, refers to the accumulated water level height of liquid or solid precipitation falling from clouds to the horizontal ground at an observation instrument within a fixed time.
2.2.4. Historical Hydrological Observations
The temperature and salinity data in the seas surrounding Taiwan (117°E–125°E, 18°N–27°N) with a 1/4° grid from the year of 1985–2020 were observed by a conductivity-temperature-depth profiler and obtained from the Ocean Data Bank (ODB) of the Ministry of Science and Technology, Taiwan. The temperature sensor measured the seawater temperature, and the conductivity sensor measured the conductivity and converted it into a further calculated salinity value. Data quality control referred to the global temperature-salinity profile program (GTSPP) of the National Oceanographic Data Center (NODC).
2.2.5. Surface Drifter
Thirteen Global Drifter Program (GDP) surface drifters, including ID numbers 39136, 41436, 71337, 82003, 82005, 82031, 91679, 91681, 107613, 114866, 115006, 63942870, 63943550 were used in this study. The hourly interpolated dataset was provided by the Atlantic Oceanographic and Meteorological Laboratory Physical Oceanography Division of the National Oceanic and Atmospheric Administration (NOAA). The interpolation methods for drifter trajectories tracked by the Argos system and global positioning system were described in [25].
2.3. Ocean Currents
Two ocean current databases were used in this study, including historical shipboard acoustic Doppler current profiler (ADCP) and CWB surface current model simulation. The ocean surveyor vessel-mounted ADCP manufactured by Teledyne RD Instruments was carried aboard the research voyager. The measured ocean current data referred to NODC’s GTSPP quality control label and underwent a series of tests to remove unreasonable data. The spatial resolution of the grid data was 1/4°, and the observation time of the data was from 1991–2020. The CWB operational forecast current model was constructed using a 3D unstructured-grid model [26], and the output included ocean current velocity, sea surface elevation, temperature, and salinity with a 1/40° grid and an hourly temporal resolution. The simulation time of the data was from 2019–2020.
3. SST and Chlorophyll Concentration Variations Adjacent to Yilan Bay
The interaction between the periodically oscillating KC [19] and the coastal current of northeastern Taiwan [16] significantly affects the seasonal variation in SST in Yilan Bay. The isotherms in Yilan Bay extend northward from the cape in the southern part of the bay and parallel to the coast (Figure 3). A large SST gradient can be seen in winter (December to February), and the SST variation within 10 km is approximately 1–1.5 °C. The average SST difference between the warm KC and the nearshore water in winter can reach 3 °C, but only 0.5–1 °C in summer. The main axis location of the KC has a seasonal variation of nearly 10 km in this area [19]. In winter, the KC axis is closer to the coast of Taiwan than in summer. However, the axis is still 50 km away from the shore, so its impact on the bay is difficult to judge. The west boundary of KC near Yilan Bay would also change with the main axis of KC in each month. Considering the difference between nearshore water (high chlorophyll concentration) and the KC (low chlorophyll concentration), we present the influence of seasonal variation in the nearshore KC with an equal chlorophyll concentration line of 0.4 mg/m3.
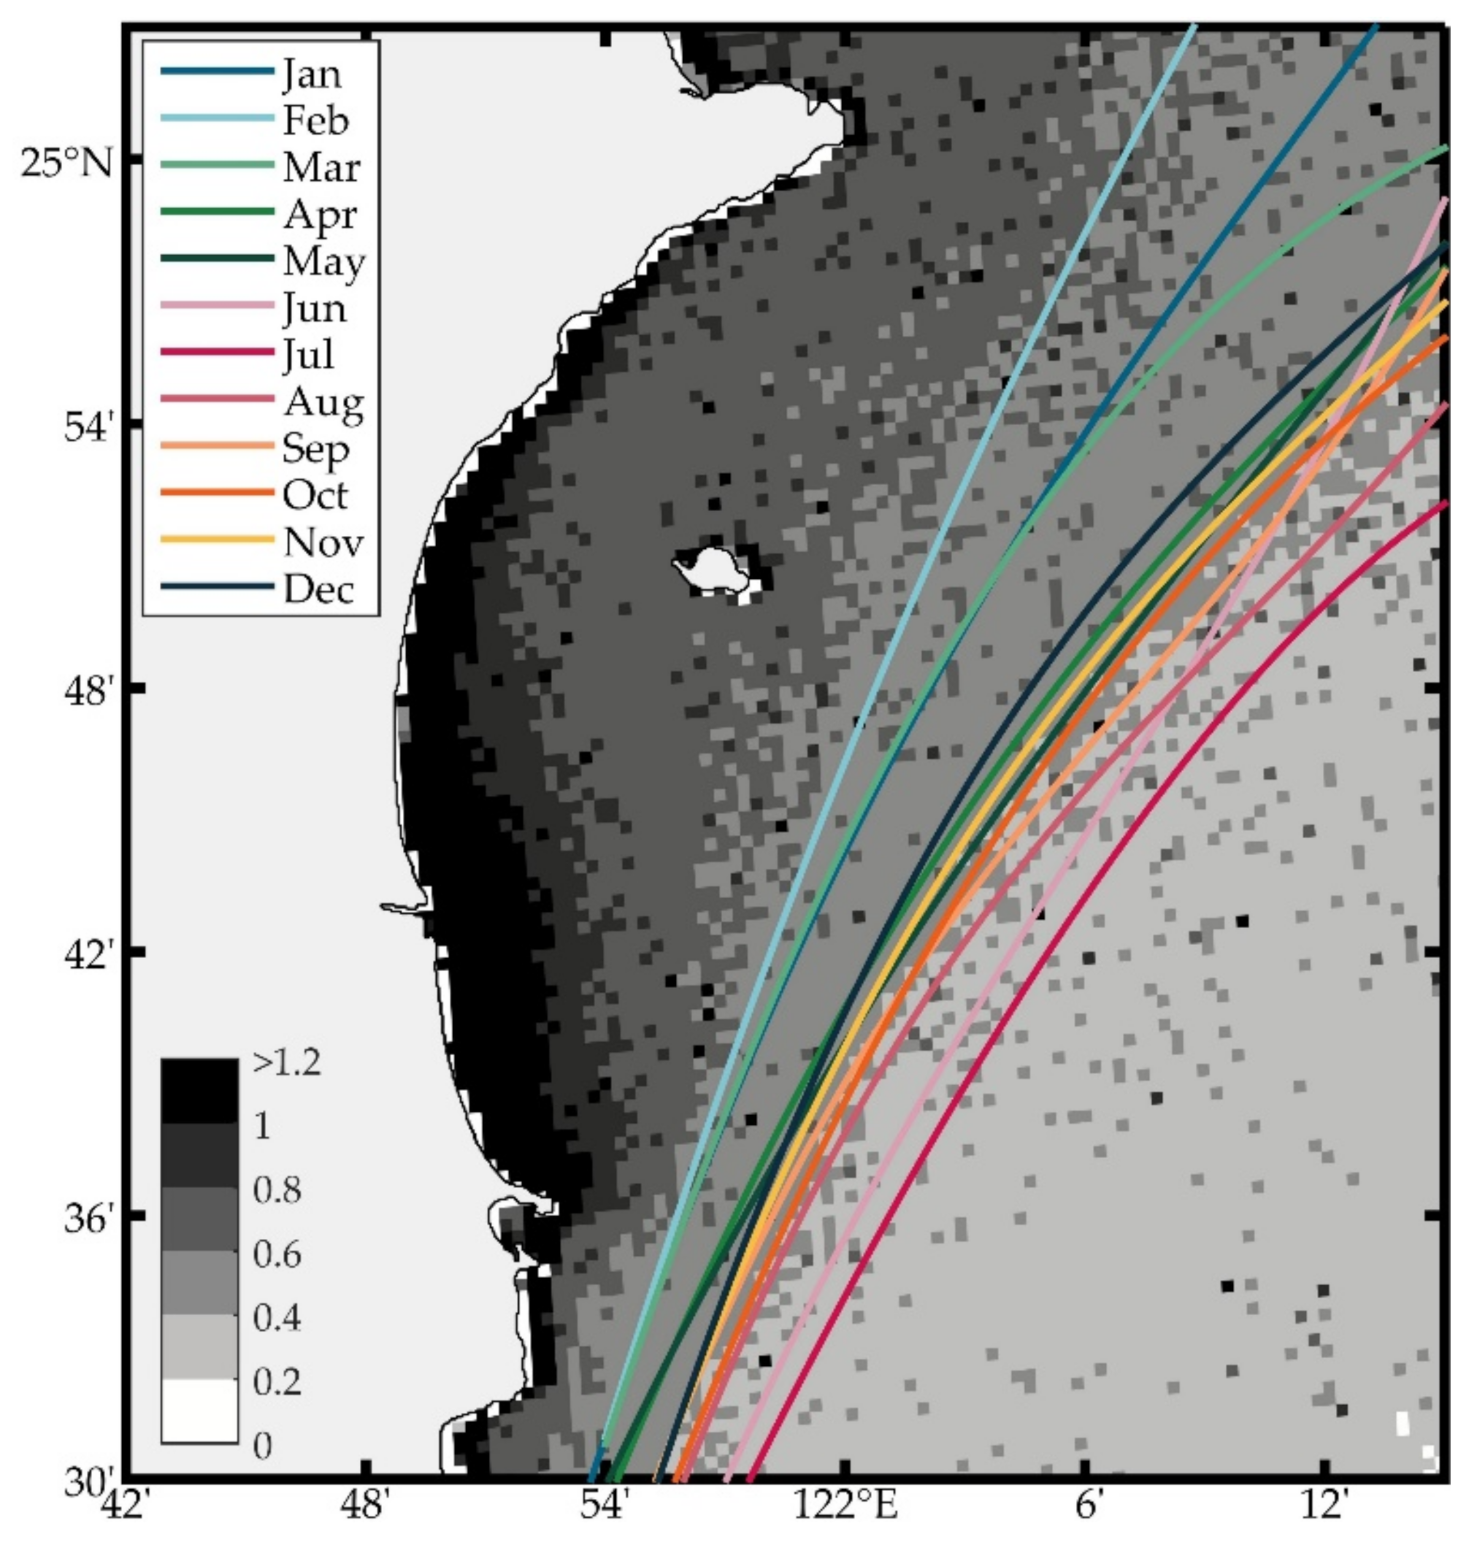
The gray shading in Figure 4 is the climatological chlorophyll concentration average over ten years. There are two main sources of high chlorophyll concentration in the bay: coastal currents from northeastern Taiwan [16] and runoff from the Lanyang River. The difference in chlorophyll concentrations inside and outside the bay can be up to a factor of two. The solid-colored lines represent the position of the 0.4 mg/m3 chlorophyll concentration contour in each month. The isoline in February is closest to the bay, which indicates that the KC is close to the coast, compressing the high concentration of chlorophyll into the bay; The isoline in July is farthest away from Taiwan; therefore, the water with high chlorophyll concentration extends eastward into the Pacific. The KC and coastal water have a seasonal shift of approximately 10 km south of the bay and nearly 20 km east of Guishan Island.
4. The Cause of Variations in Chlorophyll Concentration in Yilan Bay
4.1. Rainfall and Streamflow
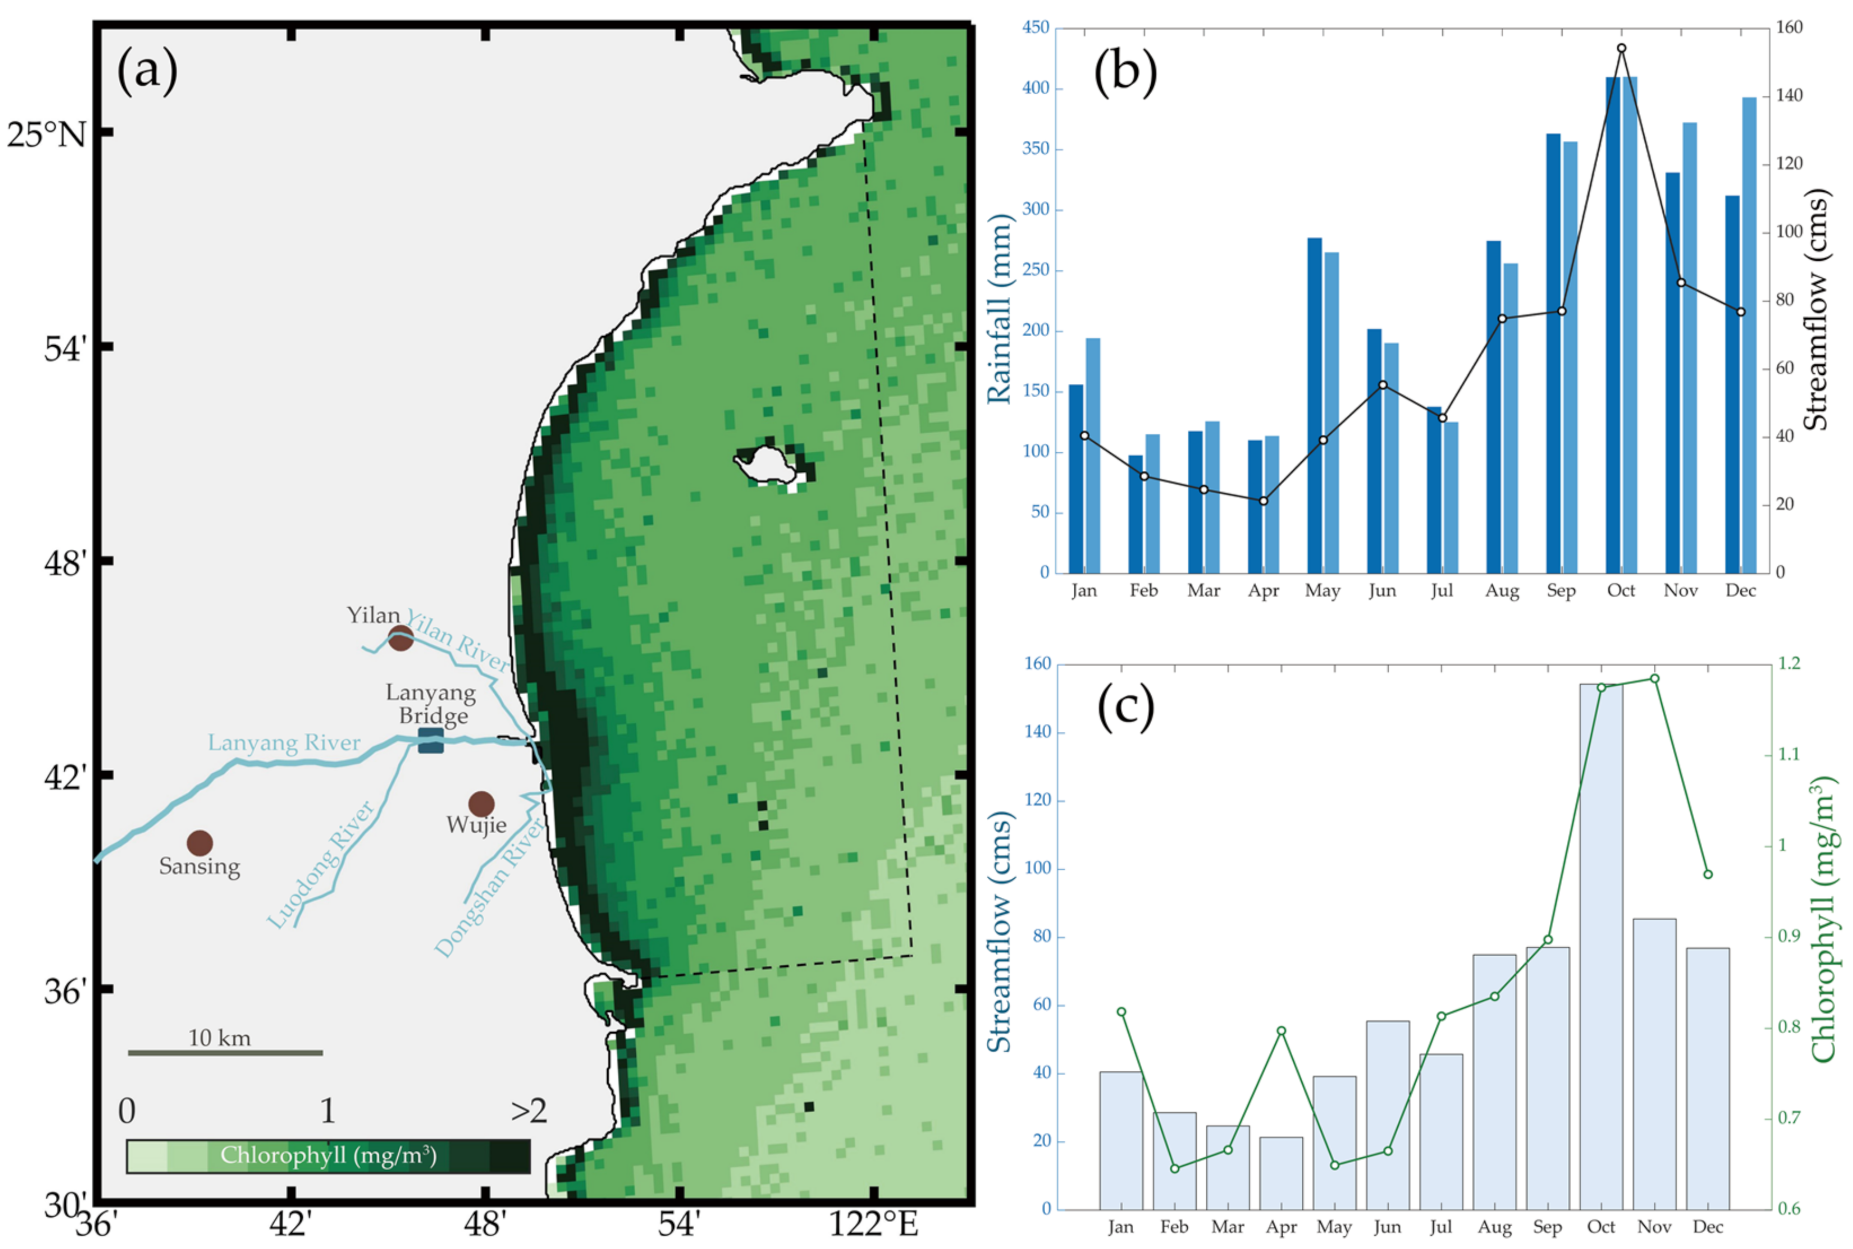
The Lanyang River is the only source of river runoff into Yilan Bay (Figure 5a), and we measured the streamflow into Yilan Bay according to the instruments on Lanyang bridge (blue box in Figure 5). Rainfall is an important factor affecting river streamflow. There are three main rainfall periods in northeastern Taiwan: plume rain (May), typhoon (summer), and orographic rain (winter). The relationship between the rainfall on Lanyang Plain (brown dot in Figure 5) and the streamflow of the Lanyang River is shown in Figure 5b. We calculated two different type of rainfall: the dark blue bar is the average rainfall at Yilan and Sansing stations, and the light blue bar is the average of all stations; this is made because we found that the rainfall observed at Wujie station was much greater than the amounts measured at the other two stations from November–January, and the average rainfall difference in December even exceeded 200 mm; however, the factors causing this difference are not clear. An increase in rainfall indeed increases the streamflow into Yilan Bay, and the correlation coefficient is 0.87. Figure 5c shows the relationship between streamflow and chlorophyll concentration in Yilan Bay (dotted line range in Figure 5a), and the correlation coefficient is 0.82. The chlorophyll concentration in the bay is higher in the flood season (October, >1 mg/m3), and lower in the dry season (February, 0.53 mg/m3); the sudden onset of high chlorophyll concentrations in March and April may be due to the high concentration of nutrients produced by Asian dust storms [27,28] after settling in the adjacent sea area and flowing along the coast into the bay. The conclusions are that the changes in chlorophyll concentration in Yilan Bay mainly come from the flow of the Lanyang River and that the streamflow depends on the amount of rainfall. This result also presented one reason of the chlorophyll concentration in the waters of northeastern Taiwan in the autumn and winter increase suddenly and sharply.
4.2. Flow Field
In order to understand the flow field in Yilan Bay, this section analyzes the path of the surface drifter and presents numerical simulations of the tidal currents in the bay, which could help in understanding the transfer of high chlorophyll concentration into the bay and the interaction of the flow field in the bay and the nearshore boundary of the KC.
4.2.1. Surface Drifter Trajectories
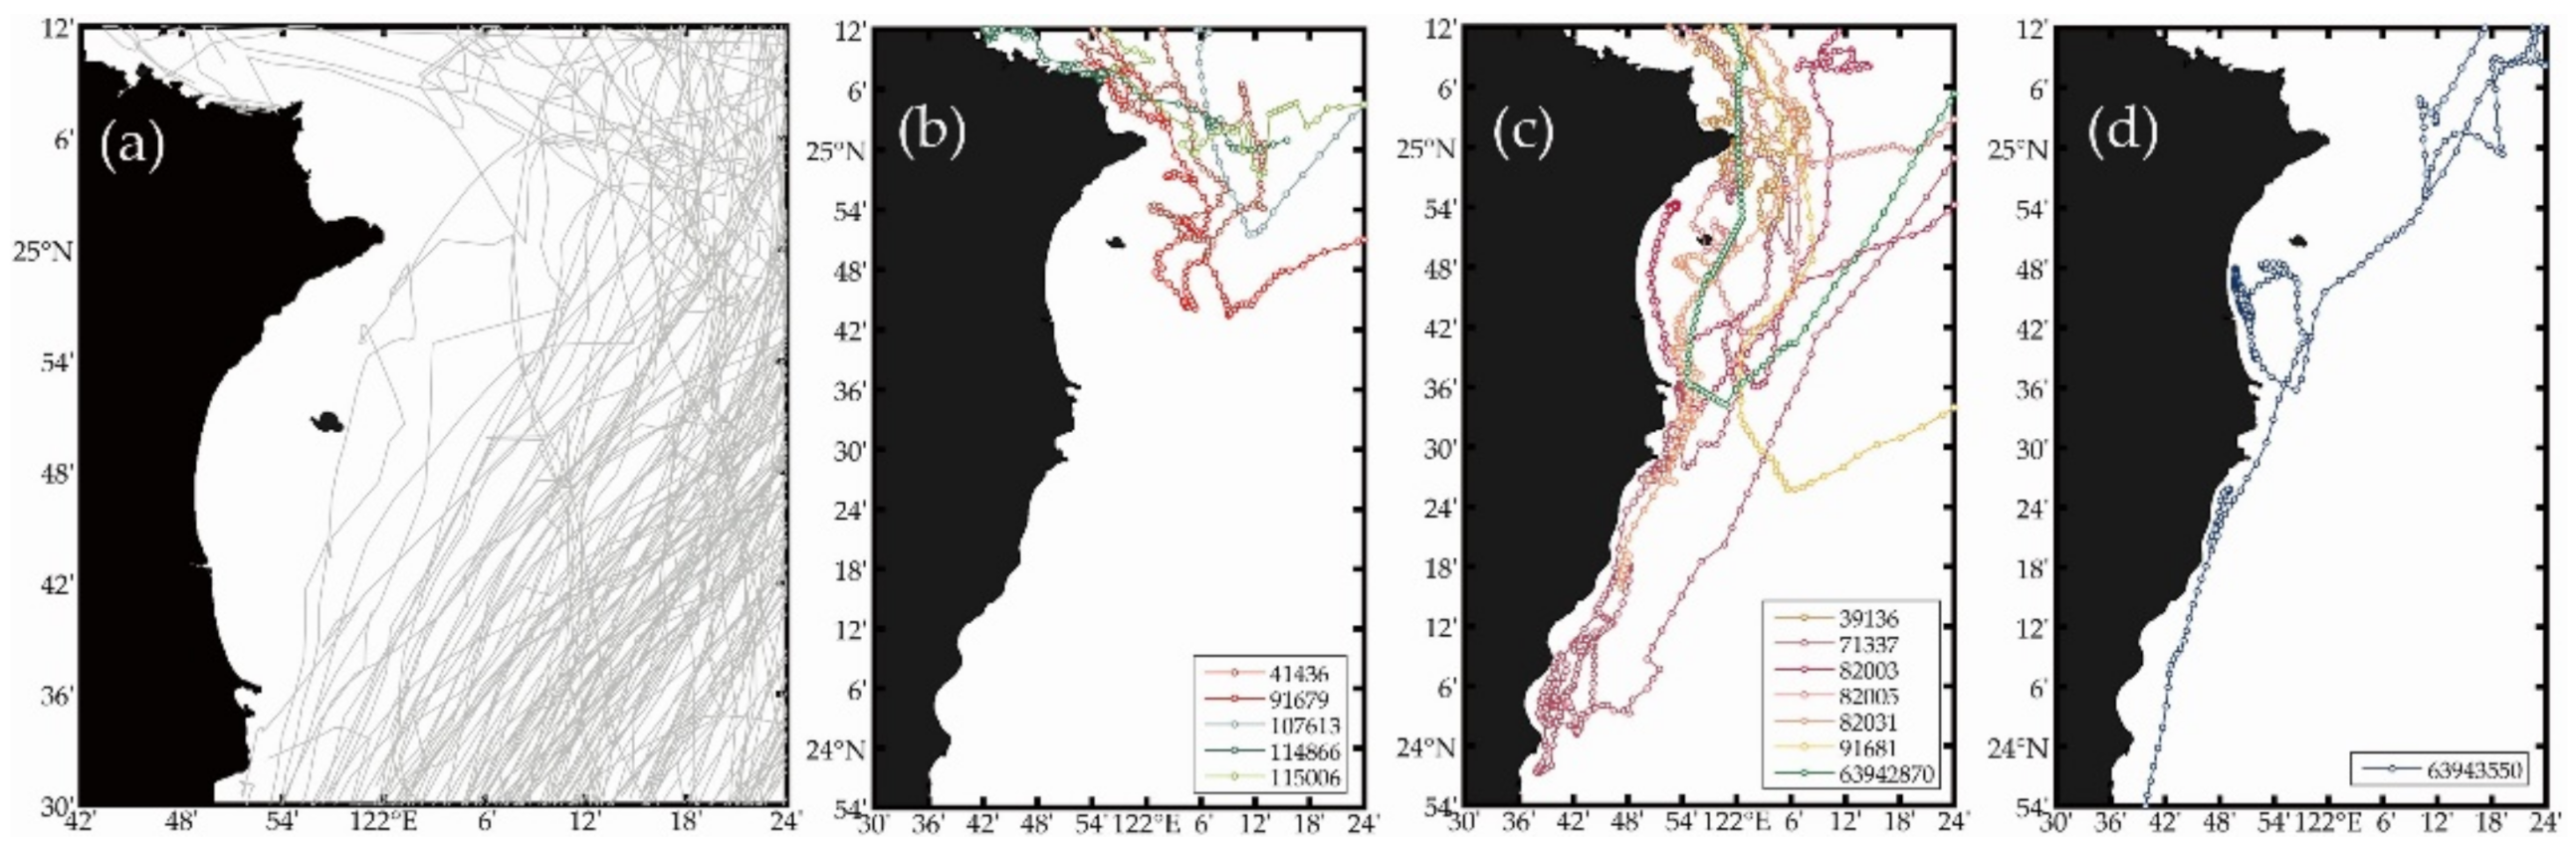
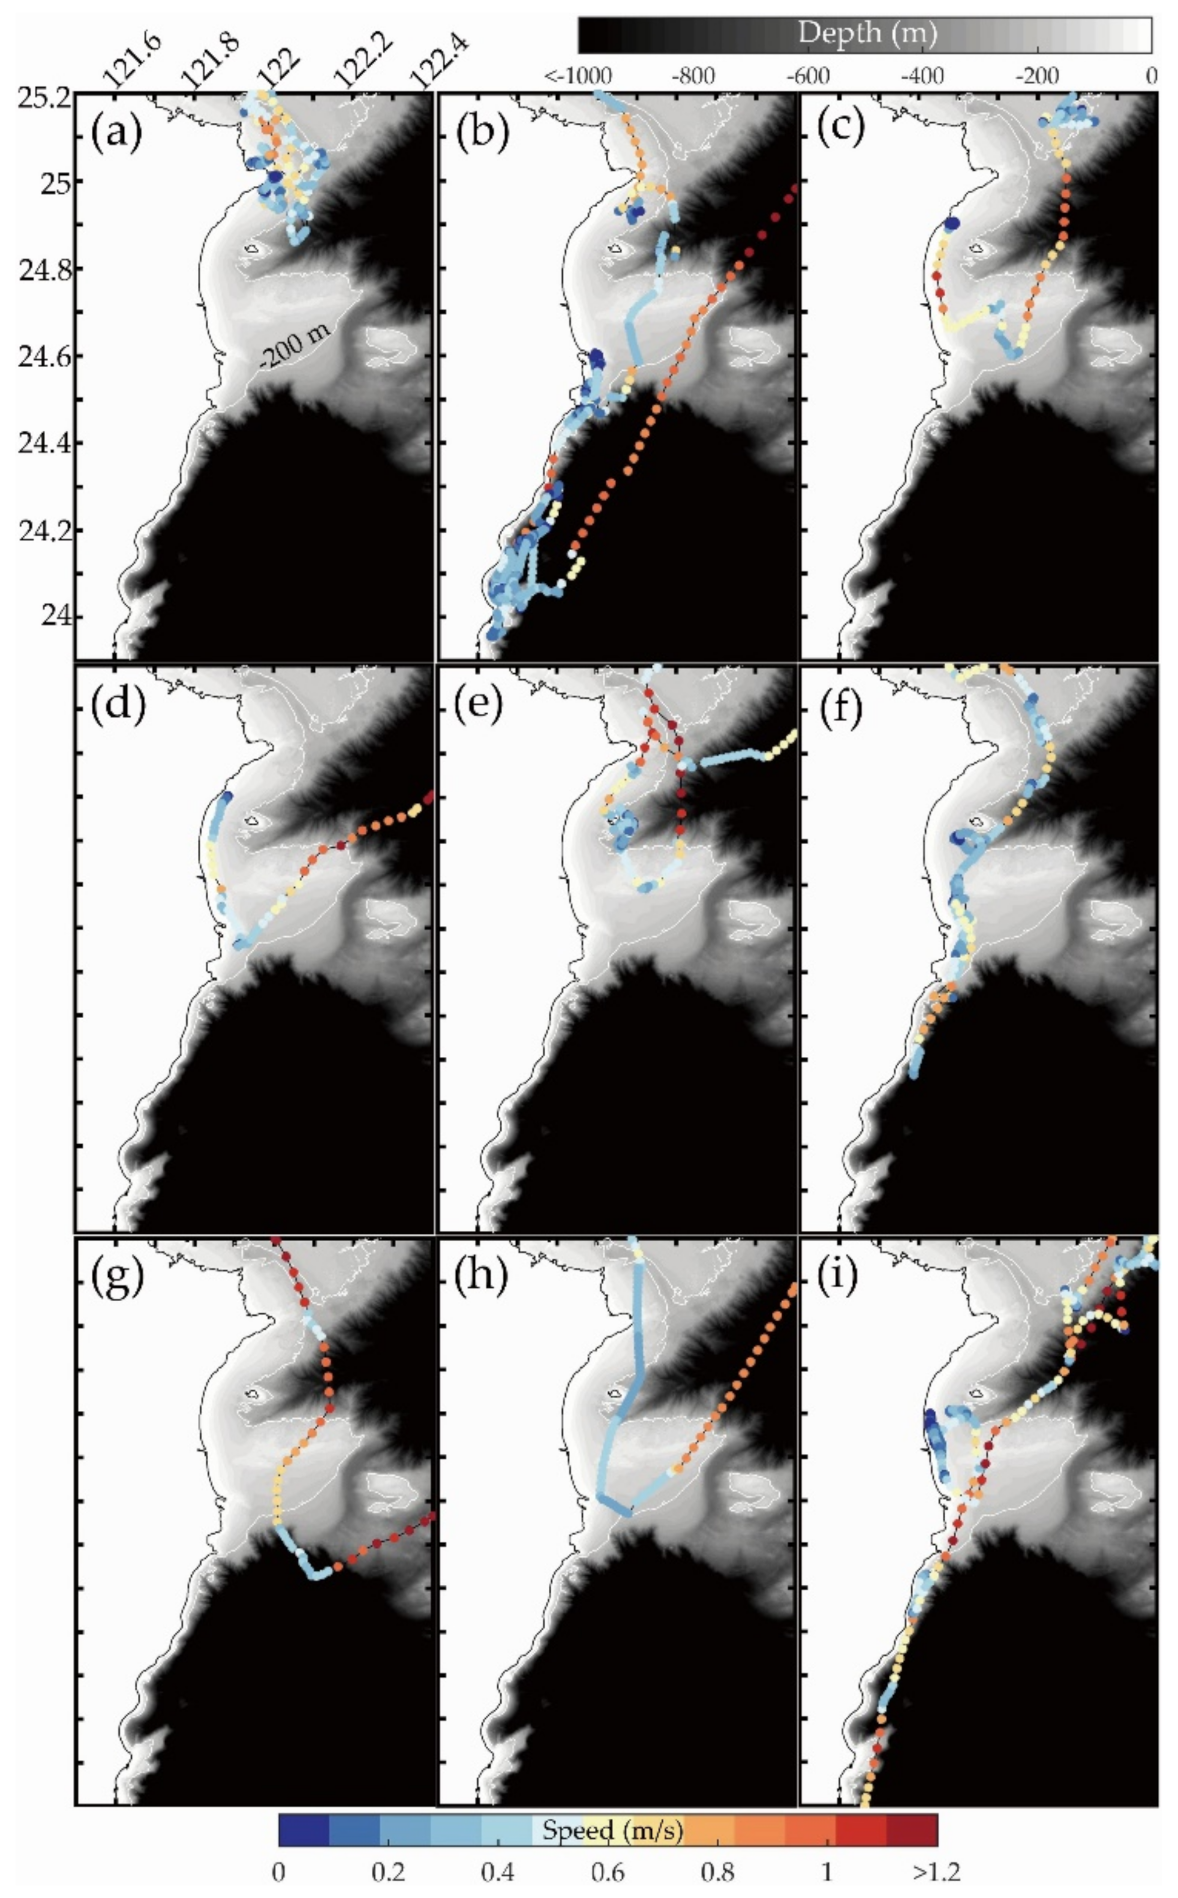
We collected a total of 154 GDP surface drifters that traveled adjacent to Yilan Bay and the KC region (Figure 6). The trajectories are divided into four categories: (1) drifting from northward outside the bay (Figure 6a); (2) drifting southward from the ECS to outside of the bay and turning to the KC (Figure 6b); (3) drifting southward from the ECS into the bay (Figure 6c), and (4) drifting northward into the bay and turning to the KC (Figure 6d). We are mainly interested in the Type-3 and Type-4 drifter trajectories entering the bay. Type-3 occurs in April, July, August, October, and November, while Type-4 occurs from February to March. Figure 7 shows the trajectories of these two types and their corresponding velocities.
Next, let us look at the movement trajectories of these drifters in detail. Drifter 39136 (Figure 7a) entered ECS at 0.56 m/s northward along 122.6°E in the KC in eastern Taiwan; it suddenly turned south at 25.8°N, 122.3°E, drifted at 0.64 m/s to the cape northern part of Yilan Bay, and hit the coast after revolving at 0.34 m/s for eight days. Please note that this drifter did not carry a drogue during this period, so its drift speed was close to the surface speed. The reason why the drifter could not move farther south may have been due to the obstruction of the northward KC, which was located nearshore in November. Drifter 71337 (Figure 7b) entered Yilan Bay southward from western Taiwan and along the northern coast in July. It continued southward along the coast to 23.95°N at a speed of 0.31 m/s, and then entered the KC and moved northeastward at a speed of 0.91 m/s. In the process of floating, the drifter stayed near the capes in the northern and southern parts of the bay for 1 and 2 days, respectively, and drifted back and forth from north to south along the coast (~24°N) for one week. The drifter was equipped with a drogue; therefore, the flow speed represents conditions at approximately 15 m depth. This case reveals that the coastal current situation in eastern Taiwan is complex and that there is indeed a frontal junction between the southward coastal current and the northward KC adjacent to Yilan Bay. Drifter 82003 is an interesting example; it was deployed with a drogue at 25.19°N, 122.19°E in August, drifted southward to 24.6°N at 0.7 m/s, then turned westward into Yilan Bay. Clearly, the drifter was deployed in the NETCC instead of the KC. The trajectory of the drifter is divided into two sections. Figure 7c,d shows the trajectories of entering and leaving the bay, respectively. The drifter entered the bay and left after approximately one day and was obviously affected by the tidal current with significant variations in the velocity range of 0.2 to 1.2 m/s. Drifter 82005 (Figure 7e) was deployed several hours later than Drifter 82003 at 25.77°N, 122.25°E, farther to the northeast; this drifter also turned southward and then westward at 0.61 m/s along the NETCC into the bay due to the similar deployment time. The drifter did not travel to the coast of the bay but was taken away by the KC to the west after drifting around Guishan Island. Note that the drifter passed 25°N, 121°E twice, but the trajectory results differed. The time difference between the two passes was 3 days, which also implies that the flow field at the boundary between the bay and the KC is not in a stable state. Drifter 82031 (Figure 7f) was released at the same time as drifter 82005, but the deployment position was farther westward (25.78°N, 122.08°E); the trajectory showed that it was affected by the tidal current along the northern coast of Taiwan and continued to drift in the east-west direction for six days before moving south to the bay, the velocity in the bay was 0.24 m/s, and the drifter finally lost contact at 24.3°N, 121.8°E. After drifter 91681 (Figure 7g) was released in the ECS, it drifted southward along the NETCC at 0.58 m/s. Notably, it is still drifting southward 30 km offshore (24.4°N, 122.1°E), which is quite rare because the KC usually flows rapidly northward here. However, if the cold dome at northeastern Taiwan is large and extends to the south, it may cause this phenomenon. Drifter 63942870 (Figure 7h) moved southward (0.31 m/s) along the northern coast of Taiwan and the NETCC in April, entered Yilan Bay, then turned northeastward at the southern end of the bay and was carried away by the KC (0.78 m/s). The last example is drifter 63943550 (Figure 7i), which is the only case among 142 drifters that entered Yilan Bay from south to north. In March, it drifted along the eastern coast of Taiwan and turned westward at the southern end of Guishan Island into the bay, and it swayed and circled (<0.1 m/s) at the mouth of the Lanyang River. After 10 days, it drifted out of the bay and followed the KC (>1 m/s).
We summarize the pathways of surface drifters in the sea area adjacent to Yilan Bay. There are two routes into the bay: southward along the northeastern coast of Taiwan following the NETCC or northward along the eastern coast of Taiwan. The average speed in the bay is approximately half that in the KC, but tidal current in the bay has a significant impact where the speed changes greatly. An obvious interface appears between the bay and the KC, which is close to the chlorophyll concentration contour in Figure 4. There is a large difference in current speed between the eastern and western sides, and the flow directions are opposite.
4.2.2. Simulation of Tidal Currents
Tidal currents are an important physical factor in Yilan Bay. Therefore, we used numerical simulation to discuss the possible transport of high chlorophyll concentration in the bay and used the Wushi tidal station (black dot in Figure 8) along the coast of the bay to judge the times of flood and ebb tides. The tidal current in northern Taiwan flows westward in the flood period and eastward in the ebb period [22], but the water level variation in Yilan Bay in northeastern Taiwan is significantly different from that along the northern coast of Taiwan. The variation in the water level in Yilan Bay occurs four to five hours earlier than that in northern Taiwan. The sea area is dominated by a mixed semidiurnal tidal pattern, which means that the tidal characteristics of Yilan Bay and northern Taiwan are not synchronized. Figure 8 shows the flow field results in Yilan Bay during the ebb and flood tidal periods from the CWB model simulation. In annual average terms, the tidal current characteristics in the ebb period are divided by Guishan Island and flow out of the bay to the south and the north; in the flood period, the flow direction across the whole bay is southward.
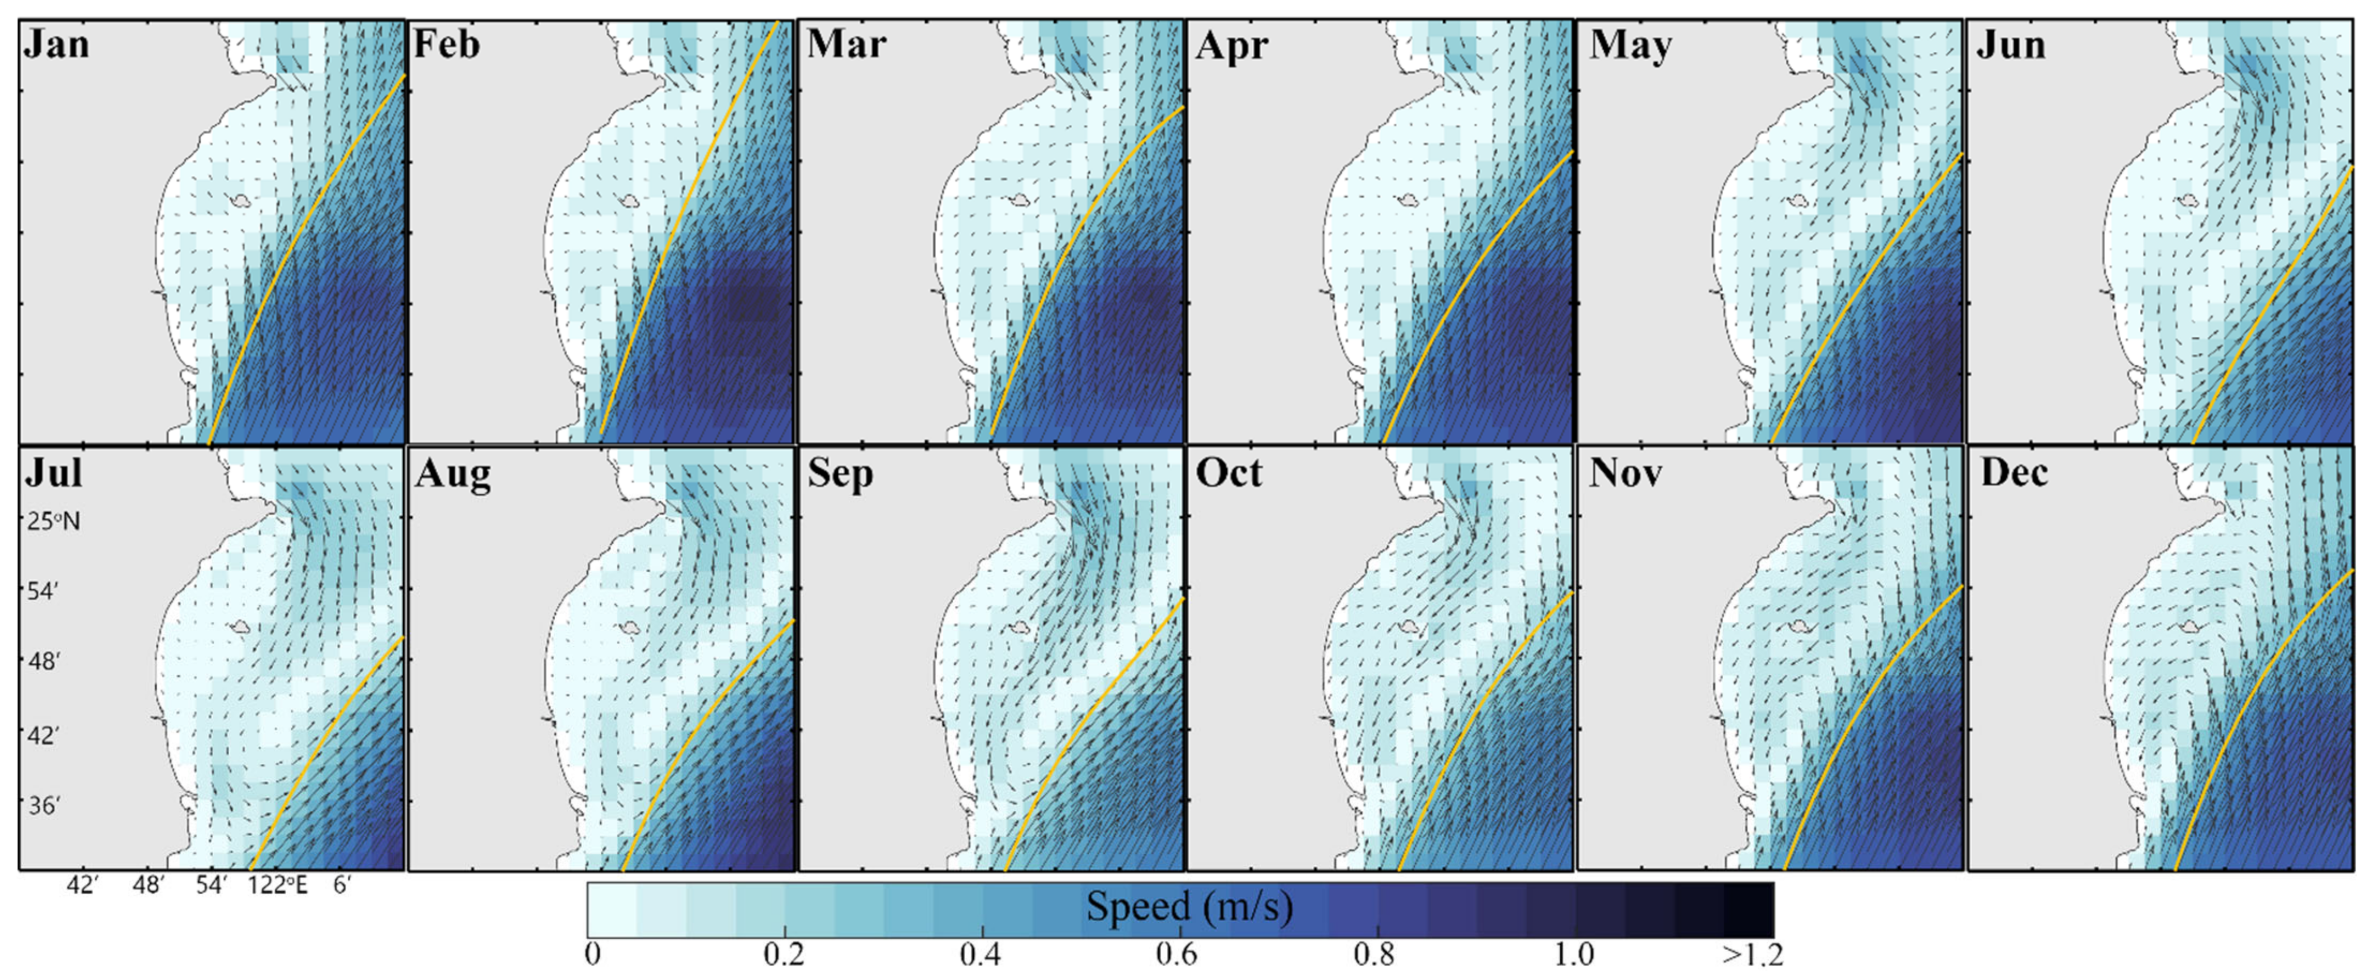
To understand the influence of KC variation on coastal currents, the monthly flow field is shown in Figure 9 (ebb period) and Figure 10 (flood period). Regardless of the tidal period, the KC begins to migrate eastward in May and then migrates back westward in October. Due to the gradual eastward migration of the KC, the effect of strong northward currents on the flow field in Yilan Bay gradually decreases, and the space is mainly dominated by tidal currents. In the ebb period, the westward nearshore current in summer appears at 24.95°N, 122.1°E, which is more easterly than that in winter (near Guishan Island). The ebb currents in the bay are bounded by the island; these currents flow northward into the ECS north of the island and southward into the KC south of the island. The flow field in the flood period is also affected by the KC seasonal migration. In winter, the nearshore position of the KC may block the tidal currents from flowing southward in the northern part of the bay. From May to October, obvious southward tidal currents pass through the whole bay and finally turn toward the KC at the southern cape of the bay, forming a northeast-southwest U-shaped flow field and thus showing a significant oceanic front; this situation explains why the drifter (Figure 7b) in July had an obvious reversal in flow field drift over such a short distance. In addition, this flow field may also lead to the formation of a chlorophyll concentration front (Figure 4), which is consistent with the position of the flow front; therefore, an obvious interface appears between the coastal water and the KC.
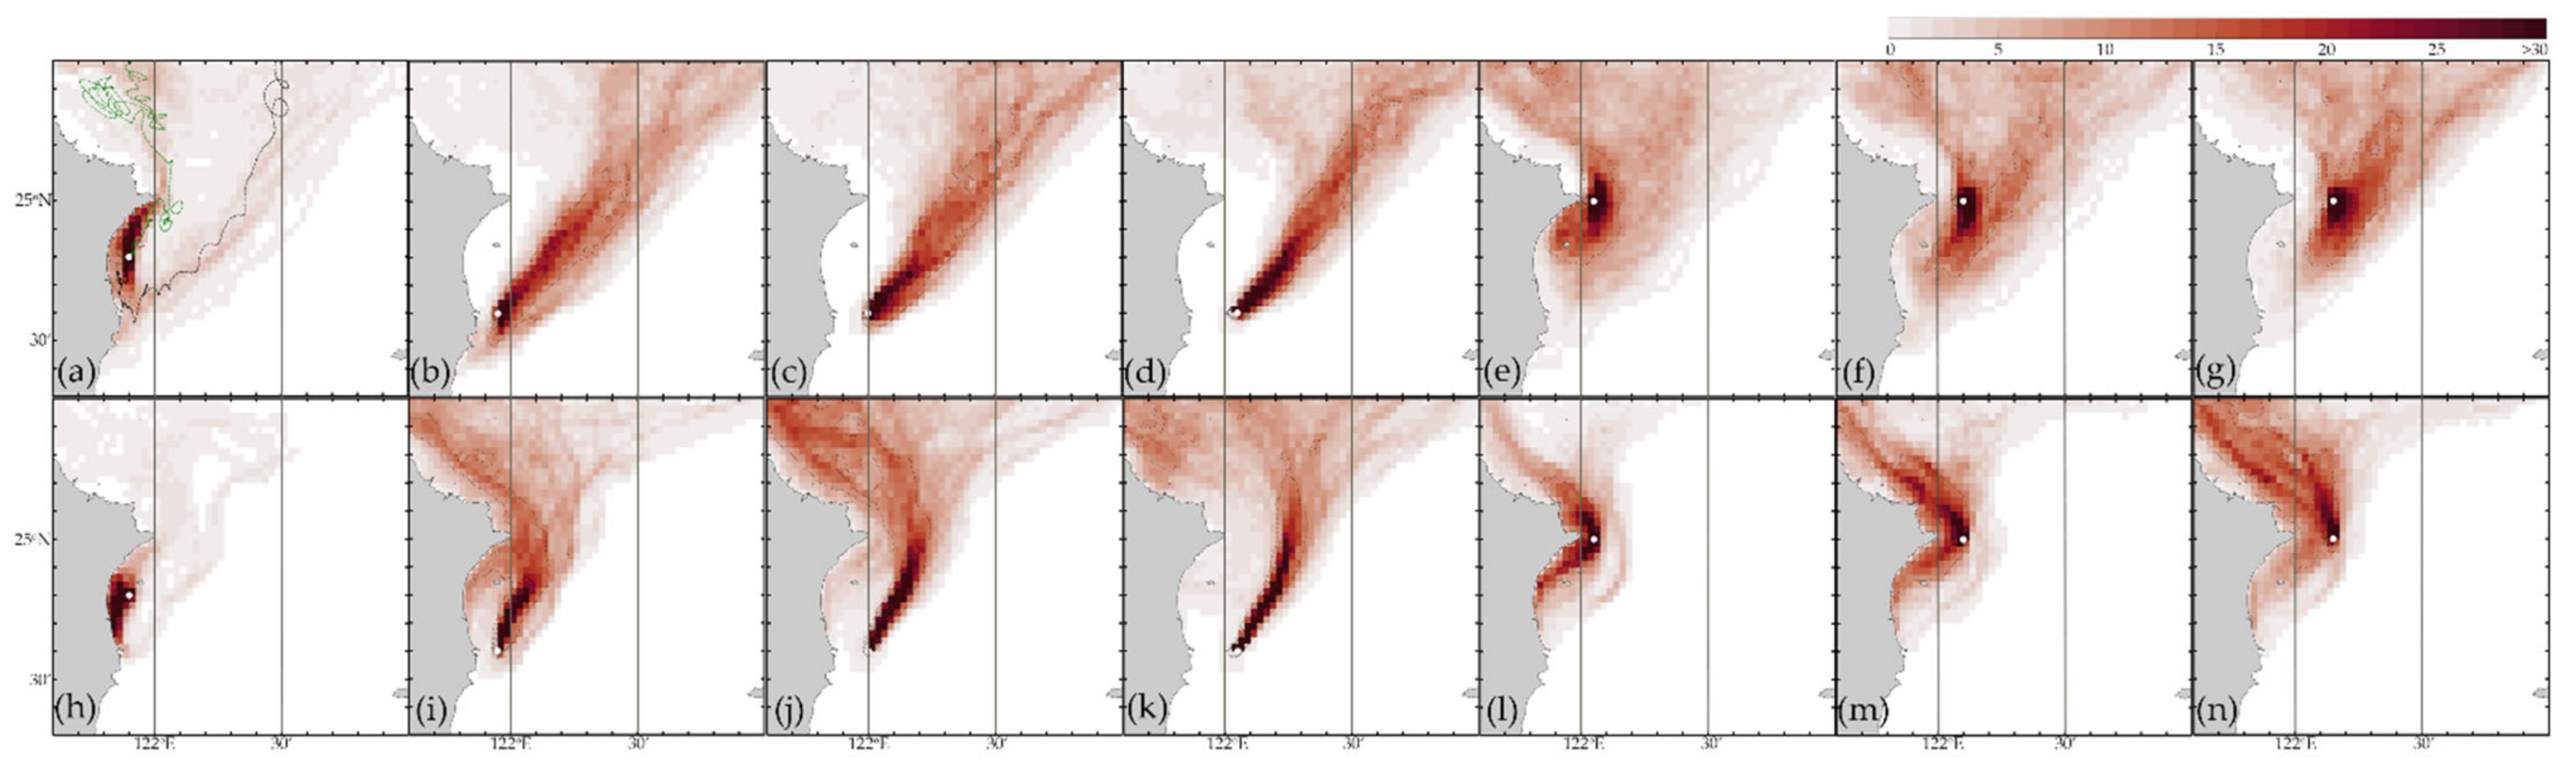
Based on the results of the hourly flow field simulation, we selected two months (February and July) with the largest difference in flow field characteristics adjacent to Yilan Bay to analyze the possible movement path of high chlorophyll concentration by using virtual particle trajectories. The selected particles were in the bay (24.8°N, 121.9°E), in the southern part of the bay (24.6°N, 121.95°E; 24.6°N, 122°E; and 24.6°N, 122.05°E), and in the northern part of the bay (25°N, 122.05°E; 25°N, 122.1°E; and 25°N, 122.15°E). These virtual particles could be regarded as near-surface flows, which are affected by wind fields, tides, and ocean currents. Figure 11 shows the probability density distribution of particle trajectories in July and February, and the blue and green lines in Figure 11a are examples of trajectories. For the drift track of particles in the bay (Figure 11a,h), in July, in addition to being affected by the tides in the bay, the particles can drift northward to the ECS or follow the KC after southward leaving the bay; in February, the particles are mainly affected by tidal currents in the bay, and most of the particles reach the coast of the bay. The drift trajectories of particles in the southern part of the bay are obviously different in these two months. In July (Figure 11b–d), both the ebb and flood currents in the bay are southward; as a result, the particles can hardly enter the bay and are directly taken away by the KC. In February (Figure 11i–k), the position of the KC near the shore can cause the particles to follow the northward currents, turn into the bay under the influence of the tidal currents near the bay, and then follow the tidal currents around the bay and return to the KC path. That factors are jointly affected by tidal currents and the KC can also be seen from the particle trajectories in the northern part of the bay. The major difference is that the diffusion range of particles in July (Figure 11e–g) is larger than that in February (Figure 11l–n). The reason for the different diffusion ranges can be seen in Figure 9 and Figure 10. The key is that the nearshore and offshore parts of the KC expand or compress the influence range of tidal currents and lead to significant seasonal differences in the diffusion range of high chlorophyll concentrations with the flow field.
4.3. A Case Study of the Variation in the Chlorophyll Concentration with the Flow Field
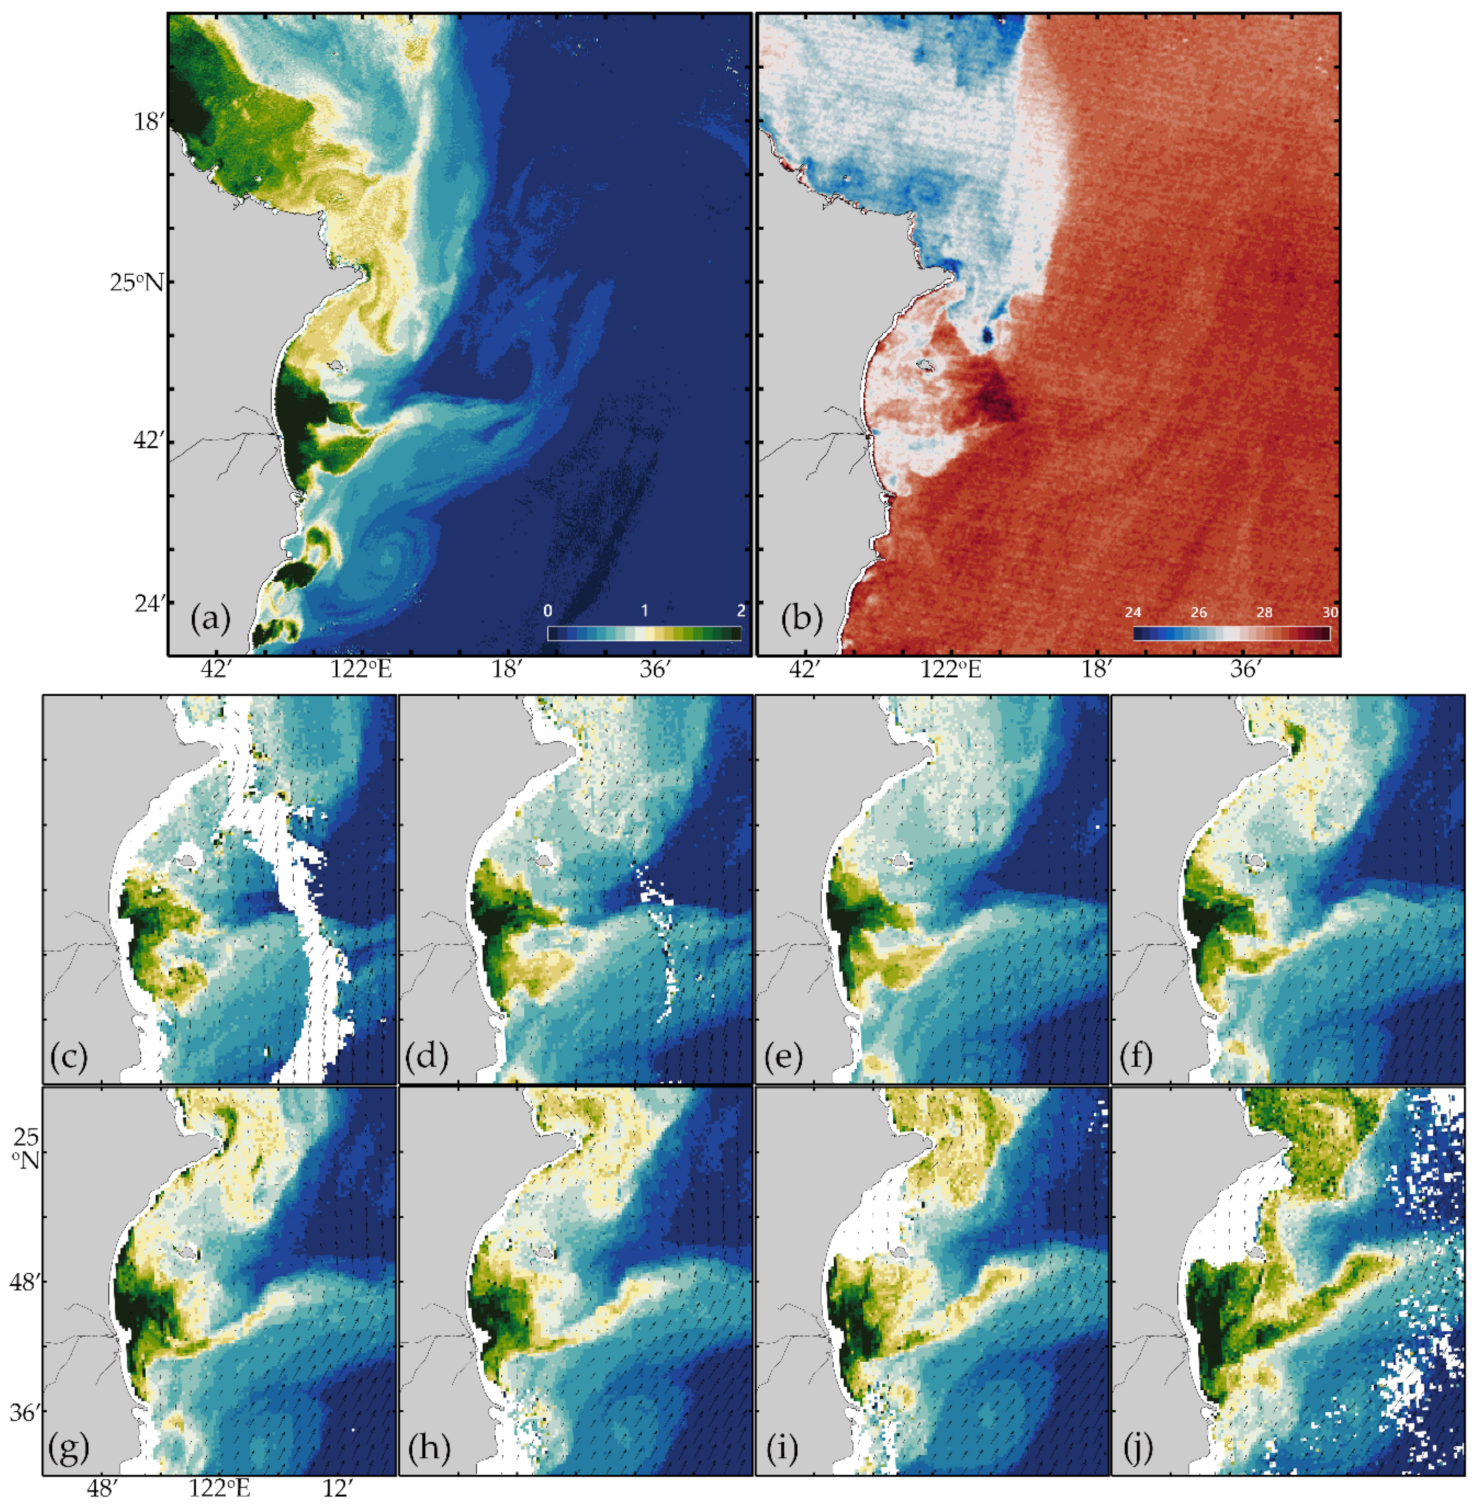
In the previous two sections, we analyze the tidal current and the KC influence in Yilan Bay. In this section, we provide an example of the variation in chlorophyll concentration with the flow field on 4 October 2019. Yilan Bay has the highest streamflow in October (Figure 5b) and has a high chlorophyll concentration. Figure 12a,b shows snapshots of chlorophyll concentration and SST, which are near-real-time data from the Second-generation GLobal Imager (SGLI) onboard the Global Change Observation Mission (GCOM-C) with 250-m grid resolution. At this time, the streamflow of the Lanyang River was 137.56 cms. The seawater along the northeastern coast of Taiwan had low SST and high chlorophyll concentration, the KC water had high SST and low chlorophyll concentration, while Yilan Bay water was mixed by tidal currents and the nearshore KC and was characterized by high chlorophyll concentration. The river plume caused by the Lanyang River diffused eastward with the tidal currents. The SST of the river plume was 1–2 °C lower than that of the KC. Although the diffusion of chlorophyll to the KC area increased the concentration, it did not significantly reduce the SST at this location. Figure 12c–j show how high chlorophyll concentration diffused with the tidal currents and KC at 08:00–15:00 (UTC + 8) on 4 October 2019. The flood period was from 08:00–12:00, when the southward tidal currents pushed the chlorophyll concentration to the southern tip of the bay and the boundary of the KC; thus, the chlorophyll concentration was carried northeastward and intruded into the surface KC. From 12:00 to 15:00, the tide pattern changed to the ebb period, and the ebb current in southern Yilan Bay was still southward. Therefore, chlorophyll continued to flow southward and was taken away by KC. Figure 12c–j clearly show that the high chlorophyll concentration in the southern part of the bay continued to extend northeastward out of the bay with an increased diffusion range. The ebb current flowed northward into the ECS in the northern part of the bay, and the high concentration of chlorophyll was also transported northward. Unfortunately, from 14:00 to 15:00, the northern part of the bay was affected by clouds, resulting in a lack of data, but we can expect that the whole bay should have been covered with high chlorophyll concentration. From this case, we know that the hydrological characteristics of Yilan Bay are significantly affected by tidal currents and the KC, and the variation over time is quite rapid.
5. Hydrological Characteristics of Yilan Bay
In this study, we analyzed the significant seasonal variations in chlorophyll concentration in Yilan Bay, found the impact of rainfall and Lanyang River runoff on the increase in chlorophyll concentration, and used drifter data and virtual particle simulations to analyze the possible transport trajectories of sea surface materials inside and outside the bay. The most important point is to understand that the interaction between tidal currents and the seasonal offset of the KC are two of the major factors affecting biogeochemical cycles in Yilan Bay. After clarifying the physical movements process of seawater in the bay, this section assesses whether the historical hydrological data are in line with our new findings.
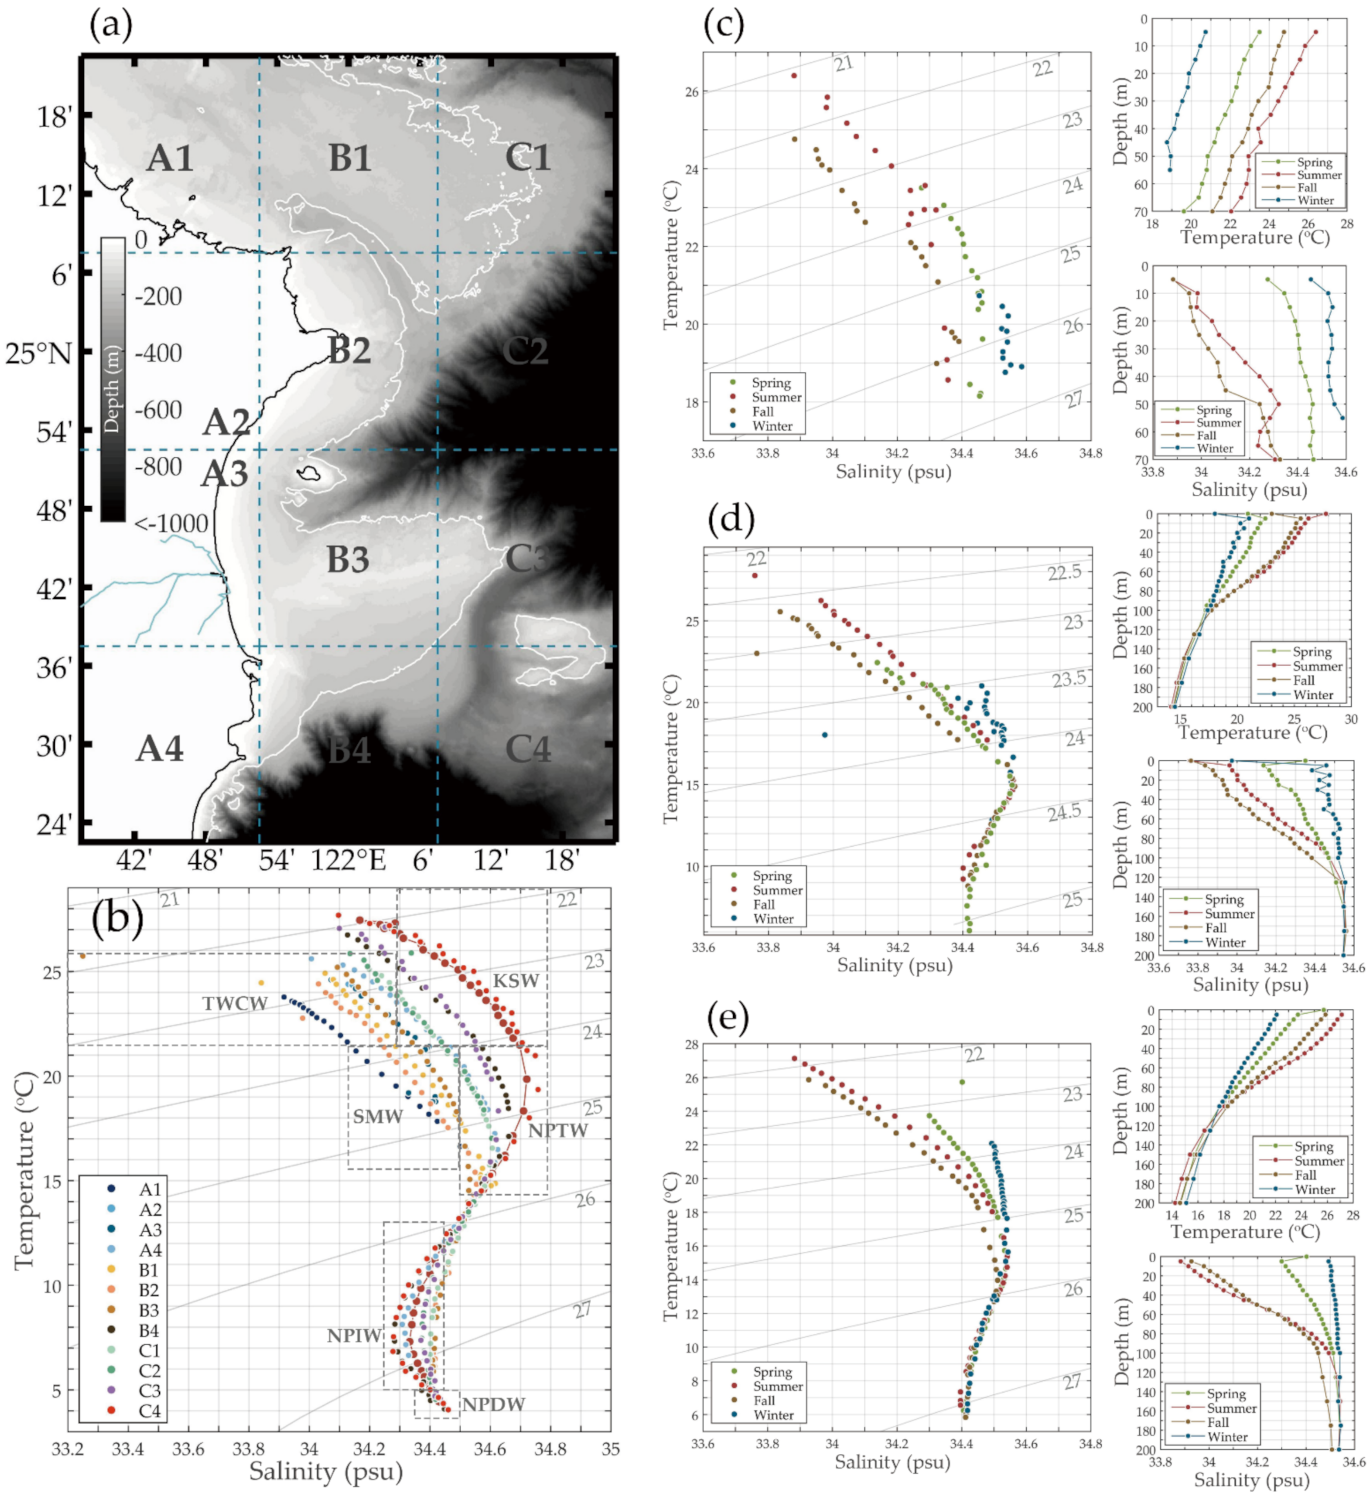
The ODB database provides data on 12 areas in the waters adjacent to Yilan Bay, as shown in Figure 13a. Figure 13b shows the T-S diagram of these 12 areas, which can be used to help us analyze the characteristics of seawater temperature and salinity to track the sources of water and qualitatively estimate the directions of ocean currents. There is a dark brown solid line segment in Figure 13b, which is the reference line segment along the KC axis in eastern Taiwan, representing the typical T-S curve of KC water, which is a left-right symmetrical S-shape. The upper curve represents Kuroshio surface water (KSW), and the salinity maximum at the right convex point in the upper direction represents North Pacific tropical waters (NPTW); a salinity minimum at the left convex point in the lower direction represents North Pacific intermediate waters (NPIW), and water with a salinity of approximately 34.4 psu and the lowest SST on the curve is called North Pacific deep water (NPDW). Area C4 is located on the KC axis, so it has the same water mass characteristics as the KC. A1 is on the continental shelf of northern Taiwan, and its water mass characteristics are composed of Taiwan warm current water (TWCW) in the upper layer and shelf mixed water (SMW) in the lower layer. The Taiwan warm current in the Taiwan Strait and the continental shelf of the ECS can be reasonably said to combine into a mixed water mass due to the swash and backwash tidal currents. The characteristics of the water masses at B1 and C1 are similar and which are mainly composed of TWCW, SMW, and NPTW. However, C1 is located in the KC path, so the upper layer water also displays the characteristics of KSW. The B1 area is likely to be affected by KC invasion only in winter, so the annual characteristics of water masses may not distinguish KSW. The characteristics of the water masses at A4 and B4 are similar in the middle and lower water layers but different in the near-surface layer. Figure 7 and Figure 11 show that coastal water can move down from the ECS shelf to A4; therefore, the upper layer of water masses at A4 has TWCW characteristics, while B4 consists mainly of KSW. Half of the areas of C2 and C3 are located in the KC path, and half are within the influence of tidal currents; therefore, the water mass has the characteristics of TWCW, KSW, NPTW and NPIW.
Next, we discuss the water masses and seasonal variations in Yilan Bay (A3, B2, and B3). A3 (Figure 13c) is located in the estuary of the Lanyang River, where the water depth is shallow (<100 m), and the water mass is characterized by TWCW and SMW. The salinity-depth profile clearly shows the influence of rainfall and river runoff in Yilan Bay. In fall (September–November), the salinity of the whole water layer is much lower than that in other seasons, and the salinity of the upper 20 m is lower than 34 psu. In summer, this feature appears because typhoons can strike this area, bringing heavy precipitation and diluting the salinity. The upper layer (<120 m) in B2 also has obvious seasonal differences. In spring, summer, and fall, it is affected by a significant tidal current cycle and has the characteristics of TWCW. However, rainfall and river runoff may dilute the salinity in summer and fall. In winter, the water type tends to SMW due to the nearshore position of the KC. The tidal currents characteristic of B3 flow southward, and this area can be affected by the KC. Therefore, the characteristics of water masses mostly include the five water masses mentioned in Figure 13b. The seasonal characteristics are obviously divided into two categories: they are greatly affected by tidal currents in summer and fall and by the nearshore KC in winter and spring. Therefore, the upper water (~100 m) has two seasonal components: TWCW and KSW.
Based on the analysis of chlorophyll concentration and tidal current characteristics in Yilan Bay, the seasonal hydrological variations adjacent to Yilan Bay are successfully explained. In the future, we can further study the topic of nearshore water flow and estuarine circulation. The surface runoff of the Lanyang River causes the formation of a river plume in the estuary, where the collection of driftwood and marine garbage caused by brackish water and coastal currents is worth studying. In addition, because the tidal currents in Yilan Bay are slow and the water depths are shallow, this area is suitable for future investigation of the vertical mixing process between the near-, mid-, and far-field plume and the KC water.
6. Conclusions
In this study, we used a variety of satellite and drifter data and numerical simulations to analyze the effects of tidal currents and the KC on chlorophyll concentrations and hydrological characteristics adjacent to Yilan Bay. We found that the chlorophyll concentration in Yilan Bay is mainly affected by rainfall and the runoff from Lanyang River. The fall season is the main rainfall period in Yilan Bay, which also causes a large increase in chlorophyll concentration. The movement of tidal currents in the bay transports these high concentrations of chlorophyll to the ECS and KC, which helps to increase marine primary productivity. Using GOCI data and tidal current simulation, we successfully present the hourly process of increase in chlorophyll concentration and inflow into the KC caused by a large amount of river runoff. The tidal currents in Yilan Bay flow out of the bay toward the north and the south with Guishan Island as the boundary in the ebb period and flows mainly to the south throughout the bay during the flood period. The spatial distribution of chlorophyll concentration in Yilan Bay is mainly affected by the seasonal shift in the position of the KC. If the KC is offshore, the ocean flow in the bay is dominated by tidal currents. If the KC is nearshore, the impact of tidal currents decreases, and there is a rapid northward current on the eastern boundary of the bay. The trajectories of the drifters help us understand the sources of ocean currents in Yilan Bay, and virtual particle simulations allow us to determine the diffusion direction of material with tidal currents. Most importantly, this study uses historical hydrological data for many years to clarify for the first time the characteristics of water masses in the waters adjacent to Yilan Bay, which not only improves our understanding of physical oceanography but also provides biochemists with sufficient knowledge of ocean physics for future studies in this sea area.
Author Contributions
Conceptualization, P.-C.H.; methodology, P.-C.H.; software, P.-C.H. and C.-Y.L.; validation, P.-C.H., H.-J.L. and C.-Y.L.; formal analysis, P.-C.H. and C.-Y.L.; investigation, P.-C.H.; resources, P.-C.H. and H.-J.L.; data curation, P.-C.H.; writing—original draft preparation, P.-C.H.; writing—review and editing, P.-C.H. and H.-J.L.; visualization, P.-C.H.; supervision, P.-C.H., and H.-J.L. All authors have read and agreed to the published version of the manuscript.
Funding
This work was supported by the Ministry of Science and Technology of Taiwan through Grant 110-2611-M-008-007.
Data Availability Statement
The level-3 monthly MODIS data were obtained from the physical oceanography distributed active archive center, NASA (AQUA daytime: https://doi.org/10.5067/MODSA-MO4D9 (accessed on 23 October 2021); AQUA nighttime: https://doi.org/10.5067/MODSA-MO4N9 (accessed on 23 October 2021); TERRA daytime: http://doi.org/10.5067/MODST-MO4D9 (accessed on 23 October 2021); and TERRA nighttime: https://doi.org/10.5067/MODST-MO4N9(accessed on 23 October 2021)). The GOCI data are available through the NASA ocean color web (https://doi.org/10.5067/COMS/GOCI/L2/OC/2014 (accessed on 23 October 2021)). The river runoff data were obtained from the WRA, Ministry of Economic Affairs, Taiwan. (https://gweb.wra.gov.tw/Hydroinfo/ (accessed on 27 October 2021)). The tidal station and meteorological station data were obtained from Central Weather Bureau, Taiwan (https://www.cwb.gov.tw/eng/ (accessed on 23 October 2021)). The drifter data were downloaded from National Oceanic and Atmospheric Administration Atlantic Oceanographic and Meteorological Laboratory Physical Oceanography Division (https://www.aoml.noaa.gov/phod/gdp/index.php (accessed on 23 October 2021)). The historical ADCP data and hydrological observations data are available through the ODB of the Ministry of Science and Technology, Taiwan (http://www.odb.ntu.edu.tw/en/ (accessed on 23 October 2021)). The surface current model simulation was obtained from Safe Ocean dataset from CWB (https://ocean.cwb.gov.tw/V2/ (accessed on 23 October 2021)). The GCOM-C SGLI data obtained from Japan Aerospace Exploration Agency, Earth Observation Research Center (https://kuroshio.eorc.jaxa.jp/JASMES/ (accessed on 23 October 2021)).
Acknowledgments
The authors appreciate all the data used provided from each open database. The authors thank anonymous reviewers and Academic editors for their comments.
Conflicts of Interest
The authors declare no conflict of interest.
Appendix A
The statistics of chlorophyll concentration and streamflow in Figure 5c.

Table A1.
The statistics of chlorophyll concentration (mg/m3) (Figure 5c). STD represents the standard deviation.
Table A1.
The statistics of chlorophyll concentration (mg/m3) (Figure 5c). STD represents the standard deviation.
| Jan | Feb | Mar | Apr | May | Jun | Jul | Aug | Sep | Oct | Nov | Dec | |
|---|---|---|---|---|---|---|---|---|---|---|---|---|
| Mean | 0.82 | 0.65 | 0.67 | 0.80 | 0.65 | 0.67 | 0.81 | 0.84 | 0.90 | 1.18 | 1.19 | 0.97 |
| STD | 0.21 | 0.07 | 0.16 | 0.23 | 0.08 | 0.11 | 0.15 | 0.15 | 0.15 | 0.49 | 0.29 | 0.29 |
Table A2.
The statistics of streamflow (cms) (Figure 5c). STD represents the standard deviation.
Table A2.
The statistics of streamflow (cms) (Figure 5c). STD represents the standard deviation.
| Jan | Feb | Mar | Apr | May | Jun | Jul | Aug | Sep | Oct | Nov | Dec | |
|---|---|---|---|---|---|---|---|---|---|---|---|---|
| Mean | 40.6 | 28.6 | 24.7 | 21.4 | 39.2 | 55.4 | 45.7 | 74.9 | 77.1 | 154.3 | 85.5 | 76.9 |
| STD | 17.5 | 11.0 | 7.9 | 6.7 | 15.5 | 37.4 | 20.9 | 74.3 | 43.6 | 145.5 | 39.0 | 51.8 |
References
- Lu, S.Y.; Shen, C.H.; Chiau, W.Y. Zoning strategies for marine protected areas in Taiwan: Case study of Gueishan Island in Yilan County, Taiwan. Mar. Policy 2014, 48, 21–29. [Google Scholar] [CrossRef]
- Chen, C.; Chan, T.Y.; Chan, B.K.K. Molluscan diversity in shallow water hydrothermal vents off Kueishan Island, Taiwan. Mar. Biodivers. 2018, 48, 709–714. [Google Scholar] [CrossRef]
- Chen, C.T.A.; Zeng, Z.; Kuo, F.W.; Yang, T.F.; Wang, B.J.; Tu, Y.Y. Tide-influenced acidic hydrothermal system offshore NE Taiwan. Chem. Geol. 2005, 224, 69–81. [Google Scholar] [CrossRef]
- Lin, Y.S.; Lui, H.K.; Lee, J.; Chen, C.T.A.; Burr, G.S.; Chou, W.C.; Kuo, F.W. Fates of vent CO2 and its impact on carbonate chemistry in the shallow-water hydrothermal field offshore Kueishantao Islet, NE Taiwan. Mar. Chem. 2019, 210, 1–12. [Google Scholar] [CrossRef]
- Lin, Y.S.; Lee, J.; Lin, L.H.; Fu, K.H.; Chen, C.T.A.; Wang, Y.H.; Lee, I.H. Biogeochemistry and dynamics of particulate organic matter in a shallow-water hydrothermal field (Kueishantao Islet, NE Taiwan). Mar. Geol. 2020, 422, 106121. [Google Scholar] [CrossRef]
- Lin, Y.S.; Lin, H.T.; Wang, B.S.; Huang, W.J.; Lin, L.H.; Tsai, A.Y. Intense but variable autotrophic activity in a rapidly flushed shallow-water hydrothermal plume (Kueishantao Islet, Taiwan). Geobiology 2021, 19, 87–101. [Google Scholar] [CrossRef]
- Tseng, L.C.; Yu, P.Y.; Hwang, J.S. Distribution and sexual dimorphism of the crab Xenograpsus testudinatus from the hydrothermal vent field of Kueishan Island, northeastern Taiwan. PLoS ONE 2020, 15, e0230742. [Google Scholar] [CrossRef]
- Huang, M.C.; Saito, N.; Shimomura, M. First record of Holophryxus fusiformis Shiino, 1937 (Crustacea, Isopoda, Dajidae) from the sakura shrimp, Lucensosergia lucens, in Taiwan. Crustacean Res. 2018, 47, 43–53. [Google Scholar] [CrossRef]
- Hsieh, H.Y.; Lo, W.T. Mesoscale distribution and assemblage structure of fish larvae in the Kuroshio waters off eastern Taiwan. Mar. Biodivers. 2019, 49, 1971–1986. [Google Scholar] [CrossRef]
- Chen, S.C.; Chang, C.R.; Han, Y.S. Seaward migration routes of indigenous eels, Anguilla japonica, A. marmorata, and A. bicolor pacifica, via satellite tags. Zool. Stud. 2018, 57, e21. [Google Scholar] [CrossRef]
- Han, Y.S.; Hsiung, K.M.; Zhang, H.; Chow, L.Y.; Tzeng, W.N.; Shinoda, A.; Yoshinaga, T.; Hur, S.P.; Hwang, S.D.; Lizuka, Y.; et al. Dispersal characteristics and pathways of Japanese glass eel in the East Asian continental shelf. Sustainability 2019, 11, 2572. [Google Scholar] [CrossRef] [Green Version]
- Johns, W.E.; Lee, T.N.; Zhang, D.; Zantopp, R.; Liu, C.T.; Yang, Y. The Kuroshio east of Taiwan: Moored transport observations from the WOCE PCM-1 array. J. Phys. Oceanogr. 2001, 31, 1031–1053. [Google Scholar] [CrossRef] [Green Version]
- Zhang, D.; Lee, T.N.; Johns, W.E.; Liu, C.T.; Zantopp, R. The Kuroshio east of Taiwan: Modes of variability and relationship to interior ocean mesoscale eddies. J. Phys. Oceanogr. 2001, 31, 1054–1074. [Google Scholar] [CrossRef]
- Jan, S.; Chern, C.S.; Wang, J.; Chao, S.Y. The anomalous amplification of M2 tide in the Taiwan Strait. Geophys. Res. Lett. 2004, 31. [Google Scholar] [CrossRef]
- Takahashi, D.; Guo, X.; Morimoto, A.; Kojima, S. Biweekly periodic variation of the Kuroshio axis northeast of Taiwan as revealed by ocean high-frequency radar. Cont. Shelf Res. 2009, 29, 1896–1907. [Google Scholar] [CrossRef]
- Hsu, P.C.; Zheng, Q.; Lu, C.Y.; Cheng, K.H.; Lee, H.J.; Ho, C.R. Interaction of coastal countercurrent in I-Lan Bay with the Kuroshio northeast of Taiwan. Cont. Shelf Res. 2018, 171, 30–41. [Google Scholar] [CrossRef]
- He, Y.; Hu, P.; Yin, Y.; Liu, Z.; Liu, Y.; Hou, Y.; Zhang, Y. Vertical migration of the along-slope counter-flow and its relation with the Kuroshio intrusion off northeastern Taiwan. Remote Sens. 2019, 11, 2624. [Google Scholar] [CrossRef] [Green Version]
- Yin, Y.; Liu, Z.; Hu, P.; Hou, Y.; Lu, J.; He, Y. Impact of mesoscale eddies on the southwestward countercurrent northeast of Taiwan revealed by ADCP mooring observations. Cont. Shelf Res. 2020, 195, 104063. [Google Scholar] [CrossRef]
- Hsu, P.C.; Lin, C.C.; Huang, S.J.; Ho, C.R. Effects of cold eddy on Kuroshio meander and its surface properties, east of Taiwan. IEEE J. Sel. Top. Appl. Earth Obs. Remote Sens. 2016, 9, 5055–5063. [Google Scholar] [CrossRef]
- Mensah, V.; Jan, S.; Andres, M.; Chang, M.H. Response of the Kuroshio east of Taiwan to mesoscale eddies and upstream variations. J. Oceanogr. 2020, 76, 271–288. [Google Scholar] [CrossRef]
- Hsu, P.C.; Lee, H.J.; Zheng, Q.; Lai, J.W.; Su, F.C.; Ho, C.R. Tide-Induced Periodic Sea Surface Temperature Drops in the Coral Reef Area of Nanwan Bay, Southern Taiwan. J. Geophys. Res. Ocean. 2020, 125, e2019JC015226. [Google Scholar] [CrossRef]
- Hsu, P.C.; Lu, C.Y.; Hsu, T.W.; Ho, C.R. Diurnal to Seasonal Variations in Ocean Chlorophyll and Ocean Currents in the North of Taiwan Observed by Geostationary Ocean Color Imager and Coastal Radar. Remote Sens. 2020, 12, 2853. [Google Scholar] [CrossRef]
- Jan, S.; Wang, J.; Yang, Y.J.; Hung, C.C.; Chern, C.S.; Gawarkiewicz, G.; Lien, R.C.; Luca, C.; Kuo, J.-Y.; Wang, B. Observations of a freshwater pulse induced by Typhoon Morakot off the northern coast of Taiwan in August 2009. J. Mar. Res. 2013, 71, 19–46. [Google Scholar] [CrossRef]
- O’Reilly, J.E.; 24 Coauthors. SeaWiFS Postlaunch Calibration and Validation Analyses, Part 3. In NASA Tech. Memo.; Hooker, S.B., Firestone, E.R., Eds.; 2000-206892; NASA Goddard Space Flight Center, 2000; Volume 11, p. 49. [Google Scholar]
- Elipot, S.; Lumpkin, R.; Perez, R.C.; Lilly, J.M.; Early, J.J.; Sykulski, A.M. A global surface drifter data set at hourly resolution. J. Geophys. Res. Ocean. 2016, 121, 2937–2966. [Google Scholar] [CrossRef]
- Zhang, Y.J.; Ye, F.; Stanev, E.V.; Grashorn, S. Seamless cross-scale modeling with SCHISM. Ocean. Model. 2016, 102, 64–81. [Google Scholar] [CrossRef] [Green Version]
- Tan, S.C.; Yao, X.; Gao, H.W.; Shi, G.Y.; Yue, X. Variability in the correlation between Asian dust storms and chlorophyll a concentration from the north to equatorial Pacific. PLoS ONE 2013, 8, e57656. [Google Scholar] [CrossRef] [Green Version]
- Tan, S.C.; Li, J.; Che, H.; Chen, B.; Wang, H. Transport of East Asian dust storms to the marginal seas of China and the southern North Pacific in spring 2010. Atmos. Environ. 2017, 148, 316–328. [Google Scholar] [CrossRef]
- Talley, L.D.; Nagata, Y.; Fujimura, M.; Iwao, T.; Kono, T.; Inagake, D.; Hirai, M.; Okuda, K. North Pacific intermediate water in the Kuroshio/Oyashio mixed water region. J. Phys. Oceanogr. 1995, 25, 475–501. [Google Scholar] [CrossRef] [Green Version]
- Ichikawa, H.; Chaen, M. Seasonal variation of heat and freshwater transports by the Kuroshio in the East China Sea. J. Mar. Syst. 2000, 24, 119–129. [Google Scholar] [CrossRef]
- Chen, C.T.A.; Wang, S.L. A salinity front in the southern East China Sea separating the Chinese coastal and Taiwan Strait waters from Kuroshio waters. Cont. Shelf Res. 2006, 26, 1636–1653. [Google Scholar] [CrossRef]
- Chen, C.T.A. Chemical and physical fronts in the Bohai, Yellow and East China seas. J. Mar. Syst. 2009, 78, 394–410. [Google Scholar] [CrossRef]
- Qu, B.; Song, J.; Yuan, H.; Li, X.; Li, N. Carbon chemistry in the mainstream of Kuroshio current in eastern Taiwan and its transport of carbon into the east China sea shelf. Sustainability 2018, 10, 791. [Google Scholar] [CrossRef] [Green Version]
Figure 1.
The seabed topography, rivers, and major ocean currents in the study area and adjacent to Yilan Bay. The two arrows show the main ocean currents: the northeastern Taiwan countercurrent (NETCC) and the Kuroshio Current (KC). The four blue lines in the right panel show the main river adjacent to Yilan Bay.

Figure 2.
SPOT-6 level-3 precision corrected images and corresponding GOCI chlorophyll concentrations (mg/m3). (a,d) 8 February 2016 02:00 (UTC), (b,e) 14 August 2019 01:00 (UTC), (c,f) 22 November 2020 02:00 (UTC). SPOT images were provided by the Centre National d’Etudes Spatiales and Center for Space and Remote Sensing Research, National Central University.

Figure 3.
Climatological monthly SST averaged over the period of April 2011–December 2020.

Figure 4.
Climatological chlorophyll concentration averaged over the period of April 2011–December 2020. The colored solid line represents the position of 0.4 mg/m3 chlorophyll concentration contour in each month.
Figure 4.
Climatological chlorophyll concentration averaged over the period of April 2011–December 2020. The colored solid line represents the position of 0.4 mg/m3 chlorophyll concentration contour in each month.

Figure 5.
(a) Climatological chlorophyll averaged over the period of April 2011–December 2020. The brown dots are the rainfall stations, the blue square is the streamflow station, and the dotted line indicates the range used to calculate the chlorophyll concentration. (b) Seasonal variations in rainfall and streamflow from 2011–2020. The dark blue bars are rainfall at stations Yilan and Sansing, and the light blue bars show rainfall at all stations; (c) Seasonal variation in streamflow and chlorophyll concentration from 2011–2020. Detailed results for the streamflow and chlorophyll concentration can be found in Table A1 and Table A2 of Appendix A.

Figure 6.
Four types of drifter trajectory cases. (a) Type-1: northward outside the bay (n = 141); (b) Type-2: southward outside the bay (n = 5); (c) Type-3: southward into the bay (n = 7), and (d) Type-4: northward into the bay (n = 1).
Figure 6.
Four types of drifter trajectory cases. (a) Type-1: northward outside the bay (n = 141); (b) Type-2: southward outside the bay (n = 5); (c) Type-3: southward into the bay (n = 7), and (d) Type-4: northward into the bay (n = 1).

Figure 7.
Drifters that entered the Yilan Bay: (a) ID: 39136; (b) ID: 71337; (c) ID: 82003-1; (d) ID: 82003-2; (e) ID: 82005; (f) ID: 82031; (g) ID: 91681; (h) ID: 63942870, and (i) ID: 63943550.
Figure 7.
Drifters that entered the Yilan Bay: (a) ID: 39136; (b) ID: 71337; (c) ID: 82003-1; (d) ID: 82003-2; (e) ID: 82005; (f) ID: 82031; (g) ID: 91681; (h) ID: 63942870, and (i) ID: 63943550.

Figure 8.
Flow field adjacent to Yilan Bay from 2019–2020: (a) ebb period and (b) flood period. The black dot is Wushi tidal station. The black line is the river.
Figure 8.
Flow field adjacent to Yilan Bay from 2019–2020: (a) ebb period and (b) flood period. The black dot is Wushi tidal station. The black line is the river.

Figure 9.
Flow field adjacent to Yilan Bay from 2019 to 2020 in the ebb tide period. The yellow line is 0.4 mg/m3 chlorophyll concentration contour in each month from Figure 4.
Figure 9.
Flow field adjacent to Yilan Bay from 2019 to 2020 in the ebb tide period. The yellow line is 0.4 mg/m3 chlorophyll concentration contour in each month from Figure 4.

Figure 10.
Flow field adjacent to Yilan Bay from 2019 to 2020 in the flood tide period. The yellow line is 0.4 mg/m3 chlorophyll concentration contour in each month from Figure 4.
Figure 10.
Flow field adjacent to Yilan Bay from 2019 to 2020 in the flood tide period. The yellow line is 0.4 mg/m3 chlorophyll concentration contour in each month from Figure 4.

Figure 11.
Probability density distributions (%) of the virtual particle drift trajectories in July (a–g) and February (h–n). The green and black lines in panel (a) are examples of drift trajectories.
Figure 11.
Probability density distributions (%) of the virtual particle drift trajectories in July (a–g) and February (h–n). The green and black lines in panel (a) are examples of drift trajectories.

Figure 12.
GCOM-C SGLI snapshots of (a) chlorophyll concentration (mg/m3) and (b) SST (°C) at 10:23 (UTC + 8) on 4 October 2019. (c–j) GOCI chlorophyll concentration from 08:00–15:00 (UTC + 8) on 4 October 2019 with flow field simulation from the CWB model.
Figure 12.
GCOM-C SGLI snapshots of (a) chlorophyll concentration (mg/m3) and (b) SST (°C) at 10:23 (UTC + 8) on 4 October 2019. (c–j) GOCI chlorophyll concentration from 08:00–15:00 (UTC + 8) on 4 October 2019 with flow field simulation from the CWB model.

Figure 13.
Historical hydrological database grid points of the (a) 12 areas adjacent to Yilan Bay and (b) climatological annual T-S diagram. Climatological seasonal T-S diagrams and temperature-depth and salinity-depth profile of areas (c) A3, (d) B2, and (e) B3. The definitions of the water masses are based on previous studies [29,30,31,32,33].

Publisher’s Note: MDPI stays neutral with regard to jurisdictional claims in published maps and institutional affiliations. |
© 2021 by the authors. Licensee MDPI, Basel, Switzerland. This article is an open access article distributed under the terms and conditions of the Creative Commons Attribution (CC BY) license (https://creativecommons.org/licenses/by/4.0/).
Share and Cite
MDPI and ACS Style
Hsu, P.-C.; Lee, H.-J.; Lu, C.-Y. Impacts of the Kuroshio and Tidal Currents on the Hydrological Characteristics of Yilan Bay, Northeastern Taiwan. Remote Sens. 2021, 13, 4340. https://doi.org/10.3390/rs13214340
AMA Style
Hsu P-C, Lee H-J, Lu C-Y. Impacts of the Kuroshio and Tidal Currents on the Hydrological Characteristics of Yilan Bay, Northeastern Taiwan. Remote Sensing. 2021; 13(21):4340. https://doi.org/10.3390/rs13214340
Chicago/Turabian StyleHsu, Po-Chun, Hung-Jen Lee, and Ching-Yuan Lu. 2021. "Impacts of the Kuroshio and Tidal Currents on the Hydrological Characteristics of Yilan Bay, Northeastern Taiwan" Remote Sensing 13, no. 21: 4340. https://doi.org/10.3390/rs13214340
Note that from the first issue of 2016, this journal uses article numbers instead of page numbers. See further details here.