
The Fusion Strategy of 2D and 3D Information Based on Deep Learning: A Review

 , ,
, ,
Abstract
:1. Introduction
- (1)
- This is the first comprehensive review of deep-learning-based fusion strategies that integrate the 2D and 3D information for segmentation and detection.
- (2)
- Providing a novel taxonomy for the fusion strategies categorization.
- (3)
- Including the suitable datasets as comprehensively as possible, which covers the RGBD datasets, fine-grained 3D model dataset, and the dataset including the registered point cloud and images.
- (4)
- Including the most up-to-date (2004–2021) methods and their comparative summaries.
- (5)
- Providing open challenges and promising directions for future research.
2. Terminology and Background
2.1. Deep Learning Based on Image
2.1.1. CNN-Based Image Classification
2.1.2. Detection
- Region-proposal-based Method
- 2.
- Regression/Classification-based Method
2.1.3. Segmentation
- Post Processing
- 2.
- Hierarchical Feature Fusion Strategy
- (1)
- Early fusion strategy
- (2)
- Late-fusion strategy
- 3.
- Dilated Convolutions
2.2. Deep Learning on Point Cloud
2.2.1. Classification
- Multi-View-based Method
- 2.
- Voxel-based Method
- 3.
- Point-based Method
2.2.2. Detection
- Proposal-based Method
- 2.
- Proposal-free Method
2.2.3. Segmentation
- 1.
- Semantic Segmentation
- (1)
- Multi-view-based Method
- (2)
- Voxel-based Method
- (3)
- Point-based Method
- 2.
- Instance Segmentation
- (1)
- Proposal-based Method
- (2)
- Proposal-free Method
3. Dataset
3.1. RGBD Dataset
3.1.1. Indoor Dataset
- Dataset Proposed by Lai et al. [82] for 2D Object Detection
- 2.
- Dataset Proposed by Koppula et al. [83] for 3D Semantic Segmentation
- 3.
- Berkeley Dataset Proposed by Janoch et al. [84] for Object Detection
- 4.
- The MPII Multi-Kinect Dataset Proposed by Susanto et al. [85] for 3D Object Detection
- 5.
- 6.
- Dataset Proposed by Zhang et al. [88] for 2D Object Detection
- 7.
- SUN3D Proposed by Xiao et al. [89] for both 2D and 3D Object Detection and Segmentation
- 8.
- Synthetic RGB-D Scenes Dataset [90] Generated by CAD Models with Fine-Grained Texture for Segmentation, Which Proposed by Lai et al.
- 9.
- SUN RGB-D Proposed by Song et al. [91] for Scene Classification, 2D and 3D Object Detection, Semantic Segmentation
- 10.
- ViDRILO Proposed by Martinez-Gomez et al. [92] for Scene Classification, Object Detection, Semantic Segmentation, Localization, 3D Reconstruction, and Data Compression.
- 11.
- SceneNN Proposed by Hua et al. [93] for Segmentation (Intrinsic Decomposition) and Shape Complement
- 12.
- 13.
- Multiview RGB-D Dataset proposed by Georgakis et al. [96] for 2D and 3D object detection
- 14.
- Matterport3D proposed by Chang et al. [97] for 2D and 3D semantic segmentation
3.1.2. Hybrid Data
- Stanford dataset proposed by Tombari et al. [98] for segmentation
- 2.
- DIODE proposed by Vasiljevic et al. [99] for semantic and object detection
3.2. 3D Dataset with 2D Information
3.2.1. Indoor
- S3DIS proposed by Armeni et al. [100] for semantic segmentation and 3D object recognition
- 2.
- Joint 2D–3D-Semantic proposed by Armeni et al. [101] for scene classification, semantic segmentation, and 3D object detection
- 3.
- ScanNet proposed by Dai et al. [102] for scene classification, object detection, and semantic segmentation
- 4.
- Dataset proposed by Sun et al. [103] for visual place recognition and localization
- 5.
- ShapeNet proposed by Chang et al. [104] for geometric analysis
- 6.
- ScanObjectNN proposed by Uy et al. [105] for object classification
3.2.2. Outdoor
- 2.
- nuScenes proposed by Caesar et al. [111] for 3D object detection and tracking
- 3.
- Swiss3DCities proposed by Can et al. [112] for 3D semantic segmentation
- 4.
- A2D2 proposed by Geyer et al. [113] for 3D object detection, semantic segmentation, and instance segmentation
- 5.
- Toronto-3D proposed by Tan et al. [114] for 3D semantic segmentation
- 6.
- Semantic3D.Net proposed by Hackel et al. [115] for 3D semantic segmentation
- 7.
- CSPC-Dataset proposed by Tong et al. [116] for semantic segmentation
- 8.
- All-In-One Drive proposed by Weng et al. [117] for 3D object detection, tracking, trajectory prediction, semantic and instant segmentation, depth estimation, and long-range perception
- 9.
- Argoverse proposed by Chang et al. [118] for D objects detection, tracking, and trajectory prediction
- 10.
- ApolloScape proposed by Huang et al. [119] for 3D object detection, semantic and instance segmentation, and 3D reconstruction
- 11.
- Virtual KITTI proposed by Gaidon et al. [120] for 3D object detection, tracking, and semantic and instance segmentation
- 12.
- Dataset proposed by Fang et al. [121] for 3D object classification, detection, semantic segmentation
3.3. Comparative Analysis
3.3.1. Indoor
3.3.2. Outdoor
4. Fusion Strategy
4.1. Segmentation
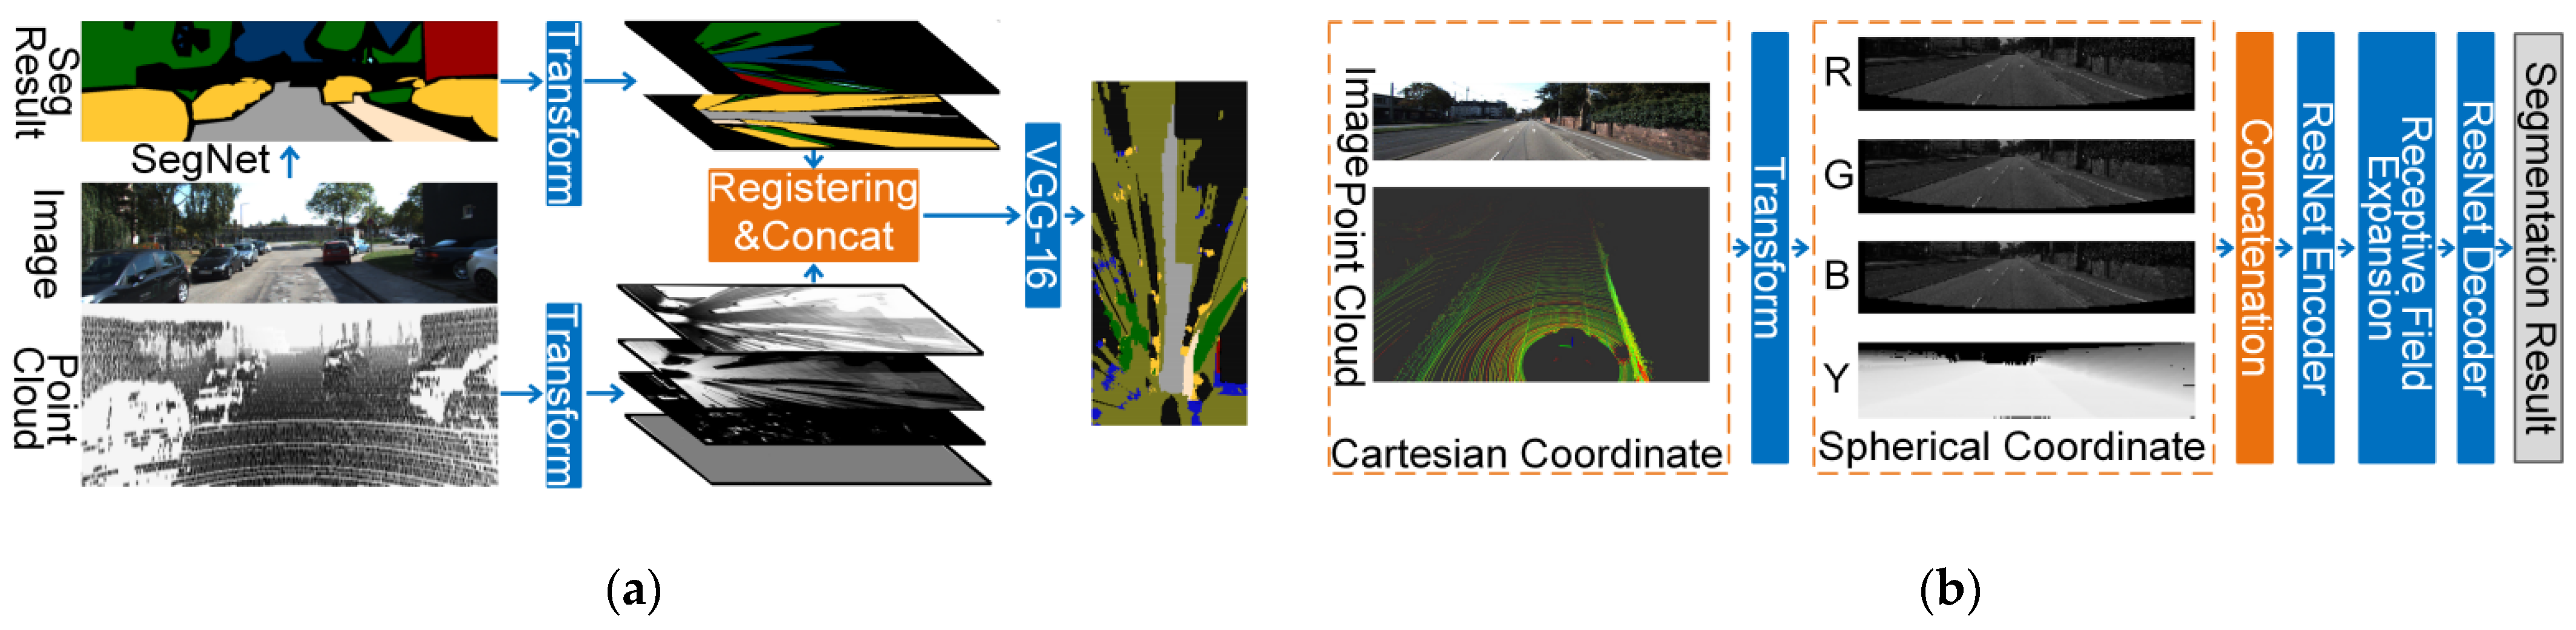
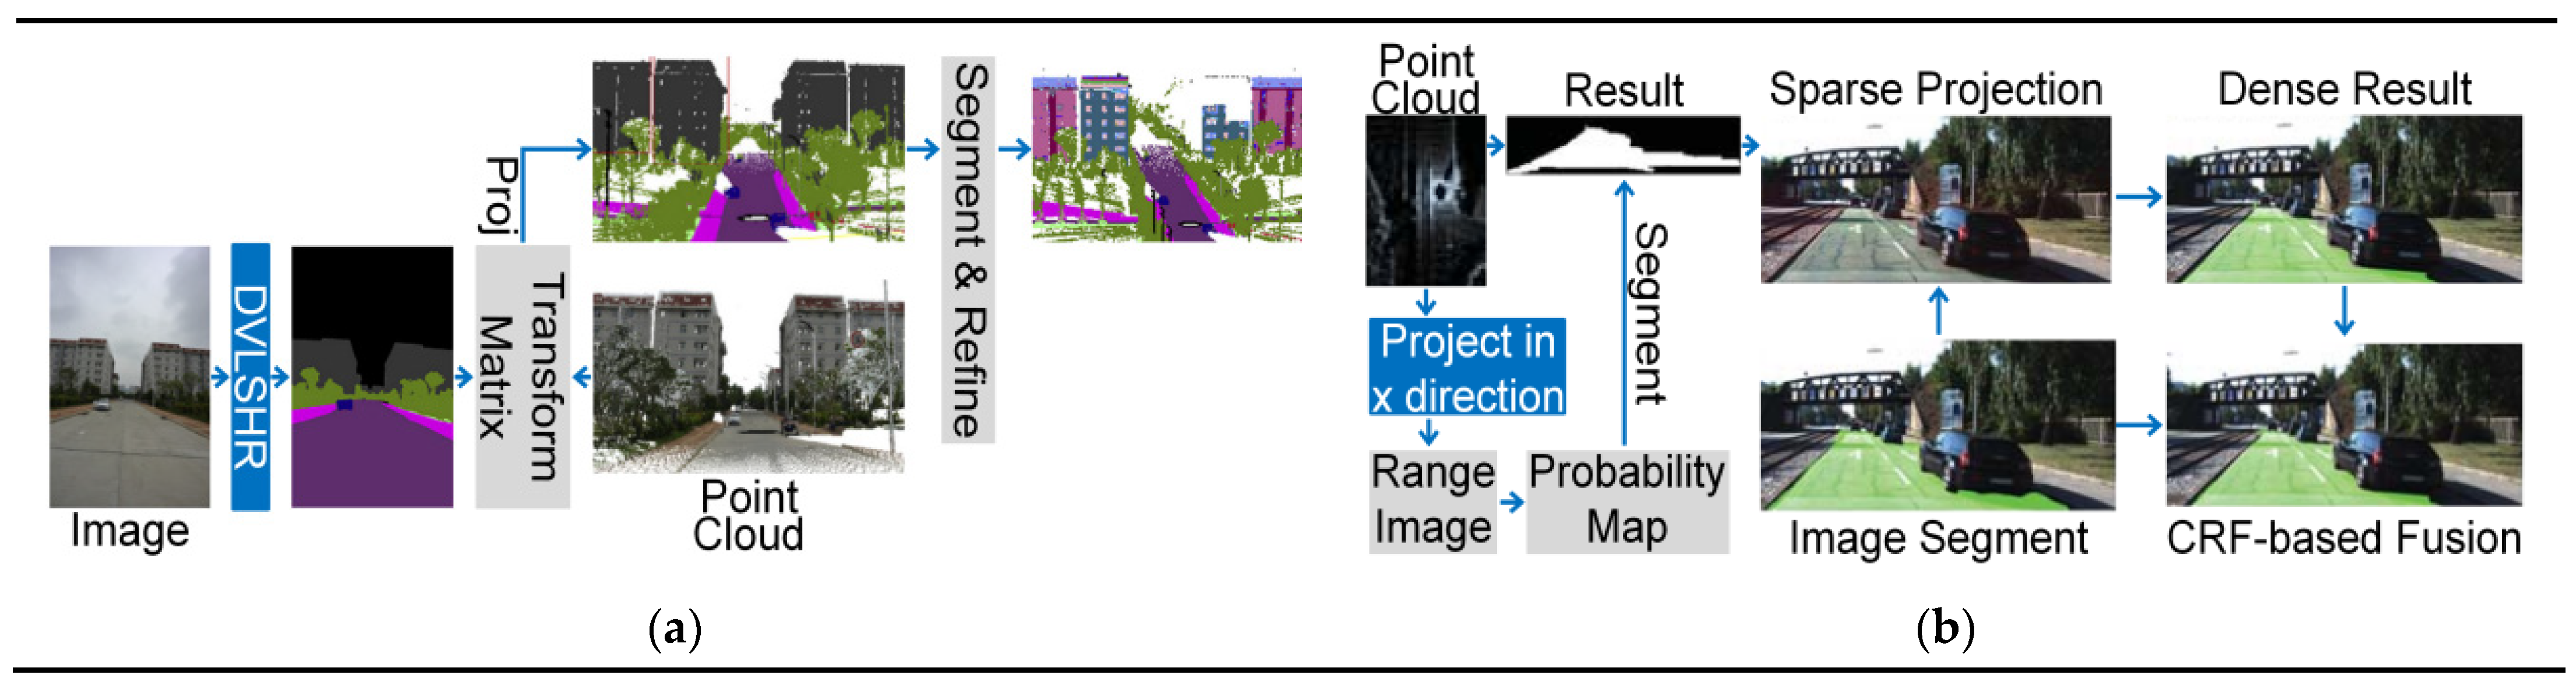
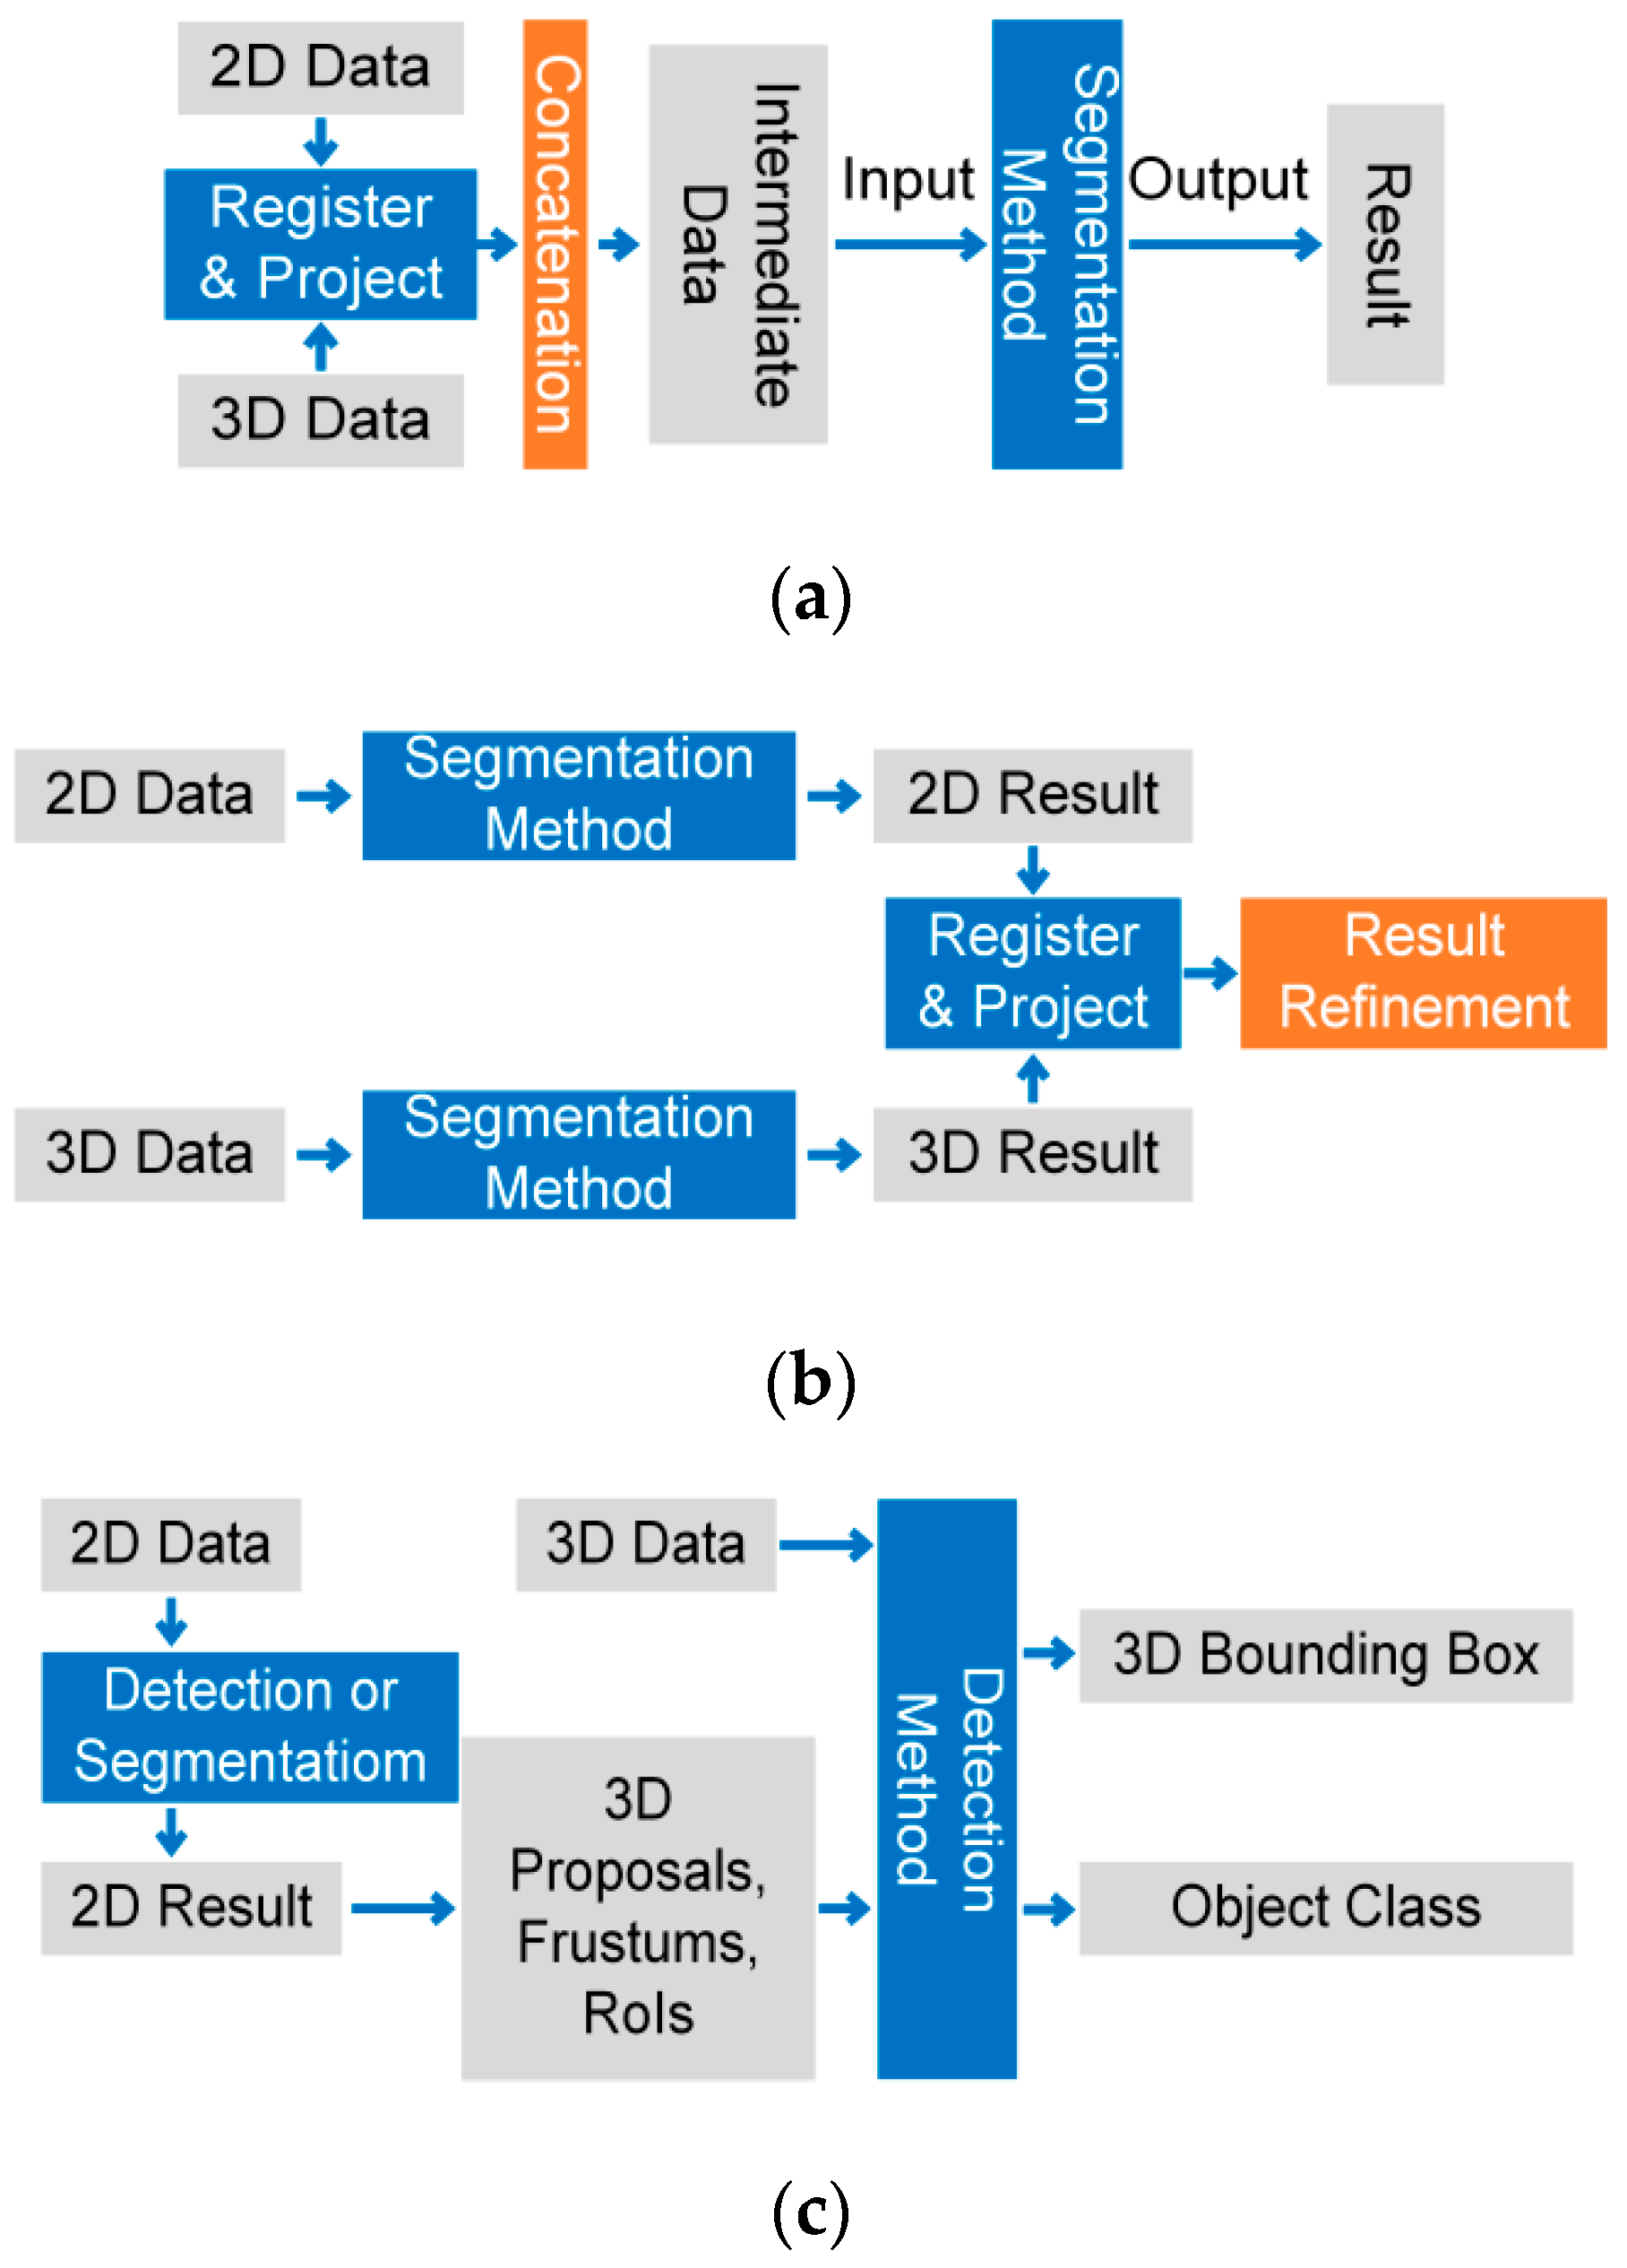
4.1.1. Data-based Fusion Strategy
4.1.2. Result-Based Fusion Strategy

| Name | Raw Data | Data 2 | Data Set | Acc | Class Acc | AP | IoU | F1-Score | Scene | Code | |
|---|---|---|---|---|---|---|---|---|---|---|---|
| [148] | _ | RGB,P | Mesh | CamVid | _ | 61.1 | _ | _ | _ | Outdoor | No |
| [144] | IDA-FCNN | RGB,P | BEV | KITTI | _ | _ | 92.7 | _ | 96.4 | Outdoor | No |
| [147] | DVLSHR | RGB,P | DVLSHR | City-Scapes | 74.9 | _ | _ | 64.2 | _ | Outdoor | No |
| [145] | LC-CRF | RGB,P | BEV | KITTI | _ | _ | 92.1 | _ | 97.1 | Outdoor | No |
| [146] | PanopticFusion | RGBD | Voxel | ScanNet | _ | 52.9 | _ | _ | _ | Indoor | No |
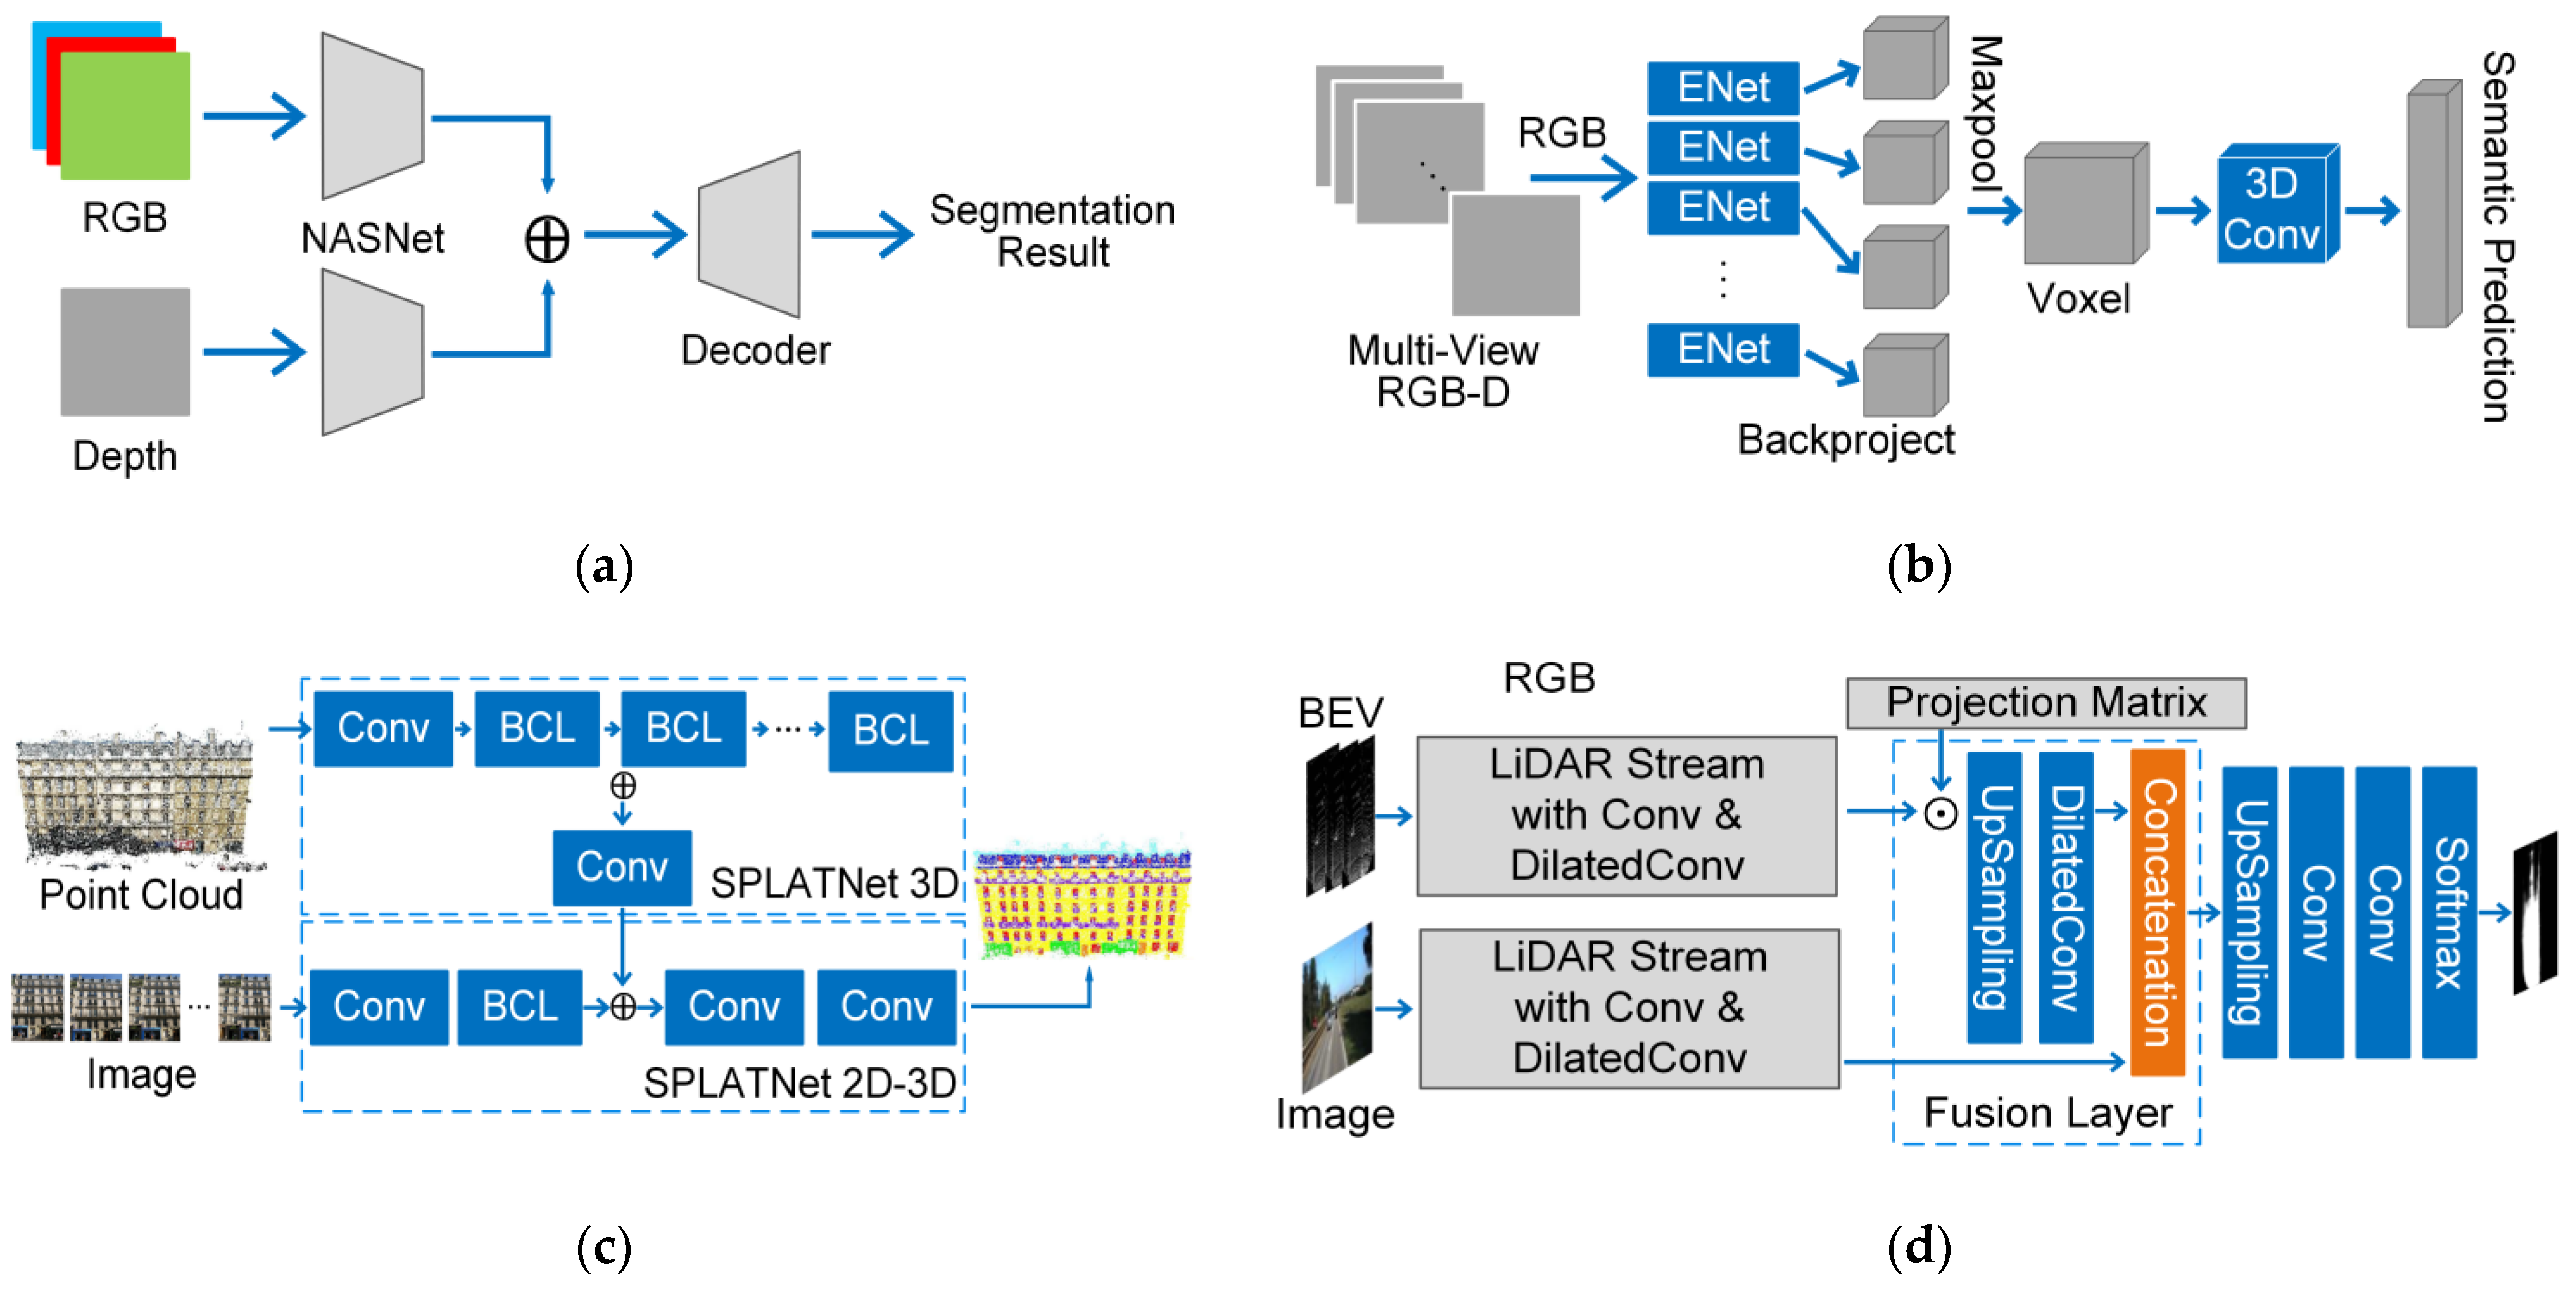
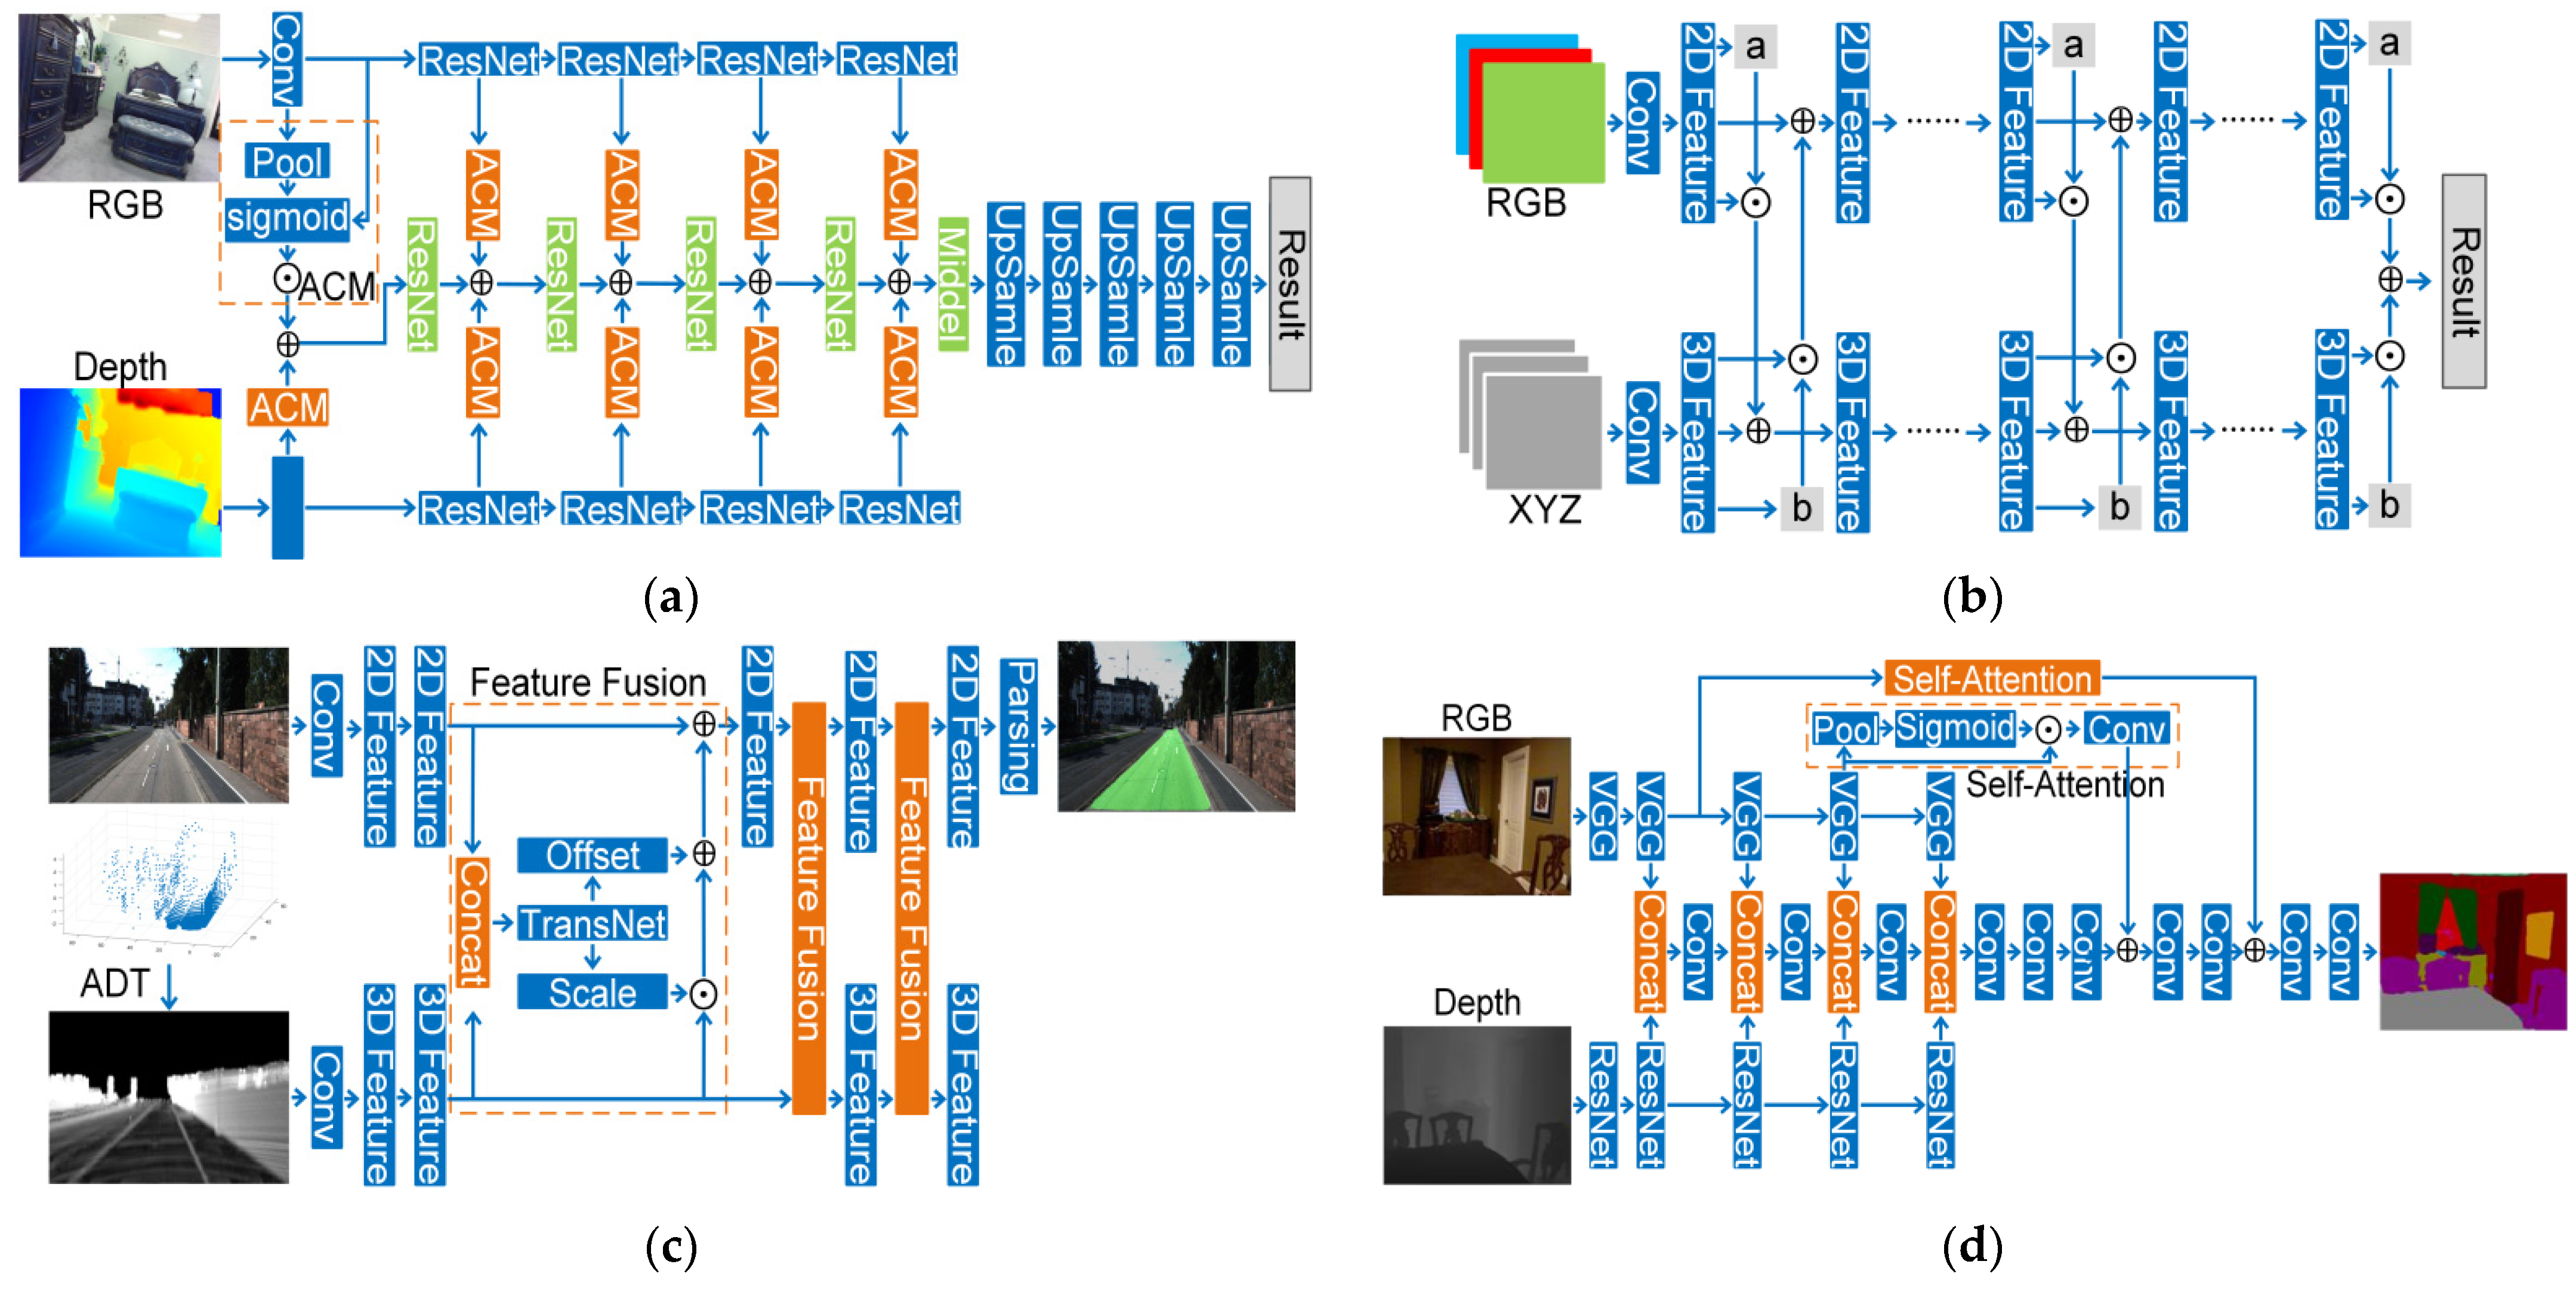
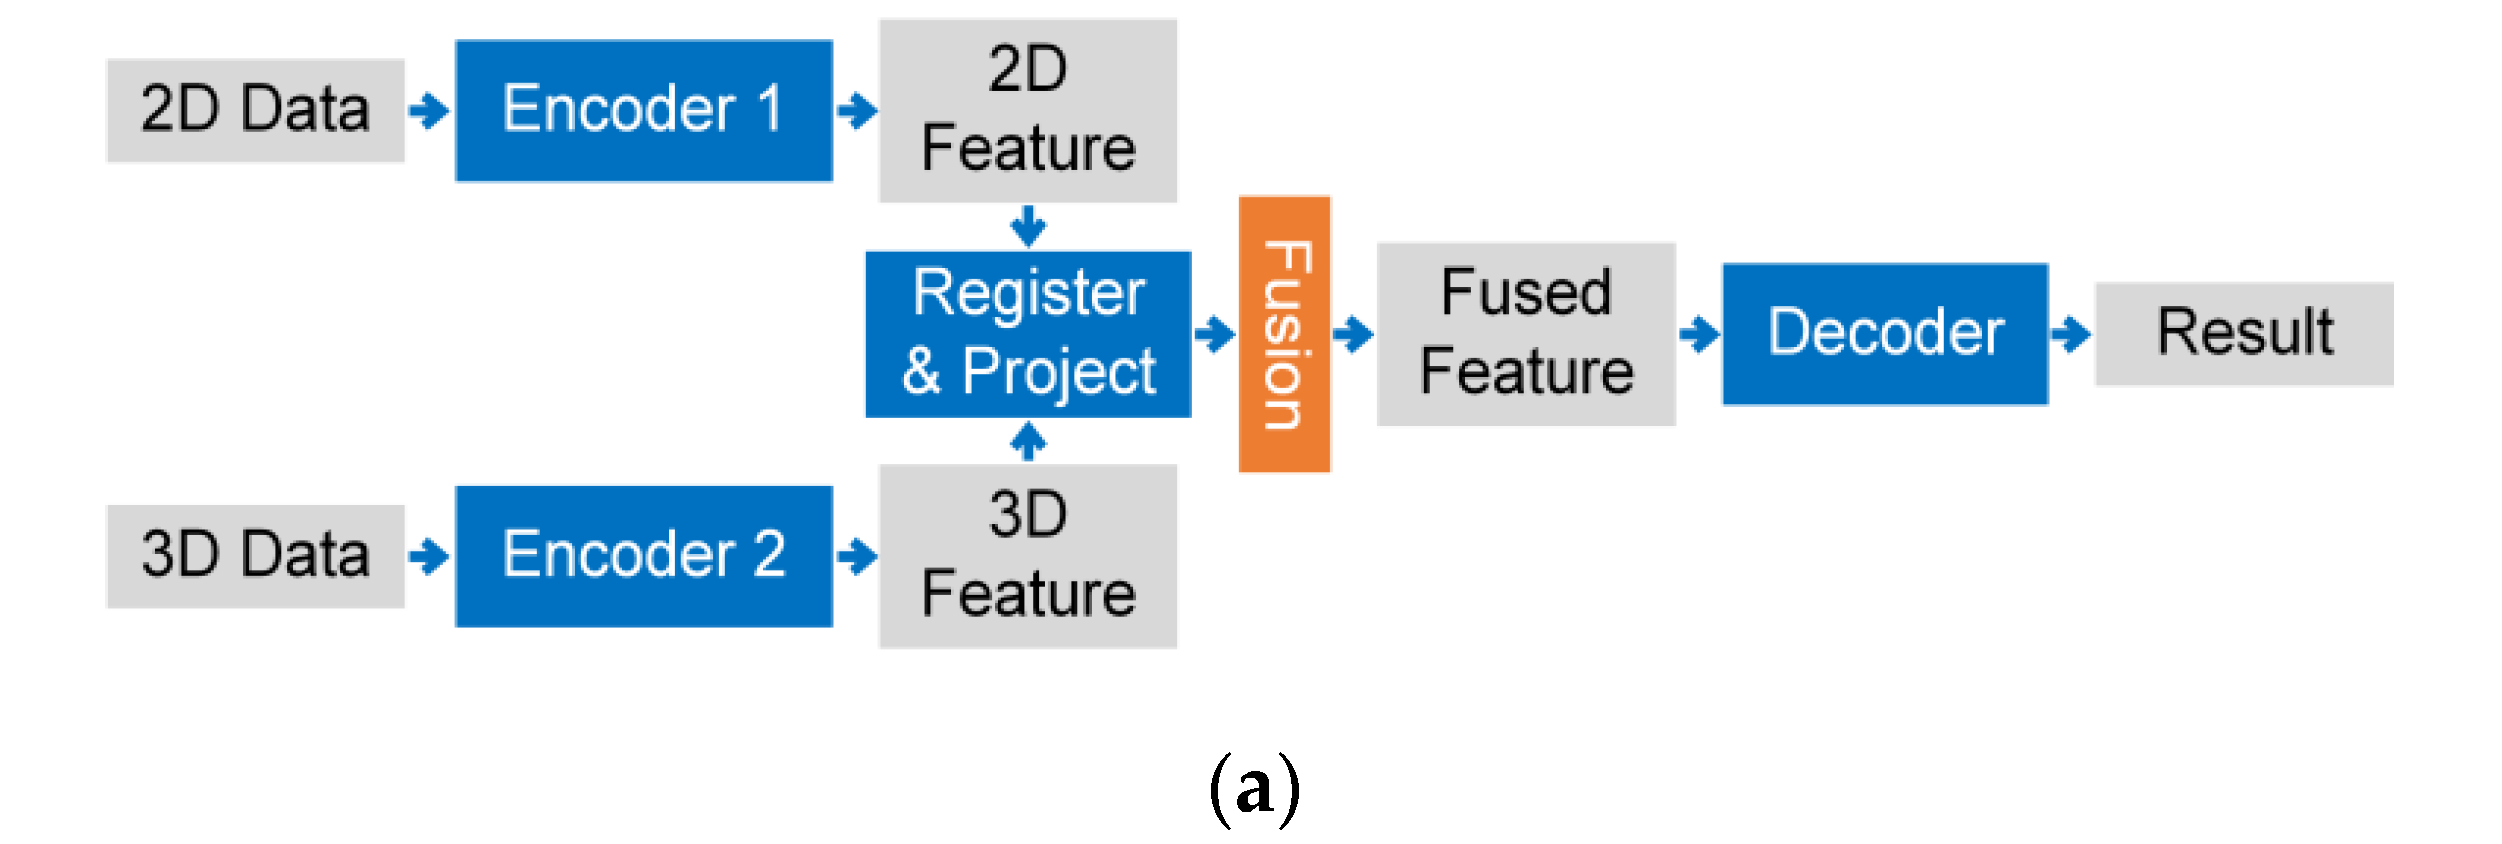
4.1.3. Feature-Based Fusion Strategy
- One-stage Fusion Strategy
- (1)
- RGBD images
- (2)
- Point Cloud Registered with RGB Images
- 1.
- Multi-Stage Fusion Strategy
- (1)
- RGBD Images
- (2)
- Point Cloud with 2D Images
- 2.
- Cross-Level Fusion Strategy
- (1)
- RGBD
- (2)
- Point Cloud Registered with Images
- 3.
- Others
- (1)
- RGBD Images
- (2)
- Point Cloud Registered with Images
| Name | Fusion Strategy | Data | Data 2 | Data Set | Acc | Class Acc | AP | IoU | F1-Score | Scene | Code | |
|---|---|---|---|---|---|---|---|---|---|---|---|---|
| [150] | _ | One-stage | RGBD | _ | NYUD2 | _ | 35.1 | 32.5 | _ | _ | Indoor | Available |
| [149] | _ _ | One-stage | RGBD | Graph HHA | NYUD v2 SUN RGBD | _ _ | 57 52.5 | _ _ | 43.6 40.2 | _ _ | Indoor | No |
| [151] | _ | One-stage | RGBD | _ | Synthia Cityscapes | _ | _ _ | _ _ | 70.7 57.8 | _ _ | Outdoor | No |
| [152] | 3DMV | One-stage | RGBD | Voxel | ScanNet | 71.2 | _ | _ | _ | _ | Indoor | Available |
| [155] | SPLATNet | One-stage | RGB, P | Lattice Indexing | ShapeNet | _ | _ | _ | 83.7 | _ | Indoor | Available |
| [154] | _ | One-stage | RGB, P | BEV | KITTI | _ | _ | 88.5 | _ | 91.4 | Outdoor | No |
| [153] | TSF-FCN | One-stage | RGB, P | BEV | KITTI | _ | _ | 95.4 | _ | 95.42 | Outdoor | No |
| [156] | MVP-Net | One-stage | RGB, P | _ | ScanNet | _ | _ | 64.1 | _ | Indoor | No | |
| [161] | BiFNet | Multi-stage | RGB, P | BEV | KITTI | _ | _ | 95.8 | _ | 97.88 | Outdoor | No |
| [157] | LSTM-CF | Multi-stage | RGBD | HHA | NYUD v2 SUN RGBD | _ | 49.4 48.1 | _ | _ | _ | Indoor | No |
| [158] | _ | Multi-stage | RGBD | HHA | NYUD v2 | 70.3 | 51.7 | _ | 41.2 | 54.2 | Indoor | No |
| [159] | 3D-SIS | Multi-stage | RGBD | Voxel | ScanNet | _ | 36.2 | _ | _ | _ | Indoor | No |
| [160] | _ | Multi-stage | RGB, P | BEV | KITTI | _ | — | 96.9 | _ | 95.98 | Outdoor | No |
| [162] | _ | Cross-level | RGBD | HHA | NYUD v2 | _ | 49.9 | _ | 37.4 | 51.2 | Indoor | No |
| [163] | ACNET | Cross-level | RGBD | _ | SUN RGBD NYUD v2 | _ _ | _ _ | _ _ | 48.1 48.3 | _ | Indoor | Available |
| [164] | _ | Cross-level | RGBD | HHA | NLPR | _ | _ | _ | _ | 86.2 | Outdoor | No |
| [165] | TSNet | Cross-level | RGBD | _ | NYUD v2 | 73.5 | 59.6 | _ | _ | 46.1 | Indoor | No |
| [166] | Floor-Net | Cross-level | RGB, P | Voxel | Self-collected | _ | 57.8 | _ | _ | Outdoor | Available | |
| [167] | _ | Cross-level | RGB, P | _ | KITTI | _ | _ | 96.2 | _ | 96.25 | Outdoor | No |
| [168] | _ | Cross-level | RGB, P | Voxel | Self-collected | _ | _ | 74.7 | _ | Outdoor | No | |
| [170] | PLARD | Cross-level | RGB, P | ADT | KITTI | _ | _ | _ | _ | 97.77 | Outdoor | No |
| [169] | _ | Cross-level | 3D Mesh | Voxel, Mesh | ScanNet | _ | _ | _ | 63.4 | _ | Indoor | Available |
| [171] | RPV-Net | Cross-level | RGB, P | Voxel | Semantic- KITTI | _ | _ | _ | 70.3 | _ | Outdoor | No |
| [172] | _ | Others | RGBD | _ | NYUD v2 | _ | _ | _ | 46.1 | _ | Indoor | No |
| [173] | _ | Others | RGB, P | _ | RueMonge | _ | 61.4 | _ | _ | _ | Outdoor | No |
4.2. Detection
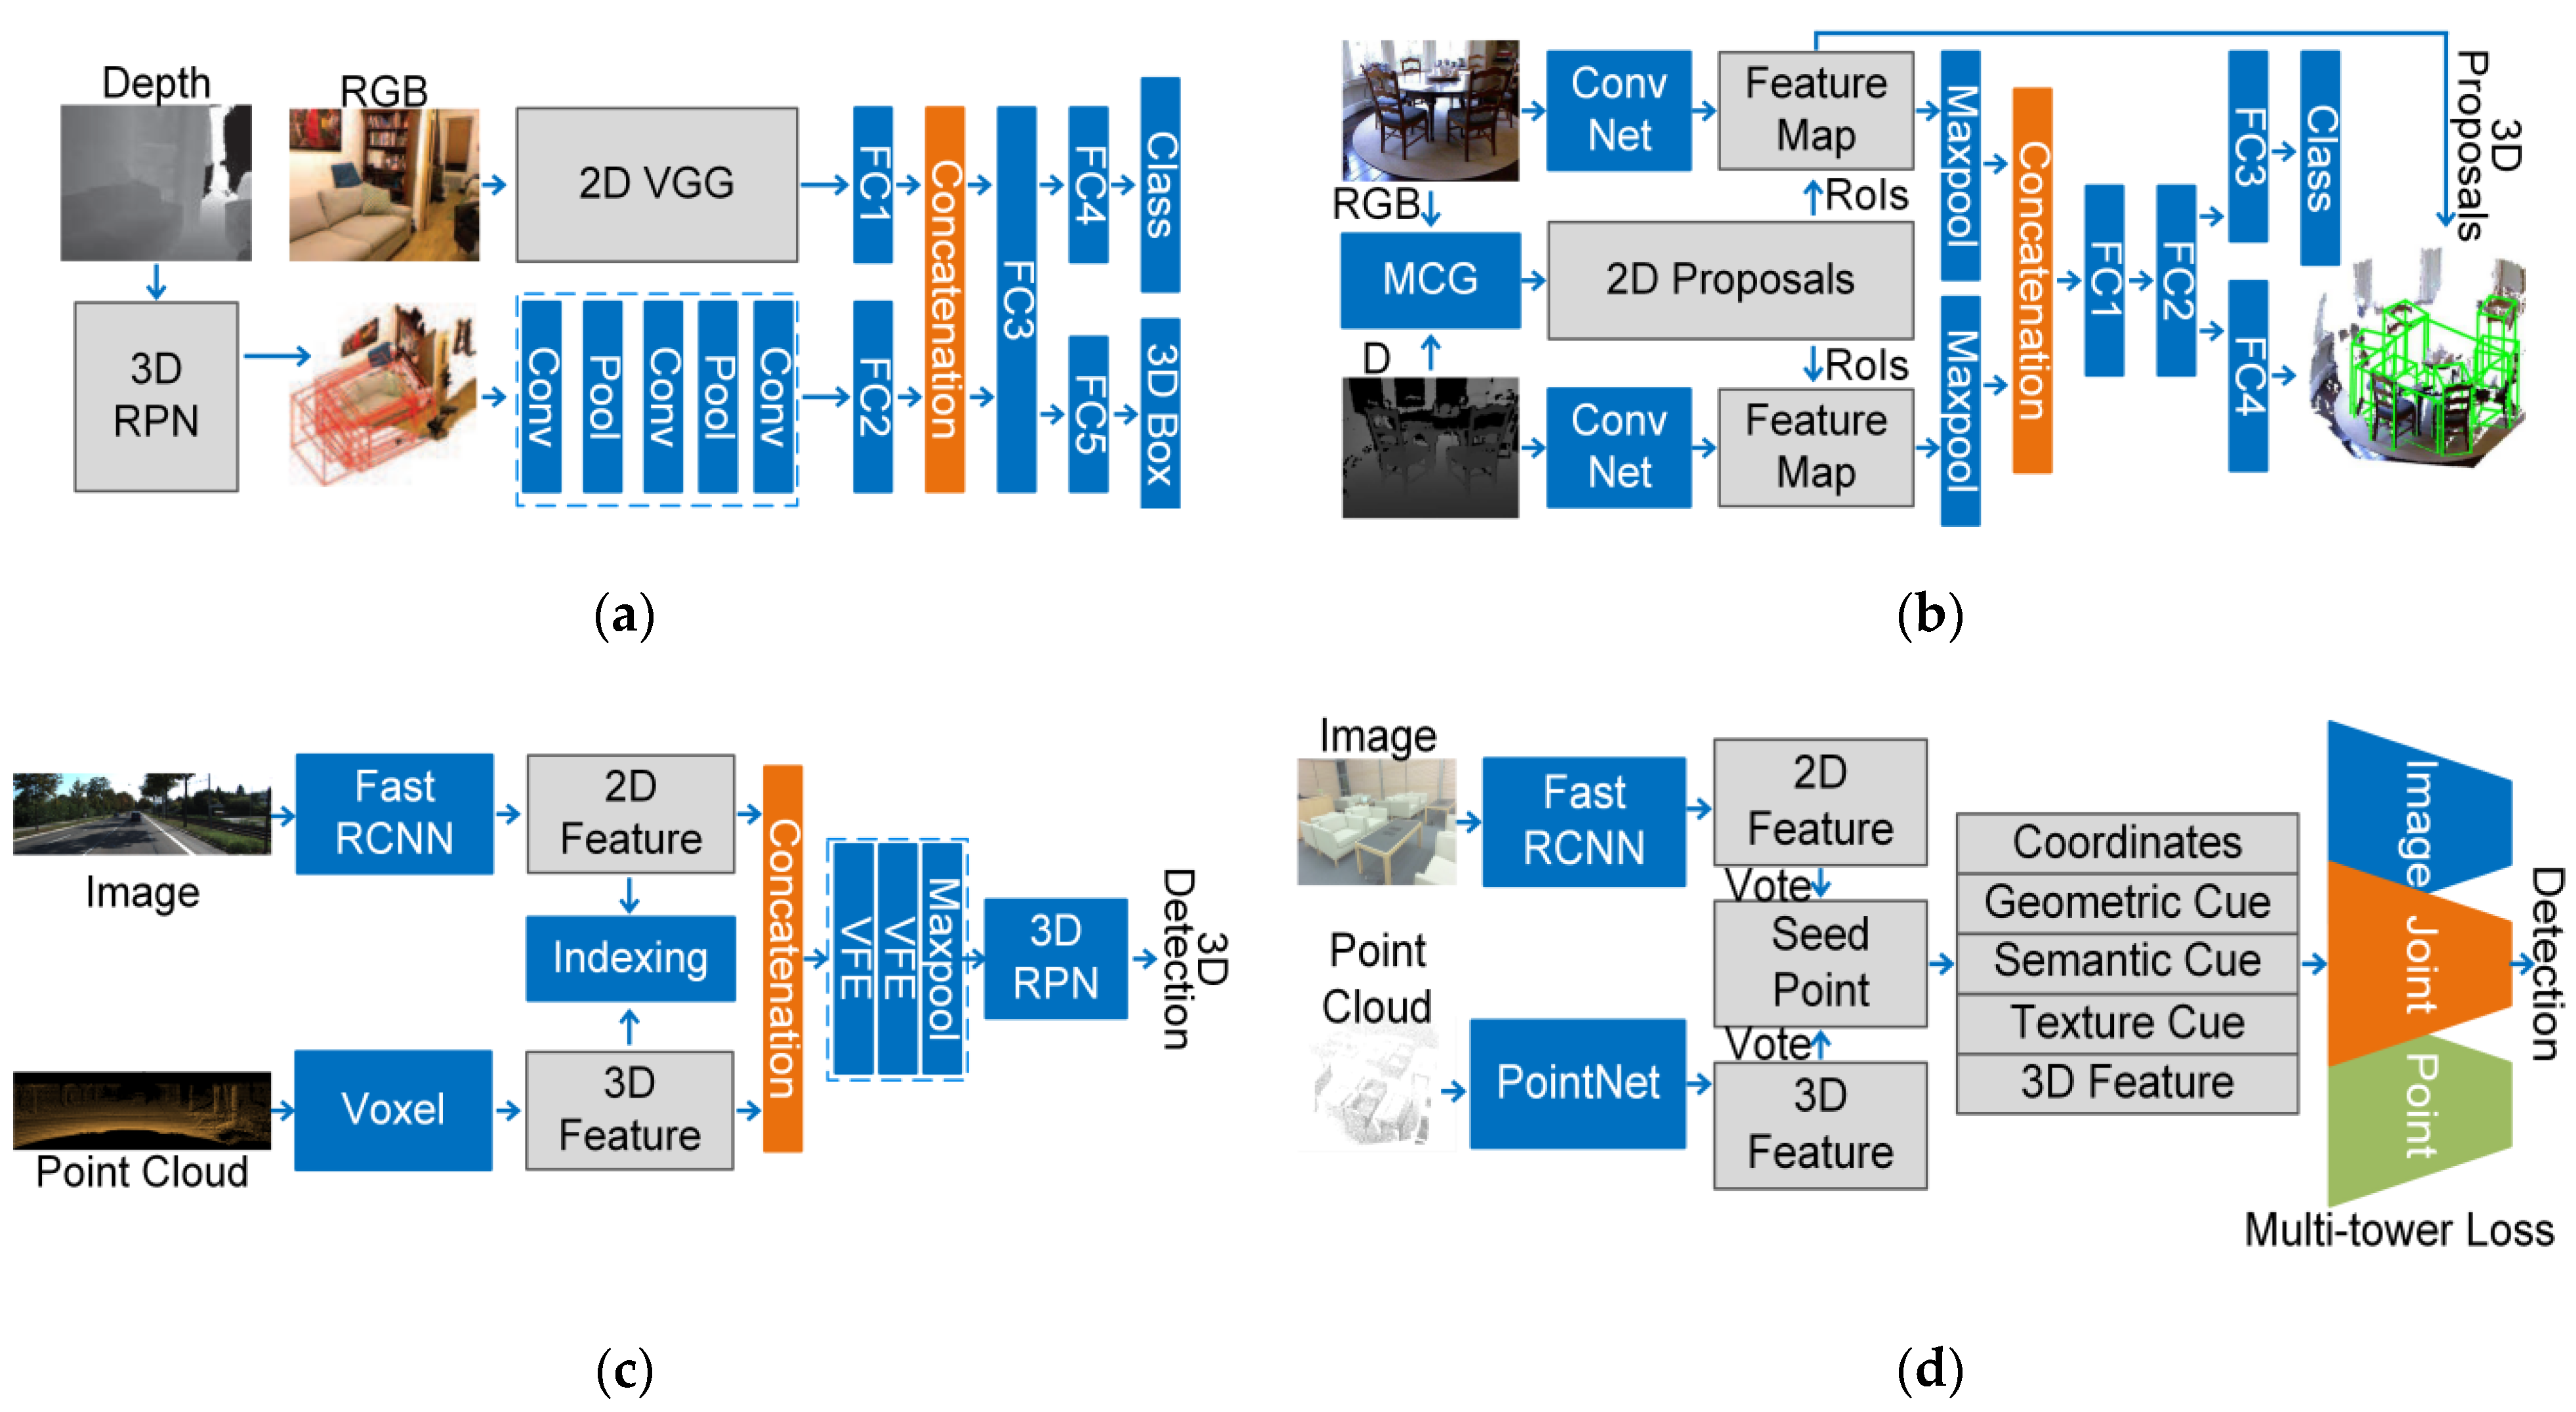
4.2.1. Data–Result-Based Fusion Strategy
| Name | Task | Data | Data 2 | Dataset | IoU Threshold | AP | Scene | Code | |
|---|---|---|---|---|---|---|---|---|---|
| [178] | _ | 3D Det | RGBD | Graph | SUN RGBD | 0.25 | 45.12 | Indoor | No |
| [180] | F-PointNet | 3D Det | RGBD | _ | KITTI | 0.7 car 0.5 ped. 0.5 cyc. 0.25 | 71.26 45.44 59.71 54 | Outdoor | No |
| SUN RGBD | Indoor | ||||||||
| [174] | _ | 2D Det | RGB, P | Voxel | GTSRB | _ | 99.71 | Outdoor | No |
| [184] | IPOD | 2D Det 3D BEV Det 3D Det | RGB, P | _ | KITTI | 0.7 | 88.96 82.92 72.88 | Outdoor | No |
| [175] | _ | 2D Det | RGB, P | Voxel | Self-collected | 93.3 | Outdoor | No | |
| [176] | _ | 2D BEV Det | RGB, P | — | KITTI | 0.7 | 80.64 | Outdoor | No |
| [179] | PC-CNN | 3D Det | RGB, P | BEV | KITTI | 0.5 0.7 | 82.09 53.59 | Outdoor | No |
| 3D BEV Det | 0.5 0.7 | 83.89 76.86 | |||||||
| MC-CNN | 3D Det | 0.5 0.7 | 84.65 54.32 | ||||||
| 3D BEV Det | 0.50.7 | 87.86 77.91 | |||||||
| [177] | _ | 2D Det | RGB, P | Voxel | Self-collected | _ | 95.7 | Outdoor | No |
| [181] | SiFRNet | 3D Det | RGB, P | BEV | SUN RGBD | 0.25 | 58.4 | Indoor | No |
| KITTI | overall 0.7 car 0.5 ped. 0.5 cyc. | 66.99 73.95 61.05 65.97 | Outdoor | ||||||
| [182] | Frustum ConvNet | 3D Det | RGB, P | _ _ | SUN RGBD | 0.25 | 57.55 | Indoor | Available |
| KITTI | 0.7 car 0.5 ped. 0.5 cyc. | 76.82 46.49 67.1 | Outdoor | ||||||
| [183] | RoarNet | 3D Det | RGB, P | _ | KITTI | 0.7 | 72.77 | Outdoor | No |
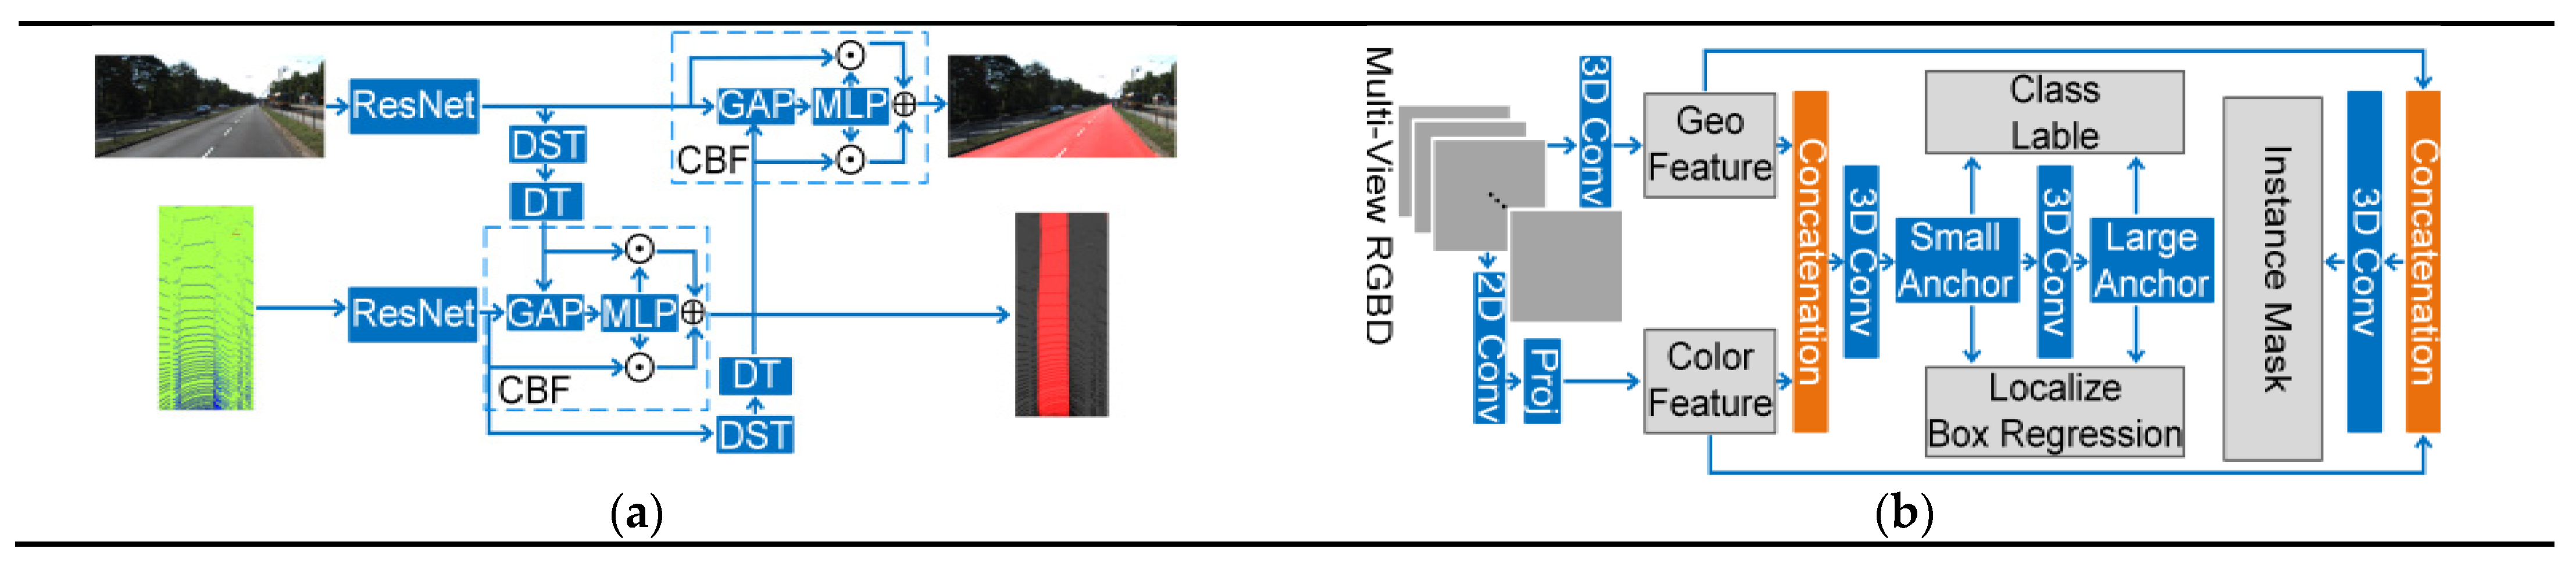
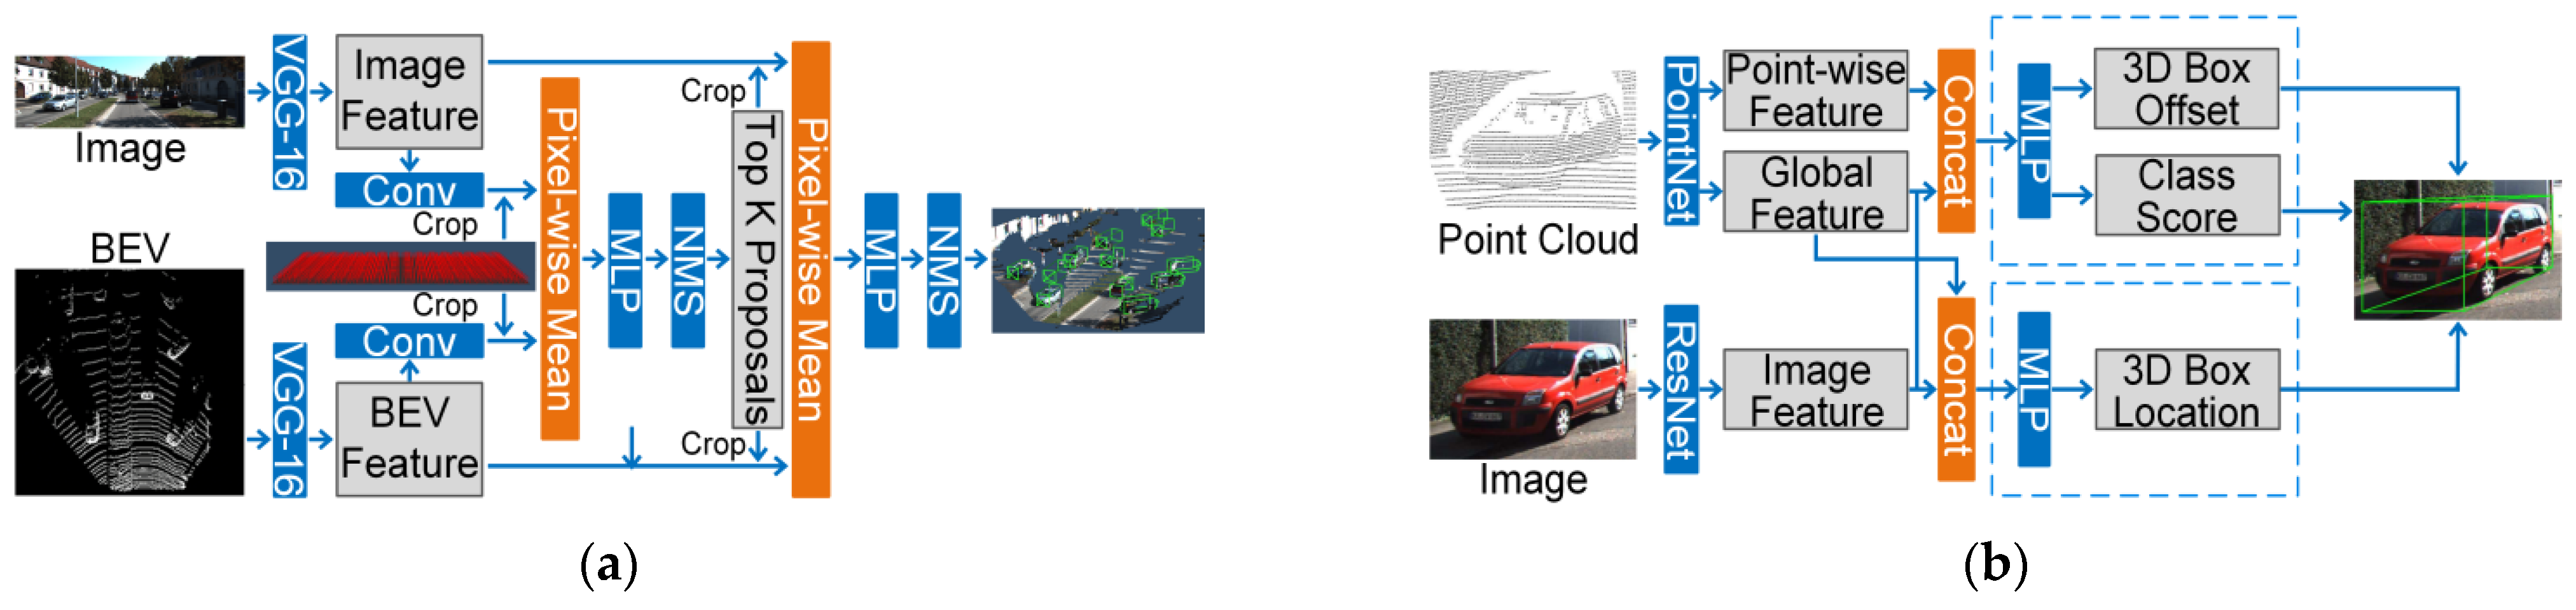
4.2.2. Feature-Based Fusion Strategy
- 1.
- One-stage Fusion Strategy
- (1)
- RGBD Images
- (2)
- Point Cloud Registered with Images
- 2.
- Multi-stage Fusion Strategy
- (1)
- RGBD Images
- (2)
- Point Cloud Registered with Images
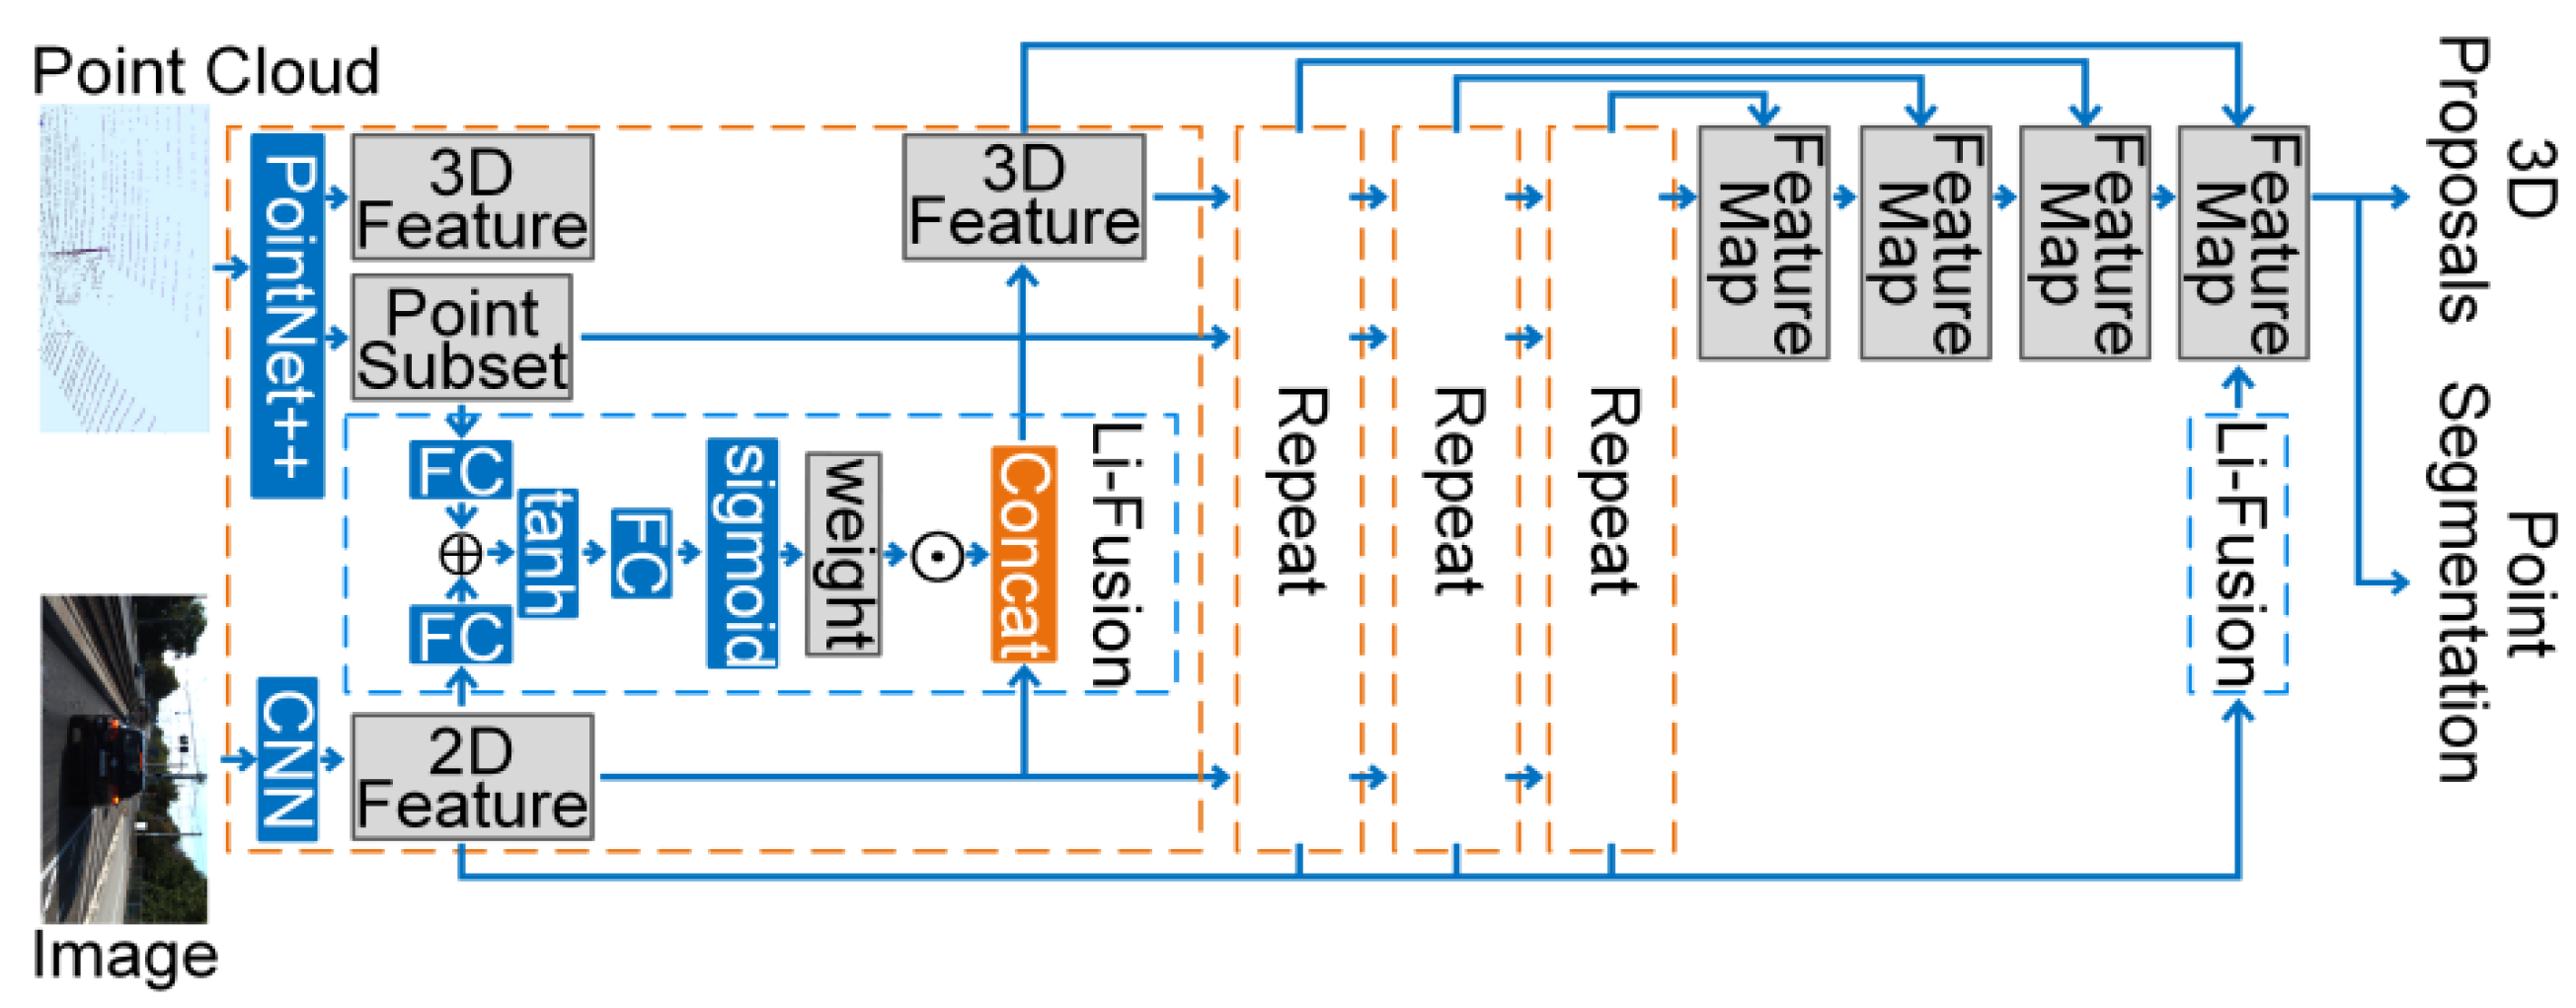
- 3.
- Cross-Level Fusion Strategy
| Name | Task | Fusion Strategy | Data | Data 2 | Dataset | IoU Threshold | AP | Scene | Code | |
|---|---|---|---|---|---|---|---|---|---|---|
| [186] | PRN | 3D Det | One-stage | RGBD | _ | SUN RGBD | 0.25 | 26.9 | Indoor | No |
| [187] | _ | 3D Det | One-stage | RGBD | _ | NYUD v2 | 0.25 | 40.9 | Indoor | Available |
| [188] | _ | 3D Det | One-stage | RGB, P | Voxel | KITTI | 0.5 | 26 | Outdoor | No |
| [189] | HDNet | 3D Det | One-stage | RGB, P | BEV | KITTI | 0.7 | 84.7 | Outdoor | No |
| [190] | MVX-Net | 3D Det 3D BEV Det | One-stage | RGB, P | Voxel | KITTI | 0.7 | 73.7 84.4 | Outdoor | No |
| [192] | MVF | 3D Det | One-stage | P | PV,BEV Voxel | Waymo | 0.7 car 0.5 ped. | 62.9 65.3 | Outdoor | No |
| 3D BEV Det | 0.7 car 0.5 ped. | 80.4 74.4 | ||||||||
| [191] | ImVoteNet | 3D Det | One-stage | RGB, P | SUN RGBD | 0.25 | 63.4 | Indoor | No | |
| [193] | _ | 2D Det | Multi-stage | RGB | P,FV | KITTI | 0.7 | 84.9 | Outdoor | Available |
| Orientation | 84.6 | |||||||||
| 3D BEV Det | 10.5 | |||||||||
| 3D Det | 5.7 | |||||||||
| [194] | MV3D | 3D Det | Multi-stage | RGB, P | BEV,FV | KITTI | 0.25 0.5 0.7 | 91.7 91.2 63.5 | Outdoor | No |
| 2D Det | 0.7 | 85.4 | ||||||||
| [195] | _ | 3D Det | Multi-stage | RGB, P | BEV | KITTI | 0.7 | 70.9 | Outdoor | No |
| 2D BEV Det | 84.0 | |||||||||
| [200] | AVOD | 3D Det | Multi-stage | RGB, P | BEV | KITTI | 0.7 car 0.5 ped. 0.5 cyc. | 73.4 44.8 54.3 | Outdoor | Available |
| 3D BEV Det | 0.7 car 0.5 ped. 0.5 cyc. | 83.4 52.5 58.8 | ||||||||
| [197] | PointFusion | 3D Det | Multi-stage | RGB, P | _ | SUN RGBD | 0.25 | 45.4 | Indoor | No |
| KITTI | 0.7 car 0.5 ped. 0.5 cyc. | 64.7 28.3 35.3 | Outdoor | |||||||
| [198] | _ | 2D Det | Multi-stage | RGB, P | BEV Voxel | KITTI | 0.7 car | 90.2 77.3 85.4 | Outdoor | No |
| 3D Det | ||||||||||
| 3D BEV Det | ||||||||||
| [196] | SCANet | 3D Det | Multi-stage | RGB, P | BEV | KITTI | 0.7 car | 67.0 | Outdoor | No |
| [199] | EPNet | 3D Det | Cross-level | RGB, P | Grid | SUN RGBD | 0.25 | 81.2 | Indoor | Available |
| 3D BEV Det | KITTI | 0.7 car | 88.8 | Outdoor |
4.3. Further Discussion
4.3.1. Non-Feature-Based Fusion Strategy
- Data-Based Fusion Strategy
- 2.
- Result-Based Fusion Strategy
- 3.
- Data–Result-Based Fusion Strategy
4.3.2. Feature-Based Fusion Strategy
- One-Stage Fusion Strategy
- 2.
- Multi-Stage Fusion Strategy
- 3.
- Cross-Level Fusion Strategy
5. Trend, Open Challenges, and Promising Direction
5.1. Trend
- Since the 3D results are more suitable for applications in the real world, more methods tend to achieve segmentation and detection in the 3D domain.
- The feature-based fusion strategy has gained more attention in current research based on the deep learning techniques because the feature fusion may improve the feature extraction and take the better use of both 2D and 3D feature in the deep-learning-based methods. Moreover, the multi-stage and cross-level feature achieved better fusion and accuracy, which may be the trends of future research also.
- There is more and more research aiming to create the methods to achieve multiple tasks at the same time. For example, the combination of detection and segmentation lead to instance-level segmentation. Moreover, the depth or shape completion may be needed along with segmentation and detection for more elaborate results.
- The interpretability of the network has become an area of growing interest and definitively will become the important research point.
5.2. Open Challenges
- Dependency on Dataset
- 2.
- Uncertain Correspondence between 2D and 3D Domain
- 3.
- Open Challenges of fusion strategies
- (1)
- Lack of the Suitable Intermediate Data for Data-based Fusion Strategy
- (2)
- Uncertain Relationship of 2D and 3D Results for Result-based Fusion Strategy
- (3)
- Dependency on the quality of RoIs/Frustums/Proposals for Data–result-based Fusion Strategy
- (4)
- Choosing Suitable Fusion Operation for Feature-based Fusion Strategy
- (5)
- Unknown Effect of Different Fusion Position
- (6)
- Combination of Different Fusion Strategies
- 4.
- Balance the Accuracy and Efficiency
- 5.
- The interpretability of the models
5.3. Promising Direction
- Unsupervised or Weakly supervised Method
- 2.
- Adaptive Transform or Adaption Method Before Projection
- 3.
- The Promising Directions of Fusion Strategies
- (1)
- Better Intermediate Data
- (2)
- Elaborate Correspondence of 2D and 3D Feature Map
- (3)
- Integration of 2D and 3D Proposals/RoIs/Frustums
- (4)
- Ablation Study about Different Fusion Operation
- (5)
- Ablation Study about Different Fusion Position
- (6)
- Integrating the Feature-based and Non-feature-based fusion strategy
- 4.
- More Efficient and Concise Feature Learning Architecture
- 5.
- The Significance of Layers or Feature Vectors
6. Conclusions
Author Contributions
Funding
Institutional Review Board Statement
Informed Consent Statement
Data Availability Statement
Conflicts of Interest
References
- Dong, S.; Wang, P.; Abbas, K. A survey on deep learning and its applications. Comput. Sci. Rev. 2021, 40, 100379. [Google Scholar] [CrossRef]
- Bello, S.A.; Yu, S.; Wang, C.; Adam, J.M.; Li, J. Review: Deep learning on 3D point clouds. Remote. Sens. 2020, 12, 1729. [Google Scholar] [CrossRef]
- Guo, Z.; Huang, Y.; Hu, X.; Wei, H.; Zhao, B. A survey on deep learning based approaches for scene understanding in autonomous driving. Electronics 2021, 10, 471. [Google Scholar] [CrossRef]
- Arshad, S.; Kim, G.-W. Role of deep learning in loop closure detection for visual and lidar SLAM: A survey. Sensors 2021, 21, 1243. [Google Scholar] [CrossRef]
- Yuan, X.; Shi, J.; Gu, L. A review of deep learning methods for semantic segmentation of remote sensing imagery. Expert Syst. Appl. 2021, 169, 114417. [Google Scholar] [CrossRef]
- Wang, J.; Zhu, H.; Wang, S.-H.; Zhang, Y.-D. A review of deep learning on medical image analysis. Mob. Netw. Appl. 2021, 26, 351–380. [Google Scholar] [CrossRef]
- Liu, X.; Song, L.; Liu, S.; Zhang, Y. A review of deep-learning-based medical image segmentation methods. Sustainability 2021, 13, 1224. [Google Scholar] [CrossRef]
- Amanullah, M.A.; Habeeb, R.A.A.; Nasaruddin, F.H.; Gani, A.; Ahmed, E.; Nainar, A.S.M.; Akim, N.M.; Imran, M. Deep learning and big data technologies for IoT security. Comput. Commun. 2020, 151, 495–517. [Google Scholar] [CrossRef]
- Xie, Y.; Tian, J.; Zhu, X.X. Linking points with labels in 3D: A review of point cloud semantic segmentation. IEEE Geosci. Remote. Sens. Mag. 2020, 8, 38–59. [Google Scholar] [CrossRef] [Green Version]
- Minaee, S.; Boykov, Y.Y.; Porikli, F.; Plaza, A.J.; Kehtarnavaz, N.; Terzopoulos, D. Image segmentation using deep learning: A survey. IEEE Trans. Pattern Anal. Mach. Intell. 2021. [Google Scholar] [CrossRef] [PubMed]
- Zhao, Z.-Q.; Zheng, P.; Xu, S.-T.; Wu, X. Object detection with deep learning: A review. IEEE Trans. Neural Netw. Learn. Syst. 2019, 30, 3212–3232. [Google Scholar] [CrossRef] [Green Version]
- Wu, Y.; Wang, Y.; Zhang, S.; Ogai, H. Deep 3D object detection networks using LiDAR data: A review. IEEE Sens. J. 2021, 21, 1152–1171. [Google Scholar] [CrossRef]
- Ming, Y.; Meng, X.; Fan, C.; Yu, H. Deep learning for monocular depth estimation: A review. Neurocomputing 2021, 438, 14–33. [Google Scholar] [CrossRef]
- Yao, G.; Yilmaz, A.; Meng, F.; Zhang, L. Review of wide-baseline stereo image matching based on deep learning. Remote Sens. 2021, 13, 3247. [Google Scholar] [CrossRef]
- Raj, T.; Hashim, F.H.; Huddin, A.B.; Ibrahim, M.F.; Hussain, A. A survey on LiDAR scanning mechanisms. Electronics 2020, 9, 741. [Google Scholar] [CrossRef]
- Bi, S.; Yuan, C.; Liu, C.; Cheng, J.; Wang, W.; Cai, Y. A survey of low-cost 3D laser scanning technology. Appl. Sci. 2021, 11, 3938. [Google Scholar] [CrossRef]
- Zhang, J.; Lin, X. Advances in fusion of optical imagery and LiDAR point cloud applied to photogrammetry and remote sensing. Int. J. Image Data Fusion 2017, 8, 1–31. [Google Scholar] [CrossRef]
- Wang, Z.; Wu, Y.; Niu, Q. Multi-sensor fusion in automated driving: A survey. IEEE Access 2019, 8, 2847–2868. [Google Scholar] [CrossRef]
- Debeunne, C.; Vivet, D. A review of visual-LiDAR fusion based simultaneous localization and mapping. Sensors 2020, 20, 2068. [Google Scholar] [CrossRef] [Green Version]
- Fayyad, J.; Jaradat, M.A.; Gruyer, D.; Najjaran, H. Deep learning sensor fusion for autonomous vehicle perception and localization: A review. Sensors 2020, 20, 4220. [Google Scholar] [CrossRef]
- Cui, Y.; Chen, R.; Chu, W.; Chen, L.; Tian, D.; Li, Y.; Cao, D. Deep learning for image and point cloud fusion in autonomous driving: A review. IEEE Trans. Intell. Transp. Syst. 2021, 1–18. [Google Scholar] [CrossRef]
- LeCun, Y.; Bottou, L.; Bengio, Y.; Haffner, P. Gradient-based learning applied to document recognition. Proc. IEEE 1998, 86, 2278–2324. [Google Scholar] [CrossRef] [Green Version]
- Krizhevsky, A.; Sutskever, I.; Hinton, G.E. Imagenet classification with deep convolutional neural networks. Adv. Neural Inf. Process. Sist. 2012, 2, 1097–1105. [Google Scholar] [CrossRef]
- Szegedy, C.; Liu, W.; Jia, Y.; Sermanet, P.; Reed, S.; Anguelov, D.; Erhan, D.; Vanhoucke, V.; Rabinovich, A. Going deeper with convolutions. arXiv 2014, arXiv:1409.4842. [Google Scholar]
- Simonyan, K.; Zisserman, A. Very deep convolutional networks for large-scale image recognition. arXiv 2014, arXiv:1409.1556. [Google Scholar]
- Long, J.; Shelhamer, E.; Darrell, T. Fully convolutional networks for semantic segmentation. In Proceedings of the IEEE Conference on Computer Vision and Pattern Recognition, Boston, MA, USA, 7–12 June 2015; pp. 3431–3440. [Google Scholar] [CrossRef] [Green Version]
- He, K.M.; Zhang, X.Y.; Ren, S.Q.; Sun, J. Deep residual learning for image recognition. In Proceedings of the IEEE Conference on Computer Vision and Pattern Recognition (CVPR), Las Vegas, NV, USA, 27–30 June 2016; pp. 770–778. [Google Scholar] [CrossRef] [Green Version]
- Girshick, R. Fast r-cnn. In Proceedings of the IEEE International Conference on Computer Vision (ICCV), Santiago, Chile, 7–13 December 2015; pp. 1440–1448. [Google Scholar] [CrossRef]
- Ren, S.; He, K.; Girshick, R.; Sun, J. Faster r-cnn: Towards real-time object detection with region proposal networks. IEEE Trans. Pattern Anal. Mach. Intell. 2017, 39, 1137–1149. [Google Scholar] [CrossRef] [Green Version]
- Dai, J.; Li, Y.; He, K.; Sun, J. R-fcn: Object detection via. region-based fully convolutional networks. In Advances in Neural Information Processing Systems; MIT Press: Cambridge, UK, 2016; pp. 379–387. [Google Scholar]
- Lin, T.Y.; Dollár, P.; Girshick, R.; He, K.; Hariharan, B.; Belongie, S. Feature pyramid networks for object detection. In Proceedings of the IEEE Conference on Computer Vision and Pattern Recognition, Honolulu, HI, USA, 21–26 July 2017; pp. 2117–2125. [Google Scholar] [CrossRef] [Green Version]
- He, K.; Gkioxari, G.; Dollár, P.; Girshick, R. Mask r-cnn. In Proceedings of the IEEE International Conference on Computer Vision, Venice, Italy, 22–29 October 2017; pp. 2961–2969. [Google Scholar]
- Yoo, D.; Park, S.; Lee, J.-Y.; Paek, A.S.; Kweon, I.S. AttentionNet: Aggregating weak directions for accurate object detection. In Proceedings of the 2015 IEEE International Conference on Computer Vision (ICCV), Santiago, Chile, 7–13 December 2015; Institute of Electrical and Electronics Engineers (IEEE): New York, NY, USA, 2015; pp. 2659–2667. [Google Scholar]
- Redmon, J.; Divvala, S.; Girshick, R.; Farhadi, A. You only look once: Unified, real-time object detection. In Proceedings of the IEEE Conference on Computer Vision and Pattern Recognition (CVPR), Las Vegas, NV, USA, 27–30 June 2016; pp. 779–788. [Google Scholar] [CrossRef] [Green Version]
- Liu, W.; Anguelov, D.; Erhan, D.; Szegedy, C.; Reed, S.; Fu, C.-Y.; Berg, A.C. Ssd: Single shot multibox detector. In Proceedings of the European Conference on Computer Vision, Amsterdam, The Netherlands, 11–14 October 2016; pp. 21–37. [Google Scholar]
- Redmon, J.; Farhadi, A. YOLO9000: Better, faster, stronger. In Proceedings of the IEEE Conference on Computer Vision and Pattern Recognition, Honolulu, HI, USA, 21–26 July 2017; pp. 6517–6525. [Google Scholar] [CrossRef] [Green Version]
- Redmon, J.; Farhadi, A. Yolov3: An incremental improvement. arXiv 2018, arXiv:1804.02767. [Google Scholar]
- Bochkovskiy, A.; Wang, C.-Y.; Liao, H.-Y.M. Yolov4: Optimal speed and accuracy of object detection. arXiv 2020, arXiv:2004.10934. [Google Scholar]
- Chen, L.-C.; Papandreou, G.; Kokkinos, I.; Murphy, K.; Yuille, A.L. Semantic image segmentation with deep convolutional nets and fully connected crfs. arXiv 2014, arXiv:1412.7062. [Google Scholar]
- Krähenbühl, P.; Koltun, V. Efficient inference in fully connected crfs with gaussian edge potentials. Adv. Neural Inf. Process. Syst. 2011, 24, 109–117. [Google Scholar]
- Liu, W.; Rabinovich, A.; Berg, A.C. Parsenet: Looking wider to see better. arXiv 2015, arXiv:1506.04579. [Google Scholar]
- Pinheiro, P.O.; Lin, T.-Y.; Collobert, R.; Dollár, P. Learning to refine object segments. In Lecture Notes in Computer Science; Springer: Berlin/Heidelberg, Germany, 2016; pp. 75–91. [Google Scholar]
- Zeiler, M.D.; Taylor, G.W.; Fergus, R. Adaptive deconvolutional networks for mid and high level feature learning. In Proceedings of the 2011 IEEE International Conference on Computer Vision, Barcelona, Spain, 6–13 November 2011; pp. 2018–2025. [Google Scholar]
- Zeiler, M.D.; Fergus, R. Visualizing and understanding convolutional networks. In Computer Vision – ECCV 2014, ECCV 2014, Lecture Notes in Computer Science; Springer: Cham, Switzerland, 2014. [Google Scholar] [CrossRef] [Green Version]
- Badrinarayanan, V.; Kendall, A.; Cipolla, R. Segnet: A deep convolutional encoder-decoder architecture for image segmentation. IEEE Trans. Pattern Anal. Mach. Intell. 2017, 39, 2481–2495. [Google Scholar] [CrossRef]
- Ronneberger, O.; Fischer, P.; Brox, T. U-Net: Convolutional Networks for Biomedical Image Segmentation. In Proceedings of the International Conference on Medical Image Computing and Computer-Assisted Intervention, Munich, Germaby, 5–9 October 2015; pp. 234–241. [Google Scholar]
- Chen, L.-C.; Papandreou, G.; Kokkinos, I.; Murphy, K.; Yuille, A.L. Deeplab: Semantic image segmentation with deep convolutional nets, atrous convolution, and fully connected CRFs. IEEE Trans. Pattern Anal. Mach. Intell. 2018, 40, 834–848. [Google Scholar] [CrossRef] [PubMed]
- Paszke, A.; Chaurasia, A.; Kim, S.; Culurciello, E. Enet: A deep neural network architecture for real-time semantic segmentation. arXiv 2016, arXiv:1606.02147. [Google Scholar]
- Guo, Y.; Wang, H.; Hu, Q.; Liu, H.; Liu, L.; Bennamoun, M. Deep learning for 3D point clouds: A survey. IEEE Trans. Pattern Anal. Mach. Intell. 2020. [Google Scholar] [CrossRef]
- Liu, W.; Sun, J.; Li, W.; Hu, T.; Wang, P. Deep learning on point clouds and its application: A survey. Sensors 2019, 19, 4188. [Google Scholar] [CrossRef] [Green Version]
- Zhang, J.; Zhao, X.; Chen, Z.; Lu, Z. A review of deep learning-based semantic segmentation for point cloud. IEEE Access 2019, 7, 179118–179133. [Google Scholar] [CrossRef]
- Su, H.; Maji, S.; Kalogerakis, E.; Learned-Miller, E. Multi-view convolutional neural networks for 3D shape recognition. In Proceedings of the 2015 IEEE International Conference on Computer Vision (ICCV), Santiago, Chile, 7–13 December 2015; pp. 945–953. [Google Scholar]
- Yang, Z.; Wang, L. Learning relationships for multi-view 3D object recognition. In Proceedings of the 2019 IEEE/CVF International Conference on Computer Vision (ICCV), Seoul, Korea, 27 October–2 November 2019; pp. 7505–7514. [Google Scholar]
- Wei, X.; Yu, R.; Sun, J. View-GCN: View-based graph convolutional network for 3D shape analysis. In Proceedings of the CVPR 2020: IEEE/CVF Conference on Computer Vision and Pattern Recognition, Seattle, WA, USA, 16–18 June 2020; Institute of Electrical and Electronics Engineers (IEEE): New York, NY, USA, 2020; pp. 1847–1856. [Google Scholar]
- Maturana, D.; Scherer, S. Voxnet: A 3D convolutional neural network for real-time object recognition. In Proceedings of the IROS 2015—IEEE/RSJ International Conference on Intelligent Robots and Systems, Hamburg, Germany, 28 September–2 October 2015; pp. 922–928. [Google Scholar]
- Riegler, G.; Ulusoy, A.O.; Geiger, A. Octnet: Learning deep 3D representations at high resolutions. In Proceedings of the 2017 IEEE Conference on Computer Vision and Pattern Recognition (CVPR), Nonolulu, HI, USA, 21–26 July 2017; pp. 6620–6629. [Google Scholar]
- Han, X.-F.; Laga, H.; Bennamoun, M. Image-based 3D object reconstruction: State-of-the-art and trends in the deep learning era. IEEE Trans. Pattern Anal. Mach. Intell. 2021, 43, 1578–1604. [Google Scholar] [CrossRef] [Green Version]
- Qi, C.R.; Su, H.; Mo, K.; Guibas, L.J. PointNet: Deep learning on point sets for 3D classification and segmentation. arXiv 2017, arXiv:1612.00593v2. [Google Scholar]
- Wu, W.; Qi, Z.; Fuxin, L. Pointconv: Deep convolutional networks on 3D point clouds. In Proceedings of the 2019 IEEE/CVF Conference on Computer Vision and Pattern Recognition (CVPR), Longh Beach, CA, USA, 15–21 June 2019; pp. 9613–9622. [Google Scholar]
- Xu, Y.; Fan, T.; Xu, M.; Zeng, L.; Qiao, Y. Spidercnn: Deep learning on point sets with parameterized convolutional filters. In Computer Science Logic; Springer: Berlin/Heidelberg, Germany, 2018; pp. 90–105. [Google Scholar]
- Simonovsky, M.; Komodakis, N. Dynamic edge-conditioned filters in convolutional neural networks on graphs. In Proceedings of the 2017 IEEE Conference on Computer Vision and Pattern Recognition (CVPR), Honolulu, HI, USA, 21–26 July 2017; pp. 29–38. [Google Scholar]
- Wang, Y.; Sun, Y.; Liu, Z.; Sarma, S.E.; Bronstein, M.M.; Solomon, J. Dynamic graph CNN for learning on point clouds. ACM Trans. Graph. 2019, 38, 1–12. [Google Scholar] [CrossRef] [Green Version]
- Shi, S.; Wang, X.; Li, H. Pointrcnn: 3D object proposal generation and detection from point cloud. In Proceedings of the 2019 IEEE/CVF Conference on Computer Vision and Pattern Recognition (CVPR), Longh Beach, CA, USA, 15–21 June 2019; pp. 770–779. [Google Scholar]
- Zarzar, J.; Giancola, S.; Ghanem, B. Pointrgcn: Graph convolution networks for 3D vehicles detection refinement. arXiv 2019, arXiv:1911.12236. [Google Scholar]
- Yang, Z.; Sun, Y.; Liu, S.; Shen, X.; Jia, J. STD: Sparse-to-dense 3D object detector for point cloud. In Proceedings of the 2019 IEEE/CVF International Conference on Computer Vision (ICCV), Seoul, Korea, 27 October–2 November 2019; pp. 1951–1960. [Google Scholar]
- Lehner, J.; Mitterecker, A.; Adler, T.; Hofmarcher, M.; Nessler, B.; Hochreiter, S. Patch refinement-localized 3D object detection. arXiv 2019, arXiv:1910.04093. [Google Scholar]
- Qi, C.R.; Litany, O.; He, K.; Guibas, L. Deep hough voting for 3D object detection in point clouds. In Proceedings of the 2019 IEEE/CVF International Conference on Computer Vision (ICCV), Seoul, Korea, 27 October–2 November 2019; pp. 9277–9286. [Google Scholar]
- Li, B.; Zhang, T.; Xia, T. Vehicle detection from 3D lidar using fully convolutional network. arXiv 2016, arXiv:1608.07916. [Google Scholar]
- Yang, Z.; Sun, Y.; Liu, S.; Jia, J. 3DSSD: Point-based 3D single stage object detector. In Proceedings of the 2020 IEEE/CVF Conference on Computer Vision and Pattern Recognition (CVPR), Seattle, WA, USA, 16–18 June 2020; pp. 11037–11045. [Google Scholar]
- Lawin, F.J.; Danelljan, M.; Tosteberg, P.; Bhat, G.; Khan, F.S.; Felsberg, M. Deep projective 3D semantic segmentation. In Programming Languages and Systems; Springer Science and Business Media: Berlin/Heidelberg, Germany, 2017; pp. 95–107. [Google Scholar]
- Wu, B.; Wan, A.; Yue, X.; Keutzer, K. Squeezeseg: Convolutional neural nets with recurrent CRF for real-time road-object segmentation from 3D lidar point cloud. In Proceedings of the 2018 IEEE International Conference on Robotics and Automation (ICRA), Brisbane, Queensland, AU, 21–25 May 2018; pp. 1887–1893. [Google Scholar] [CrossRef] [Green Version]
- Tchapmi, L.; Choy, C.; Armeni, I.; Gwak, J.; Savarese, S. SEGCloud: Semantic segmentation of 3D point clouds. In Proceedings of the 2017 International Conference on 3D Vision (3DV), Qingdao, China, 10–12 October 2017; pp. 537–547. [Google Scholar]
- Rethage, D.; Wald, J.; Sturm, J.; Navab, N.; Tombari, F. Fully-convolutional point networks for large-scale point clouds. In Advances in Knowledge Discovery and Data Mining; Springer: Berlin/Heidelberg, Germany, 2018; pp. 625–640. [Google Scholar]
- Qi, C.R.; Yi, L.; Su, H.; Guibas, L.J. Pointnet++: Deep hi-erarchical. feature learning on point sets in a metric space. Advances in Neural Information Processing Systems. arXiv 2017, arXiv:1706.02413. [Google Scholar]
- Li, Y.; Bu, R.; Sun, M.; Wu, W.; Di, X.; Chen, B. Pointcnn: Convolution on X-transformed points. arXiv 2018, arXiv:1801.07791. [Google Scholar]
- Wu, B.; Liu, Y.; Lang, B.; Huang, L. DGCNN: Disordered graph convolutional neural network based on the Gaussian mixture model. Neurocomputing 2018, 321, 346–356. [Google Scholar] [CrossRef] [Green Version]
- Landrieu, L.; Simonovsky, M. Large-scale point cloud semantic segmentation with superpoint graphs. In Proceedings of the 2018 IEEE/CVF Conference on Computer Vision and Pattern Recognition, Salt Lake City, UT, USA, 18–23 June 2018; pp. 4558–4567. [Google Scholar]
- Yi, L.; Zhao, W.; Wang, H.; Sung, M.; Guibas, L.J. GSPN: Generative shape proposal network for 3D instance segmentation in point cloud. In Proceedings of the 2019 IEEE/CVF Conference on Computer Vision and Pattern Recognition (CVPR), Long Beach, CA, USA, 16–20 June 2019; pp. 3942–3951. [Google Scholar]
- Yang, B.; Wang, J.; Clark, R.; Hu, Q.; Wang, S.; Markham, A.; Trigoni, N. Learning object bounding boxes for 3D instance segmentation on point clouds. arXiv 2019, arXiv:1906.01140. [Google Scholar]
- Wang, W.; Yu, R.; Huang, Q.; Neumann, U. SGPN: Similarity group proposal network for 3D point cloud instance segmentation. In Proceedings of the 2018 IEEE/CVF Conference on Computer Vision and Pattern Recognition, Salt Lake City, CA, USA, 18–23 June 2018; Institute of Electrical and Electronics Engineers (IEEE): New York, NY, USA, 2018; pp. 2569–2578. [Google Scholar]
- Wang, X.; Liu, S.; Shen, X.; Shen, C.; Jia, J. Associatively segmenting instances and semantics in point clouds. In Proceedings of the 2019 IEEE/CVF Conference on Computer Vision and Pattern Recognition (CVPR), Long Beach, CA, USA, 16–20 June 2019; pp. 4091–4100. [Google Scholar]
- Lai, K.; Bo, L.; Ren, X.; Fox, D. A large-scale hierarchical multi-view RGB-D object dataset. In Proceedings of the 2011 IEEE International Conference on Robotics and Automation, Shanghai, China, 9–13 May 2011; pp. 1817–1824. [Google Scholar]
- Koppula, H.S.; Anand, A.; Joachims, T.; Saxena, A. Semantic labeling of 3D point clouds for indoor scenes. In Proceedings of the Neural Information Processing Systems, Granada, Spain, 12–17 December 2011; p. 6. [Google Scholar]
- Janoch, A.; Karayev, S.; Jia, Y.; Barron, J.T.; Fritz, M.; Saenko, K.; Darrell, T. A category-level 3D object dataset: Putting the kinect to work. In RGB-D Image Analysis and Processing; Springer Science and Business Media: Berlin/Heidelberg, Germany, 2013; pp. 141–165. [Google Scholar]
- Susanto, W.; Rohrbach, M.; Schiele, B. 3D object detection with multiple kinects. In Programming Languages and Systems; Springer Science and Business Media: Berlin/Heidelberg, Germany, 2012; pp. 93–102. [Google Scholar]
- Silberman, N.; Fergus, R. Indoor scene segmentation using a structured light sensor. In Proceedings of the 2011 IEEE International Conference on Computer Vision Workshops (ICCV Workshops), Barcelona, Spain, 6–11 November 2011; pp. 601–608. [Google Scholar]
- Silberman, N.; Hoiem, D.; Kohli, P.; Fergus, R. Indoor segmentation and support inference from rgbd images. In Proceedings of the European Conference on Computer Vision, Florence, Italy, 7–13 October 2012; Springer: Berlin/Heidelberg, Germany, 2012; pp. 746–760. [Google Scholar]
- Zhang, Q.; Song, X.; Shao, X.; Shibasaki, R.; Zhao, H. Category modeling from just a single labeling: Use depth information to guide the learning of 2D models. In Proceedings of the 2013 IEEE Conference on Computer Vision and Pattern Recognition, Portland, OR, USA, 23–28 June 2013; Institute of Electrical and Electronics Engineers (IEEE): Piscataway, NJ, USA, 2013; pp. 193–200. [Google Scholar]
- Xiao, J.; Owens, A.; Torralba, A. SUN3D: A database of big spaces reconstructed using SfM and object labels. In Proceedings of the 2013 IEEE International Conference on Computer Vision, Sydney, NSW, Australia, 1–8 December 2013; Institute of Electrical and Electronics Engineers (IEEE): Piscataway, NJ, USA, 2013; pp. 1625–1632. [Google Scholar]
- Lai, K.; Bo, L.; Fox, D. Unsupervised feature learning for 3D scene labeling. In Proceedings of the 2014 IEEE International Conference on Robotics and Automation (ICRA), Hong Kong, China, 31 May–5 June 2014; Institute of Electrical and Electronics Engineers (IEEE): New York, NY, USA, 2014; pp. 3050–3057. [Google Scholar]
- Song, S.; Lichtenberg, S.P.; Xiao, J. Sun rgb-d: A rgb-d scene understanding benchmark suite. In Proceedings of the 2015 IEEE Conference on Computer Vision and Pattern Recognition (CVPR), Boston, MA, USA, 7–12 June 2015; Institute of Electrical and Electronics Engineers (IEEE): New York, NY, USA, 2015; pp. 567–576. [Google Scholar]
- Martinez-Gomez, J.; García-Varea, I.; Cazorla, M.; Morell, V. Vidrilo: The visual and depth robot indoor localization with objects information dataset. Int. J. Robot. Res. 2015, 34, 1681–1687. [Google Scholar] [CrossRef] [Green Version]
- Hua, B.-S.; Pham, Q.-H.; Nguyen, D.T.; Tran, M.-K.; Yu, L.-F.; Yeung, S.-K. Scenenn: A scene meshes dataset with annotations. In Proceedings of the 2016 Fourth International Conference on 3D Vision (3DV), Stanford, CA, USA, 25–28 October 2016; Institute of Electrical and Electronics Engineers (IEEE): New York, NY, USA, 2016; pp. 92–101. [Google Scholar]
- Handa, A.; Patraucean, V.; Badrinarayanan, V.; Stent, S.; Cipolla, R. Scenenet: Understanding real world indoor scenes with synthetic data. arXiv 2015, arXiv:1511.07041. [Google Scholar]
- McCormac, J.; Handa, A.; Leutenegger, S.; Davison, A.J. Scenenet rgb-d: 5 M photorealistic images of synthetic indoor trajectories with ground truth. arXiv 2016, arXiv:1612.05079. [Google Scholar]
- Georgakis, G.; Reza, M.A.; Mousavian, A.; Le, P.-H.; Košecká, J. Multiview RGB-D dataset for object instance detection. In Proceedings of the 2016 Fourth International Conference on 3D Vision (3DV), Stanford, CA, USA, 25–28 October 2016; pp. 426–434. [Google Scholar]
- Chang, A.; Dai, A.; Funkhouser, T.; Halber, M.; Niebner, M.; Savva, M.; Song, S.; Zeng, A.; Zhang, Y. Matterport3D: Learning from RGB-D data in indoor environments. In Proceedings of the International Conference 3D Vision 2017, Qingdao, China, 10–12 October 2017; pp. 667–676. [Google Scholar] [CrossRef] [Green Version]
- Tombari, F.; Di Stefano, L.; Giardino, S. Online learning for automatic segmentation of 3D data. In Proceedings of the 2011 IEEE/RSJ International Conference on Intelligent Robots and Systems, San Francisco, CA, USA, 25–30 September 2011; pp. 4857–4864. [Google Scholar]
- Vasiljevic, I.; Kolkin, N.; Zhang, S.; Luo, R.; Wang, H.; Dai, F.Z.; Daniele, A.F.; Mostajabi, M.; Basart, S.; Walter, M.R. Diode: A dense indoor and outdoor depth dataset. arXiv 2019, arXiv:1908.00463. [Google Scholar]
- Armeni, I.; Sener, O.; Zamir, A.R.; Jiang, H.; Brilakis, I.; Fischer, M.; Savarese, S. 3D semantic parsing of large-scale indoor spaces. In Proceedings of the 2016 IEEE Conference on Computer Vision and Pattern Recognition (CVPR), Las Vegas, NV, USA, 27–30 June 2016; pp. 1534–1543. [Google Scholar]
- Armeni, I.; Sax, S.; Zamir, A.R.; Savarese, S. Joint 2D-3D-semantic data for indoor scene understanding. arXiv 2017, arXiv:1702.01105. [Google Scholar]
- Dai, A.; Chang, A.X.; Savva, M.; Halber, M.; Funkhouser, T.; Niessner, M. Scannet: Richly-annotated 3D reconstructions of indoor scenes. In Proceedings of the 2017 IEEE Conference on Computer Vision and Pattern Recognition (CVPR), Honolulu, HI, USA, 21–26 June 2017; pp. 2432–2443. [Google Scholar]
- Sun, X.; Xie, Y.; Luo, P.; Wang, L. A Dataset for Benchmarking Image-Based Localization. In Proceedings of the 2017 IEEE Conference on Computer Vision and Pattern Recognition (CVPR), Honolulu, HI, USA, 21–26 June 2017; Institute of Electrical and Electronics Engineers (IEEE): New York, NY, USA, 2017; pp. 5641–5649. [Google Scholar]
- Chang, A.X.; Funkhouser, T.; Guibas, L.; Hanrahan, P.; Huang, Q.; Li, Z.; Savarese, S.; Savva, M.; Song, S.; Su, H. Shapenet: An information-rich 3D model repository. arXiv 2015, arXiv:1512.03012. [Google Scholar]
- Uy, M.A.; Pham, Q.-H.; Hua, B.-S.; Nguyen, T.; Yeung, S.-K. Revisiting point cloud classification: A new benchmark dataset and classification model on real-world data. In Proceedings of the 2019 IEEE/CVF International Conference on Computer Vision (ICCV), Seoul, Korea, 27 October–3 November 2019. [Google Scholar]
- Geiger, A.; Lenz, P.; Urtasun, R. Are we ready for autonomous driving? The KITTI vision benchmark suite. In Proceedings of the IEEE Conference on Computer Vision and Pattern Recognition (CVPR), Providence, RI, USA, 16–21 June 2012; pp. 3354–3361. [Google Scholar] [CrossRef]
- Geiger, A.; Lenz, P.; Stiller, C.; Urtasun, R. Vision meets robotics: The KITTI dataset. Int. J. Robot. Res. 2013, 32, 1231–1237. [Google Scholar] [CrossRef] [Green Version]
- Ros, G.; Ramos, S.; Granados, M.; Bakhtiary, A.; Vazquez, D.; López, A. Vision-based offline-online perception paradigm for autonomous driving. In Proceedings of the 2015 IEEE Winter Conference on Applications of Computer Vision, Waikoloa, HI, USA, 5–9 January 2015; Institute of Electrical and Electronics Engineers (IEEE): New York, NY, USA, 2015; pp. 231–238. [Google Scholar]
- Zhang, R.; Candra, S.A.; Vetter, K.; Zakhor, A. Sensor fusion for semantic segmentation of urban scenes. In Proceedings of the 2015 IEEE International Conference on Robotics and Automation (ICRA), Seattle, WA, USA, 25–30 May 2015; Institute of Electrical and Electronics Engineers (IEEE): New York, NY, USA, 2015; pp. 1850–1857. [Google Scholar]
- Behley, J.; Garbade, M.; Milioto, A.; Quenzel, J.; Behnke, S.; Stachniss, C.; Gall, J. Semantickitti: A dataset for semantic scene understanding of LiDAR sequences. In Proceedings of the 2019 IEEE/CVF International Conference on Computer Vision (ICCV), Seoul, Korea, 27 October–3 November 2019; pp. 9296–9306. [Google Scholar]
- Caesar, H.; Bankiti, V.; Lang, A.H.; Vora, S.; Liong, V.E.; Xu, Q.; Krishnan, A.; Pan, Y.; Baldan, G.; Beijbom, O. nuScenes: A multimodal dataset for autonomous driving. In Proceedings of the IEEE/CVF Conference on Computer Vision and Pattern Recognition, Seattle, WA, USA, 13–19 June 2020; pp. 11618–11628. [Google Scholar] [CrossRef]
- Can, G.; Mantegazza, D.; Abbate, G.; Chappuis, S.; Giusti, A. Semantic segmentation on Swiss3DCities: A benchmark study on aerial photogrammetric 3D pointcloud dataset. Pattern Recognit. Lett. 2021, 150, 108–114. [Google Scholar] [CrossRef]
- Geyer, J.; Kassahun, Y.; Mahmudi, M.; Ricou, X.; Durgesh, R.; Chung, A.S.; Hauswald, L.; Pham, V.H.; Mühlegg, M.; Dorn, S. A2D2: Audi autonomous driving dataset. arXiv 2020, arXiv:2004.06320. [Google Scholar]
- Tan, W.; Qin, N.; Ma, L.; Li, Y.; Du, J.; Cai, G.; Yang, K.; Li, J. Toronto-3D: A Large-scale Mobile LiDAR dataset for semantic segmentation of urban roadways. In Proceedings of the 2020 IEEE/CVF Conference on Computer Vision and Pattern Recognition Workshops (CVPRW), Seattle, WA, USA, 14–19 June 2020; pp. 797–806. [Google Scholar]
- Hackel, T.; Savinov, N.; Ladicky, L.; Wegner, J.D.; Schindler, K.; Pollefeys, M. Semantic3d.Net: A new large-scale point cloud classification benchmark. arXiv 2017, arXiv:1704.03847. [Google Scholar] [CrossRef] [Green Version]
- Tong, G.; Li, Y.; Chen, D.; Sun, Q.; Cao, W.; Xiang, G. CSPC-Dataset: New lidar point cloud dataset and benchmark for large-scale scene semantic segmentation. IEEE Access 2020, 8, 87695–87718. [Google Scholar] [CrossRef]
- Weng, X.; Man, Y.; Cheng, D.; Park, J.; O’Toole, M.; Kitani, K.; Wang, J.; Held, D. All-in-One Drive: A Large-Scale Comprehensive Perception Dataset with High-Density Long-Range Point Clouds. 2020. Available online: https://www.researchgate.net/publication/347112693_All-In-One_Drive_A_Large-Scale_Comprehensive_Perception_Dataset_with_High-Density_Long-Range_Point_Clouds (accessed on 18 May 2021).
- Chang, M.-F.; Ramanan, D.; Hays, J.; Lambert, J.; Sangkloy, P.; Singh, J.; Bak, S.; Hartnett, A.; Wang, D.; Carr, P.; et al. Argoverse: 3D tracking and forecasting with rich maps. In Proceedings of the 2019 IEEE/CVF Conference on Computer Vision and Pattern Recognition (CVPR), Long Beach, CA, USA, 15–21 June 2019; pp. 8740–8749. [Google Scholar]
- Huang, X.; Wang, P.; Cheng, X.; Zhou, D.; Geng, Q.; Yang, R. The Apolloscape open dataset for autonomous driving and its application. IEEE Trans. Pattern Anal. Mach. Intell. 2020, 42, 2702–2719. [Google Scholar] [CrossRef] [Green Version]
- Gaidon, A.; Wang, Q.; Cabon, Y.; Vig, E. Virtualworlds as proxy for multi-object tracking analysis. In Proceedings of the 2016 IEEE Conference on Computer Vision and Pattern Recognition (CVPR), Las Vegas, NV, USA, 26 June–1 July 2016; pp. 4340–4349. [Google Scholar]
- Fang, J.; Yan, F.; Zhao, T.; Zhang, F.; Zhou, D.; Yang, R.; Ma, Y.; Wang, L. Simulating lidar point cloud for autonomous driving using real-world scenes and traffic flows. arXiv 2018, arXiv:1811.07112. [Google Scholar]
- Yi, L.; Shao, L.; Savva, M.; Huang, H.; Zhou, Y.; Wang, Q.; Graham, B.; Engelcke, M.; Klokov, R.; Lempitsky, V. Large-scale 3D shape reconstruction and segmentation from shapenet core55. arXiv 2017, arXiv:1710.06104. [Google Scholar]
- Mo, K.; Zhu, S.; Chang, A.X.; Yi, L.; Tripathi, S.; Guibas, L.J.; Su, H. PartNet: A large-scale benchmark for fine-grained and hierarchical part-level 3D object understanding. In Proceedings of the 2019 IEEE/CVF Conference on Computer Vision and Pattern Recognition (CVPR), Long Beach, CA, USA, 15–21 June 2019; pp. 909–918. [Google Scholar]
- Wu, Z.; Song, S.; Khosla, A.; Yu, F.; Zhang, L.; Tang, X.; Xiao, J. 3D Shapenets: A deep representation for volumetric shapes. In Proceedings of the IEEE Conference on Computer Vision and Pattern Recognition, Boston, MA, USA, 7–12 June 2015. [Google Scholar]
- Richtsfeld, A.; Morwald, T.; Prankl, J.; Zillich, M.; Vincze, M. Segmentation of unknown objects in indoor environments. In Proceedings of the 2012 IEEE/RSJ International Conference on Intelligent Robots and Systems, Algarve, Portugal, 7–12 October 2012; Institute of Electrical and Electronics Engineers (IEEE): New York, NY, USA, 2012; pp. 4791–4796. [Google Scholar]
- Taghanaki, S.A.; Luo, J.; Zhang, R.; Wang, Y.; Jayaraman, P.K.; Jatavallabhula, K.M. Robust point set: A dataset for benchmarking robustness of point cloud classifiers. arXiv 2020, arXiv:2011.11572. [Google Scholar]
- De Deuge, M.; Quadros, A.; Hung, C.; Douillard, B. Unsupervised feature learning for classification of outdoor 3D scans. In Proceedings of the Australasian Conference on Robitics and Automation, Sydney, New South Wales, AU, 2–4 December 2013; pp. 1–27. [Google Scholar]
- Serna, A.; Marcotegui, B.; Goulette, F.; Deschaud, J.-E. Paris-rue-madame database—A 3D mobile laser scanner dataset for benchmarking urban detection, segmentation and classification methods. In Proceedings of the 1st International Conference on Pattern Recognition Applications and Methods ICPRAM 2014, Angers, France, 6 March 2014; pp. 819–824. [Google Scholar]
- Vallet, B.; Brédif, M.; Serna, A.; Marcotegui, B.; Paparoditis, N. Terra mobilita/iQmulus urban point cloud analysis benchmark. Comput. Graph. 2015, 49, 126–133. [Google Scholar] [CrossRef] [Green Version]
- Roynard, X.; Deschaud, J.-E.; Goulette, F. Paris-lille-3D: A point cloud dataset for urban scene segmentation and classification. In Proceedings of the 2018 IEEE/CVF Conference on Computer Vision and Pattern Recognition Workshops (CVPRW), Salt Lake City, UT, USA, 18–22 June 2018; pp. 2108–21083. [Google Scholar]
- Wang, Y.; Tan, X.; Yang, Y.; Liu, X.; Ding, E.; Zhou, F.; Davis, L.S. 3D pose estimation for fine-grained object categories. In Transactions on Petri Nets and Other Models of Concurrency XV; Springer Science and Business Media: Berlin/Heidelberg, Germany, 2019; pp. 619–632. [Google Scholar]
- Ibrahim, M.; Akhtar, N.; Wise, M.; Mian, A. Annotation tool and urban dataset for 3D point cloud semantic segmentation. IEEE Access 2021, 9, 35984–35996. [Google Scholar] [CrossRef]
- Rottensteiner, F.; Sohn, G.; Gerke, M.; Wegner, J.D.; Breitkopf, U.; Jung, J. Results of the ISPRS benchmark on urban object detection and 3D building reconstruction. ISPRS J. Photogramm. Remote. Sens. 2014, 93, 256–271. [Google Scholar] [CrossRef]
- Zolanvari, S.; Ruano, S.; Rana, A.; Cummins, A.; da Silva, R.E.; Rahbar, M.; Smolic, A. Dublin city: Annotated lidar point cloud and its applications. arXiv 2019, arXiv:1909.03613. [Google Scholar]
- Hu, Q.; Yang, B.; Khalid, S.; Xiao, W.; Trigoni, N.; Markham, A. Towards semantic segmentation of urban-scale 3D point clouds: A dataset, benchmarks and challenges. In Proceedings of the IEEE/CVF Conference on Computer Vision and Pattern Recognition, Online Conference, 19–25 June 2021; pp. 4977–4987. [Google Scholar]
- Varney, N.; Asari, V.K.; Graehling, Q. Dales: A large-scale aerial lidar data set for semantic segmentation. In Proceedings of the 2020 IEEE/CVF Conference on Computer Vision and Pattern Recognition Workshops (CVPRW), Online Conference, 14–19 June 2020; Institute of Electrical and Electronics Engineers (IEEE): New York, NY, USA, 2020; pp. 717–726. [Google Scholar]
- Ye, Z.; Xu, Y.; Huang, R.; Tong, X.; Li, X.; Liu, X.; Luan, K.; Hoegner, L.; Stilla, U. Lasdu: A large-scale aerial lidar dataset for semantic labeling in dense urban areas. ISPRS Int. J. Geo-Inf. 2020, 9, 450. [Google Scholar] [CrossRef]
- Li, X.; Li, C.; Tong, Z.; Lim, A.; Yuan, J.; Wu, Y.; Tang, J.; Huang, R. Campus3d: A photogrammetry point cloud benchmark for hierarchical understanding of outdoor scene. In Proceedings of the 28th ACM International Conference on Multimedia, Seattle, WA, USA, 12–16 October 2020; pp. 238–246. [Google Scholar]
- Sun, P.; Kretzschmar, H.; Dotiwalla, X.; Chouard, A.; Patnaik, V.; Tsui, P.; Guo, J.; Zhou, Y.; Chai, Y.; Caine, B.; et al. Scalability in perception for autonomous driving: Waymo open dataset. In Proceedings of the IEEE Conference on Computer Vision and Pattern Recognition (CVPR), Online Conference, 14–19 June 2020; pp. 2446–2454. [Google Scholar]
- Wulff, F.; Schaufele, B.; Sawade, O.; Becker, D.; Henke, B.; Radusch, I. Early fusion of camera and lidar for robust road detection based on U-net fcn. In Proceedings of the 2018 IEEE Intelligent Vehicles Symposium (IV), Changshu, China, 30 June–1 July 2018; Institute of Electrical and Electronics Engineers (IEEE): New York, NY, USA; pp. 1426–1431. [Google Scholar]
- Erkent, O.; Wolf, C.; Laugier, C.; Gonzalez, D.S.; Cano, V.R. Semantic grid estimation with a hybrid bayesian and deep neural network approach. In Proceedings of the 2018 IEEE/RSJ International Conference on Intelligent Robots and Systems (IROS), Madrid, Spain, 1–5 May 2018; pp. 888–895. [Google Scholar]
- Zhou, K.; Ming, D.; Lv, X.; Fang, J.; Wang, M. CNN-based land cover classification combining stratified segmentation and fusion of point cloud and very high-spatial resolution remote sensing image Data. Remote. Sens. 2019, 11, 2065. [Google Scholar] [CrossRef] [Green Version]
- Lee, J.-S.; Park, T.-H. Fast road detection by cnn-based camera–lidar fusion and spherical coordinate transformation. IEEE Trans. Intell. Transp. Syst. 2021, 22, 5802–5810. [Google Scholar] [CrossRef]
- Gu, S.; Lu, T.; Zhang, Y.; Alvarez, J.M.; Yang, J.; Kong, H. 3-D LiDAR + monocular camera: An inverse-depth-induced fusion framework for urban road detection. IEEE Trans. Intell. Veh. 2018, 3, 351–360. [Google Scholar] [CrossRef]
- Gu, S.; Zhang, Y.; Tang, J.; Yang, J.; Kong, H. Road detection through CRF based lidar-camera fusion. In Proceedings of the 2019 International Conference on Robotics and Automation (ICRA), Montreal, QC, Canada, 20–24 May 2019; pp. 3832–3838. [Google Scholar]
- Narita, G.; Seno, T.; Ishikawa, T.; Kaji, Y. Panoptic fusion: Online volumetric semantic mapping at the level of stuff and things. In Proceedings of the 2019 IEEE/RSJ International Conference on Intelligent Robots and Systems (IROS), Macau, China, 4–8 November 2019; pp. 4205–4212. [Google Scholar]
- Zhang, R.; Li, G.; Li, M.; Wang, L. Fusion of images and point clouds for the semantic segmentation of large-scale 3D scenes based on deep learning. ISPRS J. Photogramm. Remote. Sens. 2018, 143, 85–96. [Google Scholar] [CrossRef]
- Riemenschneider, H.; Bódis-Szomorú, A.; Weissenberg, J.; Van Gool, L. Learning where to classify in multi-view semantic segmentation. In Programming Languages and Systems; Springer Science and Business Media: Berlin/Heidelberg, Germany, 2014; pp. 516–532. [Google Scholar]
- Qi, X.; Liao, R.; Jia, J.; Fidler, S.; Urtasun, R. 3D graph neural networks for RGBD semantic segmentation. In Proceedings of the 2017 IEEE International Conference on Computer Vision (ICCV), Venice, Italy, 22–29 October 2017; pp. 5199–5208. [Google Scholar]
- Gupta, S.; Girshick, R.; Arbeláez, P.; Malik, J. Learning rich features from RGB-D images for object detection and segmentation. In Programming Languages and Systems; Springer Science and Business Media: Berlin/Heidelberg, Germany, 2014; pp. 345–360. [Google Scholar]
- Jaritz, M.; De Charette, R.; Wirbel, E.; Perrotton, X.; Nashashibi, F. Sparse and dense data with CNNs: Depth completion and semantic segmentation. In Proceedings of the 2018 International Conference on 3D Vision (3DV), Verona, Italy, 5–8 September 2018; pp. 52–60. [Google Scholar]
- Dai, A.; Nießner, M. 3DMV: Joint 3D-multi-view prediction for 3D semantic scene segmentation. In Lecture Notes in Computer Science; Springer: Berlin/Heidelberg, Germany, 2018; pp. 458–474. [Google Scholar]
- Lv, X.; Liu, Z.; Xin, J.; Zheng, N. A novel approach for detecting road based on two-stream fusion fully convolutional network. IEEE Intell. Veh. Symp. 2018, 1464–1469. [Google Scholar] [CrossRef]
- Yang, F.; Yang, J.; Jin, Z.; Wang, H. A Fusion model for road detection based on deep learning and fully connected CRF. In Proceedings of the 13th Annual Conference on System of Systems Engineering (SoSE), Paris, France, 19–22 June 2018; pp. 29–36. [Google Scholar]
- Su, H.; Jampani, V.; Sun, D.; Maji, S.; Kalogerakis, E.; Yang, M.-H.; Kautz, J. Splatnet: Sparse lattice networks for point cloud processing. In Proceedings of the 2018 IEEE/CVF Conference on Computer Vision and Pattern Recognition, Salt Lake City, UT, USA, 18–23 June 2018; Institute of Electrical and Electronics Engineers (IEEE): New York, NY, USA, 2018; pp. 2530–2539. [Google Scholar]
- Jaritz, M.; Gu, J.; Su, H. Multi-view pointnet for 3D scene understanding. In Proceedings of the 2019 IEEE/CVF International Conference on Computer Vision Workshop (ICCVW), Seoul, Korea, 27 October–2 November 2019; pp. 3995–4003. [Google Scholar]
- Li, Z.; Gan, Y.; Liang, X.; Yu, Y.; Cheng, H.; Lin, L. LSTM-CF: Unifying context modeling and fusion with LSTMs for RGB-D scene labeling. In Machine Learning in Clinical Neuroimaging; Springer: Berlin/Heidelberg, Germany, 2016; pp. 541–557. [Google Scholar]
- Liu, H.; Wu, W.; Wang, X.; Qian, Y. RGB-D joint modelling with scene geometric information for indoor semantic segmentation. Multimed. Tools Appl. 2018, 77, 22475–22488. [Google Scholar] [CrossRef]
- Hou, J.; Dai, A.; NieBner, M. 3D-SIS: 3D semantic instance segmentation of RGB-D scans. In Proceedings of the 2019 IEEE/CVF Conference on Computer Vision and Pattern Recognition (CVPR), Long Beach, CA, USA, 16–20 June 2019; pp. 4416–4425. [Google Scholar]
- Yu, D.; Xiong, H.; Xu, Q.; Wang, J.; Li, K. Multi-stage residual fusion network for lidar-camera road detection. In Proceedings of the 2019 IEEE Intelligent Vehicles Symposium (IV), Paris, France, 9–12 June 2019; Institute of Electrical and Electronics Engineers (IEEE): New York, NY, USA, 2019; pp. 2323–2328. [Google Scholar]
- Li, H.; Chen, Y.; Zhang, Q.; Zhao, D. Bifnet: Bidirectional fusion network for road segmentation. IEEE Trans. Cybern. 2021, 1–12. [Google Scholar] [CrossRef]
- Yuan, J.; Zhang, K.; Xia, Y.; Qi, L. A fusion network for semantic segmentation using RGB-D data. In Proceedings of the Ninth International Conference on Graphic and Image Processing (ICGIP), Qingdao, China, 14–16 October 2018; p. 1061523. [Google Scholar]
- Hu, X.; Yang, K.; Fei, L.; Wang, K. ACNET: Attention based network to exploit complementary features for RGBD semantic segmentation. In Proceedings of the 2019 IEEE International Conference on Image Processing (ICIP), Taipei, Taiwan, 22–25 September 2019; pp. 1440–1444. [Google Scholar]
- Chen, H.; Li, Y. Three-stream attention-aware network for RGB-D salient object detection. IEEE Trans. Image Process. 2019, 28, 2825–2835. [Google Scholar] [CrossRef]
- Zhou, W.; Yuan, J.; Lei, J.; Luo, T. TSNet: Three-stream self-attention network for RGB-D indoor semantic segmentation. IEEE Intell. Syst. 2021, 36, 73–78. [Google Scholar] [CrossRef]
- Liu, C.; Wu, J.; Furukawa, Y. FloorNet: A unified framework for floorplan reconstruction from 3D scans. In Medical Image Computing and Computer-Assisted Intervention; Springer Science and Business Media: Berlin/Heidelberg, Germany, 2018; pp. 203–219. [Google Scholar]
- Caltagirone, L.; Bellone, M.; Svensson, L.; Wahde, M. Lidar—camera fusion for road detection using fully convolutional neural networks. Robot. Auton. Syst. 2019, 111, 125–131. [Google Scholar] [CrossRef] [Green Version]
- Kim, D.-K.; Maturana, D.; Uenoyama, M.; Scherer, S. Season-invariant semantic segmentation with a deep multimodal network. In Experimental Robotics; Springer: Berlin/Heidelberg, Germany, 2018; pp. 255–270. [Google Scholar]
- Chiang, H.-Y.; Lin, Y.-L.; Liu, Y.-C.; Hsu, W.H. A Unified point-based framework for 3D segmentation. In Proceedings of the 2019 International Conference on 3D Vision (3DV), Montreal, QC, Canada, 16–19 September 2019; Institute of Electrical and Electronics Engineers (IEEE): New York, NY, USA, 2019; pp. 155–163. [Google Scholar]
- Chen, Z.; Zhang, J.; Tao, D. Progressive lidar adaptation for road detection. IEEE/CAA J. Autom. Sin. 2019, 6, 693–702. [Google Scholar] [CrossRef] [Green Version]
- Xu, J.; Zhang, R.; Dou, J.; Zhu, Y.; Sun, J.; Pu, S. Rpvnet: A deep and efficient range-point-voxel fusion network for lidar point cloud segmentation. arXiv 2021, arXiv:2103.12978. [Google Scholar]
- Nakajima, Y.; Kang, B.; Saito, H.; Kitani, K. Incremental class discovery for semantic segmentation with RGBD sensing. In Proceedings of the 2019 IEEE/CVF International Conference on Computer Vision (ICCV), Seoul, Korea, 27 October–2 November 2019; pp. 972–981. [Google Scholar]
- Martinovic, A.; Knopp, J.; Riemenschneider, H.; Van Gool, L. 3D all the way: Semantic segmentation of urban scenes from start to end in 3D. In Proceedings of the 2015 IEEE Conference on Computer Vision and Pattern Recognition (CVPR), Boston, MA, USA, 7–12 June 2015; Institute of Electrical and Electronics Engineers (IEEE): New York, NY, USA, 2015; pp. 4456–4465. [Google Scholar]
- Arcos-García, Á.; Soilán, M.; Álvarez-García, J.A.; Riveiro, B. Exploiting synergies of mobile mapping sensors and deep learning for traffic sign recognition systems. Expert Syst. Appl. 2017, 89, 286–295. [Google Scholar] [CrossRef]
- Guan, H.; Yan, W.; Yu, Y.; Zhong, L.; Li, D. Robust traffic-sign detection and classification using mobile lidar data with digital images. IEEE J. Sel. Top. Appl. Earth Obs. Remote. Sens. 2018, 11, 1715–1724. [Google Scholar] [CrossRef]
- Barea, R.; Perez, C.; Bergasa, L.M.; Lopez-Guillen, E.; Romera, E.; Molinos, E.; Ocana, M.; Lopez, J. Vehicle detection and localization using 3D lidar point cloud and image semantic segmentation. In Proceedings of the 2018 21st International Conference on Intelligent Transportation Systems (ITSC), Big Island, HI, USA, 4–7 November 2018; pp. 3481–3486. [Google Scholar]
- Guan, H.; Yu, Y.; Peng, D.; Zang, Y.; Lu, J.; Li, A.; Li, J. A convolutional capsule network for traffic-sign recognition using mobile lidar data with digital images. IEEE Geosci. Remote. Sens. Lett. 2019, 17, 1067–1071. [Google Scholar] [CrossRef]
- Lahoud, J.; Ghanem, B. 2D-driven 3D object detection in RGB-D images. In Proceedings of the 2017 IEEE International Conference on Computer Vision (ICCV), Venice, Italy, 22–29 October 2017; Institute of Electrical and Electronics Engineers (IEEE): New York, NY, USA, 2017; pp. 4632–4640. [Google Scholar]
- Du, X.; Ang, M.H.; Karaman, S.; Rus, D. A general pipeline for 3D detection of vehicles. In Proceedings of the 2018 IEEE International Conference on Robotics and Automation (ICRA), Brisbane, Australia, 21–25 May 2018; pp. 3194–3200. [Google Scholar]
- Qi, C.R.; Liu, W.; Wu, C.; Su, H.; Guibas, L.J. Frustum pointnets for 3D object detection from RGB-D data. In Proceedings of the 2018 IEEE/CVF Conference on Computer Vision and Pattern Recognition (CVPR), Salt Lake City, UT, USA, 18–22 June 2018; pp. 918–927. [Google Scholar]
- Zhao, X.; Liu, Z.; Hu, R.; Huang, K. 3D object detection using scale invariant and feature reweighting networks. In Proceedings of the Proceedings of the AAAI Conference on Artificial Intelligence, Honolulu, HI, USA, 27 January–1 February 2019; Association for the Advancement of Artificial Intelligence (AAAI): Palo Alto, CA, USA, 2019; Volume 33, pp. 9267–9274. [Google Scholar]
- Wang, Z.; Jia, K. Frustum convnet: Sliding frustums to aggregate local point-wise features for amodal 3D object detection. In Proceedings of the 2019 IEEE/RSJ International Conference on Intelligent Robots and Systems (IROS), Macau, China, 4–8 November 2019; pp. 1742–1749. [Google Scholar]
- Shin, K.; Kwon, Y.P.; Tomizuka, M. Roarnet: A robust 3D object detection based on region approximation refinement. In Proceedings of the 2019 IEEE Intelligent Vehicles Symposium (IV), Paris, France, 9–12 June 2019; pp. 2510–2515. [Google Scholar]
- Yang, Z.; Sun, Y.; Liu, S.; Shen, X.; Jia, J. Ipod: Intensive point-based object detector for point cloud. arXiv 2018, arXiv:1812.05276. [Google Scholar]
- Vora, S.; Lang, A.H.; Helou, B.; Beijbom, O. Pointpainting: Sequential fusion for 3D object detection. In Proceedings of the 2020 IEEE/CVF Conference on Computer Vision and Pattern Recognition (CVPR), Seattle, WA, USA, 16–18 June 2020; pp. 4603–4611. [Google Scholar]
- Song, S.; Xiao, J. Deep sliding shapes for amodal 3D object detection in RGB-D images. In Proceedings of the 2016 IEEE Conference on Computer Vision and Pattern Recognition (CVPR), Las Vegas, NV, USA, 27–30 June 2016; pp. 808–816. [Google Scholar]
- Deng, Z.; Latecki, L.J. Amodal detection of 3D objects: Inferring 3D bounding boxes from 2D ones in RGB-depth images. In Proceedings of the 2017 IEEE Conference on Computer Vision and Pattern Recognition (CVPR), Honolulu, HI, USA, 21–26 June 2017; pp. 398–406. [Google Scholar]
- Wang, Z.; Zhan, W.; Tomizuka, M. Fusing bird’s eye view lidar point cloud and front view camera image for 3D object detection. In Proceedings of the 2018 IEEE Intelligent Vehicles Symposium (IV), Changshu, China, 30 June–1 July 2018; pp. 1–6. [Google Scholar]
- Yang, B.; Liang, M.; Urtasun, R. Hdnet: Exploiting hd maps for 3d object detection. In Proceedings of the Conference on Robot Learning, Zurich, Switzerland, 29–31 October 2018; pp. 146–155. [Google Scholar]
- Sindagi, V.A.; Zhou, Y.; Tuzel, O. MVX-Net: Multimodal voxelnet for 3D object detection. In Proceedings of the 2019 International Conference on Robotics and Automation (ICRA), Montreal, QC, Canada, 20–24 May 2019; pp. 7276–7282. [Google Scholar]
- Qi, C.R.; Chen, X.; Litany, O.; Guibas, L.J. Imvotenet: Boosting 3D object detection in point clouds with image votes. In Proceedings of the 2020 IEEE/CVF Conference on Computer Vision and Pattern Recognition (CVPR), Online Conference, 14–19 June 2020; Institute of Electrical and Electronics Engineers (IEEE): New York, NY, USA, 2020; pp. 4403–4412. [Google Scholar]
- Zhou, Y.; Sun, P.; Zhang, Y.; Anguelov, D.; Gao, J.; Ouyang, T.; Guo, J.; Ngiam, J.; Vasudevan, V. End-to-end multi-view fusion for 3d object detection in lidar point clouds. In Proceedings of the Conference on Robot Learning, London, UK/Online Conference, 8–11 November 2020; pp. 923–932. [Google Scholar]
- Xu, B.; Chen, Z. Multi-level fusion based 3D object detection from monocular images. In Proceedings of the 2018 IEEE/CVF Conference on Computer Vision and Pattern Recognition, Salt Lake City, UT, USA, 18–22 June 2018; pp. 2345–2353. [Google Scholar]
- Chen, X.; Ma, H.; Wan, J.; Li, B.; Xia, T. Multi-view 3D object detection network for autonomous driving. In Proceedings of the IEEE Conference on Computer Vision and Pattern Recognition, Honolulu, HI, USA, 21–26 July 2017; pp. 6526–6534. [Google Scholar]
- Liang, M.; Yang, B.; Wang, S.; Urtasun, R. Deep continuous fusion for multi-sensor 3D object detection. In Lecture Notes in Computer Science; Springer Science and Business Media: Berlin/Heidelberg, Germany, 2018; pp. 663–678. [Google Scholar]
- Lu, H.; Chen, X.; Zhang, G.; Zhou, Q.; Ma, Y.; Zhao, Y. Scanet: Spatial-channel attention network for 3D object detection. In Proceedings of the 2019 IEEE International Conference on Acoustics, Speech and Signal Processing (ICASSP), Brighton, UK, 12–17 May 2019; Institute of Electrical and Electronics Engineers (IEEE): New York, NY, USA, 2019; pp. 1992–1996. [Google Scholar]
- Xu, D.; Anguelov, D.; Jain, A. PointFusion: Deep sensor fusion for 3D bounding box estimation. In Proceedings of the 2018 IEEE/CVF Conference on Computer Vision and Pattern Recognition, Salt Lake City, UT, USA, 18–23 June 2018; pp. 244–253. [Google Scholar]
- Liang, M.; Yang, B.; Chen, Y.; Hu, R.; Urtasun, R. Multi-task multi-sensor fusion for 3D object detection. In Proceedings of the 2019 IEEE/CVF Conference on Computer Vision and Pattern Recognition (CVPR), Long Beach, CA, USA, 16–20 June 2019; pp. 7337–7345. [Google Scholar]
- Huang, T.; Liu, Z.; Chen, X.; Bai, X. EPNet: Enhancing point features with image semantics for 3D object detection. In Computer Vision—ECCV; Springer: Berlin/Heidelberg, Germany, 2020; pp. 35–52. [Google Scholar]
- Ku, J.; Mozifian, M.; Lee, J.; Harakeh, A.; Waslander, S.L. Joint 3D proposal generation and object detection from view aggregation. In Proceedings of the IEEE/RSJ International Conference on Intelligent Robots and Systems (IROS), Madrid, Spain, 1–5 May 2018; Institute of Electrical and Electronics Engineers (IEEE): New York, NY, USA, 2018; pp. 1–8. [Google Scholar]


| Name | Object | Class | Data | Data Type | Source | Task | |
|---|---|---|---|---|---|---|---|
| [98] | Stanford | - | 6 | 3D Model | Real-world | Stanford 3D Scanning Repository | Semantic Seg |
| 400 | 20 | Shape Watertight Database | |||||
| 31 | 6 | RGBD | Kinect | ||||
| [104] | ShapeNet | 3 M | 3135 | CAD Model | Real-world | Online Open-source | Semantic Seg |
| ShapeNetCore | 51.3 K | 55 | |||||
| ShapeNetSem | 12 K | 270 | |||||
| [122] | ShapeNet Core55 | 16.9 K | 16 | Point Cloud | Real-world | Online Open-source | Semantic Seg |
| 55 | Parts | Part Seg | |||||
| - | Voxel Model | 3D Rec | |||||
| [123] | PartNet | 573.6 K | 24 | Point Cloud | Real-world | Online Open-source | Herarchical Seg |
| [124] | ModelNet | 48 K | 40 | RGBD, CAD Model, Voxel | Synth-etic | 3D Warehouse | Cla |
| Yobi3D | |||||||
| SUN Database | Shape Comp | ||||||
| Princeton Shape |
| Name | Size (m2) | Amount | Object | Class | Data | Data Type | Sensor | Task | |
|---|---|---|---|---|---|---|---|---|---|
| [82] | - | - | 250 K | 300 | 51 | RGBD | Real-world | Kinect, Camera | Semantic Seg |
| [83] | - | - | - | 2.5 K | 27 | RGBD | Real-world | SLAM, Kinect | Semantic Seg |
| [86] | - | - | - | - | 127 | RGBDI | Real-world | Kinect | Semantic Seg, Scene Cla |
| [84] | Berkley B3DO | - | 849 | - | 50 | RGBD | Real-world | Kinect | Object Det |
| [125] | - | - | 111 | - | 6 | RGBD | Real-world | Kinect XtionPRO | Unknow Seg |
| [85] | - | - | 2.2 K | - | 9 | RGBD | Real-world | Kinect | Object Det |
| - | Point Cloud | ||||||||
| [87] | NYU v2 | - | 1.4 K | 35.0 K | - | RGBD | Real-world | Kinect | Instance Seg |
| [88] | - | - | - | 900 | 5 | RGBD | Real-world | Kinect | Object Det |
| [89] | SUN3D | - | 415 | - | 12 | RGBD, Camera Pose | Real-world | Xtion PRO | Semantic Seg |
| - | Camera Pose | ||||||||
| [90] | RGBD Scenes v.2 | - | - | - | 10 | RGBD | Synthetic | Trimble 3D Warehouse | Semantic Seg |
| Point Cloud | |||||||||
| Voxel Model | |||||||||
| CAD Model | |||||||||
| [91] | SUN RGB-D | - | 10.3 K | - | 800 | RGBD | Real-world | Intel Real-Sense, Asus Xtion, Kinect | Object Det |
| Point Cloud | |||||||||
| [92] | ViDRILO | - | 22.5 K | - | 10 | RGBD | Real-world | Kinect | Scene Cla |
| 0.3 M | Point Cloud | ||||||||
| [93] | SceneNN | 2124 | - | 1.5 K | - | RGBD | Real-world | Kinect, XtionPRO | Semantic Seg, Shape Comp, 3D Rec |
| 3D Mesh | |||||||||
| Camera Pose | |||||||||
| [94] | SceneNet | - | - | 3.7 K | - | RGBD | Synthetic | 3D CAD Model Repositories | Semantic Seg |
| 3D Secene | |||||||||
| [95] | SceneNet RGBD | - | 5 M | - | 255 | RGBD | Synthetic | 3D CAD Model Repositories | Semantic Seg, Object Det |
| - | 3D Secene | ||||||||
| Camera Pose | |||||||||
| [96] | - | - | 7.5 K | 118 | 11 | RGBD | Real-world | Kinect, Big Bird Da-taset | Object Det |
| 96.6 M | Point Cloud | ||||||||
| [99] | DIODE | - | 11.5 K | - | - | RGBD | Real-world | FARO Focus S350 | Semantic Seg |
| 170 M | Point Cloud | ||||||||
| - | Normal | ||||||||
| [100] | S3DIS | 6020 | - | - | 12 | RGBD Image | Real-world | Matterport Camera | Semantic Seg |
| 965 M | Colored Point Cloud | ||||||||
| - | Mutual Relationship | ||||||||
| [101] | 2D-3D-S | 6020 | 70.5 K | - | 13 | RGB Image | Real-world | Matterport Camera, Structured-light Sensors | Semantic Seg |
| 695 M | Colored Point Cloud | ||||||||
| - | 3D Mesh | ||||||||
| Normal | |||||||||
| Camera Pose | |||||||||
| Mutual Relationship | |||||||||
| [102] | ScanNet | 34453 | 2.5 M | 36.2 K | 19 | RGBD 3D Mesh Camera Pose CAD Model | Real-world | Kinect | Semantic Seg, 3D Rec |
| - | |||||||||
| [103] | - | 5000 | 682 | - | - | RGB Image | Real-world | Riegl, DSLR Cameras | Image Localization |
| 67 M | Point Cloud | ||||||||
| - | Mutual Relationship | ||||||||
| [126] | Robust-PointSet | - | - | 12.3 K | 40 | CAD Model | Synthetic | ModelNet40 | Robustness Evaluation |
| [105] | Scan-ObjectNN | - | - | 2.9 K | 15 | CAD Model | Synthetic | ModelNet40 | Semantic Seg, Object Det |
| [97] | Matterport | 219 K | 0.2 M | 50.8 K | 40 | RGBD | Real-world | Panorama Camera, SceneNN, ScanNet | Semantic Seg, Scene Cla |
| - | Point Cloud | ||||||||
| 3D Mesh |
| Name | Point | Object | Class | Data | Data Type | Sensor | Task | |
|---|---|---|---|---|---|---|---|---|
| [98] | New York City | - | 15 | 3 | Point Cloud | Real-world | Lidar sensor (MLS) | Semantic Seg |
| [127] | Sydney Urban Objects Dataset | 2.3 M | 588 | 26 | Point Cloud | Real-world | Velodyne (MLS) | Cla |
| Name | Size (km) | Amount | Object | Class | Data | Data Type | Sensor/ Data Source | Task | |
|---|---|---|---|---|---|---|---|---|---|
| [106,107] | KITTI | 39.2 | 12 K 1799 M | 200 K | 2 | RGB Image, Point Cloud | Real-world | Velodyne Camera | 3D & 2D Det SLAM |
| [108] | KITTI (Ros) | - | 216 | - | 11 | Labeled Image | Real-world | KITTI | 2D Seg |
| [109] | KITTI (Zhang) | - | 252 | - | 10 | Labeled Image | |||
| [110] | Semantic-KITTI | - | 4549 M | - | 28 | Point Cloud | 3D Seg | ||
| [120] | Virtual KITTI | - | 17 K | - | 13 | RGB Image | Synthetic | 2D Seg, 2D Det, Track, Optical Flow | |
| [128] | Paris-Rue-Madame | 0.16 | 20 M | 642 | 17 | Point Cloud | Real-world | Velodyne Riegl | 3D Seg |
| [129] | IQmulus | 10 | 300 M | - | 50 | Colored Point Cloud | Real-world | Stereopolis II | 3D Seg |
| [115] | Semantic3D.net | 4 B | - | 8 | Point Cloud | Real-world | TLS | 3D Seg | |
| [130] | Paris-Lille-3D | 1.94 | 143 M | - | 50 | Point Cloud | Real-world | Velodyne | 3D Seg |
| [121] | - | - | 100 K | - | 5 | Point Cloud | Synth-etic | Riegl 3D Model | 3D Seg,3D Det,3D Cla |
| [131] | - | - | 20 K | - | 300 | CAD models | Synth-etic | Stanford-Cars CompCars | 3D Object Pose Estimation |
| [118] | Argoverse | 290 | 107 K | 10.6 K | 17 | RGB Image | Real-world | VLP-32,GPS, Stereo Camera GPS/IMU | 3D Det, Object Track |
| - | Point Cloud | ||||||||
| [119] | Apollo-Scape | - | 144 K 120 K | - | 35 | RGBD Image, Point Cloud | Real-world | Riegl VMX-CS6 Camera GPS/IMU | 3D & 2D Seg, 3D & 2D Det, 3D Localize, 3D Rec |
| - | Sensor Pose | ||||||||
| [111] | nuScenes | 242 | 400 K 1.4 M | - | 23 | Point Cloud, Map | Real-world | LiDAR Scanner Radar Scanner Camera GPS/IMU | 3D & 2D Det, Track |
| - | Radar Signal, Sensor Pose | ||||||||
| [113] | A2D2 | - | 41,277 | - | 38 | RGB Image | Real-world | LiDAR Scanner Camera | 3D & 2D Seg, 3D & 2D Det, Depth Estima- tion, Optical Flow |
| - | Point Cloud, Mutual Rela- tionship | ||||||||
| [114] | Toronto-3D | 1 | 78.3 M | - | 8 | Colored Point Cloud | Real-world | Teledyne Optech Maverick Camera GNSS | 3D Seg |
| - | HD Map | ||||||||
| [116] | CSPC | - | 68 M | - | 6 | Colored Point Cloud | Velodyne Lady Bug 5 GPS/IMU | 3D Seg | |
| [117] | AIODrive | - | 250 K | 26 M | RGBD Image | Real-world | LiDAR Scanner Spad-LiDAR Scanner Radar Scanner RGBD Camera GPS/IMU | 3D Seg, 3D Det, Track, Trajectory Prediction, Depth Estimation | |
| - | Point Cloud, Sensor Pose | ||||||||
| [132] | PC-Urban | - | 4.3 B | - | 25 | Point Cloud | Real-world | Ouster LiDAR Scanner | 3D Seg |
| Name | Size (km²) | Amount | Class | Data | Data Type | Sensor | Task | |
|---|---|---|---|---|---|---|---|---|
| [133] | ISPRS | 0.15 | - | 2 | RGB Image, Point Cloud | Real-world | ALS | 3D Det, 3D Rec |
| 1.2 M | ||||||||
| [134] | DublinCity | 2 | 4471 1.4 B | 13 | RGB Image, Point Cloud | Real-world | NIKON D800E, Leica RCD30 (ALS) | 3D Seg, 3D Rec |
| [112] | Swiss3D-Cities | 2.7 | - | 5 | RGB Image, Point Cloud | Real-world | UAV | 3D Seg |
| 226 M | ||||||||
| [135] | SensatUrban | 7.64 | - | 13 | RGB Image, Point Cloud | Real-world | SODA Camera (UAV), RTK GNSS | 2D & 3D Seg |
| 2847 M | ||||||||
| [136] | DALES | 330 | 505 M | 8 | Point Cloud | Real-world | Riegl Q1560 (ALS) | 3D Seg, 3D Rec |
| [137] | LASDU | 1.02 | 3 M | 5 | Point Cloud | Real-world | ALS | 3D Seg, 3D Rec |
| [138] | Campus3D | 1.58 | 937 M | 24 | Colored Point Cloud | Real-world | UAV | 3D Seg, Instance Seg |
| [139] | Waycom | 76 | 250 K 12 M | 4 | RGB Image, Point Cloud | Real-world | MLS | 2D & 3D Det Track |
| Name | Data | Data 2 | Data Set | Acc | Class Acc | AP | IoU | F1-Score | Scene | Code | |
|---|---|---|---|---|---|---|---|---|---|---|---|
| [140] | UGrid-Fused | RGB, P | UGrid UView | KITTI | _ | _ | 89.5 90.0 | _ | 93.8 93.1 | Outdoor | No |
| [141] | _ | RGB, P | Grid BEV | KITTI | 81 | 49.4 | _ | 69.8 | _ | Outdoor | No |
| [142] | StdnDSN | RGB, P | StdnDSN | Self-collected | 91.5 | _ | _ | _ | _ | Outdoor | No |
| [143] | _ | RGB, P | Spherical Image | KITTI | _ | _ | 89.63 | _ | 94.3 | Outdoor | No |
Publisher’s Note: MDPI stays neutral with regard to jurisdictional claims in published maps and institutional affiliations. |
© 2021 by the authors. Licensee MDPI, Basel, Switzerland. This article is an open access article distributed under the terms and conditions of the Creative Commons Attribution (CC BY) license (https://creativecommons.org/licenses/by/4.0/).
Share and Cite
Zhao, J.; Wang, Y.; Cao, Y.; Guo, M.; Huang, X.; Zhang, R.; Dou, X.; Niu, X.; Cui, Y.; Wang, J. The Fusion Strategy of 2D and 3D Information Based on Deep Learning: A Review. Remote Sens. 2021, 13, 4029. https://doi.org/10.3390/rs13204029
Zhao J, Wang Y, Cao Y, Guo M, Huang X, Zhang R, Dou X, Niu X, Cui Y, Wang J. The Fusion Strategy of 2D and 3D Information Based on Deep Learning: A Review. Remote Sensing. 2021; 13(20):4029. https://doi.org/10.3390/rs13204029
Chicago/Turabian StyleZhao, Jianghong, Yinrui Wang, Yuee Cao, Ming Guo, Xianfeng Huang, Ruiju Zhang, Xintong Dou, Xinyu Niu, Yuanyuan Cui, and Jun Wang. 2021. "The Fusion Strategy of 2D and 3D Information Based on Deep Learning: A Review" Remote Sensing 13, no. 20: 4029. https://doi.org/10.3390/rs13204029