Correction

Correction: Kulk et al. Primary Production, an Index of Climate Change in the Ocean: Satellite-Based Estimates over Two Decades. Remote Sens. 2020, 12, 826

by
Gemma Kulk
1,*,
Trevor Platt
1,
James Dingle
1,
Thomas Jackson
1,
Bror F. Jönsson
1,
Heather A. Bouman
2,
Marcel Babin
3,
Robert J. W. Brewin
4,
Martina Doblin
5,
Marta Estrada
6,
Francisco G. Figueiras
7,
Ken Furuya
8,
Natalia González-Benítez
9,
Hafsteinn G. Gudfinnsson
10,
Kristinn Gudmundsson
10,
Bangqin Huang
11,
Tomonori Isada
12,
Žarko Kovač
13,
Vivian A. Lutz
14,
Emilio Marañón
15,
Mini Raman
16,
Katherine Richardson
17,
Patrick D. Rozema
18,
Willem H. van de Poll
18,
Valeria Segura
14,
Gavin H. Tilstone
1,
Julia Uitz
19,
Virginie van Dongen-Vogels
20,
Takashi Yoshikawa
8 and
Shubha Sathyendranath
21
add Show full author list remove Hide full author list
1
Earth Observation Science and Applications, Plymouth Marine Laboratory, Prospect Place, The Hoe, Plymouth PL1 3DH, UK
2
Department of Earth Sciences, University of Oxford, Oxford OX1 3AN, UK
3
Marine Optics and Remote Sensing Lab, Laboratoire d’Océanographie de Villifranche, B.P. 8, Quai de la Darse, CEDEX, 06238 Villefranche-sur-Mer, France
4
College of Life and Environmental Sciences, University of Exeter, Peter Lanyon Building, Treliever Road, Penryn, Cornwall TR10 9FE, UK
5
Plant Functional Biology and Climate Change Cluster, Faculty of Science, University of Technology Sydney, P.O. Box 123 Broadway, Sydney 2007, Australia
6
Institut de Ciències der Mar, CSIC, Pg. Marítim de la Barceloneta, 37-49, 08003 Barcelona, Spain
7
Instituto de Investigaciones Marinas, CSIC, Eduardo Cabello 6, 36208 Vigo, Spain
8
Graduate School of Agricultural and Life Sciences, The University of Tokyo, Tokyo 113-8657, Japan
9
Area of Biodiversity and Conservation, Universidad Rey Juan Carlos, Tulipán, 28933 Madrid, Spain
10
Marine and Freshwater Research Institute, Skúlagata 4, Reykjavík 101, Iceland
11
State Key Laboratory of Marine Environmental Science, Fujian Provincial Key Laboratory of Coastal Ecology and Environmental Studies, Xiamen University, Xiamen 361005, China
12
Akkeshi Marine Station, Field Science Center for Northern Biosphere, Hokkaido University, Aikkapu 1, Akkeshi, Hokkaido 088-1113, Japan
13
Faculty of Science, University of Split, Rudera Boškovi’ca 33, 21000 Split, Croatia
14
Instituto Nacional de Investigacion y Desarrollo Pesquero, Paseo Victoria Ocampo 1, Escollera Norte, Mar del Plata B7602HSA, Argentina
15
Departamento de Ecoloxía e Bioloxía Animal, Universidade de Vigo, Campus As Lagoas-Marcosende, 36310 Vigo, Spain
16
Space Application Center, ISRO, Jodhpur Tekra, Ambawadi Vistar P.O., Ahmedabad 380015, India
17
Center for Macroecology, Evolution and Climate, Globe Institute, University of Copenhagen, Universitetsparken 15, 2100 Copenhagen, Denmark
18
Department of Ocean Ecosystems, Energy and Sustainability Research Institute Groningen, University of Groningen, Nijenborgh 7, 9747 AG Groningen, The Netherlands
19
CNRS and Sorbonne Université, Laboratoire d’Océanographie de Villefranche, 181 Chemin du Lazaret, 06230 Villefranche-sur-mer, France
20
Oceanography and Shelf Processes Research, Australian Institute of Marine Science, PMB3, Townsville MC, Townsville 4810, Australia
21
National Centre for Earth Observation, Plymouth Marine Laboratory, Prospect Place, The Hoe, Plymouth PL1 3DH, UK
*
Author to whom correspondence should be addressed.
Remote Sens. 2021, 13(17), 3462; https://doi.org/10.3390/rs13173462
Submission received: 19 May 2021 / Accepted: 15 June 2021 / Published: 1 September 2021
(This article belongs to the Special Issue Feature Paper Special Issue on Ocean Remote Sensing)
Since the article “Primary Production, an Index of Climate Change in the Ocean: Satellite-Based Estimates over Two Decades” by Kulk et al. [1] was published, we discovered an error in the code of the primary production model, which crept in when the code was updated from the original version described by Platt and Sathyendranath (1988), Sathyendranath et al. (1995) and Longhurst et al. (1995) ([2,31,52] in [1]). The main error in the code led to a time interval for the integration of daily water-column primary production that was shorter than it should have been. As a consequence, daily surface irradiance and hence primary production were systematically underestimated by 20–25% for the entire time series. We also discovered that the Photosynthetic Active Radiation (PAR) products of the National Aeronautics and Space Administration (NASA) that were used to scale the daily light cycle were rounded down for 2003–2019 (MODIS years), which led to an additional but small underestimation of daily surface irradiance. In addition to addressing these errors, we have included a merged time series of the PAR product to remove inter-sensor biases (as described in the corrected text of Appendix B; see below).
The main corrections increased our estimate of global annual primary production on average by +23.9% between 1998 and 2018, while the correction of the rounding error in the PAR products increased global annual primary production between 2003 and 2018 by +0.9%. Inclusion of the merged PAR product in the primary production model caused a −0.25% decrease in global annual primary production between 1998 and 2002 and a +0.08% increase between 2003 and 2010 (relative to the aforementioned +23.9% increase for the entire time series). Our estimate of global annual primary production between 1998 and 2018 now is 48.7 to 52.5 Gt C y−1 instead of the published estimate of 38.8 to 42.1 Gt C y−1. Although this is a substantial increase in the estimate of primary production, the results of the sensitivity analysis in which the photosynthesis versus irradiance parameters were varied by ±1 standard deviation and, importantly, the observed trends in regional and global annual primary production are largely unchanged. We therefore consider the outcomes of the study still valid after the corrections. We also note that our corrected estimate of global annual primary production is still within the range of earlier reports (32.0–70.7 Gt C y−1 [5,104] in [1]).
The corrected paragraphs, tables and figures appear below. All references mentioned below can be found in the original article [1]. The corrections affect a number of results, but the nature of the corrections is largely the same: the magnitude of primary production has increased significantly everywhere, whereas the trends have been affected only marginally, and the major conclusions remain unchanged, except for the magnitude of marine primary production. The authors apologise for any inconvenience caused. The original article has been updated.

1. Text Corrections

1.1. A Correction Has Been Made to the Abstract

Primary production by marine phytoplankton is one of the largest fluxes of carbon on our planet. In the past few decades, considerable progress has been made in estimating global primary production at high spatial and temporal scales by combining in situ measurements of primary production with remote-sensing observations of phytoplankton biomass. One of the major challenges in this approach lies in the assignment of the appropriate model parameters that define the photosynthetic response of phytoplankton to the light field. In the present study, a global database of in situ measurements of photosynthesis versus irradiance (P-I) parameters and a 20-year record of climate quality satellite observations were used to assess global primary production and its variability with seasons and locations as well as between years. In addition, the sensitivity of the computed primary production to potential changes in the photosynthetic response of phytoplankton cells under changing environmental conditions was investigated. Global annual primary production varied from 48.7 to 52.5 Gt C yr−1 over the period of 1998–2018. Inter-annual changes in global primary production did not follow a linear trend and regional differences in the magnitude and direction of change in primary production were observed. Trends in primary production followed directly from changes in chlorophyll-a and were related to changes in the physico-chemical conditions of the water column due to inter-annual and multi-decadal climate oscillations. Moreover, the sensitivity analysis in which P-I parameters were adjusted by ±1 standard deviation showed the importance of accurately assigning photosynthetic parameters in global and regional calculations of primary production. The assimilation number of the P-I curve showed strong relationships with environmental variables such as temperature and had a practically one-to-one relationship with the magnitude of change in primary production. In the future, such empirical relationships could potentially be used for a more dynamic assignment of photosynthetic rates in the estimation of global primary production. Relationships between the initial slope of the P-I curve and environmental co-variables were more elusive.

1.2. Corrections Have Been Made to Results, 3.1 Global and Regional Annual Primary Production, Paragraph 1

Global annual primary production computed using mean photosynthesis versus irradiance (P-I) parameters (for each biogeographic province and for each season) varied from 48.7 to 52.5 Gt C y−1 in the period 1998–2018 (Table 2; Figure 3 and Figure 4A). Summer (14.6–16.0 Gt C) was the most productive season in each of the years, followed by spring (13.5–14.7 Gt C), autumn (11.0–11.9 Gt C per season) and winter (9.4–10.2 Gt C per season) (Figure 4B). On regional scales, annual primary production was highest in the Pacific Ocean (43.2–44.5%), followed by the Atlantic (27.8–28.8%), Indian (15.7–16.7%) and Antarctic oceans (11.3–12.0%) (Table 2; Figure 3). In addition, the highest annual primary production rates were found at low latitudes in the Trades biome (39.2–40.7%), followed by the Westerlies (29.7–31.1%), Coastal (22.2–23.7%) and Polar biomes (6.3–7.3%) (Table 2; Figure 3). These regional differences in annual primary production were related to the surface areas of the specific ocean basins and biomes (r2 = 0.674, p < 0.01), with the coastal regions being relatively more and polar regions relatively less productive than the other regions when computed as a rate per unit area (Table 2; Figure 3A).

1.3. Corrections Have Been Made to Results, 3.2. Trends in Primary Production, Paragraph 2

Inter-annual trends in global primary production showed an increase in rates between 1998 and 2003; relatively stable rates between 2003 and 2011; and a subsequent decrease in rates until 2015, after which rates showed a minor increase (Figure 4A). Annual primary production in the Atlantic and Pacific oceans showed similar inter-annual trends to global primary production (r2 = 0.856, 0.913, p < 0.001) (Figure 4C). Trends in annual primary production in the other ocean basins varied from the global trend, with relatively lower production between 2003 and 2011 in the Antarctic Ocean (r2 = 0.712, p < 0.001) and a relatively early decrease in production in the Indian Ocean (r2 = 0.767, p < 0.001) (Figure 4C). Annual primary production in the Coastal, Trades and Westerlies biomes showed inter-annual trends comparable with that in global primary production (r2 = 0.794–0.922, p < 0.001), with relatively higher rates observed between 1998 and 2000 in the Trades biome and a relatively slow increase in production between 1998 and 2011 in the Westerlies biome (Figure 4E). In the Polar biome, production decreased relatively early between 2004 and 2011 and was relatively high after 2015 compared with the trends in global annual primary production (r2 = 0.583, p < 0.001).

1.4. Corrections Have Been Made to Results, 3.2. Trends in Primary Production, Paragraph 3

Trends in seasonal global primary production were highest in late spring to mid-summer, with the lowest rates observed in December for the Northern Hemisphere and in June for the Southern Hemisphere (Figure 4B). Most regions showed similar seasonal trends in primary production, with the peak occurring either earlier (Pacific Ocean and Westerlies and Coastal biomes) or later (Antarctic and Atlantic oceans and Polar biome) in summer (r2 = 0.790–0.958, p < 0.001) (Figure 4D,F). Monthly primary production in the Trades biome was more variable from spring to autumn compared with the global trend (r2 = 0.758, p < 0.001) (Figure 4D). Trends in seasonal primary production in the Indian Ocean deviated most from the global trend, with two peaks in monthly primary production observed in spring and autumn and the lowest rates observed in summer (Figure 4F).

1.5. Corrections Have Been Made to Results, 3.2. Trends in Primary Production, Paragraph 4

Inter-annual and seasonal trends in global primary production were closely related to chlorophyll-a biomass (Spearman’s rank correlation coefficient rs = 0.661–0.939, p < 0.01) (Figure 3C). In the Pacific Ocean and Westerlies biome, annual primary production was also related to Photosynthetic Active Radiation (PAR) (rs = 0.438–0.436, p < 0.05) (Figure 3E). The variations in global primary production were associated with trends in the El Niño-Southern Oscillation (ENSO) (Multi-variate ENSO Index (MEI), r = −0.309; ENSO Eastern Pacific (EP) index, r = −0.469) and the Atlantic Multi-decadal Oscillation (AMO) (r = 0.419). The initial increase in global annual primary production between 1998 and 2003 was related to ENSO (EP index, r = −0.956), AMO (r = 0.971) and the Indian Ocean Dipole (IOD) (r = 0.563), while the decrease in global annual primary production after 2011 was related to ENSO (MEI, r = −0.664; ENSO Central Pacific (CP) index, r = −0.883) and the Pacific Decadal Oscillation (PDO) (r = −0.832).

1.6. Corrections Have Been Made to Results, 3.3. Sensitivity of Primary Production to Changes in Photosynthetic Parameters, Paragraph 1

Global annual primary production varied from 25.7 to 27.8 Gt C y−1 between 1998 and 2018 when both P-I parameters were reduced simultaneously by one standard deviation (−1 SD), whereas the values ranged from 70.8 to 76.2 Gt C y−1 when the P-I parameters were increased by one standard deviation (+1 SD) (−46.4% and +44.8% compared with the results using the mean P-I estimates) (Table 2; Figure 3D,F and Figure 5). The magnitude of the decrease in primary production when the P-I parameters were adjusted by −1 standard deviation was always greater than the increase in production when the P-I parameters were adjusted by +1 standard deviation (Figure 5). The sensitivity of primary production to changes in P-I parameters was highest in the Atlantic Ocean, followed by the Pacific, Antarctic and Indian oceans (Figure 3D,F and Figure 5; Table 2). The sensitivity was highest in the Trades biome and lowest in the Westerlies biome (Figure 3D,F and Figure 5; Table 2). Trends in global and regional annual primary production for the sensitivity analyses (data not shown) were similar to those observed for the main model run with mean P-I parameters (Table 2; Figure 3B and Figure 4) (r2 = 0.983–0.999, p < 0.001).

1.7. Corrections Have Been Made to Results, 3.3. Sensitivity of Primary Production to Changes in Photosynthetic Parameters, Paragraph 2

On a seasonal basis, global primary production changed between −50.1 to −43.9% and +42.2 to +48.5% when the photosynthetic parameters were adjusted by −1 and +1 standard deviation, respectively (Figure 5). The highest deviation from the mean P-I-based primary production estimates was observed during summer in the Atlantic Ocean and during spring in the Trades biome, whereas the lowest deviation was observed during autumn in the Antarctic Ocean and during winter in the Westerlies biome. Trends in seasonal primary production were similar to those observed for the mean photosynthetic parameters estimates (Figure 4) when the photosynthetic parameters were adjusted by +1 standard deviation (data not shown). When the photosynthetic parameters were adjusted by −1 standard deviation, seasonal trends changed in the Indian Ocean and the Coastal and Trades biomes. Primary production in these regions became relatively lower in spring and summer compared with other seasons (data not shown). No changes in seasonal primary production trends were observed in the Antarctic, Atlantic and Pacific oceans and the Polar and Westerlies biomes when photosynthetic parameters were adjusted by −1 standard deviation.

1.8. Corrections Have Been Made to Results, 3.4. Relationship between Photosynthetic Parameters and Primary Production, Paragraph 1

It was expected that the changes in the magnitude of global and regional primary production were driven by variations in photosynthetic parameters, as all other input variables remained unchanged between the different model computations. When the relative change in primary production was compared with that of the P-I parameters for −1 SD and +1 SD estimates, variations were shown to be closely coupled (the light adaptation parameter Ik was unchanged) (Figure 6). Both the initial slope of the P-I curve (αB) (r2 = 0.536 for −1 SD and r2 = 0.571 for +1 SD estimates) and the assimilation number ( P m B ) (r2 = 0.711 for −1 SD and r2 = 0.670 for +1 SD estimates) showed positive linear relationships with primary production for each season and biogeographical province. The weaker sensitivity of daily water-column primary production to change in αB, relative to that of P m B , could be explained by the importance of αB under light-limited conditions, as opposed to P m B , whose effect is dominant in light-saturating conditions. It is important to note that the ratio of P m B to αB (i.e., Ik) remained unchanged between these different estimates of primary production. Independent variations in αB and P m B that modify Ik could lead to higher sensitivity of primary production to the change [100–103]. The sensitivity analysis in which αB and P m B were independently adjusted by ±1 standard deviation (variable Ik) showed that changes in P m B caused greater variation in global annual primary production than changes in αB (Figure 7). Significant relationships between P-I parameters and primary production were also observed when αB and P m B were varied independently (−1 SD αB: y = 0.617 x, r2 = 0.862; +1 SD αB: y = 0.369 x, r2 = 0.534; −1 SD P m B : y = 0.704 x, r2 = 0.893; +1 SD P m B : y = 0.444 x, r2 = 0.723). When Ik increased (−1 SD αB and +1 SD P m B ), primary production became more sensitive to changes in P m B compared with those in αB (see slope of relationships above).

1.9. Corrections Have Been Made to the Discussion, Paragraph 1

In the present study, a global database of photosynthesis versus irradiance (P-I) parameters, together with a 20-year time series of remote-sensing-based chlorophyll-a concentrations, was used to study the magnitude and variability in marine primary production on a global scale. The estimate for global annual primary production of 48.7–52.5 Gt C y−1 between 1998 and 2018 in this study was within the range reported before (32.0–70.7 Gt C y−1) [5,104] and close to earlier reported values for depth- and wavelength-resolved primary production models (45–56 Gt C y−1) [2,4,5,7,22]. According to the model used in this study, primary production depends on phytoplankton biomass (in chlorophyll units), Photosynthetic Active Radiation (PAR, 400–700 nm; total value and its spectral and angular distribution) and on the assigned values of the photosynthetic and chlorophyll-a profile parameters. Although the model does not explicitly include the effects of environmental variables such as temperature and nutrients, or mixed-layer dynamics, these were implicitly accounted for through the photosynthetic and chlorophyll-a profile parameters, which were assigned by season and biogeographical province [2,16]. Based on an inter-comparison of various primary production models, it has been reported that primary production generally increases at higher chlorophyll-a concentrations, higher PAR and shallower mixed-layer depths, whereas variability in temperature could either increase or decrease primary production [4]. In the present study, trends in global and regional annual primary production were best explained by variations in chlorophyll-a concentration, which in turn may vary with seasonal, inter-annual and multi-decadal variations in physico-chemical conditions of the water column [17–19]. This study confirmed that global annual primary production varied with the ENSO and AMO [17–19,26], but not all variation in global annual primary production could be explained by large-scale ocean-atmospheric oscillations. The previously reported negative (linear) trend in global annual primary production [25,27,28] was not observed in the present study. Instead, a more dynamic pattern of inter-annual trends in primary production was revealed at global and regional scales (also see [26,29]).

1.10. Corrections Have Been Made to Discussion, Paragraph 2

The assignment of photosynthetic parameters remains one of the major challenges in the assessment of global annual primary production using numerical models based on remote-sensing observations [31–34]. In this study, we have tackled this problem by assembling a database of around ten thousand observations that covered the majority of the biogeographical provinces of Longhurst [16]. The sensitivity of primary production to variations in the photosynthetic parameters was further studied by investigating the effect on primary production of changing P-I parameters from their mean values. P-I parameters may vary 2–10-fold among different biogeographical provinces (this study; [33,86,105]). This variation may reflect natural variability but might also be affected to some extent by small differences in measurement protocols from author to author [33,86]. In the database used here, we tried to minimise the latter source of variability, for example by correcting values of the initial slope of the P-I curve (αB) for the spectral quality of the light source used in the P-I experiment (also see [33]). A sensitivity analysis in which P-I parameters were adjusted by ±1 standard deviation revealed that the variation in photosynthetic rates may lead to a decrease or an increase in the magnitude of global annual primary production by 45–47%. Global annual primary production remained close to the range of earlier observations (32.0–70.7 Gt C y−1) [2,4,5,22] when both P-I parameters were adjusted by +1 standard deviation (+1 SD) (70.8–76.2 Gt C y−1), but adjustments by −1 standard deviation (−1 SD) resulted in considerably lower global annual primary production rates (25.7–27.8 Gt C y−1). Seasonal trends in global primary production were little affected, as the magnitude of change in P-I parameters was similar among seasons. The sensitivity analysis illustrated the importance of the parameters that describe the relationship between phytoplankton biomass and PAR in the calculations of primary production, but adjusting the P-I parameters by ±1 standard deviation would represent the lower and upper limits of change in the photosynthetic response of phytoplankton cells. It would therefore be important to better understand the variability in P-I parameters and subsequent estimates of primary production under natural variations in environmental conditions and under global climate change.

1.11. A Correction Has Been Made to the Discussion, Paragraph 4

The relationship between photosynthetic parameters and temperature is of particular interest in understanding the scope of change in primary production under global climate change. Over the past few decades, SST has increased by 0.5 °C and is projected to increase a further 1.5–4.0 °C under different CO2 emission scenarios [24]. The rise in SST and subsequent changes in stratification and nutrient loading into the euphotic zone are expected to affect phytoplankton growth and primary production [23,24]. One estimate of a potential change in annual primary production arising from variations in photosynthetic parameters under global climate change can be arrived at by using SST as the main driver of change in P m B . Assuming a simplified linear relationship between P m B and temperature in the Coastal biome (where temperature dependence of P m B was highest; P m B = 0.13 * T + 1.82, r2 = 0.872 for T < 20 °C), P m B might be expected to increase by 8.3% under a rise of SST of +2 °C. Based on the relationships between P m B and primary production estimates presented in this study (Figure 7; assuming Ik is unchanged), annual primary production in the Coastal biome could increase by +0.92 Gt C y−1. Depending on the specific relationship with temperature, variations in P-I parameters and subsequent estimates of global primary production may vary on regional scales (for example, +13.4% in P m B in the Polar biome). The actual variation in P-I parameters and primary production under global climate change would be more complex and the interplay between different physico-chemical conditions will have a major effect on the direction of change.

1.12. Corrections Have Been Made to Conclusions, Paragraph 1

It is the first time that highly quality-controlled, multi-sensor, inter-sensor-bias-corrected, ocean-colour observations extending over two decades have been combined with the increased spatial and temporal coverage of in situ observations of the photosynthetic parameters of phytoplankton to compute the magnitude and variability of primary production on a global scale. This has led to a more accurate assessment of global annual primary production and its trends over the past 20 years. Variability in global annual primary production could be related to inter-annual and multi-decadal oscillations, such that the present record of ocean-colour observations is not of sufficient length to detect trends associated with climate change [112]. Here, we report an inter-annual variability (standard deviation) of ±2.7% around a mean of 50.7 Gt C y−1 within the two decades studied. The importance of accurately assigning photosynthetic parameters in global and regional calculations of primary production has been illustrated by a sensitivity analysis. With the recent development of a global database of in situ measurements of P-I parameters [33] and the subsequent enhancement of the database (this study), photosynthetic parameters could be assigned to almost all biogeographical provinces (defined by Longhurst [16]). This has considerably improved the confidence with which regional primary production can be estimated, especially in those regions that were previously known to be different from others, such as the Arabian Sea and the Antarctic Ocean [110]. Yet, the need to improve P-I data coverage in large areas of the global ocean remains (this study, Figure 1; [33,49,86]). In particular, large areas of the Pacific and Indian oceans remain poorly sampled. Methods designed to assign photosynthetic parameters based on their relationships to other variables amenable to remote sensing [106,110] could, in the future, lead to a more dynamic assignment of these parameters. Sea-surface temperature and phytoplankton community-size structure (this study; [33,38,40,41,86,105,107,108]) could be suitable variables for further development of such methods for different ocean basins and biomes.

1.13. A Correction Has Been Made to Appendix A. Model of Daily Water-Column Primary Production, Appendix A.2 Irradiance Field, Paragraph 1

Spectrally resolved irradiance at the sea surface was computed using a clear-sky model and expressed as the sum of a direct sunlight component and a diffuse skylight component. The surface direct and diffuse components were then scaled to match the daily Photosynthetic Active Radiation (PAR, 400–700 nm) products from the National Aeronautics and Space Administration (NASA) (https://oceancolor.gsfc.nasa.gov/, accessed on 20 August 2020) and corrected for reflection and refraction at the sea surface assuming a flat ocean. To limit inter-sensor biases, a merged PAR product was generated by referencing PAR from SeaWiFS to MODIS by linear regression on a pixel-by-pixel basis for overlapping years (2003–2010). The PAR time series consisted of SeaWiFS-shifted-to-MODIS products for 1998–2002, an average of SeaWiFS and MODIS products for 2003–2010 and MODIS products for 2011–2018. The spectrally resolved irradiance just below the surface was then used to construct the underwater light field (I(z,λ,θ) in µmol photons m−2 s−1), as the sum of a direct (d) and a diffuse (s) component of solar irradiance [113].

2. Figure/Table Corrections

2.1. Corrections Have Been Made to Table 2

Table 2. Climatological mean and standard deviation (n = 21) of annual primary production (in Gt C y−1) between 1998 and 2018 for each ocean basin and biome as defined by Longhurst (2007). Range in annual primary production between 1998 and 2018 is given in parentheses. Results are given for primary production estimates based on mean, –1 standard deviation and +1 standard deviation photosynthesis versus irradiance (P-I) parameters. Surface areas (in km2) for each ocean basin and biome are also provided.
Mean P-I
CoastalPolarTradesWesterliesTotal
47 × 10657 × 106141 × 106131 × 106376 × 106
Antarctic79 × 106 1.06 ± 0.09 (0.88−1.21) 4.83 ± 0.14 (4.66–5.14)5.88 ± 0.19 (5.58–6.20)
Atlantic94 × 1063.13 ± 0.16 (2.89–3.33)1.54 ± 0.09 (1.39–1.76)6.52 ± 0.14 (6.24–6.73)3.12 ± 0.05 (3.04–3.24)14.3 ± 0.38 (13.7–14.9)
Indian48 × 1063.82 ± 0.18 (3.55–4.10) 4.42 ± 0.12 (4.17–4.62) 8.24 ± 0.30 (7.72–8.70)
Pacific155 × 1064.76 ± 0.22 (4.34–5.03)0.91 ± 0.06 (0.80–1.02)9.21 ± 0.31 (8.57–9.62)7.39 ± 0.16 (7.09–7.60)22.3 ± 0.63 (21.2–23.1)
Total376 × 10611.7 ± 0.53 (10.9–12.4)3.51 ± 0.20 (3.12–3.85)20.2 ± 0.50 (19.1–20.7)15.3 ± 0.30 (15.0–15.9)50.7 ± 1.38 (48.7–52.5)
Mean P-I –1 Standard Deviation
CoastalPolarTradesWesterliesTotal
47 × 10657 × 106141 × 106131 × 106376 × 106
Antarctic79 × 106 0.56 ± 0.04 (0.48–0.64) 2.82 ± 0.09 (2.72–3.02)3.39 ± 0.11 (3.22–3.59)
Atlantic94 × 1061.64 ± 0.08 (1.51–1.76)0.81 ± 0.05 (0.73–0.90)2.52 ± 0.06 (2.39–2.61)1.51 ± 0.03 (1.47–1.56)6.48 ± 0.19 (6.16–6.75)
Indian48 × 1062.27 ± 0.10 (2.11–2.42) 2.70 ± 0.08 (2.54–2.82) 4.96 ± 0.17 (4.65–5.24)
Pacific155 × 1062.35 ± 0.11 (2.12–2.49)0.52 ± 0.03 (0.45–0.58)5.13 ± 0.18 (4.75–5.34)4.00 ± 0.09 (3.85–4.12)12.0 ± 0.34 (11.4–12.5)
Total376 × 1066.26 ± 0.28 (5.79–6.64)1.89 ± 0.10 (1.70–2.06)10.3 ± 0.27 (9.75–10.6)8.34 ± 0.17 (8.13–8.66)26.8 ± 0.74 (25.7–27.8)
Mean P-I +1 Standard Deviation
CoastalPolarTradesWesterliesTotal
47 × 10657 × 106141 × 106131 × 106376 × 106
Antarctic79 × 106 1.49 ± 0.14 (1.24–1.71) 6.71 ± 0.19 (6.48–7.14)8.20 ± 0.26 (7.78–8.63)
Atlantic94 × 1064.57 ± 0.23 (4.21–4.86)2.27 ± 0.14 (2.05–2.61)10.4 ± 0.22 (9.95–10.7)4.70 ± 0.08 (4.58–4.87)21.9 ± 0.58 (20.9–22.8)
Indian48 × 1065.34 ± 0.26 (4.96–5.72) 6.07 ± 0.17 (5.71–6.34) 11.4 ± 0.42 (10.7–12.0)
Pacific155 × 1067.08 ± 0.32 (6.47–7.49)1.30 ± 0.08 (1.13–1.46)13.2 ± 0.44 (12.3–13.8)10.6 ± 0.23 (10.2–10.9)32.1 ± 0.92 (30.6–33.4)
Total376 × 10617.0 ± 0.77 (15.8–18.0)5.07 ± 0.30 (4.48–5.56)29.6 ± 0.73 (28.1–30.4)22.0 ± 0.43 (21.5–22.8)73.7 ± 2.00 (70.8–76.2)

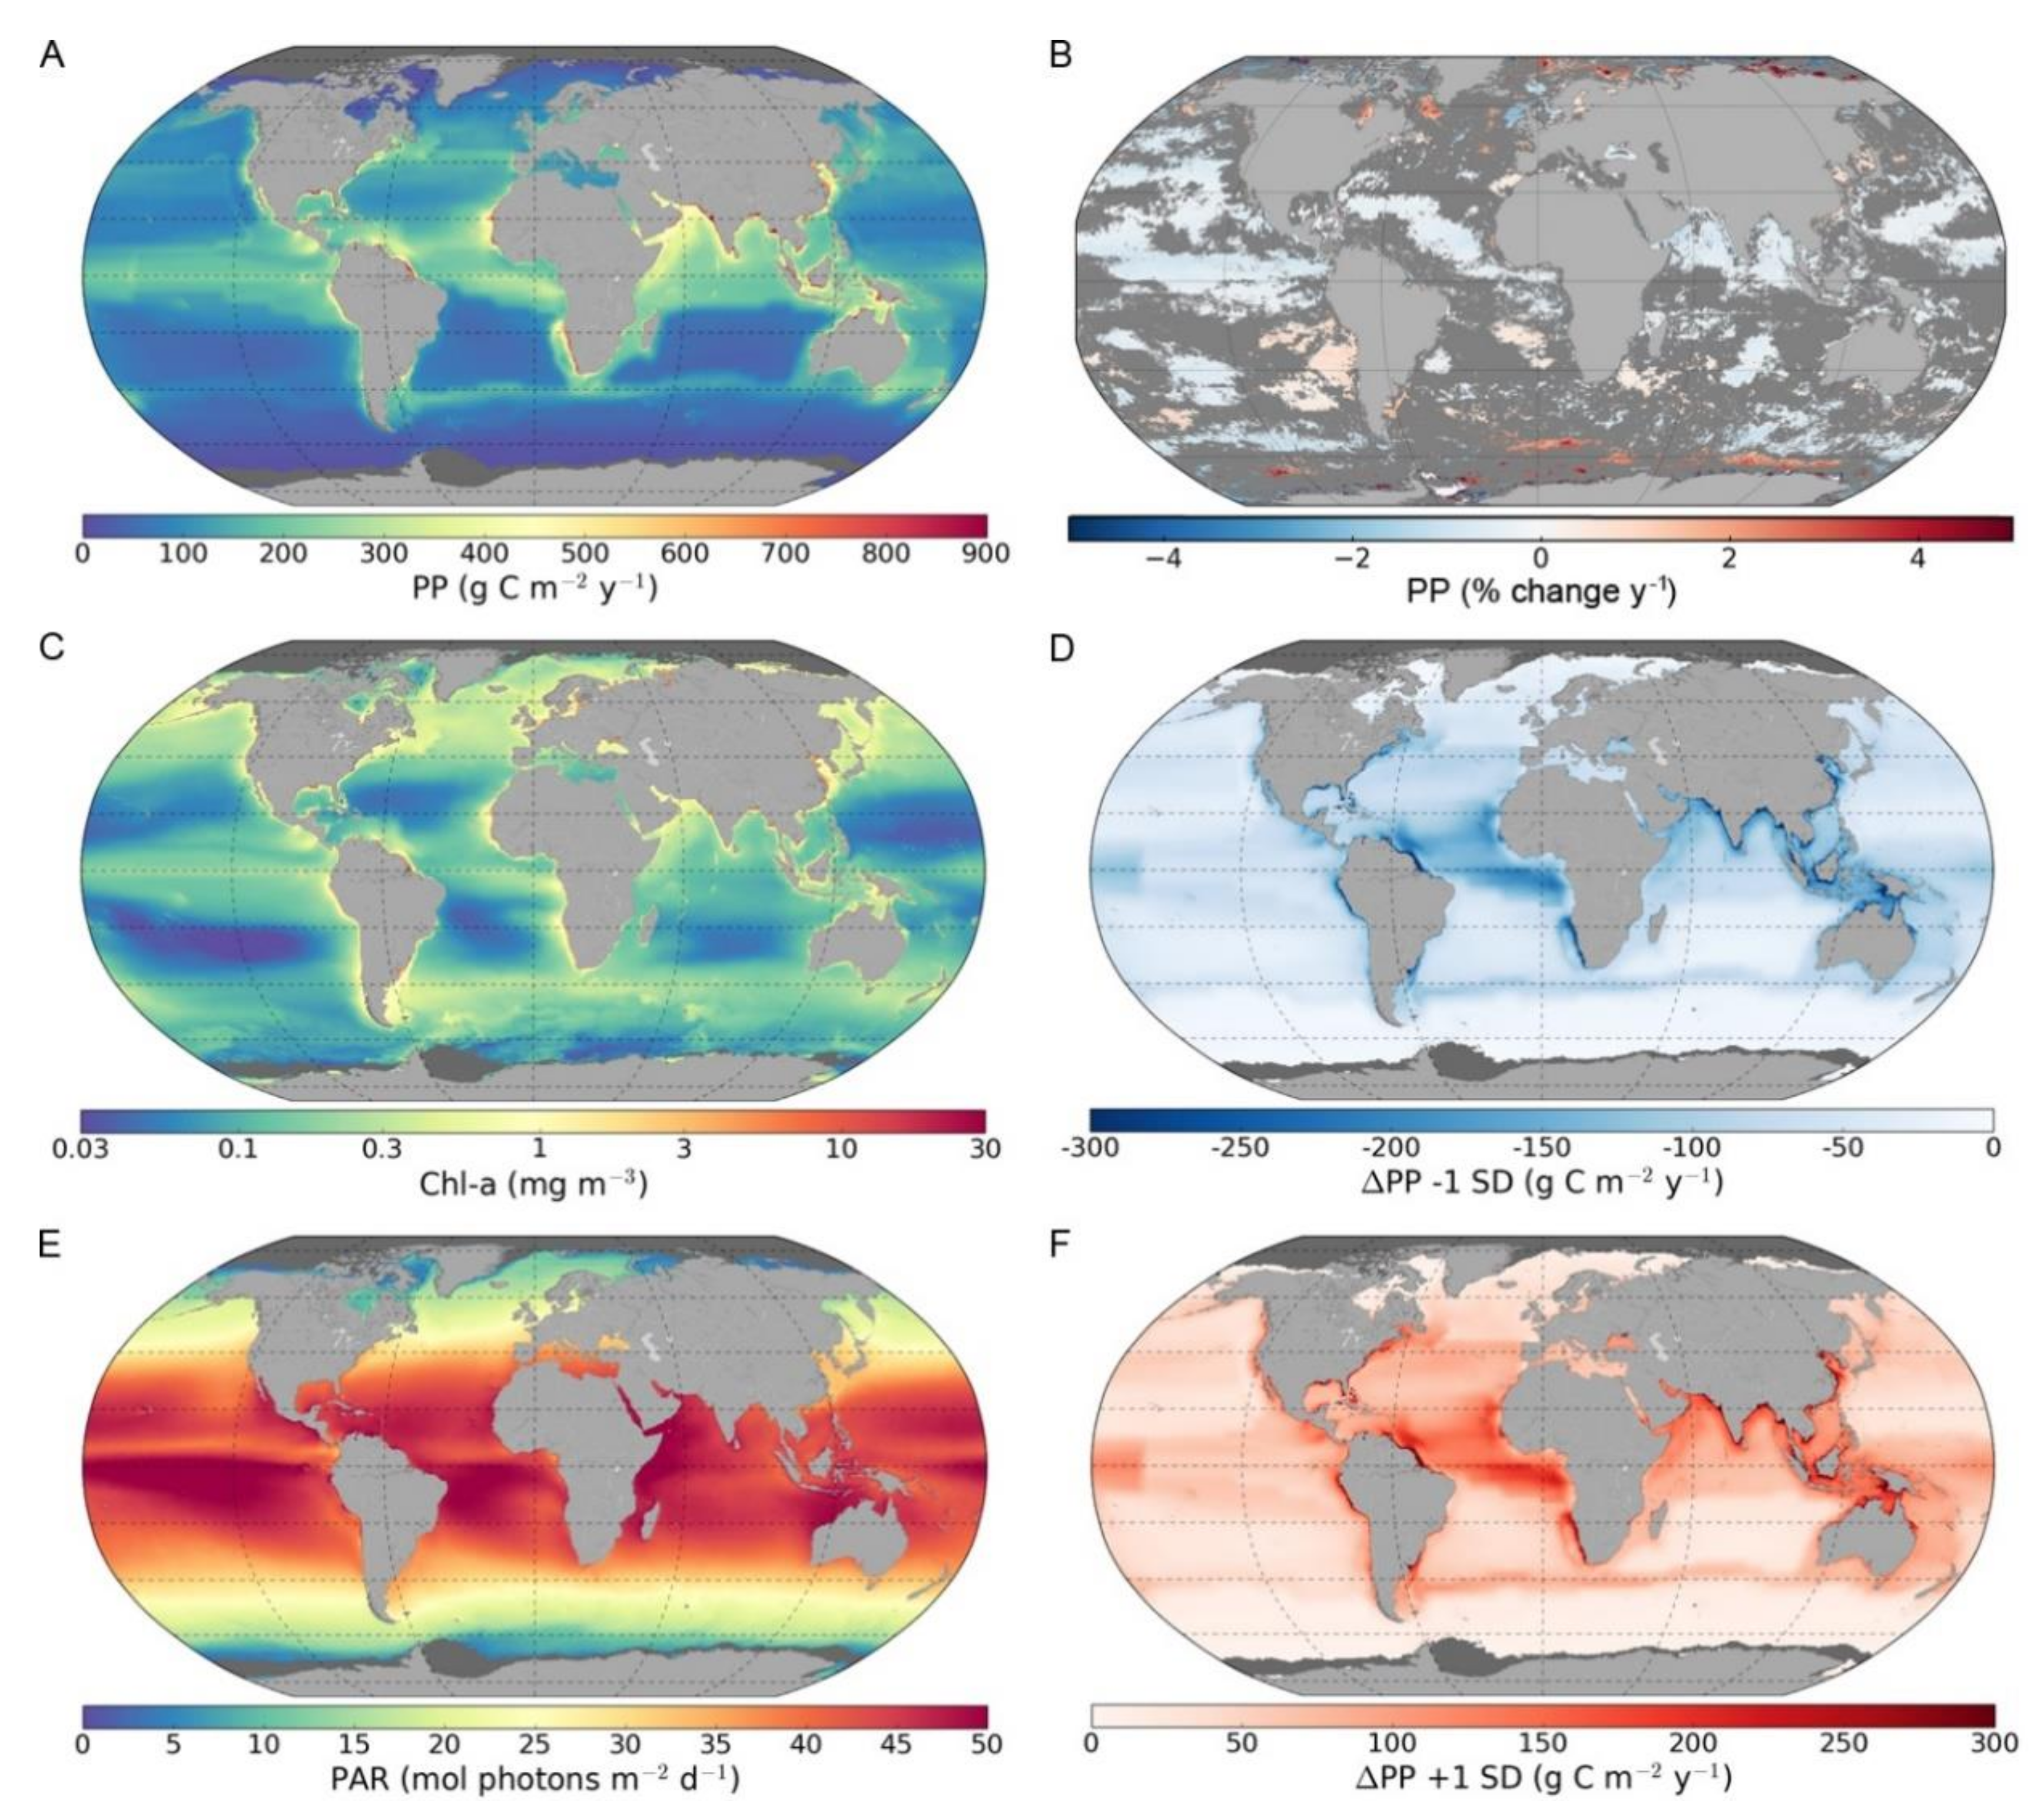
2.2. Corrections Have Been Made to Figure 3

Figure 3. Maps of global annual primary production (PP) and associated parameters for the period of 1998–2018: (A) global annual primary production based on mean photosynthesis versus irradiance (P-I) parameters; (B) linear trends in global annual primary production between 1998 and 2018 given as percentage change per year (dark grey colour represents non-significant trends); (C) remote-sensing-derived mean surface chlorophyll-a (Chl-a); (D) difference in primary production between mean P-I parameters and –1 standard deviation (–1 SD)-based estimations; (E) remote-sensing-derived Photosynthetic Active Radiation (PAR, 400–700 nm); and (F) difference in primary production between mean P-I parameters and +1 standard deviation (+1 SD)-based estimations.
Remotesensing 13 03462 g003

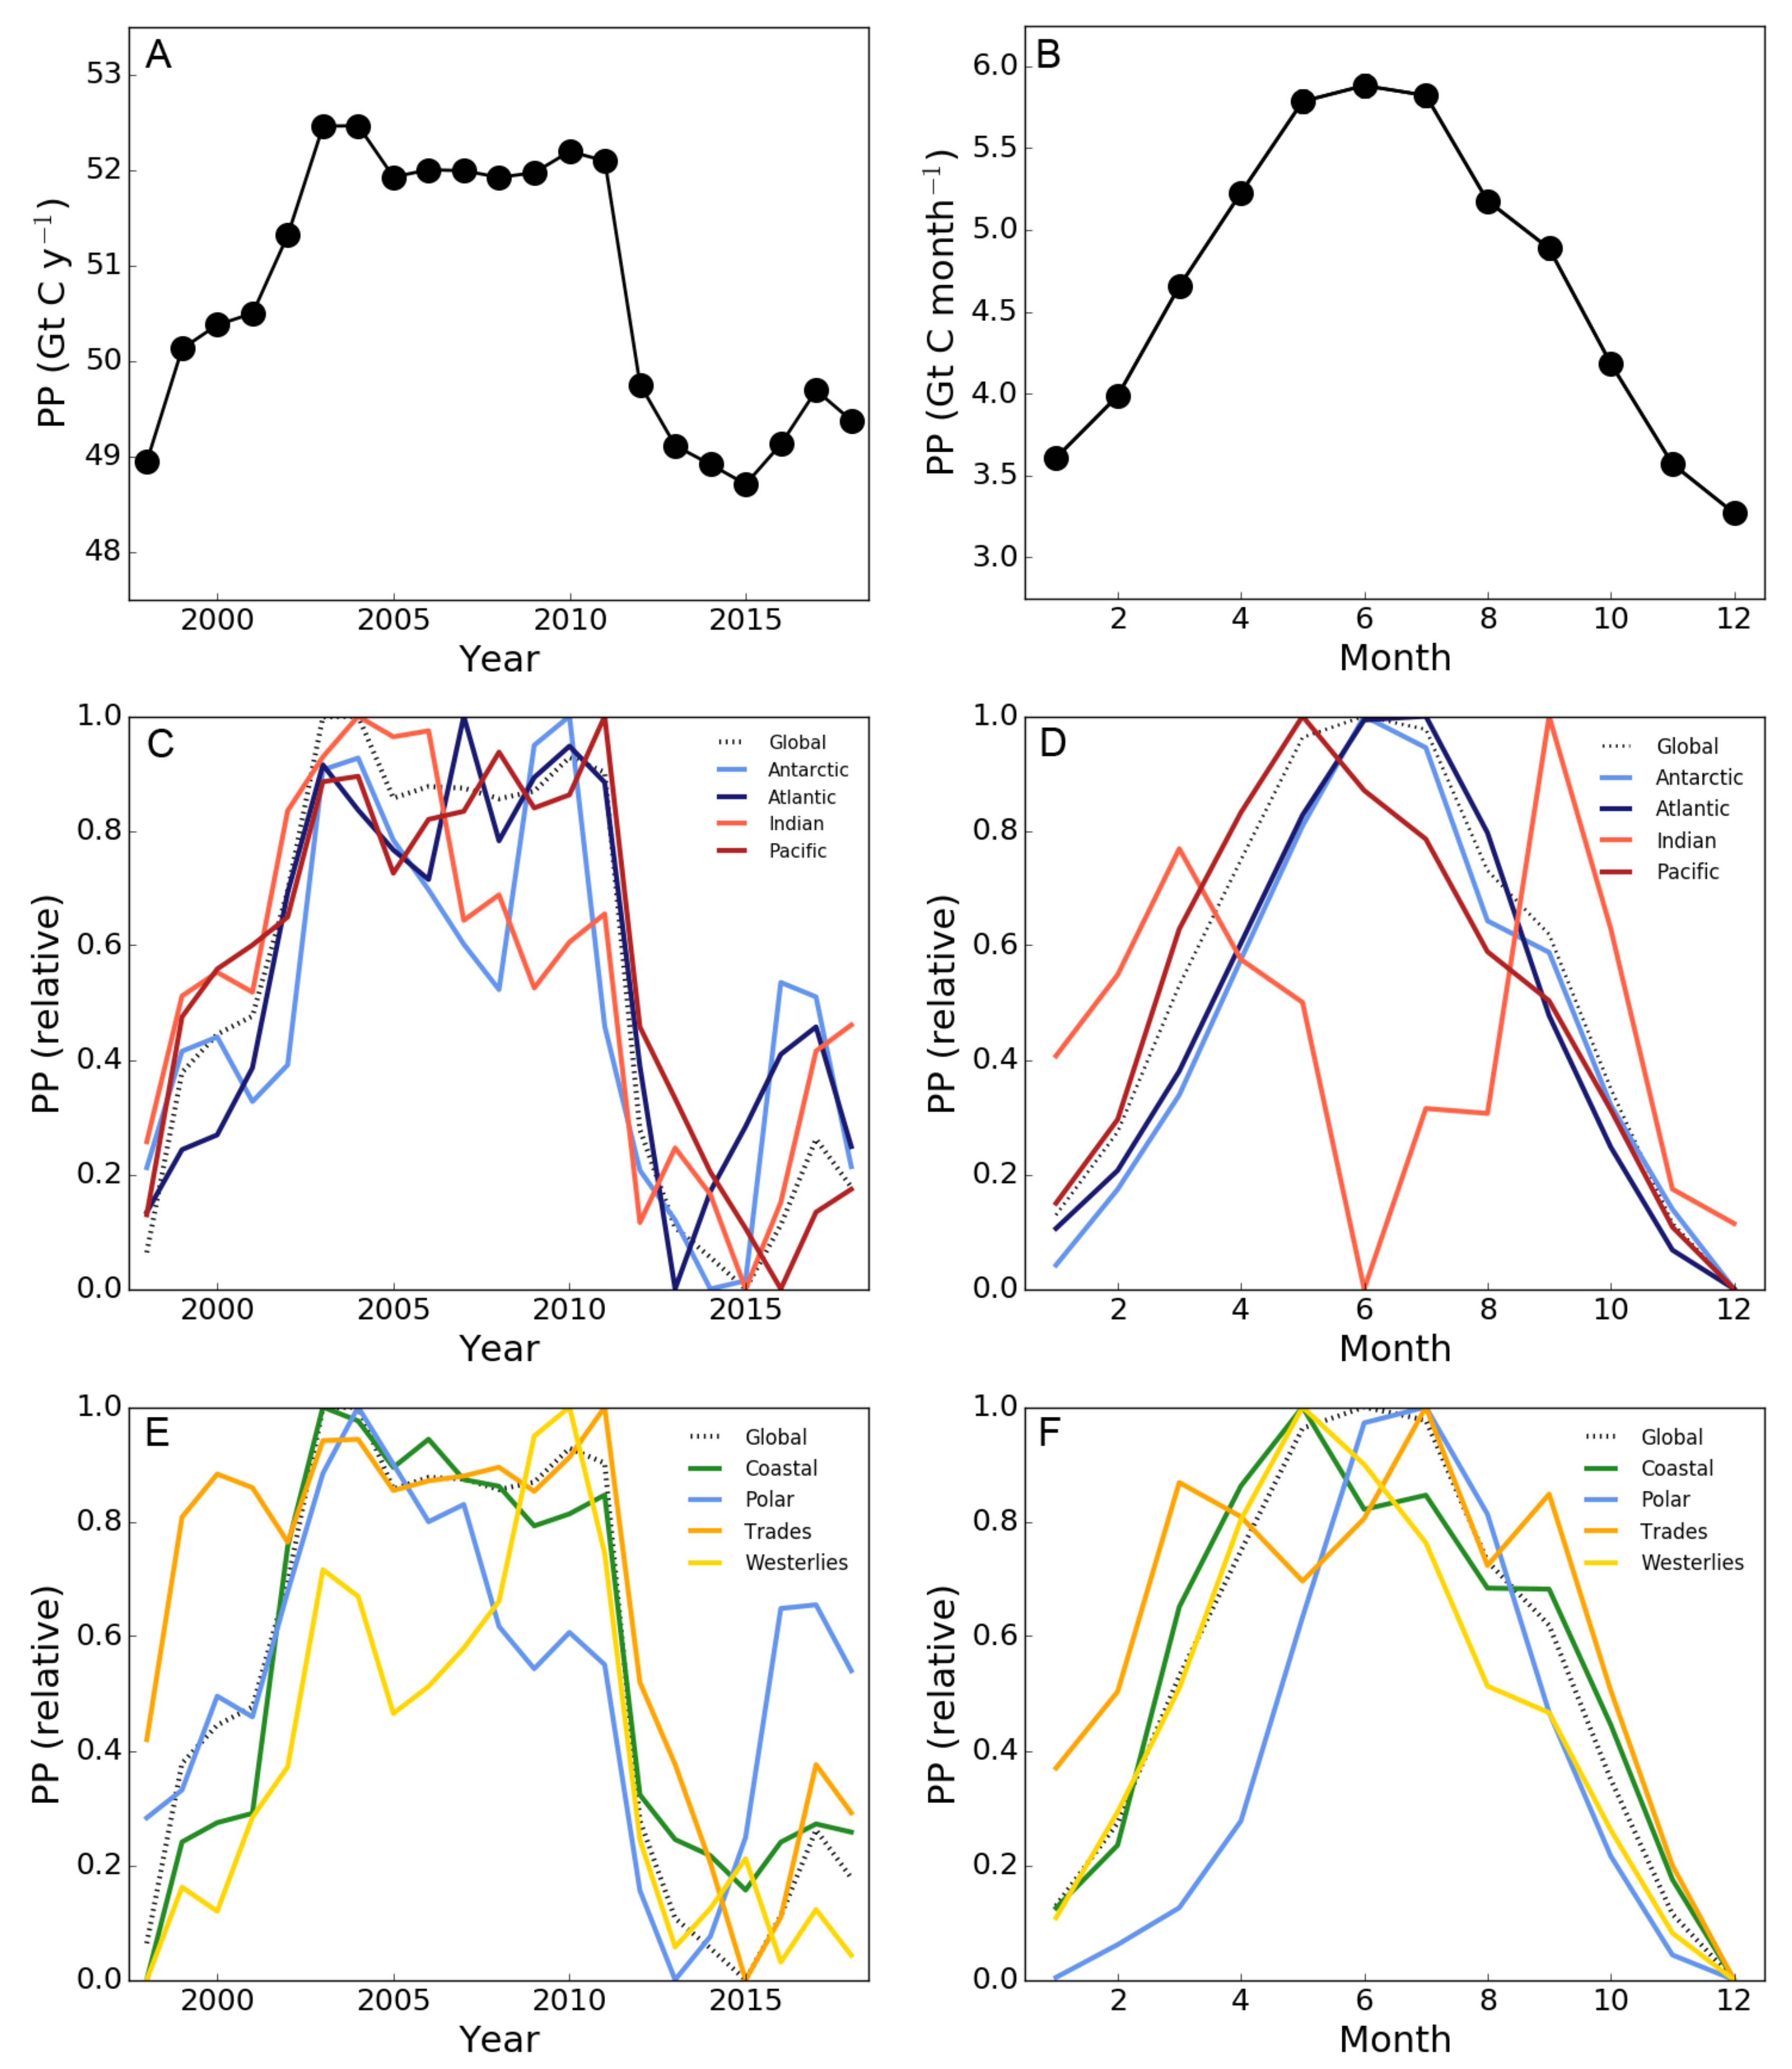
2.3. Corrections Have Been Made to Figure 4

Figure 4. Trends in primary production (PP) with (A) annual global primary production for each year in the period between 1998 and 2018, (B) mean monthly primary production, (C) relative annual and (D) monthly primary production for each oceanic basin and (E) relative annual and (F) monthly primary production for each biome as defined by Longhurst (2007). The dotted lines illustrate the relative global primary production per year (C,E) and month (D,F). Estimates of monthly primary production for the Southern Hemisphere were shifted to depict the summer season (December–February) along with that of the Northern Hemisphere (June–August) in months 6–8. Relative trends for each basin and biome were calculated by subtracting the minimum primary production from the annual (C,E) or monthly (D,F) primary production and dividing this by the difference between the minimum and maximum primary production between 1998 and 2018 or between January and December.
Remotesensing 13 03462 g004

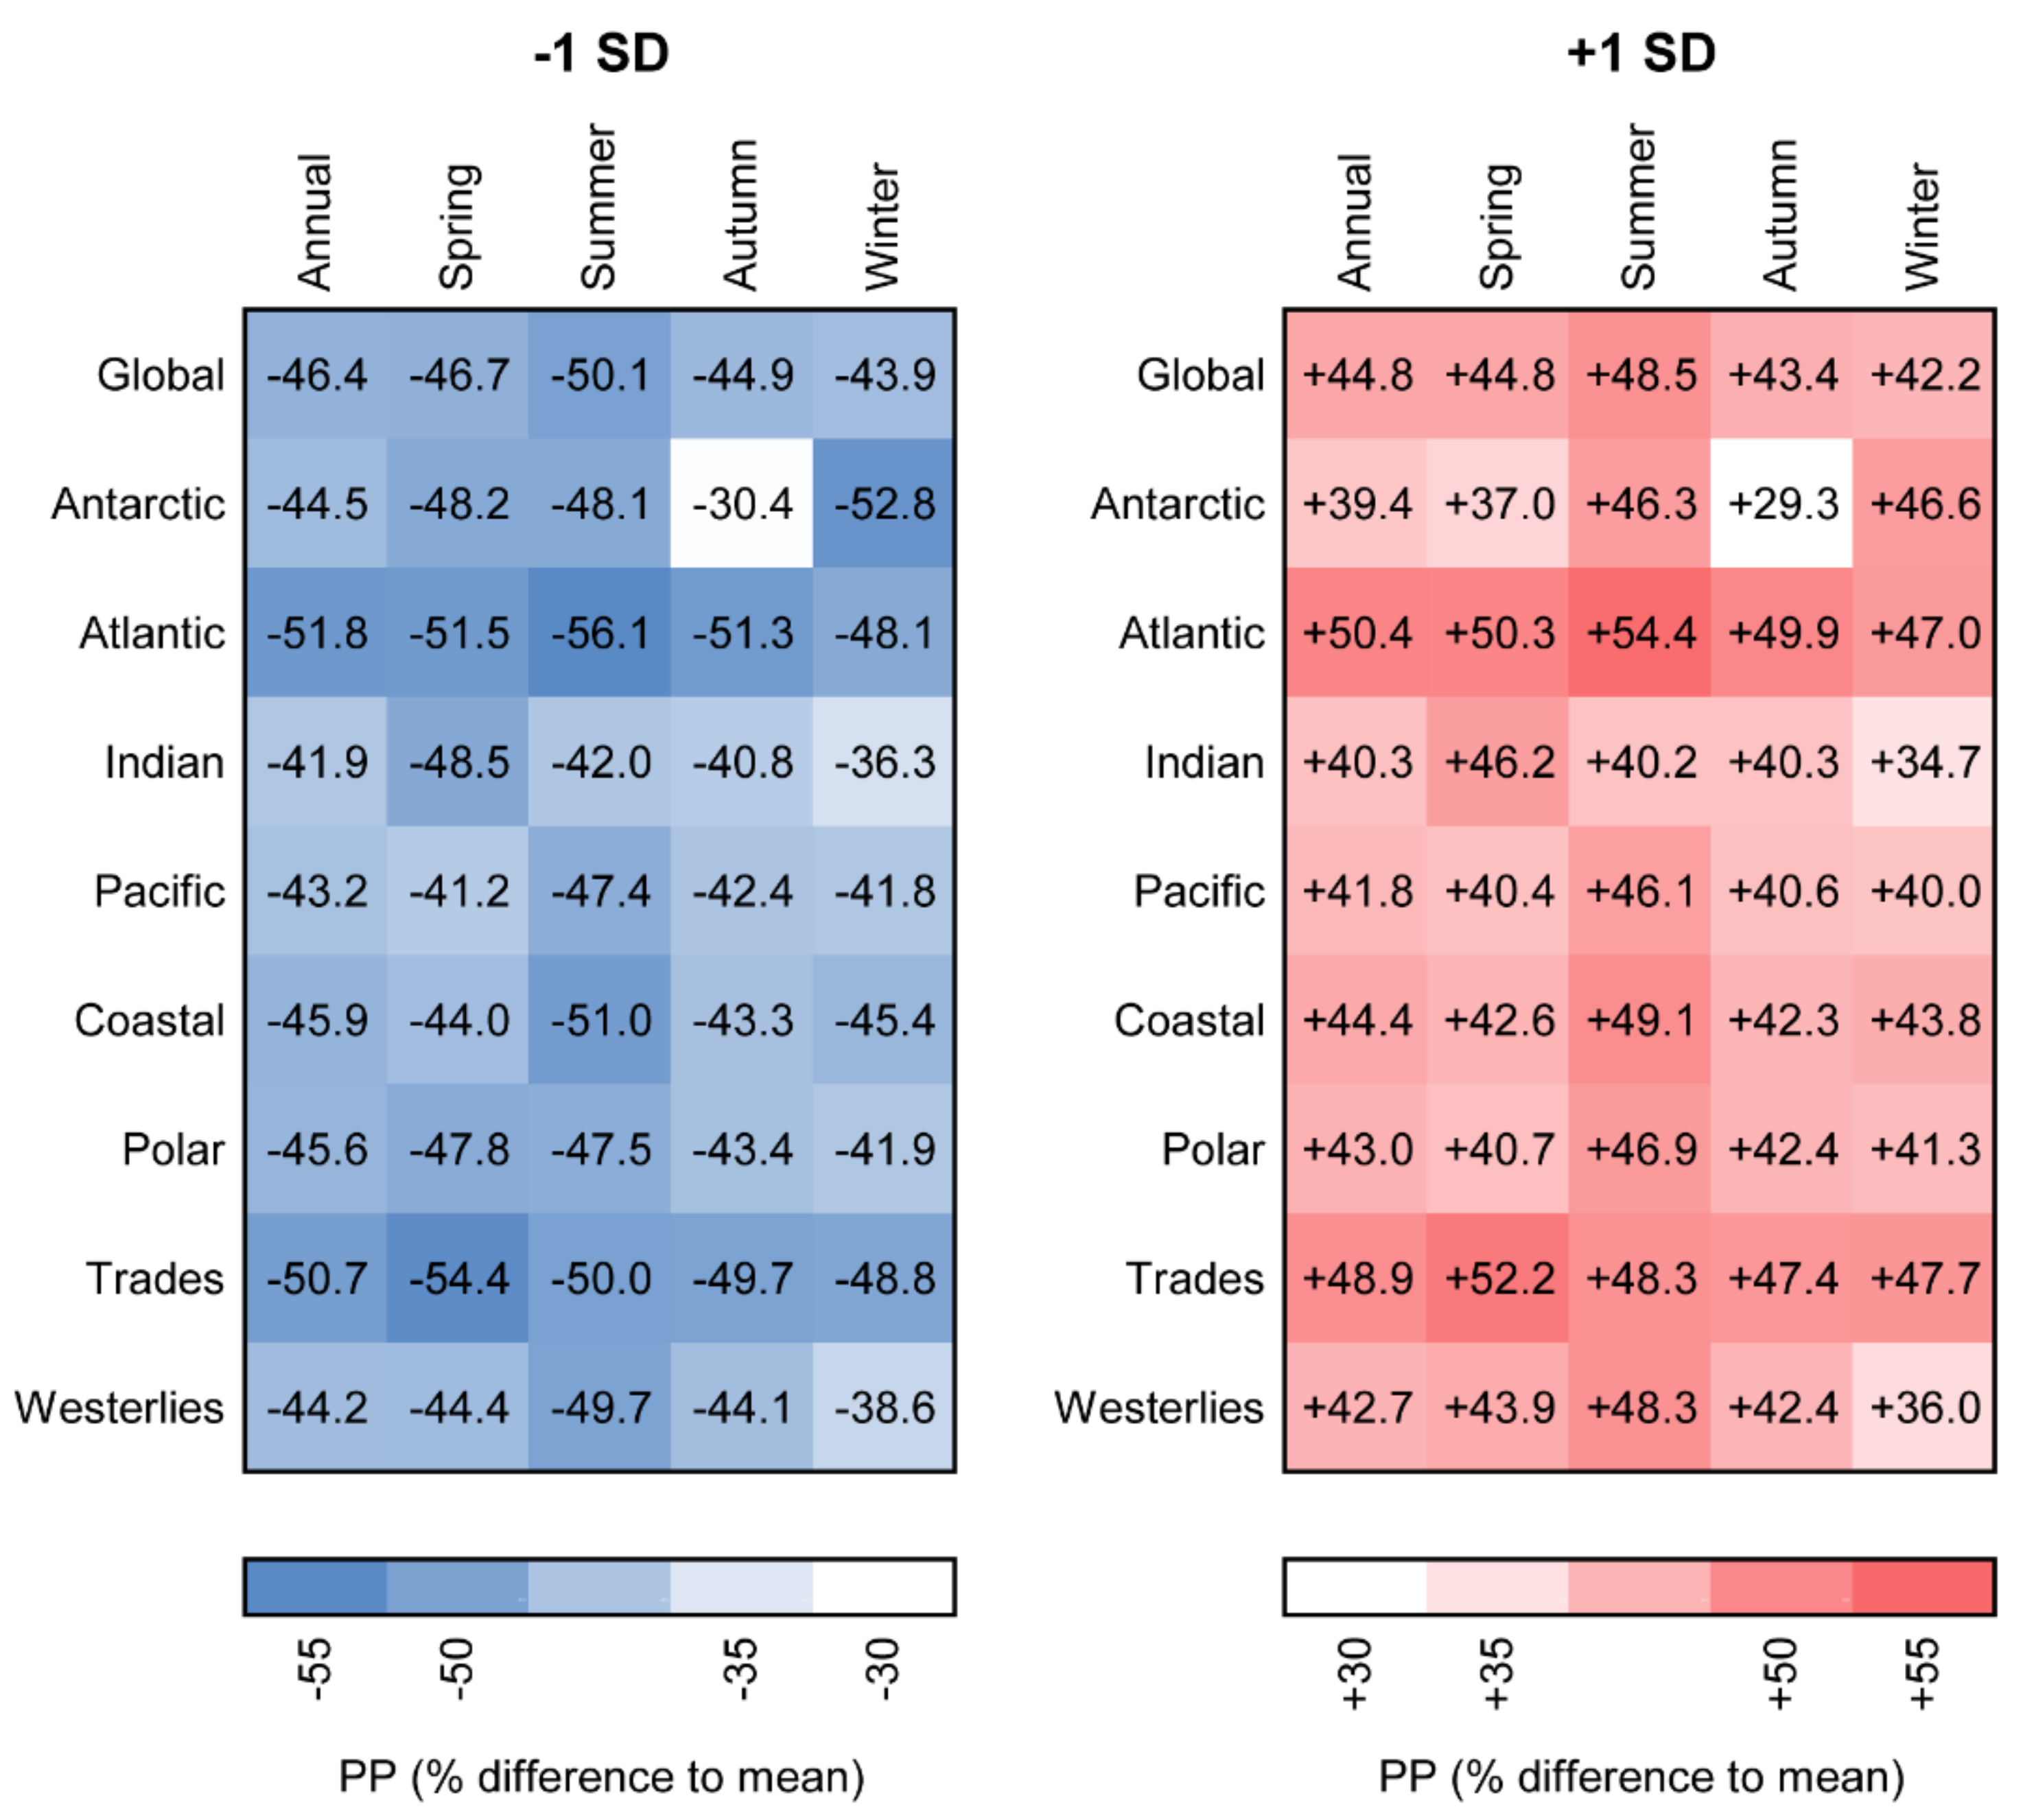
2.4. Corrections Have Been Made to Figure 5

Figure 5. Percentage change in primary production (PP) for estimates based on mean photosynthesis versus irradiance (P-I) parameters ±1 standard deviation compared with estimates based on mean P-I parameters. Mean percentage differences in annual and seasonal primary production for each ocean basin and biome are given. Data were obtained from model computations in which both P-I parameters were adjusted simultaneously and the light adaptation parameter (Ik) was unchanged.
Remotesensing 13 03462 g005

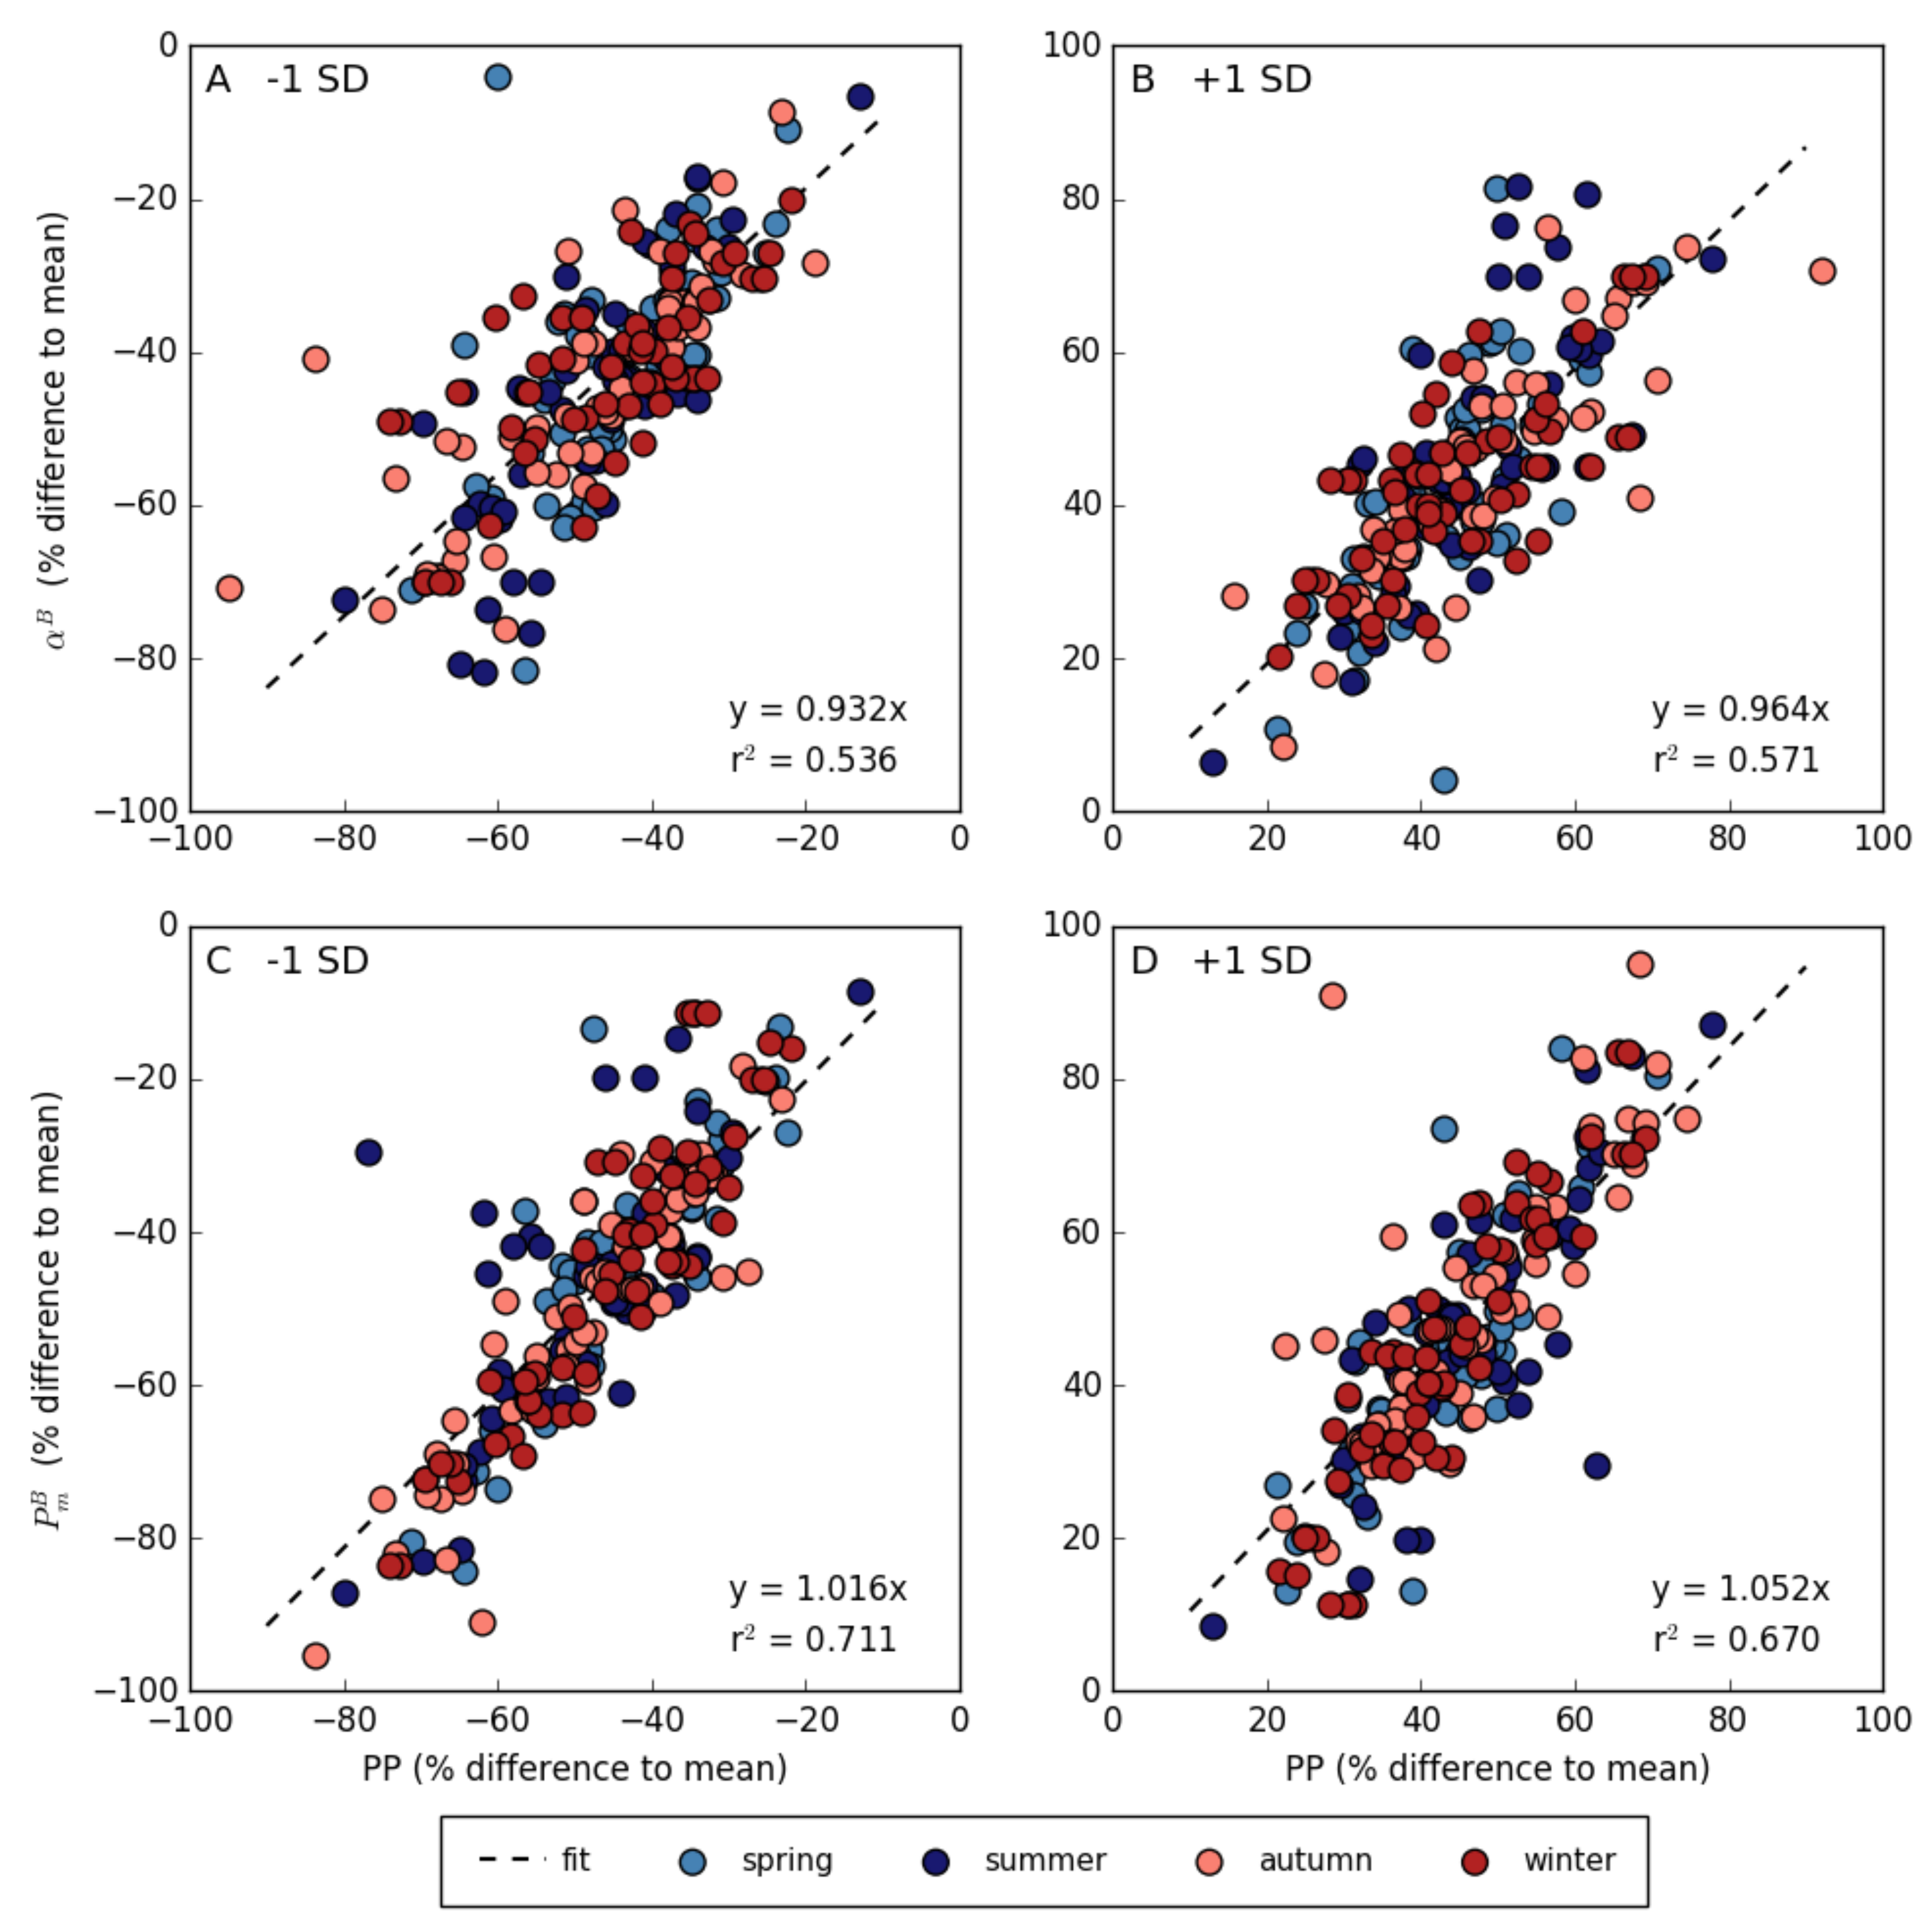
2.5. Corrections Have Been Made to Figure 6

Figure 6. Relationship between photosynthesis versus irradiance (P-I) parameters and primary production (PP) expressed as percentage difference in (A,B) the initial slope ( α B ) and (C,D) the assimilation number ( P m B ) of the P-I curve and primary production for –1 standard deviation (–1 SD) (A,C) and +1 standard deviation (+1 SD) (B,D) compared with mean P-I parameters estimates. Each point represents a biogeographical province and season for the period between 1998 and 2018.
Remotesensing 13 03462 g006

2.6. Corrections Have Been Made to Figure 7

Figure 7. Percentage change in global annual primary production (PP) compared with estimates based on mean photosynthesis versus irradiance (P-I) parameters. Results from three different sensitivity analyses are given: (1) both the initial slope ( α B ) and assimilation number ( P m B ) of the P-I curve were adjusted by ±1 standard deviation (SD) [ P m B , α B ]; (2) only P m B was adjusted by ±1 standard deviation [ P m B ]; and (3) only α B was adjusted by ±1 standard deviation [ α B ].
Remotesensing 13 03462 g007

Reference

  1. Kulk, G.; Platt, T.; Dingle, J.; Jackson, T.; Jönsson, B.F.; Bouman, H.A.; Babin, M.; Brewin, R.J.W.; Doblin, M.; Estrada, M.; et al. Primary Production, an Index of Climate Change in the Ocean: Satellite-Based Estimates over Two Decades. Remote Sens. 2020, 12, 826. [Google Scholar] [CrossRef] [Green Version]
Publisher’s Note: MDPI stays neutral with regard to jurisdictional claims in published maps and institutional affiliations.

