
Land Subsidence in Wuhan Revealed Using a Non-Linear PSInSAR Approach with Long Time Series of COSMO-SkyMed SAR Data


1
State Key Laboratory of Information Engineering in Surveying, Mapping and Remote Sensing (LIESMARS), Wuhan University, Wuhan 430079, China
2
Italian Space Agency (ASI), Via del Politecnico snc, 00133 Rome, Italy
3
National Research Council (CNR), Institute of Atmospheric Sciences and Climate (ISAC), Via del Fosso del Cavaliere 100, 00133 Rome, Italy
*
Author to whom correspondence should be addressed.
Remote Sens. 2021, 13(7), 1256; https://doi.org/10.3390/rs13071256
Submission received: 27 February 2021
/
Revised: 16 March 2021
/
Accepted: 22 March 2021
/
Published: 25 March 2021
(This article belongs to the Special Issue Multi-temporal Synthetic Aperture Radar)
Abstract
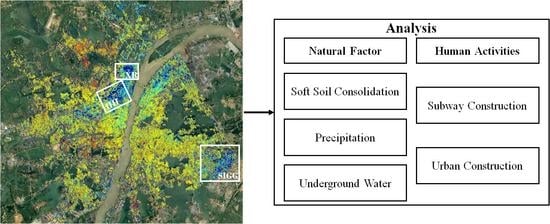
:Wuhan is an important city in central China, with a rapid development that has led to increasingly serious land subsidence over the last decades. Most of the existing Interferometric Synthetic Aperture Radar (InSAR) subsidence monitoring studies in Wuhan are either short-term investigations—and thus can only detect this process within limited time periods—or combinations of different Synthetic Aperture Radar (SAR) datasets with temporal gaps in between. To overcome these constraints, we exploited nearly 300 high-resolution COSMO-SkyMed StripMap HIMAGE scenes acquired between 2012 and 2019 to monitor the long-term subsidence process affecting Wuhan and to reveal its spatiotemporal variations. The results from the Persistent Scatterer Interferometric SAR (PSInSAR) processing highlight several clearly observable subsidence zones. Three of them (i.e., Houhu, Xinrong, and Guanggu) are affected by serious subsidence rates and non-linear temporal behavior, and are investigated in this paper in more detail. The subsidence in Houhu is caused by soft soil consolidation and compression. Soil mechanics are therefore used to estimate when the subsidence is expected to finish and to calculate the degree of consolidation for each year. The COSMO-SkyMed PSInSAR results indicate that the area has entered the late stage of consolidation and compression and is gradually stabilizing. The subsidence curve found for the area around Xinrong shows that the construction of an underground tract of the subway Line 21 caused large-scale settlement in this area. The temporal granularity of the PSInSAR time series also allows precise detection of a rebound phase following a major flooding event in 2016. In the southern industrial park of Guanggu, newly detected subsidence was found. The combination of the subsidence curve with an optical time-series image analysis indicates that urban construction is the main trigger of deformation in this area. While this study unveils previously unknown characters of land subsidence in Wuhan and clarifies the relationship with the urban causative factors, it also proves the benefits of non-linear PSInSAR in the analysis of the temporal evolution of such processes in dynamic and expanding cities.
1. Introduction
Wuhan, the capital of Hubei Province, is the largest city in central China and one of the most important industrial bases and transportation hubs of the country; it is famous for its “major juncture of nine provinces”. Wuhan has a registered population of 9.08 million and a floating population of 5.1 million [1]. With the relaxation of the settlement policy, the urban population will continue to increase, and so will the demand for housing in the city. Therefore, the external expansion of the city is inevitable, followed by a new round of urban construction.
In terms of the geological environment, carbonate rock bands and silty soft soil are widely distributed at the surface and in the subsurface of the city [2,3,4,5]. Human activities, such as underground development [6], urban construction [7], and groundwater pumping [8], combined with the local geological setting, affect the stability of the surface and cause ground deformation [9,10]. Ground deformation can cause serious damage (e.g., tilting, fracturing) to public and private buildings, bridges, and roads, thus also impacting on their serviceability (e.g., [11,12,13]). Therefore, the monitoring of surface deformation is an important part of urban management and planning, as well as structural safety monitoring.
Many traditional methods are applied for urban surface deformation monitoring, including Global Navigation Satellite Systems (GNSS) and leveling. However, these are point-based measurement methods, which generally achieve a small measurement range, require a long observation period to provide statistically significant trends, and are labor-intensive [8]. In contrast, satellite Synthetic Aperture Radar (SAR) systems provide full-time, all-weather, wide coverage at a low cost and are only minimally affected by clouds and rainfall. Interferometric SAR (InSAR) processing methods, including advanced approaches, such as Persistent Scatterer Interferometric SAR (PSInSAR) [14,15] and Small Baseline Subset (SBAS) [16,17], successfully exploit these features (e.g., [18,19,20]).
Many deformation monitoring studies using PSInSAR and SBAS have been conducted in the Wuhan area, focusing on large-scale urban surface settlement and building stability [6,7,8,9,10]. These studies were carried out from two aspects of natural and human factors, combined with urban development, to qualitatively analyze the causes of settlement in Wuhan. Costantini et al. [10] used 45 COSMO-SkyMed X-band SAR scenes from June 2013 to June 2014 to analyze the temporal and spatial characteristics of the settlement in the Hankou area. This study proved that the settlement in this area is controlled by geological factors, excessive extraction of groundwater, urban construction, and other human activities. Bai et al. [9] used 11 TerraSAR-X X-band SAR scenes from October 2009 to August 2010 to analyze the Wuhan area. However, because of the short observation period, only an obvious settlement was detected in Hankou area, and its cause was attributed to urban construction and carbonate karst problems. Zhou et al. [6] were the first to use the SBAS method to process 15 C-band scenes of Sentinel-1 from April 2015 to April 2016. For the first time, settlements were comprehensively detected in Hankou, Qingshan Industrial Zone, and Wuchang. However, limited by the amount of data, only a qualitative analysis of the settlement of each area was carried out. These were all short-term studies, which could only detect the subsidence that occurred during the corresponding time periods, but could not analyze the overall trend or better unveil the causes, triggers, and non-linear dynamics of subsidence in Wuhan. On this basis, more recently, Benattou et al. [7] and Zhang et al. [8] attempted an analysis of a three-year-long period using 54 Sentinel-1 and 20 RADARSAT-2 C-band SAR images acquired in 2015–2018, respectively. The latest study was by Han et al. [21], who used the multi-temporal dataset method to monitor the Wuhan area for the first time, processing 19 ALOS-1 L-band scenes from January 2007 to October 2010, three ENVISAT C-band scenes from December 2008 to May 2010, and 104 Sentinel-1 scenes from April 2015 to June 2019. These authors attempted to investigate land subsidence in a multi-temporal dimension, although with different datasets with temporal gaps in between.
In this study, we utilize the longest time series of high-resolution X-band SAR data ever exploited over the city of Wuhan, which were collected by the COSMO-SkyMed constellation from 2012 to 2019, and extract the deformation characteristics across the city using a non-linear PSInSAR approach. In light of the known improved sensitivity to deformation brought by X-band SAR data and their capability of sensing thermal expansion [22], we extract and remove the thermal dilation term to get more accurate deformation phases. By combining the settlement observations with optical images and the geological soft soil consolidation theory, the impact of human activities and geological factors on surface settlements and their relationships are analyzed. Compared with short-term sequence analysis, a long-term approach can better analyze the overall deformation trends and causes of deformation, which is beneficial in more accurately determining the settlement area.
2. Study Area
Wuhan (29°58′N–31°22′N, 113°41′E–115°5′E) is located in the east of the Jianghan Plain and the middle reaches of the Yangtze River (Figure 1a). The confluence between the Yangtze River and its largest tributary, the Han River, spatially bounds the three main areas of the city, namely Hankou, Wuchang, and Hanyang (Figure 1b). In the city, rivers and lakes are intertwined, and of the city’s total area is covered by water [23]. Wuhan has a northern subtropical monsoon (humid) climate with abundant annual rainfall of 1150 to 1450 . The rainfall is concentrated from June to August every year, accounting for about of the annual rainfall [24].
Carbonate rocks in Wuhan cover 1100 , accounting for about of the urban area, and they consist of six carbonate rock bands [25,26]. As shown in Figure 2, most of Hankou is an alluvial plain formed by flooding and siltation, so the silty soft soil is distributed widely [27,28]. There have been over 15 subsidence events caused by geological influences, and according to the 2016–2020 Wuhan geological disaster prevention and control plan [29], the city contains one high-risk area for geological hazards (Bank of Hanyang River), six middle-risk areas (i.e., Huangpi Caidian, Xinzhou Old Street, Houhu, Hanyang Huangjinkou, Hannan Shamao, Jiangxia Fasi), four low-risk areas (i.e., Huangpi Huanghualao, Dongxihu Xingou, Caidian Xinnong, Caidian Zhurushan), and one non-risk area (other than the above areas). In addition, as the economy develops and the population increases, many buildings and much infrastructure are being constructed in Wuhan, so the water demand for residents and, therefore, groundwater pumping from local aquifers are also increasing. The superposition of various natural and human factors has gradually led to subsidence across different sectors of the city. In this paper, we select three representative research areas, which are in Houhu (HH), Xinrong (XR), and the southern industrial park of Guanggu (SIGG) (Figure 1b). These areas are all classified as moderately prone to hazards in the 2016–2020 Wuhan geological disaster prevention and control plan [29]. However, this is due to a smoothing effect due to the presence, within the plan, of higher-risk areas located in the mountains and villages surrounding the city of Wuhan. Therefore, on a relative scale, the moderately prone classification may evoke an impression of lower susceptibility to subsidence. As we demonstrate in this paper, the surface deformations occurring in these three sectors in the last years highlight, instead, the local geological susceptibility, and thus require specific investigation. Houhu has a silty soft soil geologic structure, and it is part of a lake reclamation. Xinrong and the southern industrial park of Guanggu involve major engineering works for large-scale underground construction (subway) and ground construction, respectively.
Our focus on the dynamics affecting the HH, XR, and SIGG areas, instead of a wider investigation across Wuhan, is an intentional choice that is intended to provide a novel contribution to the existing InSAR literature on Wuhan and not to duplicate previous studies that have already unveiled the spatial correlation with the surface geology and distribution of the metro lines, as well as the temporal correlation with Yangtze River water level [6,21].
3. Materials and Methods
3.1. Datasets
In this study, we used SAR data from the Italian Space Agency (ASI)’s COSMO-SkyMed constellation [30,31], the Shuttle Radar Topography Mission (SRTM) Digital Elevation Model (DEM) from NASA, time series of optical images from Google Earth, and geological and precipitation data from the administrative department of Wuhan’s municipal government.
In particular, to estimate long-term surface deformation, we selected 286 ascending-mode StripMap HIMAGE scenes that were collected over Wuhan from 16 June 2012 to 3 November 2019, with HH (i.e., horizontal transmit and horizontal receive) polarization and an incidence angle at the scene center of about , as part of the COSMO-SkyMed background mission [32]. Table 1 lists the key parameters of the COSMO-SkyMed data stack used for the analysis. This is the longest SAR time series ever analyzed over Wuhan to study land subsidence, regardless of the operation band. In the literature, the longest single-geometry SAR stack consisted of 104 scenes of ascending-mode C-band Sentinel-1 from April 2015 to June 2019 [21], while the only published InSAR study of land subsidence using COSMO-SkyMed over the city was limited to 45 images from June 2013 to June 2014 [10].
The reliance of the present study on the ascending geometry only is due to the absence of an equally long and consistent COSMO-SkyMed descending-mode data stack over Wuhan, as per the predefined observation scenario of the background mission. While this is a technical constraint that cannot be overcome, it is worth noting that it is common to the existing studies—e.g., those based on Sentinel-1 data that are collected over Wuhan along the ascending geometry only, as per the mission observation scenario of Sentinel-1 [33]. None of the published studies have analyzed both ascending and descending geometries.
The 30 resolution SRTM DEM was used during the PSInSAR processing to remove the topographic phases and for geocoding (see Section 3.2).
In order to analyze the main causes of urban deformation, we examined the planning documents for Wuhan geological disaster prevention and control from the Wuhan Natural Resources and Planning Bureau [29], obtained the geological environment information of Wuhan and the present situation of subsidence disaster, and drew a distribution map of Wuhan’s soft soil (Figure 2). Rainfall data and subway construction information were sourced from the Wuhan Municipal Bureau of Statistics [1]. Google Earth was used to get the optical images corresponding to the settlement time series and to detect the change in urban construction in the study area. To avoid duplication of other studies that have already specifically analyzed groundwater levels of aquifer wells, water levels of the Yangtze River, and leveling benchmarks [6,21], the analysis of these data is not repeated in the present paper.
3.2. PSInSAR and Non-Linearities
COSMO-SkyMed data were processed using the SARPROZ software, which extends the standard linear Persistent Scatterer (PS) technique [14,15] to solve for non-linear motions without the need to have a priori information on the deformation process. The implemented processing workflow complies with the published InSAR literature exploiting SARPROZ [34,35].
The image collected on 18 May 2016 was used as the master for the whole dataset, both for co-registration and interferogram formation. With regard to co-registration, this task is particularly challenging in cases like Wuhan, where multiple urban changes on the ground have occurred over the total period of observation (i.e., nine years of data acquisition in the present paper) and are scattered across the swath of the time series. Careful validation of the resampling results is important in order to avoid problems in the following processing steps. We chose a PS point (30°31′54″N, 114°21′26″E) near the WHU International GNSS Service (IGS) station as the reference point. We identified PS candidates (PSCs) through statistical analysis of the amplitude stability using an amplitude stability index smaller than 0.25. At the end, all of the candidates with temporal coherence above 0.7 were selected.
To solve for the motion, a general model of the phase difference between two PSC points is necessary. In our work, we assume:
where is the wavelength, T is the temporal baseline, is the perpendicular baseline, is the slant range, and is the incident angle. is the differential phase, is the linear deformation velocity, is the height difference between two points, is the non-linear deformation component, and is the noise term. Equation (1) recalls the extended model proposed by Crosetto et al. [22], by which the classical two-parameter PSInSAR model (i.e., deformation velocity and residual topographic error) is extended by including a thermal expansion parameter, which is related to the average temperature differences between the acquisition of the images. This suits the application context offered by Wuhan well, given that the city is a dense urban environment with many high-rise buildings, with temperature-related deformation being non-negligible and thus requiring an estimation of the thermal dilation of each PSC. As per requirements stated by Crosetto et al. [22], this is achievable owing to the large amount of COSMO-SkyMed images processed (about 300) and the length of the total period of observation (nearly 7.5 years).
With regard to the deformation velocity component, in traditional PSInSAR, the deformation is usually assumed as a linear velocity. This is generally suitable for many urban subsidence phenomena over a limited period, but is not a feasible model for surface motion estimation of more than seven years, as in our paper. Because it is unlikely that land subsidence in the city maintains long-term linear deformation, we adopted a non-linear deformation model and thus included a non-linear deformation velocity component in Equation (1). Such an approach allows the identification of not only non-linear processes, but also linear ones, therefore making fewer assumptions about the nature of the deformation. To allow the estimation of non-linear deformation, we used the so-called SMART mode in SARPROZ [36]. Hereby, the velocity was assumed to be linearly related in time only within a small moving window (i.e., 7 images in our processing workflow). This approach allows for the estimation of the velocity in a similar way to the standard PSInSAR, but limited to the selected moving window. Therefore, the approach allows for the estimation of an overall non-linear motion, which is essential for this long-term research.
Line-of-sight (LOS) deformation records and annual velocity values estimated with the PSInSAR analysis were finally projected onto the vertical direction by dividing them by the cosine of the incidence angle of the sensor’s LOS. This conversion was made under the assumption that the predominant deformation direction was vertical, and that no horizontal deformation occurred.
3.3. Analysis of the Soft Soil Consolidation Degree
The existing literature proves that InSAR time series analysis is able to highlight different stages of land subsidence that comply with the theory of settlement induced by urbanization and new building constructions [37,38]. The process of soft soil consolidation in Houhu was therefore analyzed based on the long time series of InSAR deformation results. Consolidation inversion is an advanced and accurate method for calculating the consolidation coefficient of soft soil. According to the settlement curve calculated with InSAR, the final settlement amount was retrieved so as to calculate the degree of soft soil consolidation [39]. This method is based on Terzaghi’s one-dimensional consolidation theory [40]. In order to distinguish the early, middle, and late stages of consolidation and compression, and to continuously improve the inversion accuracy, we adopted a staged back-analysis method.
A hyperbolic model was used to calculate the final deformation from the InSAR deformation time series of each PS. Assuming that the settlement rate of soft soil decreases with time in the form of a hyperbola, the corresponding deformation at any time can be expressed by the following hyperbolic equation:
where and represent the initial deformation (subsidence) value and the observation time of the reference point for the fitting calculation, respectively; t and correspond to a given time and the deformation (subsidence) value at that time; and are parameters related to the initial subsidence value, and are calculated based on the linear regression in versus t (as explained below). The calculation of the derivatives at t returns the velocity and acceleration of subsidence.
Equation (2) can be converted into:
Equation (3) indicates that there is a linear relation between and . Therefore, and can be calculated via linear regression.
Equation (3) can be further converted to calculate the final deformation value:
After the final deformation (subsidence) is determined, the consolidation degree can be calculated. The consolidation degree refers to the ratio between the deformation amount at time t and the final deformation amount S, which indicates the soil layer under load, and can be converted into:
where U is the average consolidation degree achieved by the soft soil at time t, and is the final deformation reached when . Thus, the consolidation degree gradually increases with the consolidation process. When , (i.e., ) is the most unstable state, whereas when , (i.e., ), and thus indicates when the consolidation process is complete.
The hyperbolic model was successfully applied by Park and Hong [41] in a recent study aimed to estimate non-linear land subsidence in Busan, South Korea. These authors observed that this model is recommended when the consolidation degree is already at around 30–40% of its development, and a sufficient number of InSAR observations are available to provide a temporal coverage longer than the initial subsidence phase. It is clear that the model fails to reveal subsidence of low severity, or areas with no evident subsidence patterns. For these reasons, the model was intentionally applied to the area of Houhu, where the length of the time series allowed the depiction of a clear trend associated with the consolidation stages.
4. Results
Cumulative Deformation Map
Figure 3 shows the cumulative deformation across the Wuhan area using PSInSAR from June 2012 to November 2019. The blue (negative value) areas move away from the radar sensor along its line of sight, while the red (positive) areas move toward the radar sensor. A total of 320,000 PS points were extracted, and the average density across the whole urban area reached 200 points. The density may have been higher if there had not been so many water bodies and if the urban environment had not changed so quickly and across different sectors, with land lots transforming from reclaimed land/bare land to built-up areas in different times within the entire monitoring period.
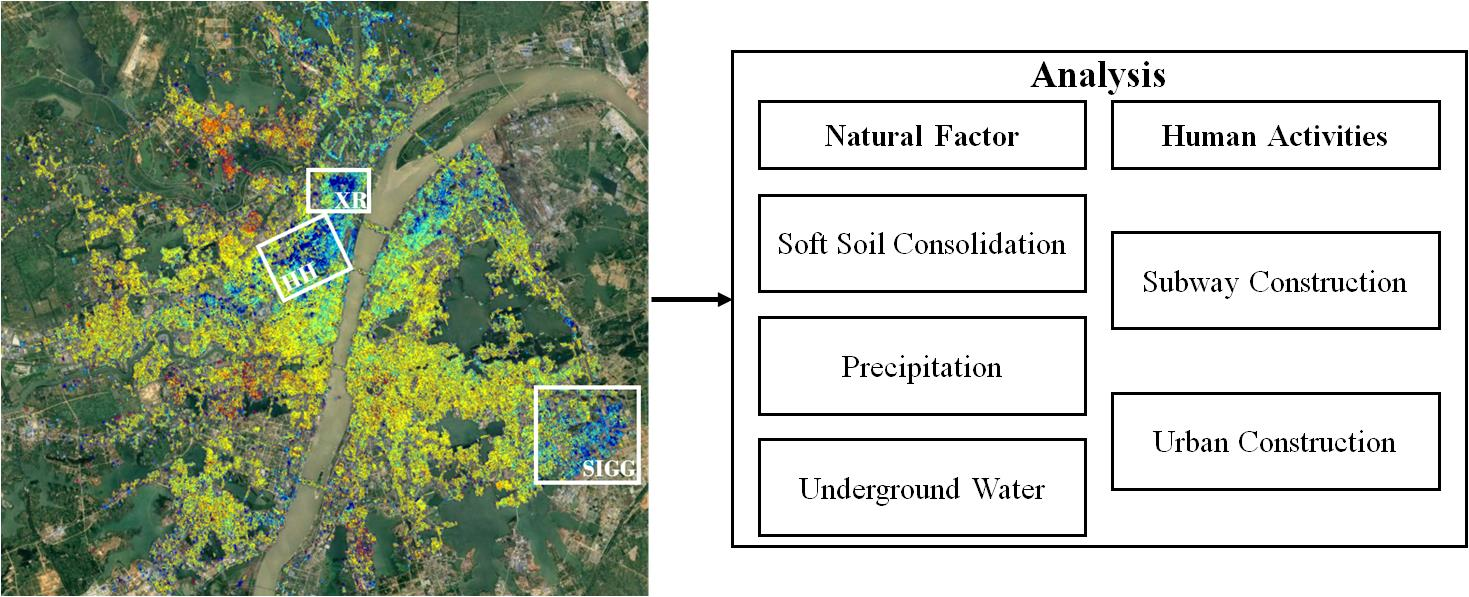
Unlike the previous InSAR studies that estimated linear deformation trends and displayed annual average subsidence rates in Wuhan, we here focus on the subsidence patterns observed across the city based on the eight-year-long cumulative displacement. According to the cumulative deformation map, it can be found that there are signs of deformation in many sectors of Wuhan city, among which the central urban area in Hankou is the most serious, with the maximum cumulative subsidence in the vertical direction reaching .
The three main deformation areas observed are Hankou, the Qingshan industrial area, and the southern industrial park of Guanggu. Based on different subsidence causes, we divided the deformation patterns identified in Hankou into three sub-regions: the Houhu area (soft soil, Region S1), Xinrong area (subway, Region S2), and Hankou CBD and surrounding residential areas (construction and groundwater, Region S3). Furthermore, we identified the subsidence pattern located in Qingshan District (Region S4), an important industrial area on the eastern bank of the Yangtze River. The Wuhan Iron and Steel (Group) Company, China First Metallurgical Construction Corporation, and Wuhan Petrochemical Plant are all located in this zone. Finally, Guanggu is a high-tech development zone in Wuhan. With the approval of the country’s second national independent innovation demonstration zone, Guanggu has built large-scale high-tech industrial parks, and a large number of high-tech enterprises have settled there. The southern industrial park of Guanggu (Region S5) is a representative area of integrating industry and residential areas in Guanggu. Focusing on this region is quite important given that the surface deformation due to the joint construction of industry and residential areas has not been previously analyzed in the numerous publications discussing urban subsidence in Wuhan [6,8,9].
5. Analysis and Discussion
5.1. Deformation Analysis of Soft Soil Area
Most of the soft soils in Wuhan are lacustrine deposits and were generally formed in the late Pleistocene [42], geologically speaking. The soft soil thickness reaches over 10 m at several locations, particularly at the Grade-I terrace (Figure 2b). The regular fluctuation of the lake water caused the migration of the soil. Because of the slow fluctuation of the lake water and the slow current, the transported silt was deposited on the lake bottom, gradually forming a silty soft soil layer. On the contrary, the city of Wuhan is developing rapidly in order to expand the building area; receding lakes and ponds and reclaimed lands are used for construction. Some areas even expand the land area by artificially filling lakes. Although lake filling can expand the building area, the silt and soft soil foundation will take a long time to complete its consolidation, a process that is particularly apparent in the Houhu area. According to the geological survey, there is a silty soft soil layer with a thickness of over 5 m distributed under the Houhu area [29].
Due to the limitation of the number of SAR images, previous research only indicated that there is deformation in the Houhu area [6] and attributed this to the soft soil [8]. Moreover, Costantini et al. [10] attempted a comparison of ground deformation from InSAR with leveling and groundwater level records. However, the overall deformation process in this area is not clear, and there is no quantitative analysis to show how much the soft soil in the Houhu area has consolidated. Therefore, we conducted a detailed analysis of the soft soil deformation in the Houhu area and calculated the degree of soft soil consolidation year by year.
Assuming that all soft soil layers in the research area are horizontal and continuous, the applied load on the ground is constant, and only vertical displacement occurs, other factors were excluded so that only soft soil deformation was analyzed [43]. Four typical PS points, which were representative of different deformation grades, were selected in each of the obvious deformation zones in the Houhu area for deformation analysis and soft soil consolidation degree calculation. Comparing their cumulative deformation time series (Figure 4b), it can be found that the Houhu area had a slower deformation rate before the end of September 2013 during the early stage of soft soil consolidation and compression. This stage was a relatively stable period, the deformation rate and scale were relatively slow, the damage to the buildings was small, and large-scale collapses were not expected. The area entered the middle stage of soft soil consolidation and compression from the end of 2013 to the beginning of 2015. The soft soil consolidated more rapidly in the vertical direction and the minimum deformation rate of the four PS points reached 50 mm/year, while the maximum deformation rate reached 115 mm/year. Large-scale deformation occurred in a short time. At this stage, the damage to the foundation of the buildings was significant, and the related ground and wall cracking reports mostly occurred during this stage (Figure 4c,d). After February 2015, the consolidation and compression of soft soil seemed to be basically completed, tending to be gentle and entering the late stage of soft soil consolidation.
In order to quantitatively evaluate the consolidation of soft soils and to analyze the consolidation deformation grade in Houhu more clearly, Table 2 reports the annual average consolidation degrees calculated for each of the four selected points year by year. According to the calculations, the average degree of consolidation of the four selected points was less than in 2012, while it increased significantly from 2013 to 2014 to more than . After the rapid consolidation period, the consolidation degree of the soft soil reached more than in 2015, and then it increased steadily at a rate of 1–2% per year, thus approaching the status. At this stage, the study area was generally stable, and the possibility of settlement collapses was reduced. The Wuhan Natural Resources and Planning Bureau also changed the area from a high-risk area to a medium–low-risk area in the 2016–2020 Wuhan geological disaster prevention and control plan [29]. The results in Table 2 are consistent with the deformation curve shown in Figure 4b.
These observations need, however, to be better contextualized in the framework of other human-related factors involved in the subsidence process. Indeed, while the above assessment assumed that the applied load on the ground was constant, as controlled only by natural compaction, a significant contribution to the process and shape of the consolidation curves was made by groundwater management practices over the investigated period. As observed by Costantini et al. [10], piezometric levels at some wells in the Houhu area recorded sharp declines in the period between mid-2013 and mid-2014, with water level drops as high as 5 m. This explains the significant acceleration in the consolidation process, as observed in Figure 4b between late-2013 and mid-2014.
5.2. Urban Rail Transit
During the period from 2012 to 2019, Wuhan completed the construction of many subway lines, such as Metro Lines 3, 6, 7, 8, 11, and 21, basically completing the full coverage in the main urban area. As demonstrated in the InSAR literature [44] and in Wuhan [21], subway tunneling can induce the settlement of the ground above the line, inevitably causing surface subsidence. One typical area for these phenomena is the Xinrong area, through which Metro Lines 1 and 21 pass (Figure 5a). The settlement center is at the intersection of the two subway lines.
The construction of Metro Line 21 officially started in December 2014, and it was completed and put into service in January 2018. Four typical PS points were chosen along the subway (Figure 5a), and the cumulative deformation curve is shown in Figure 5b. The subsidence of the Xinrong area started in October 2014, slightly earlier than the start of the subway construction. This is because, in the first half of the year, the groundwater level needed to be kept below the estimated construction depth to prevent backflow by pumping water from the aquifer. When pore water pressure decreases in response to groundwater pumping, the effective stress increases [43] and causes aquifer depletion and, in turn, surface deformation. Large-scale surface deformation at this site started to occur in December 2014.
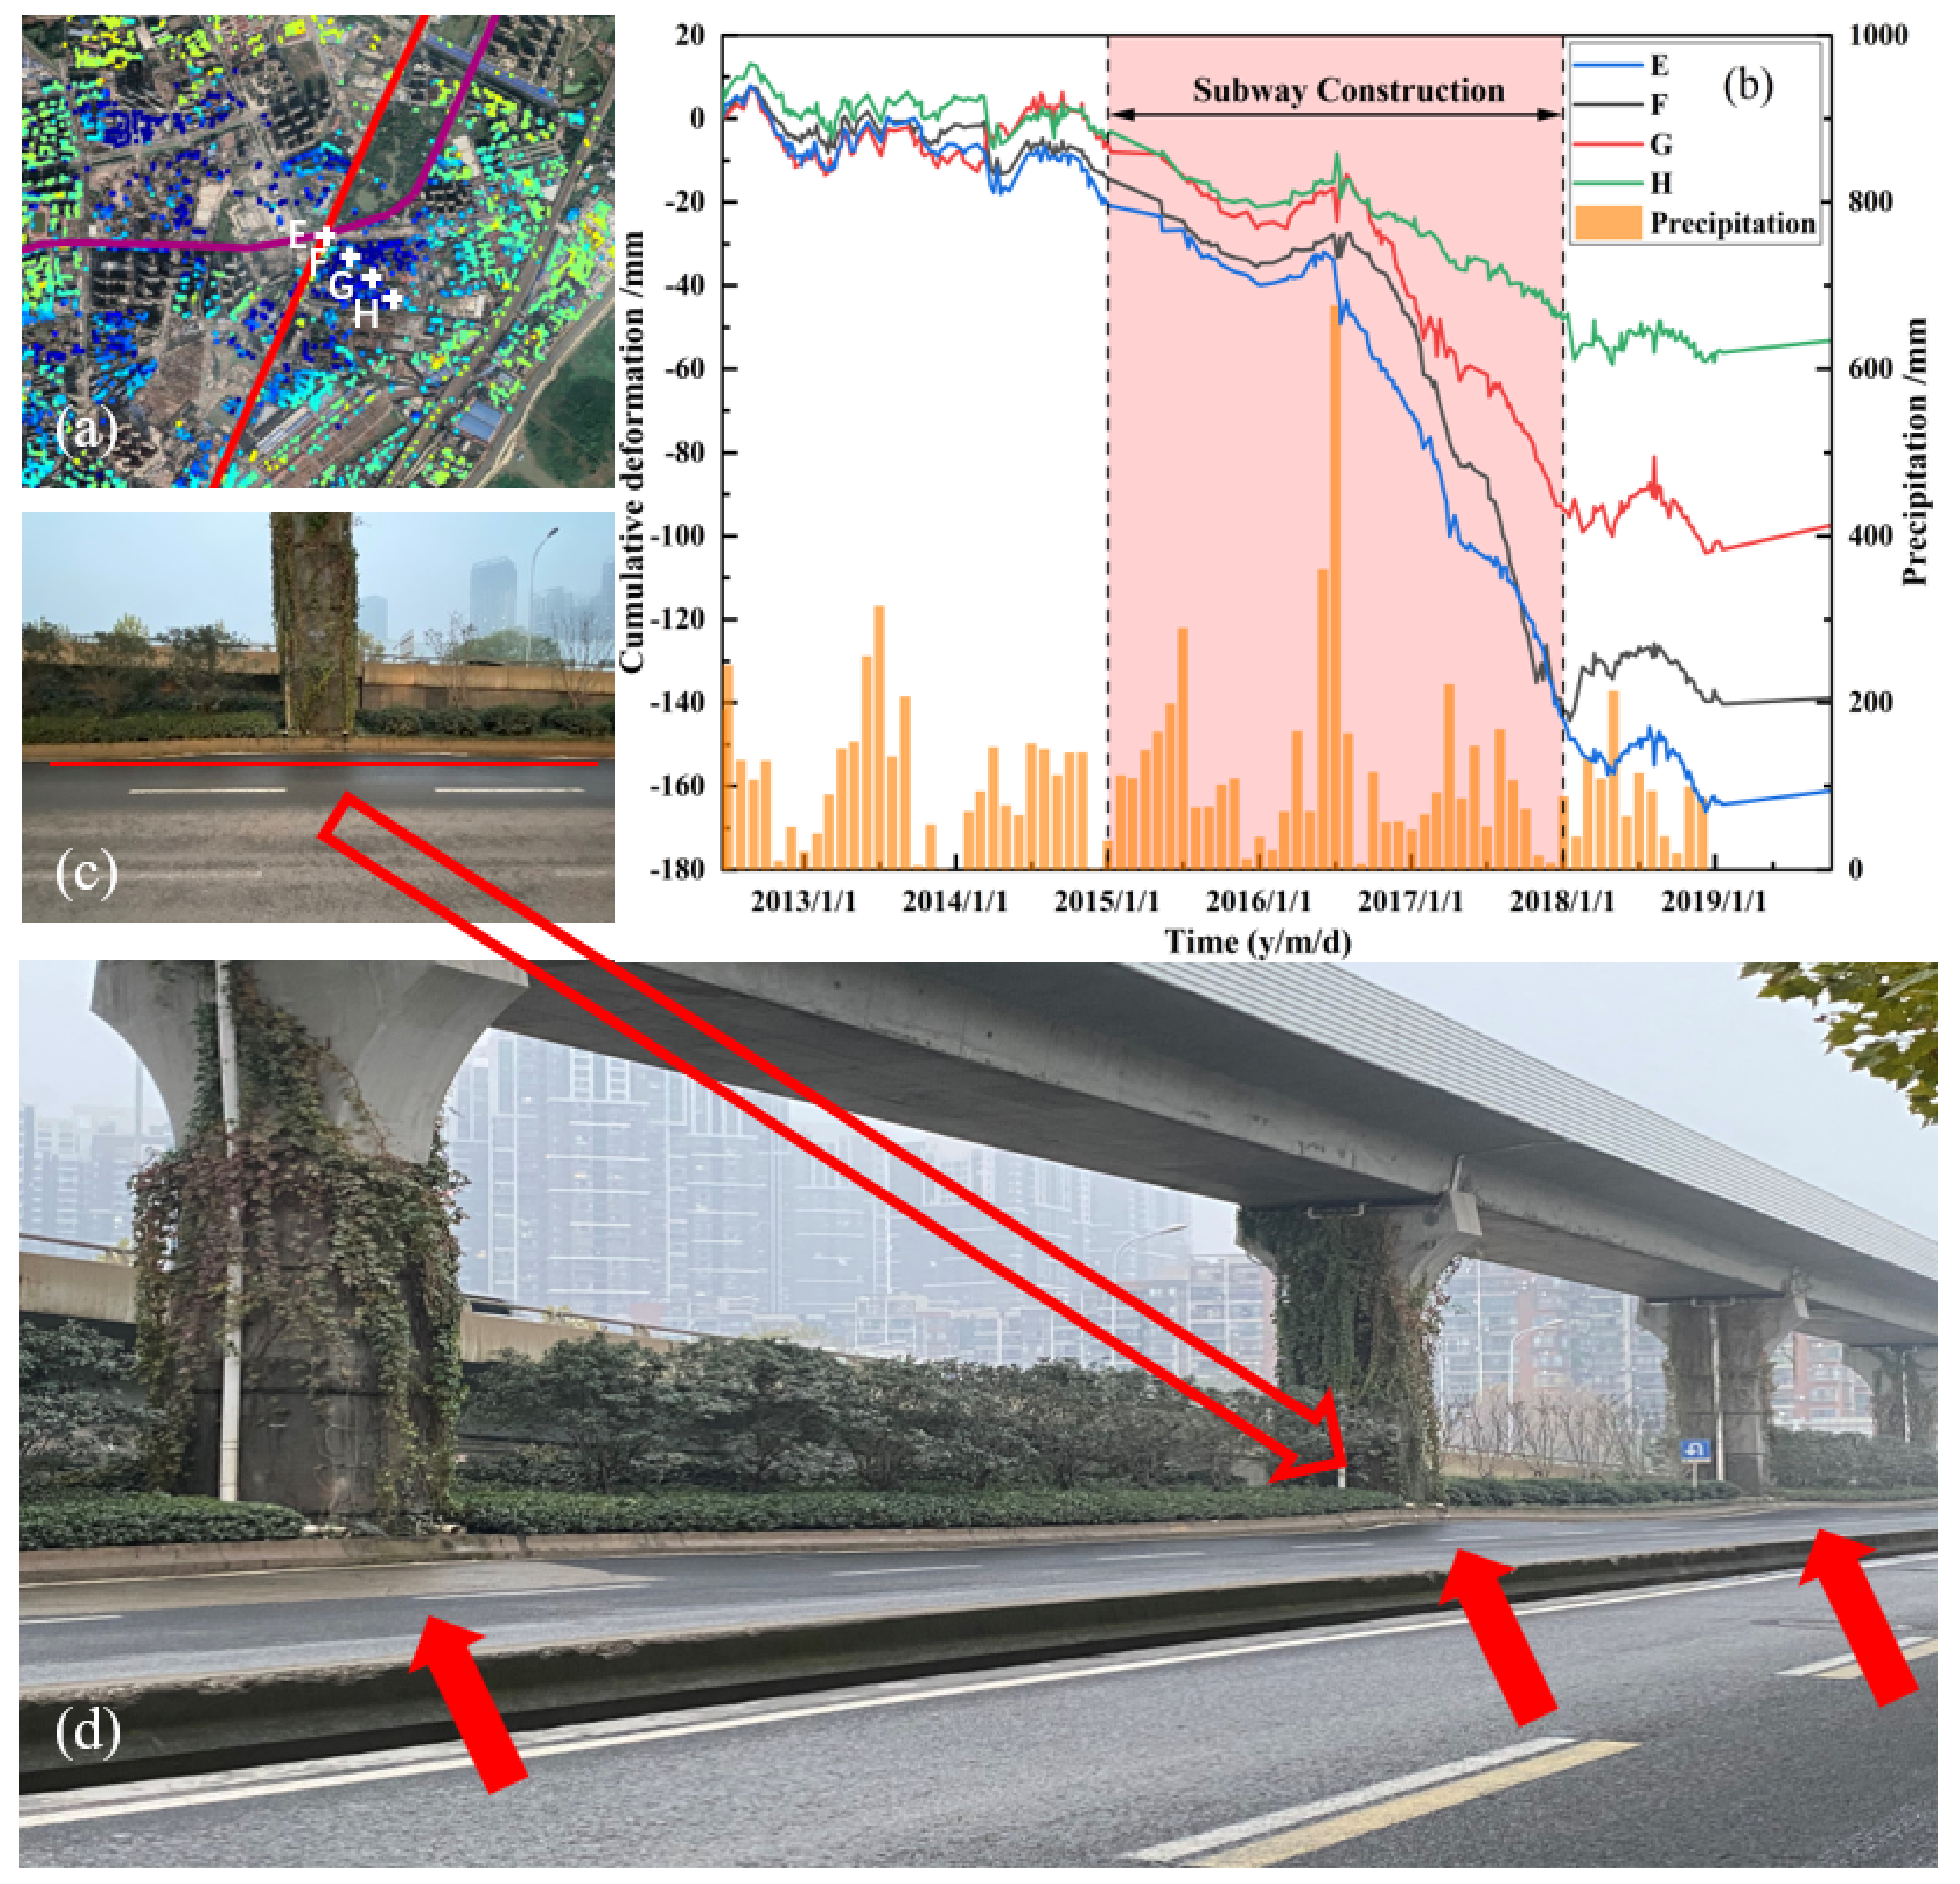
The high temporal sampling offered by the COSMO-SkyMed InSAR time series allows the detection of an inversion of the deformation trend, which was temporally confined from April to July 2016 when the displacement curve stabilized and then registered an uplift of 10–15 mm in a few months. In this period, the monthly average precipitation data highlight a sharp increase in rainfall compared to the other years. In July 2016, Wuhan experienced the most catastrophic flood disaster in nearly 20 years [24].
During the flood-fighting period, underground construction was suspended. Moreover, this area is adjacent to the Yangtze River. During the flood, the water level of the Yangtze River rose rapidly, and the area adjacent to the Yangtze River was the first to be affected [21]. Enormous amounts of rainfall and floods fully supplemented the groundwater, the aquifer was refilled, and the pore water pressure increased, which slowed the rate of surface subsidence and even temporarily led to local uplifts. After the flood event, the construction restarted, and the subsidence curve showed obvious linear deformation (Figure 5b). At the beginning of 2018, with the completion of the subway construction, large-scale subsidence gradually stopped.
The above observation made possible by COSMO-SkyMed data seems particularly relevant, given that recent research based on Sentinel-1 data concluded that land uplift was sometimes subtle during periods of high increases in river water levels [21]. On the contrary, in this case, the deformation trend inversion was marked and clearly detectable.
5.3. Urban Construction
The large range of settlement that we find in the southern industrial park of Guanggu (Figure 3a) has not been observed and discussed in previous InSAR studies of Wuhan. It is the first time that this process is analyzed in relation to urban construction intermingling with industrial development. It is worth recalling that Guanggu was once the heavy industry hub of Wuhan, home to heavy industries such as the Wuhan Iron and Steel Company, Wuhan Heavy-Duty Machine Tool Group Corporation, and China Aerospace Science and Technology Corporation. With the introduction of industry and city integration policy, Guanggu is transforming from a traditional industrial park into a new city of science and technology. At present, Guanggu has formed a pattern in which the optoelectronic information industry takes the lead, and biomedicine, new energy and environmental protection, high-end equipment manufacturing, and the high-tech service industry develop together. At the same time, the idea of industry and city integration has positioned Guanggu as the sub-center of the city, with a resident population of more than 1.8 million.
Therefore, the spatial and temporal analysis of settlement patterns cannot be undertaken without an understanding of new building constructions happening on a yearly basis, which are documented through historic images from Google Earth. Building constructions have been continuously carried out in the southern industrial park of Guanggu since 2012, at a yearly rate far exceeding that of other urban areas of Wuhan, and they are still ongoing.
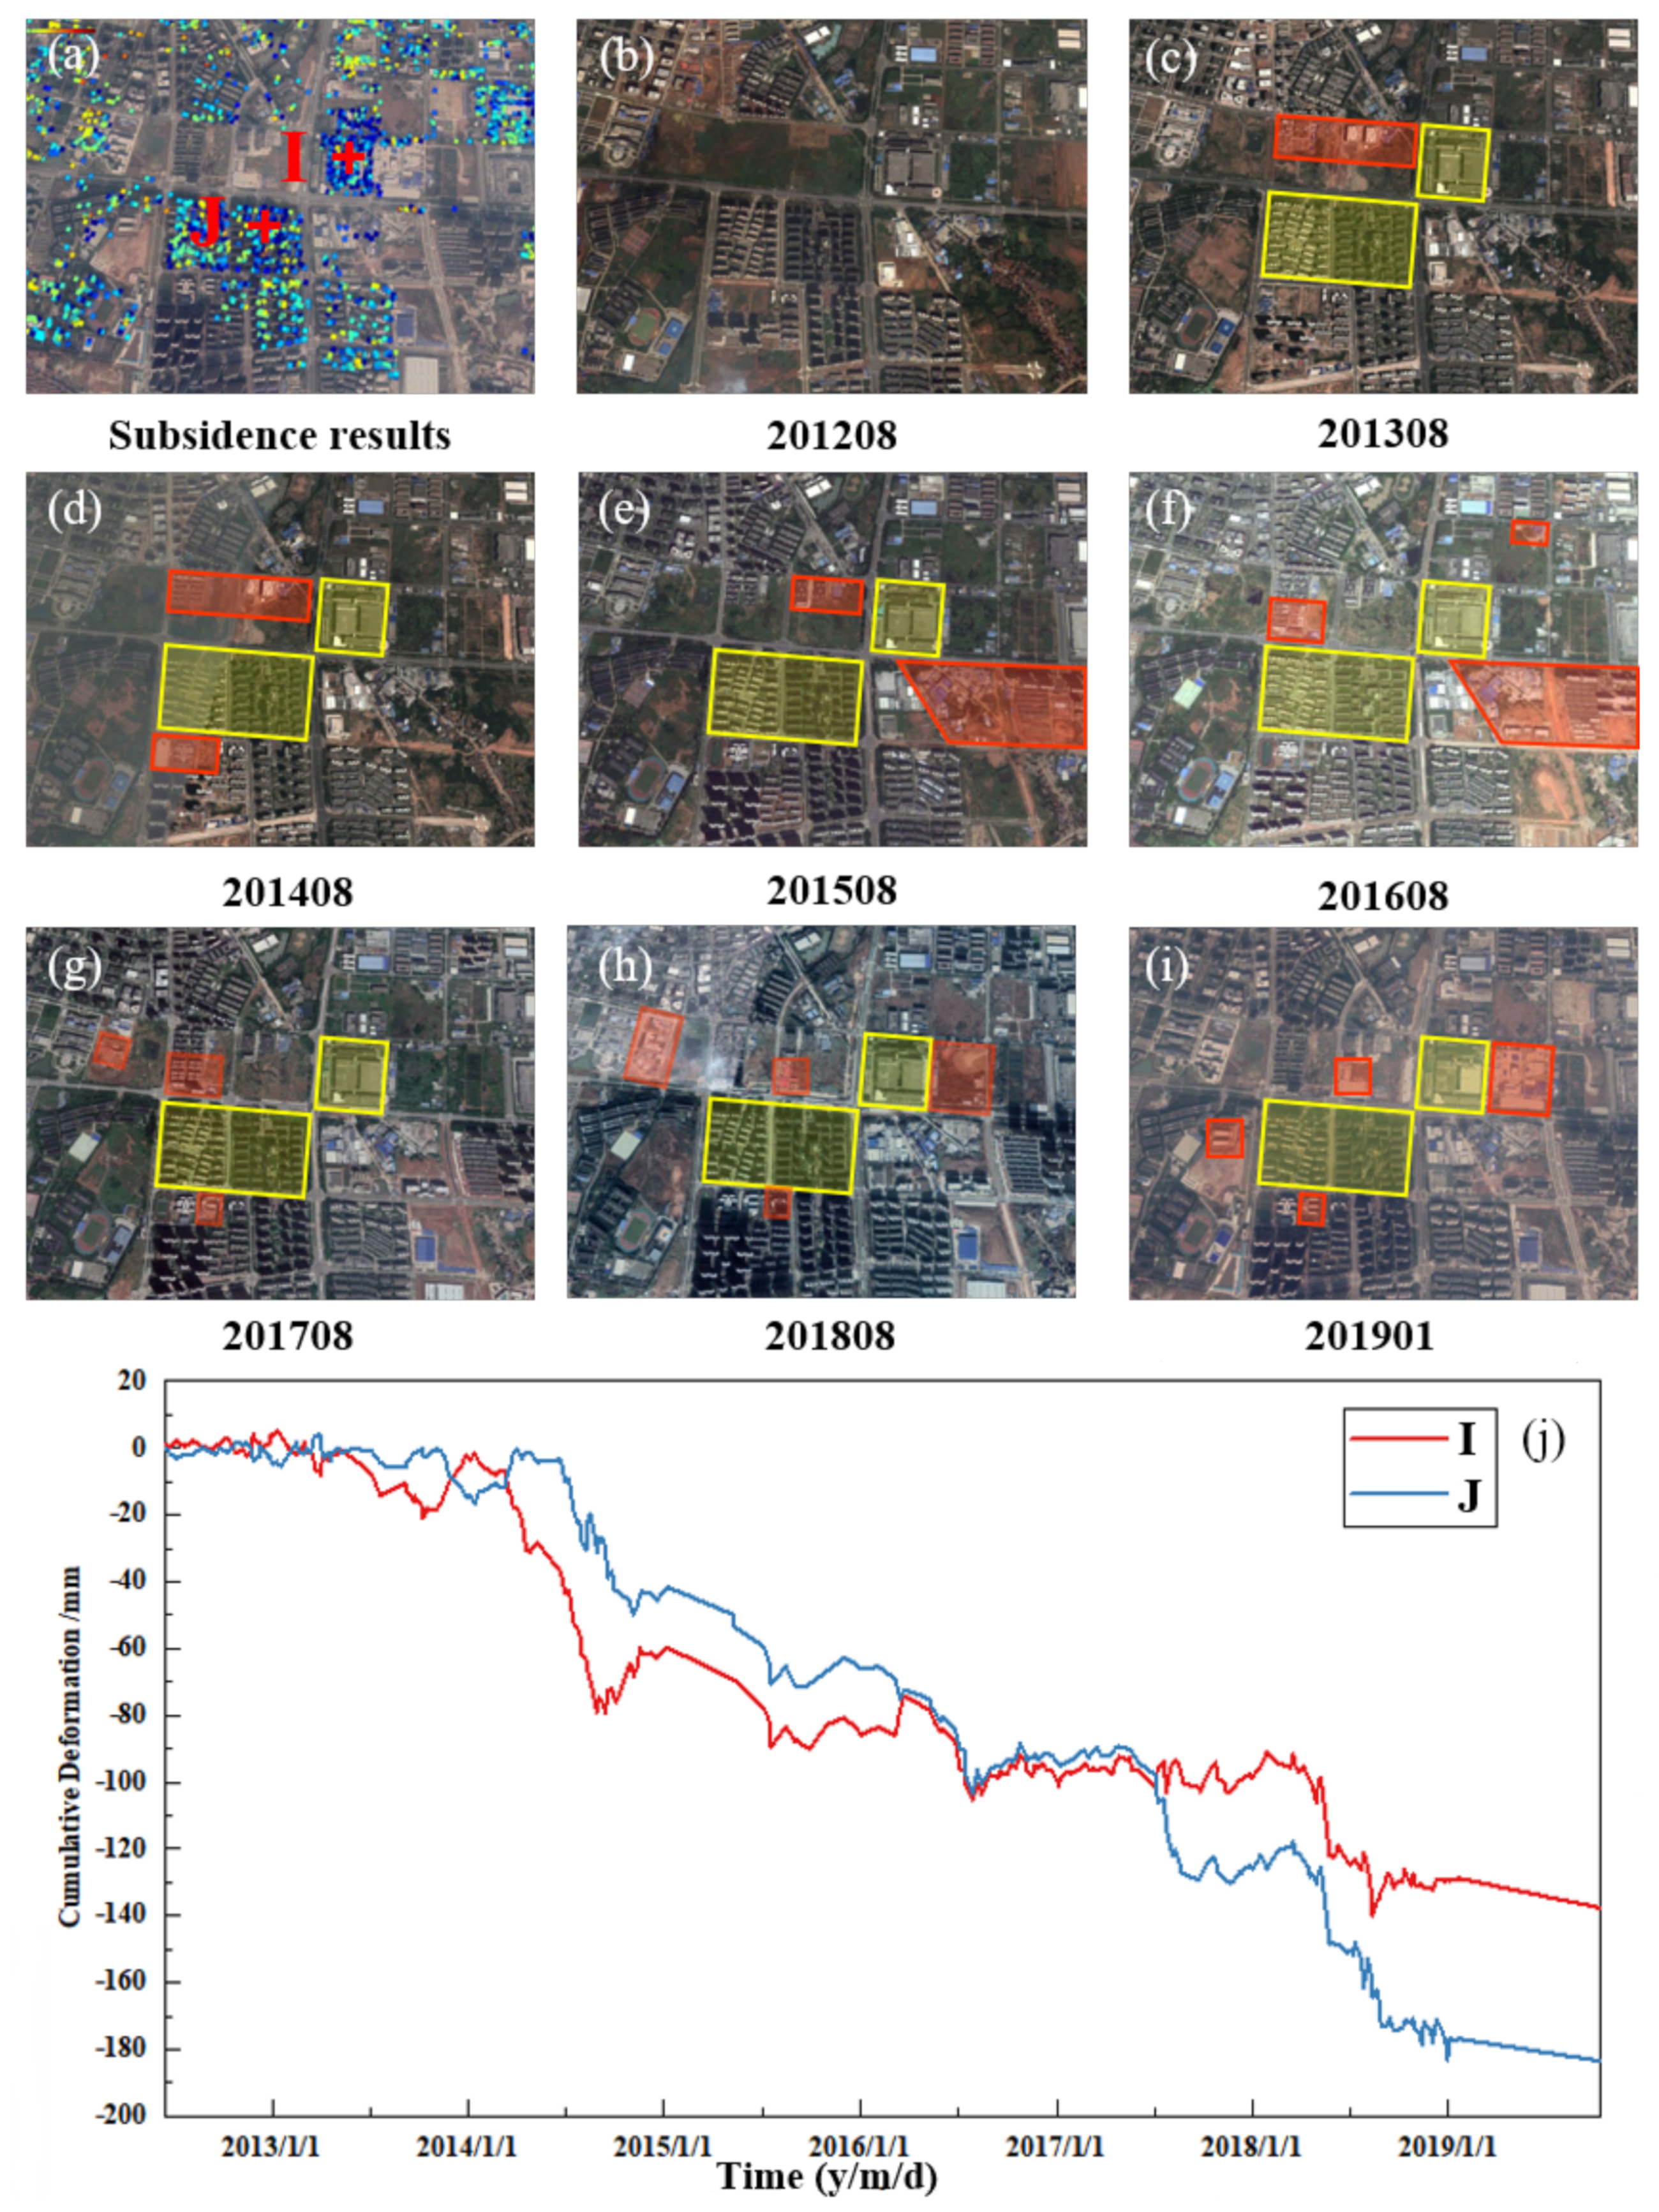
We selected two typical PS points, I and J, in the study area, which are located in the Wuhan Xinxin Semiconductor Manufacturing Co., Ltd. building and Vanke B-1 residential building, i.e., buildings that were already present before 2012 (Figure 6a). The settlement of these two points definitely has clear spatial correlation with the new buildings built in their surroundings. Excluding seasonal change factors in the settlement curve, point I shows two settlement stages that occurred in 2014 and 2018, respectively (Figure 6j). However, point J shows three settlement stages that occurred in 2014, 2017, and 2018. The settlement curves of the two points in 2014 and 2018 are similar in trend, thus suggesting that the causative factors should be the same, i.e., the establishment of the nearby buildings (Figure 6b–i) as part of a large-scale urban construction project. It is worth mentioning that in 2017, all constructions were close to point J, and there was a certain distance from point I. This also caused the noticeable settlement of point J in 2017, while point I was relatively stable. The remaining years mostly contained land leveling and other pre-construction preparatory activities, which can be considered as small-scale urban construction activities, with minimal impact on nearby existing buildings.
6. Conclusions
In this paper, a PSInSAR analysis of nearly 300 COSMO-SkyMed high-resolution images was used to monitor the large-area surface subsidence affecting the city of Wuhan. This long-term investigation allowed, for the first time, a complete overview and analysis of the spatiotemporal deformation trends. The results show that there are many subsidence areas in the main urban areas of Wuhan. The southern industrial park of Guanggu is a settlement area that was newly detected in this paper, which was not observed in previous studies. By combining the long-term sequence of settlement curves to analyze the subsiding area, the relationship between natural factors (soft soil consolidation, rainfall), human factors (subway construction, urban buildings, groundwater pumping), and ground deformation was analyzed and discussed in detail. Urban subsidence is a complex phenomenon with different causes and implications in space and time. We showed that the subsidence in the Houhu area follows the model of soft soil compaction, with influence from local groundwater management practices. Similarly, the deformation at the Xinrong station follows the dynamics of groundwater extraction and construction time, with the exception of the specific effect due to the 2016 flood event. The deformation in the southern industrial park of Guanggu is more complex. At least two main subsidence-causing events seemed to subsequently occur in time, with a complex influence on the local spatiotemporal deformation patterns. In the last years, awareness of ground consolidation and subsidence issues has increased at the local and regional levels, and more monitoring has been implemented, together with an increase in flood prevention measures.
While this unprecedented study has already unveiled the key causative factors of the subsiding zone at Xinrong and the evolution of soft soil consolidation stages at Houhu, further investigations may help to provide additional local and short-scale insights into the spatiotemporal variations of the deformation process in these areas. In the near future, for the newly detected subsidence areas in Guanggu, more data, especially meteorological and hydrological records, will be collected to further corroborate the causes of subsidence at these and other severely affected zones. The research will focus on different advanced InSAR methods and approaches, such as yearly or bi-yearly InSAR processing, which will be used to capture intermittent/temporary subsidence patterns that an overall analysis of the whole period 2012–2019 (as presented here) may have smoothed. Finally, a further research direction could aim to investigate how the effects due to land subsidence intermingle with those due to other types of urban transformations that are happening in Wuhan, such as the construction of new infrastructure and how it impacts local mobility and transportation, for which the long time series of COSMO-SkyMed SAR data has already proved beneficial for multi-temporal monitoring [45].
Author Contributions
Conceptualization, T.B. and H.J.; methodology, H.J. and T.B.; validation, H.J.; resources, D.T. and F.C.; writing—original draft preparation, H.J.; writing—review and editing, T.B., D.T., and F.C.; visualization, H.J. and T.B. All authors have read and agreed to the published version of the manuscript.
Funding
This research received no external funding.
Institutional Review Board Statement
Not applicable.
Informed Consent Statement
Not applicable.
Data Availability Statement
Not applicable.
Acknowledgments
This research was carried out using COSMO-SkyMed Products © of the Italian Space Agency (ASI), delivered under a license for use by ASI (i.e., “WUHAN-CSK” led by D. Tapete).
Conflicts of Interest
The authors declare no conflict of interest.
References
- Wuhan Bureau Statistics. Statistical Yearbook of Wuhan. 2019. Available online: http://www.stats.gov.cn/tjsj/ndsj/2019/indexeh.htm (accessed on 26 February 2021).
- Ning, G.; Chen, G.; Xu, S.; Xiao, Y. Engineering geological research on the underground space of Wuhan city. Hydrogeol. Eng. Geol. 2006, 33, 29–35. [Google Scholar]
- He, B.; Zhong, S.; Luo, Q.; Zhan, B.; Chen, C. Characteristics of karst development and karst treatments. Sci. Technol. Eng. 2017, 17, 336–342. [Google Scholar]
- Fan, S. A Discussion on Karst Collapse in Wuhan (Hubei). Resour. Environ. Eng. 2006, 20, 608–616. [Google Scholar]
- Li, X.; Xiao, S.; Tang, H.; Peng, J. A GIS-based monitoring and early warning system for cover-collapse sinkholes in karst terrane in Wuhan, China. Nat. Hazards Earth Syst. Sci. Discuss. 2017, 1–28. [Google Scholar] [CrossRef]
- Zhou, L.; Guo, J.; Hu, J.; Li, J.; Xu, Y.; Pan, Y.; Shi, M. Wuhan surface subsidence analysis in 2015-2016 based on sentinel-1A data by SBAS-InSAR. Remote Sens. 2017, 9, 982. [Google Scholar] [CrossRef] [Green Version]
- Benattou, M.; Balz, T.; Liao, M. Measuring surface subsidence in Wuhan, China with Sentinel-1 data using PSInSAR. Int. Arch. Photogramm. Remote Sens. Spatial Inf. Sci. 2018, 42, 73–77. [Google Scholar] [CrossRef] [Green Version]
- Zhang, Y.; Liu, Y.; Jin, M.; Jing, Y.; Liu, Y.; Liu, Y.; Sun, W.; Wei, J.; Chen, Y. Monitoring land subsidence in wuhan city (China) using the SBAS-INSAR method with radarsat-2 imagery data. Sensors 2019, 19, 743. [Google Scholar] [CrossRef] [Green Version]
- Bai, L.; Jiang, L.; Wang, H.; Sun, Q. Spatiotemporal characterization of land subsidence and uplift (2009-2010) over Wuhan in Central China revealed by TerraSAR-X InSAR analysis. Remote Sens. 2016, 8, 350. [Google Scholar] [CrossRef] [Green Version]
- Costantini, M.; Bai, J.; Malvarosa, F.; Minati, F.; Vecchioli, F.; Wang, R.; Hu, Q.; Xiao, J.; Li, J. Ground deformations and building stability monitoring by COSMO-SkyMed PSP SAR interferometry: Results and validation with field measurements and surveys. In Proceedings of the 2016 IEEE International Geoscience and Remote Sensing Symposium (IGARSS), Beijing, China, 10–15 July 2016; pp. 6847–6850. [Google Scholar] [CrossRef]
- Holzer, T.L. Man-Induced Land Subsidence; Geological Society of America: Boulder, CO, USA, 1984. [Google Scholar]
- Chaussard, E.; Wdowinski, S.; Cabral-Cano, E.; Amelung, F. Land subsidence in central Mexico detected by ALOS InSAR time-series. Remote Sens. Environ. 2014, 140, 94–106. [Google Scholar] [CrossRef]
- Zhu, B.; Wang, Y. Road Surface Deformation Assessment of Chengdu, China Using PS-InSAR Technique and Sentinel-1 Multi-Temporal SAR Datasets. In Proceedings of the IGARSS 2019—2019 IEEE International Geoscience and Remote Sensing Symposium, Yokohama, Japan, 28 July–2 August 2019; pp. 2006–2009. [Google Scholar] [CrossRef]
- Ferretti, A.; Prati, C.; Rocca, F. Nonlinear subsidence rate estimation using permanent scatterers in differential SAR interferometry. IEEE Trans. Geosci. Remote Sens. 2000, 38, 2202–2212. [Google Scholar] [CrossRef] [Green Version]
- Ferretti, A.; Prati, C.; Rocca, F. Permanent scatterers in SAR interferometry. IEEE Trans. Geosci. Remote Sens. 2001, 39, 8–20. [Google Scholar] [CrossRef]
- Berardino, P.; Fornaro, G.; Lanari, R.; Sansosti, E. A new algorithm for surface deformation monitoring based on small baseline differential SAR interferograms. IEEE Trans. Geosci. Remote Sens. 2002, 40, 2375–2383. [Google Scholar] [CrossRef] [Green Version]
- Lanari, R.; Mora, O.; Manunta, M.; Mallorquí, J.J.; Berardino, P.; Sansosti, E. A small-baseline approach for investigating deformations on full-resolution differential SAR interferograms. IEEE Trans. Geosci. Remote Sens. 2004, 42, 1377–1386. [Google Scholar] [CrossRef]
- Motagh, M.; Walter, T.R.; Sharifi, M.A.; Fielding, E.; Schenk, A.; Anderssohn, J.; Zschau, J. Land subsidence in Iran caused by widespread water reservoir overexploitation. Geophys. Res. Lett. 2008, 35, 33814. [Google Scholar] [CrossRef] [Green Version]
- Guo, J.; Zhou, L.; Yao, C.; Hu, J. Surface Subsidence Analysis by Multi-Temporal InSAR and GRACE: A Case Study in Beijing. Sensors 2016, 16, 1495. [Google Scholar] [CrossRef] [PubMed] [Green Version]
- Cigna, F.; Tapete, D. Satellite InSAR survey of structurally-controlled land subsidence due to groundwater exploitation in the Aguascalientes Valley, Mexico. Remote Sens. Environ. 2021, 254, 112254. [Google Scholar] [CrossRef]
- Han, Y.; Zou, J.; Lu, Z.; Qu, F.; Kang, Y.; Li, J. Ground deformation of wuhan, china, revealed by multi-temporal insar analysis. Remote Sens. 2020, 12, 3788. [Google Scholar] [CrossRef]
- Crosetto, M.; Monserrat, O.; Cuevas-González, M.; Devanthéry, N.; Luzi, G.; Crippa, B. Measuring thermal expansion using X-band persistent scatterer interferometry. ISPRS J. Photogramm. Remote Sens. 2015, 100, 84–91. [Google Scholar] [CrossRef] [Green Version]
- Li, Z.; Tan, Y.; Li, L.; Yu, Z.; Lan, H. Study of Land Surface Composition of Wuhan City based on Linear Spectral Mixture Analysis. Remote Sens. Technol. Appl. 2013, 28, 780–784. [Google Scholar]
- Wu, H.L.; Cheng, W.C.; Shen, S.L.; Lin, M.Y.; Arulrajah, A. Variation of hydro-environment during past four decades with underground sponge city planning to control flash floods in Wuhan, China: An overview. Undergr. Space 2020, 5, 184–198. [Google Scholar] [CrossRef]
- Wang, X.; Lai, J.; He, S.; Garnes, R.S.; Zhang, Y. Karst geology and mitigation measures for hazards during metro system construction in Wuhan, China. Nat. Hazards 2020, 103, 2905–2927. [Google Scholar] [CrossRef]
- Luo, X.J. Division of “Six Belts and Five Types” of carbonate region and control of karst geological disaster in Wuhan. J. Hydraul. Eng. 2014, 45, 171–179. [Google Scholar]
- Chen, Z.; Chen, S.; Wu, L. Experimental analysis of soft soil characteristic in Wuhan. Resour. Environ. Eng. 2015, 29, 974–977. [Google Scholar]
- Zhang, X.; Tang, H.; Qin, Z. Study on the imperilments of soft foundation and land subsidence in Wuhan. Geol. Sci. Technol. Inf. 2003, 22, 95–99. [Google Scholar]
- Natural Wuhan Resources and Planning Bureau. Wuhan City Geological Disaster Prevention Plan (2016–2020); Natural Wuhan Resources and Planning Bureau: Wuhan, China, 2018.
- Covello, F.; Battazza, F.; Coletta, A.; Lopinto, E.; Fiorentino, C.; Pietranera, L.; Valentini, G.; Zoffoli, S. COSMO-SkyMed an existing opportunity for observing the Earth. J. Geodyn. 2010, 49, 171–180. [Google Scholar] [CrossRef] [Green Version]
- Caltagirone, F.; Capuzi, A.; Coletta, A.; De Luca, G.F.; Scorzafava, E.; Leonardi, R.; Rivola, S.; Fagioli, S.; Angino, G.; Labbate, M.; et al. The COSMO-SkyMed dual use earth observation program: Development, qualification, and results of the commissioning of the overall constellation. IEEE J. Sel. Top. Appl. Earth Obs. Remote Sens. 2014, 7, 2754–2762. [Google Scholar] [CrossRef]
- Battagliere, M.; Covello, F.; Coletta, A. COSMO-SkyMed background mission: Overview, objectives and results. In Proceedings of the 63rd International Astronautical Congress, Naples, Italy, 1–5 October 2012; pp. 1–5. [Google Scholar]
- European Space Agency. Sentinel-1 Observation Scenario; European Space Agency: Paris, France, 2014. [Google Scholar]
- Roccheggiani, M.; Piacentini, D.; Tirincanti, E.; Perissin, D.; Menichetti, M. Detection and monitoring of tunneling induced ground movements using Sentinel-1 SAR interferometry. Remote Sens. 2019, 11, 639. [Google Scholar] [CrossRef] [Green Version]
- Perissin, D.; Wang, Z.; Lin, H. Shanghai subway tunnels and highways monitoring through Cosmo-SkyMed Persistent Scatterers. ISPRS J. Photogramm. Remote Sens. 2012, 73, 58–67. [Google Scholar] [CrossRef]
- Milillo, P.; Giardina, G.; Perissin, D.; Milillo, G.; Coletta, A.; Terranova, C. Pre-Collapse Space Geodetic Observations of Critical Infrastructure: The Morandi Bridge, Genoa, Italy. Remote Sens. 2019, 11, 1403. [Google Scholar] [CrossRef] [Green Version]
- Stramondo, S.; Bozzano, F.; Marra, F.; Wegmuller, U.; Cinti, F.R.; Moro, M.; Saroli, M. Subsidence induced by urbanisation in the city of Rome detected by advanced InSAR technique and geotechnical investigations. Remote Sens. Environ. 2008, 112, 3160–3172. [Google Scholar] [CrossRef]
- Pratesi, F.; Tapete, D.; Del Ventisette, C.; Moretti, S. Mapping interactions between geology, subsurface resource exploitation and urban development in transforming cities using InSAR Persistent Scatterers: Two decades of change in Florence, Italy. Appl. Geogr. 2016, 77, 20–37. [Google Scholar] [CrossRef] [Green Version]
- Hu, X.; Oommen, T.; Lu, Z.; Wang, T.; Kim, J.W. Consolidation settlement of Salt Lake County tailings impoundment revealed by time-series InSAR observations from multiple radar satellites. Remote Sens. Environ. 2017, 202, 199–209. [Google Scholar] [CrossRef]
- Xue, S.; Li, S.; Lin, R. The back analysis of consolidation coefficient of soft soil foundation changing with time. Sci. Technol. Eng. 2007, 17, 245–250. [Google Scholar]
- Seo-Woo, P.; Sang-Hoon, H. Nonlinear Modeling of Subsidence from a Decade of InSAR Time Series. Geophys. Res. Lett. 2020, 48. [Google Scholar] [CrossRef]
- Xu, H. Dynamic Reaction Property and Distribution of Soft Soil in the Urban District of Wuhan. Soil Eng. Found. 1997, 11, 8–12. [Google Scholar]
- Zhang, X. Soil Mechanic; China Communications Press: Beijing, China, 2011. [Google Scholar]
- Cigna, F.; Jordan, H.; Bateson, L.; McCormack, H.; Roberts, C. Natural and Anthropogenic Geohazards in Greater London Observed from Geological and ERS-1/2 and ENVISAT Persistent Scatterers Ground Motion Data: Results from the EC FP7-SPACE PanGeo Project. Pure Appl. Geophys. 2015, 172, 2965–2995. [Google Scholar] [CrossRef] [Green Version]
- Tanveer, H.; Balz, T.; Cigna, F.; Tapete, D. Monitoring 2011–2020 traffic patterns in Wuhan (China) with COSMO-SkyMed SAR, amidst the 7th CISM military world games and COVID-19 outbreak. Remote Sens. 2020, 12, 1636. [Google Scholar] [CrossRef]
Figure 1.
(a) The geographical location of Wuhan (China) and (b) a zoom on the Hankou, Hanyang, and Wuchang research areas. The red point in the inset map in (a) represents the location of Wuhan city in China, the red rectangle represents the coverage of COSMO-SkyMed StripMap HIMAGE images, and the yellow rectangles in (b) indicate the locations of the three main research areas—located in Houhu (HH), Xinrong (XR), and the southern industrial park of Guanggu (SIGG)—overlaid on Google Earth imagery. The topography in (a) is from the Shuttle Radar Topography Mission (SRTM) digital elevation model by NASA.

Figure 2.
(a) Simplified geological map of Wuhan, where units are grouped by age (modified from [24]). The black rectangle represents the location of Houhu (HH), which is the representative research area affected by soft soil geological factors and is investigated in detail in this paper. (b) Typical cross-section of Wuhan’s geological structure, with details on lithologies and their thickness (reproduced from [25]).

Figure 3.
(a) Persistent Scatterer Interferometric Synthetic Aperture Radar (PSInSAR) cumulative deformation map in Wuhan from June 2012 to December 2019, with (b) detail over the Hankou area. The white star represents the location of the reference point. The white rectangles and irregular polygons are the five detected settlement areas (S1–S5). HK, QS, and SIGG are the abbreviations of Hankou, Qingshan, and the southern industrial park of Guanggu, respectively. The result is superimposed onto Google Earth imagery.

Figure 4.
(a) Cumulative deformation map of Houhu—with the study area outlined by the white polygon and the selected points, A, B, C, and D, in red—superimposed onto Google Earth imagery. (b) The deformation curves of A, B, C, and D are compared and distinguished into the early, middle, and late stages of consolidation and compression. (c,d) Photographs obtained from field investigations to prove the damage caused to residential areas by soft soil consolidation (photographs taken by Haonan Jiang; September 2020).

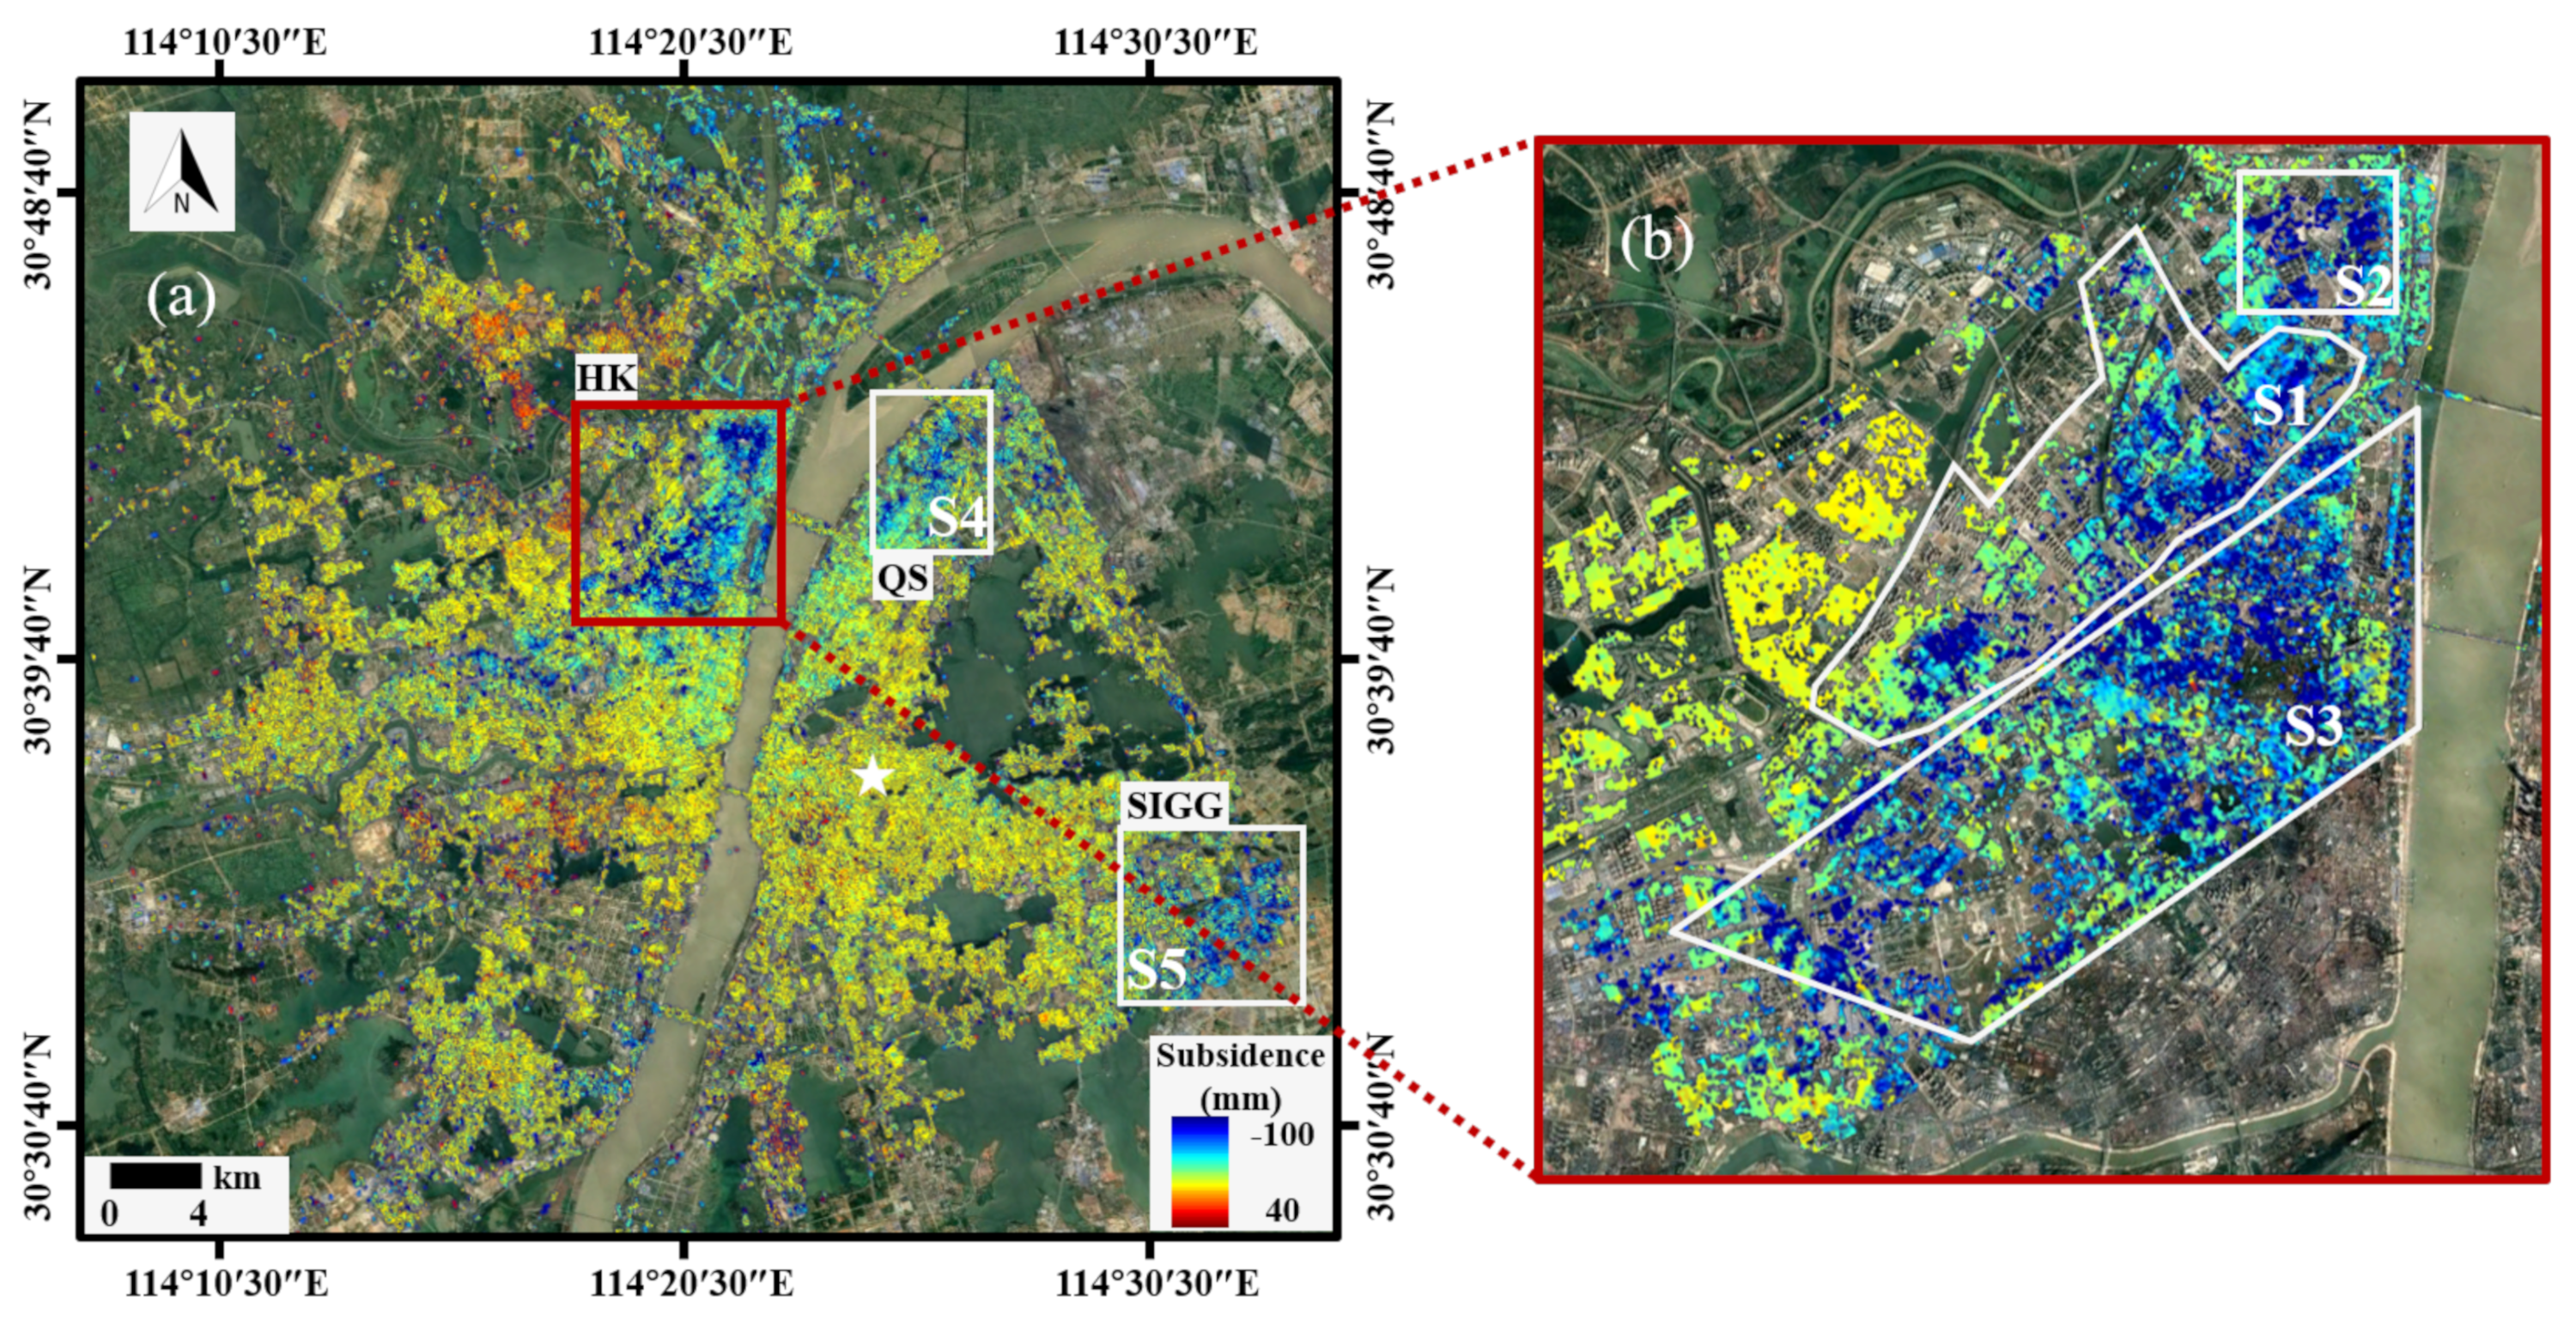
Figure 5.
(a) Cumulative deformation map of the Xinrong area, superimposed onto Google Earth imagery. The red and purple lines are the paths of Metro Lines 1 and 21, respectively. The intersection of the two subway lines identifies the center of the ground settlement. (b) Settlement curves corresponding to four typical PS points, E, F, G, and H, selected equidistantly from the settlement center to the edge marked in (a). The orange bar graph shows the rainfall data. (c,d) Photos taken during field investigation showing noticeable cracks and discontinuities in the road caused by the settlement (photographs taken by Haonan Jiang; September 2020).

Figure 6.
(a) Cumulative deformation map of the southern industrial park of Guanggu, with an indication of the locations of the two selected typical PS points, I and J. (b–i) Google Earth time lapse of the study area from 2012 to 2019, in which the yellow rectangles are the settlement areas centered on points I and J, and the red rectangles are the new urban construction areas that appeared from one year to another as the large-scale urban construction projects progressed. (j) Deformation curve corresponding to points I and J marked in picture (a).


Table 1.
Key parameters of COSMO-SkyMed data stack used in this paper.
| Parameters | Description |
|---|---|
| Product type | L1A, single-look complex slant (SCS) products |
| Imaging Modes | StripMap HIMAGE |
| Operating Band | X Band |
| Wavelength (cm) | 3.1 |
| Polarization | Single, HH |
| Revisit frequency (day) | 10 (average) |
| Orbit direction | Ascending |
| Looking direction | Right |
| Range resolution (m) | 3 |
| Azimuth resolution (m) | 3 |
| Ground swath width (km) | 40 |
| Number of images | 286 |
| Date of earliest image used | 16 June 2012 |
| Date of latest image used | 3 November 2019 |
1 Average value achieved over Wuhan with the full COSMO-SkyMed constellation of four satellites.
Table 2.
Final deformation and consolidation degree of Persistent Scatterer (PS) points in the Houhu area of Wuhan.
Table 2.
Final deformation and consolidation degree of Persistent Scatterer (PS) points in the Houhu area of Wuhan.
| PS Point | Final Deformation (mm) | Consolidation Degree of Soft Soil (%) | ||||||
|---|---|---|---|---|---|---|---|---|
| 2012 | 2013 | 2014 | 2015 | 2016 | 2017 | 2018 | ||
| A | −90.8 | 3.77 | 6.28 | 74.31 | 88.83 | 91.11 | 92.22 | 95.66 |
| B | −139.4 | 3.56 | 17.12 | 68.95 | 89.63 | 90.93 | 93.10 | 94.67 |
| C | −80.0 | 7.37 | 18.56 | 69.36 | 89.24 | 89.68 | 89.74 | 90.67 |
| D | −167.0 | 1.47 | 8.40 | 62.90 | 90.01 | 92.15 | 95.03 | 96.68 |
Publisher’s Note: MDPI stays neutral with regard to jurisdictional claims in published maps and institutional affiliations. |
© 2021 by the authors. Licensee MDPI, Basel, Switzerland. This article is an open access article distributed under the terms and conditions of the Creative Commons Attribution (CC BY) license (http://creativecommons.org/licenses/by/4.0/).
Share and Cite
MDPI and ACS Style
Jiang, H.; Balz, T.; Cigna, F.; Tapete, D. Land Subsidence in Wuhan Revealed Using a Non-Linear PSInSAR Approach with Long Time Series of COSMO-SkyMed SAR Data. Remote Sens. 2021, 13, 1256. https://doi.org/10.3390/rs13071256
AMA Style
Jiang H, Balz T, Cigna F, Tapete D. Land Subsidence in Wuhan Revealed Using a Non-Linear PSInSAR Approach with Long Time Series of COSMO-SkyMed SAR Data. Remote Sensing. 2021; 13(7):1256. https://doi.org/10.3390/rs13071256
Chicago/Turabian StyleJiang, Haonan, Timo Balz, Francesca Cigna, and Deodato Tapete. 2021. "Land Subsidence in Wuhan Revealed Using a Non-Linear PSInSAR Approach with Long Time Series of COSMO-SkyMed SAR Data" Remote Sensing 13, no. 7: 1256. https://doi.org/10.3390/rs13071256
Note that from the first issue of 2016, this journal uses article numbers instead of page numbers. See further details here.