Communication

Interannual and Seasonal Variability of Greenhouse Gases and Aerosol Emissions from Biomass Burning in Northeastern China Constrained by Satellite Observations

1
Key Laboratory of Wetland Ecology and Environment, Northeast Institute of Geography and Agroecology, Chinese Academy of Sciences, Changchun 130102, China
2
University Chinese Academy of Science, Beijing 100049, China
3
Center for Spatial Information Science and Systems, George Mason University, Fairfax, VA 22030, USA
4
Department of Atmospheric, Oceanic and Earth Sciences, George Mason University, Fairfax, VA 22030, USA
*
Author to whom correspondence should be addressed.
Remote Sens. 2021, 13(5), 1005; https://doi.org/10.3390/rs13051005
Submission received: 2 February 2021 / Revised: 28 February 2021 / Accepted: 2 March 2021 / Published: 6 March 2021
(This article belongs to the Special Issue Vegetation Fires, Greenhouse Gas Emissions and Climate Change)

Abstract

:
Biomass burning is a major source of greenhouse gases (GHGs) and particulate matter (PM) emissions in China. Despite increasing efforts of fire monitoring, it remains challenging to quantify the variability in interannual and seasonal emissions of GHGs and PM from biomass burning. In this study, we investigated the biomass burning emissions in Northeastern China based on fire radiative power (FRP) obtained from the Visible Infrared Imaging Radiometer Suites (VIIRS) active fires datasets during the period 2012 to 2019. Our results showed that the average annual emissions from biomass burning in Northeastern China during 2012–2019 were: 81.6 Tg for CO2, 260.2 Gg for CH4, 5.5 Gg for N2O, 543.2 Gg for PM2.5 and 573.6 Gg for PM10, respectively. Higher levels of GHGs and PM emissions were concentrated in the Songnen Plain and Sanjiang Plain, the main grain producing areas in this region, and were associated with dense fire points. There were two emission peaks observed each year: after harvesting (October to November) and before planting (March to April). During this study period, the total fire emissions initially increased and then decreased in a fluctuating pattern, with emissions peaking in 2015, the year when more emission regulations were introduced. Crop straw was the major source of GHGs and PM among all kinds of biomass burning. Following more stringent controls on burning and the utilization of crop straw, the main burning season changed from autumn to spring. The proportion from spring burning increased from 20.5% in 2013 to 77.1% in 2019, with an annual growth rate of 20%. The results of this study demonstrate the effectiveness of regulatory control in reducing GHGs and PM emissions, as well as satellite fire observations as a powerful means to assess such outcomes.

Graphical Abstract

1. Introduction

Biomass burning (BB) is an important source of aerosols and greenhouse gases (GHGs), including carbon dioxide (CO2), methane (CH4), and nitrous oxide (N2O) [1,2]. It is estimated that, globally, approximately 8.8 Pg of dry biomass is burned annually, with emissions of CO2, CH4 and N2O of 13.9 Pg yr−1, 50 Tg −1 and 1.36 Tg −1, respectively [2]. Furthermore, BB can contribute a large amount of chemically active gases (e.g., CO, NO, non-methane hydrocarbons) to the atmosphere at regional and global levels [2]. These gases lead to the chemical production of tropospheric ozone (another GHG), which can severely affect air quality and climate change. Therefore, emissions from biomass burning are a significant issue in the atmospheric environment field.
Biomass burning emissions have been extensively studied worldwide, based on satellite data and statistical data [3,4,5]. The estimation of emissions based on statistical data could provide more accurate information of emissions from biofuel burnt indoors, but there was a time lag between the emission inventory and biofuel burning [6]. Quantifying emissions based on satellite data is widely used at present [7,8,9] and focuses mainly on burned area and fire radiative power (FRP). However, open field burning events covering small areas or short durations are difficult to detect by satellite. Furthermore, the emission factors (EFs) of all pollutants from biomass burning are another important parameter in calculating emissions, and this is related to biomass types (land use) and combustion conditions. Previous fire emission assessments, such as FINN (the Fire Inventory from NCAR (National Center for Atmospheric Research)) [10], GFAS (Global Fire Assimilation System) [11], and GFED (Global Fire Emission Database) [12], all used the same EFs for all types of cropland. However, worldwide there are many types of crops, and the EF varies with crop type. Therefore, to improve the accuracy of the biomass burning emission inventory, it is helpful to calculate biomass burning emissions using high-resolution satellite data and the EFs of different biomass and crop types.
China is one of the world’s largest employers of biomass burning, and is dominated by open field burning of crop residues. On a global scale, approximately 17.9% of straw resource [13] and 3–6% of agricultural fires are from China [14]. The estimation of emissions from biomass burning in China mainly focuses on calculating the emissions inventory and analyzing the spatio-temporal distributions [4,7,15]. Emissions from biomass burning are related to anthropogenic factors (e.g., local customs, laws and regulations for open field burning) and natural factors (e.g., lightning, precipitation). The uncertainties of anthropogenic and natural factors may limit the study of the spatial and temporal distribution of air pollutant emissions from biomass burning in China. At the same time, the emissions of biomass burning can present seasonal and annual variability, particularly in recent years, when a series of laws and regulations for the control of open field agricultural straw burning has been promulgated to reduce biomass burning emissions and improve air quality. However, the impact of laws and regulations on open field biomass burning has been given little attention; in particular, the seasonal and annual variability of GHGs and aerosols during this period have not been reported.
Northeastern China is one of the major grain-producing regions in China. Due to the huge amounts of crop straw, limited storage room and high cost of collection, a large amount of crop straw is burned in the fields after harvesting in this region, which causes severe regional haze [8]. Recently, a straw burning ban and alternative straw utilization strategy were introduced to control crop straw open field burning and reduce air pollution in this region. However, the seasonal and interannual variability of GHGs and aerosols have not been analyzed in this region. The objectives of this study are (1) to identify the interannual and seasonal variability of GHGs and aerosols from biomass burning emissions in Northeastern China; and (2) to assess the policy implications of the burning season on GHGs and aerosol emissions from biomass burning.

2. Methodology

2.1. Study Area

The geographical region of Northeastern China consists of Heilongjiang Province, Jilin Province, Liaoning Province, and four prefectural-level cities in the eastern region of Inner Mongolia Autonomous Region (Figure 1). Northeastern China is a major grain producing region, with a total area of 3.5 × 10⁵ km2. The annual mean temperature in this region is 4.7 °C. Due to the cold climate, the planting pattern is single cropping, conventional planting in May and harvesting in October. The average yearly straw yield is 159 Tg, accounting for 20% of the total straw yield in China [16]. The planting area is mainly concentrated in the Songnen Plain and Sanjiang Plain.

2.2. Estimating Biomass Burning Emissions

A modified fire radiative power (FRP) algorithm was used to estimate the emissions of greenhouse gases and aerosols from biomass burning in Northeastern China during the period from 2012 to 2019 [8]. The formula used was as follows:
E = t 1 t 2 F R P * d t × β × E F = F R P × f F R P × t 2 t 1 × β × E F
where E is the biomass burning emissions (g); FRP* is the modified satellite fire radiative power (MW); FRP is the instantaneous fire radiative power observed by polar-orbit satellite (MW); fFRP is the correction factor to be used for adjusting the underestimated emissions by polar-orbit satellite fire spots, here set as 5 after series sensitivity experiments between polar-orbit satellite and geostationary satellite data and observation data [8]; t2 and t1 are the beginning and end times of fire events; β is the biomass combustion factor (kg/MJ); the averaged value of 0.411 kg/MJ from previous studies [17,18] was used in this study; and EF is the emission factor for a pollutant species emitted from biomass burning (g/kg). Moreover, according to the previous studies, approximately 68% of active fires within the 0.02° × 0.02° grid cells were detected [19]. Then, another correction factor, fnum, was used to fill in the missed fire spots. So, the total emissions from biomass burning are calculated by the following formula:
E t o t = E × f n u m
where E t o t is the total emissions from open biomass burning (g) and f n u m is the correction factor, the fnum value is 1.47 (1/0.68).

2.3. Determining Parameters for Emission Estimation

Fire radiative power was retrieved from NOAA’s (National Oceanic and Atmospheric Administration) Visible Infrared Imaging Radiometer Suite (VIIRS) 375 m I-band fire product [20]. The 375 m data complement Moderate Resolution Imaging Spectroradiometer (MODIS) fire detection; they both show good agreement in hotspot detection, but the improved spatial resolution of the 375 m data provides a greater response over fires of relatively small areas and provides improved mapping of large fire perimeters [21]. Both Near Real-Time (NRT) data and older standard/science quality data can be downloaded. The VIIRS 375m standard active fire and thermal anomalies product was used in this study, which is the standard quality dataset and is advised to perform scientific analysis. The dataset is in pixel level and consists of fire location (latitude, longtitude), confidence, FRP and other parameters. VIIRS is onboard the Suomi National Polar-Orbiting Partnership (Suomi NPP) spacecraft, which overpasses Northeastern China between 12:00 and 14:00 local time every day, so only fires occurring in this period were captured. In order to calculate the daily emissions using the instant FRP, a series of sensitivity experiments was conducted and a correction factor, fFRP, was used for adjusting fire emissions to the actual fire conditions. Firstly, the Himawari-8 fire products with 10 min resolution from June 2015 to April 2019 in Northeastern China were analyzed, and the hourly distributions of fire points were obtained. The hourly proportion showed that only 23% of whole day fires occurred during 12:00 to 14:00. This means that about 3 times these fires were underestimated. Furthermore, a previous study also reported that the retrieved FRP from the VIIRS 375 m I-Brand only used fire products and underestimated the FRP value due to I-Brand pre-aggregation saturation in Eastern China [22]. Then, we set the fFRP values to 1, 3, 5 and 7 to calculate fire emissions, and compared the simulated results with the observed data. The results showed that, with the values 1 and 3, the simulated data were lower than the observed data; while with the value of 7, the simulated data were higher than the observed data. When the value was set to 5, the time series of simulated data agreed well with the observed data. Then, the value fFRP was selected as 5 [8]. For the duration time of the fires, previous studies were mainly obtained via the geostationary satellites, assuming that the duration time of burning could be extended to 2 h before and after the fire detected time when the fire was detected more than 3 times a day [23]. Meanwhile, the average burning time of open field crop residue fires was about 3 h in Northeastern China, according to questionnaires with local farmers. Then, we assumed that the fire could last one hour prior and post the fire detection by VIIRS sensors.
To apply Equation (1), we needed to know the vegetation type for each fire and EF for each vegetation type first. Here, we overlaid the fire location and landcover data. First, the landcover file included 14 land cover types and crop planting area data were obtained from MAMSPAM [24]. Then, we judged the fire point to the nearest landcover grid cell, according to fire location (latitude and longitude) in VIIRS fire products. Vegetation type and emission factors from crops with the largest planting area in this grid cell were selected for this grid. For forest fire, shrubland fire, and grassland fire, the EFs were chosen from the data provided in a previously published paper, and are widely used in global biomass burning emission studies. For cropland fire, instead of using one emission factor for all crop types, we selected the EF according to the crop type. Seven crop types, including rice, corn, soybeans, rapeseed, potatoes, beet and wheat, were considered. Furthermore, to improve the accuracy of the EFs, the EFs for all crop types were derived mainly from localized open field burning. For pollutant species, we calculated greenhouse gases (CO2, CH4, N2O), PM2.5 (particulate matter with diameter less than 2.5 μm) and PM10 (particulate matter with diameter less than 10 μm). Furthermore, some pollutants, such as NMVOCs (non-methane volatile organic compounds), OC (organic carbon) and EC (elemental carbon), were also mentioned in this study. Here, OC and EC are part of PM2.5 and PM10, which provided high resolution input data for local air quality forecasting. Detailed values of EFs of each pollutant from crop straw and other biomass are shown in Tables S1 and S2.

2.4. Interannual and Seasonal Emission Variability

Before trend analysis, the accuracy of the emission inventory is assessed by comparing the simulated emission data with the field monitoring data. First, we compare the simulation data with the field data before trend analyses. Eighteen monitoring stations located in the main crop planting areas of Northeastern China were selected and used when checking the accuracy. The estimated emissions are consistent with the field monitoring data [8]. Second, we compared our results to other fire emission inventories, such as GFAS and FINN. Our results are much higher than those from GFAS and FINN emission inventories. Other studies also demonstrated that GFAS and FINN emission inventories underestimated the open biomass burning in China [25]. The reason would be that the VIIRS sensors are capable of detecting more fires, especially for relatively smaller areas, when compared to MODIS.
Using the daily emissions of pollutant gases and particulate matter from biomass burning in Northeastern China, we explored the temporal characteristics and the annual and seasonal emissions variability. For the annual emissions variability, we calculated the annual emissions from 2012 to 2019. During this period, a ban on straw burning was implemented and the alternative utilization of crop straw was introduced as part of the efforts to control open field burning and reduce air pollution in this region. The amount of crop straw burned in open fields varied from year to year, subject to changes in weather conditions (e.g., early snowing season), socioeconomic decisions (e.g., straw as domestic fuel), and emission control regulations. We divided the burning time into three periods: autumn burning (1 October to 31 December, after harvesting); spring burning (1 February to 30 April, before planting); and the remaining periods (January, and May to September). The emissions in each period were calculated and the variability was analyzed.

3. Results and Discussion

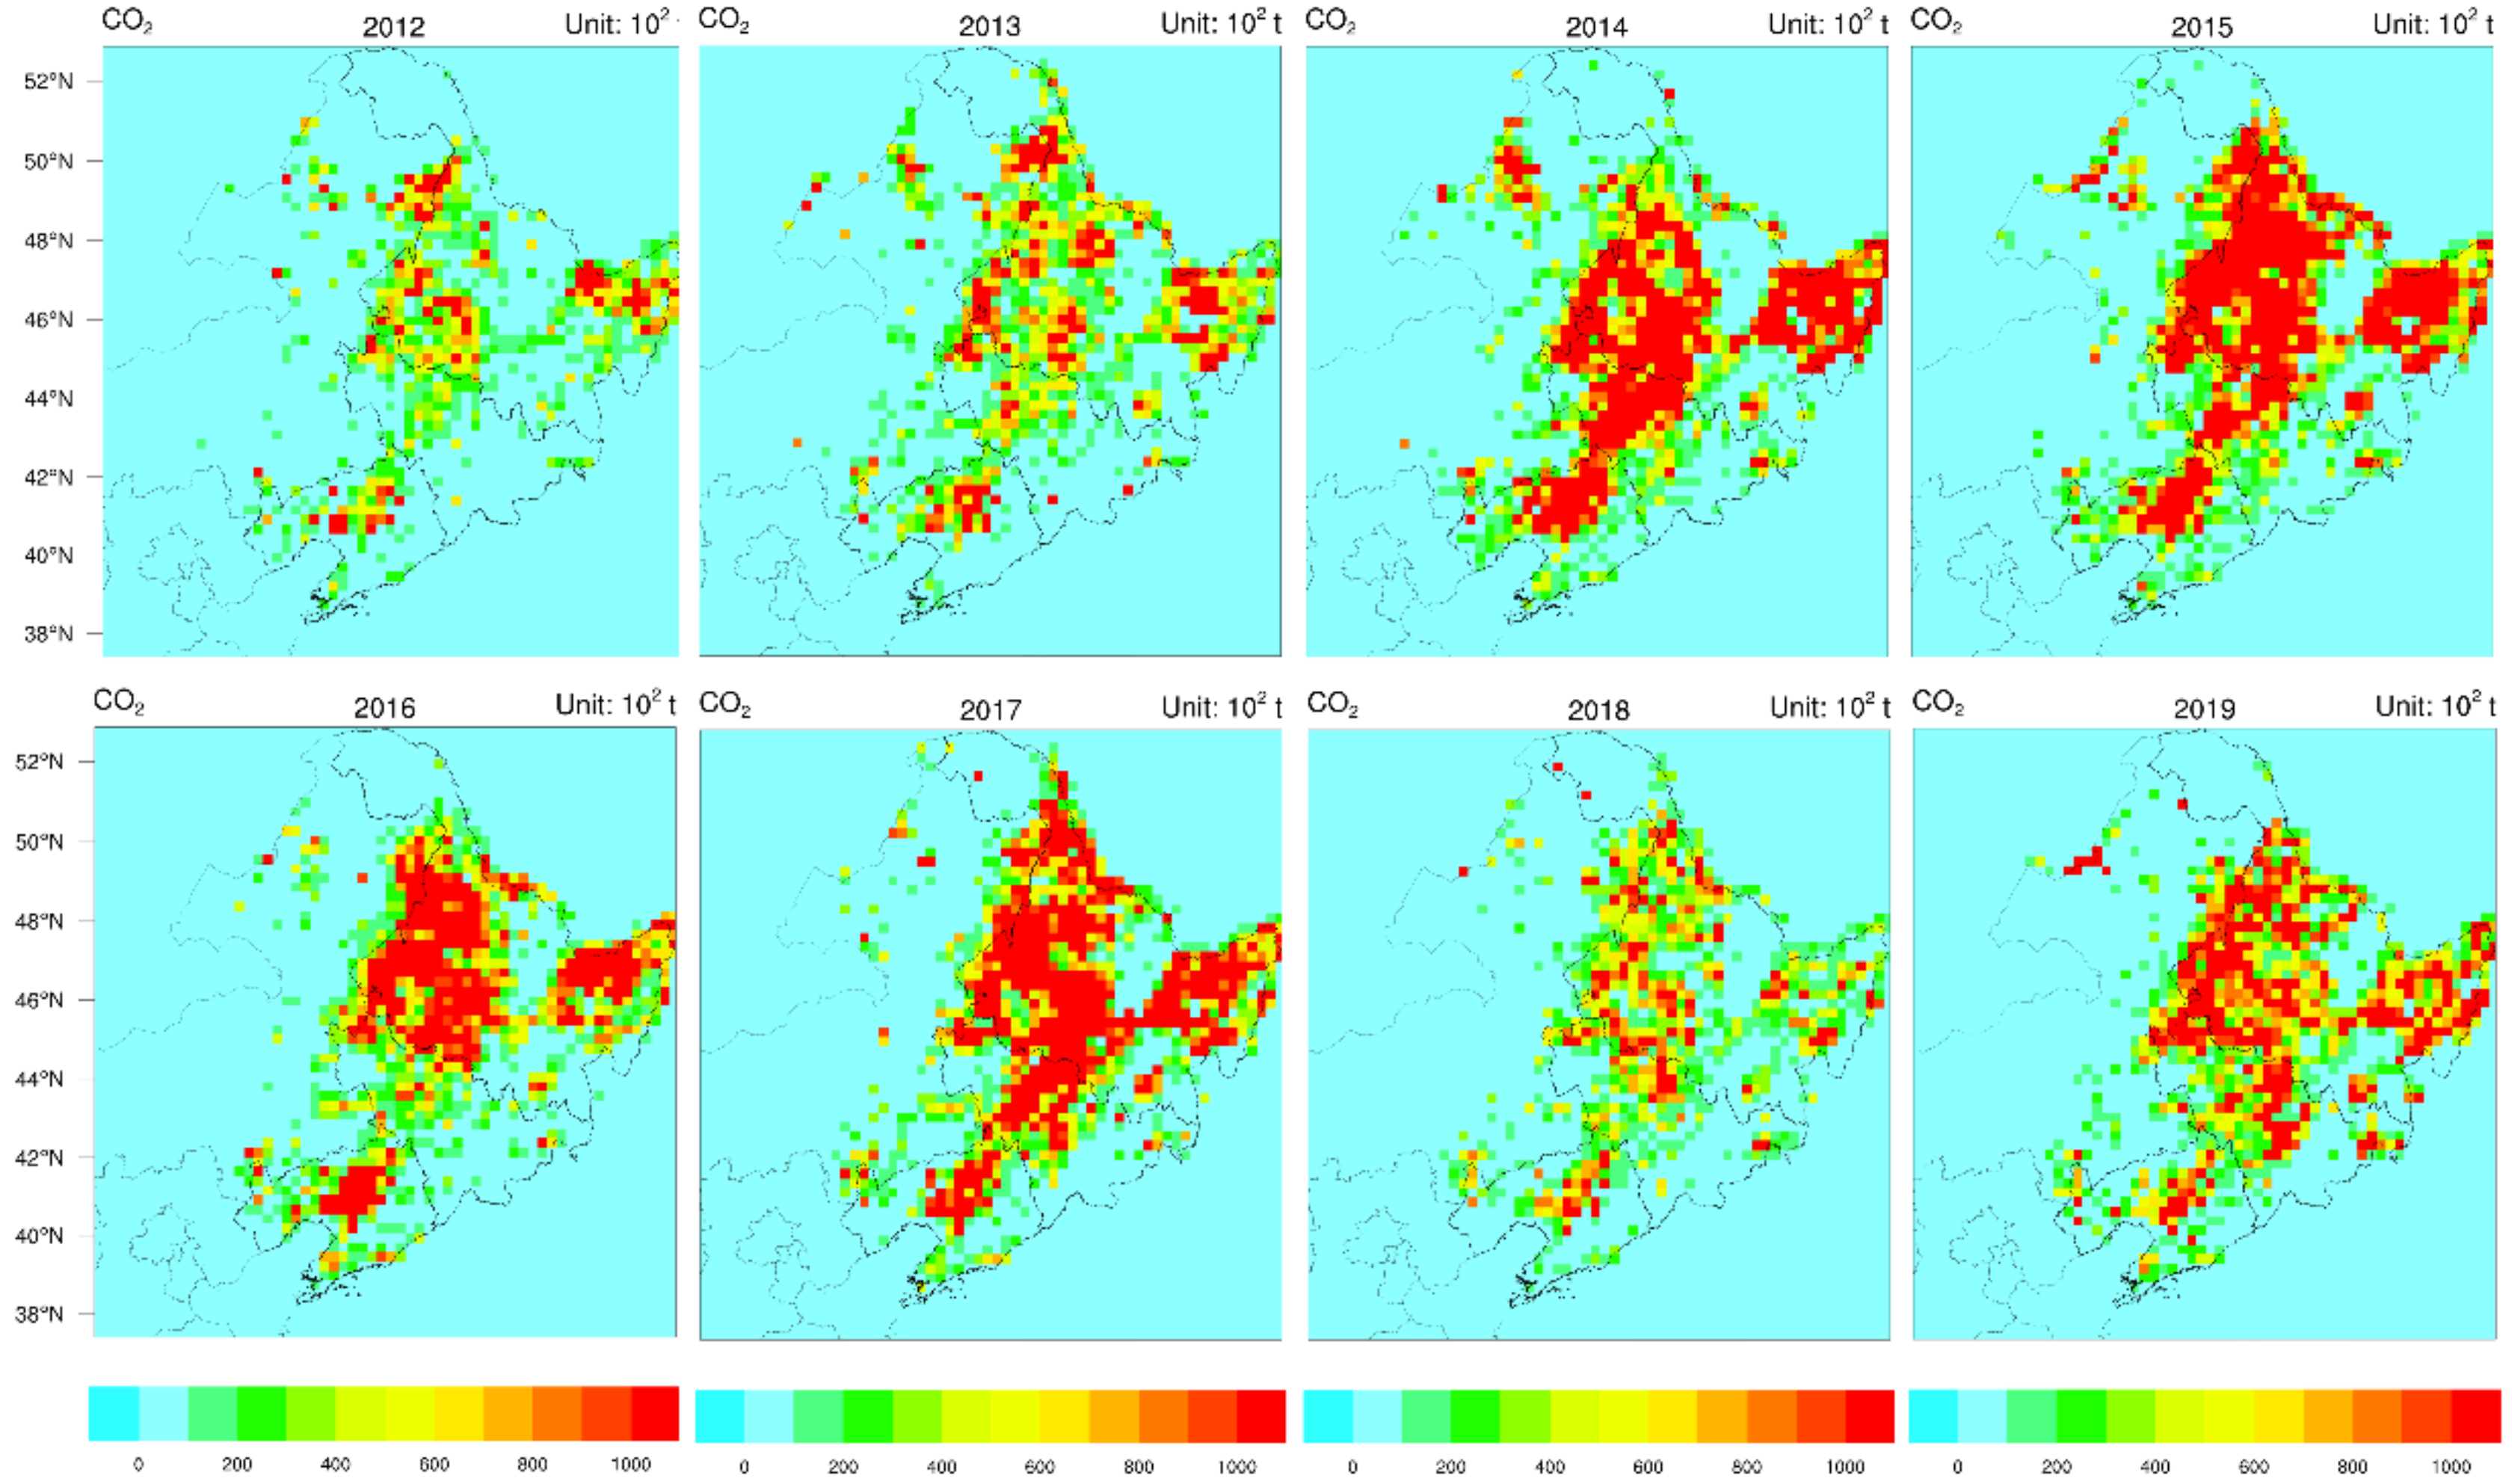
3.1. GHGs and Aerosol Emissions from Biomass Burning in Northeastern China in 2018

Daily GHGs and aerosol emissions from biomass burning in Northeastern China were calculated, which provided high resolution input data for local air quality forecasting. From the daily biomass burning emissions in 2018 (Figure 2), we found that all types of GHGs and aerosols showed higher emissions in March and April, with a second and lower peak in October. A previous study observed the highest PM2.5 emissions from crop residue burning in October and September in Northeastern China [26]. This is because crops were planted in May and harvested in October, with only one annual planting season due to the cold climate in this region. Crop residues were burned after harvesting in October every year due to the high cost of collection, limited room for storage and few ways to utilize the huge amount of straw. With the deterioration of air quality and frequent occurrences of regional haze, a series of strict bans on crop straw open burning were enacted by local governments. As a result, there was a sharp decrease in burned crop residues after harvesting after 2015. However, crop residues must be cleared before planting in May the following year, so farmers had to burn the residual straw in March and April to clear the field and to plant a new crop.
The total emissions of CO2, CH4, N2O, NMVOCs, PM2.5, PM10, OC and EC from biomass burning were 41,057.2 Gg, 128.7 Gg, 2.9 Gg, 286.3 Gg, 282 Gg, 296.9 Gg, 111.2 Gg and 8.5 Gg in Northeastern China in 2018, respectively. These results are lower than those of previous studies based on a bottom-up method [4,27], which estimated the crop residue burning both indoors and in the field in China in 2012 and 2014. In the present study, we calculated the open biomass burning without the indoor burning element. Satellite-based methods often underestimate emissions from crop residue fires due to some small area fires not being captured by satellites [28]; this is particularly important in China, where crop residue burning is the major source of biomass burning. Finally, the annual emissions varied due to the implementation of the open field burning ban. Compared with other years, the emissions from biomass burning in 2018 were lower, as described in more detail in Section 3.2.
The spatial patterns of all GHGs and aerosols are presented in Figure 3. The GHGs and aerosols were mainly concentrated on the Songnen Plain and the Sanjiang Plain, the two main grain producing areas in Northeastern China. The pollutant species CO2, NMVOCs, PM10 and PM2.5 are the dominant species from biomass burning. Due to the higher EF of CO2 relative to other carbonaceous gas species, CO2 is the major gaseous pollutant from biomass burning. The high PM2.5 and PM10 emissions illustrated that biomass burning was dominated by fine particles. A previous study also revealed that about 90% of particulates from biomass burning are PM2.5 [29].

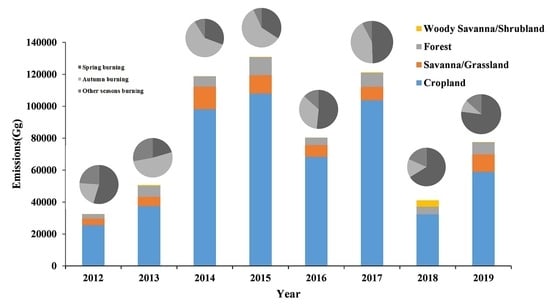
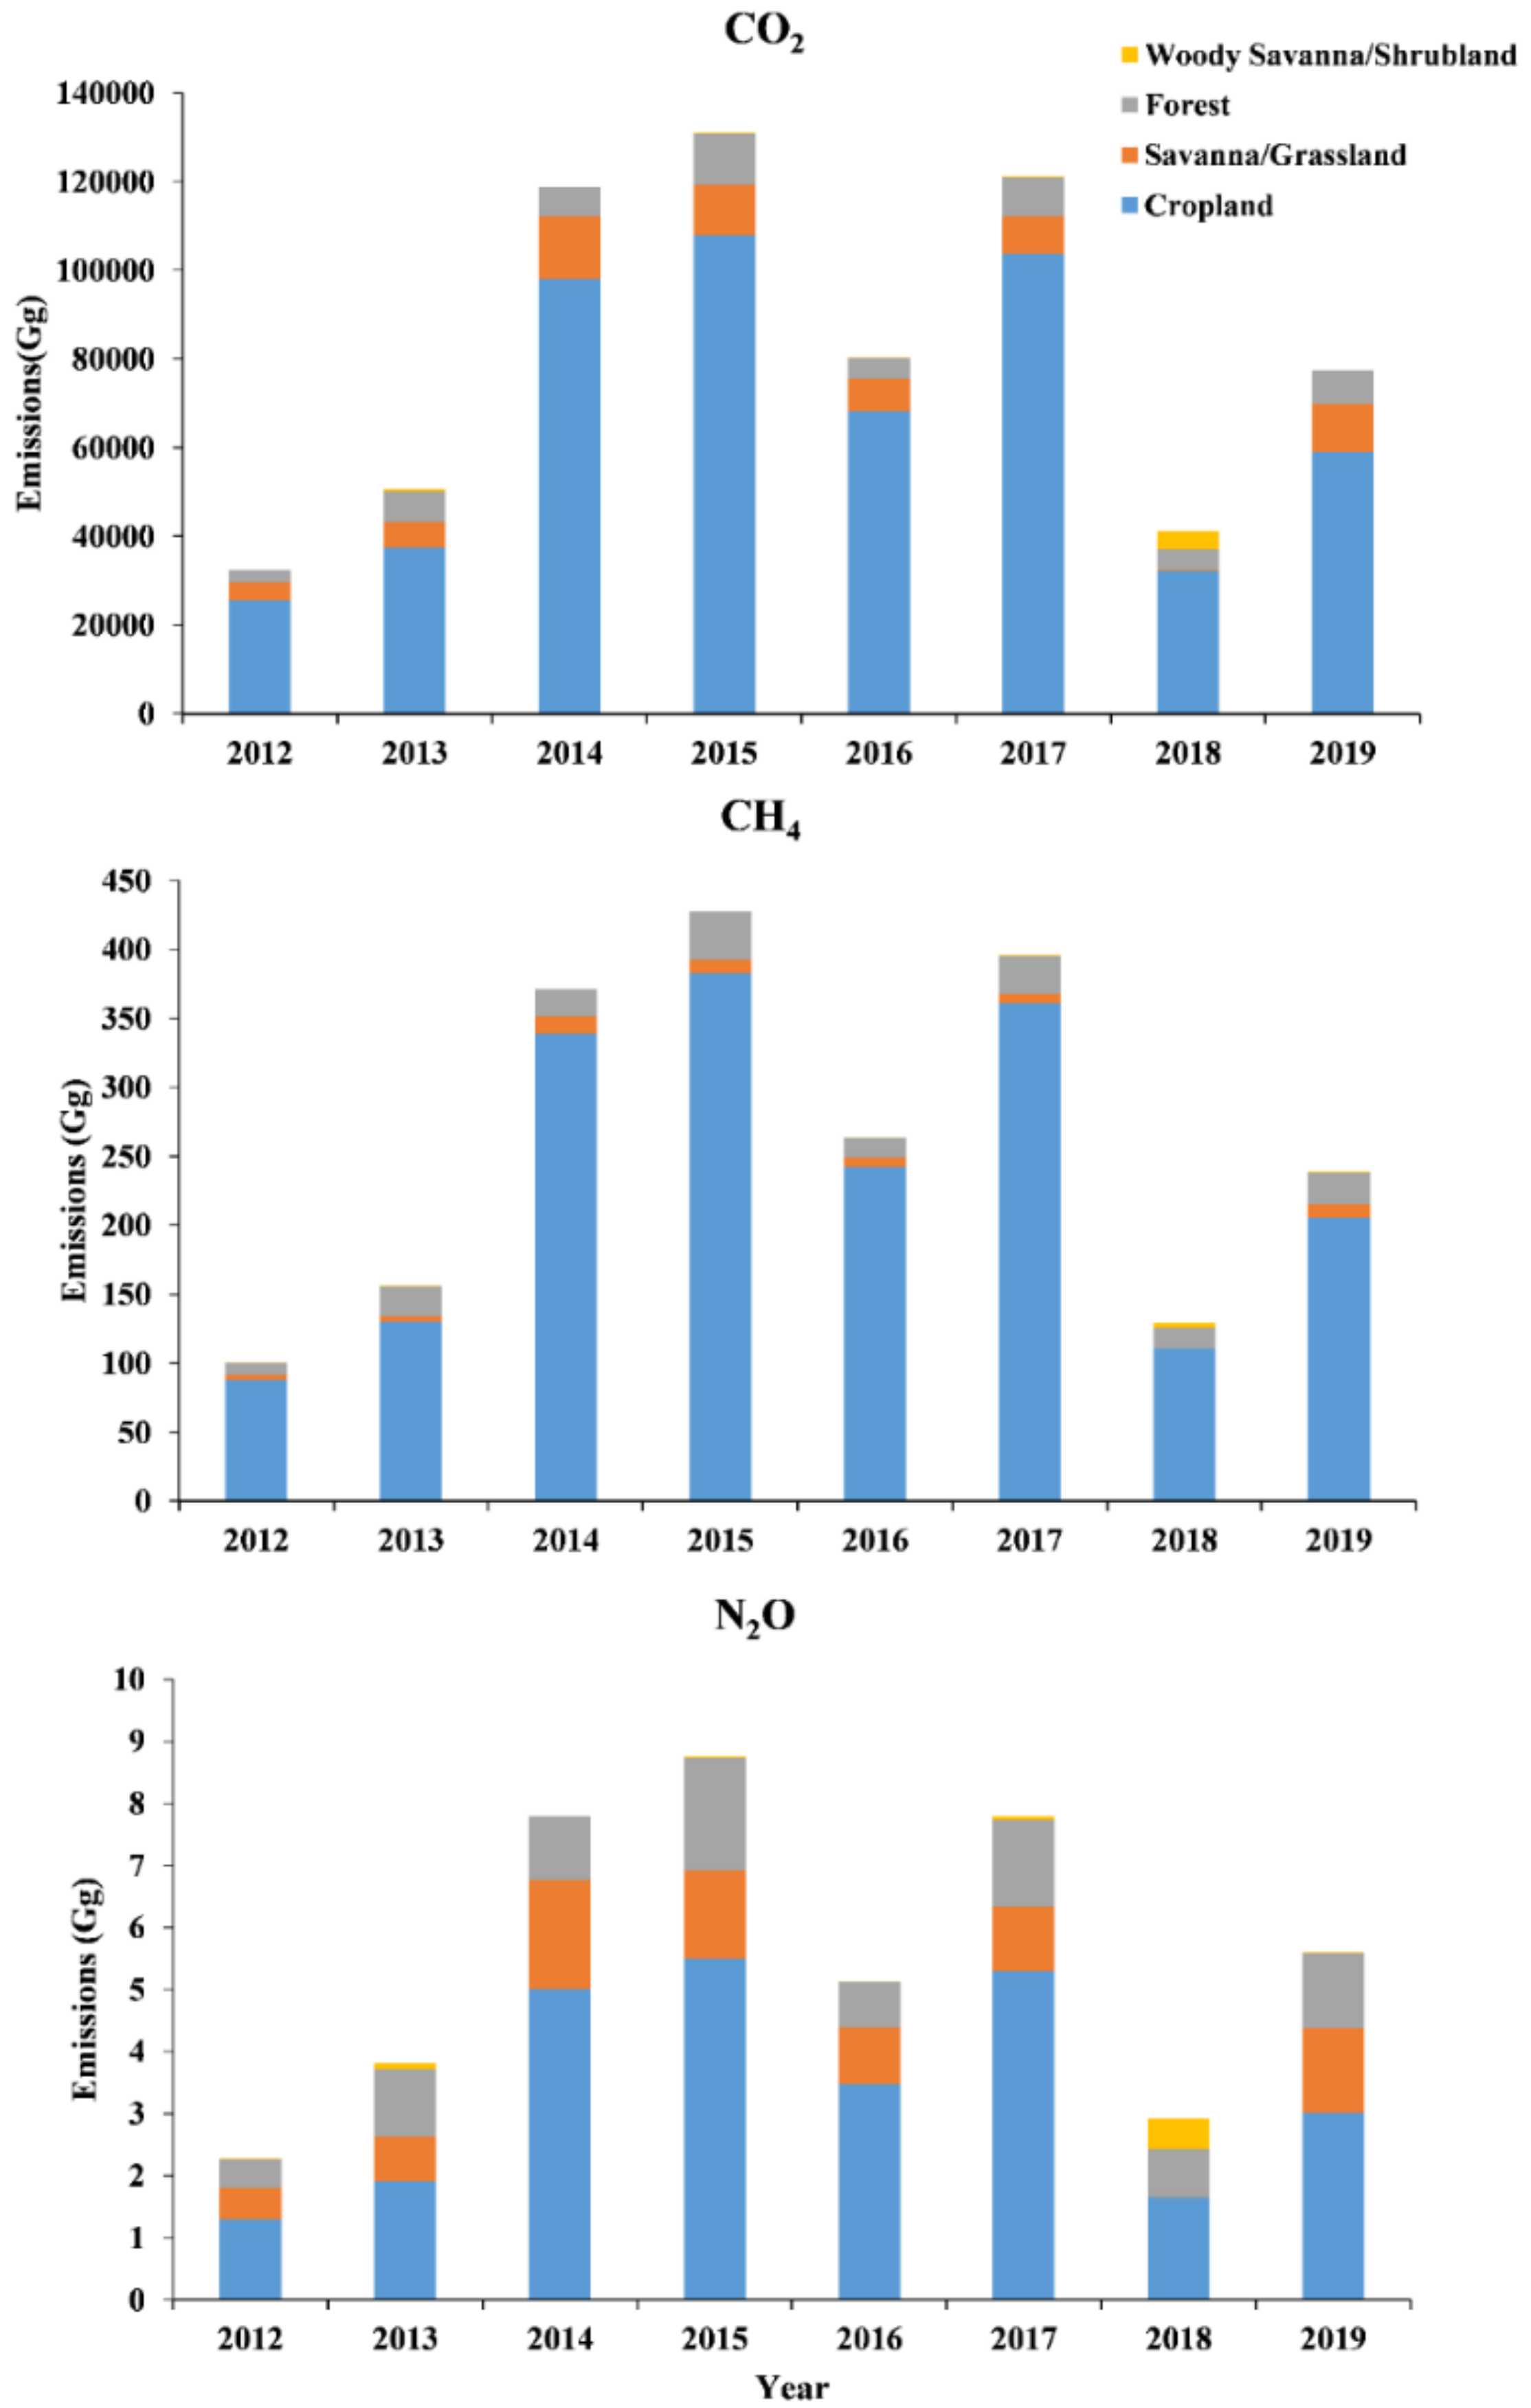
3.2. Annual Variability of GHGs and Aerosol Emissions from Biomass Burning during 2012–2019

Table 1 shows the annual emissions of GHGs and aerosols from biomass burning in Northeastern China during the period 2012–2019; average annual emissions of CO2, CH4, N2O, NMVOCs, PM2.5, PM10, OC and EC during this period were 81,619.4 Gg, 260.2 Gg, 5.5 Gg, 562.0 Gg, 543.2 Gg, 573.6 Gg, 201.3 Gg and 15.8 Gg, respectively. These emissions were higher than those reported by others [7,15]. Mehmood et al. [15] estimated biomass burning in China during 2002–2016 according to the FINNv1.5 inventory, which was based on burned area retrieved from the MODIS fire product. A previous study documented that the FINN inventory underestimated biomass burning emissions in Northern China [25]. Yin et al. [7] also estimated biomass burning emissions based on FRP in China during 2003–2017; however, the FRP data were derived from MODIS, with a spatial resolution of 1 km. In the present study, we retrieved FRP data from VIIRS, with a spatial resolution of 375 m. The higher spatial resolution made it possible to capture more small fires in the satellite observations, particularly important in Northeastern China where small-area crop straw burning is the primary type of biomass burning. More fire locations resulted in a higher FRP and larger fire emissions in this region.
From 2012 to 2019, the emissions of GHGs showed first an increase and then a fluctuating, decreasing pattern, with the peak emission in 2015. A similar temporal pattern was also reported by Yin et al. [7]. From 2012 to 2015, biomass burning emissions increased year by year. Compared with 2012, the emissions of CO2, CH4 and N2O in 2015 increased by 303%, 326% and 282%, respectively. The PM emissions in 2015 were also two or three times the levels in 2012. The temporal pattern was consistent with another study based on the FINNv1.5 inventory [15]. This interannual variability is due to the lack of attention given to air pollution and biomass burning in China before 2015. With more straw production [16], and consequent increased crop straw burning in the field, pollutant emissions increased annually. Since 2016, crop residue collection and reuse activities in Northeastern China resulted in lower pollutant emissions from biomass burning in this region. Particularly in 2018, when a strict burning ban was implemented in this region, the emissions of GHGs and PM were reduced close to the levels of 2012. Until the spring of 2019, there were still large amounts of crop residue left in the field due to limited collection. However, the left crop residue must be clean to plant, and people have no choice but to burn it in the field. Then, in spring 2019, the fire points and emissions increased significantly, especially during 19 Feb to 4 March (Figure S1), which caused an emission increase from 2018 to 2019. Anyway, the dominant pollutant was CO2, followed by NMVOCs, PM10 and PM2.5. This suggested that biomass burning was one of the major sources of GHGs and particulate matter.
The temporal changes of all pollutants from biomass burning during the period 2012 to 2019 were similar. Taking CO2 as an example (Figure 4), every year, CO2 emissions were concentrated in the Songnen Plain and Sanjiang Plain, the main grain producing areas. During the period from 2014 to 2017, higher CO2 emissions were observed in this region, with the highest emissions in 2015. In 2016, the emissions of CO2 from Jilin Province reduced significantly with the collection of crop residues in this province, but a similar change was not obvious in Heilongjiang and Liaoning Provinces. Then, with a stricter burning ban in Northeastern China, lower CO2 emissions across the whole region were observed in 2018. Overall, Heilongjiang Province produced higher emissions than Jilin and Liaoning Provinces from 2012 to 2019 due to the greater area of cropland and higher crop straw yields in Heilongjiang Province.
The three types of GHGs showed similar interannual variability during the period from 2012 to 2019, in spite of emission amounts differing greatly (Table 1). The contributions from four land use categories (cropland, grassland, forest and shrubland) were similar for all types of GHGs (Figure 5). Cropland burning caused the largest emissions for the three types of GHGs, followed by forest burning and grassland burning, while emissions from shrubland were negligible. The proportion of CO2 emitted from cropland burning to the total CO2 from all biomass open field burning in Northeastern China during 2012–2019 was 80.3%, while the proportions from forest burning and grassland burning were 9.4% and 8.8%, respectively. This suggested that crop straw burning was the primary source of CO2 in biomass burning emissions. These results are consistent with Wang et al. [30]. Another previous study also showed that crop straw burning was the major biomass burning category in China [4]. Among the three types of GHGs, CO2 was the major species, accounting for 99.6% of the total GHGs. Cropland burning was determined to be the primary contributor of CO2 to biomass burning. Meanwhile, a previous study illustrated that forest burning and cropland fire were the major contributors to the total CO2 emissions from biomass burning in China, with contributions of 45% and 39%, respectively, during the period 2003–2017 [7]; while in Northeastern China, cropland burning was also the major contributor to the total CO2 emissions from biomass burning, and emissions from forest fires showed a significant downward trend during 2003–2017 [7]. The different contributors between these studies could be related to study regions and time period.

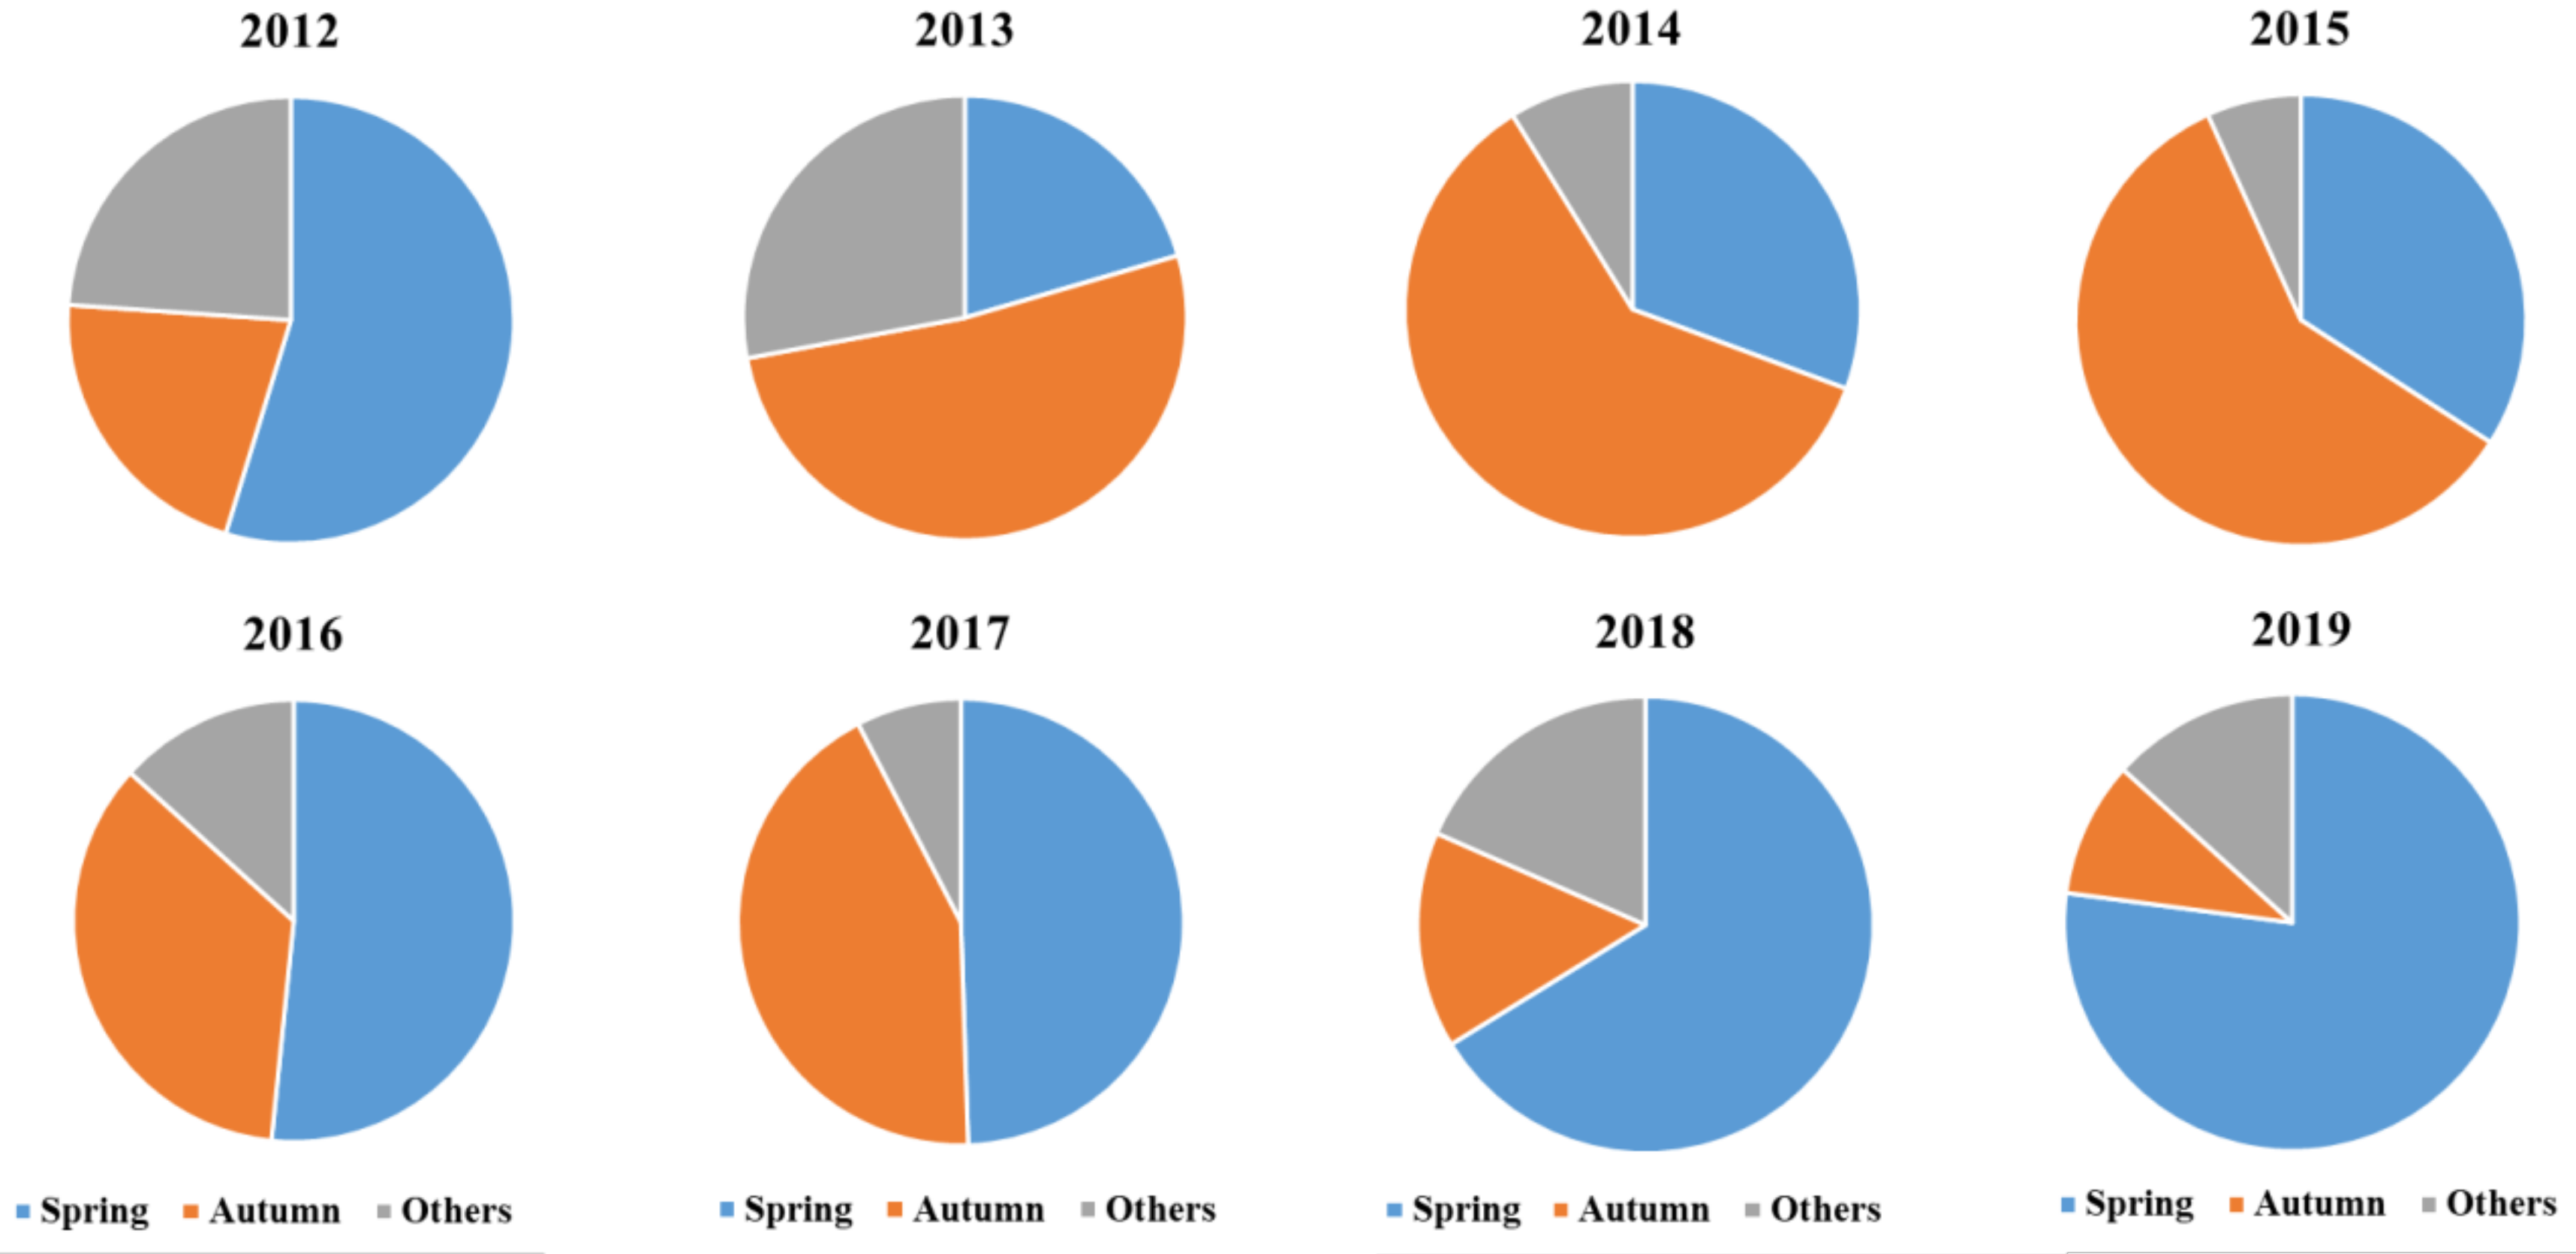
3.3. Seasonal Variability of CO2 Emissions from Biomass Burning from 2012 to 2019

Seasonal variations of CO2 emissions from biomass burning in Northeastern China during the period of 2012–2019 are presented in Figure 6. Before 2015, autumn was the major burning season (except 2012), with the autumn contribution to annual CO2 emissions averaging 57.1% during 2013–2015, while spring contributed 28.4% during the same period. From 2016, spring became the major burning season, especially in 2019, when spring contributed 77.1% of annual emissions. From 2013 to 2019, the emissions of CO2 from spring burning increased year on year. The proportion from spring burning increased from 20.5% in 2013 to 77.1% in 2019, with an annual growth rate of 20%. These results suggested that the burning season changed from autumn to spring. This was related to the burning ban policy in Northeastern China, as described above. As an important source of GHGs and aerosols, biomass burning, especially from crop straw open field burning, was strictly controlled by the government after harvesting in autumn. A burning ban and comprehensive straw utilization program were implemented after harvesting. However, comprehensive crop straw utilization was limited in this region, with a straw utilization ratio of less than 60%. In Northeastern China, the average annual straw yield is 159 Tg, accounting for 20% of the total straw yield in China [16]. Due to this high straw yield, the high cost of straw collection, limited room for straw storage and few straw utilization methods, open field burning was the most effective option of all treatments. The open field burning ratio in this region was 20–50% in 2012 [4]. Especially in recent years, with the burning ban implemented after harvest, the proportion of burning in autumn has decreased. As any straw not collected or burned must be cleared from the field in spring the following year before planting, open field burning was conducted by farmers before planting. Therefore, the proportion of spring burning increased significantly. During the period 2012–2019, the proportions of burning in autumn, spring and other times of the year were different in 2012 from those of other years because heavy snow in autumn 2012 occurred much earlier than usual, even before harvesting had finished. This heavy snow caused the straw to be too wet to ignite, preventing open field burning in autumn 2012.

3.4. Policy Implications for Biomass Burning

Biomass resources in China, especially in Northeastern China, are very large, which presents great challenges for comprehensive straw utilization. Five straw utilization approaches have been proposed for China: its use as fuel, fertilizer, feed, industrial raw material and base material [31]. A series of laws, regulations, guidance, demonstrations, and financial support for straw utilization have been promulgated by the national and provincial governments, with work plans executed by the county and township governments [32]. With all these actions, the rate of straw utilization nationwide increased from 80% in 2015 to 85% in 2019. An increase in the straw utilization ratio was also observed in Northeastern China; for example, in 2019 in Heilongjiang Province, the ratios reached 82%, which were the highest ratios in the past few years [33]. However, these polices were short-term and dominated by prohibition and penalty. Some long-term, results-oriented and sustainable policies should be considered to deal with the huge amount of straw produced every year. For example, although returning straw to soil as fertilizer is the most widely used approach, in Northeastern China, the low temperatures cause the returned straw to decay in the soil at a slower rate, so its effective use as fertilizer is limited. Therefore, other approaches, such as packing and processing as fuel, are widely used in this region.
The comprehensive utilization of crop straw and wood fuel can significantly reduce GHGs and aerosol emissions and improve air quality [30]. Therefore, several policy implications for regional air quality and even climate change should be recognized. Besides an effective open field burning ban, some further recommendations are suggested: (1) developing clean and efficient combustion technologies (e.g., biomass stoves or clean stoves); (2) providing financial incentives to industries and other users of straw (e.g., lower prices for biomass stoves, minimizing costs for straw transportation, optimizing biomass plant); (3) strengthening the awareness of farmers of the importance of crop straw utilization; and (4) prescribed burning as a short-term solution in Northeastern China to avoid the concentrated open field burning before planting in the spring. Overall, straw utilization is beneficial to energy saving and air pollution reduction.

4. Conclusions

We estimated the emissions of greenhouse gases (GHGs) and particulate matter (PM) from biomass burning in Northeastern China over the period of 2012–2019, using satellite-derived fire information. Overall, biomass burning contributed in large quantities to the emissions of GHGs, with average annual emissions of CO2, CH4 and N2O of 81,619.4 Gg, 260.2 Gg, and 5.5 Gg in Northeastern China, respectively. The emissions of three types of GHGs and PM showed an initial increase and then a fluctuating but overall decreasing trend from 2012 to 2019, with a peak emission in 2015. Cropland burning was the primary source of biomass burning for all GHGs and PM emissions. With a stringent burning ban and alternative straw utilization strategy introduced during the post-harvesting period, the major emission season changed from autumn (after harvesting) to spring (before planting).
This study reveals how the policies of a burning ban and alternative fuel utilization could help reduce GHGs and PM emissions from biomass burning. This study provided a high spatio-temporal resolution emissions inventory from biomass burning, which can assist in monitoring and assessing the progress and effectiveness of emission control regulations. However, the satellite-based emission inventory could only estimate open field burning. Domestic biomass burning for heating and cooking is also an important contributor to biomass burning and GHGs emissions. In the future, both open field burning and domestic biomass burning should be considered together.

Supplementary Materials

The following are available online at https://www.mdpi.com/2072-4292/13/5/1005/s1, Table S1: Emission factors from open crop residue burning (g/kg), Table S2: Emission factors from other sources of biomass burning (g/kg), Figure S1: Daily emissions of GHGs and aerosols from biomass burning in Northeastern China during 2012 to 2019.

Author Contributions

Conceptualization, Data curation, Methodology, Writing—original draft, Writing—review and editing, H.Z.; Data curation, Methodology, Formal analysis, Visualization, G.Y.; Supervision, writing—review and editing, D.Q.T.; Writing—review and editing, X.Z., A.X. and S.Z. All authors have read and agreed to the published version of the manuscript.

Funding

This work is financially supported by the National Natural Science Foundation of China (No. 41771504), National Key R&D Plan of China (No. 2017YFC0212303) and the National Natural Science Foundation of Jilin Province (No.20200201214JC). We acknowledge the Fire Information for Resource Management System (FIRMS) freely sharing the VIIRS fire products and fire emission data.

Data Availability Statement

The data presented in this study are available upon request from the corresponding author.

Conflicts of Interest

We declare no conflict of interest.

References

  1. Tian, H.; Lu, C.; Ciais, P.; Michalak, A.M.; Canadell, J.G.; Saikawa, E.; Huntzinger, D.N.; Gurney, K.R.; Sitch, S.; Zhang, B.; et al. The terrestrial biosphere as a net source of greenhouse gases to the atmosphere. Nat. Cell Biol. 2016, 531, 225–228. [Google Scholar] [CrossRef] [Green Version]
  2. Andreae, M.O. Emission of trace gases and aerosols from biomass burning—An updated assessment. Atmos. Chem. Phys. Discuss. 2019, 19, 8523–8546. [Google Scholar] [CrossRef] [Green Version]
  3. Ito, A.; Ito, A.; Akimoto, H. Seasonal and interannual variations in CO and BC emissions from open biomass burning in Southern Africa during 1998-2005. Glob. Biogeochem. Cycles 2007, 21, 2011. [Google Scholar] [CrossRef]
  4. Zhou, Y.; Xing, X.; Lang, J.; Chen, D.; Cheng, S.; Wei, L.; Wei, X.; Liu, C. A comprehensive biomass burning emission inventory with high spatial and temporal resolution in China. Atmos. Chem. Phys. Discuss. 2017, 17, 2839–2864. [Google Scholar] [CrossRef] [Green Version]
  5. Zhang, X.; Liu, J.; Han, H.; Zhang, Y.; Jiang, Z.; Wang, H.; Meng, L.; Li, Y.C.; Liu, Y. Satellite-Observed Variations and Trends in Carbon Monoxide over Asia and Their Sensitivities to Biomass Burning. Remote Sens. 2020, 12, 830. [Google Scholar] [CrossRef] [Green Version]
  6. Zhao, H.; Zhang, X.; Zhang, S.; Chen, W.; Tong, D.Q.; Xiu, A. Effects of Agricultural Biomass Burning on Regional Haze in China: A Review. Atmosphere 2017, 8, 88. [Google Scholar] [CrossRef] [Green Version]
  7. Yin, L.; Du, P.; Zhang, M.; Liu, M.; Xu, T.; Song, Y. Estimation of emissions from biomass burning in China (2003–2017) based on MODIS fire radiative energy data. Biogeosciences 2019, 16, 1629–1640. [Google Scholar] [CrossRef] [Green Version]
  8. Yang, G.; Zhao, H.; Tong, D.Q.; Xiu, A.; Zhang, X.; Gao, C. Impacts of post-harvest open biomass burning and burning ban policy on severe haze in the Northeastern China. Sci. Total Environ. 2020, 716, 136517. [Google Scholar] [CrossRef]
  9. Silva, C.A.; Santilli, G.; Sano, E.E.; Laneve, G. Fire Occurrences and Greenhouse Gas Emissions from Deforestation in the Brazilian Amazon. Remote Sens. 2021, 13, 376. [Google Scholar] [CrossRef]
  10. FINN: The Fire Inventory from NCAR. Available online: https://www2.acom.ucar.edu/modeling/finn-fire-inventory-ncar (accessed on 20 February 2021).
  11. GFAS: Global Fire Assimilation System. Available online: http://www.gmes-atmosphere.eu/about/project_structure/input_data/d_fire/ (accessed on 20 February 2021).
  12. GFED: Global Fire Emission Database. Available online: http://globalfiredata.org/pages/data/ (accessed on 20 February 2021).
  13. Bi, Y.Y.; Wang, Y.J.; Cao, C.Y. Straw resource quantity and its regional distribution in China. Agric. Mech. Res. 2010, 32, 1–7. [Google Scholar]
  14. Streets, D.G.; Yarber, K.F.; Woo, J.-H.; Carmichael, G.R. Biomass burning in Asia: Annual and seasonal estimates and atmospheric emissions. Glob. Biogeochem. Cycles 2003, 17, 1759–1768. [Google Scholar] [CrossRef] [Green Version]
  15. Mehmood, K.; Chang, S.; Yu, S.; Wang, L.; Li, P.; Li, Z.; Liu, W.; Rosenfeld, D.; Seinfeld, J.H. Spatial and temporal distributions of air pollutant emissions from open crop straw and biomass burnings in China from 2002 to 2016. Environ. Chem. Lett. 2018, 16, 301–309. [Google Scholar] [CrossRef]
  16. Wang, J.; Tang, H.; Wang, J. Comprehensive utilization status and development analysis of crop straw resource in Northeast China. Trans. Chin. Soc. Agric. Mach. 2017, 48, 1–21. (In Chinese) [Google Scholar]
  17. Wooster, M.J.; Roberts, G.; Perry, G.L.W.; Kaufman, Y.J. Retrieval of biomass combustion rates and totals from fire radiative power observations: FRP derivation and calibration relationships between biomass consumption and fire radiative energy release. J. Geophys. Res. Space Phys. 2005, 110, 24311. [Google Scholar] [CrossRef]
  18. Freeborn, P.H.; Wooster, M.J.; Hao, W.M.; Ryan, C.A.; Nordgren, B.L.; Baker, S.P.; Ichoku, C. Relationships between energy release, fuel mass loss, and trace gas and aerosol emissions during laboratory biomass fires. J. Geophys. Res. Space Phys. 2008, 113, 113. [Google Scholar] [CrossRef]
  19. Liu, T.; E Marlier, M.; Karambelas, A.; Jain, M.; Singh, S.; Singh, M.K.; Gautam, R.; DeFries, R.S. Missing emissions from post-monsoon agricultural fires in northwestern India: Regional limitations of MODIS burned area and active fire products. Environ. Res. Commun. 2019, 1, 011007. [Google Scholar] [CrossRef]
  20. FIRMS: Fire Information for Resource Management System. Available online: https://earthdata.nasa.gov/earth-observation-data/near-real-time/firms (accessed on 9 June 2020).
  21. Schroeder, W.; Oliva, P.; Giglio, L.; Csiszar, I.A. The New VIIRS 375m active fire detection data product: Algorithm description and initial assessment. Remote Sens. Environ. 2014, 143, 85–96. [Google Scholar] [CrossRef]
  22. Zhang, T.; Wooster, M.J.; Xu, W. Approaches for synergistically exploiting VIIRS Iand M-Band data in regional active fire de-tection and FRP assessment: A demonstration with respect to agricultural residue burning in Eastern China. Remote Sens. En-viron. 2017, 198, 407–424. [Google Scholar] [CrossRef] [Green Version]
  23. Zhang, X.; Kondragunta, S.; Ram, J.; Schmidt, C.; Huang, H.-C. Near-real-time global biomass burning emissions product fromgeostationary satellite constellation. J. Geophys. Res. Atmos. 2012, 117, 1–18. [Google Scholar]
  24. MAPSPAM. Available online: https://www.mapspam.info/data/ (accessed on 6 March 2021).
  25. Stavrakou, T.; Müller, J.-F.; Bauwens, M.; De Smedt, I.; Lerot, C.; Van Roozendael, M.; Coheur, P.-F.; Clerbaux, C.; Boersma, K.F.; Van Der A, R.; et al. Substantial Underestimation of Post-Harvest Burning Emissions in the North China Plain Revealed by Multi-Species Space Observations. Sci. Rep. 2016, 6, 1–11. [Google Scholar] [CrossRef] [Green Version]
  26. Li, R.; Chen, W.; Zhao, H.; Wu, X.; Zhang, M.; Tong, D.Q.; Xiu, A. Inventory of Atmospheric Pollutant Emissions from Burning of Crop Residues in China Based on Satellite-retrieved Farmland Data. Chin. Geogr. Sci. 2020, 30, 266–278. [Google Scholar] [CrossRef]
  27. Zhang, X.; Lu, Y.; Wang, Q.; Qian, X. A high-resolution inventory of air pollutant emissions from crop residue burning in China. Atmos. Environ. 2019, 213, 207–214. [Google Scholar] [CrossRef]
  28. Yan, X.; Ohara, T.; Akimoto, H. Bottom-up estimate of biomass burning in mainland China. Atmos. Environ. 2006, 40, 5262–5273. [Google Scholar] [CrossRef]
  29. Deng, C.R. Identification of Biomass Burning Source in Aerosols and the Formation Mechanism of Haze. Ph.D. Thesis, University of Fudan, Shanghai, China, 2011. [Google Scholar]
  30. Wang, J.; Xi, F.; Liu, Z.; Bing, L.; Alsaedi, A.; Hayat, T.; Ahmad, B.; Guan, D. The spatiotemporal features of greenhouse gases emissions from biomass burning in China from 2000 to 2012. J. Clean. Prod. 2018, 181, 801–808. [Google Scholar] [CrossRef] [Green Version]
  31. Li, H.; Dai, M.; Dai, S.; Dong, X. Current status and environment impact of direct straw return in China’s cropland—A review. Ecotoxicol. Environ. Saf. 2018, 159, 293–300. [Google Scholar] [CrossRef] [PubMed]
  32. Ren, J.; Yu, P.; Xu, X. Straw Utilization in China—Status and Recommendations. Sustainability 2019, 11, 1762. [Google Scholar] [CrossRef] [Green Version]
  33. MOA: Ministry of Agriculture and Rural Affairs of the People’s Republic of China. Available online: http://www.moa.gov.cn/xw/qg/202001/t20200103_6334268.htm (accessed on 10 June 2020).
Figure 1. The location of Northeastern China, distribution of four land use categories (forest, cropland, grassland and shrubland) and some regions and provinces mentioned in this study.
Remotesensing 13 01005 g001
Figure 2. Daily emissions of greenhouse gases (GHGs) and aerosols from biomass burning in Northeastern China in 2018. NMVOC: non-methane volatile organic compounds; PM2.5: particulate matter with diameter less than 2.5 μm; PM10: particulate matter with diameter less than 10 μm; OC: organic carbon; EC: elemental carbon.
Remotesensing 13 01005 g002
Figure 3. The spatial distribution of greenhouse gases (GHGs) and aerosols emitted from biomass burning in Northeastern China in 2018. The subfigures on top row from left to right are present CO2, CH4, N2O, and NMVOC (non-methane volatile organic compounds) respectively. The subfigures on the bottom row from left to right are present PM2.5 (particulate matter with diameter less than 2.5 μm), PM10 (particulate matter with diameter less than 10 μm), OC (organic carbon) and EC (elemental carbon), respectively.
Remotesensing 13 01005 g003
Figure 4. The temporal changes in CO2 from biomass burning during 2012–2019. The subfigures represent the distribution of CO2 from biomass burning in every year from 2012 to 2019.
Remotesensing 13 01005 g004
Figure 5. Greenhouse gases emissions from all categories of biomass burning. The subfigures from top to down represent the emissions of CO2, CH4 and N2O respectively.
Remotesensing 13 01005 g005
Figure 6. Seasonal variability of CO2 emissions from crop straw burning during 2012 to 2019 in Northeastern China.
Remotesensing 13 01005 g006
Table 1. Annual emissions of greenhouse gases (GHGs) and aerosols from biomass burning in Northeastern China from 2012 to 2019 (Gg).
CO2CH4N2ONMVOCsPM2.5PM10OCEC
201232,480.8 100.2 2.3 220.6 210.5 223.9 79.4 6.4
201350,673.1 156.6 3.8 350.5 338.0 358.0 136.1 10.6
2014118,778.8 371.3 7.8 811.8 792.3 839.0 287.0 22.9
2015130,912.1 427.8 8.8 907.3 866.0 909.4 316.8 24.9
201680,297.8 263.1 5.1 550.7 523.4 550.2 183.2 14.7
2017121,238.9 395.5 7.8 840.5 829.1 865.0 304.2 23.3
201841,057.2 128.7 2.9 286.3 282.0 296.9 111.2 8.5
201977,516.7 238.3 5.6 528.4 504.6 538.4 192.4 15.4
Average81,619.4260.25.5562.0543.2573.6201.315.8
Note: NMVOCs: non-methane volatile organic compounds; PM2.5: particulate matter with diameter less than 2.5 μm; PM10: particulate matter with diameter less than 10 μm; OC: organic carbon; EC: elemental carbon.
Publisher’s Note: MDPI stays neutral with regard to jurisdictional claims in published maps and institutional affiliations.

