1. Introduction
The extraordinary leap forward in the capability of new space-borne missions to collect an unprecedented quantity and quality of Earth observation data is opening crucial opportunities and challenges. Copernicus [
1], as the world’s largest single observation and monitoring programme for environment and security, has set a paradigmatic example in this context. Full exploitation of the huge amount of information from data delivered, in particular, by its space component is inevitably entangled with responding to the need for novel key enabling technologies.
This paper reports the results achieved by the Horizon 2020 project AURORA (Advanced Ultraviolet Radiation and Ozone Retrieval for Applications) [
2], in terms of technological advancements required to exploit the potential of the synergistic use of the measurements from the atmospheric Sentinel missions of Copernicus.
The ultimate goal of the project was to contribute to the effort stimulated by the European Space Agency to upgrade synergistic products based on merging information from multiple sources from research to operational products. The choice not to include data synergy as part of the operational processing of Sentinel-4 and Sentinel-5(p) was followed by recommendations to further investigate the topic to reach the maturity level necessary for implementation into the Copernicus system and in operational services for the Earths’ atmosphere, i.e., the Copernicus Atmosphere Monitoring Service (CAMS) [
3] and Copernicus Climate Change Service (C3S) [
4].
The core activities of AURORA focused on two aspects. The first was a scientific investigation of an innovative approach to combine independent measurements of the same atmospheric target acquired at different frequencies by remote-sounders onboard Low Earth Orbit (LEO) and Geostationary Equatorial Orbit (GEO) satellites. Second, the project pursued to develop, implement and test a technological prototype system with capabilities to process different sets of geophysical products-in particular, vertical profiles of atmospheric ozone concentration-expected from Sentinel-4 and Sentinel-5. A technological infrastructure was designed and assembled to bridge the science-driven focus of the project mentioned above and the comparably high priority to turn the potential of Sentinel data synergy into applications and services based on products of improved quality.
The AURORA technological infrastructure is a key element of the project; its main objective is to make available to the project partners a suite of technologies, including a database collecting all the relevant data (input and auxiliary data, intermediate and final products), to help along the scientific activities of the project, to support the end-user application, and to provide an infrastructure to implement a software prototype (Prototype Data Processor; PDP) demonstrating the technical feasibility of the AURORA data processing.
The processing is organised in a Data Processing Chain (DPC) involving independent scientific tools able to process data as a sequence of operations, starting from the geophysical variables obtained from Sentinel observations (synthetic level 2 products) up to the final AURORA products (tropospheric ozone and UV-radiation at the Earth’s surface) through fusion and assimilation processes. The PDP is designed as a distributed data processing, able to automatically execute the processing chain.
In
Section 2 we outline the scope and objectives of the work reported in the article; a detailed description of the AURORA data processing chain is given in
Section 3;
Section 4 is devoted to offer a deeper insight into the technological infrastructure;
Section 5 describes the results of tests conducted using synthetic data for evaluation of the performance of the PDP. Major outcomes and lesson learned from the activity for developing the AURORA prototype data processor are provided in the conclusions.
2. Scope and Objectives
The primary goal of the technology-driven activities conducted in the AURORA framework can be identified in the development of one of the key products of the project: the Prototype Data Processor (PDP), i.e., a system capable of automatically execute the AURORA data processing chain, with the key purpose of replicating as close as possible a realistic operational processing.
It is important to highlight the fact that the AURORA PDP was conceived to serve a twofold purpose. The PDP was developed in parallel with the single scientific modules of the AURORA Data Processing Chain, and it is used, on the one hand, as an internal tool to test their functionalities and performances, as well as to verify the overall dynamical processing of the full set of synthetic data simulating the operational products. On the other hand, it is aimed to turn into a tool for external users that in the long-term perspective has the potential to evolve towards operational deployment and use.
The first step toward this purpose was to create a pre-operational system. In an intermediate phase, still distinct from future adoption of synergistic data processing strategies by the Copernicus services, the objective of this system is to offer to application developers and early adopters the possibility to generate and access synergistic products of the atmospheric Sentinels based on the AURORA concept. The availability of a pre-operational version of the PDP is also a key factor to test the benefit of these products and of their advanced quality in the context of specific applications and services and can be an integral part of the process necessary to upgrade data synergy strategies from research to operations.
As a matter of fact, in the context of AURORA, the PDP operated with simulated data while still including all the functionalities required to process real atmospheric Sentinel data. Operational ozone profiles from Sentinel-5p mission (launched on 13 October 2017), as well as from Sentinel 4 and Sentinel 5 (launch dates from 2023 onwards), are not yet available. The AURORA project relied, therefore, on the use of simulated data, which permitted on the other hand to run experiments in fully controlled conditions. Moreover, even if the simulated data are reduced in size with respect to the real ones, the technologies used are designed as scalable systems, first of all in terms of input data volume as well as in terms of the quantities of users’ requests. In the context of the project, we performed a dedicated experiment on scalability by using volumes of simulated data consistent with an operational scenario (see
Section 5).
3. The AURORA Data Processing Chain
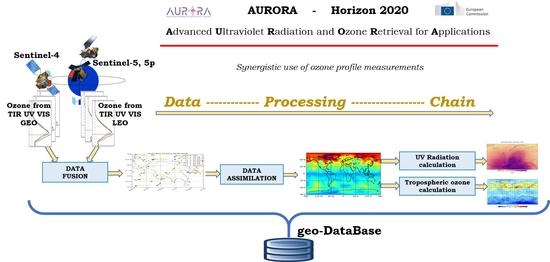
The objective of the AURORA project is to reduce the complexity in managing the high volume of data produced by the atmospheric Sentinel satellites by combining observations from multiple instruments, carried out in different spectral regions and from different platforms observing the Earth’s atmosphere from geostationary and low-Earth orbits. The strategy used to combine data and make available a unique geophysical product consists of a two-stage process (see
Figure 1).
In the first stage, the individual ozone products derived from UV, TIR and VIS bands, measured from both GEO and LEO platforms are fused from co-located observations obtaining a single ozone vertical profile characterised by its covariance matrix and averaging kernel matrix. The Complete Data Fusion (CDF) method, described in Ceccherini et al. [
5], was demonstrated to be equivalent, in the linear approximation, to the synergistic (or simultaneous) retrieval in terms of retrieval values, error estimates and number of degrees of freedom. The CDF method can be used when the application of the synergistic (or simultaneous) retrieval is too complex or not possible, as it uses standard products and has very simple requirements for its implementation. Moreover, the application of the CDF reduces the complexity in managing high volumes of remote sensing data, improving the quality of the final products, with respect to the standard ones [
6,
7,
8,
9].
In the second stage, the Data Assimilation System (DAS) combines the output by the fusion algorithm with a numerical model, to produce accurate ozone analyses and forecasts. The data assimilation models the dynamics of the atmosphere and the physical processes that occur in the Earth system. The AURORA project includes two state-of-the-art DASs used for the scientific analysis: (C-)IFS at ECMWF and TM5 at KNMI. The former was used with two configurations; one, referred to as simply IFS, is a low-resolution version of the one used for the operational weather forecasts and the C3S global reanalysis; the other, referred to as C-IFS, benefits from a sophisticated on-line chemistry module and it is used in the CAMS operational and reanalysis activities. The tests described in this paper, with focus on the technological features of the project, refer to TM5. The 3D ozone field, output of the DAS is used to calculate the tropospheric ozone partial column and the UV-radiation at the Earth’s surface.
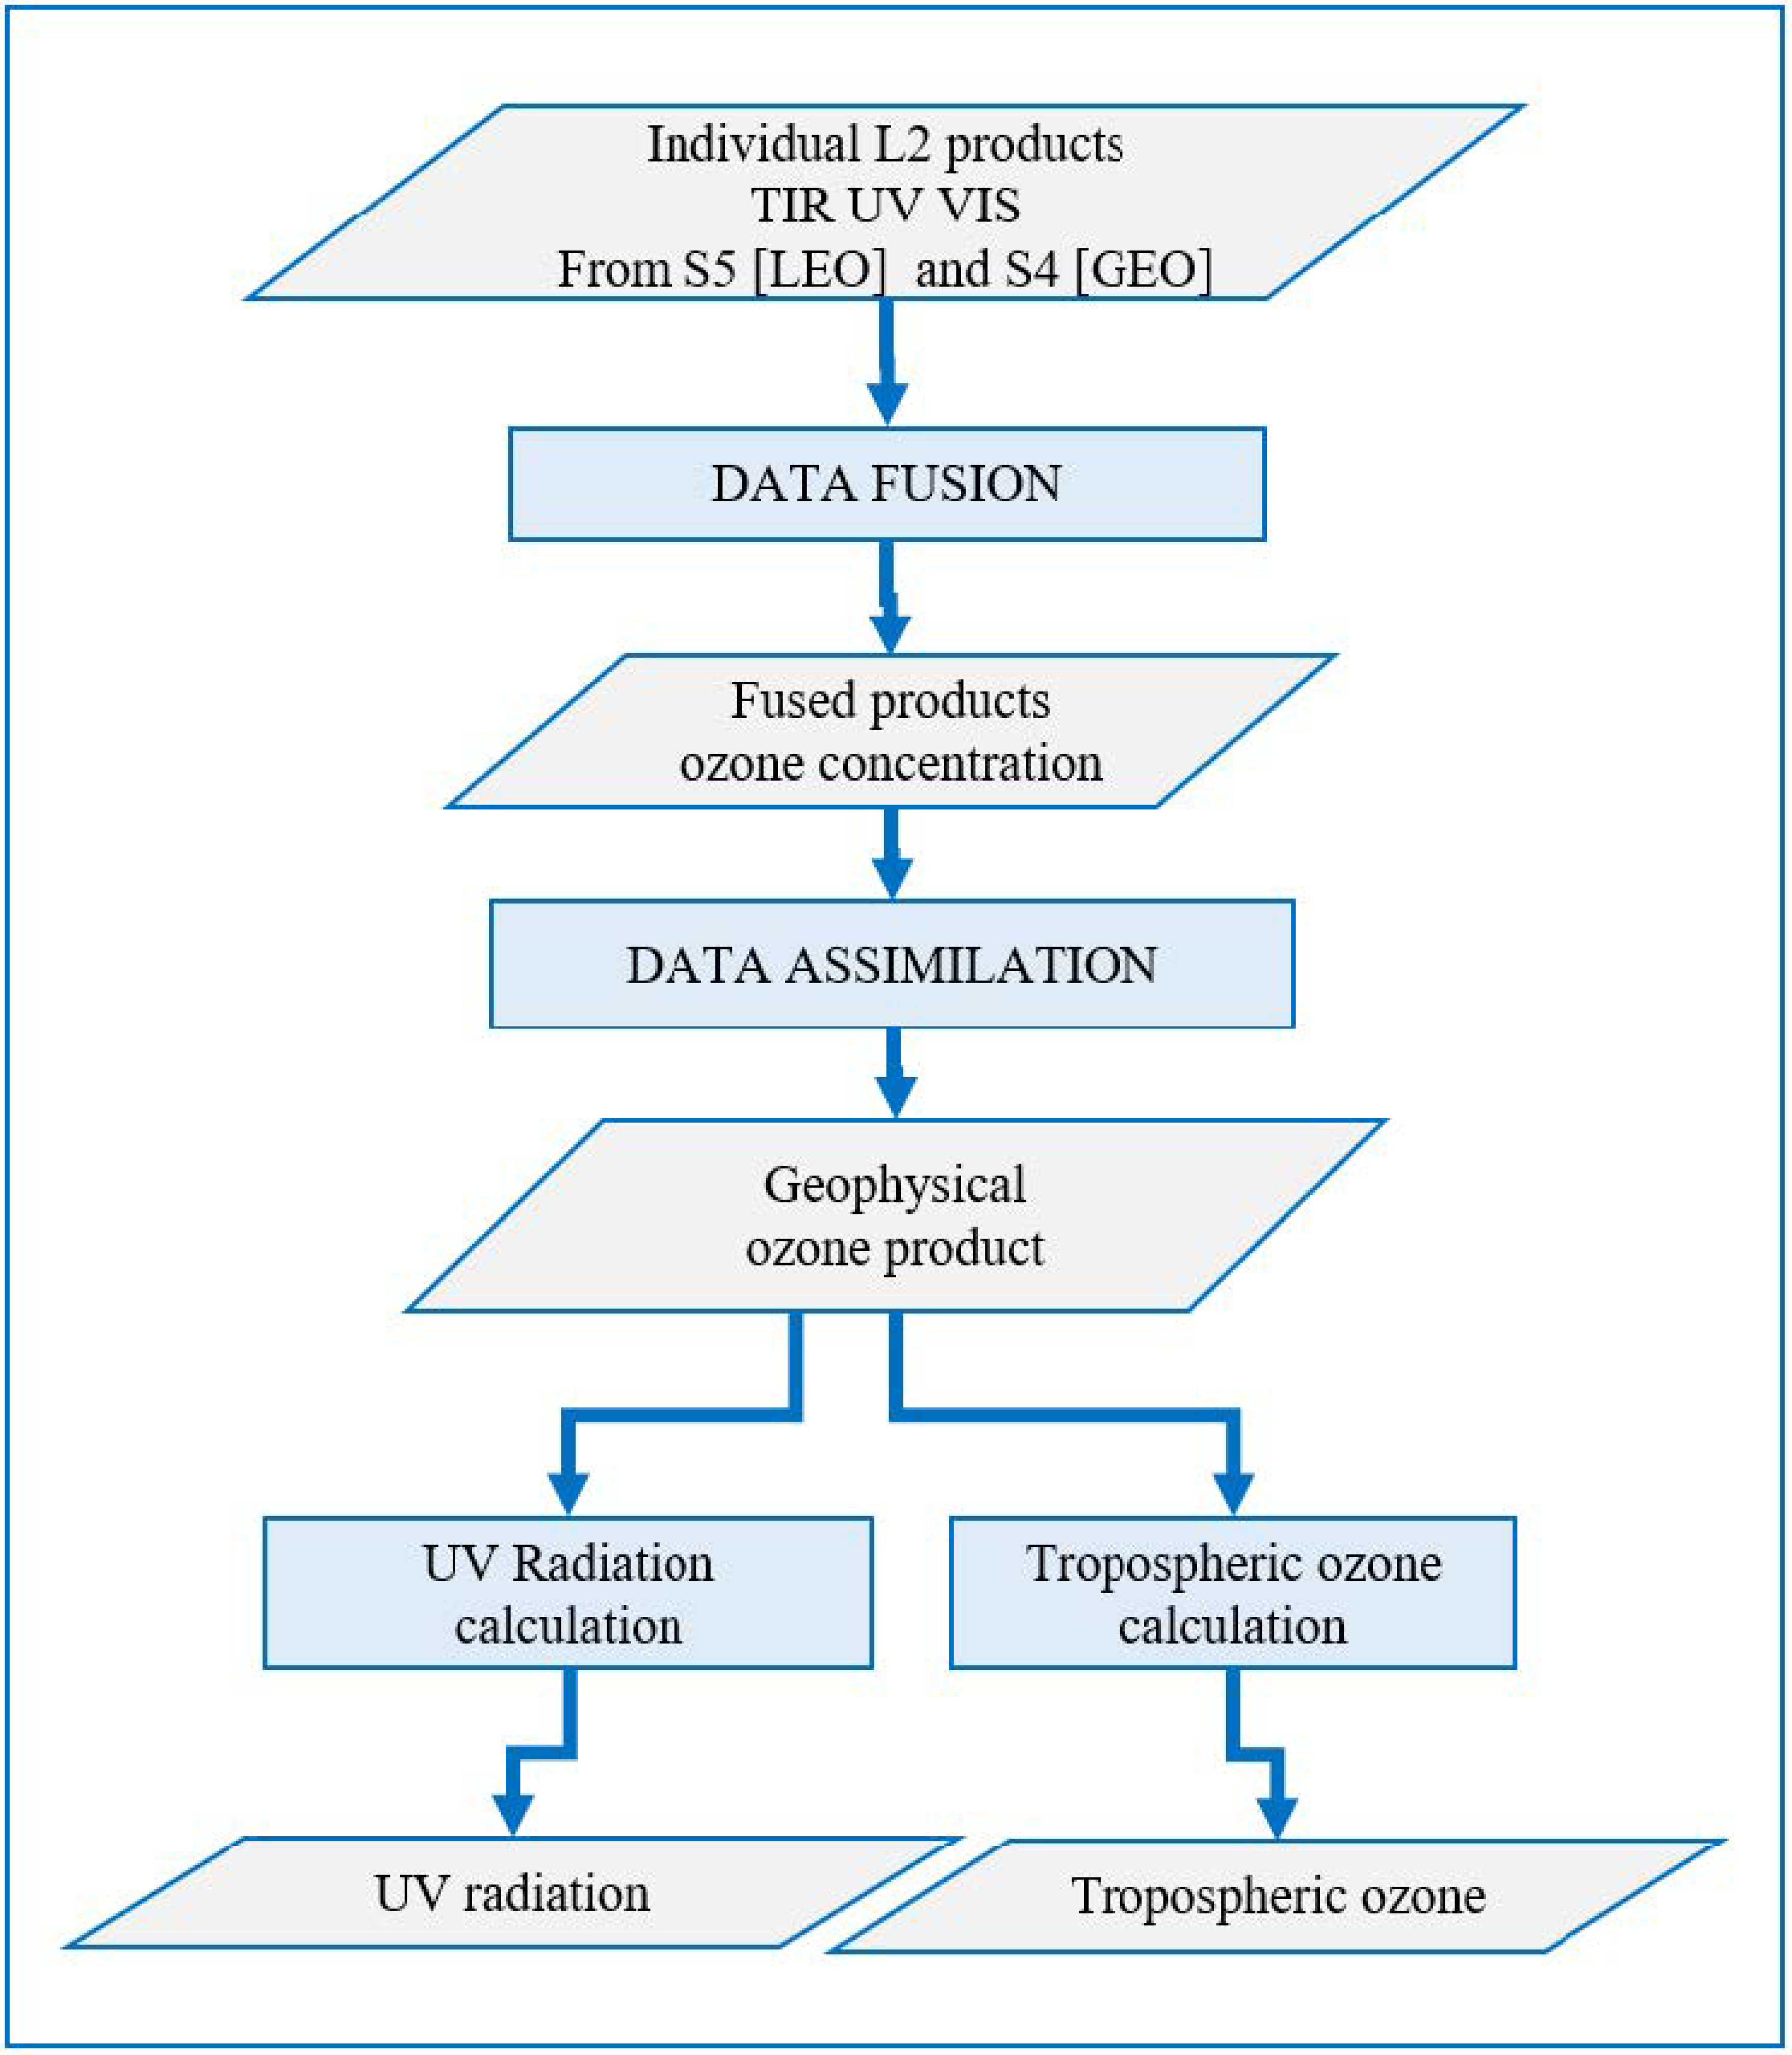
The AURORA Data Processing Chain (DPC) implements the data combination strategy described above in a step-by-step sequence of independent algorithms, from the individual synthetic level 2 products (i.e., the geophysical variables obtained from the simulated Sentinel observations) to the UV-index and tropospheric ozone that are the final products of the chain. The overall flow of the DPC consists of the three main steps summarised in
Figure 2:
Step 1: data fusion algorithm
The data fusion is applied to the level 2 products.
- –
Inputs of the data fusion are the individual level 2 files containing the simulated level 2 products for S4 and S5 (TIR, UV, VIS);
- –
Output of the data fusion is the fused ozone concentration product for LEO, GEO and LEO+GEO combination, both as VMR and as partial columns.
Step 2: data assimilation system
The Data Assimilation Systems (DAS) combines the fused products using a model to take into account the dynamics of the atmosphere.
- –
The DAS input is a set of fused ozone products for LEO, GEO and GEO+LEO geometries computed by the Data Fusion tool (alternatively DAS is able to import the L2 products);
- –
The DAS output is the geophysical ozone product provided by the assimilation system, both current state and forecast.
Step 3: Algorithms for the computation of the final AURORA products
The tropospheric ozone and the UV-index at earth surface are computed from the assimilated products.
- –
The input of the tools are the geophysical ozone products provided by DAS
- –
The outputs are: [(a)] the Tropospheric partial column of Ozone; [(b)] the UV radiation at the Earth’s surface. Both products can be calculated for the atmosphere current state and forecast
It should be clear that the processing chain starts with the fusion of the level 2 data; the DPC does not include the tools used to simulate the individual level 2, even if they have been developed within the AURORA project, as they should arrive from an operational retrieval processor in the future. Nevertheless, it is important to describe here the main characteristics of the level 2 datasets. For the simulations we considered two platforms (S4 and S5) and three Bands (TIR, UV, VISible); for each of them we referred to the up to date technical specifications available in 2016, date of the project start (Cortesi et al. 2018 [
2], Tirelli et al. 2020 [
6]). Moreover, for project needs, we decided to simulate level 2 products with the application of spatial filters, in order to reduce the volume of data to be simulated (Tirelli et al. 2020 [
6]).
4. The Technological Infrastructure for Distributed Data Processing
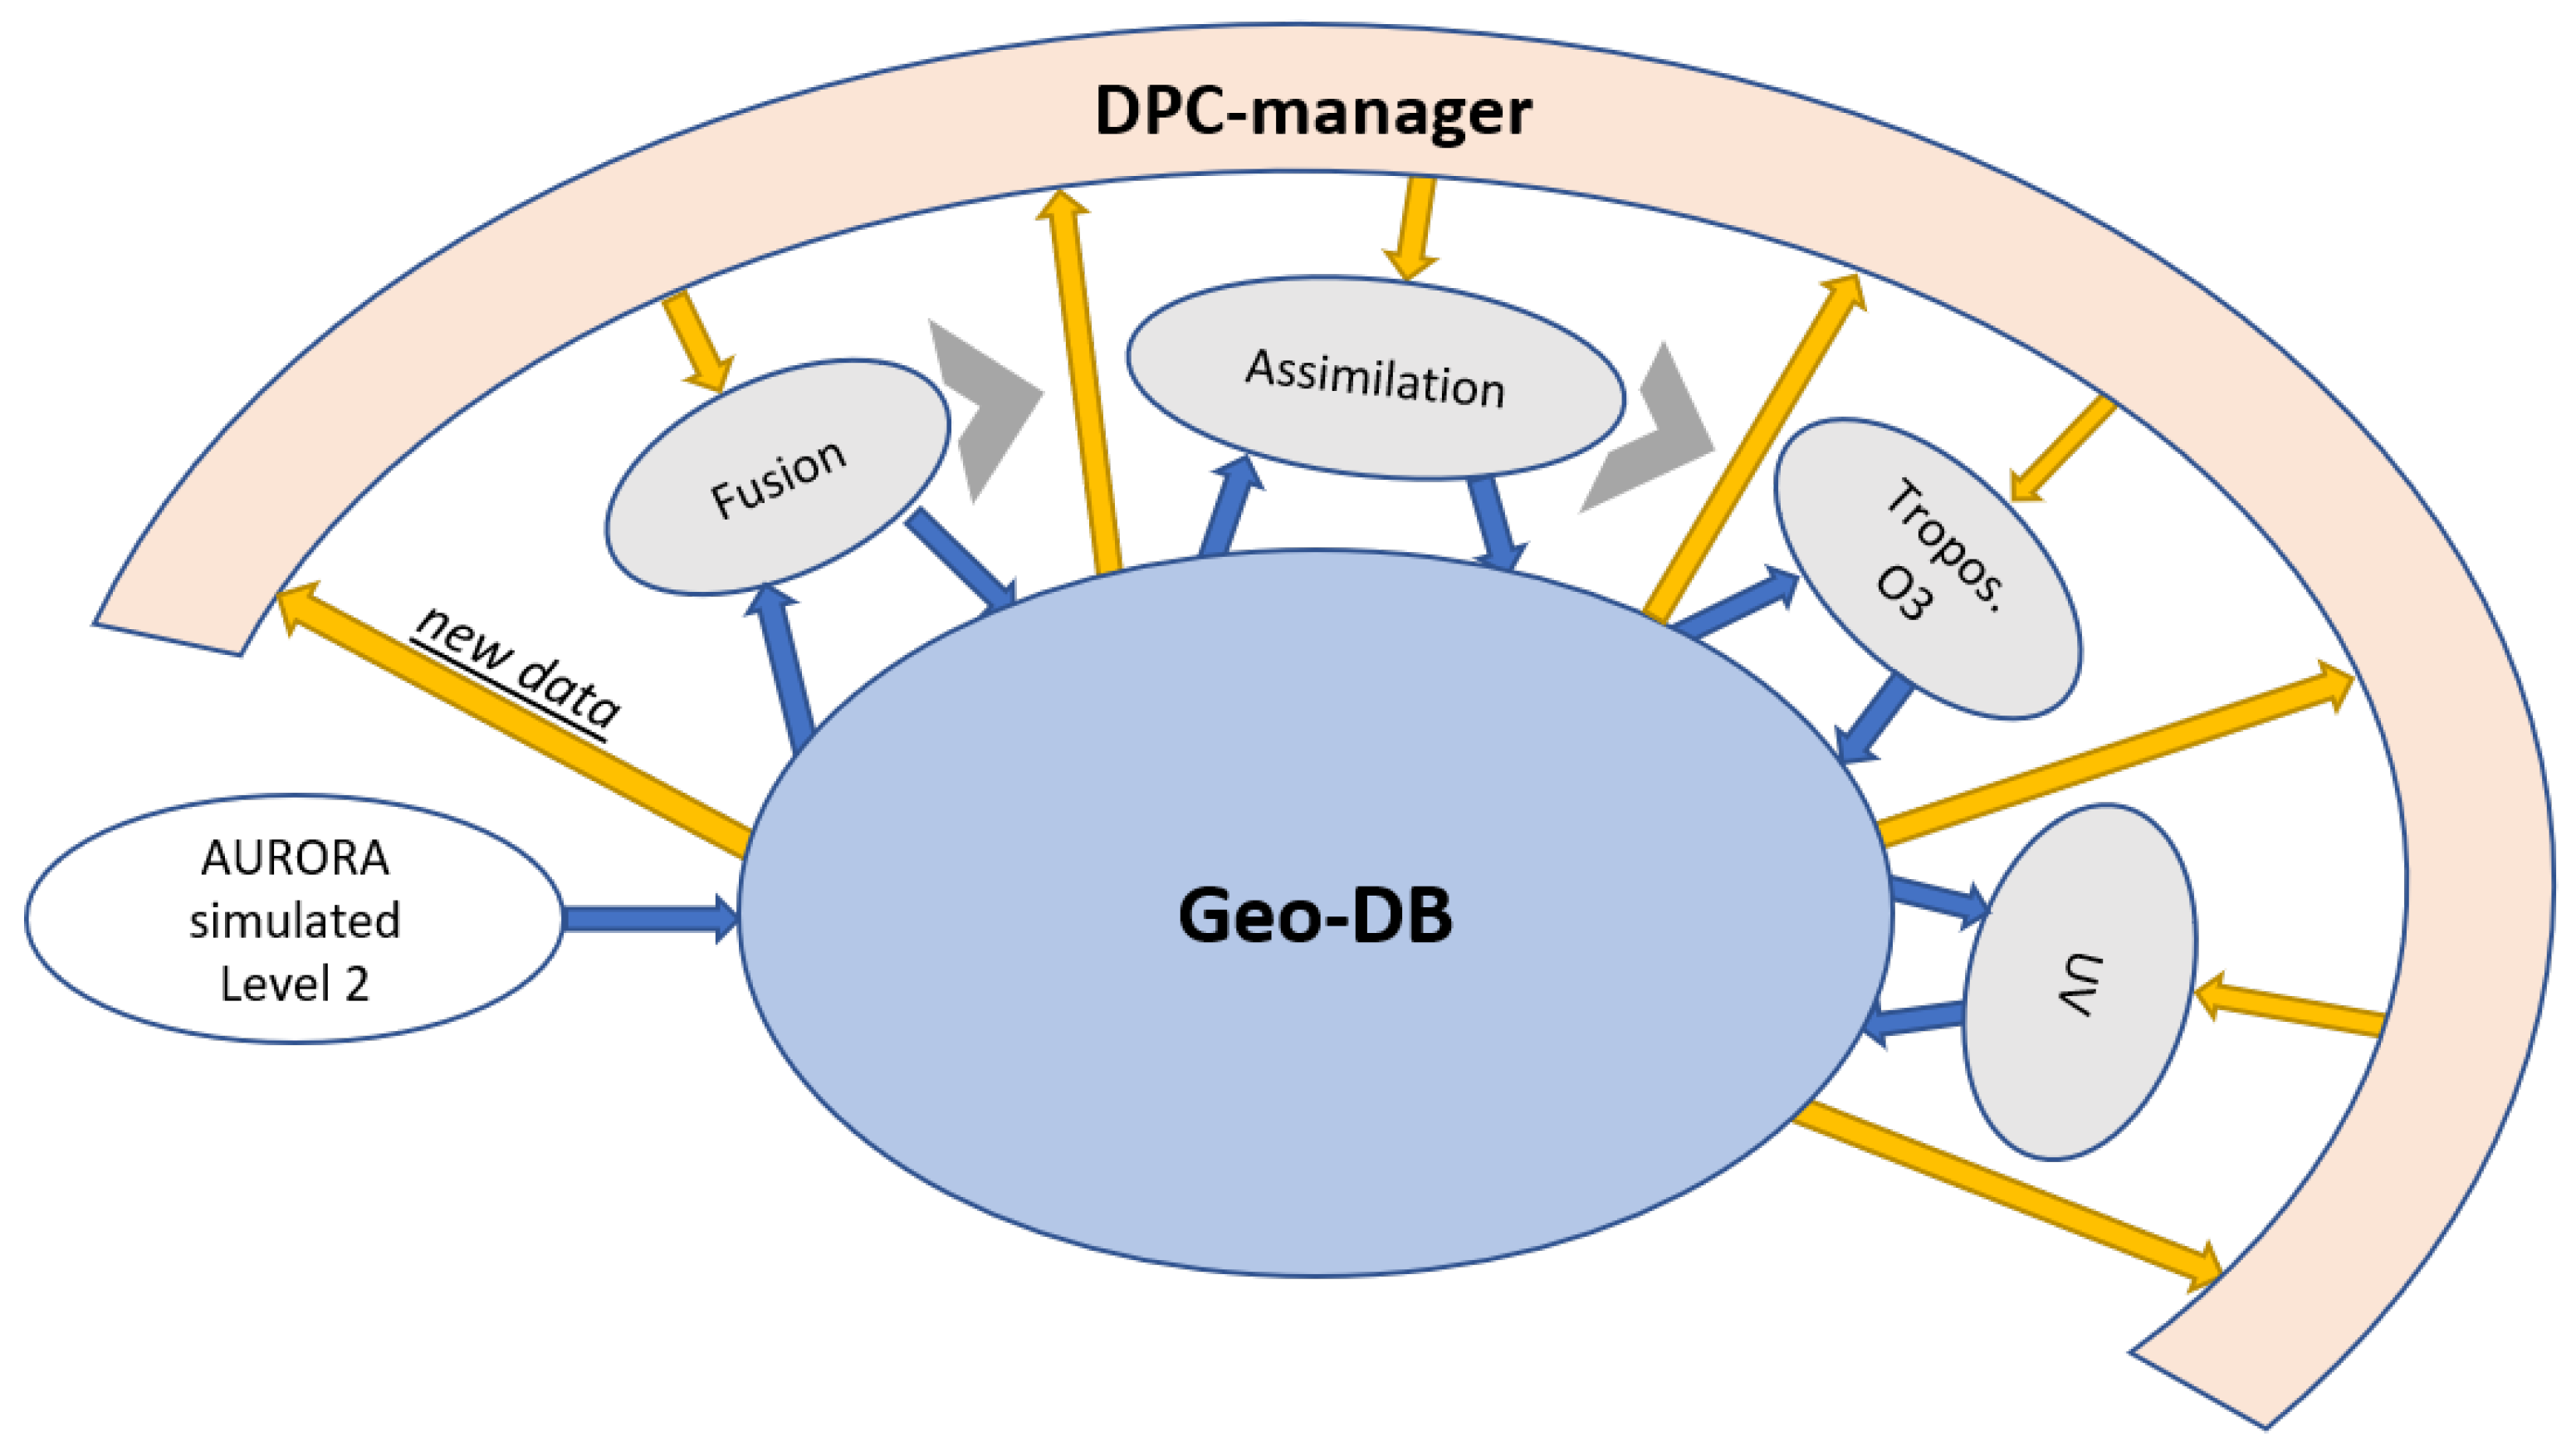
The technological infrastructure, developed in order to implement the AURORA data processing chain, was realised following a distributed processing approach architecture (
Figure 3). It is mainly composed of a geo-database (geo-DB), which is described in more details in
Section 4.1 and it was designed to store all the data required for the processing (input and auxiliary data, intermediate and final products); four independent modules run on independent servers (described in details in
Section 4.3) and are devoted to execute the four steps of processing; the DPC-manager (see
Section 4.4), that is a supervising module able to manage the data processing and to schedule the activities of each computational tool. Each DPC-component is designed as an independent module running on different servers.
The data processing is supervised by the DPC-manager tool that manages the processing and schedules the activity of each module. It receives notifications from the geo-DB when a new product has been uploaded and sends to the appropriate processing tool the "request to process". The communication between the geo-DB and the supervisor, as well as between the supervisor and each processing module, is described in more details in
Section 4.2. Each module is independent from the other; there is no communication nor interaction between modules; notifications that originate from the geo-DB are transmitted to the DPC-manager and notifications from DPC-manager are transmitted to the appropriate processing module. The data flow thus originates from the geo-DB (data to process) and returns to the geo-DB after computation (data processed), i.e., each module reads input data from geo-DB, executes the calculation and uploads the products to the geo-DB (in a network star configuration,
Figure 4). No data flow is allowed between the modules.
4.1. The Geo-Database
The geo-DB is the core of the technological infrastructure. It contains all the data required for the processing (input and auxiliary data; intermediate and final products) in a centralised repository and implements the technologies for the data access, as well as the specific functionalities for data archiving and communication.
The geo-DB component was designed and developed to possess the following main features:
It is based on a modular and extensible architecture, ready for big-data analysis.
It allows scalable storage for data and metadata with support of different formats and standards; in particular ISO 19115 and Climate and Forecast v 1.6.
It integrates an HYRAX server accessible via OPeNDAP protocol [
10] to assure interoperability among partners.
The OPenDAP implementation makes it compliant with the OGC standard: WCS, WMS, CSW [
11] to maximize the interoperability.
A key element of geo-DB is the OPeNDAP protocol that allows for interoperability among partners. The main features of this component are:
It enables remote datasets to be accessed through data analysis and visualization packages.
It supports direct access to data or data subset stored in most commonly adopted Earth Science data formats.
It is used and supported by International institutions (NOAA, NASA, NSF, ABM, …).
Even if OPeNDAP is the primary access to the data, the geo-DB implements FTP and HTTP servers as alternative data access.
The geo-DB is based on docker linux containers; it is composed of a series of loosely coupled modules (storage, Hyrax, Redis) enclosed in a container. The modular structure allows to exploit the advantages in terms of scaling, fault tolerance, high availability, and also allows to reduce the downtime during the rolling updates. The use of separated containers also improves the security and the possibility of an easy deployment in any cloud infrastructure supporting container technology.
In the release undergoing the software prototype tests, it was upgraded to
massively scalable object storage for unstructured data by means of Blobfuse, an open source project developed to provide a virtual file system backed by the Azure Blob storage [
12]. The geo-DB can be easily configured in order to replace the Azure Blob storage, adopted for the AURORA project with different open source solutions (as Apache Hadoop, Openstack, …) or proprietary ones (Amazon S3, Google cloud Storage Bucket, …).
4.2. The Message Queue Technology
The communication between the various components of the infrastructure (i.e., between manager and agents and between geo-DB and manager) is executed by means of messages managed by the ’Celery’ application software, which is a distributed system to process messages and a task queue with focus on real-time processing [
13]. Celery is implemented in conjunction with the Redis storage solution, that is an open source, in-memory data structure store, used as a database, cache and message broker. [
14].
The rationale of the communication technology is explained in the schema shown in
Figure 5 depicting the link that connects the manager and a processing module. No direct connection is established between manager and module; two Celery tasks, running on both components, open a queue to the Redis broker; the task running on the manager (publisher) sends a message to the broker; then the broker addresses the message to the task running on the module (subscriber). The same technology is used in the communication between geo-DB and manager.
All the communication between the DPC components and the geo-DB are asynchronous. When new data is loaded on the database, the geo-DB triggers the DPC manager, and then the manager notifies to the tool involved in the specific processing that new input data are available for processing.
4.3. The Processing Modules
The AURORA DPC contains four distributed processing modules, running on independent servers, one for each step of the chain: Fusion, Assimilation, Tropospheric-ozone and UV-radiation modules. Each module is composed of two main components, or sub-modules: the DPC-agent and the processing tool.
Figure 6 illustrates a general schema of a processing module and its integration in the technological infrastructure. The DPC-agent implements a Celery task (see
Section 4.2) dedicated to receive from the DPC-manager the notification that a new product, input of the module, is available in the geo-DB. As the notification occurs, if the processing tool is designed to read input data from local disk, the agent loads them from the geo-DB (via OPeNDAP protocol) and store them to a local temporary file; then the agent gives the authorisation to start to the processing tool. If the processing tool is designed to directly import input data from the geo-DB, as the notification occurs the agent immediately gives the authorisation to start. The processing tool reads input data, from the local disk or from the geo-DB, executes the elaboration (if it is the case) and stores the output to a local file. At the end, the file is uploaded to the geo-DB. Note that each processing module downloads input data from the geo-DB using the OPeNDAP protocol whereas the upload of the output processed data to the geo-DB is performed by using an HTTP protocol. The processing modules are described in more details in subsections from
Section 4.3.1 to
Section 4.3.4.
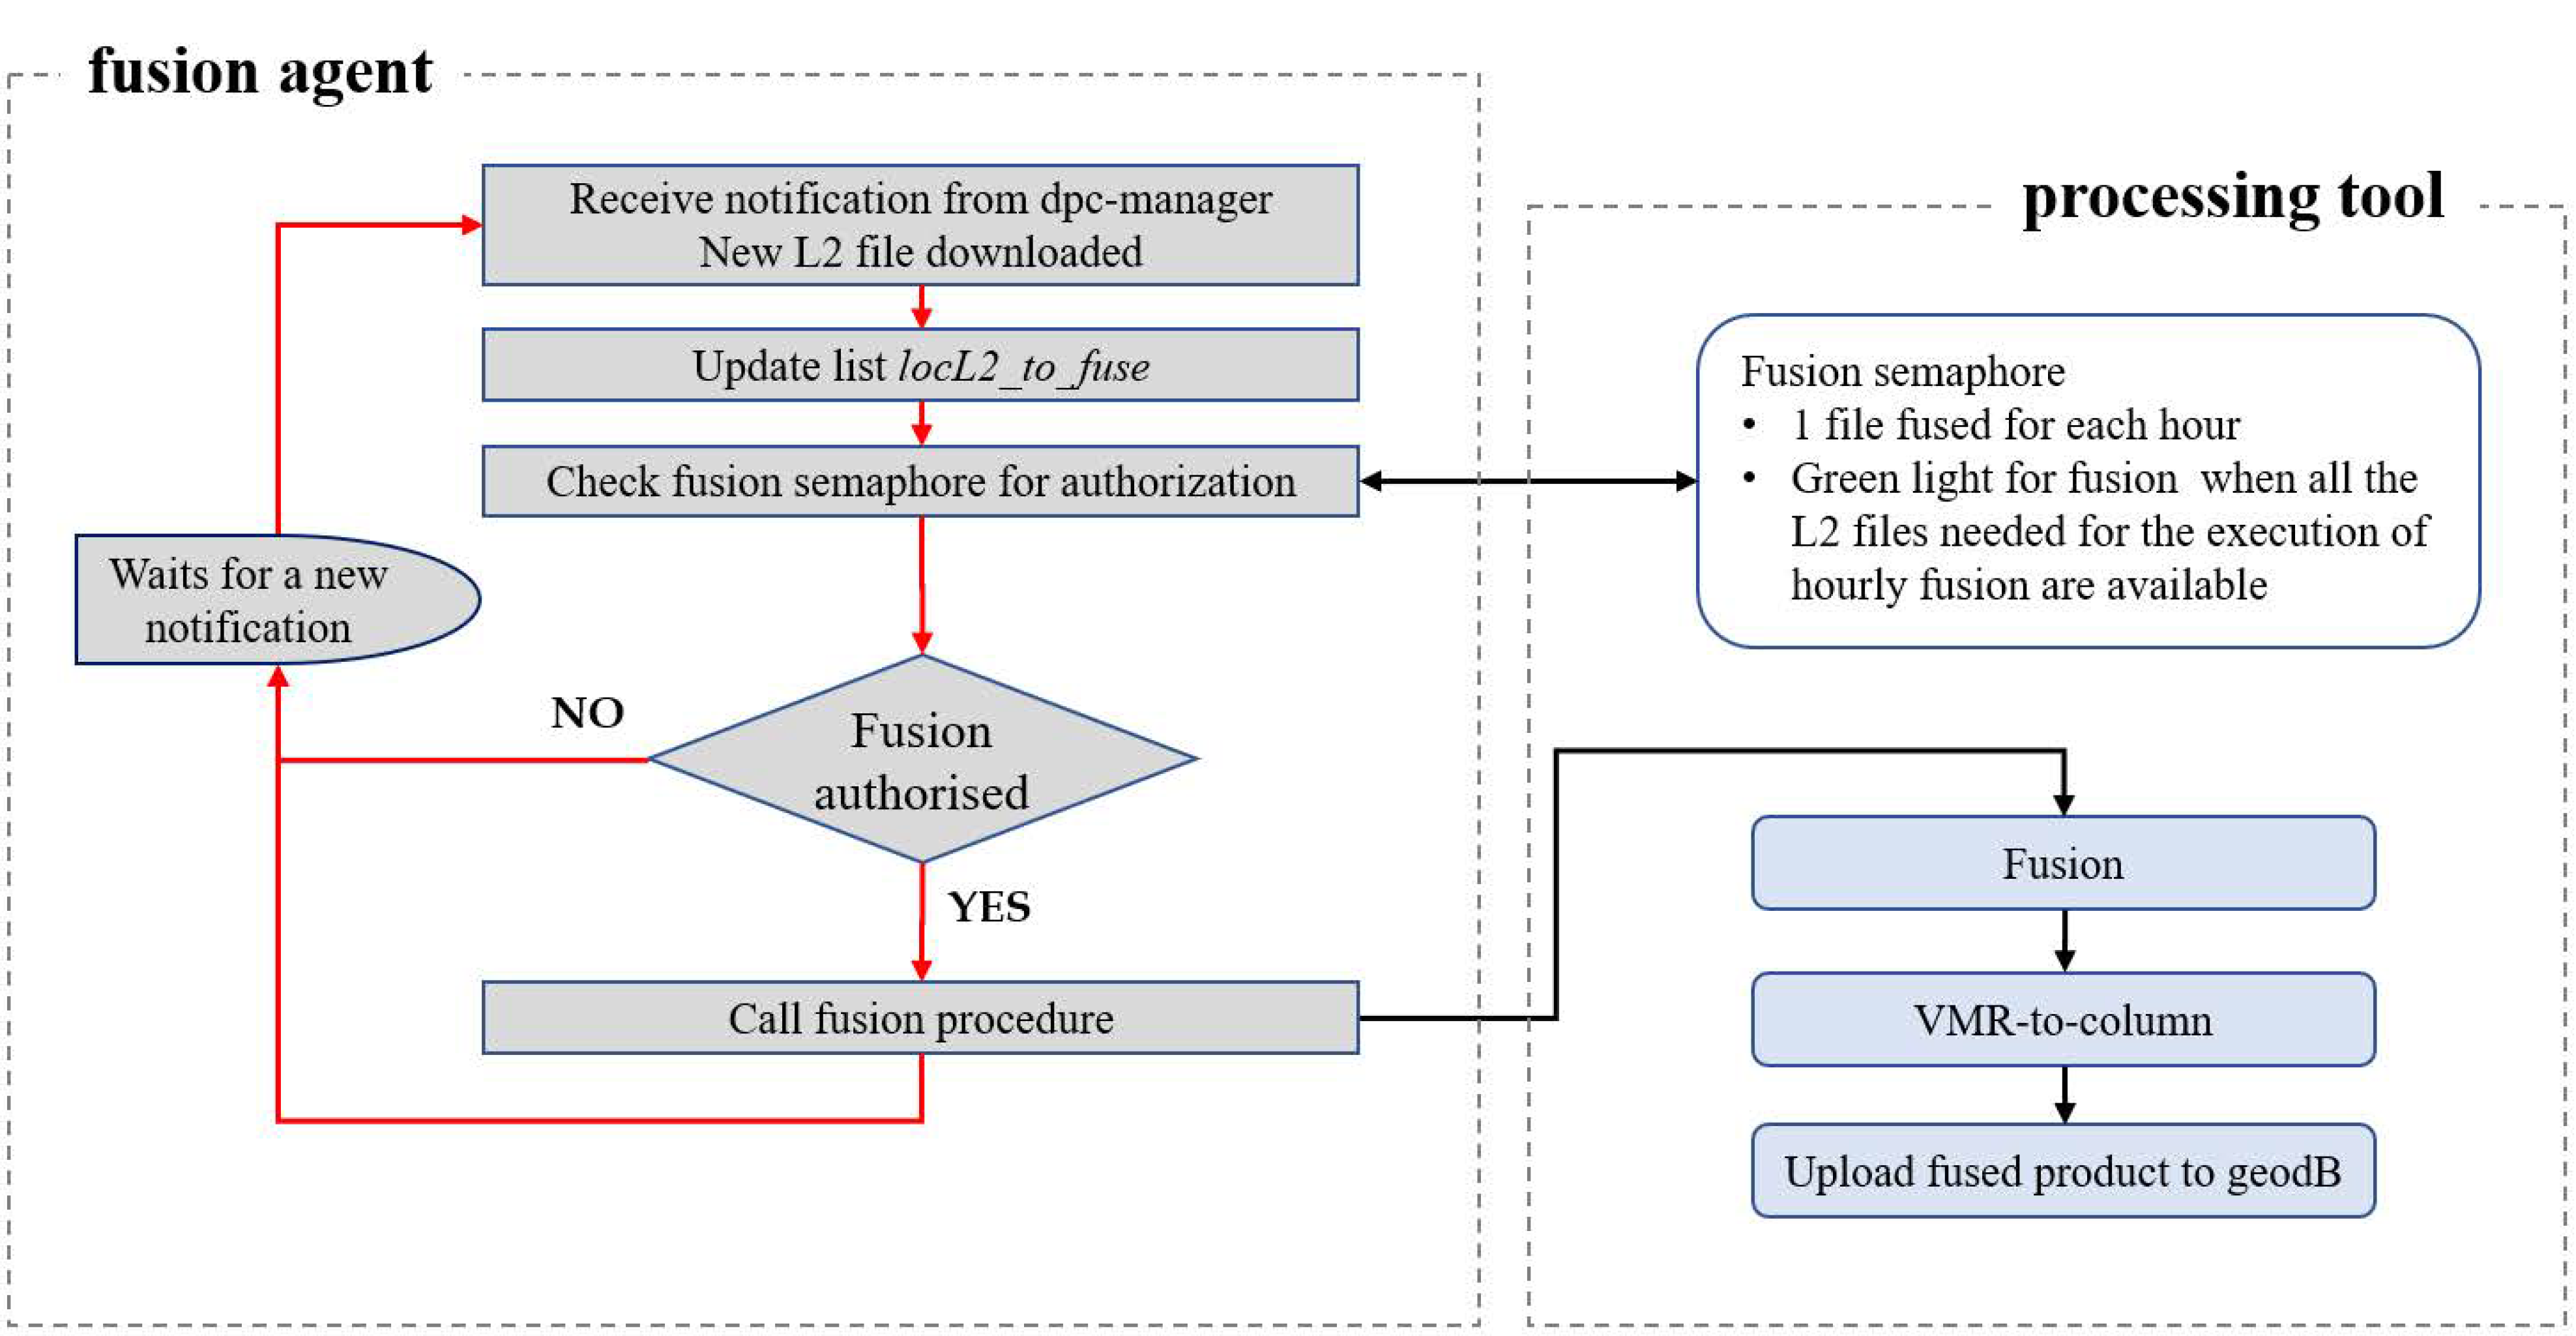
4.3.1. FUSION Module
The FUSION module implements the Complete Data Fusion (CDF) method described in Ceccherini et al. (2015) [
5]. The CDF application is an a-posteriori fusion method combining independent observations of the same atmospheric state, performed by measurements from different platforms and spectral bands, in a unique fused product. The fused product has the same structure as the fusing ones so that the module can be considered transparent for what regards the input-output form. On the other hand, depending on the coincidence criteria chosen, the fusion module can have a significant impact on the input-output data volume ratio. For example, Zoppetti et al. 2020 [
7] shows that considering a realistic spatial and temporal distribution of the UV and TIR level 2 products (no VIS considered in this experiment) and using a regular coincidence grid-cell with a one-degree size and 1-h time amplitude, up to 504 products can be fused (up to 160 with a 0.5 × 0.625 degree cell).
Figure 7 represents the module flow chart and, in particular, the interaction between the fusion agent and the fusion tool. The fusion agent invokes the fusion procedure when all the needed level 2 files are available. In particular, in extra-European areas, three files are expected (LEO, three spectral bands); where also S4 (GEO) products occur, six files are expected (LEO+GEO, three spectral bands). The DPC agent also implements a strategy that allows managing possible shortage in the availability of one or more files.
4.3.2. Assimilation Module
The AURORA assimilation module integrates the KNMI data assimilation system, referred to as TM5 [
15,
16]. TM5 consists in a global chemistry-transport model can simulate the concentrations of the various atmospheric trace gases, including greenhouse gases, such as carbon dioxide and methane, several chemically active species (e.g., ozone), and aerosols. The dynamical forcings are provided through the ECMWF operational meteorological fields (forecasts of wind, surface pressure and temperature). Emission data are taken from various databases, for instance the Emissions Database for Global Atmospheric Research (EDGAR). The data assimilation system embedded in TM5 is based on a sequential Kalman filtering technique (KF), which is successfully used to simultaneously assimilate various UV–VIS ozone retrievals. The TM5 ozone forecasts are based on a tracer transport scheme. The modelling of the transport, chemistry, and the aspects of the ozone data assimilation are described in detail in [
17]. The three-dimensional advection of ozone is described by the flux-based second-order moments scheme [
18].
The high-level flow chart of the assimilation module is reported in
Figure 8. The TM5 system does not start a new assimilation for each new fused product that is produced upstream; the assimilation procedure only starts at a particular clock based time (e.g., 00, 12 UTC); it generates in output (local disk) a file product for each period under analysis. The DAS generates in output a netCDF file containing the four-dimensional global ozone analyses and forecasts. The final characteristics of the output product were defined as a compromise between what was considered affordable in AURORA in terms of data size and the requirements dictated by the calculations of the ground UV-index and tropospheric ozone, and ultimately by those needed in the development and use of the AURORA downstream applications.
4.3.3. Tropospheric Ozone Module
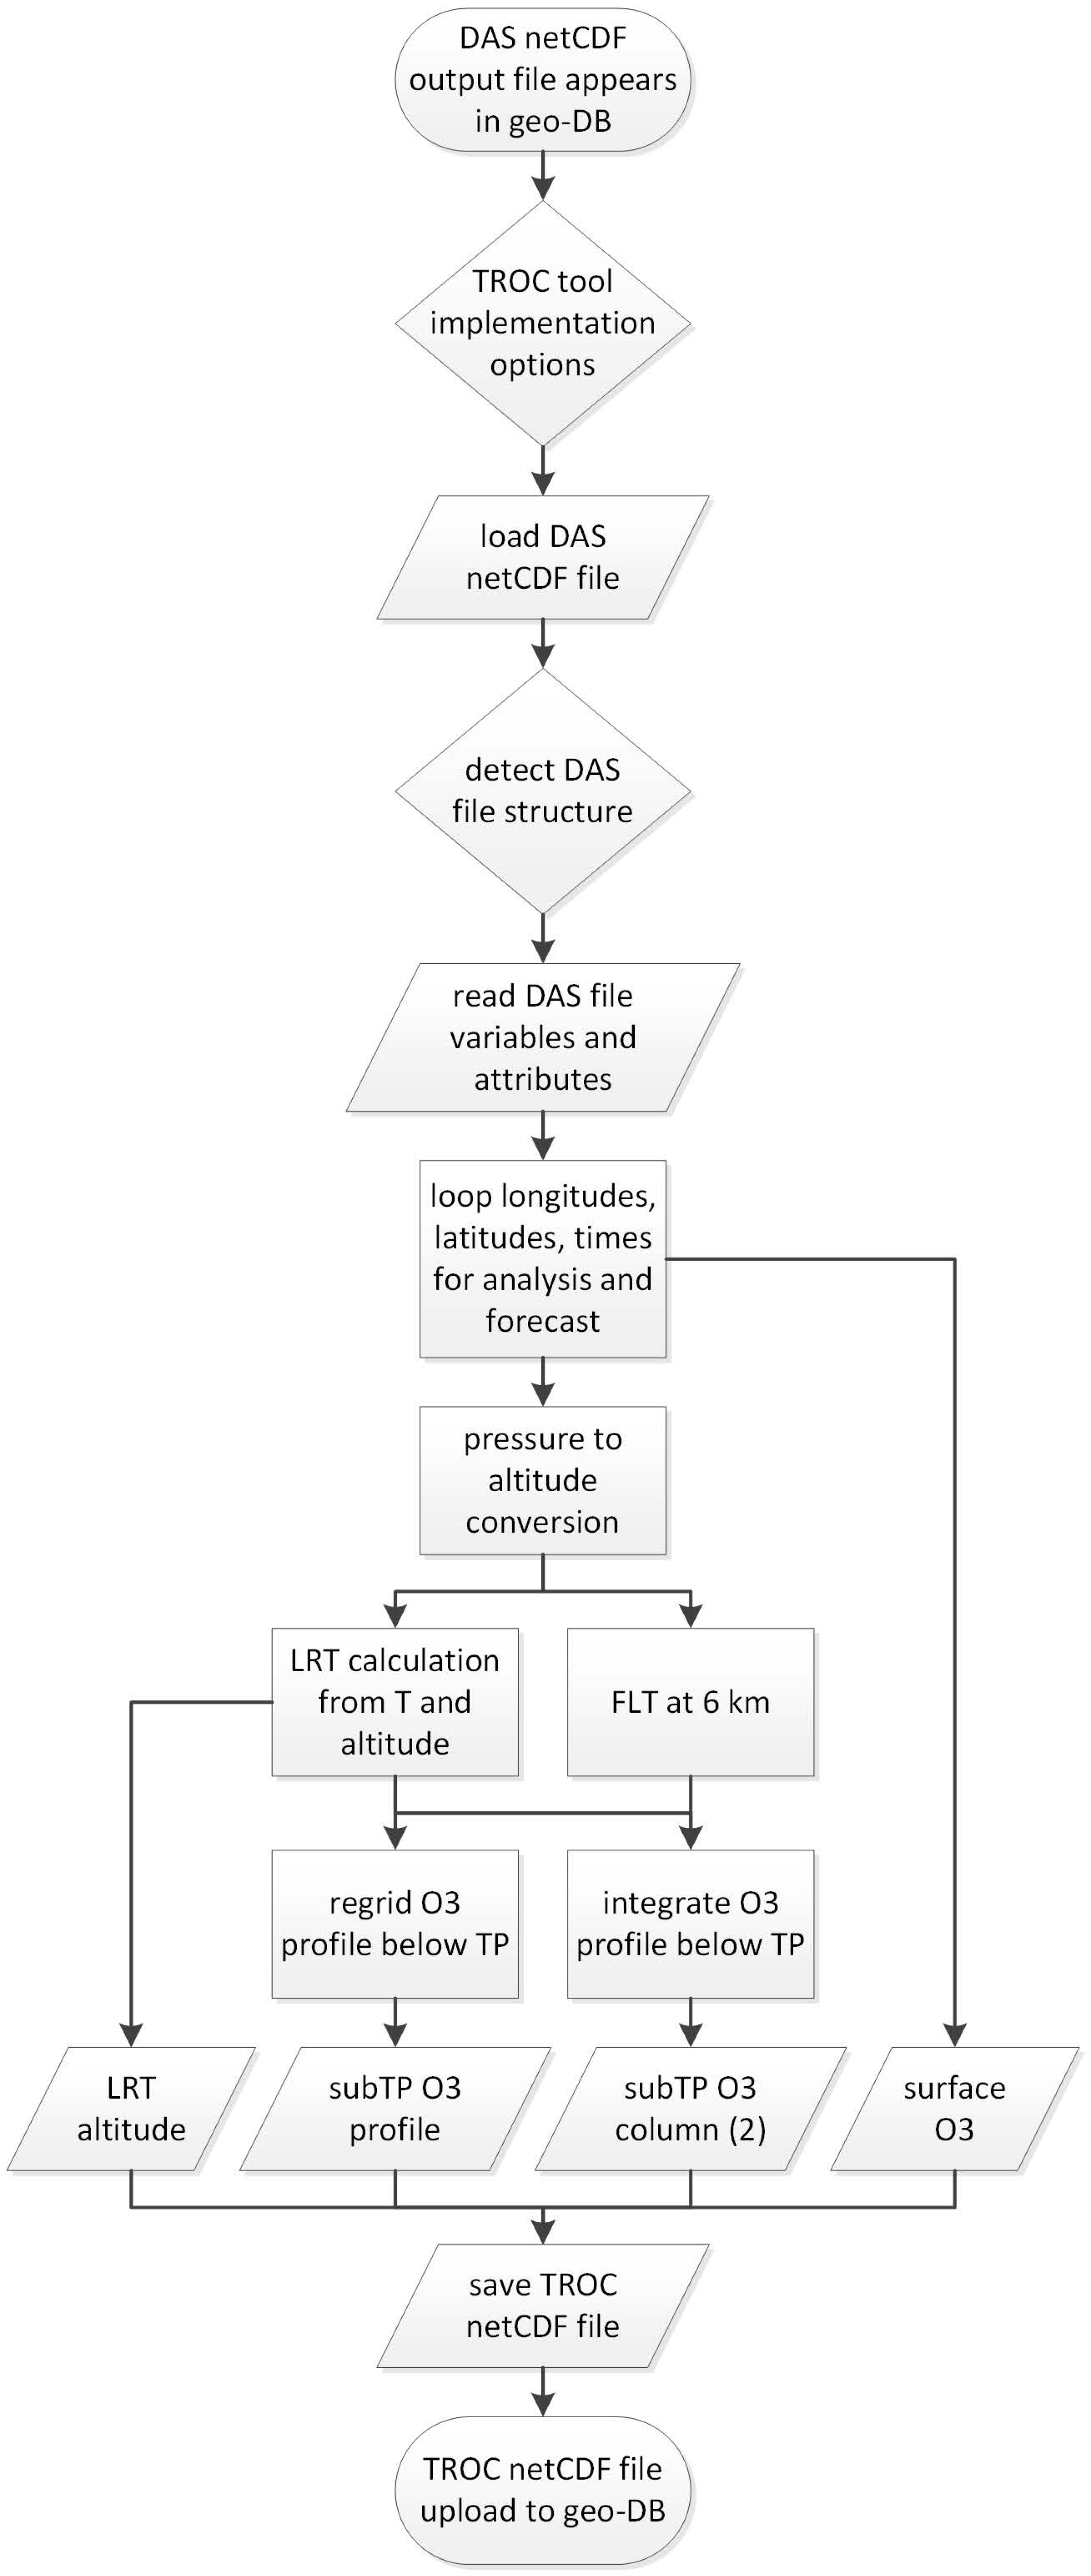
The AURORA tropospheric ozone calculation (TROC) tool calculates tropospheric ozone profiles and integrated tropospheric ozone columns from the globally assimilated and forecasted vertical ozone profile and temperature fields provided by the assimilation systems. The WMO lapse-rate tropopause altitude [
19] and surface ozone concentration are included in the tool’s output as well. Based on the DAS variables, the tropospheric ozone tool incorporates the following data processing flow, as also presented schematically in
Figure 9:
The tropospheric ozone tool is automatically initiated upon appearance of a DAS output file into the geo-DB.
As several tropospheric ozone tool implementation options are possible, one (or more, for testing) of those options is automatically selected to run the tool on the detected DAS output file.
The DAS netCDF output file is loaded from the geo-DB by the DPC-agent.
Detection of the DAS dimensions (or file source) and dynamical adaptation to these dimensions.
Upon taking into account the right dimensions of the DAS variables, the latter are properly read into the processing memory. Dummy tropospheric ozone tool output variables with the same dimensions are created in this same step.
The tropospheric ozone tool algorithm loops over the DAS file longitudes, latitudes, and times, for both the analysis and forecast data. For each step within the loop, i.e., for each single vertical ozone profile, several quantities are calculated and written into the corresponding location of the pre-initialised output variables (see previous step). The surface ozone concentration, as the first value of the profile, is readily available and therefore directly copied to the output variable.
The DAS pressure profile is first constructed from the given surface pressure and the DAS pressure coefficients. The resulting pressure profile is then converted to a vertical altitude profile by use of the hydrostatic equation and the surface altitude. As the atmosphere’s relative humidity field is not contained in the DAS files however, its value is set to zero. This approximation results in few percent errors on the upper altitude values. The surface altitude, which is not in the DAS files either, is taken from the ECMWF ERA-Interim orography (to be replaced by ERA-5) and also saved as a tropospheric ozone tool output file variable for reference.
Two tropopauses are determined from the (given) temperature and (calculated) altitude profiles, namely the physical WMO lapse-rate tropopause (LRT) and, trivially, the artificial fixed-level tropopause (FLT) at 6 km. Especially the former requires a sufficiently fine-gridded vertical dimension of the temperature profile of the order of 1 km [
19,
20]. Its value is immediately stored as a tropospheric ozone tool output file variable for reference.
In order to simplify the sub-tropopause ozone profile data storage, each DAS ozone profile is regridded with mass-conservation [
21] and vertically integrated to an integer-value altitude grid, with the surface altitude and LRT altitude as additional extreme values; e.g., when the surface and LRT altitudes equal 2.5 and 12.5 km, respectively, the assimilated ozone profile is regridded to the [2.5, 3, 4, … 11, 12, 12.5] grid. As such only the surface and LRT altitudes have to be known (and are therefore stored) to reconstruct the entire vertical altitude grid of the tropospheric ozone profile. The predefined vertical dimension of the tropospheric ozone profile output field (in sub-column units) is set to twenty, so that a vertical range of 21 km between surface altitude and LRT can be covered, which is largely sufficient. Super-LRT values are filled with dummy missing data values.
Two tropospheric ozone column values are obtained from the original sub-tropopause ozone profile by direct summation of the corresponding sub-column values, one up to 6 km and one up to the lapse-rate tropopause.
All variables resulting from the previous processes are written into a new tropospheric ozone tool net-CDF output file, thereby following the Climate and Forecast conventions [
22]. Note that uncertainty fields are not included, as these are not provided within (C-)IFS either.
The tropospheric ozone tool output file is uploaded to the AURORA geo-DB. There will be only one type of output file for both data assimilation systems.
4.3.4. UV-Radiation Module
The UV-radiation module is dedicated to the computation of the UV-radiation at the Earth surface. The model used is described in details in [
23]. The atmospheric radiative transfer of the model is based on the “libRadtran” [
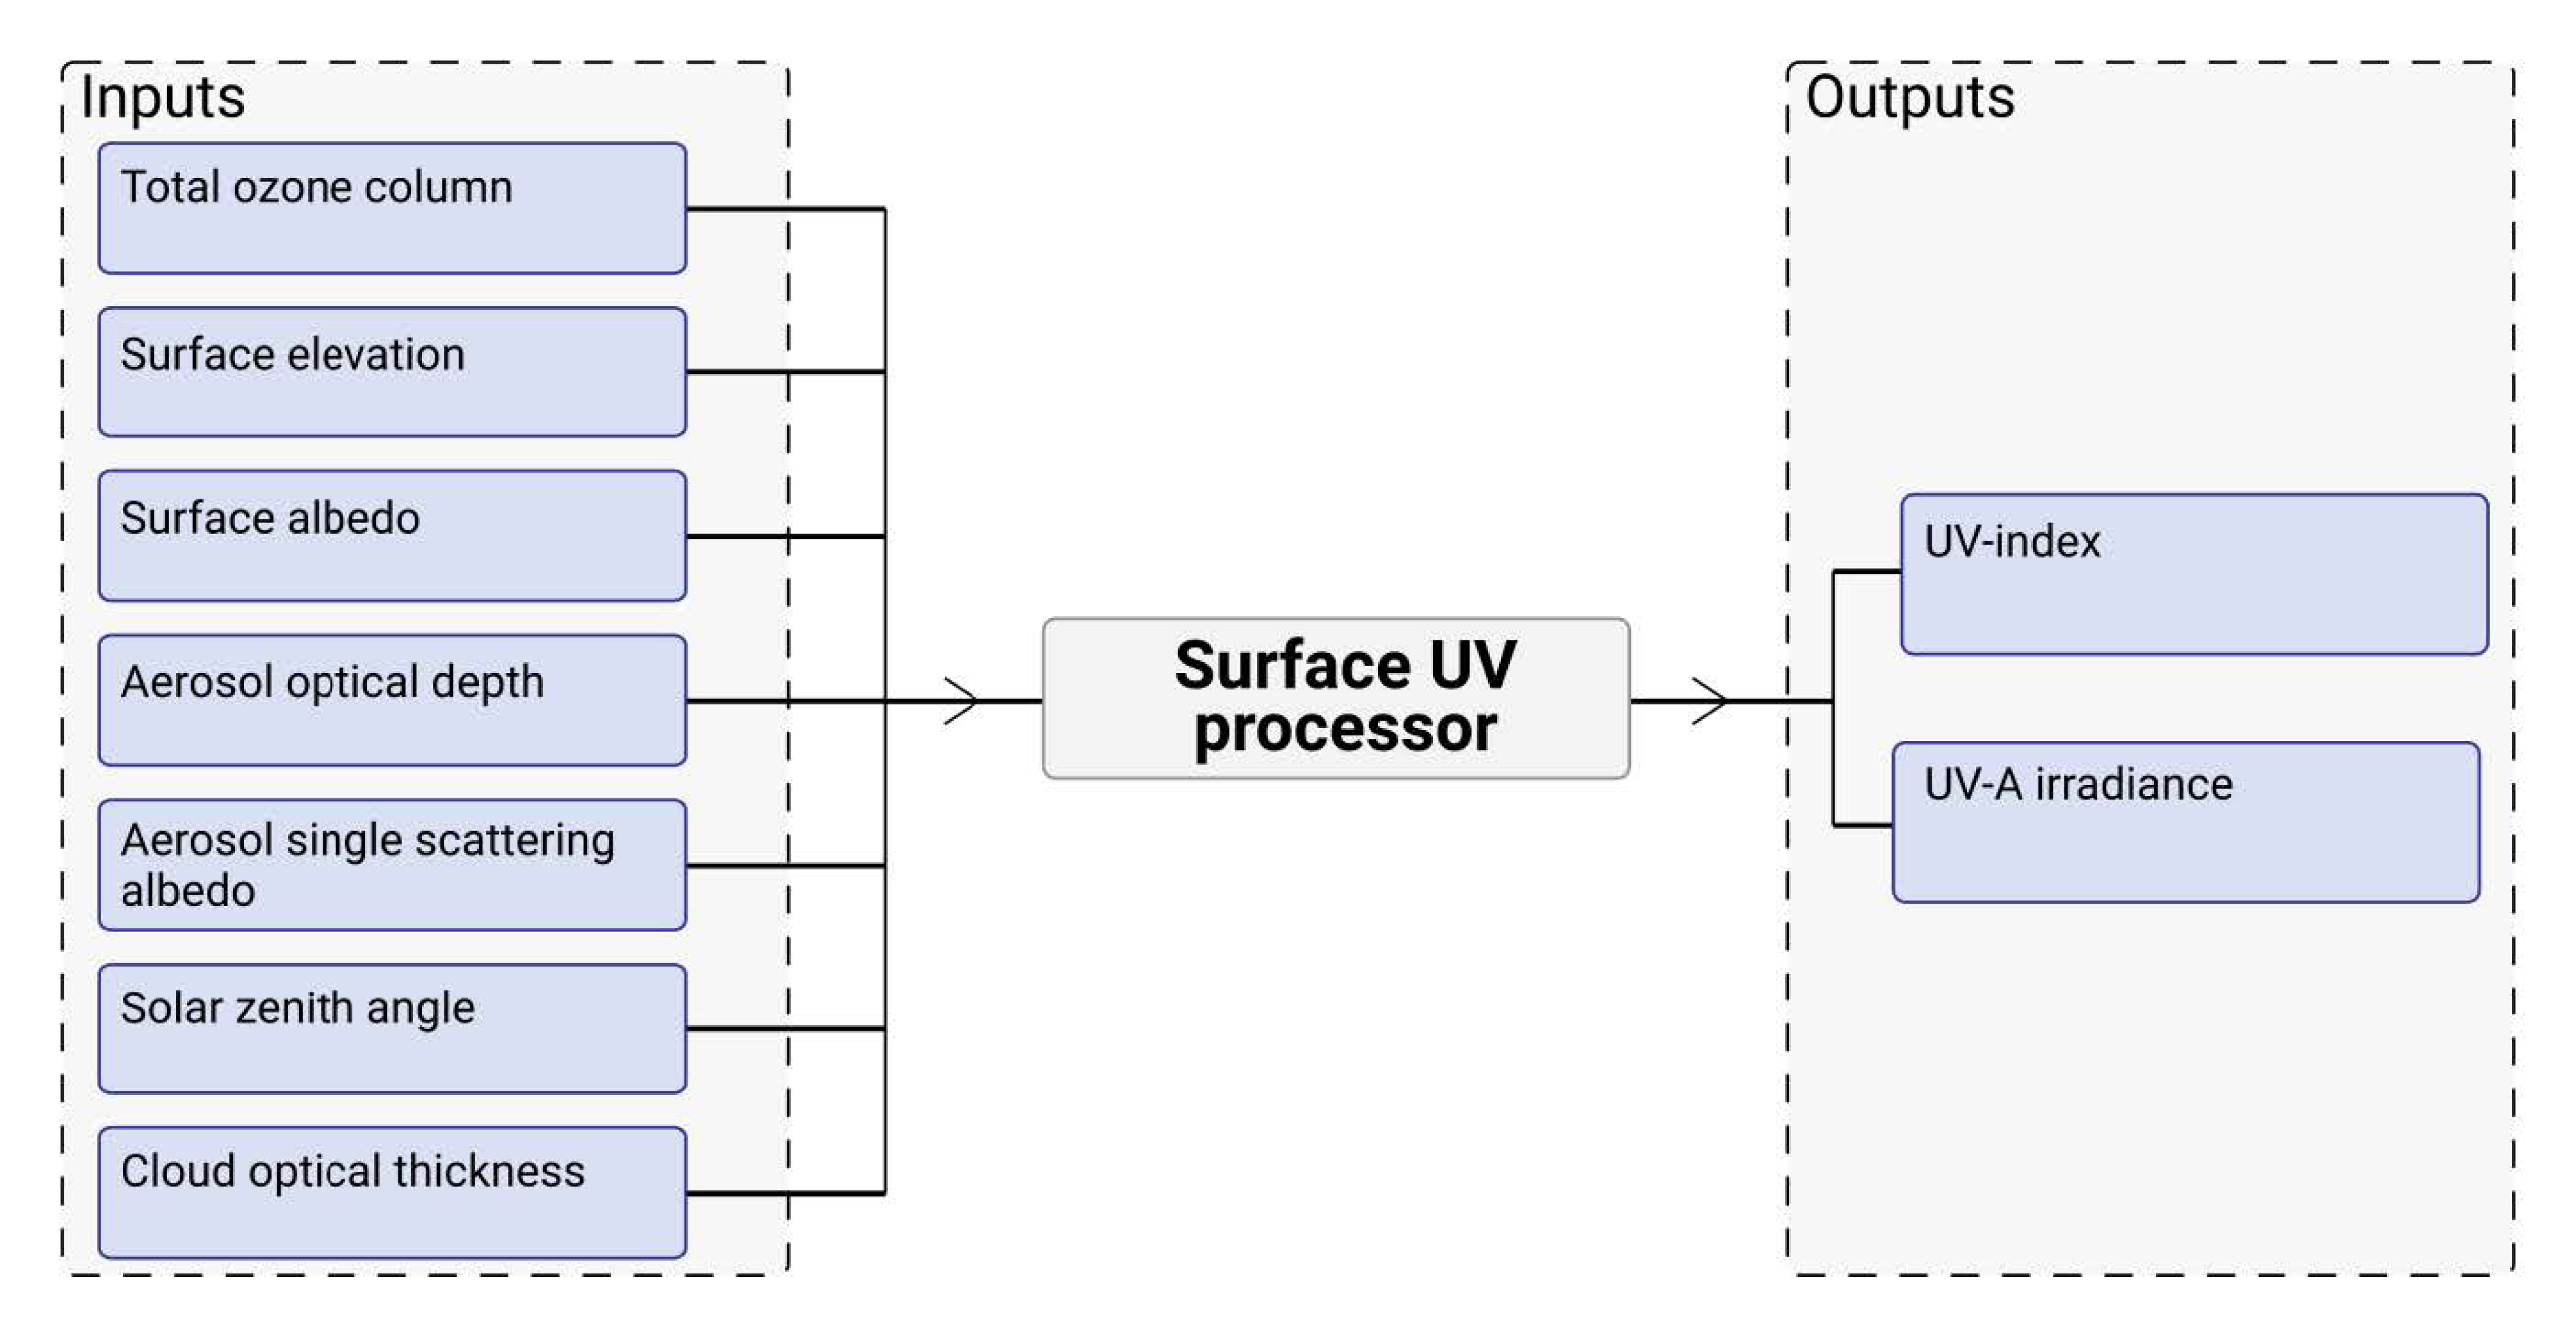
24] radiative transfer software package. The simulations are carried out to compute the UV radiation at single surface point on a single moment and therefore the spatial and temporal resolution of the UV radiation model is only limited by the resolutions of the required input variables such as the concentration of ozone. As the full atmospheric radiative transfer computations are computationally very expensive and would not allow data processing at large-scale we used the so-called lookup-table approach to implement the UV radiation model. In the lookup-table approach, a pre-computed table of surface UV radiation values, corresponding to certain input parameters, is used and the model evaluations are carried out as interpolation of the table. This makes the UV radiation model computationally very efficient and allows for large-scale data processing fulfilling the needs of the AURORA project. The AURORA UV radiation model uses the US Standard Atmosphere 1976 as auxiliary data in order to model the atmosphere.
The surface UV model has seven input and two output variables. The inputs of the model are:
Total ozone column (from AURORA assimilation system).
Surface elevation (from NOAA ETOPO2v2g digital elevation model).
Surface albedo (from Lambertian Surface Albedo Climatology at 360 nm from Total Ozone Mapping Spectrometer (TOMS)).
Aerosol optical depth (from Max-Planck-Institute aerosol climatology version 2 (MAC-v2)).
Aerosol single scattering albedo (from the MAC-v2 aerosol climatology).
Solar zenith angle (computed based on time, date, and location).
Cloud optical thickness (from auxiliary data source if available).
The outputs of the model are:
A flow chart of the surface UV calculation module is shown in
Figure 10.
4.4. DPC-Manager: The Processing Supervisor
The DPC-manager is the tool devoted to supervise the processing chain and to schedule the activities of each module. It implements two Celery tasks, one for receiving messages from the geo-DB and one for sending messages to the local processing modules.
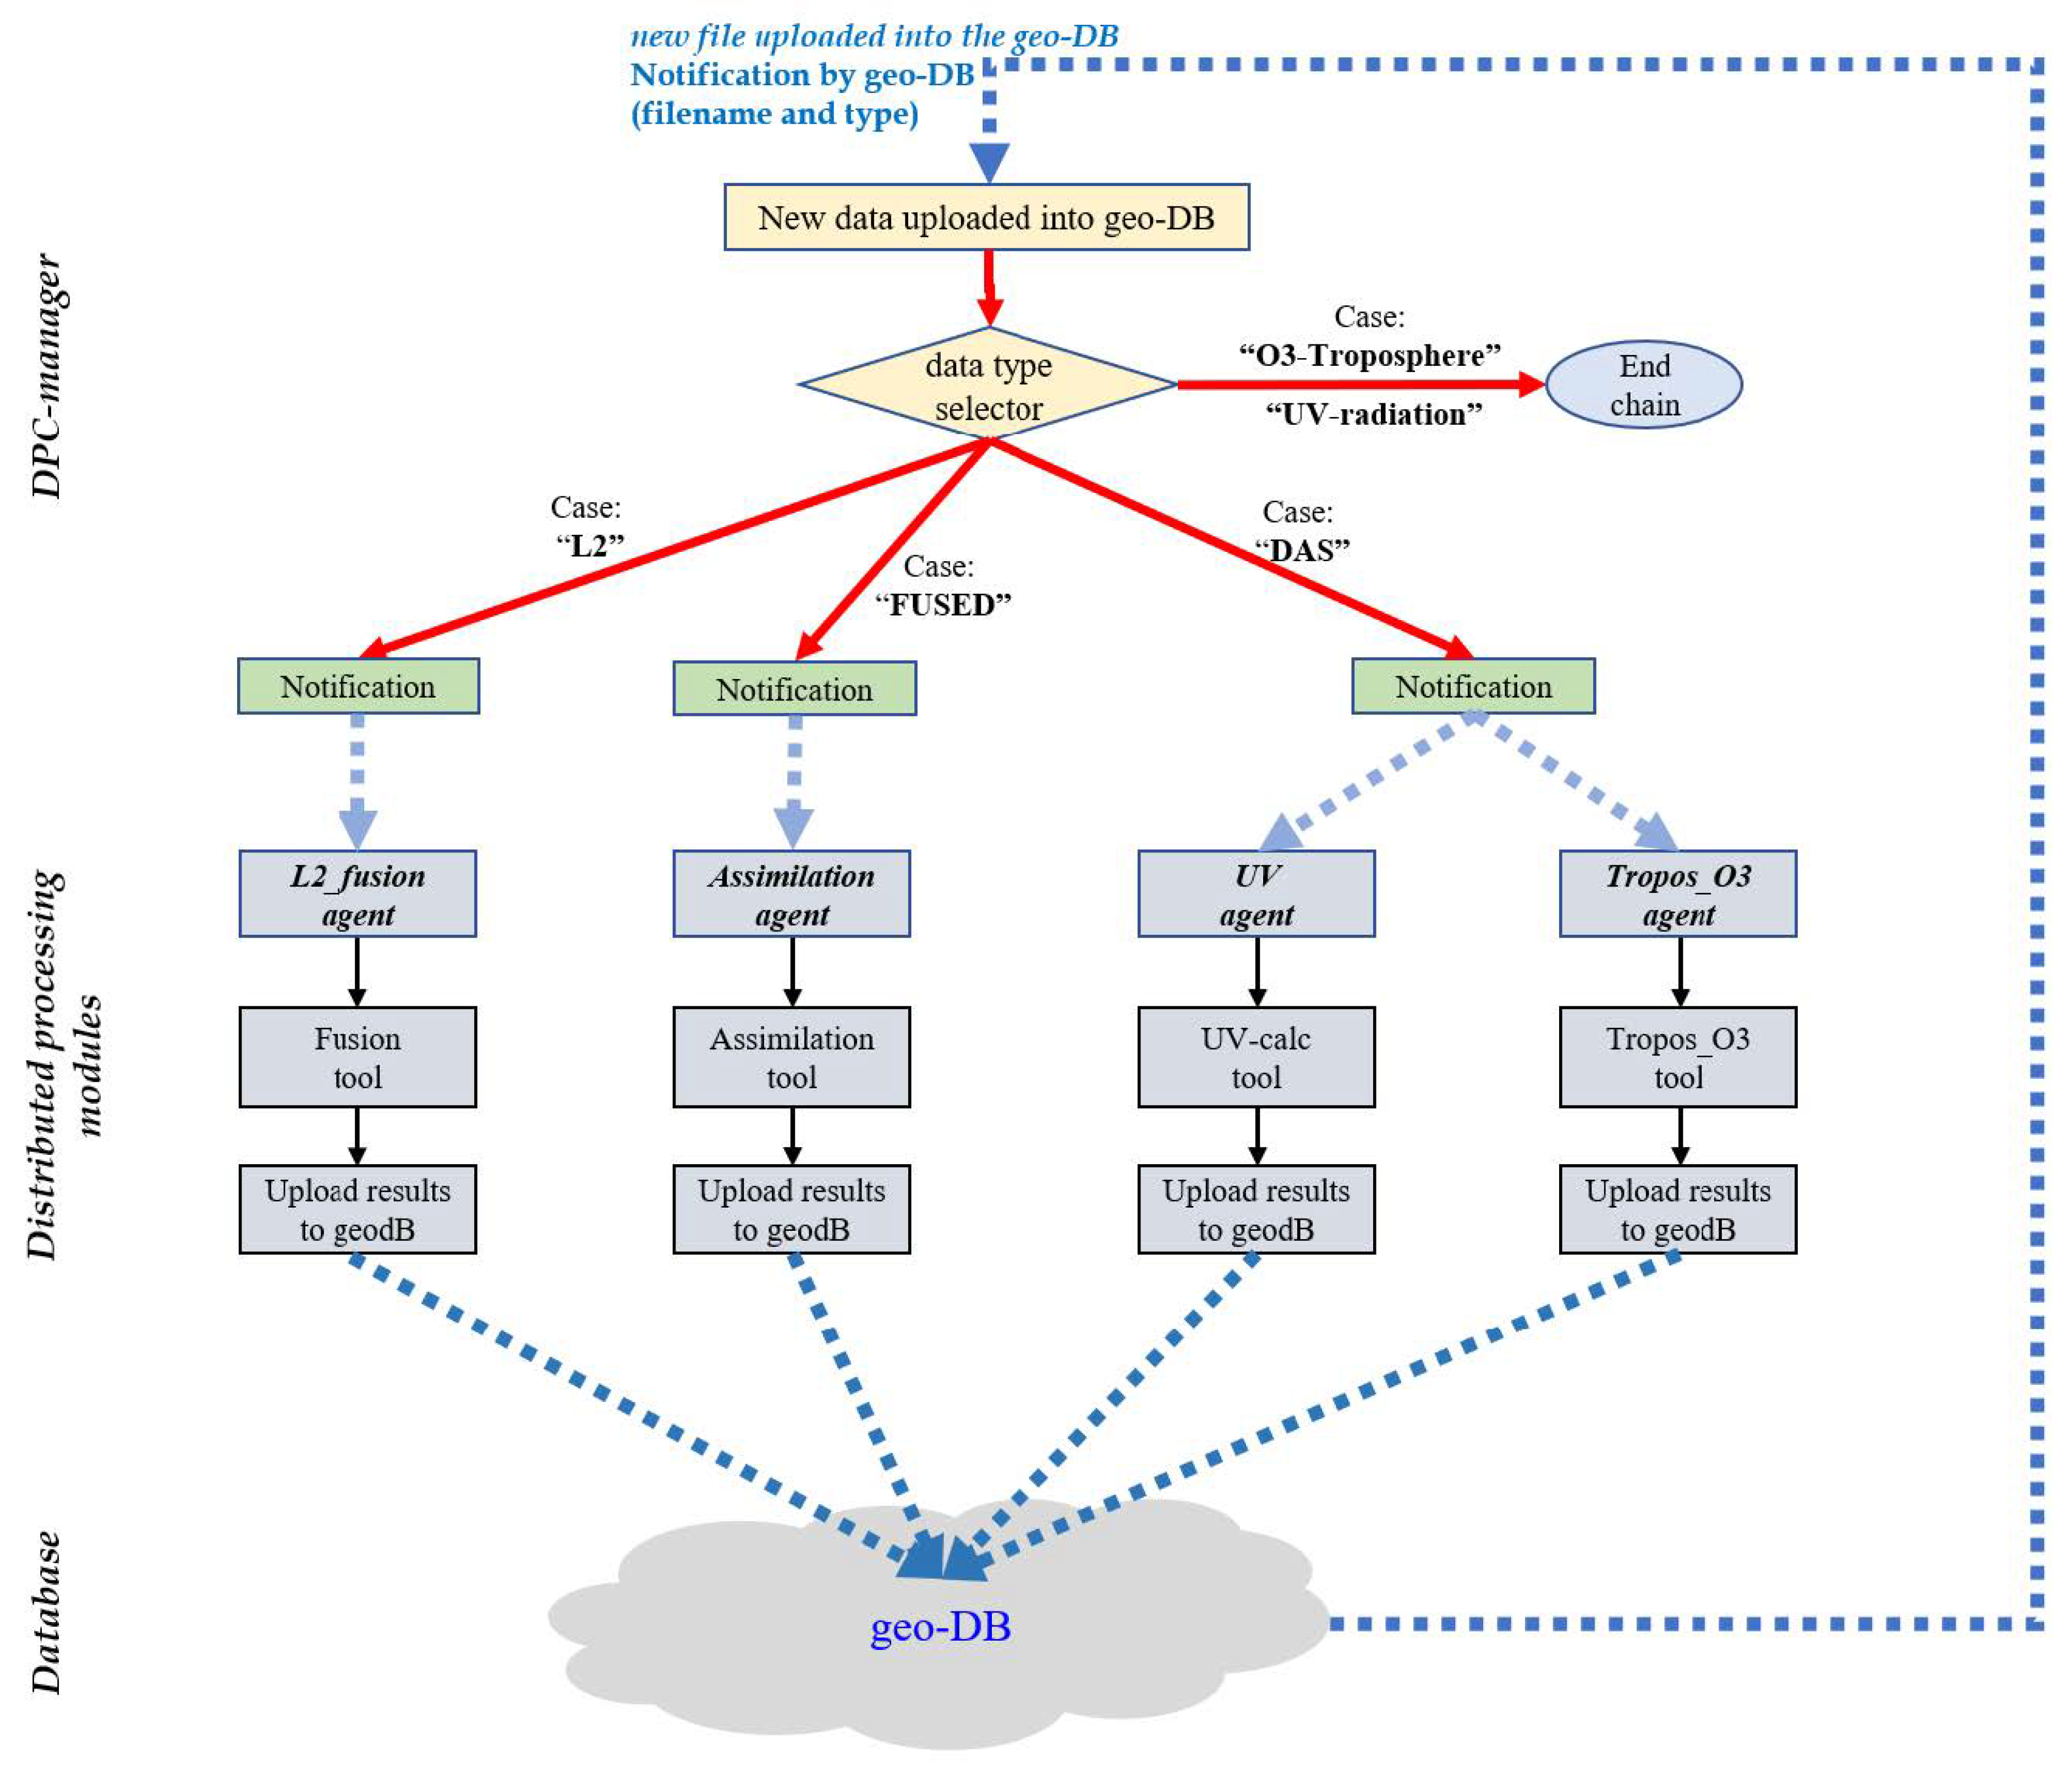
Figure 11 shows the high level flow-chart of the DPC-manager, with the description of its main functionalities.
When a new product file is uploaded into the geo-DB, it notifies to the DPC-manager the URL of the product (i.e., the name and address of the file in the geo-DB resource), the type of the product and the time (date, hour) to which it is referred. After receiving the notification from the geo-DB, the DPC-manager selects the specific processing module on the basis of the classification of the product type: L2 for level 2 products; FUSED for the products output of the Fusion; DAS for the products of the assimilation step; Tropospheric-ozone and UV-radiation for the output of the Tropospheric Ozone tool and UV-radiation calculation tool, respectively; see
Figure 11) and notifies to the agent included in the remote module that a new input file has been uploaded into the geo-DB and it is ready to be used for processing. After receiving the notification from the manager, the agent included in the remote module starts the data reading from the geo-DB and the processing; at the end of the process the output products are uploaded to the geo-DB.
5. The Prototype Data Processor: Proof of Processing
All the components of the DPC are assembled in a software prototype (the Prototype Data Processor -PDP), designed as a distributed data processing.
5.1. Prototype Configuration
The prototype is a modular supervised system following a distributed approach. Each module is independent from the others and can run at different premises; it reads the input data from the centralised database (the geo-DB, see
Section 4.1) by using the web-services provided by the technological infrastructure and, after the processing, uploads the products to the geo-DB for subsequent processing and storage. The supervisor tool (see
Section 4.4) manages the scheduling of the processing operations. The communication between the different tools is guaranteed by Celery, an asynchronous task queue/job based on distributed messages (see
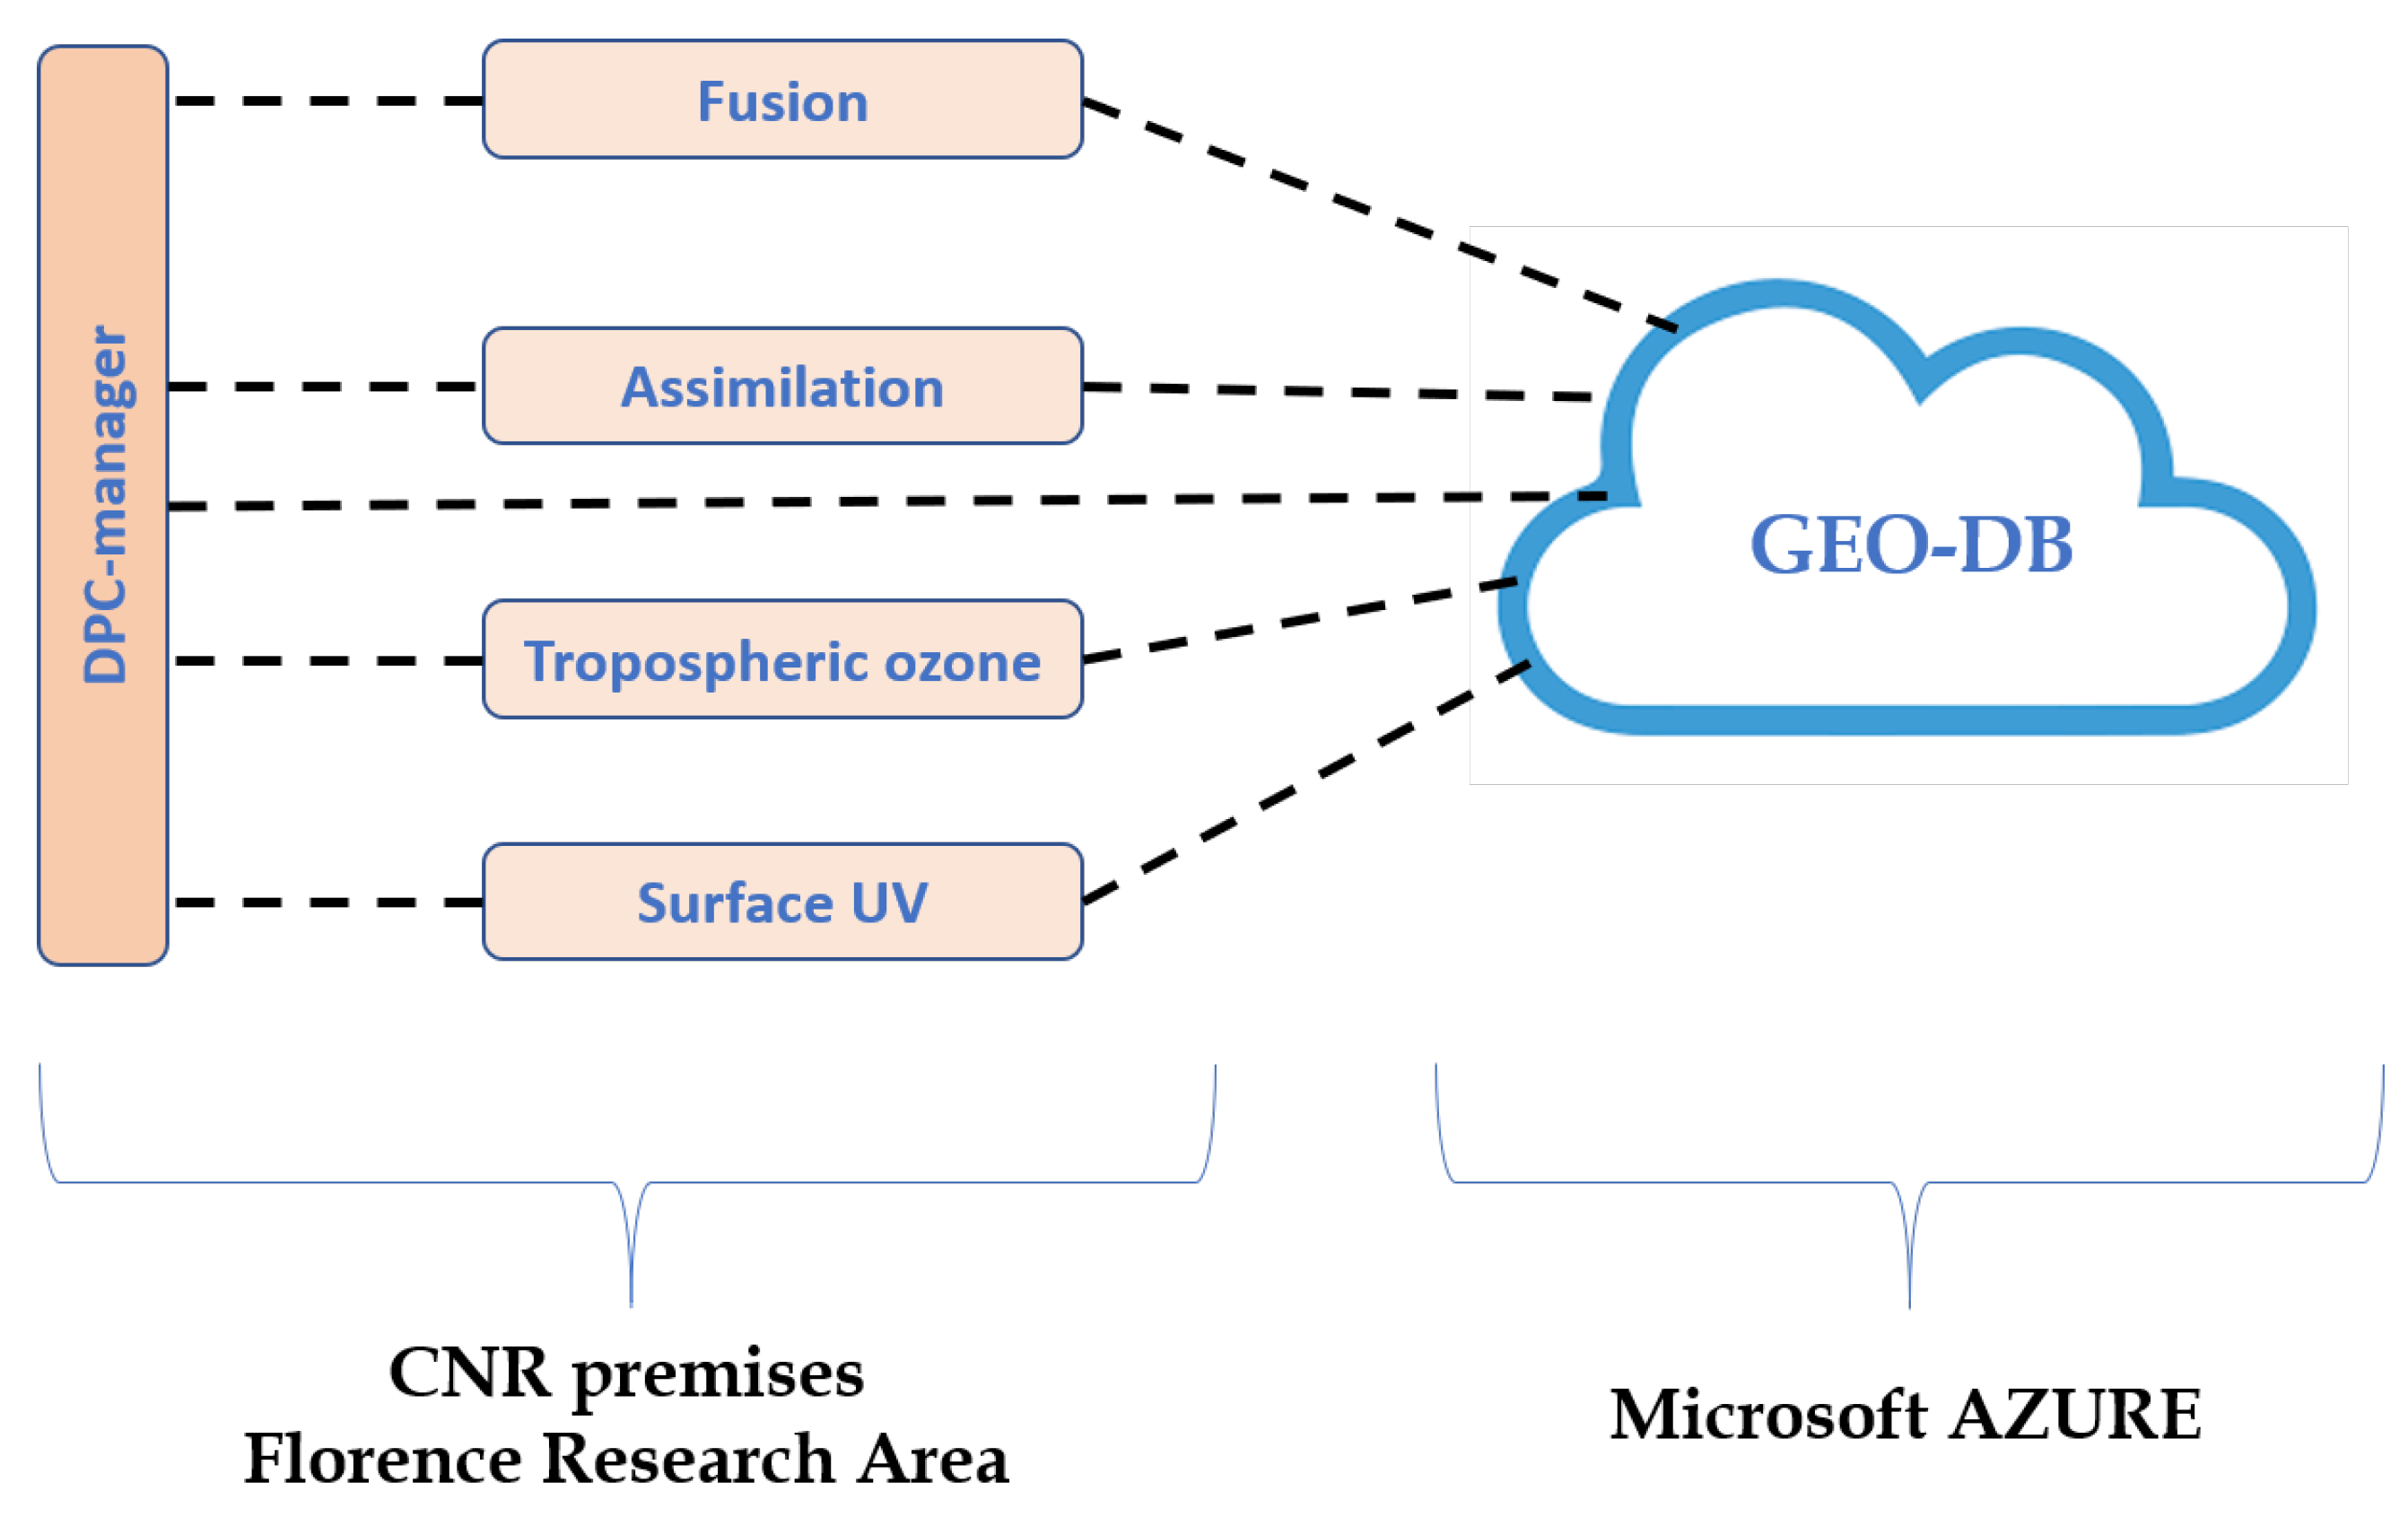
Section 4.2). The PDP is a key product of the AURORA project. The prototype is built with the geo-DB installed in the Microsoft Azure cloud infrastructure and the processing tools (including the DPC-manager supervisor) installed at CNR premises in dedicated servers located in the Florence Research Area (see
Figure 12).
5.2. Assessment of the Implemented Prototype Configuration
5.2.1. Assimilation System
In the assimilation experiment, PDP uses a DAS-emulator instead of the real assimilation system; the assimilation module is then composed by the assimilation-agent and the DAS-emulator tool. The use of the DAS-emulator in place of the real DAS reduces the complexity of the prototype and it does not degrade the meaning of the test on the infrastructure. The messages from the geo-DB as well as the data traffic in downloading from and uploading to the geo-DB are managed as it would be with the real DAS. From the point of view of the infrastructure there is no difference if, after the download of the input data, the DAS-tool performs the full computation or just waits the time requested and then uploads a pre-computed file product.
When the assimilation-agent receives from the DPC-manager the notification that a new fused product is available in the geo-DB, it reads all the fused input data from geo-DB via OPeNDAP and calls the TM5-emulator in place of the real DAS. Note that, even if the assimilation system is not integrated, the fused products are entirely read from geo-DB in order to mimic the realistic data traffic. The DAS-emulator basically consists in a timed loop (the time characteristic of the DAS computation); a file selector and an uploader tool. The emulator executes in sequence the following steps: waits for a fixed time consistent with the time required by TM5; selects a pre-computed DAS file from a dedicated database; uploads the file selected to geo-DB.
5.2.2. Distributed Processing
Despite the PDP being a modular system designed for a complete distributed processing (each tool can run on different machine in different location), the experiments for the performance assessments of the PDP are executed by running all the tools at the CNR premises; only the geo-DB is implemented in cloud. However, this configuration of the prototype does not degrade the meaning of the test on the infrastructure. Indeed, each tool, even if installed on the same computer, is independent from the others in terms of data location and connection to the geo-DB; the messages from the geo-DB to the manager and from the manager to the tool are addressed to independent queues; the data traffic, in downloading from and uploading to the geo-DB, is independent; local data storage is independent. In conclusion, from the point of view of the infrastructure we can consider the prototype configuration adequately representative of the distributed configuration proposed for the real analysis.
5.3. Experiment for the Automatic Execution of Data Processing
In order to test the capabilities and the performances of the technological infrastructure, PDP was used in a processing experiment consisting in the automatic execution of the full processing chain, from simulated level 2 to final AURORA products. The selected testing period is 10 days. The scheduling used for the L2 upload corresponds to a factor 30 in time scale; i.e., 1 “real” hour is processed in 2 min.
The flow of the operations is described below:
The L2 simulated data were uploaded to the geo-DB by using an automatic uploader procedure timed at 2 min. Every 2 min the uploader sent to the geo-DB a group of files related to one hour.
When a group of level 2 files were available, PDP automatically started the processing chain and executed in sequence fusion+column conversion, assimilation, calculation of tropospheric ozone and calculation of UV radiation (see
Section 3).
Intermediate products (fused L2 expressed in column) and final products (DAS output, tropospheric-ozone and UV-radiation at surface) were automatically uploaded to geo-DB.
This experiment is dedicated to the assessment and verification of the prototype from a technological point of view; the scientific verification of the processing tools as well as the quality assessment/validation of the related output products, are out of the scope of the present paper, but are reported in [
25].
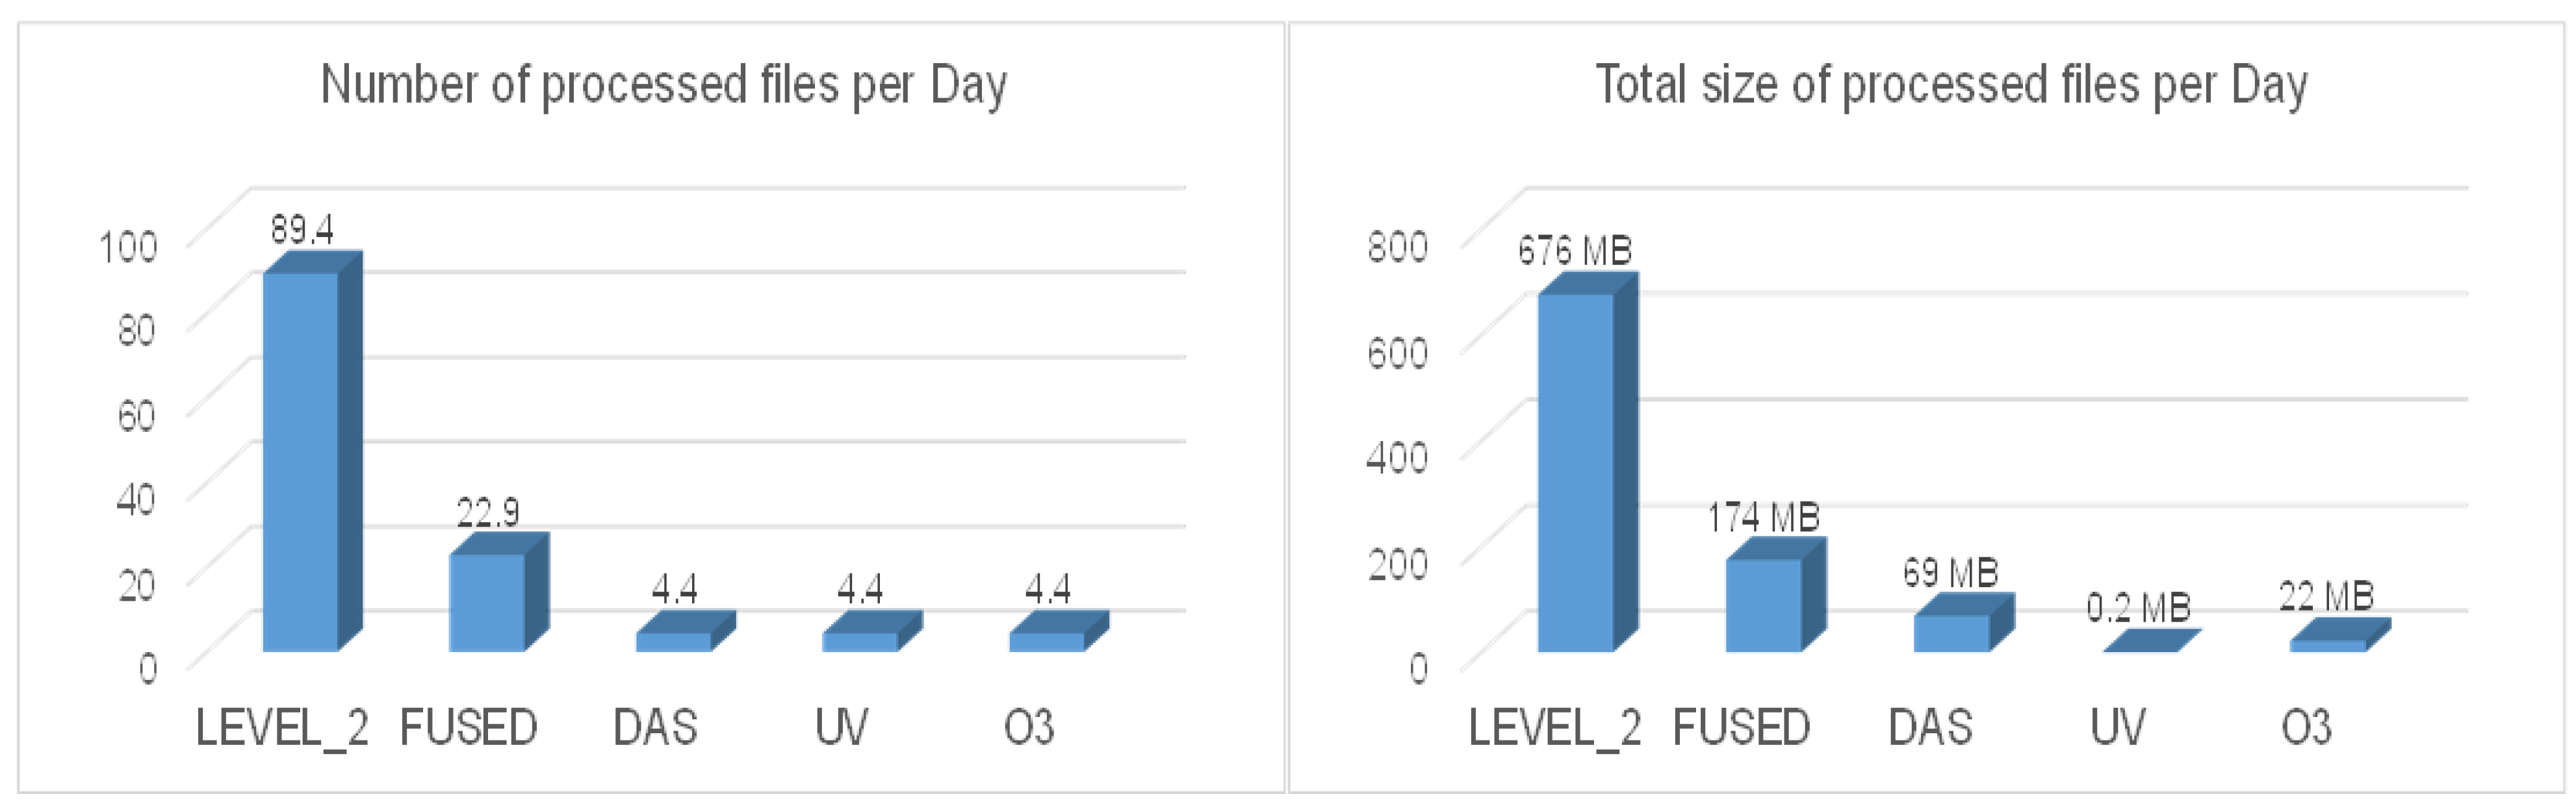
Figure 13 shows a summary of the processing information: the number of files processed per day and the size (in Mbytes) processed per day, detailed for all the steps of the processing chain. An important conclusion emerging from the experiment is the effect of data size reduction obtained by the first step of the processing chain; by using simulated data the size reduction is about a factor 4 in size. Indeed the Complete Data Fusion reduces the complexity of the data to analyze by the assimilation systems, both in terms of number of level 2 products and data size.
5.4. Discussion on the Prototype Configuration: Limitations and Perspectives
5.4.1. Prototype Configuration
The configuration of the prototype used to perform the experiment for the automatic execution of the full processing chain (
Section 5.3) is described in
Section 5.1. However, the solutions adopted for the technological infrastructure and the distributed approach make the infrastructure flexible to allow different configurations implementation, according to specific needs. For example, the database can be moved in a different location (transparent to the user); the processing modules can be used in a completely distributed configuration (each tool run is executed in a different machine, at different location) or all the processing chain can be executed in the same server.
The geo-DB originally runs on the OVH Cloud infrastructure and we performed several tests by using this cloud service. In the second part of the project, the geo-DB was moved to Microsoft Azure. The change was decided for commercial reasons only; from the technical point of view, we found similar performances when using OVH or Azure cloud infrastructure.
Each processing tool has been tested in all the functionalities (including communication with the DPC-manager as well as data download/upload from/to geo-DB) in different servers at different locations. In particular, each development team tested the tools at its premises during the development phase. Aside the hardware resources needed to run the process, there are no special server system requirements to run the processing tool: the only server system requirements are the python 3 environment (the DPC-agent is developed in python) and the Celery library.
The integration of a new processing tool in the prototype, needed for example for the calculation of a different product, requires a moderate effort and no modifications to the infrastructure. The DPC-agent is developed in python (other languages implementing Celery APIs are possible). No specific requirements are needed for the development language of the processing tools; the PDP in its current configuration integrates tool developed in fortran, matlab and python.
5.4.2. Size of Processed Data
The AURORA level 2 simulated files are filtered for project needs by a clear-sky selector and a spatial undersampling; the filtering reduces the level 2 input data size from about 1.4 GB per hour (in real condition) to about 30 MB per hour (in AURORA simulated conditions). The experiment described in
Section 5.3 on the full data processing (i.e., the complete processing chain) in dynamic conditions has been executed using the reduced (filtered) level 2 simulated dataset. Specific tests of the fusion process using level 2 not filtered files, including level 2 data download from geo-DB and fused product upload to geo-DB, indicate that the download of the full level 2 dataset needed for one hour of fusion takes about 7 min and the fusion process is performed in a time much less than an hour, giving a positive indication for the use of the AURORA technological infrastructure in a real data scenario.
5.4.3. Possible Fault of a Processing Tool
Since the processing chain is based on a push notification mechanism, the prototype is a fault tolerant system. The case of a fault of a processing tool, that can occur for different reasons (lack of input data, problems in network connections, crash of the processing tool, ….) results in a lack of notification from DPC-manager. If a DPC-agent does not receive the notification, the corresponding processing is not started; the processing chain continues with the available data only. A log file generated by the DPC-manager traces these cases and warns the user about a possible lack of products.
6. Conclusions
This paper proposes a technological infrastructure developed within the Horizon-2020 project AURORA. The infrastructure supported the scientific activity of the project and provides a suite of tools to implement a data processing chain dedicated to the analysis of the level 2 products of the Sentinel-4 and Sentinel-5 missions of the Copernicus programme. Starting from the level 2 Sentinel products, the AURORA analysis is organised in a sequence of operations until the final tropospheric ozone and UV radiation products, through fusion and assimilation processes.
The DPC infrastructure integrates cloud computing services and specific independent data processing tools. Each tool has been developed by different scientific teams (and project partners) and uses in general different programming languages; moreover, the data processing of each tool remains under the development team responsibility. All the data related to the processing (simulated level 2, intermediate and final products) are stored in a centralized database in the cloud (geo-DB).
The adopted technologies and the distributed approach make the infrastructure flexible: data can be moved in different locations (transparent to the user); the system can be used in a completely distributed configuration (each tool runs on a different machine at a different location) or with the full processing chain executed in the same server, according to the specific needs. The integration of a new processing tool requires a moderate effort and no modifications to the infrastructure. All the components of the data processing chain are assembled in a software prototype (PDP), designed as a distributed data processing, able to automatically execute the processing chain. By using simulated level 2 data, the prototype demonstrates the technical feasibility of the AURORA processing concept and achieves this goal by enforcing a replica of a system capable to work in an operational scenario.
The AURORA infrastructure was designed and developed for the specific applications of the project but uses general purpose technologies opening the way of different practices: ingestion of new data types (for example observations from ground stations, etc.), inclusion of new processing tools, application to a different data analysis context.
The presented PDP is classified as a product with a Technology Readiness Level (TRL) equal to 5, corresponding to “Technology validated in relevant environment”. Despite that the technological prototype is not demonstrated in operational condition, the storage scalability of the geo-DB and the tests executed by using simulated level 2 data of real size ensure that the infrastructure is robust enough for use with real data.
Author Contributions
Conceptualization, M.G. and A.M. and C.B. and N.Z. and F.B.; methodology, A.K. and J.-C.L. and A.A. and A.L. and O.T. and S.C. and C.T. and S.D.B.; software, V.F. and B.C. and M.G. and N.Z. and S.D.B. and C.B. and A.K. and A.L. and O.T.; writing—review and editing, M.G. and U.C. and S.C. and S.D.B. and C.T. and N.Z. and C.B. and A.L. and A.K. and O.T. and A.M.; supervision, U.C. and C.T. and M.G.; project administration, U.C. and C.T. and S.D.B.; funding acquisition, U.C. All authors have read and agreed to the published version of the manuscript.
Funding
The AURORA project is supported by the Horizon 2020 research and innovation program of the European Union (Call: H2020-EO-2015; Topic: EO-2-2015) under Grant Agreement No. 687428.
Institutional Review Board Statement
Not applicable.
Informed Consent Statement
Not applicable.
Data Availability Statement
The data used in this study are available on request from the corresponding author.
Acknowledgments
The AURORA Consortium gratefully acknowledges the valuable and constant support on the many aspects of the project provided by the members of the External Expert Advisory Board: Marina Khazova (Public Health England), William Lahoz (Norwegian Institute for Air Research), Alan O’Neill (University of Reading) and Dimitris Stathakis (University of Thessaly).
Conflicts of Interest
The authors declare no conflict of interest.
Abbreviations
The following abbreviations are used in this manuscript:
| AURORA | Advanced Ultraviolet Radiation and ozone Retrieval for Applications |
| CAMS | Copernicus Atmosphere Monitoring Service |
| CDF | Complete Data Fusion |
| CSW | Catalogue Service for Web |
| C3S | Copernicus Climate Change Service |
| DAS | Data Assimilation System |
| DPC | Data Processing Chain |
| ECMWF | European Centre for Medium-Range Weather Forecasts |
| FLT | Fixed-Level Tropopause |
| GEO | Geostationary Equatorial Orbit |
| H2020 | Horizon 2020 |
| KNMI | Koninklijk Nederlands Meteorologisch Instituut
(Royal Netherlands Meteorological Institut) |
| LEO | Low Earth Orbit |
| LRT | Lapse-Rate Tropopause |
| OGC | Open Geospatial Consortium |
| OPenDAP | Open-source Project for a Network Data Access Protocol |
| PDP | Prototype Data Processor |
| TIR | Thermal InfraRed |
| TRL | Technology Readiness Level (Horizon 2020 Programme) |
| URL | Uniform Resource Locator |
| UV | Ultra Violet |
| VIS | VISible |
| WMO | World Meteorological Organization |
| WCS | Web Coverage Service |
| WMS | Web Map Service |
References
- European Commission. Copernicus. Official Web Site of the Copernicus Programme. Available online: https://www.copernicus.eu/en (accessed on 22 October 2020).
- Cortesi, U.; Ceccherini, S.; Del Bianco, S.; Gai, M.; Tirelli, C.; Zoppetti, N.; Barbara, F.; Bonazountas, M.; Argyridis, A.; Bós, A.; et al. Advanced Ultraviolet Radiation and Ozone Retrieval for Applications (AURORA): A Project Overview. Atmosphere 2018, 9, 454. [Google Scholar] [CrossRef] [Green Version]
- European Commission. Copernicus Atmosphere Monitoring Service. Official Web Site of the Copernicus Atmosphere Monitoring Service. Available online: https://atmosphere.copernicus.eu/ (accessed on 22 October 2020).
- European Commission. Copernicus Climate Chage Service. Official Web Site of the Copernicus Climate Change Service. Available online: https://climate.copernicus.eu/ (accessed on 22 October 2020).
- Ceccherini, S.; Carli, B.; Raspollini, P. Equivalence of data fusion and simultaneous retrieval. Opt. Express 2015, 23, 8476–8488. [Google Scholar] [CrossRef] [PubMed]
- Tirelli, C.; Ceccherini, S.; Zoppetti, N.; Del Bianco, S.; Gai, M.; Barbara, F.; Cortesi, U.; Kujanp, J.; Huan, Y.; Dragani, R. Data Fusion Analysis of Sentinel-4 and Sentinel-5 Simulated Ozone Data. J. Atmos. Ocean. Technol. 2020, 37, 573–587. [Google Scholar] [CrossRef]
- Zoppetti, N.; Ceccherini, S.; Carli, B.; Del Bianco, S.; Gai, M.; Tirelli, C.; Barbara, F.; Dragani, R.; Arola, A.; Kujanpää, J.; et al. The Complete Data Fusion for a Full Exploitation of Copernicus Atmospheric Sentinel Level 2 Products. Atmos. Meas. Tech. 2019, 2019, 1–13. [Google Scholar] [CrossRef] [Green Version]
- Ceccherini, S.; Zoppetti, N.; Carli, B.; Cortesi, U.; Del Bianco, S.; Tirelli, C. The cost function of the data fusion process and its application. Atmos. Meas. Tech. 2019, 12, 2967–2977. [Google Scholar] [CrossRef] [Green Version]
- Ceccherini, S.; Carli, B.; Tirelli, C.; Zoppetti, N.; Del Bianco, S.; Cortesi, U.; Kujanpää, J.; Dragani, R. Importance of interpolation and coincidence errors in data fusion. Atmos. Meas. Tech. 2018, 11, 1009–1017. [Google Scholar] [CrossRef] [Green Version]
- OPeNDAP. Open-Source Project for a Network Data Access Protocol. Available online: https://www.opendap.org/ (accessed on 22 October 2020).
- Open Geospatial Consortium (OGC). Available online: https://www.ogc.org/ (accessed on 22 October 2020).
- Microsoft Azure. Linux FUSE Adapter for Blob Storage. Microsoft Azure official Web Site. Available online: https://azure.microsoft.com/it-it/blog/linux-fuse-adapter-for-blob-storage (accessed on 22 October 2020).
- Celery Official Web Site of the Celery Project. Available online: https://docs.celeryproject.org (accessed on 22 October 2020).
- Sanfilippo, S. REDIS. Official Web Site of the Redis Project. Available online: https://redis.io/ (accessed on 22 October 2020).
- Krol, M.; Houweling, S.; Bregman, B.; van den Broek, M.; Segers, A.; van Velthoven, P.; Peters, W.; Dentener, F.; Bergamaschi, P. The two-way nested global chemistry-transport zoom model TM5: Algorithm and applications. Atmos. Chem. Phys. 2005, 5. [Google Scholar] [CrossRef] [Green Version]
- Huijnen, V.; Williams, J.; van Weele, M.; van Noije, T.; Krol, M.; Dentener, F.; Segers, A.; Houweling, S.; Peters, W.; de Laat, J.; et al. The global chemistry transport model TM5: Description and evaluation of the tropospheric chemistry version 3.0. Geosci. Model Dev. 2010, 3, 445–473. [Google Scholar] [CrossRef] [Green Version]
- Eskes, H.J.; van Velthoven, P.F.J.; Valks, P.J.M.; Kelder, H.M. Assimilation of GOME total ozone satellite observations in a three-dimensional tracer transport model. Q. J. Roy. Meteor. Soc. 2003, 129, 1663–1681. [Google Scholar] [CrossRef]
- Prather, M.J. Numerical advection by conservation of second-order moments. J. Geophys. Res. 1986, 91, 6671–6681. [Google Scholar] [CrossRef] [Green Version]
- WMO. Meteorology—A three-dimensional science. WMO Bull. 1957, 230, 134–138. [Google Scholar]
- Reichler, T.; Dameris, M.; Sausen, R. Determining the tropopause height from gridded data. Geophys. Res. Lett. 2003, 30. [Google Scholar] [CrossRef] [Green Version]
- Keppens, A.; Compernolle, S.; Verhoelst, T.; Hubert, D.; Lambert, J.C. Harmonization and comparison of vertically resolved atmospheric state observations: Methods, effects, and uncertainty budget. Atmos. Meas. Tech. 2019, 12, 4379–4391. [Google Scholar] [CrossRef] [Green Version]
- CF Convention. NetCDF Climate and Forecast (CF) Metadata Conventions. Available online: https://http://cfconventions.org/index.html/ (accessed on 22 October 2020).
- Lipponen, A.; Ceccherini, S.; Cortesi, U.; Gai, M.; Keppens, A.; Masini, A.; Simeone, E.; Tirelli, C.; Arola, A. Advanced Ultraviolet Radiation and Ozone Retrieval for Applications—Surface Ultraviolet Radiation Products. Atmosphere 2020, 11, 324. [Google Scholar] [CrossRef] [Green Version]
- Emde, C.; Buras-Schnell, R.; Kylling, A.; Mayer, B.; Gasteiger, J.; Hamann, U.; Kylling, J.; Richter, B.; Pause, C.; Dowling, T.; et al. The libradtran software package for radiative transfer calculations (version 2.0.1). Geosci. Model Dev. 2016, 9, 1647–1672. [Google Scholar] [CrossRef] [Green Version]
- Keppens, A. Final Performance Assessment Report for the AURORA Ozone and UV Fusion Procedures and Resulting Fused Products. 2019. Available online: https://cordis.europa.eu/project/id/687428/it/ (accessed on 7 January 2021).
| Publisher’s Note: MDPI stays neutral with regard to jurisdictional claims in published maps and institutional affiliations. |
© 2021 by the authors. Licensee MDPI, Basel, Switzerland. This article is an open access article distributed under the terms and conditions of the Creative Commons Attribution (CC BY) license (http://creativecommons.org/licenses/by/4.0/).

 ,
, 


