Detection of Tailings Dams Using High-Resolution Satellite Imagery and a Single Shot Multibox Detector in the Jing–Jin–Ji Region, China

 ,
,  , ,
, ,  and
and
Abstract
:
1. Introduction
2. Study Area and Satellite Data
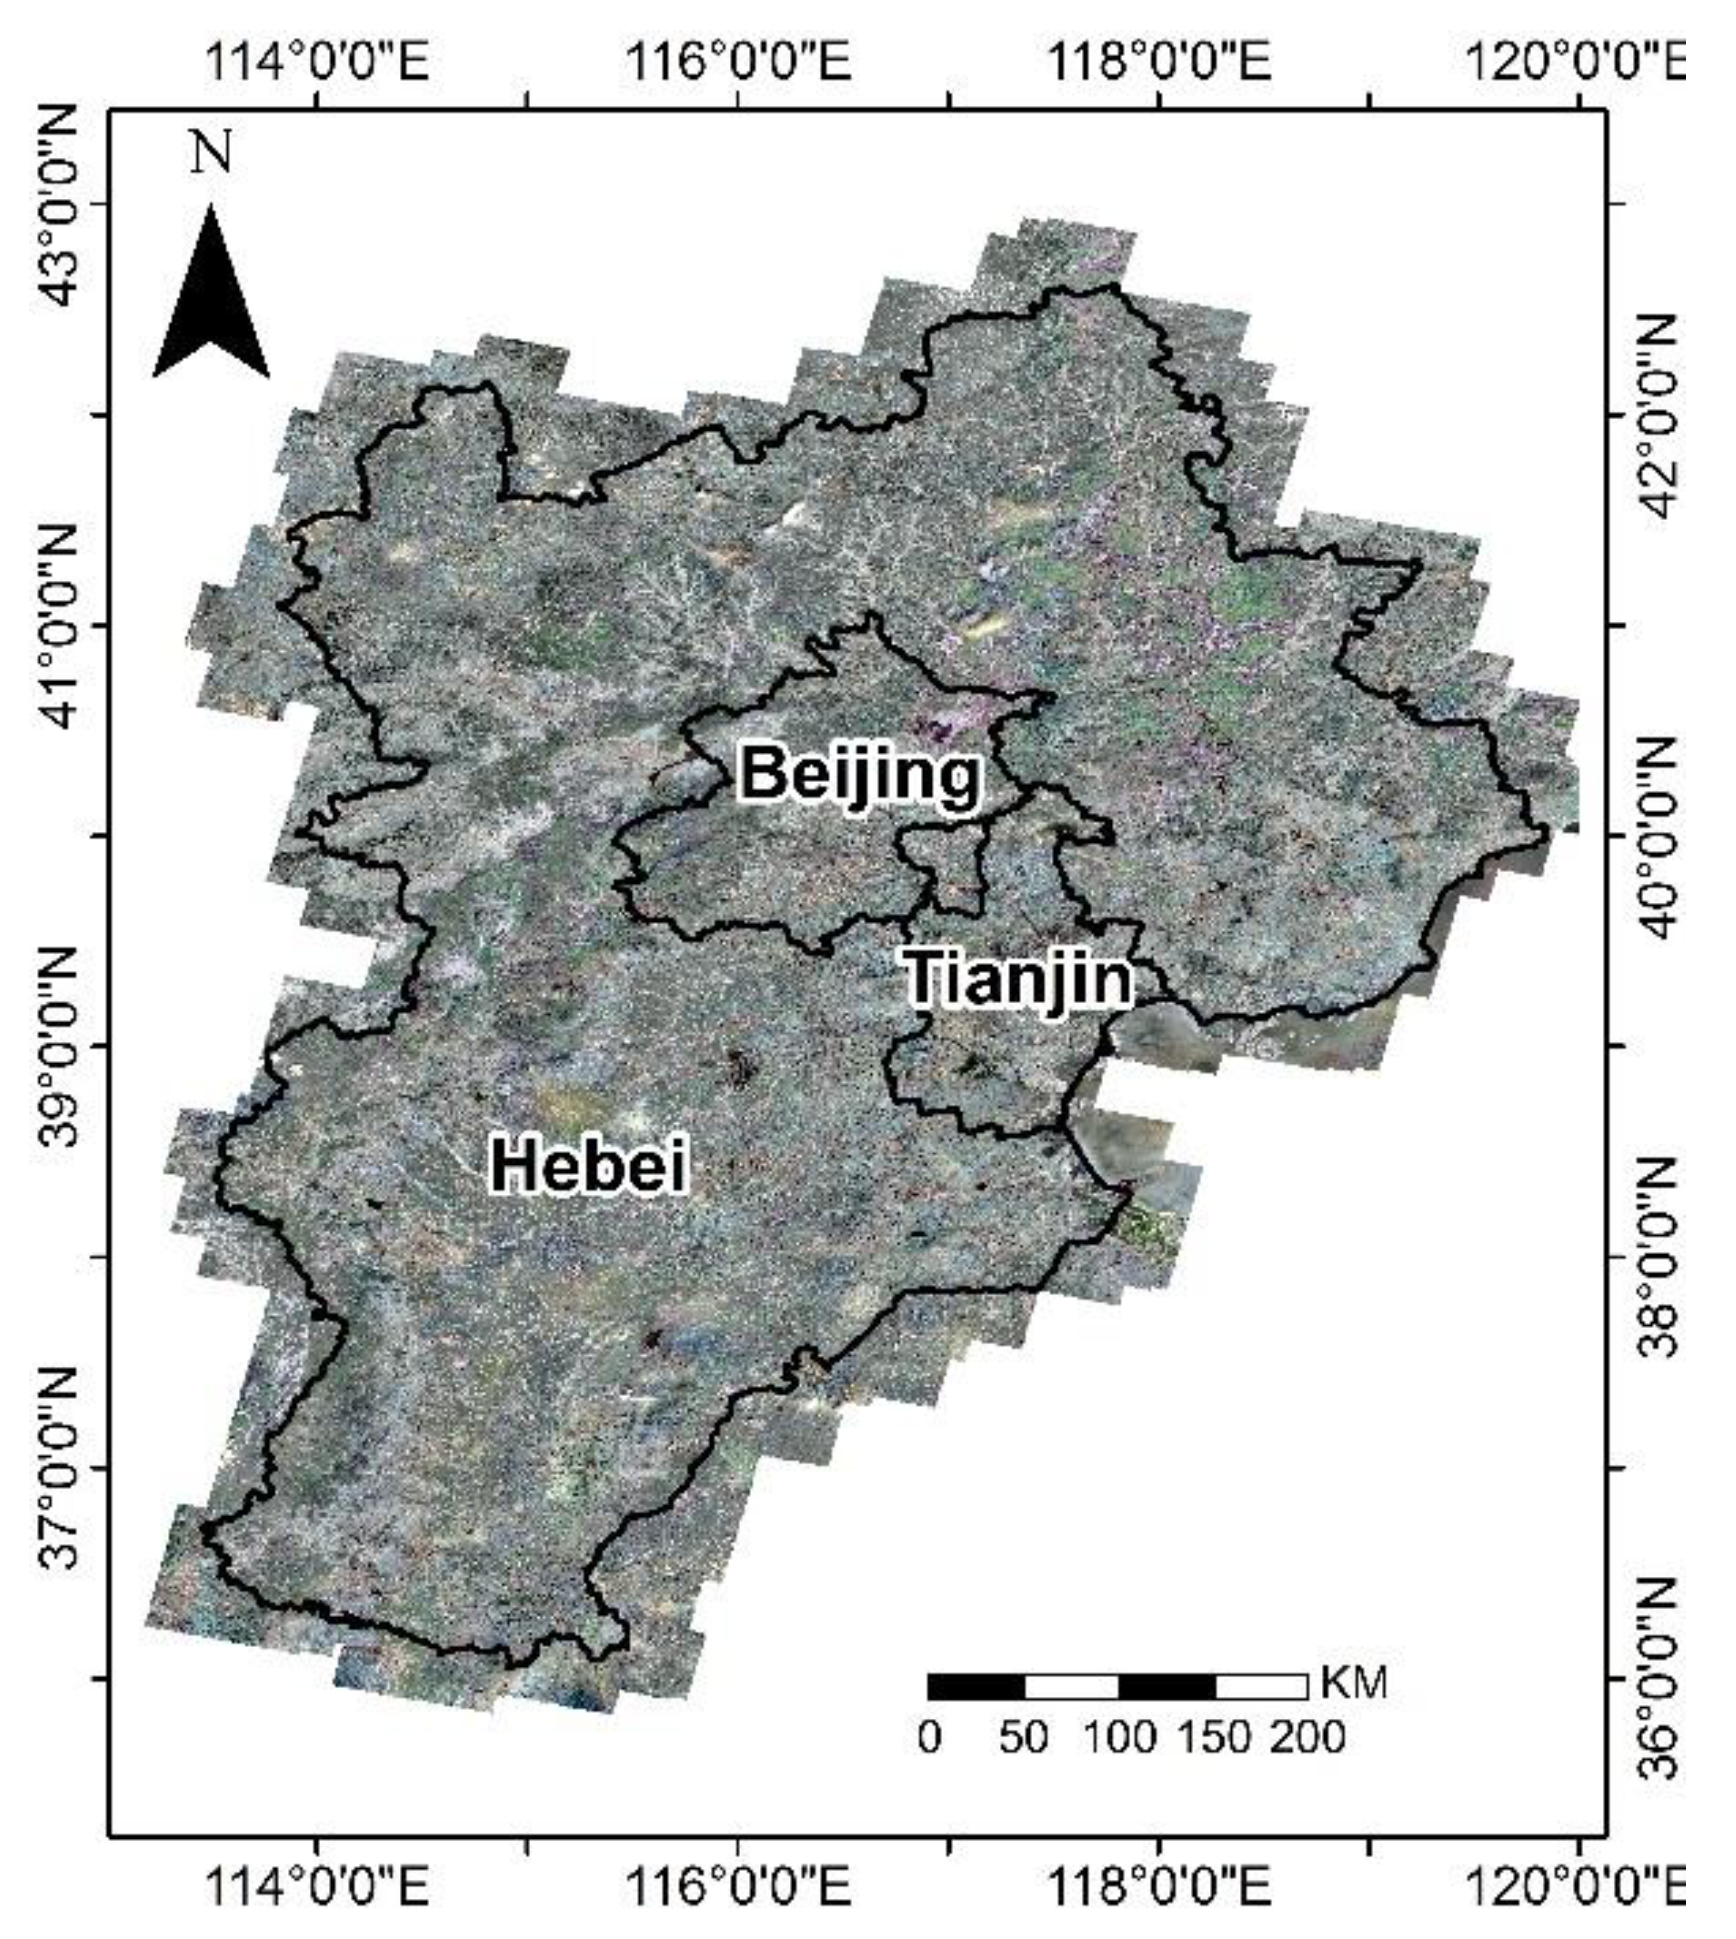
2.1. Study Area
2.2. Satellite Data
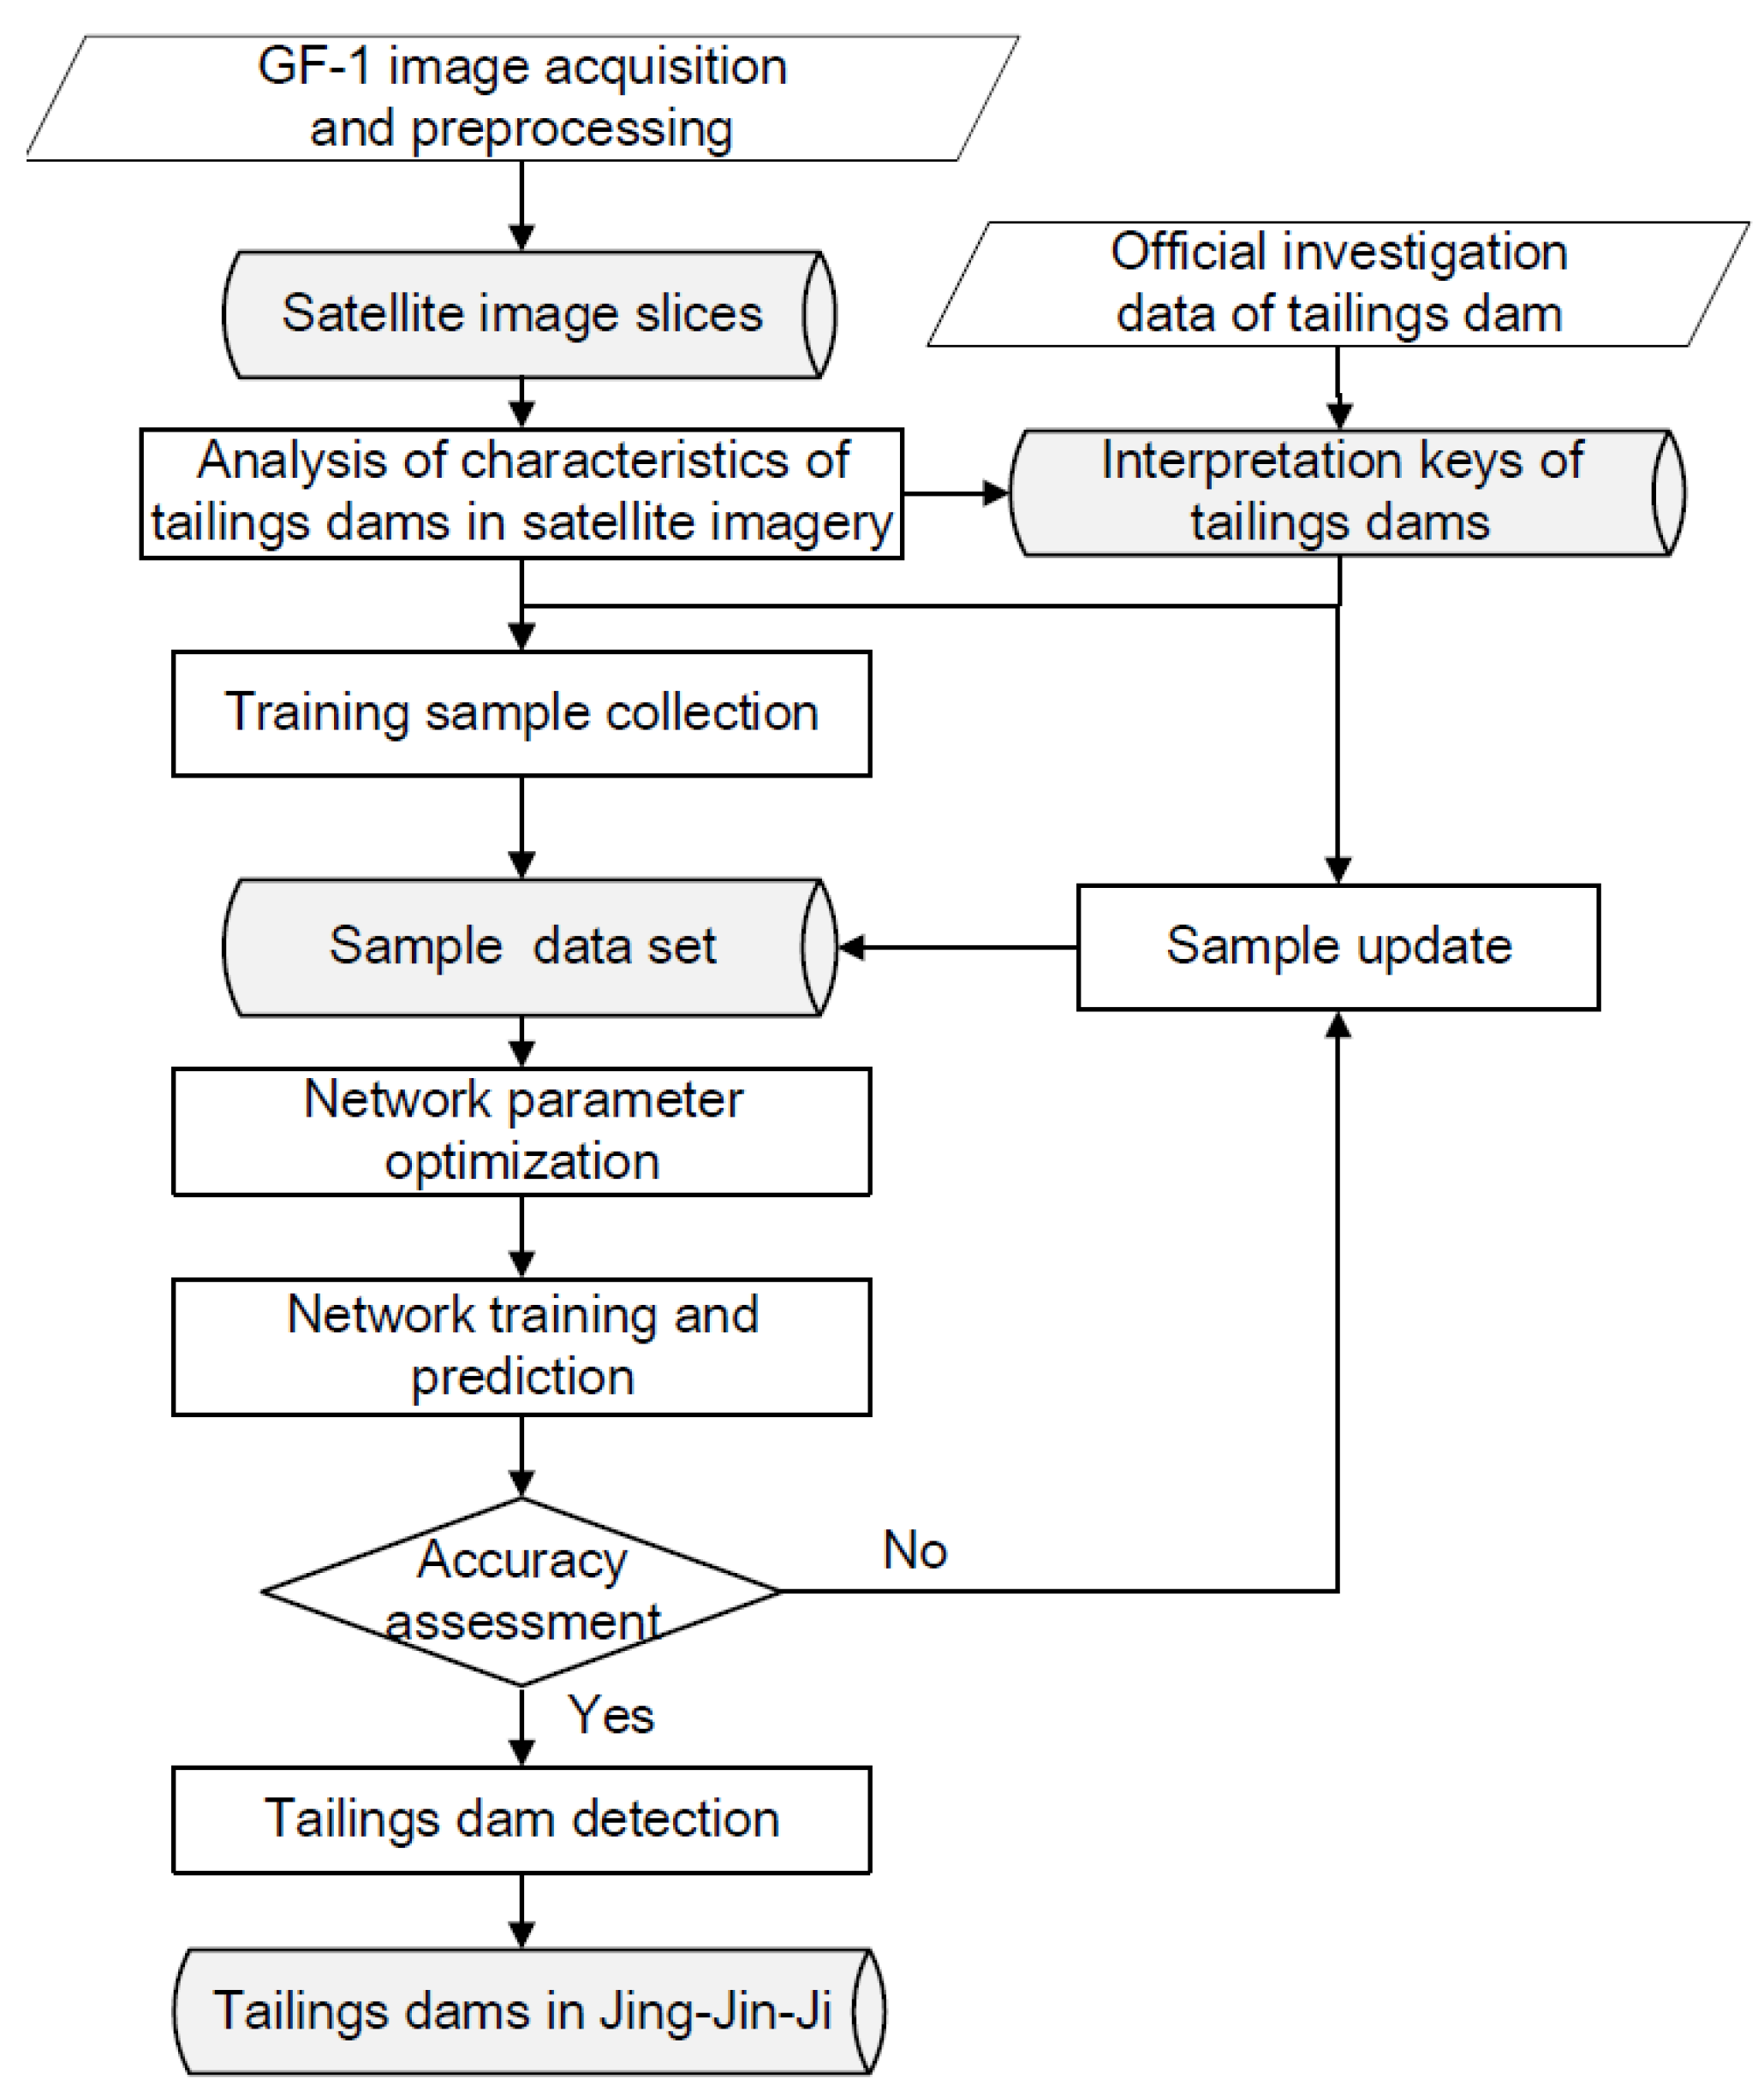
3. Methodology
3.1. Data Preprocessing
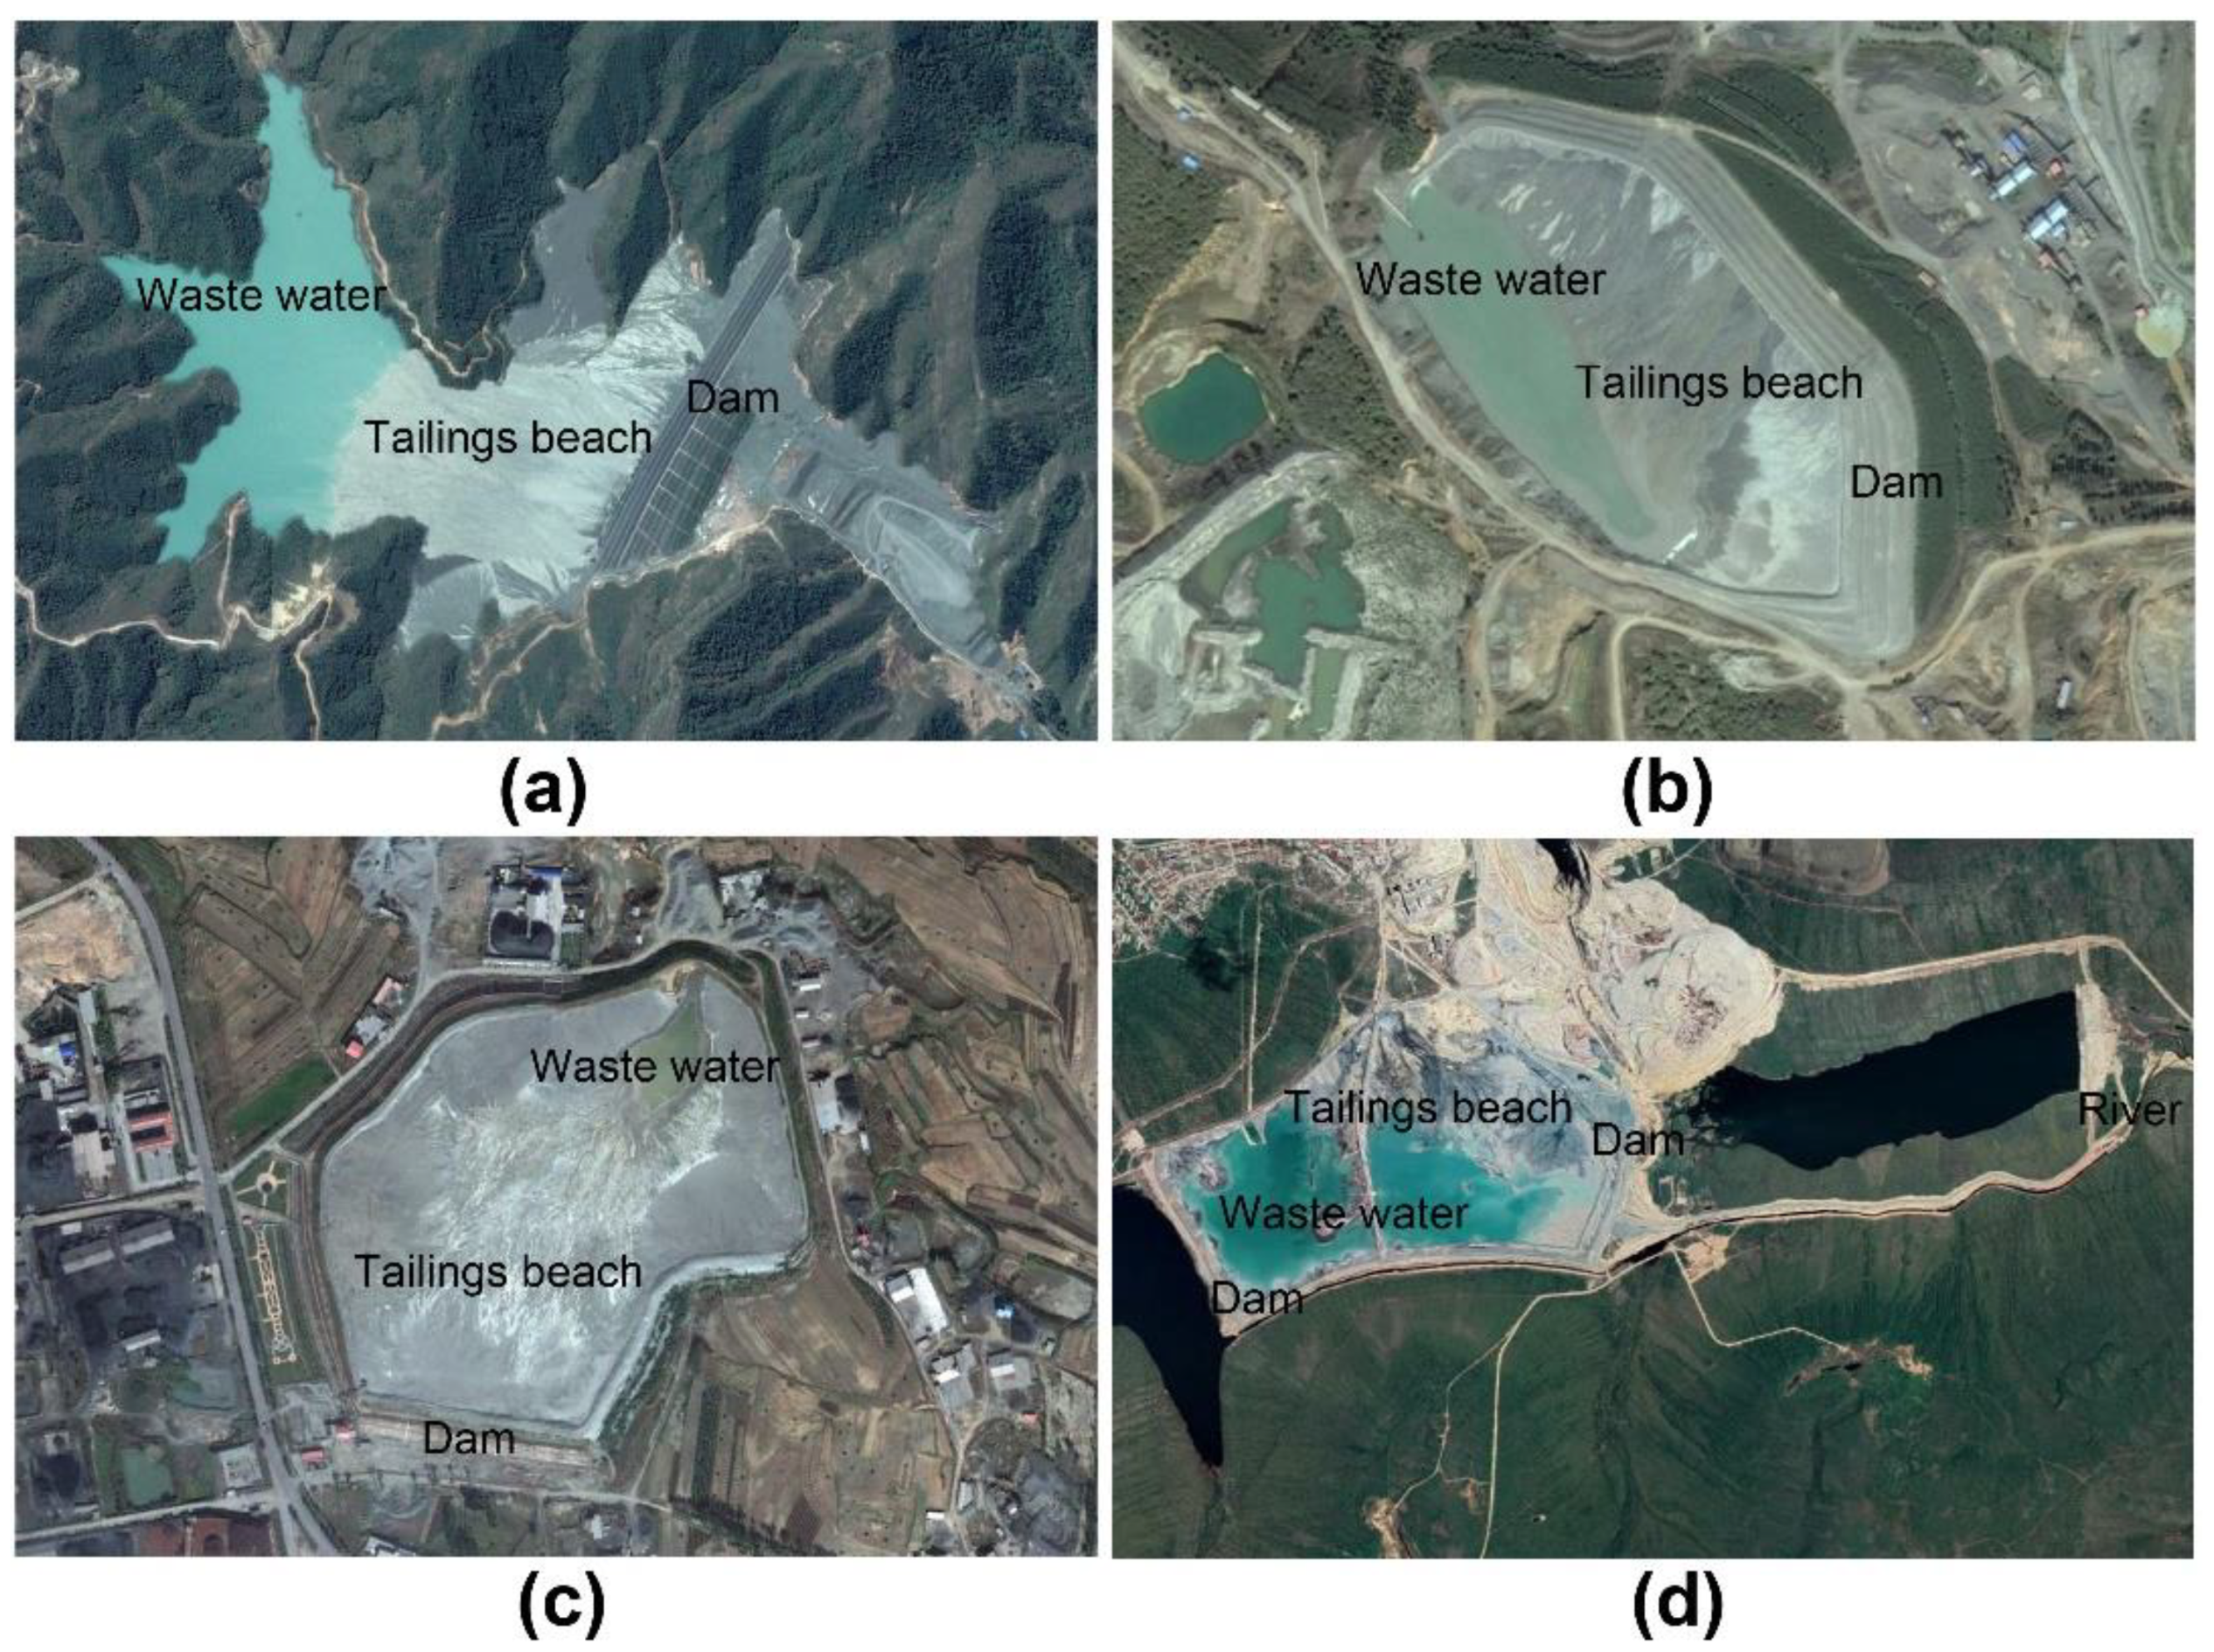
3.2. Characteristics of Tailings Dams in Satellite Imagery
3.3. Sample Preparation
- (1)
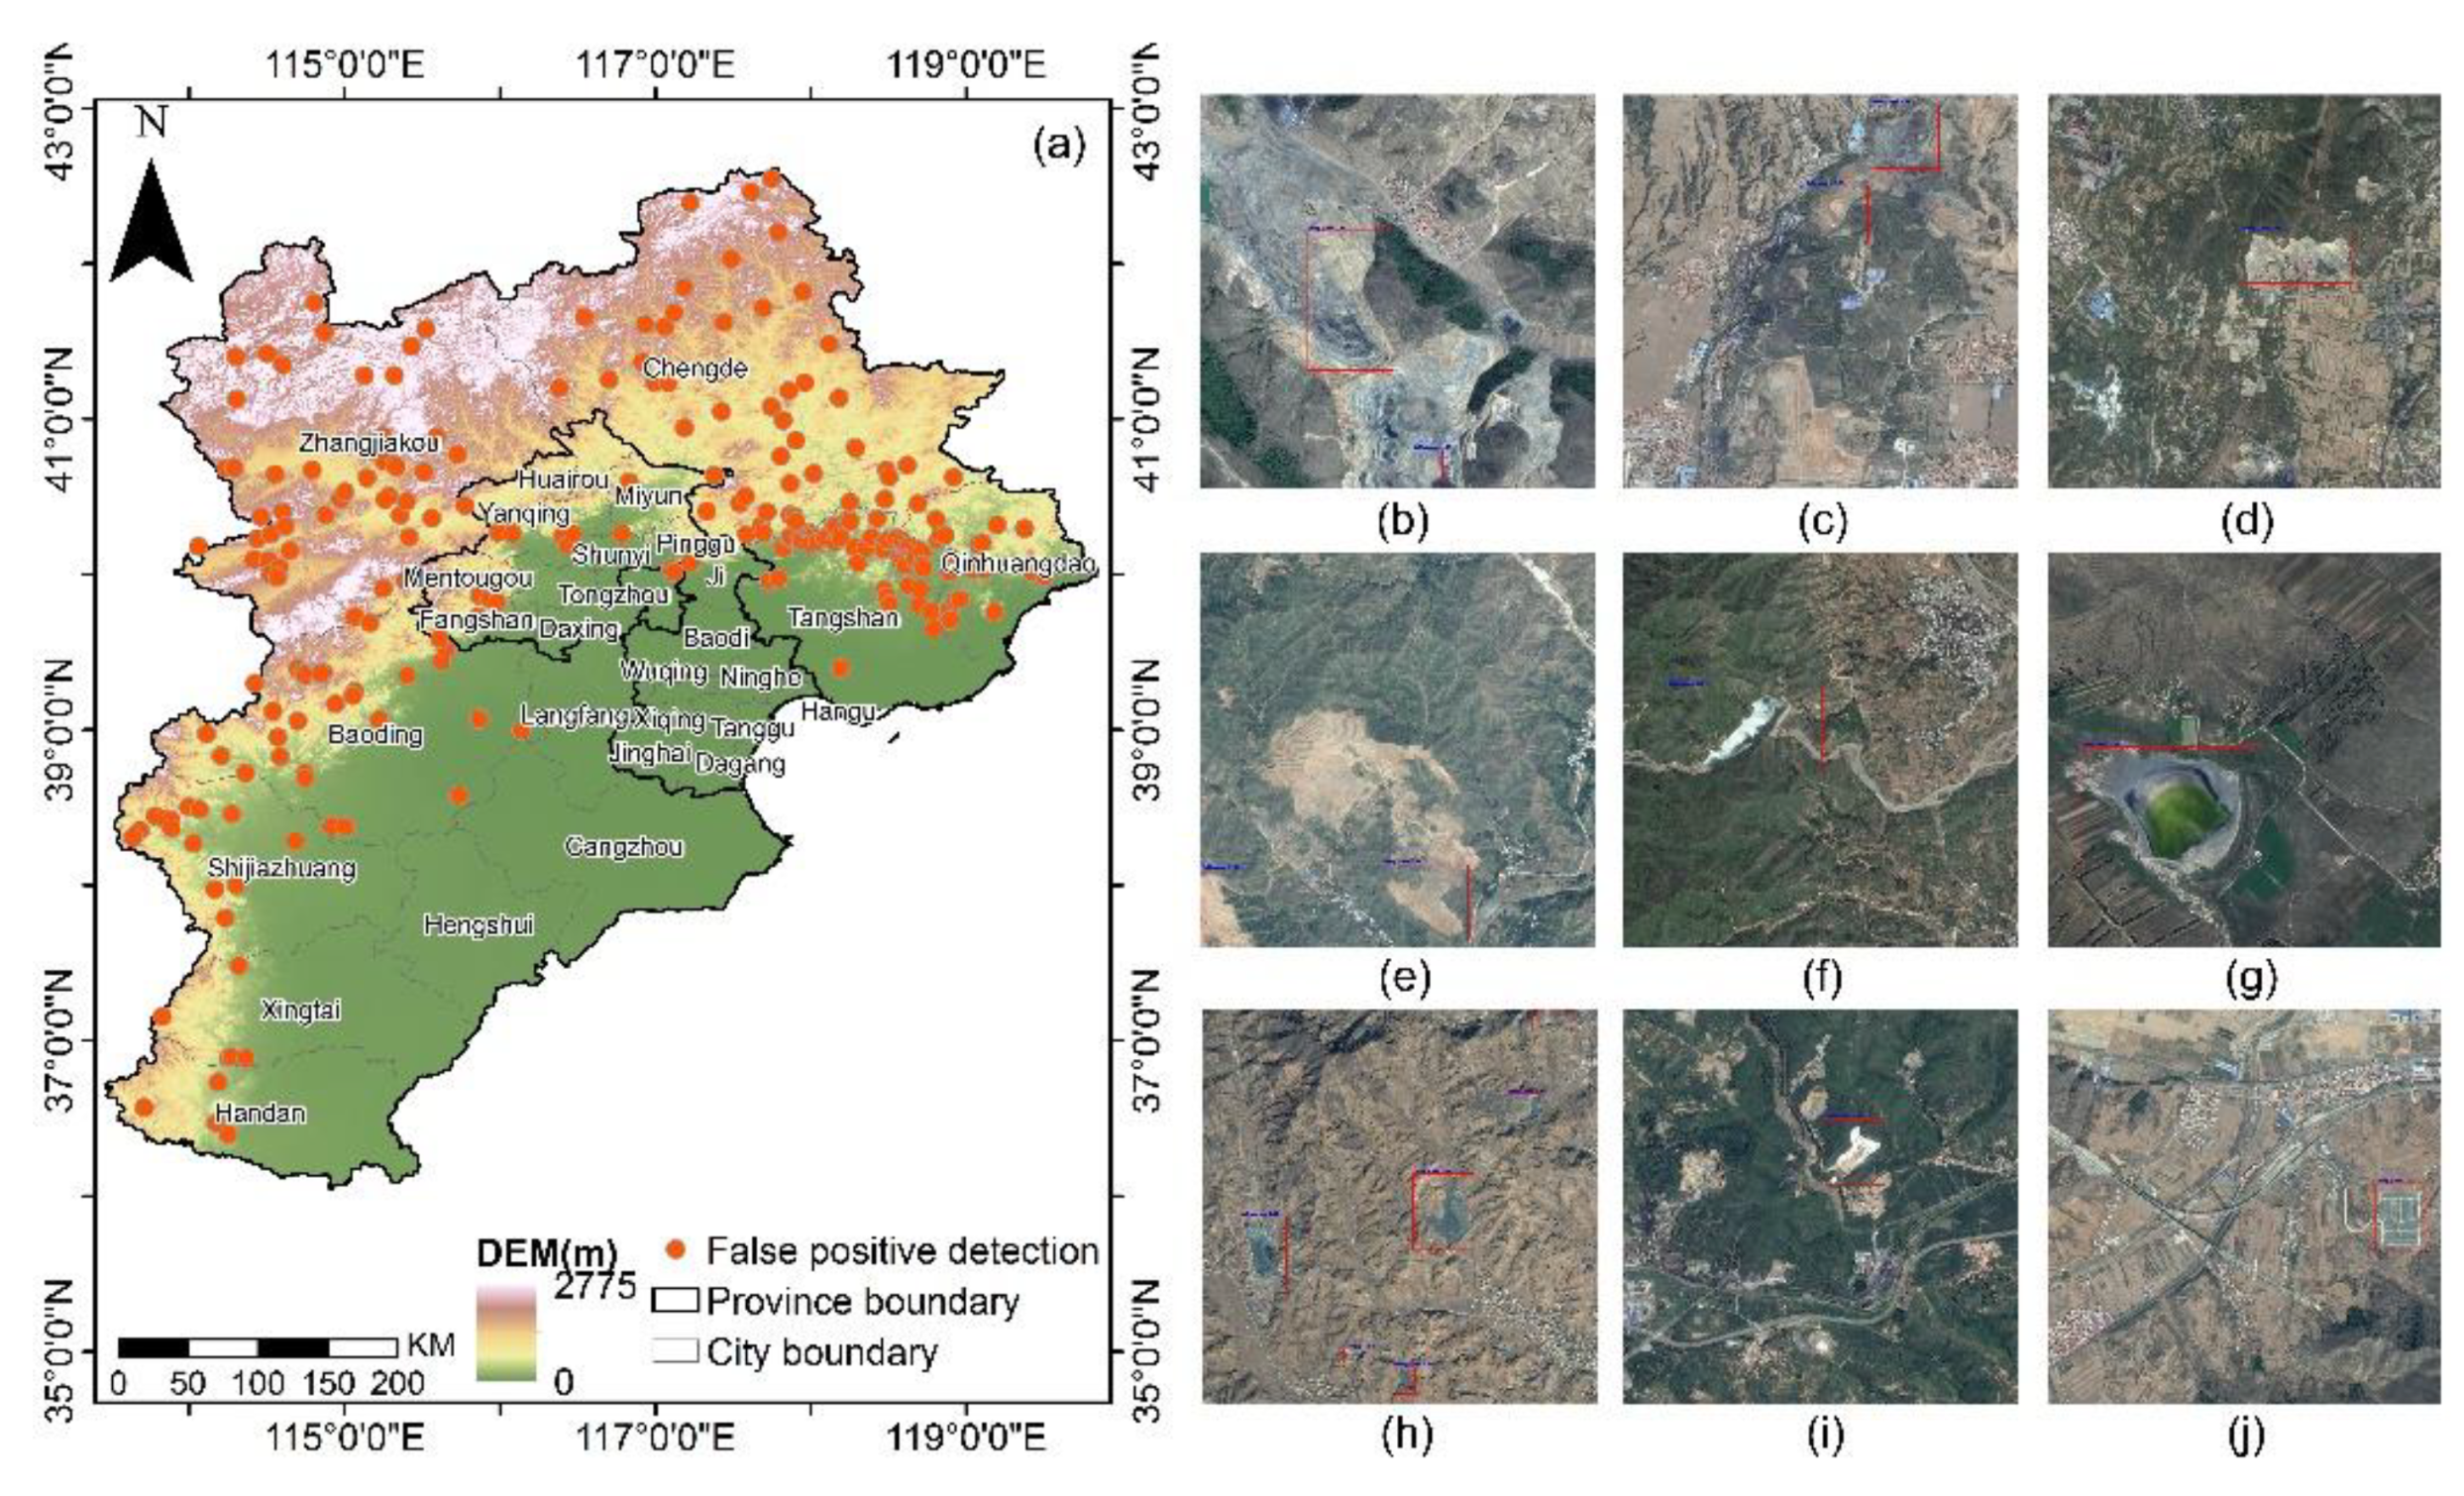
- Negative samples related to mining activities. This kind of object mainly includes mining pit, mining field, waste rock dump, and so on. Since their hue, texture, and shape are similar to those of tailings ponds, they are often mistakenly detected.
- (2)
- Water reservoir. The color of the water reservoir is similar to the color of the wastewater of tailings ponds. The shape of water reservoir is comparable to that of cross-valley tailings ponds. Especially the water surface of reservoirs is frozen in winter, showing brightness similar to those of tailings pond. Despite these similarities, the dam in the case of the tailings pond is wide and exhibits stacking layers, and generally shows radial and gradual textural characteristics of tailings discharge which can be captured by the feature maps of the deep network. In contrast, water reservoirs and ponds generally contain a narrow dam, and the water body has relatively uniform hue and texture.
- (3)
- Bare land. The reservoir area of inactive tailings ponds only contains a tailings beach with no or a small water area. Bare land in dry or small reservoirs and ponds is similar to the tailings of inactive tailings ponds in terms of shape, texture, and other characteristics, and thus, can cause large false detection. Tailings ponds are usually near the mining area and concentrator facilities. Using the contextual information, negative samples of bare land or dry reservoirs were selected.
- (4)
- Cloud. Cloud clusters in remote sensing images can be easily distinguished from tailing ponds during sample preparation. However, their hue, shape, and other characteristics are similar to those of white or gray-white color tailings. Some of them tend to be incorrectly detected as tailings dams.
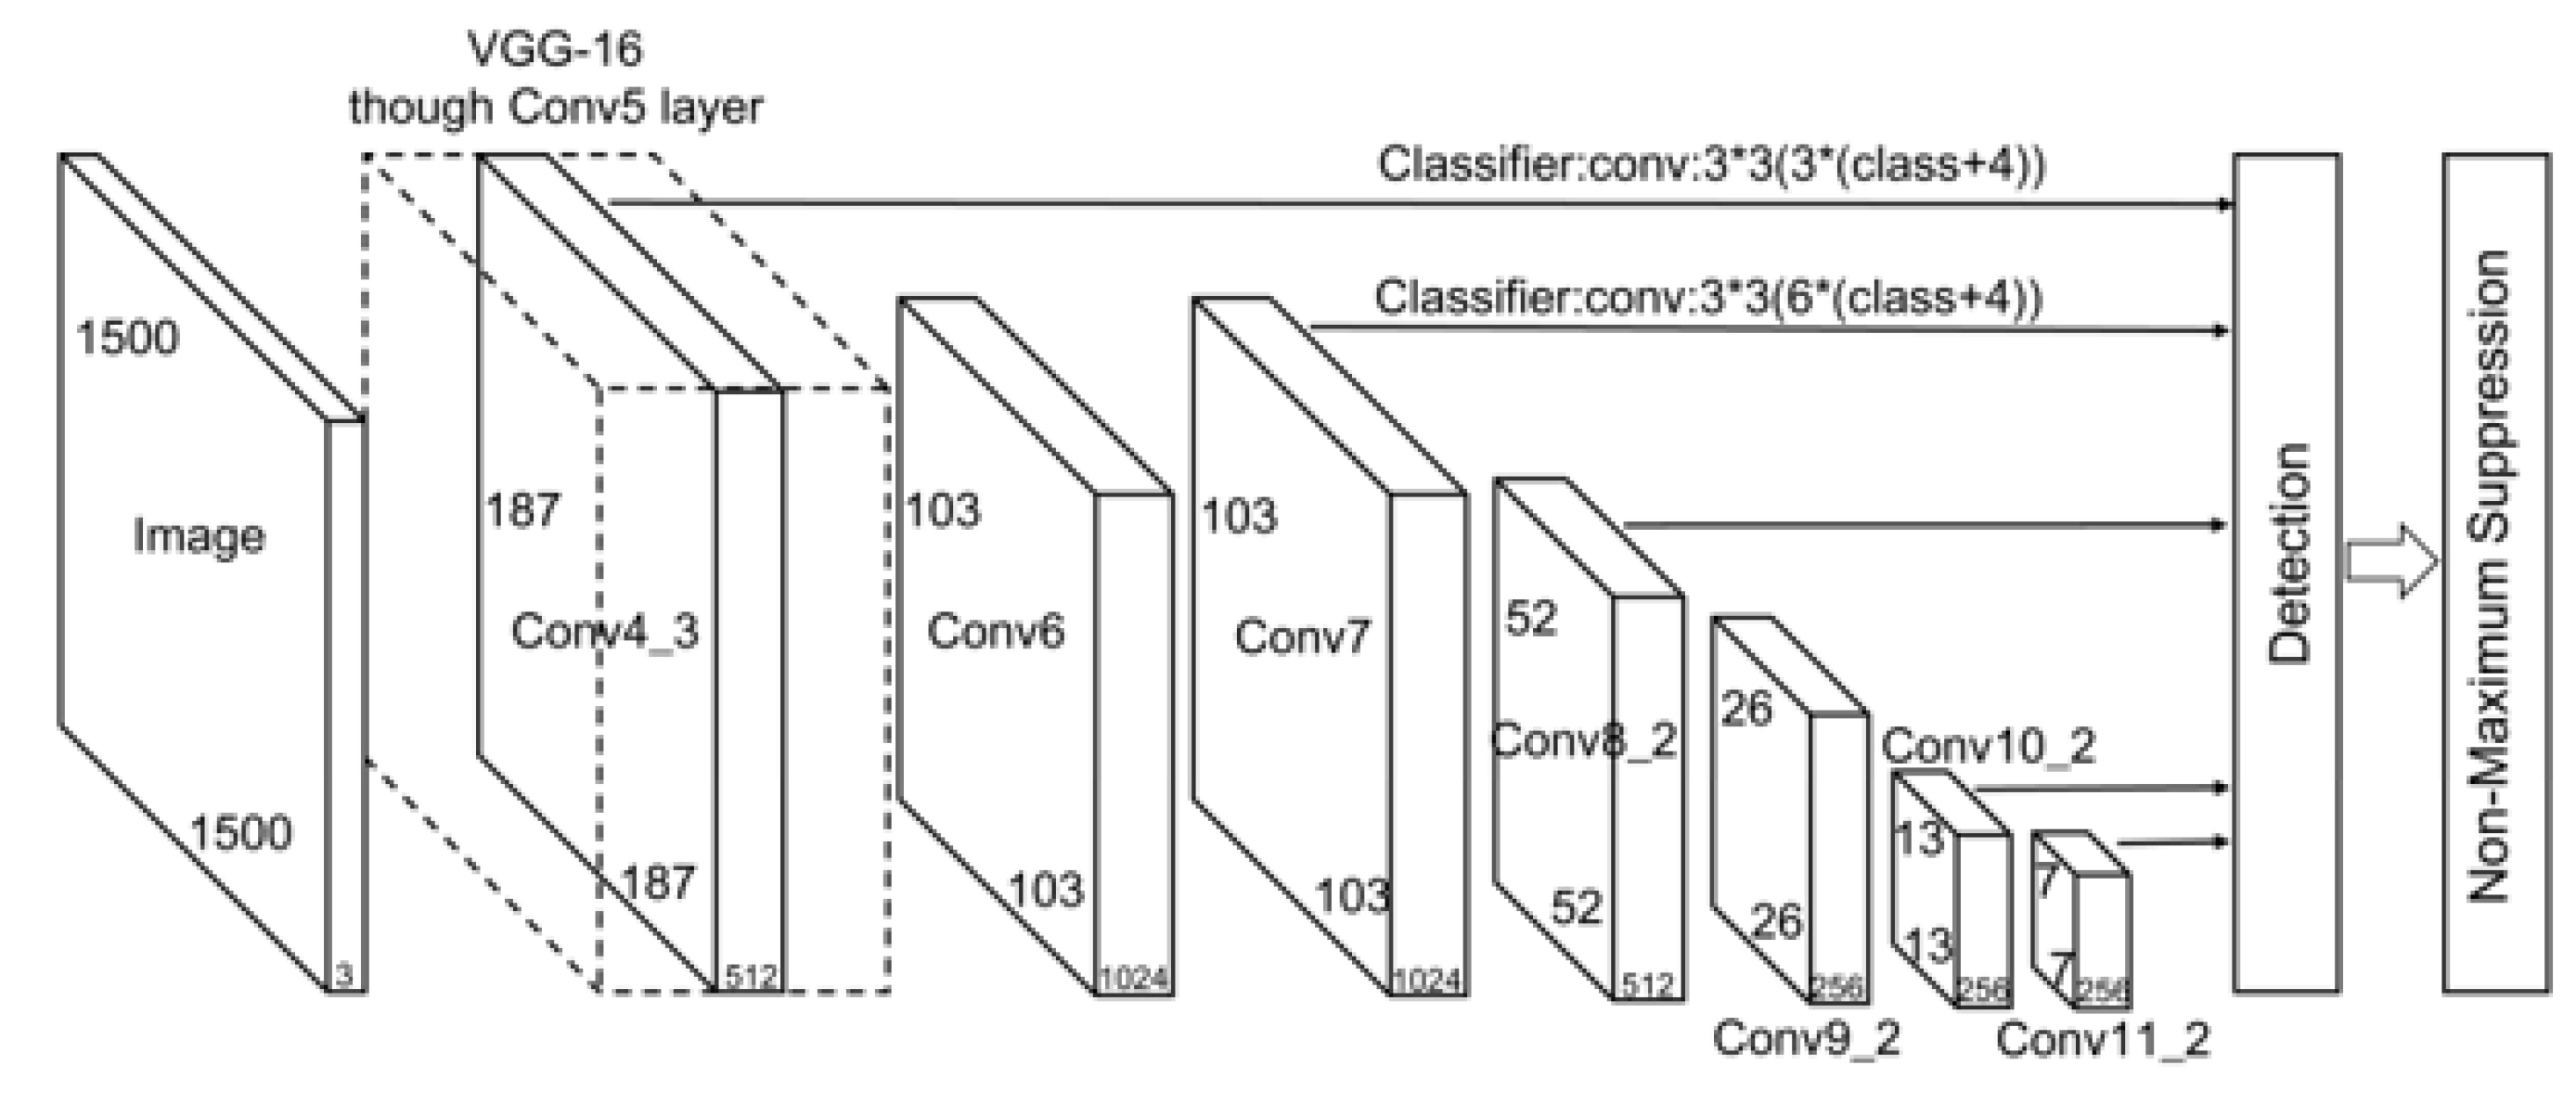
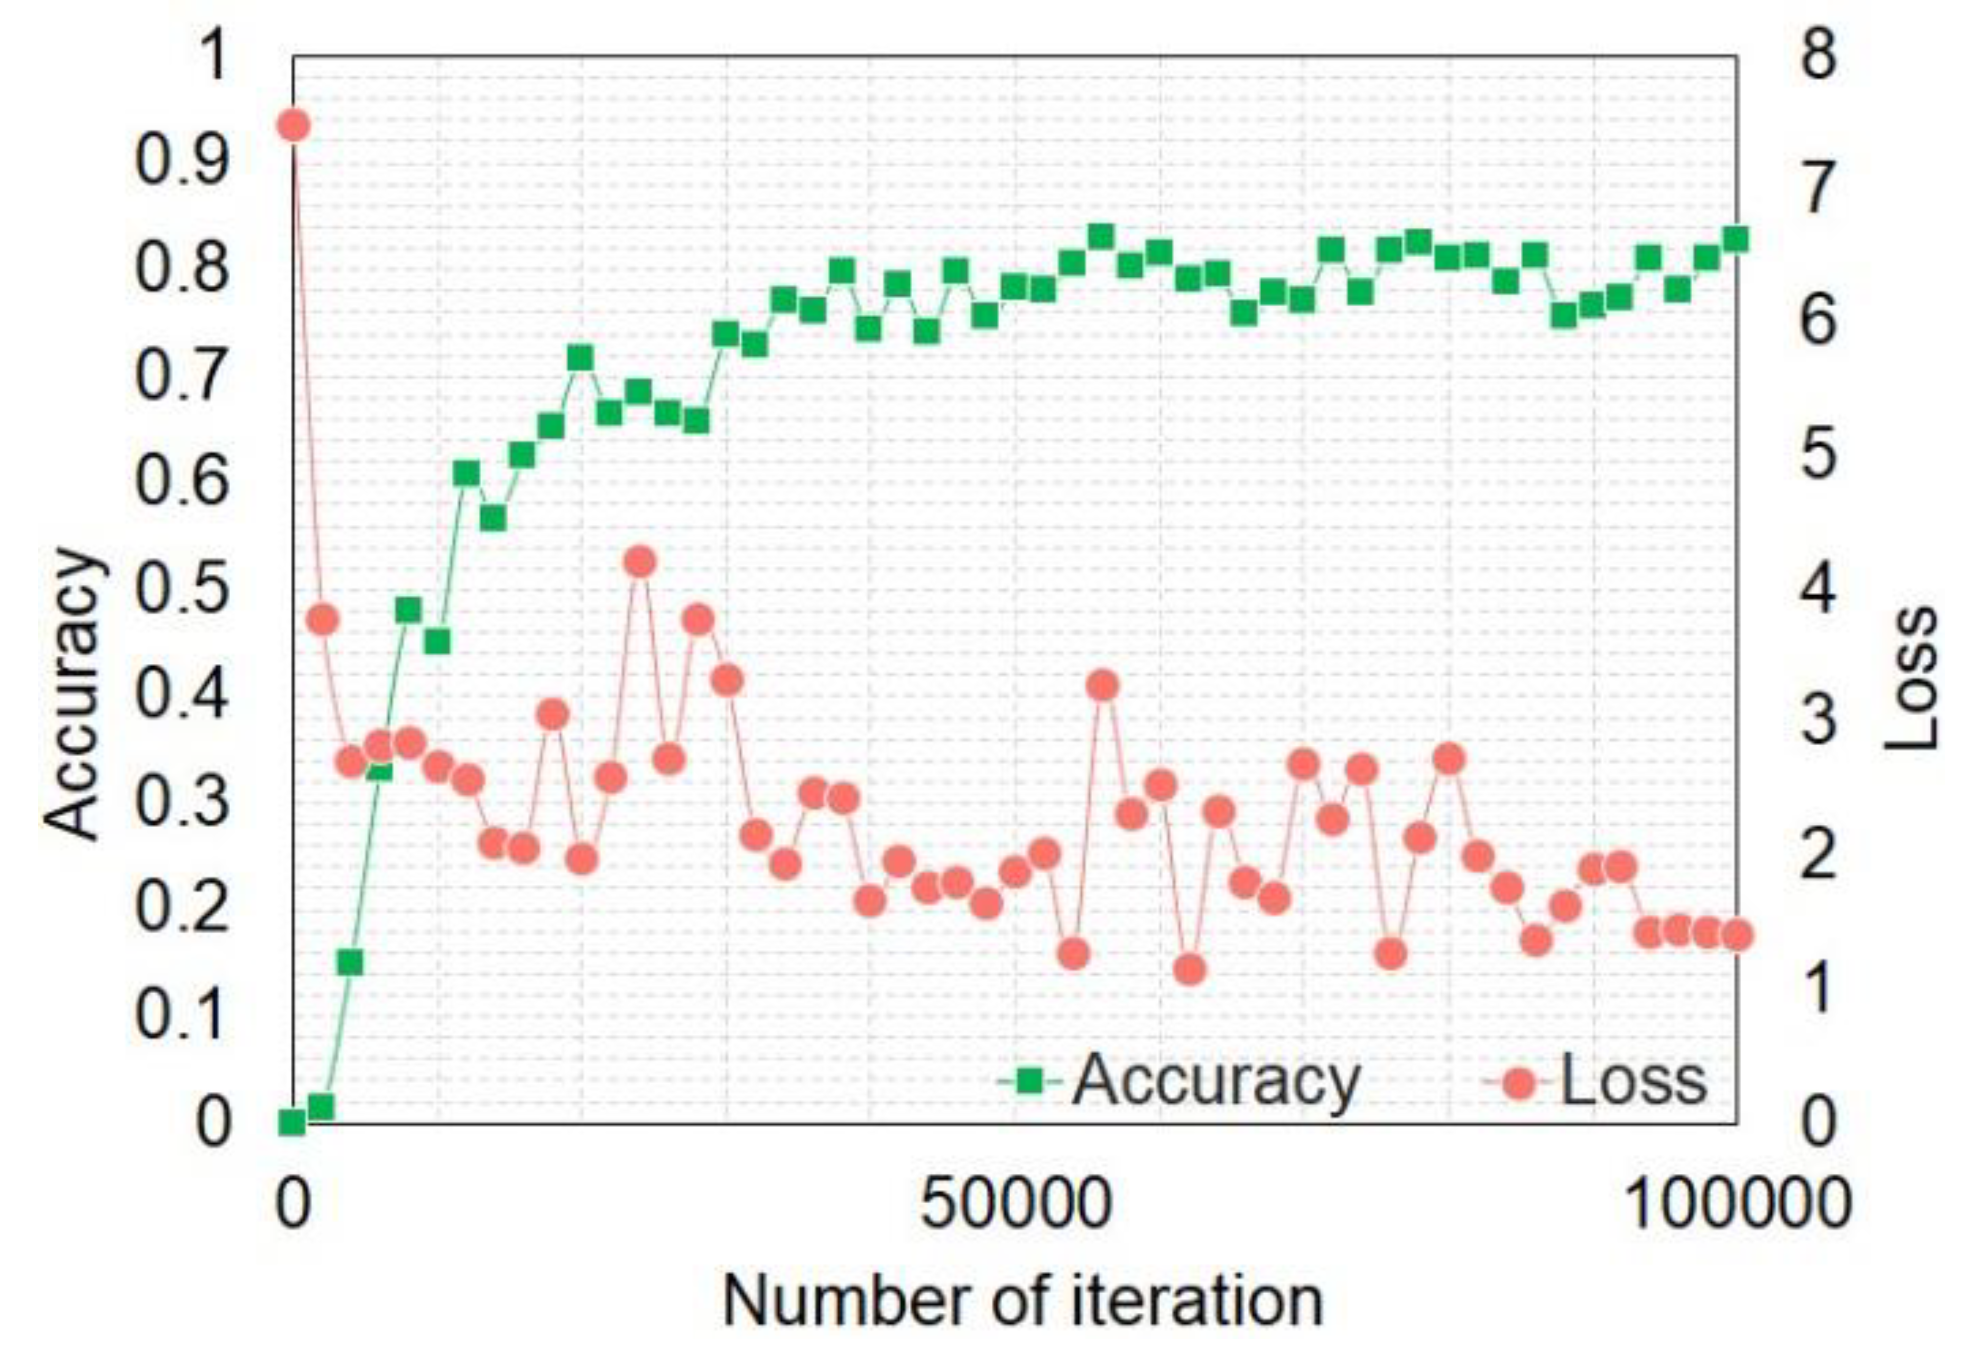
3.4. SSD Network Training and Optimization
3.5. Accuracy Assessment
4. Results and Discussion
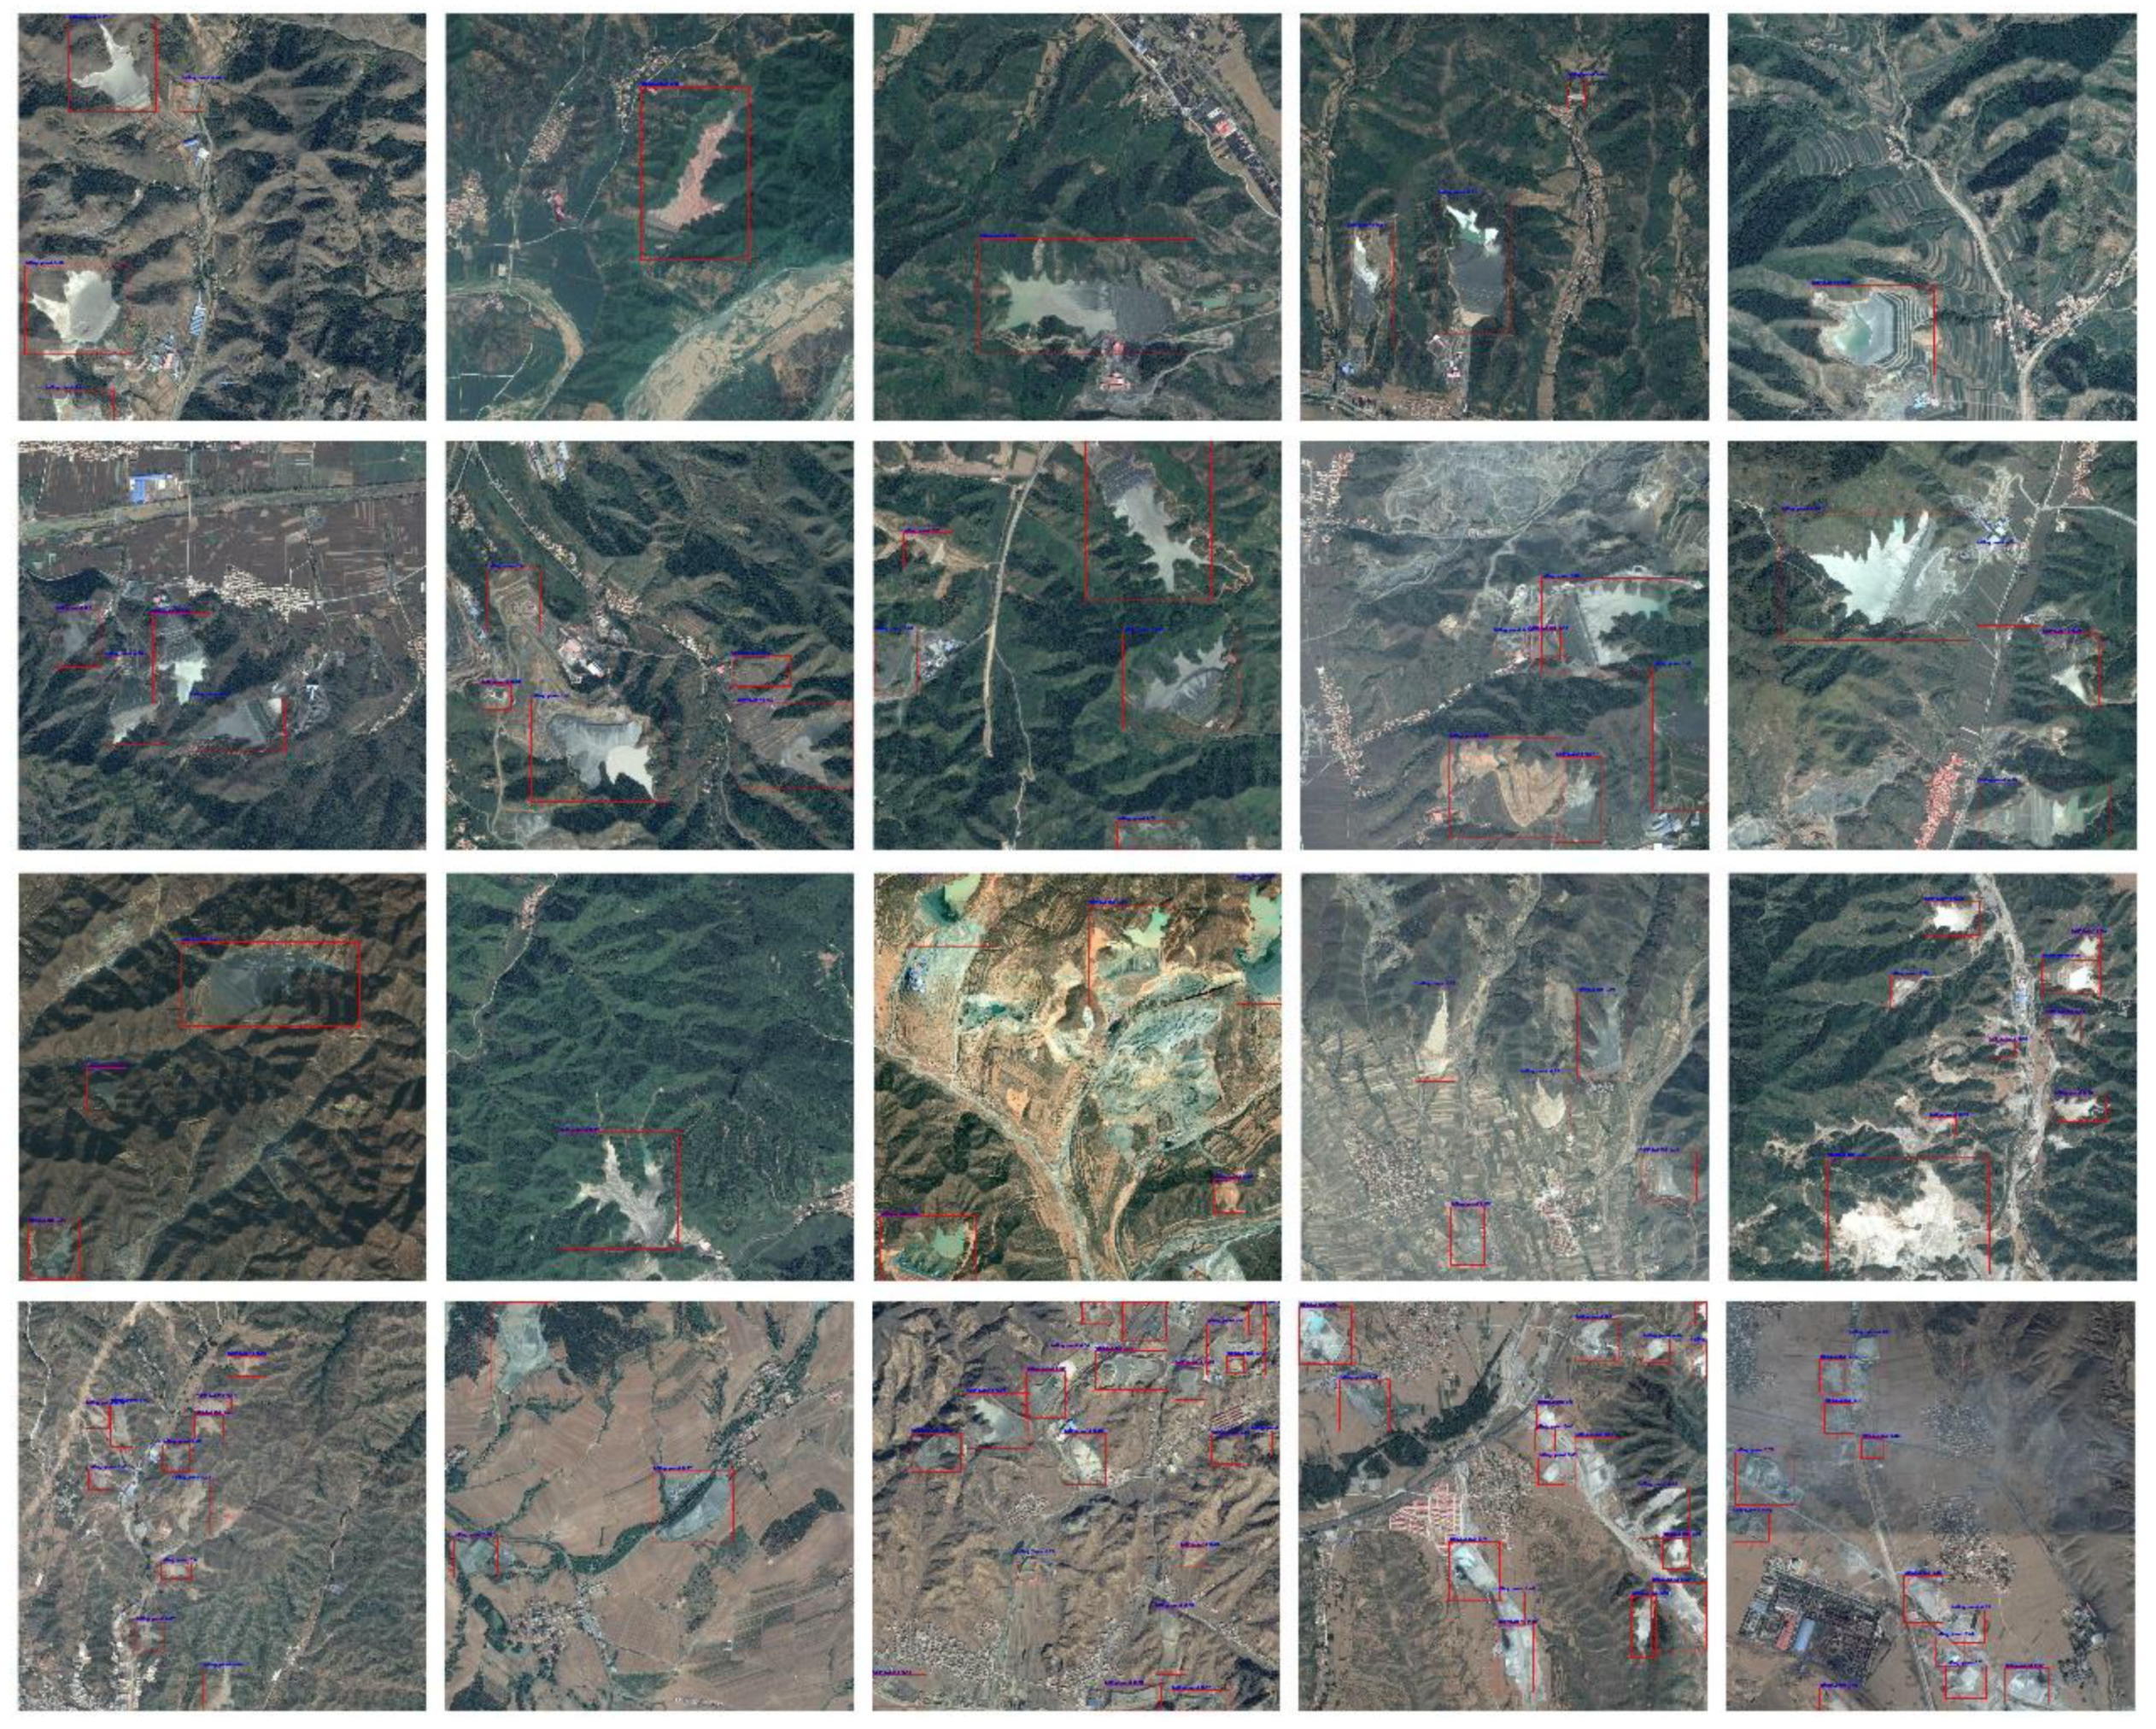
4.1. Detection Results of SSD
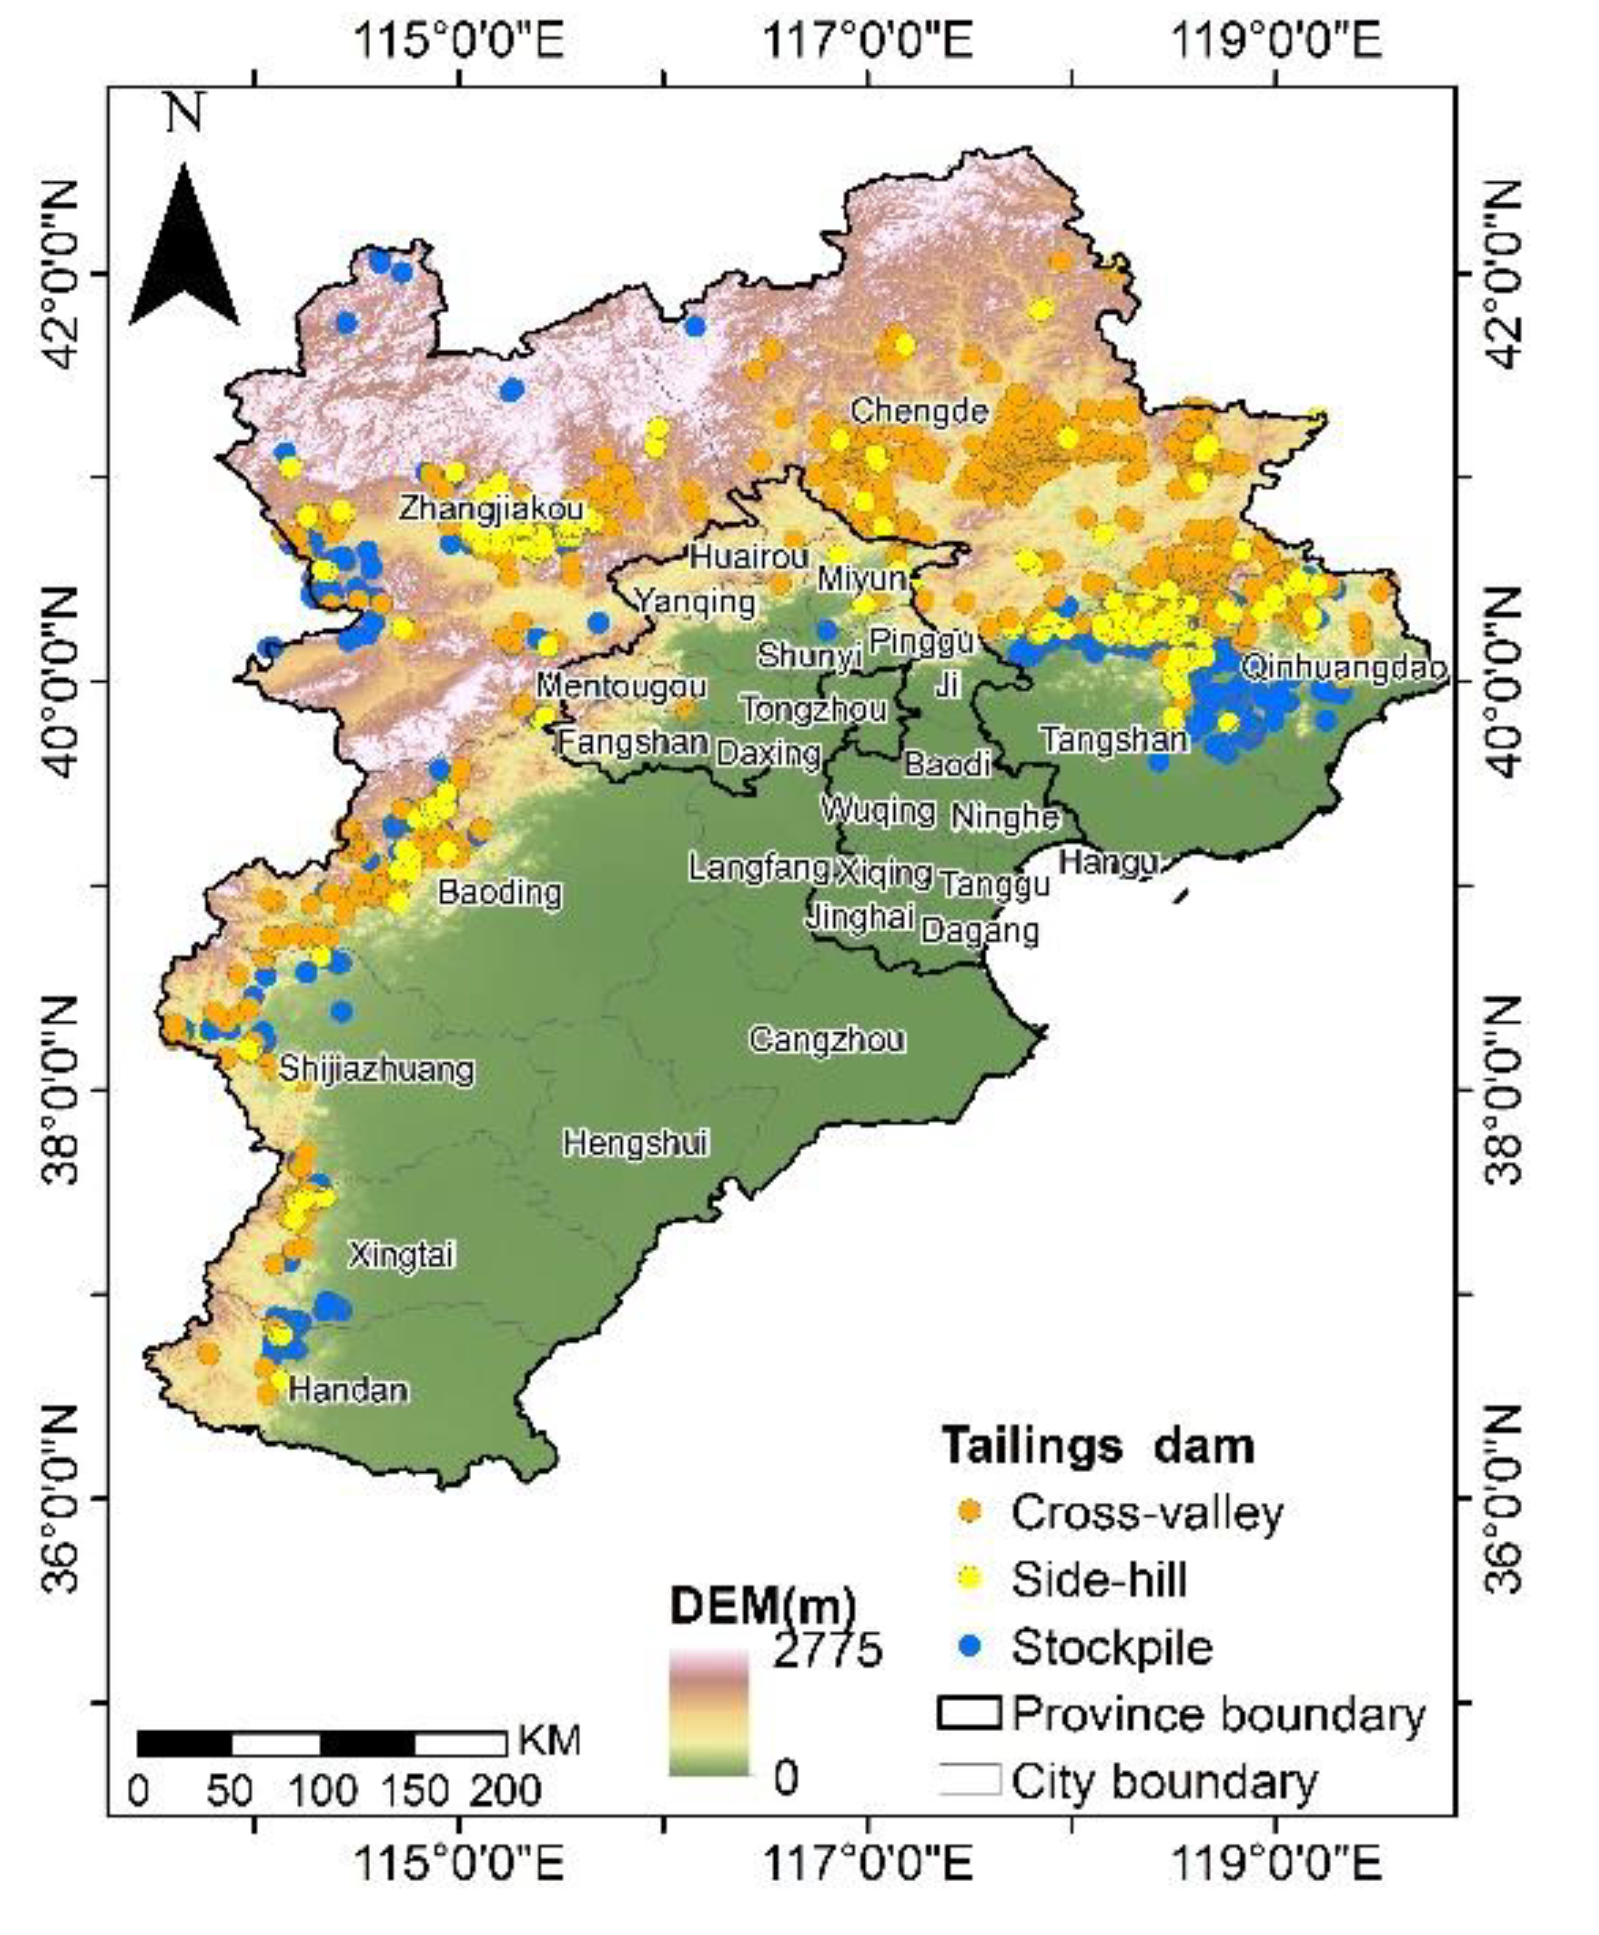
4.2. Tailings Dams in the Jing–Jin–Ji Region
5. Conclusions
Author Contributions
Funding
Acknowledgments
Conflicts of Interest
Software Availability
References
- Santamarina, J.C.; Torres-Cruz, L.A.; Bachus, R.C. Why coal ash and tailings dam disasters occur. Science 2019, 364, 526. [Google Scholar] [CrossRef] [PubMed]
- Bebbington, A.J.; Humphreys Bebbington, D.; Sauls, L.A.; Rogan, J.; Agrawal, S.; Gamboa, C.; Imhof, A.; Johnson, K.; Rosa, H.; Royo, A.; et al. Resource extraction and infrastructure threaten forest cover and community rights. Proc. Natl. Acad. Sci. USA 2018, 115, 13164–13173. [Google Scholar] [CrossRef] [PubMed] [Green Version]
- Kossoff, D.; Dubbin, W.E.; Alfredsson, M.; Edwards, S.J.; Macklin, M.G.; Hudson-Edwards, K.A. Mine tailings dams: Characteristics, failure, environmental impacts, and remediation. Appl. Geochem. 2014, 51, 229–245. [Google Scholar] [CrossRef] [Green Version]
- Werner, T.T.; Mudd, G.M.; Schipper, A.M.; Huijbregts, M.A.J.; Taneja, L.; Northey, S.A. Global-scale remote sensing of mine areas and analysis of factors explaining their extent. Glob. Environ. Chang. 2020, 60, 102007. [Google Scholar] [CrossRef]
- Blight, G.E.; Fourie, A.B. Catastrophe revisited—Disastrozus flow failures of mine and municipal solid waste. Geotech. Geol. Eng. 2005, 23, 219–248. [Google Scholar] [CrossRef]
- Carmo, F.F.D.; Kamino, L.H.Y.; Junior, R.T.; Campos, I.C.D.; Carmo, F.F.D.; Silvino, G.; Castro, K.J.D.S.X.D.; Mauro, M.L.; Rodrigues, N.U.A.; Miranda, M.P.D.S.; et al. Fundão tailings dam failures: The environment tragedy of the largest technological disaster of Brazilian mining in global context. Perspect. Ecol. Conserv. 2017, 15, 145–151. [Google Scholar] [CrossRef]
- Hatje, V.; Pedreira, R.M.A.; de Rezende, C.E.; Schettini, C.A.F.; de Souza, G.C.; Marin, D.C.; Hackspacher, P.C. The environmental impacts of one of the largest tailing dam failures worldwide. Sci. Rep. 2017, 7, 10706. [Google Scholar] [CrossRef]
- Silva Rotta, L.H.; Alcântara, E.; Park, E.; Negri, R.G.; Lin, Y.N.; Bernardo, N.; Mendes, T.S.G.; Souza Filho, C.R. The 2019 Brumadinho tailings dam collapse: Possible cause and impacts of the worst human and environmental disaster in Brazil. Int. J. Appl. Earth Obs. Geoinf. 2020, 90, 102119. [Google Scholar] [CrossRef]
- Kamunda, C.; Mathuthu, M.; Madhuku, M. An Assessment of Radiological Hazards from Gold Mine Tailings in the Province of Gauteng in South Africa. Int. J. Environ. Res. Public Health 2016, 13, 138. [Google Scholar] [CrossRef] [Green Version]
- Lyu, Z.; Chai, J.; Xu, Z.; Qin, Y.; Cao, J. A comprehensive review on reasons for tailings dam failures based on case history. Adv. Struct. Eng. 2019, 2019, 4159306. [Google Scholar] [CrossRef]
- Wallingford, H. A Review of the Risks Posed by the Failure of Tailings Dams. 2019. Available online: https://damsat.org/wp-content/uploads/2019/01/BE-090-Tailings-dams-R1-Secured.pdf (accessed on 21 December 2019).
- Owen, J.R.; Kemp, D.; Lèbre, É.; Svobodova, K.; Pérez Murillo, G. Catastrophic tailings dam failures and disaster risk disclosure. Int. J. Disaster Risk Reduct. 2020, 42, 101361. [Google Scholar] [CrossRef]
- Lumbroso, D.; McElroy, C.; Goff, C.; Collell, M.R.; Petkovsek, G.; Wetton, M. The potential to reduce the risks posed by tailings dams using satellite-based information. Int. J. Disaster Risk Reduct. 2019, 38, 101209. [Google Scholar] [CrossRef]
- National Inventory of Dams (NID). National Inventory of Dams. Available online: https://nid-test.sec.usace.army.mil (accessed on 14 February 2019).
- Wei, Z.; Yin, G.; Wang, J.G.; Wan, L.; Li, G. Design, construction and management of tailings storage facilities for surface disposal in China: Case studies of failures. Waste Manag. Res. 2012, 31, 106–112. [Google Scholar] [CrossRef] [PubMed]
- China Daily. Alarm over Tailings’ Effects on Rivers. Available online: http://www.chinadaily.com.cn/cndy/2011-07/29/content_13006210.htm (accessed on 21 February 2018).
- Fernández-Manso, A.; Quintano, C.; Roberts, D. Evaluation of potential of multiple endmember spectral mixture analysis (MESMA) for surface coal mining affected area mapping in different world forest ecosystems. Remote Sens. Environ. 2012, 127, 181–193. [Google Scholar] [CrossRef]
- Hao, L.; Zhang, Z.; Yang, X. Mine tailing extraction indexes and model using remote-sensing images in southeast Hubei Province. Environ. Earth Sci. 2019, 78, 493. [Google Scholar] [CrossRef] [Green Version]
- Ma, B.; Chen, Y.; Zhang, S.; Li, X. Remote Sensing Extraction Method of Tailings Ponds in Ultra-Low-Grade Iron Mining Area Based on Spectral Characteristics and Texture Entropy. Entropy 2018, 20, 345. [Google Scholar] [CrossRef] [Green Version]
- Liu, J.; Liu, R.; Zhang, Z.; Cai, Y.; Zhang, L. A Bayesian Network-based risk dynamic simulation model for accidental water pollution discharge of mine tailings ponds at watershed-scale. J. Environ. Manag. 2019, 246, 821–831. [Google Scholar] [CrossRef]
- Xiao, R.; Shen, W.; Fu, Z.; Shi, Y.; Xiong, W.; Cao, F. The application of remote sensing in the environmental risk monitoring of tailings pond: A case study in Zhangjiakou area of China. SPIE Proc. 2012, 8538. [Google Scholar] [CrossRef]
- Zhou, Y.; Wang, X.; Yao, W.; Yang, J. Remote sensing investigation and environment impact analysis of tailing ponds in Shandong province. Geol. Surv. China 2017, 4, 88–92. [Google Scholar]
- Tong, Q.; Xue, Y.; Zhang, L. Progress in Hyperspectral Remote Sensing Science and Technology in China Over the Past Three Decades. IEEE J. Sel. Top. Appl. Earth Obs. Remote Sens. 2014, 7, 70–91. [Google Scholar] [CrossRef]
- Gao, L.; Yao, D.; Li, Q.; Zhuang, L.; Zhang, B.; Bioucas-Dias, J.M. A new low-rank representation based hyperspectral image denoising method for mineral mapping. Remote Sens. 2017, 9, 20. [Google Scholar] [CrossRef] [Green Version]
- Thomas, K.; Stefan, S. Use of airborne hyperspectral data to estimate residual heavy metal contamination and acidification potential in the Guadiamar floodplain Andalusia, Spain after the Aznacollar mining accident. SPIE Proc. 2004, 5574. [Google Scholar] [CrossRef]
- Riaza, A.; Buzzi, J.; García-Meléndez, E.; Vázquez, I.; Bellido, E.; Carrère, V.; Müller, A. Pyrite mine waste and water mapping using Hymap and Hyperion hyperspectral data. Environ. Earth Sci. 2012, 66, 1957–1971. [Google Scholar] [CrossRef]
- Hu, X.; Oommen, T.; Lu, Z.; Wang, T.; Kim, J.-W. Consolidation settlement of Salt Lake County tailings impoundment revealed by time-series InSAR observations from multiple radar satellites. Remote Sens. Environ. 2017, 202, 199–209. [Google Scholar] [CrossRef]
- Li, T.; Motagh, M.; Wang, M.; Zhang, W.; Gong, C.; Xiong, X.; He, J.; Chen, L.; Liu, J. Earth and rock-filled dam monitoring by high-resolution X-Band interferometry: Gongming dam case study. Remote Sens. 2019, 11, 246. [Google Scholar] [CrossRef] [Green Version]
- Du, Z.; Ge, L.; Ng, A.H.-M.; Zhu, Q.; Horgan, F.G.; Zhang, Q. Risk assessment for tailings dams in Brumadinho of Brazil using InSAR time series approach. Sci. Total Environ. 2020, 717, 137125. [Google Scholar] [CrossRef]
- Wu, X.; Sahoo, D.; Hoi, S.C.H. Recent advances in deep learning for object detection. Neurocomputing 2020, 396, 39–64. [Google Scholar] [CrossRef] [Green Version]
- Krizhevsky, A.; Sutskever, I.; Hinton, G.E. ImageNet classification with deep convolutional neural networks. Commun. ACM 2017, 60, 84–90. [Google Scholar] [CrossRef]
- Girshick, R.; Donahue, J.; Darrell, T.; Malik, J. Rich feature hierarchies for accurate object detection and semantic segmentation. In Proceedings of the IEEE Conference on Computer Vision and Pattern Recognition, Columbus, OH, USA, 23–28 June 2014; pp. 580–587. [Google Scholar]
- Girshick, R. Fast r-cnn. In Proceedings of the IEEE International Conference on Computer Vision, Santiago, Chile, 7–13 December 2015; pp. 1440–1448. [Google Scholar]
- Ren, S.; He, K.; Girshick, R.; Sun, J. Faster R-CNN: Towards real-time object detection with region proposal networks. In Proceedings of the Advances in Neural Information Processing Systems, Montreal, QC, Canada, 7–12 December 2015; MIT Press: Cambridge, MA, USA, 2015; pp. 91–99. [Google Scholar]
- Sermanet, P.; Eigen, D.; Zhang, X.; Mathieu, M.; Fergus, R.; LeCun, Y. OverFeat: Integrated Recognition, Localization and Detection using Convolutional Networks. arXiv 2013, arXiv:1312.6229. [Google Scholar]
- Redmon, J.; Divvala, S.; Girshick, R.; Farhadi, A. You only look once: Unified, real-time object detection. In Proceedings of the IEEE Conference on Computer Vision and Pattern Recognition, Las Vegas, NV, USA, 27–30 July 2016; pp. 779–788. [Google Scholar]
- Liu, W.; Anguelov, D.; Erhan, D.; Szegedy, C.; Reed, S.; Fu, C.; Berg, A.C. Ssd: Single shot multibox detector. In Proceedings of the European Conference on Computer Vision, Amsterdam, The Netherlands, 11–14 October 2016; Springer: Cham, Switzerland, 2016; pp. 21–37. [Google Scholar]
- Guo, H.; Wang, L.; Liang, D. Big Earth Data from space: A new engine for Earth science. Sci. Bull. 2016, 61, 505–513. [Google Scholar] [CrossRef]
- Lu, L.; Guo, H.; Corbane, C.; Li, Q. Urban sprawl in provincial capital cities in China: Evidence from multi-temporal urban land products using Landsat data. Sci. Bull. 2019, 64, 955–957. [Google Scholar] [CrossRef] [Green Version]
- Sedona, R.; Cavallaro, G.; Jitsev, J.; Strube, A.; Riedel, M.; Benediktsson, J.A. Remote Sensing Big Data Classification with High Performance Distributed Deep Learning. Remote Sens. 2019, 11, 3056. [Google Scholar] [CrossRef] [Green Version]
- Zhang, B.; Chen, Z.; Peng, D.; Benediktsson, J.A.; Liu, B.; Zou, L.; Li, J.; Plaza, A. Remotely sensed big data: Evolution in model development for information extraction[point of view]. Proc. IEEE 2019, 107, 2294–2301. [Google Scholar] [CrossRef]
- Zhou, K.; Ming, D.; Lv, X.; Fang, J.; Wang, M. CNN-Based land cover classification combining stratified segmentation and fusion of point cloud and very high-spatial resolution remote sensing image data. Remote Sens. 2019, 11, 2065. [Google Scholar] [CrossRef] [Green Version]
- Sui, B.; Jiang, T.; Zhang, Z.; Pan, X.; Liu, C. A modeling method for automatic extraction of offshore aquaculture zones based on semantic segmentation. ISPRS Int. J. Geo-Inf. 2020, 9, 145. [Google Scholar] [CrossRef] [Green Version]
- Li, W.; Hsu, C.-Y. Automated terrain feature identification from remote sensing imagery: A deep learning approach. Int. J. Geogr. Inf. Sci. 2020, 34, 637–660. [Google Scholar] [CrossRef]
- Chen, Z.; Lu, K.; Gao, L.; Li, B.; Gao, J.; Yang, X.; Yao, M.; Zhang, B. Automatic detection of track and fields in China from high-resolution satellite images using multi-scale-fused single shot multibox detector. Remote Sens. 2019, 11, 1377. [Google Scholar] [CrossRef] [Green Version]
- Balaniuk, R.; Isupova, O.; Reece, S. Mining and tailings dam detection in satellite imagery using deep learning. arXiv 2007, arXiv:2007.01076. [Google Scholar]
- Lu, L.; Guo, H.; Wang, C.; Pesaresi, M.; Ehrlich, D. Monitoring bidecadal development of urban agglomeration with remote sensing images in the Jing-Jin-Tang area, China. J. Appl. Remote Sens. 2014, 8, 1–13. [Google Scholar] [CrossRef] [Green Version]
- Ji, J.; Wang, S.; Zhou, Y.; Liu, W.; Wang, L. Spatiotemporal change and landscape pattern variation of eco-environmental quality in Jing-Jin-Ji Urban Agglomeration From 2001 to 2015. IEEE Access 2020, 8, 125534–125548. [Google Scholar] [CrossRef]
- Yu, G.; Song, C.; Pan, Y.; Li, L.; Li, R.; Lu, S. Review of new progress in tailing dam safety in foreign research and current state with development trend in China. Chin. J. Rock Mech. Eng. 2014, 33, 3238–3248. [Google Scholar]
- Engels, J. An Expert Management System for Surface Tailings Storage. Ph.D. Thesis, University of Leeds, Leeds, UK, 2006. [Google Scholar]
- Miao, X.; Liu, X.; Chen, J.; Zhuang, S.; Fan, J.; Jiang, H. Insulator Detection in Aerial Images for Transmission Line Inspection Using Single Shot Multibox Detector. IEEE Access 2019, 7, 9945–9956. [Google Scholar] [CrossRef]
- Zhai, S.; Shang, D.; Wang, S.; Dong, S. DF-SSD: An Improved SSD Object Detection Algorithm Based on DenseNet and Feature Fusion. IEEE Access 2020, 8, 24344–24357. [Google Scholar] [CrossRef]
- Dong, P. Automated measurement of sand dune migration using multi-temporal lidar data and GIS. Int. J. Remote Sens. 2015, 36, 5426–5447. [Google Scholar] [CrossRef]
- Milillo, P.; Perissin, D.; Salzer, J.T.; Lundgren, P.; Lacava, G.; Milillo, G.; Serio, C. Monitoring dam structural health from space: Insights from novel InSAR techniques and multi-parametric modeling applied to the Pertusillo dam Basilicata, Italy. Int. J. Appl. Earth Obs. Geoinf. 2016, 52, 221–229. [Google Scholar] [CrossRef]
- Leng, P.; Song, X.; Duan, S.-B.; Li, Z.-L. Generation of continuous surface soil moisture dataset using combined optical and thermal infrared images. Hydrol. Process. 2017, 31, 1398–1407. [Google Scholar] [CrossRef]
- Lu, L.; Weng, Q.; Guo, H.; Feng, S.; Li, Q. Assessment of urban environmental change using multi-source remote sensing time series (2000–2016): A comparative analysis in selected megacities in Eurasia. Sci. Total Environ. 2019, 684, 567–577. [Google Scholar] [CrossRef]


| Spectral Band | Wavelength | Spatial Resolution | Swath width at Nadir | Revisit Time |
|---|---|---|---|---|
| (um) | (m) | (km) | (d) | |
| Pan | 0.49–0.9 | 2 | 69 | 41 |
| Blue | 0.45–0.52 | 8 | 69 | 41 |
| Green | 0.52–0.59 | |||
| Red | 0.63–0.69 | |||
| NIR | 0.77–0.89 |
| Confidence Score Threshold | TP | FP | FN | Precision | Recall Rate | F1-Score |
|---|---|---|---|---|---|---|
| 0.1 | 900 | 853 | 11 | 0.513 | 0.988 | 0.676 |
| 0.2 | 865 | 189 | 46 | 0.821 | 0.950 | 0.880 |
| 0.3 | 808 | 88 | 103 | 0.902 | 0.887 | 0.894 |
| 0.4 | 759 | 51 | 152 | 0.937 | 0.833 | 0.882 |
| 0.5 | 709 | 29 | 202 | 0.961 | 0.833 | 0.892 |
| 0.6 | 669 | 17 | 242 | 0.975 | 0.734 | 0.838 |
© 2020 by the authors. Licensee MDPI, Basel, Switzerland. This article is an open access article distributed under the terms and conditions of the Creative Commons Attribution (CC BY) license (http://creativecommons.org/licenses/by/4.0/).
Share and Cite
Li, Q.; Chen, Z.; Zhang, B.; Li, B.; Lu, K.; Lu, L.; Guo, H. Detection of Tailings Dams Using High-Resolution Satellite Imagery and a Single Shot Multibox Detector in the Jing–Jin–Ji Region, China. Remote Sens. 2020, 12, 2626. https://doi.org/10.3390/rs12162626
Li Q, Chen Z, Zhang B, Li B, Lu K, Lu L, Guo H. Detection of Tailings Dams Using High-Resolution Satellite Imagery and a Single Shot Multibox Detector in the Jing–Jin–Ji Region, China. Remote Sensing. 2020; 12(16):2626. https://doi.org/10.3390/rs12162626
Chicago/Turabian StyleLi, Qingting, Zhengchao Chen, Bing Zhang, Baipeng Li, Kaixuan Lu, Linlin Lu, and Huadong Guo. 2020. "Detection of Tailings Dams Using High-Resolution Satellite Imagery and a Single Shot Multibox Detector in the Jing–Jin–Ji Region, China" Remote Sensing 12, no. 16: 2626. https://doi.org/10.3390/rs12162626