Evaluation of Zenith Tropospheric Delay Derived from ERA5 Data over China Using GNSS Observations


Institute of Space Science, Shandong University, Weihai 264209, China
*
Author to whom correspondence should be addressed.
Remote Sens. 2020, 12(4), 663; https://doi.org/10.3390/rs12040663
Submission received: 6 January 2020
/
Revised: 4 February 2020
/
Accepted: 14 February 2020
/
Published: 17 February 2020
(This article belongs to the Special Issue GPS/GNSS for Earth Science and Applications)
Abstract
:The latest reanalysis of the European Center for Medium-Range Weather Forecasts (ECMWF), ERA5, can provide atmospheric data for calculating Zenith Tropospheric Delay (ZTD) with hourly temporal resolution, which is a key factor in Global Navigation Satellite System (GNSS) high-precision application. This paper is aimed at evaluating the performance of ZTD derived from ERA5 reanalysis data over China using 219 GNSS stations of the Crustal Movement Observation Network of China (CMONOC) covering the period from 2015 to 2016. The site-specific hourly ZTD at these stations is obtained by integration method and Saastamoinen model method on ERA5 pressure-level and surface-level reanalysis data with the temporal resolution of 1 h and the spatial resolution of 0.25° × 0.25°. Firstly, the atmospheric temperature and pressure that derived from ERA5 are compared with temperature and pressure obtained from meteorological sensors available at 193 GNSS stations. The biases are 2.31 °C and 1.26 mbar implying the accuracy and feasibility of ERA5 pressure and temperature for calculating ZTD over China. Secondly, the performance of ERA5 ZTD is systematically evaluated using ZTD from 219 GNSS sites. The average bias and Root Mean Square (RMS) of ERA5 pressure-level ZTD at all test stations in integration method are approximately 2.97 mm and 11.49 mm respectively, and those of ERA5 surface-level ZTD in model method are 7.97 mm, 39.25 mm, which indicates that ERA5 pressure-level ZTD has a higher accuracy over China. Further analysis indicates that the accuracies of ZTD derived from ERA5 pressure-level and surface-level data are approximately 13.8% and 10.9% higher than those from of ERA-Interim pressure-level and surface-level data. Moreover, ERA5 is able to accurately capture the short-term (hourly) variation of ZTD, which further indicates the better performance of ERA5. Thirdly, the temporal and spatial variation characteristics of ERA5 ZTD accuracy are further analyzed over China. The results show that the ZTD in the southern region has the lower accuracy compared with that in the northern region over China due to the influence of latitude and altitude. Furthermore, it is found that the ERA5 ZTD over China has obvious seasonality, with higher accuracy in winter and lower accuracy in summer.
1. Introduction
Tropospheric effect is a major error source in precise global navigation satellite system (GNSS) positioning [1]. Due to its impact on GNSS signal, it should be considered carefully. However, the tropospheric delay is also an important data source for Numerical Weather Model (NMW) since it contains accurate atmospheric information, such as real-time tropospheric delay, atmospheric water vapor and occultation events information and so on [2,3,4]. Thus, high-precision tropospheric delay product is critical for GNSS to improve the accuracy of positioning and water vapor retrieving [5,6].
The tropospheric delay in the zenith direction is known as the Zenith Tropospheric Delay (ZTD), which is made up of hydrostatic and wet components. Generally, Zenith Hydrostatic Delay (ZHD) can be accurately calculated by empirical models like Saasmoninen model on the condition that atmospheric temperature and pressure can be obtained with high precision [7]. Since the distribution of water vapor is irregular, there is no such precise empirical model for Zenith Wet Delay (ZWD). The uncertainties of ZWD affect the convergence time and solution accuracy in GNSS precise positioning and high-precision application [8]. Therefore, the accurate quantification of ZTD is still a challenge owing to the high temporal and spatial variations. Numerical meteorological data have been proven to be an effective means for tropospheric delay calculation [9,10], and have been increasingly applied in this field recently, with long time series and high spatial and temporal resolution. The products of Numerical Weather Model (NWM) have been used to build global or regional temperature, pressure and ZTD models by scholars, such as Global Pressure and Temperature (GPT), GPT2, Global Pressure and Temperature 2 wet (GPT2w), Improved Tropospheric Grid (ITG), etc. [11,12,13,14,15], which implies that NMW data play a vital role in the field of geodesy and GNSS meteorology. These further applications are based on the high-accuracy parameters derived from NMW data such as pressure, temperature and ZTD. Thus, it is very necessary and meaningful to evaluate the accuracy of ZTD and related atmospheric parameters calculated by using numerical meteorological reanalysis data.
So far, many researchers have used GNSS data to validate tropospheric parameters derived from meteorological data including ZTD, ZWD and integrated water vapor [16,17]. Among them, ZTD is one of the most important and widely used content. Andrei and Chen [18] assessed the accuracy of ZTD derived from the NWM compared with that calculated by IGS stations, which shows that its root mean square (RMS) error is approximately 3 cm. There are also many studies on the accuracy and applicability of tropospheric delay calculated by meteorological reanalysis products. Several studies have proven that compared with ZTD from National Centers for Environmental Prediction (NCEP), ZTD derived from European Center for Medium-Range Weather Forecasts (ECMWF) is of higher accuracy [19,20,21,22]. Bromwich and Wang [23] found that the reanalysis data from the ECMWF or NCEP can achieve high precision with dense observations, but there is some uncertainty in the accuracy with sparse data. Boccara [24] analyzed the performance of ECMWF and NCEP reanalysis data using observations of the Vorcore superpressure balloon campaign over Antarctica in 2015. It was found that ECMWF analyses agree closely to the observations while the NCEP has strong positive and negative bias. ECMWF and NCEP data have also been used to eliminate tropospheric path delays in GNSS positioning and to improve tropospheric delay models for North America [25,26,27]. The evaluation of ZTD derived from NCEP and ECMWF data using GPS observation in China was conducted by Chen [28]. The results indicated the accuracy of calculating ZTD with the two kind of reanalysis data and the feasibility of establishing a new ZTD model based on them over China. In summary, the feasibility of using GNSS data to evaluate the accuracy of ZTD derived from meteorological data has been demonstrated. The accuracy and performance of ZTD from the early version of the reanalysis data in different regions have also been evaluated.
ERA5 is the latest generation of reanalysis data operated by ECMWF, just updated in January 2019. ERA5 has been updated and innovated in many features, such as significantly improved horizontal resolution and temporal resolution (79 km to 31 km, 6-hourly to hourly), increase of the data assimilated, etc., compared to ERA-Interim [29]. Therefore, ERA5 is promising in establishing global model of temperature, pressure and ZTD. It is necessary to assess the reliability of ERA5 in hourly GNSS tropospheric delay calculation before further applications, but until now systematic studies on this have not been founded. Thus, in this paper the goals we want to achieve are: (1) to assess the accuracy of atmospheric temperature and pressure provided by ERA5 by comparing with those from GNSS meteorological data;(2) to evaluate the performance of ERA5 ZTD by comparing with GNSS ZTD; and (3) to analyze the temporal and spatial variation characteristics of ERA5 ZTD over China. In addition, the ERA-Interim and GPT2w model are also involved for comparison.
The paper is organized as follows. The data and the methodology for ZTD calculation from ERA5 and GNSS are introduced in Section 2. The accuracies of temperature, pressure and ZTD are shown, and the temporal and spatial variation features of ZTD bias and RMS over China are analyzed in Section 3. The summary and conclusions of this paper are given in Section 4.
2. Data and Methodology
2.1. Data Description
The main data used in this paper are the ERA5 reanalysis data (pressure-level products and surface-level products) from ECMWF and GNSS observations collected from the Crustal Movement Observation Network of China (CMONOC) during the two-year period from 2015 to 2016. The performance of ZTD derived from ERA5 over China is analyzed by comparing with GNSS ZTD.
2.1.1. Reanalysis Products
The hourly pressure-level and surface-level meteorological data of ERA5 were used (https://www.ecmwf.int/en/forecasts/datasets/reanalysis-datasets/era5). The horizontal resolution of all of them was 0.25° × 0.25° and the vertical resolution of pressure-level was 37 levels achieving 0.1mbar. The atmospheric pressure, geopotential and temperature of pressure-level reanalysis data were included as well as specific humidity. In the surface-level reanalysis data, the pressure, 2 m dewpoint temperature, and 2 m temperature were selected to calculate ZTD. The latitude and longitude ranged from 15° N to 54.5° N and from 70° E to 139.5° E. The surface-level and pressure-level data of ERA-Interim are also processed as comparison, with a horizontal resolution of 0.5° × 0.5° and temporal resolution of 6-hourly.
2.1.2. GNSS Observations
The GNSS observations were collected at 219 GNSS stations in the CMONOC network to generate ZTD. CMONOC network is a national scientific infrastructure for monitoring important geophysical and geodetic parameters in China such as the water vapor distribution, plate tectonics, gravity field, and so on [30,31,32,33]. The distribution of GNSS reference stations which were selected in this study is shown in Figure 1. All stations are equipped with GNSS high-precision receivers and meteorological sensors. The ZTD time series from GNSS were estimated using the software BERNESE5.2, developed by University of Bern [34]. GNSS stations equipped with meteorological sensors can provide atmospheric temperature and pressure at 5s interval [35]. These meteorological data were used to evaluate the accuracy of temperature and pressure from ERA5.
2.2. Methods
2.2.1. The Method of Calculating Atmospheric Temperature and Pressure from ERA5
Atmospheric pressure and temperature are the basis for calculating ZTD, which should be firstly evaluated. The reference value is the GNSS meteorological observation data. The vertical and horizontal interpolation should be conducted to calculate the pressure and temperature using ERA5 in order to compare with the meteorological data of GNSS stations. The formula for calculating the atmospheric pressure of grid points at the station height using pressure-level data is as follows. The detailed introduction is in Jade’s paper [36]. The linear vertical interpolation method is used to calculate the temperature values at four grid points. The temperature and pressure values at the height of GNSS stations are then obtained using bilinear interpolation method.
where and are two nearest height corresponding to the pressure level and respectively. is the pressure at height H of grid point j. and are pressure values at height H of grid point j using and at layer i-1 and i+1 respectively.
The method of calculating the temperature and pressure of GNSS stations using surface-level data is different from that of using pressure-level data. Temperature and pressure values of four grid points near the GNSS station can be provided at the reference height by surface-level data. Then the atmospheric temperature and pressure values at the height of GNSS stations are calculated using the standard atmosphere model [37]. Similarly, the temperature and pressure values at GNSS stations are obtained according to the following interpolation method.
where T denotes temperature, P denotes atmospheric pressure, P0 is standard pressure at the reference height H0, T0 is standard temperature at the same height, and H is the height of GNSS station.
Before calculating the temperature, pressure and ZTD values, the data need to be checked first, such as the normality of the instrument, the correctness of the data format and the integrity of the collected data. After the time series have been obtained using the selected data, the data with error larger than three times standard deviation is rejected. Additionally, only 5 layers (here refer to the formula for calculating the pressure value based on the pressure-level data at the station location) of data in Network Common Data Form (NetCDF) file are extracted according to the height of the station when atmospheric pressure and temperature at grid points are calculated using pressure-level data, in order to shorten the calculation time.
2.2.2. Calculating ZTD Using ERA5 Meteorological Data at GNSS Stations
Since the location of grid point from ERA5 is different from the location of GNSS sites, the ZTD of the nearest four grid point needs to be calculated firstly, and then the grid ZTD are interpolated to the location of GNSS sites. Generally, the grid point ZTD is calculated based on the ERA5 pressure-level data using the integral method with the formula as follows [38]:
where k1 = 77.604 K/Pa, k2 = 64.79 K/Pa, k3 = 377600.0 K2/Pa, P represents the atmospheric pressure, h the specific humidity, N the total refraction, and e the vapor pressure. Then the ZTD is calculated by the following formula:
The integral content between different levels is calculated using the trapezoidal formula as:
ZTD derived from the surface-level data mainly uses the traditional Saastamoinen method as the following [7].
where T represents the temperature at the GNSS station, P represents the atmospheric pressure, e represents the partial pressure of water vapor, represents the relative humidity, represents the latitude, and H represents the height of the site. It is worth noting that the reference planes of the geopotential height and GNSS altitude are different, but should be unified [39]. The ZTD of the grid point calculated in this paper is at the height of GNSS stations. Since the surface-level data do not provide relative humidity, it can be calculated using 2 m temperature and 2 m dewpoint temperature. The relative humidity is calculated using the formula given by Haase [40] as
where Td is the dewpoint temperature, T is 2 m temperature, is saturation vapor pressure. In the case that the temperature is higher than 0 °C, R2 = 6.112hpa, R3 = 17.502K, R4 = 32.19K, T0 = 273.16K. In the case that the temperature is lower than −23 °C, R3 = 22.587K, R4 = −0.7K. In the case that the temperature is higher than −23 °C and lower than 0 °C, the calculating formula is as follows
where Ti = 250.16K, represents the saturation vapor pressure value in the first case, represents the saturation vapor pressure value in the second case, and represents the saturation vapor pressure value in the third case.
The deriving of ZTD from pressure-level data needs two steps: calculating the zenith delay by integration method from Level 1 to Level 37, and calculating the tropospheric delay above the top level using the Saastamoinen model to make comparable results [28]. Then the ZTD of GNSS stations was obtained by interpolation on the basis of the ZTD of grid points.
2.2.3. Deriving ZTD from GNSS
The GNSS data from 2015 to 2016 were processed by BERNESE5.2 software in the post-processing mode to get ZTD values, which were estimated every 1 h. GNSS ZTD can be solved with the strategies described in Table 1 [41,42].
The ZTD time series from ERA5 was compared with that from GNSS so that the residuals could be obtained. Then the deviation (bias), Mean Absolute Error (MAE) and Root Mean Square (RMS) error were calculated to evaluate the ZTD accuracy for each station. The temporal and spatial features were analyzed in detail afterwards. The formulas for calculating bias, MAE and RMS are expressed as follows:
where is the ERA5 ZTD at time i, is the GNSS ZTD at time i. N represents the amount of epoch. Bias represents the systematical difference between ERA5 ZTD and GNSS ZTD, MAE and RMS measure the precision of ERA5ZTD against GNSS ZTD.
3. Evaluation and Analysis
3.1. Temperature and Pressure Evaluation
Meteorological observations from 193 GNSS sites were selected as reference for evaluating the accuracies of the ERA5 pressure and temperature. The atmospheric pressure and temperature derived from ERA5 surface-level data and pressure-level data were calculated at each station throughout 2015 as shown in Figure 2 and Figure 3. Further statistics of bias and RMS of temperature and pressure are shown in Table 2.
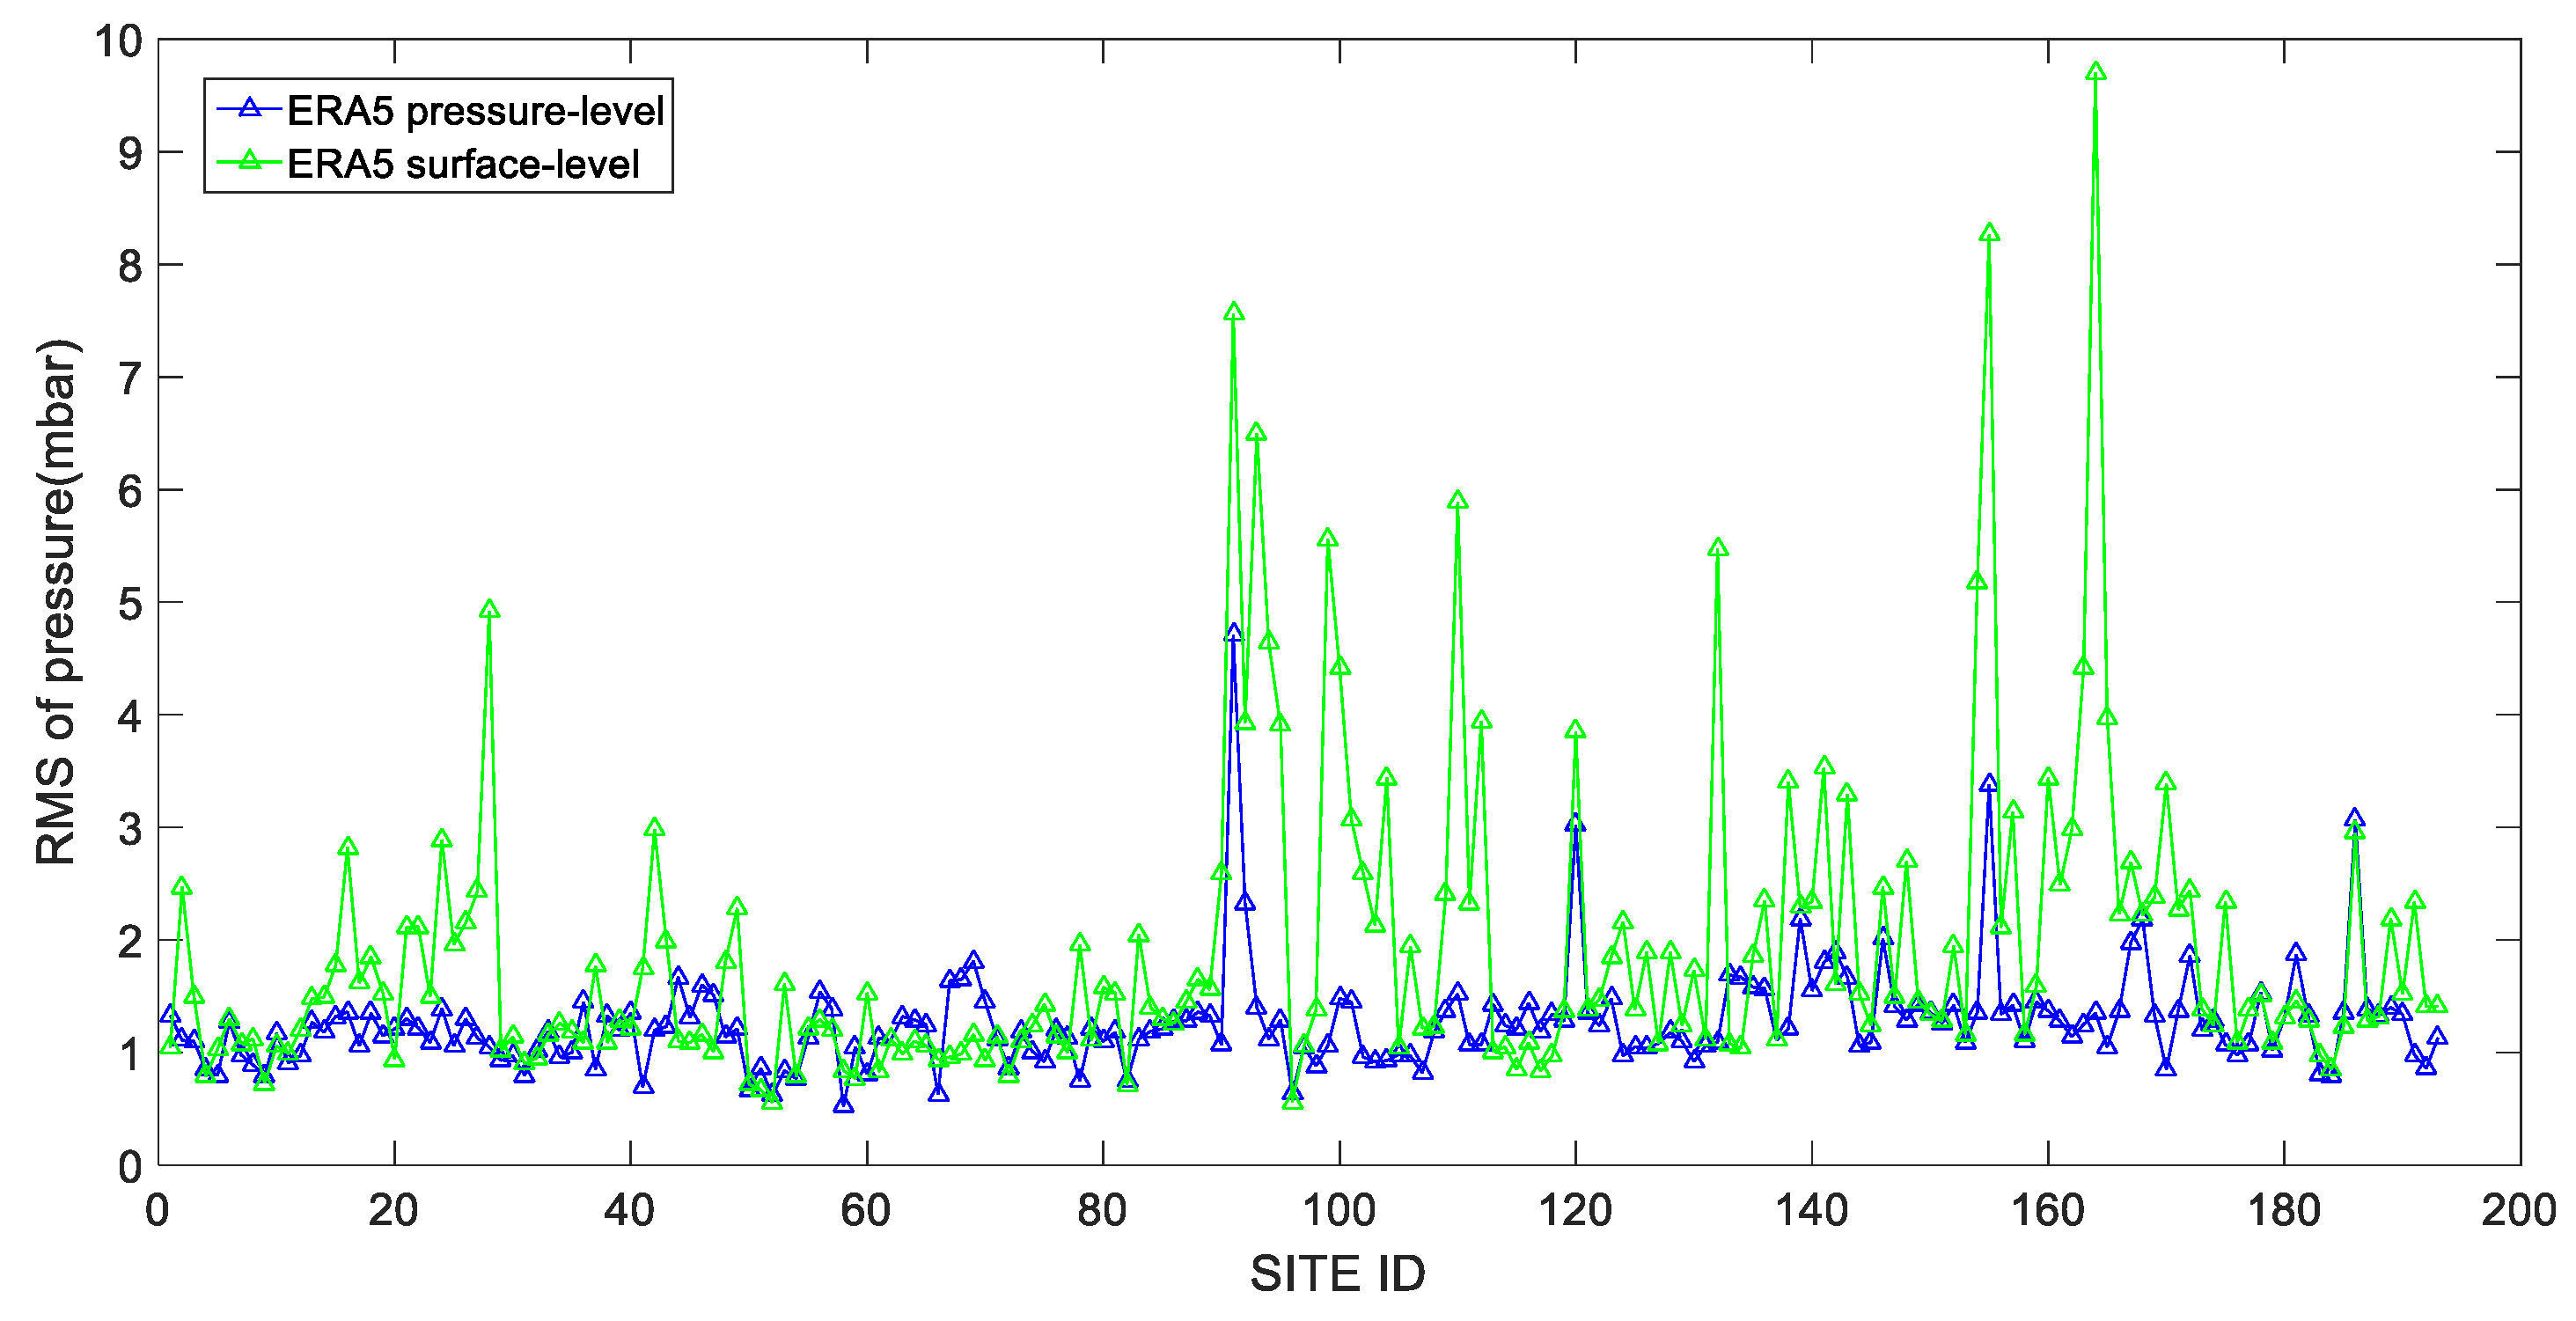
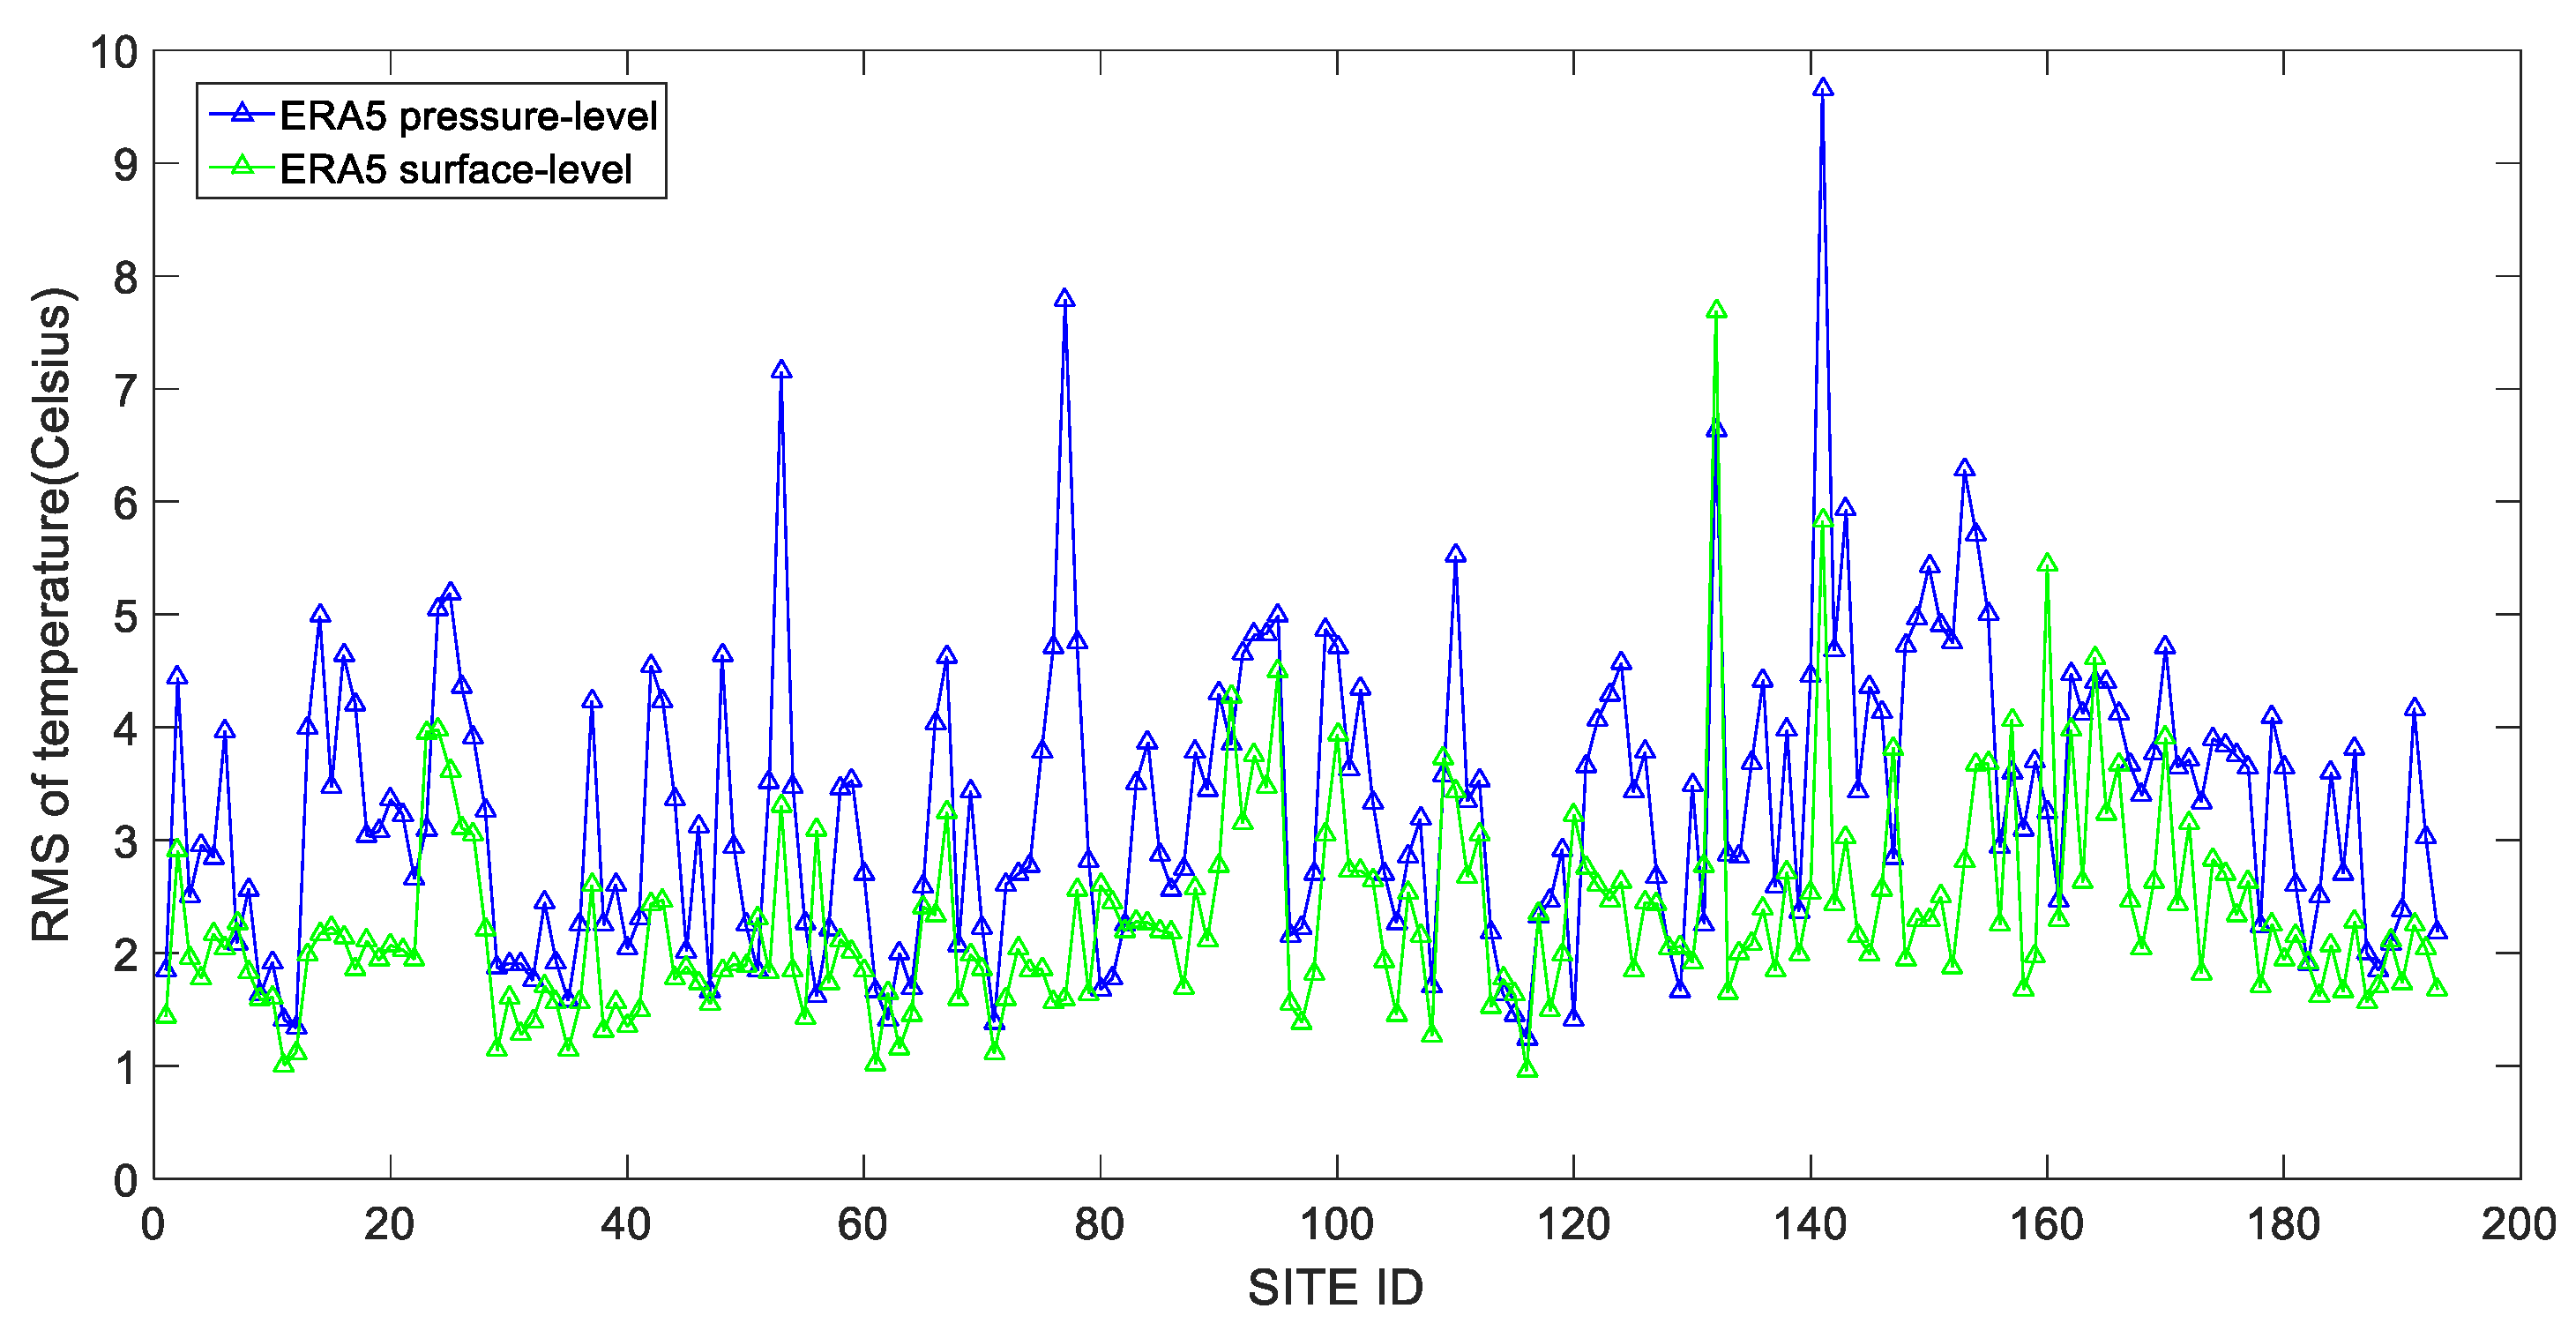
It can be seen from Figure 2, Figure 3 and Table 2 that for most stations the atmospheric pressure derived from ERA5 pressure-level data has a higher accuracy than that from ERA5 surface-level data. The accuracy difference of ERA5 temperature and pressure between stations selected for evaluation is relatively small. The temperature derived from ERA5 surface-level data is more accurate than that of pressure-level data in most stations. It can be found that the annual average RMS values of the atmospheric pressure derived from the pressure-level data and the surface-level data are 1.26 mbar and 1.91 mbar, respectively. The annual average RMS values of the temperature from pressure-level data and surface-level data are 3.32 °C and 2.31 °C, respectively. The results imply that ERA5 atmospheric temperature and pressure agree well with the measured temperature and pressure. According to China’s climate characteristics, for the commonly used Saastamoinen model, if we use T = 12 °C, P = 1000 mbar, H = 5000 m, = 20°, a pressure error of 1 mbar leads to a ZHD error of 2.2 mm and a temperature error of 1 °C leads to a ZWD error of 6.2 mm. Therefore, the pressure and temperature derived from ERA5 with such accuracy can be used in the calculation of ZTD in China, which is important for GNSS tropospheric delay correction at stations not equipped with meteorological sensors. On the other hand, when just using the temperature or pressure from ERA5 over China in case of availability for both the surface-level and the pressure-level data, it is recommended that the pressure should be interpolated using the pressure-level data of ERA5, and the temperature be calculated using the surface-level data of ERA5.
3.2. Evaluation of ERA5ZTD
The evaluation of ERA5 ZTD was conducted with respect to GNSS ZTD from 219 stations which are uniformly distributed over China. The hourly ZTD time series covers the period from 2015 to 2016. The accuracies of the ERA5 ZTD from pressure-level data and surface-level data are shown in Figure 4, Figure 5 and Table 3 in terms of bias and RMS.
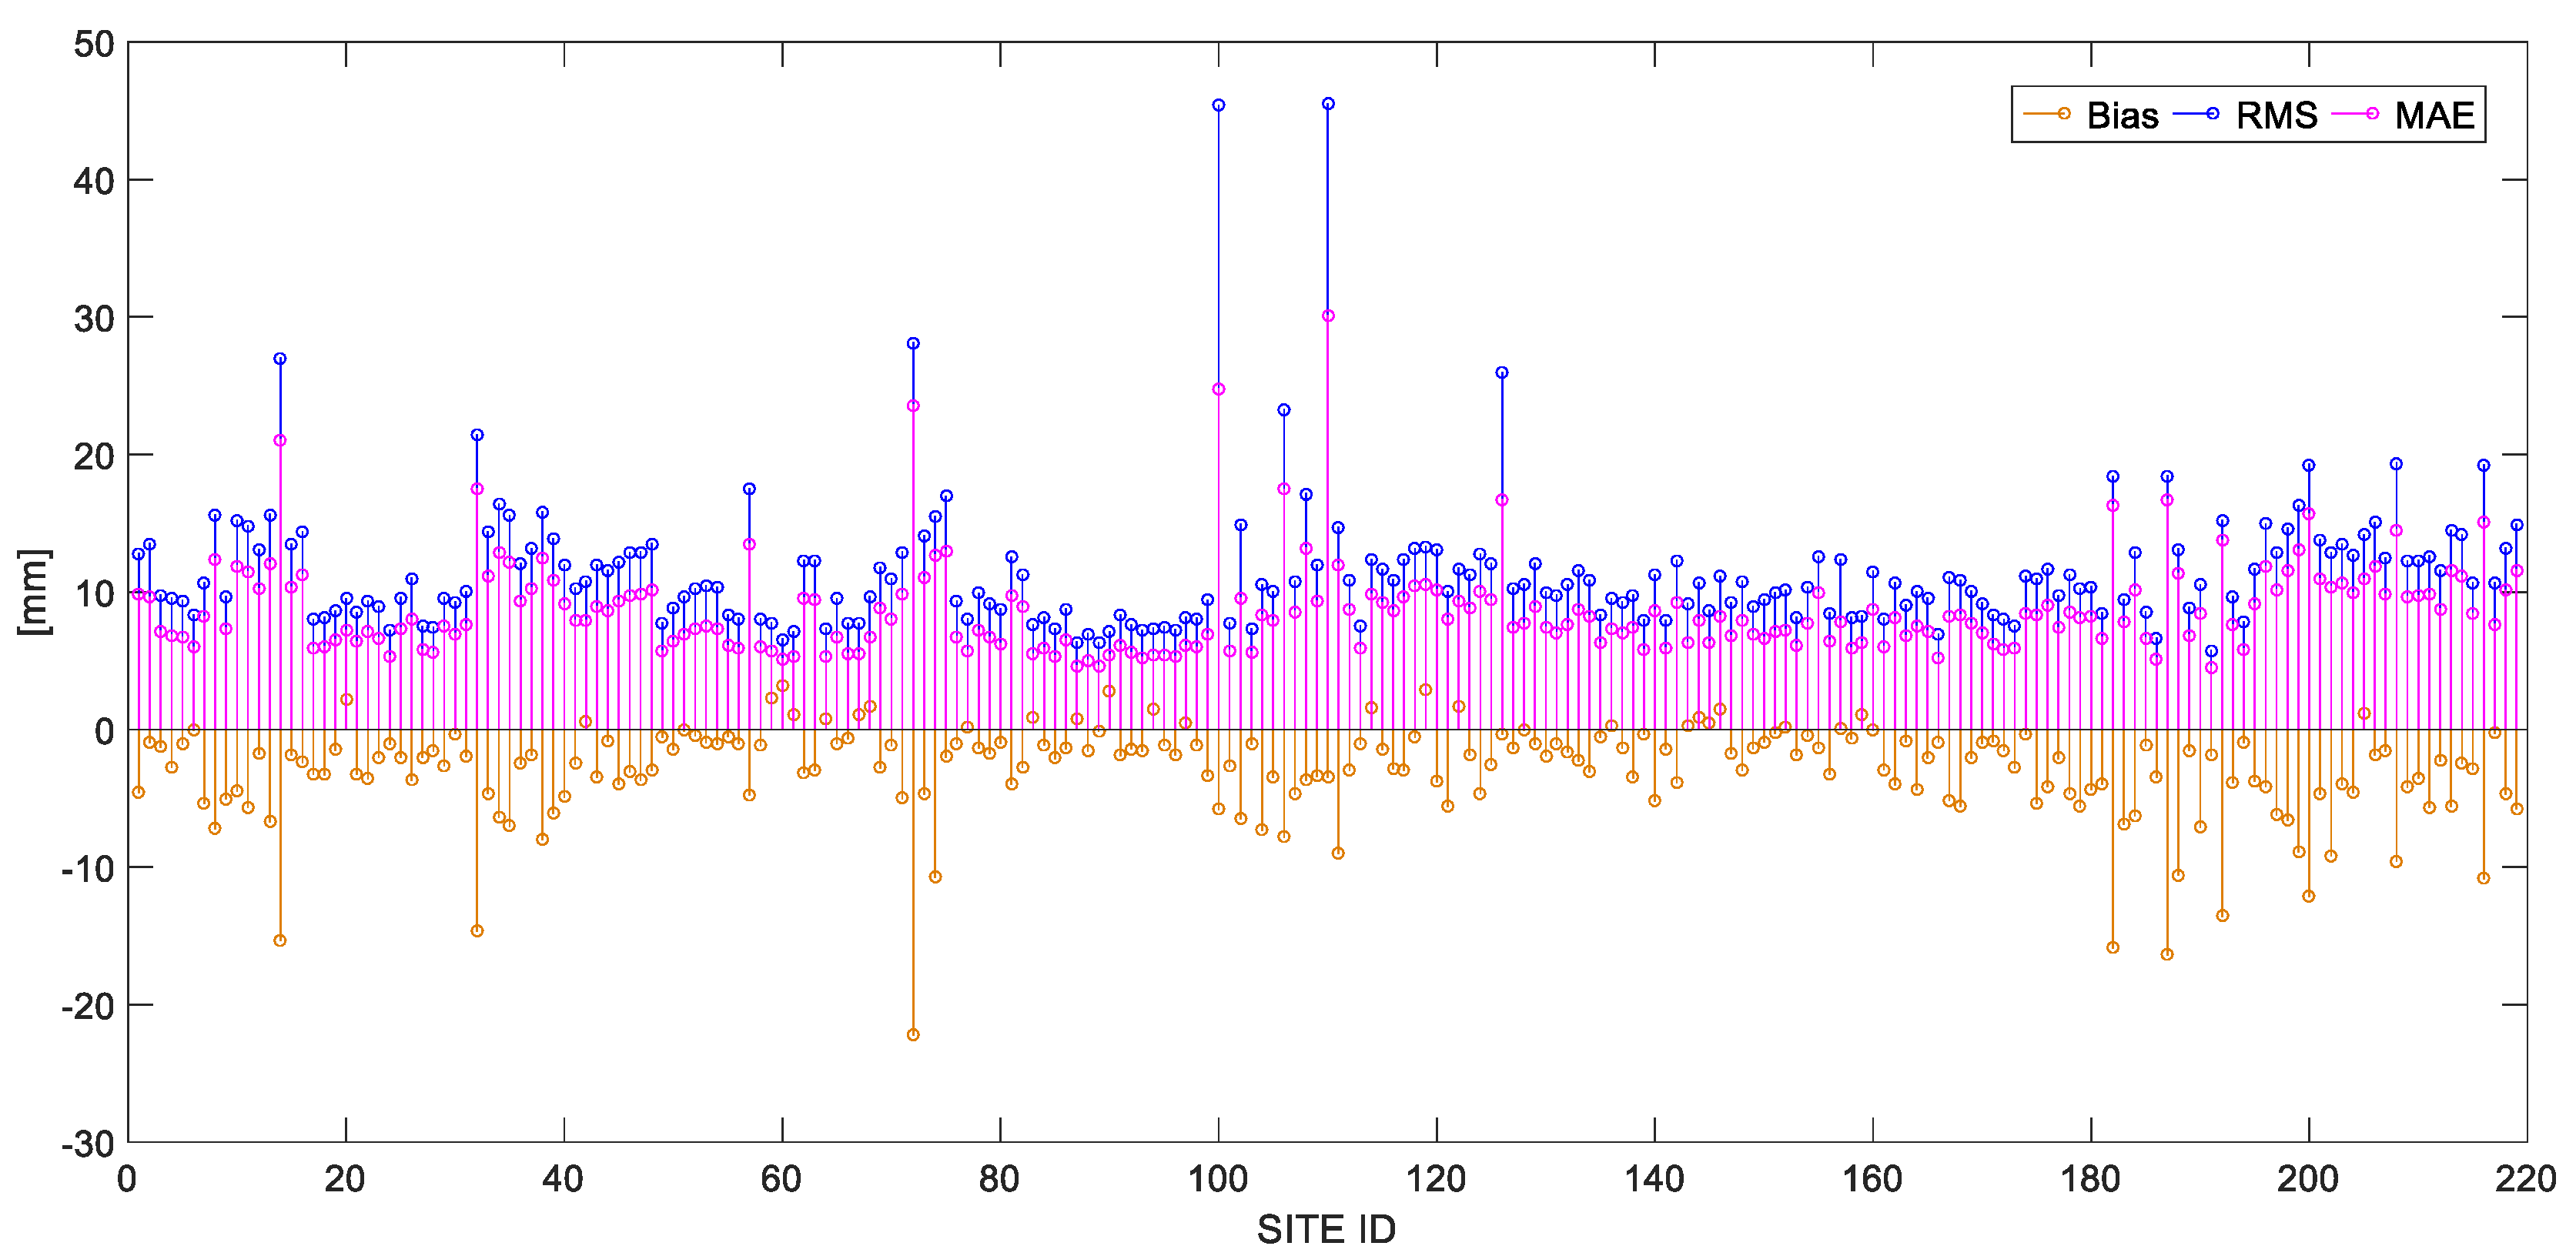
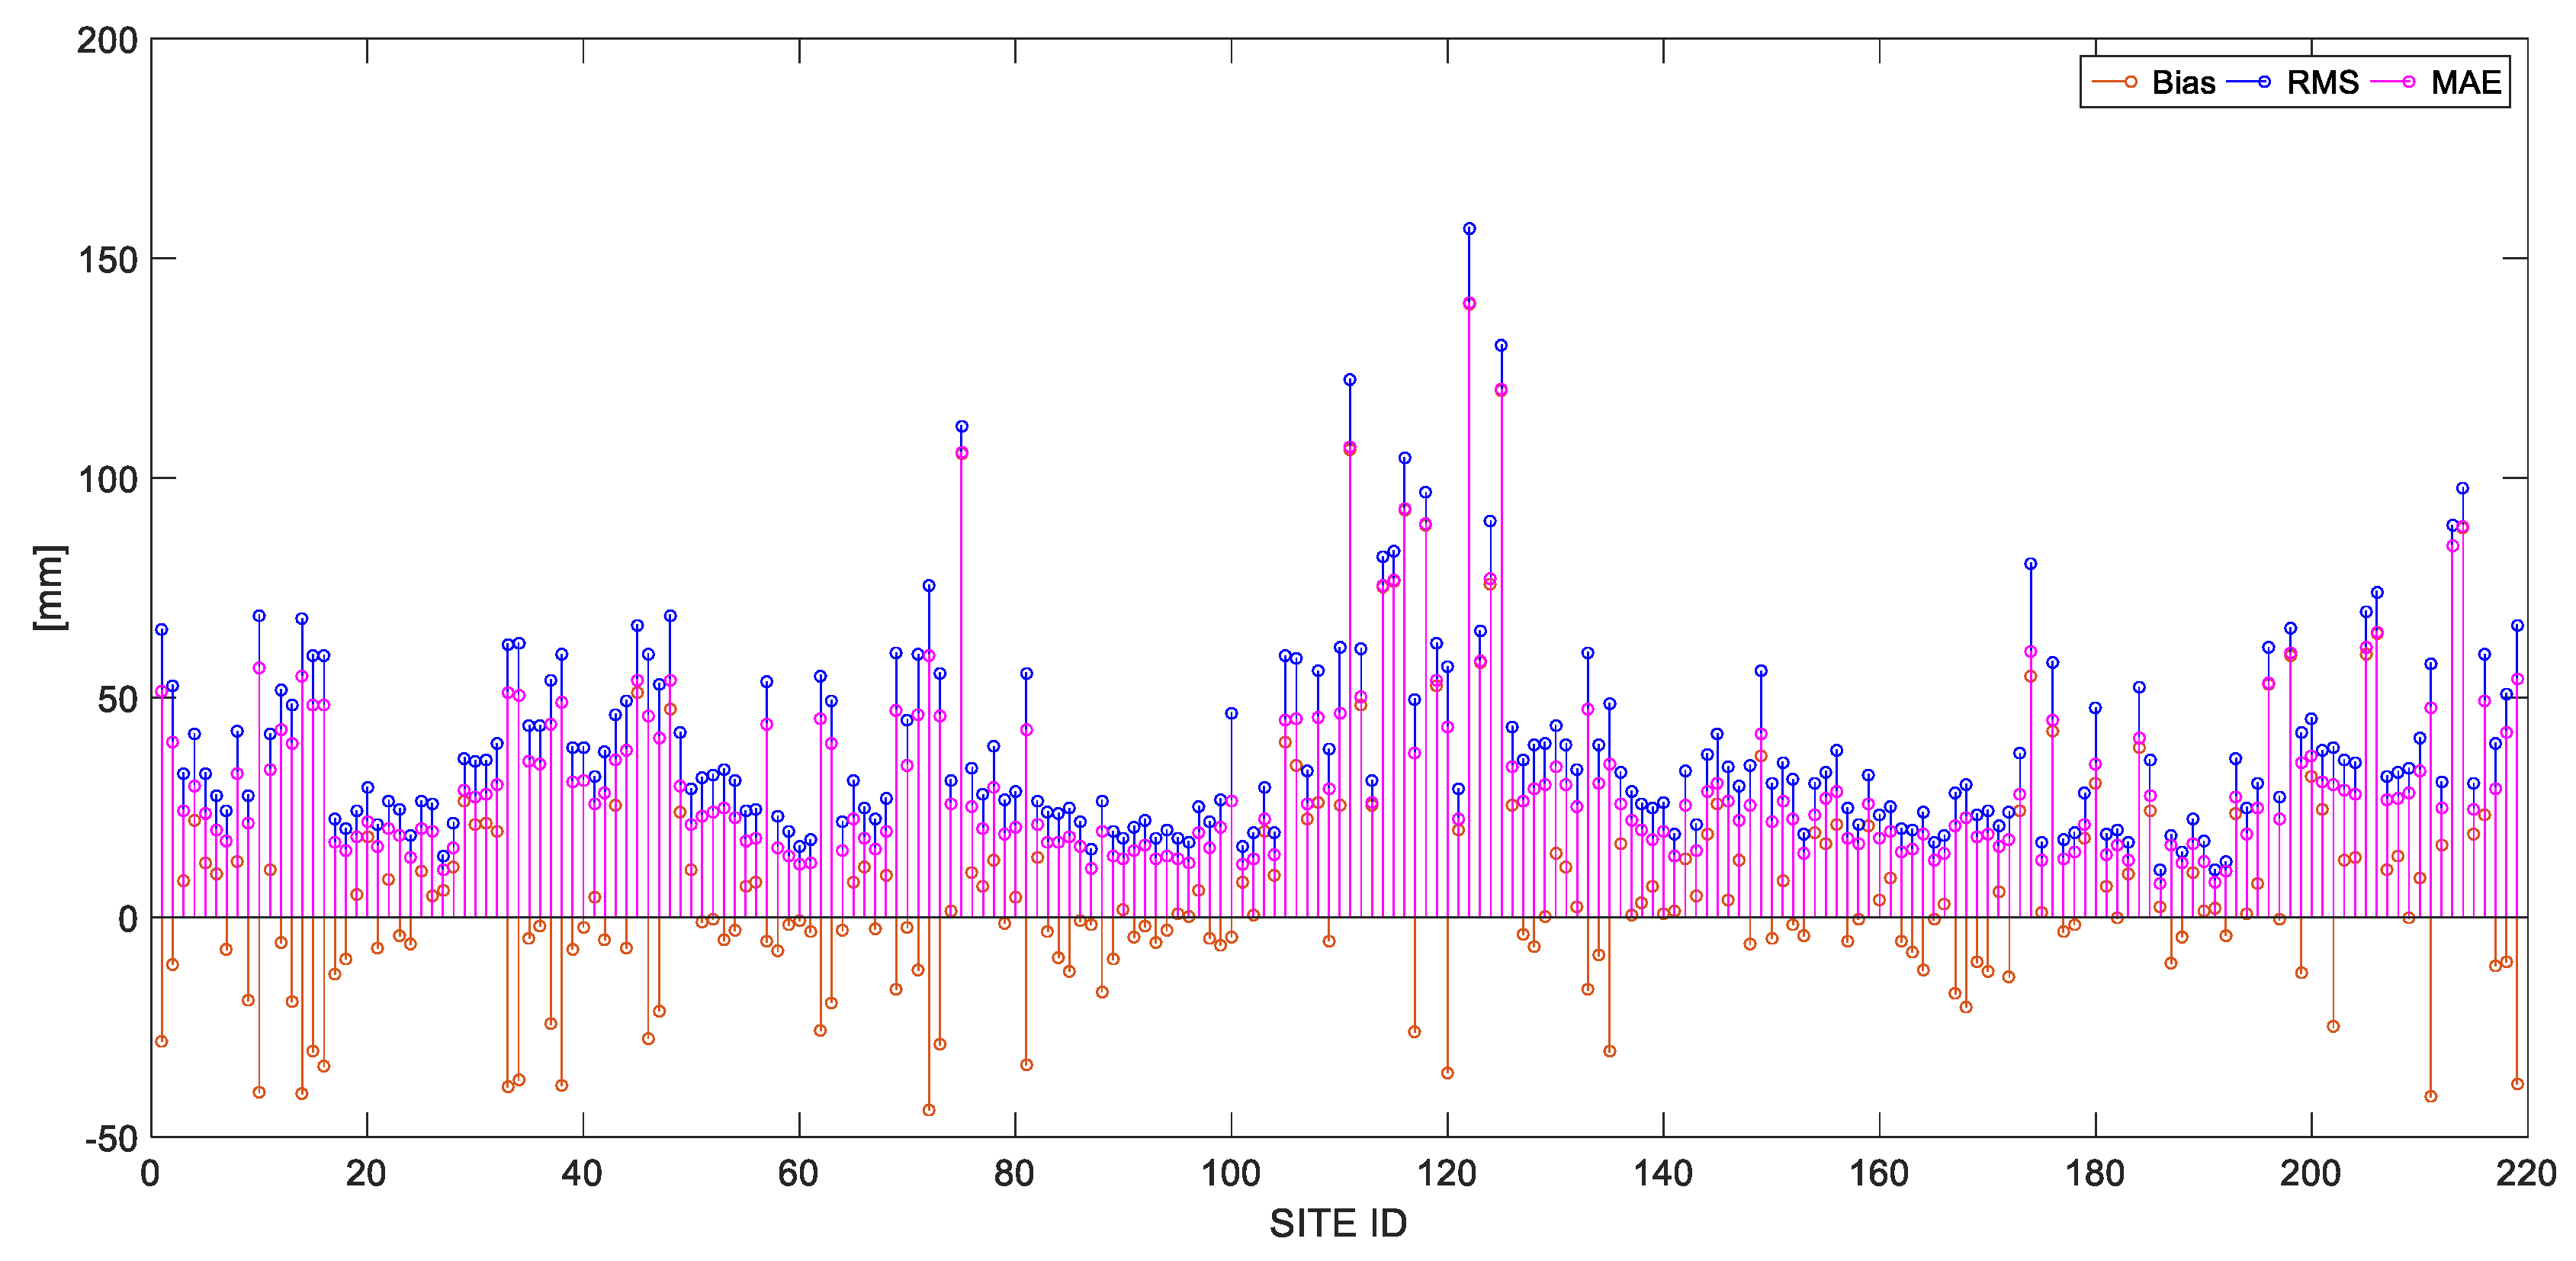
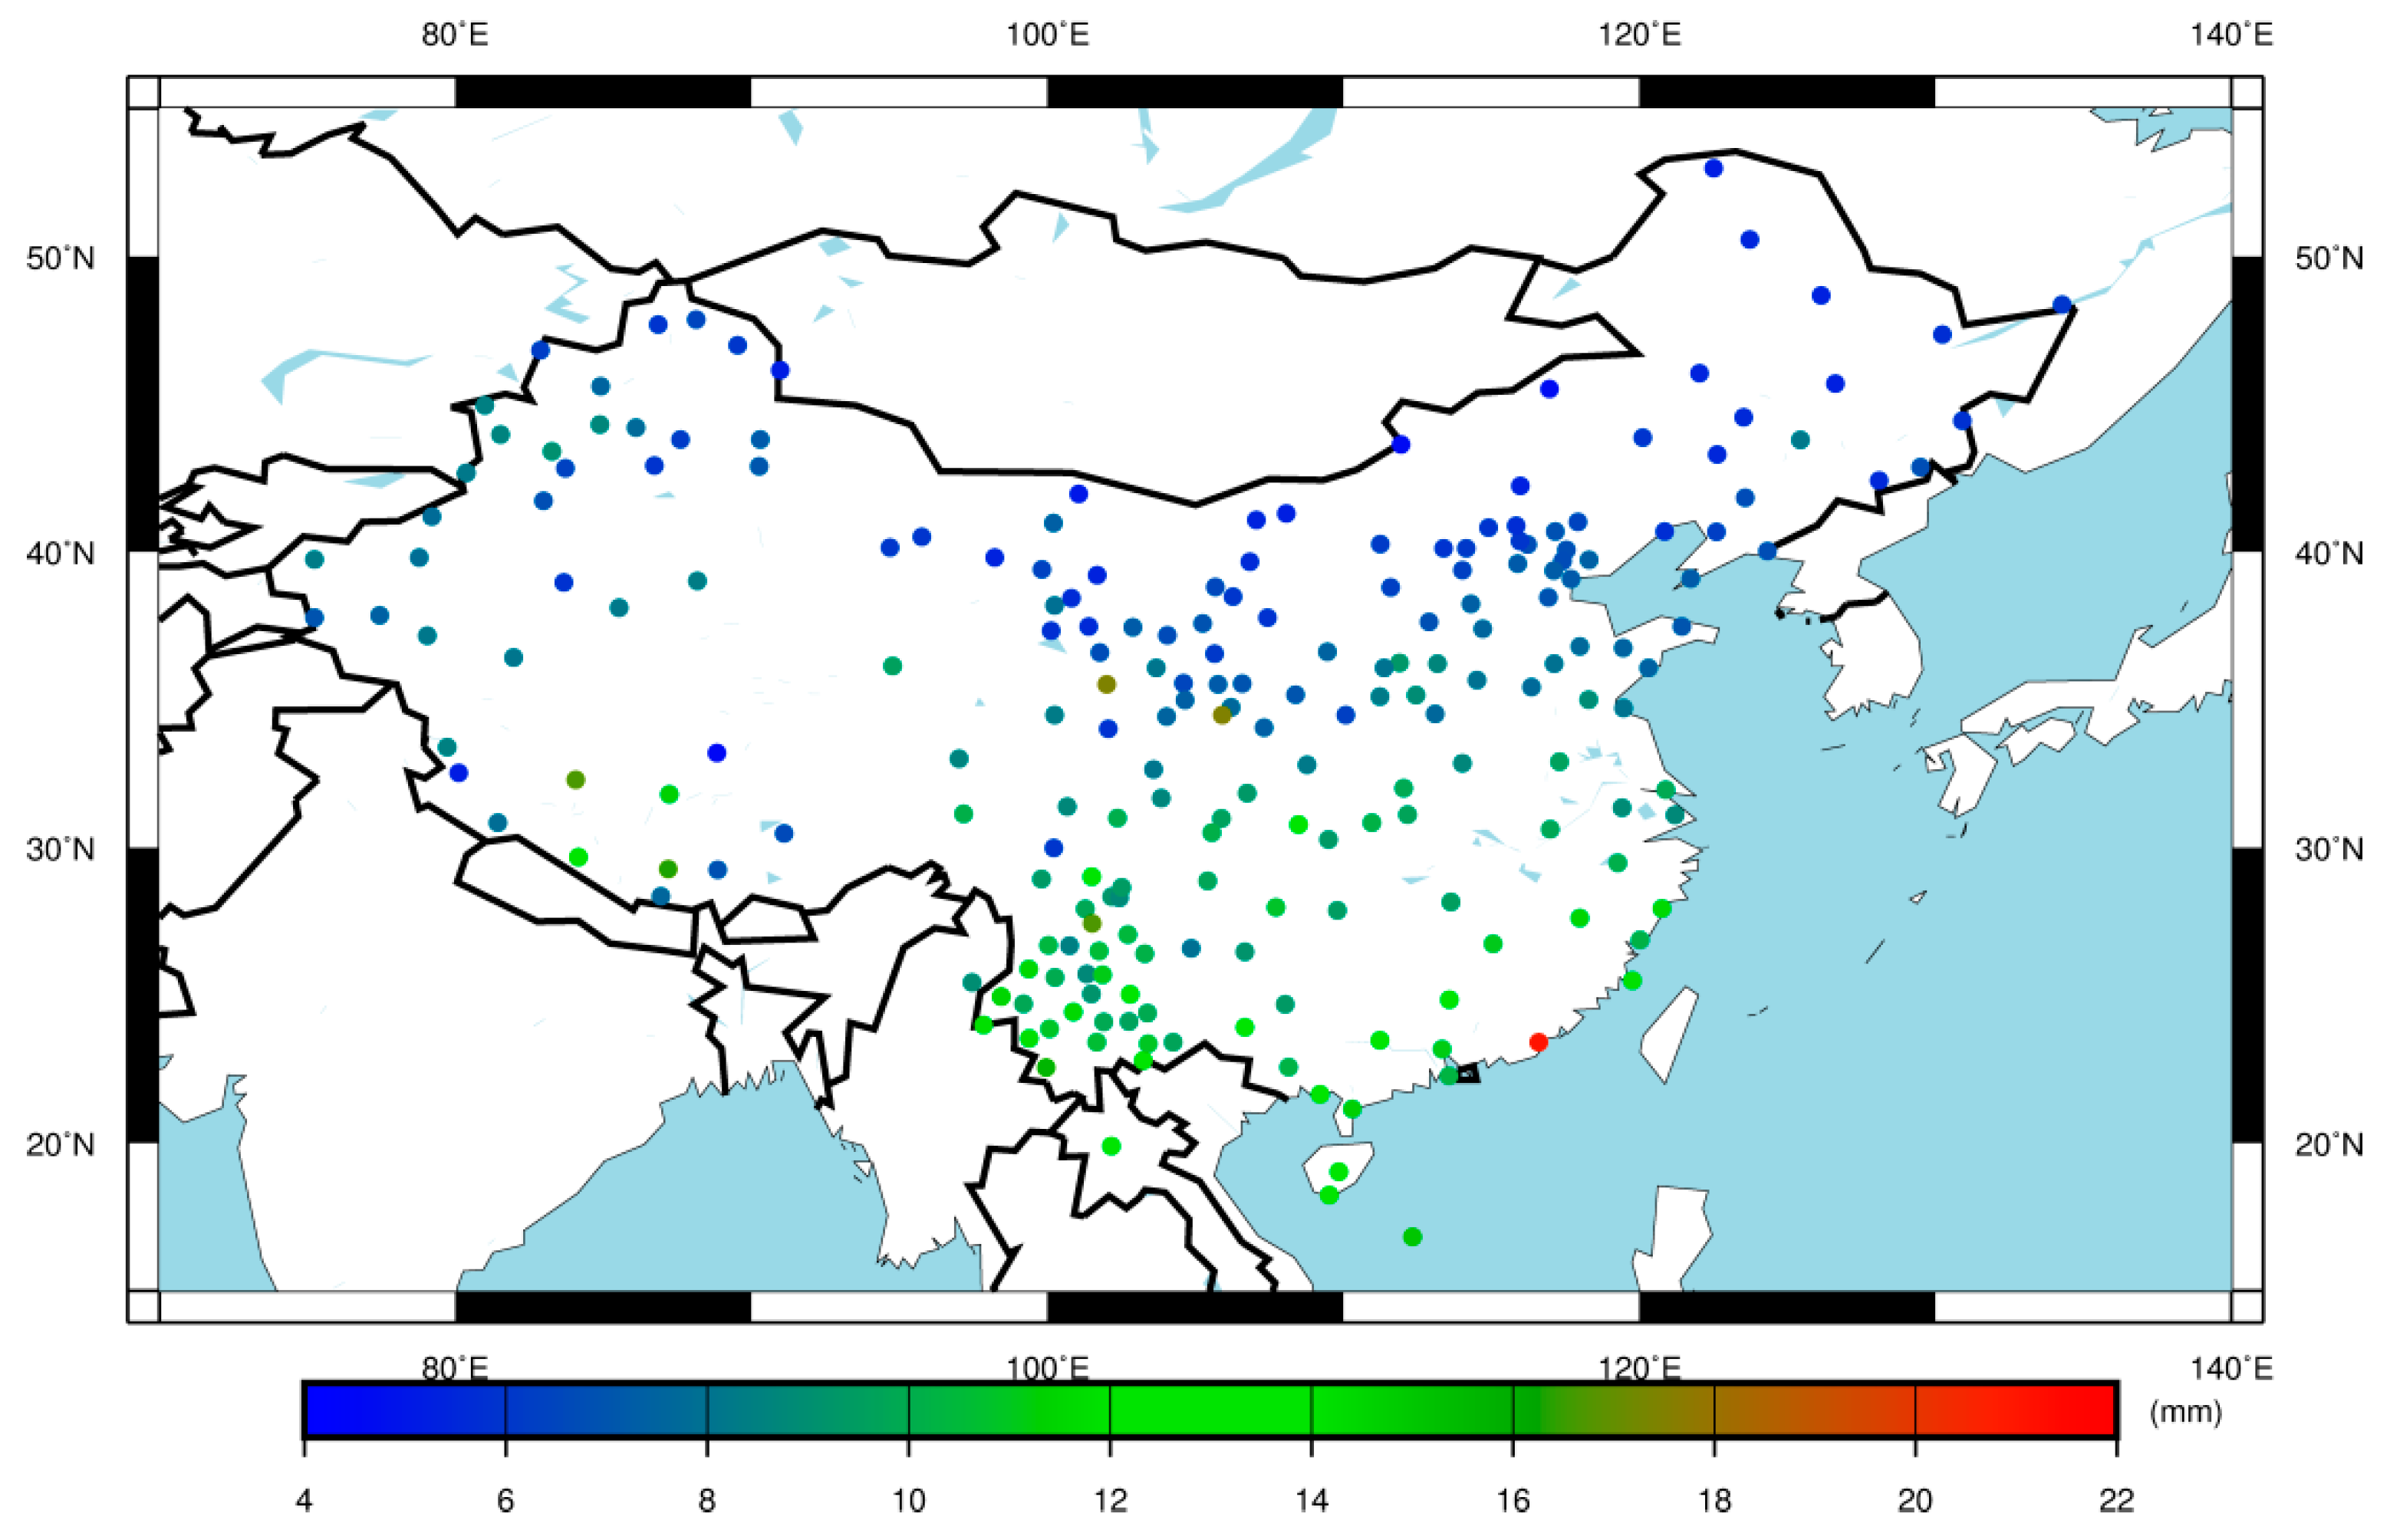
The absolute values of the bias calculated by ERA5 pressure-level ZTD compared with GNSS ZTD are less than 6 mm for 90% of 219 stations. It also can be found that the RMS values of difference between ERA5 pressure-level ZTD and GNSS ZTD are less than 15 mm for 92% of 219 stations. The reason the error of few sites seems higher than others in Figure 4 and Figure 5 may be that they are all located in mountainous areas of Qinghai province and Sichuan province, where the terrainis complex and the climate is changeable with the plateau characteristics. The average bias, MAE and RMS of ERA5 pressure-level ZTD of all GNSS stations in statistics are about 2.97 mm, 8.73 mm and 11.49 mm, respectively. Compared with ERA5 surface-level with bias of 7.97 mm, MAE of 31.19 mm and RMS of 39.25 mm, ERA5 pressure-level ZTD agrees much better than surface-level ZTD with GNSS ZTD and is more suitable for tropospheric delay correction and ZTD modeling over China. Thus, the following comparison and analysis are mainly based on ERA5 pressure-level ZTD.
3.3. Accuracy Comparison of ERA5 ZTD and ERA-Interim ZTD
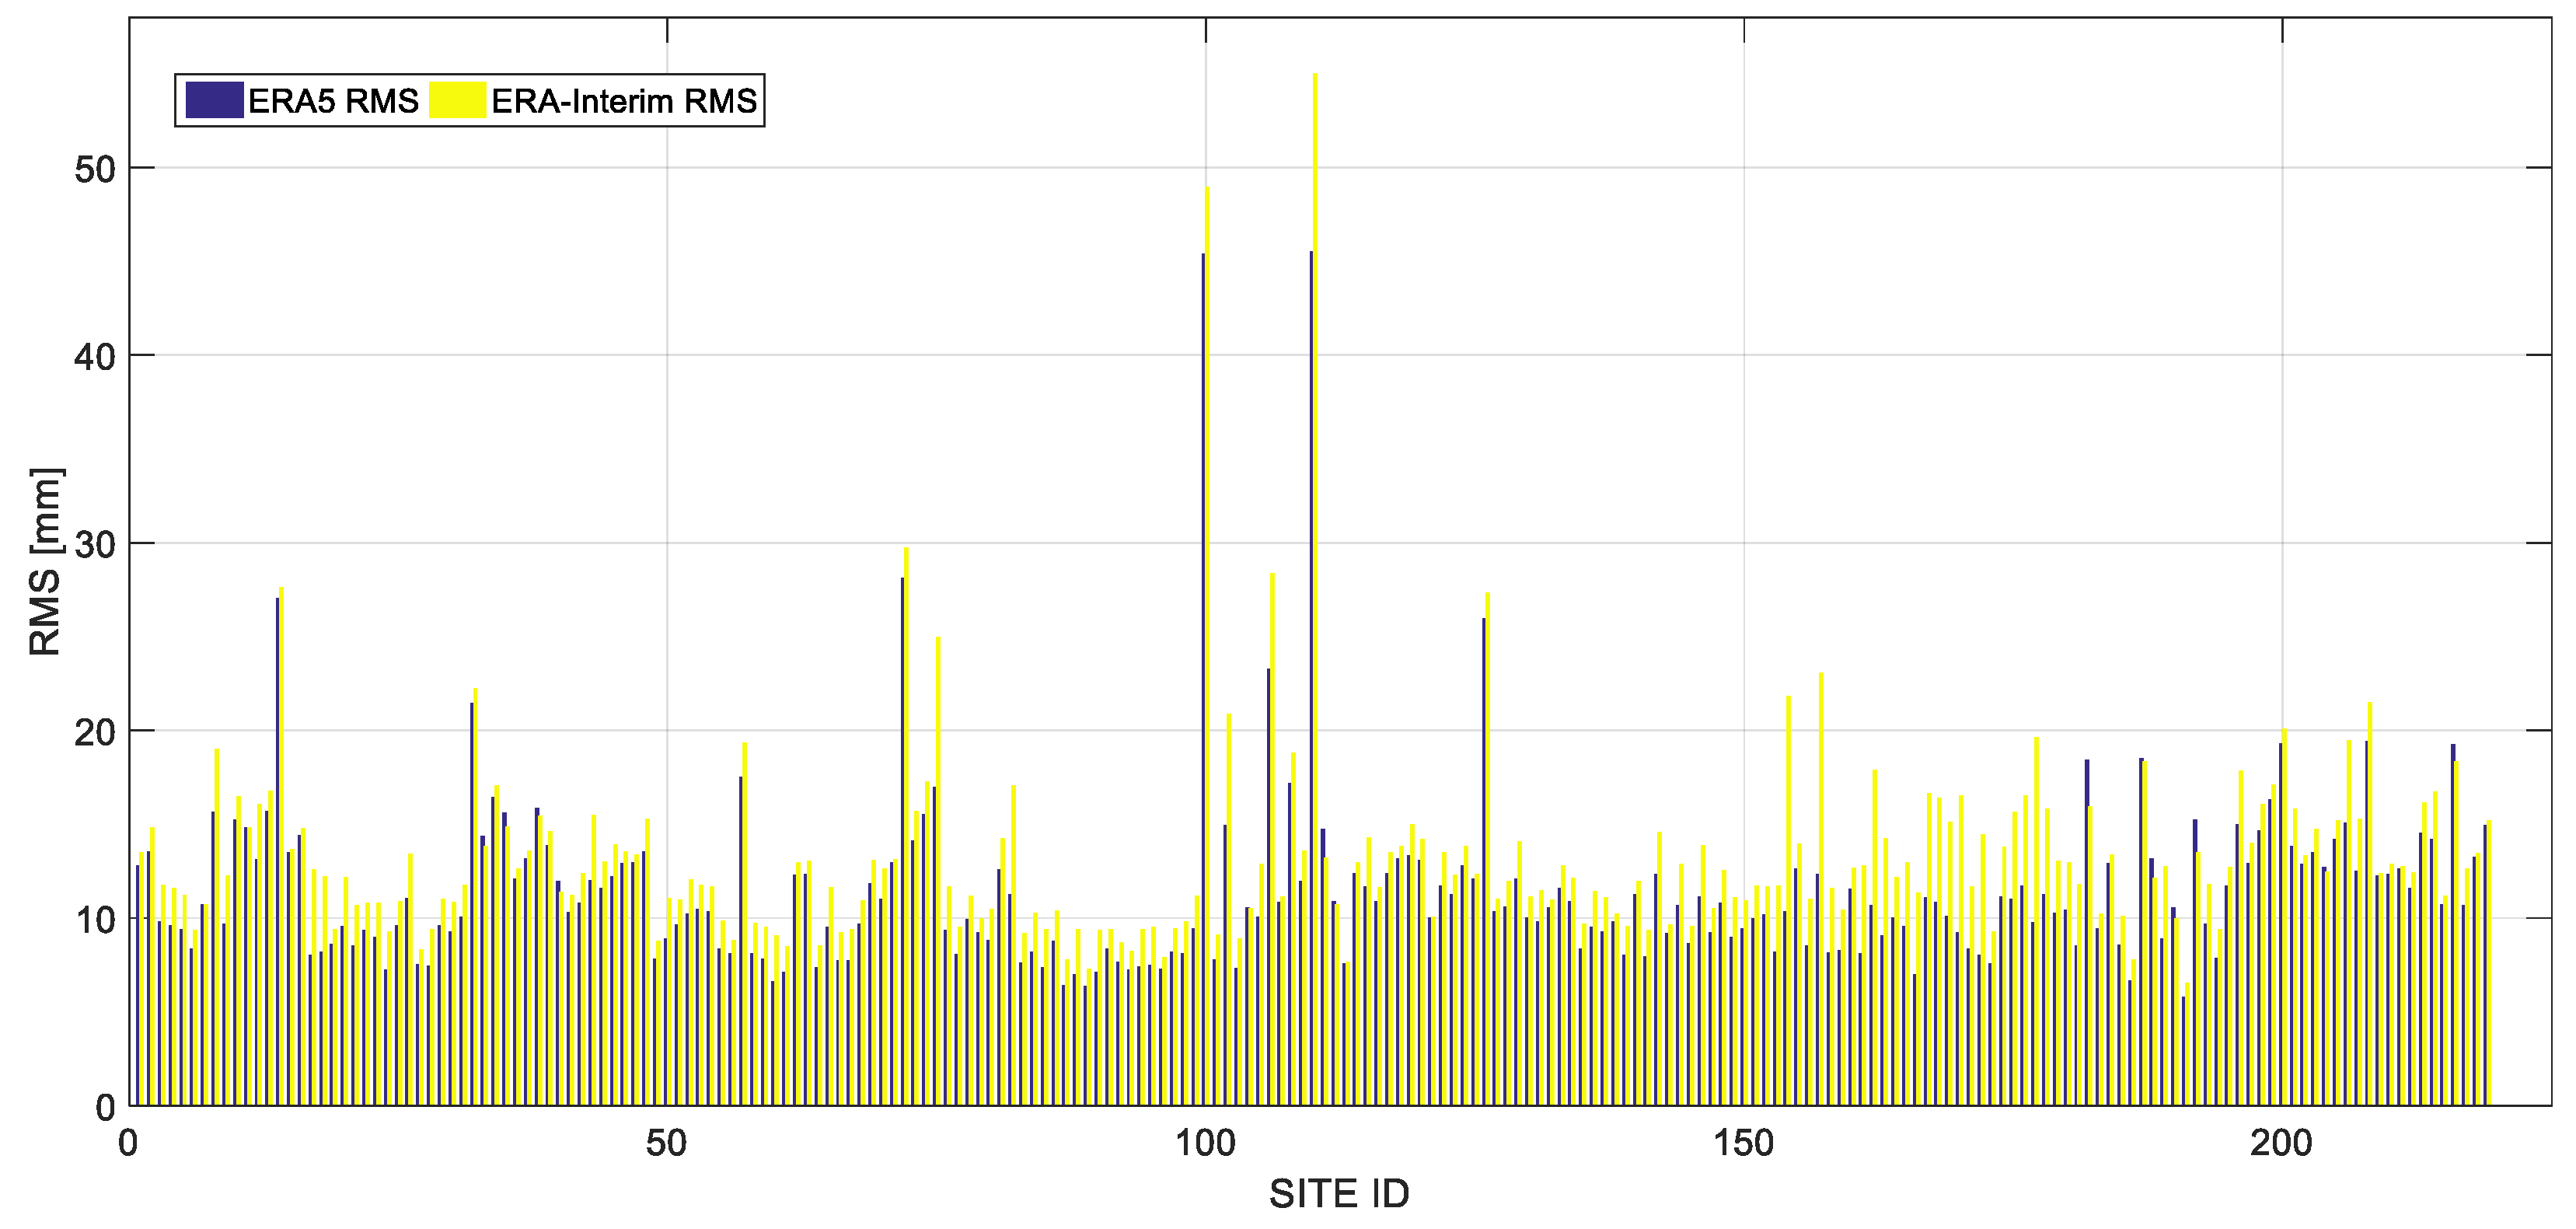
To further analyze the performance of ERA5 ZTD over China, this paper compares the ERA5 ZTD with the ZTD derived from ERA-Interim, which has been widely used to develop GNSS tropospheric model. RMS values of ERA5 ZTD and ERA-Interim ZTD compared with GNSS ZTD are shown in Figure 6, Figure 7 and Table 4.
It can be seen from Figure 6 and Figure 7 and Table 4 that ERA5 performs better than ERA-Interim with less average RMS values. The average RMS values of ZTD calculated by ERA-Interim pressure-level data and surface-level data are 13.33 mm and 44.07 mm, respectively, and the average RMS of ZTD calculated by ERA5 pressure-level data and by surface-level data are 11.49 mm and 39.25 mm, respectively. The accuracies of the ZTD calculated by ERA5 pressure-level data and surface-level data are 13.8% and 10.93% higher than those of ERA-Interim respectively.
3.4. ERA5, ERA-Interim, GNSS, and GPT2w ZTD Comparison
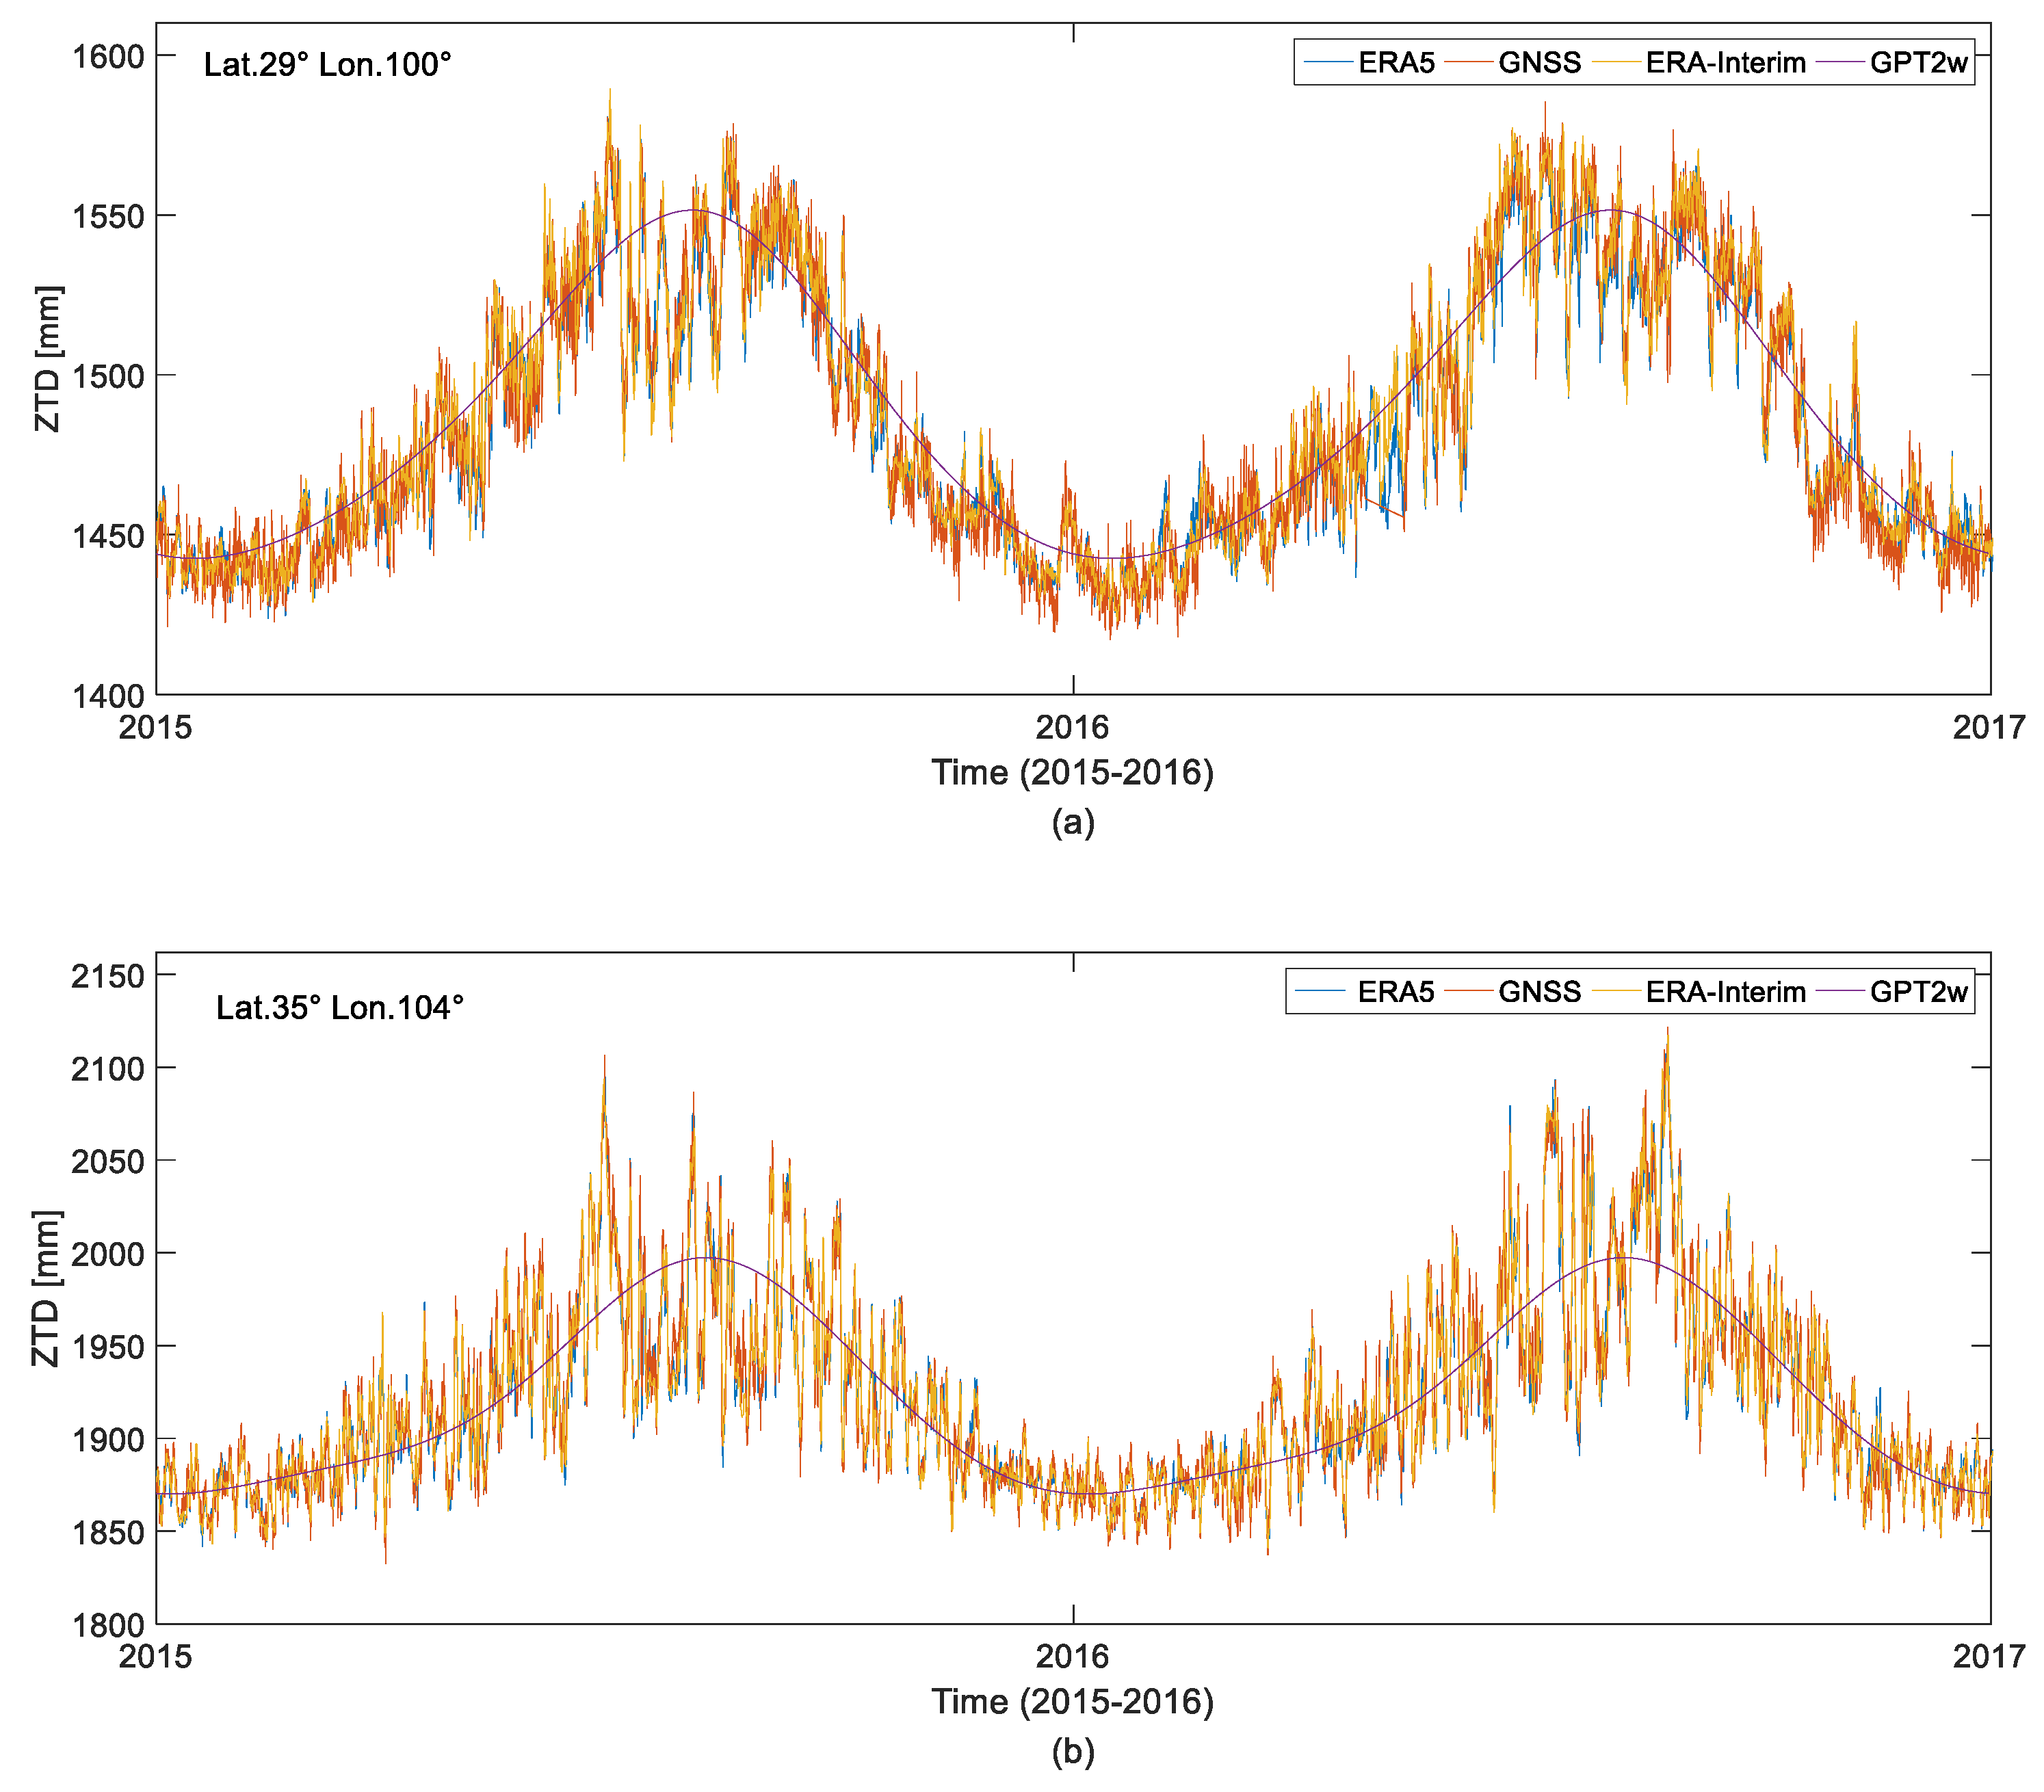
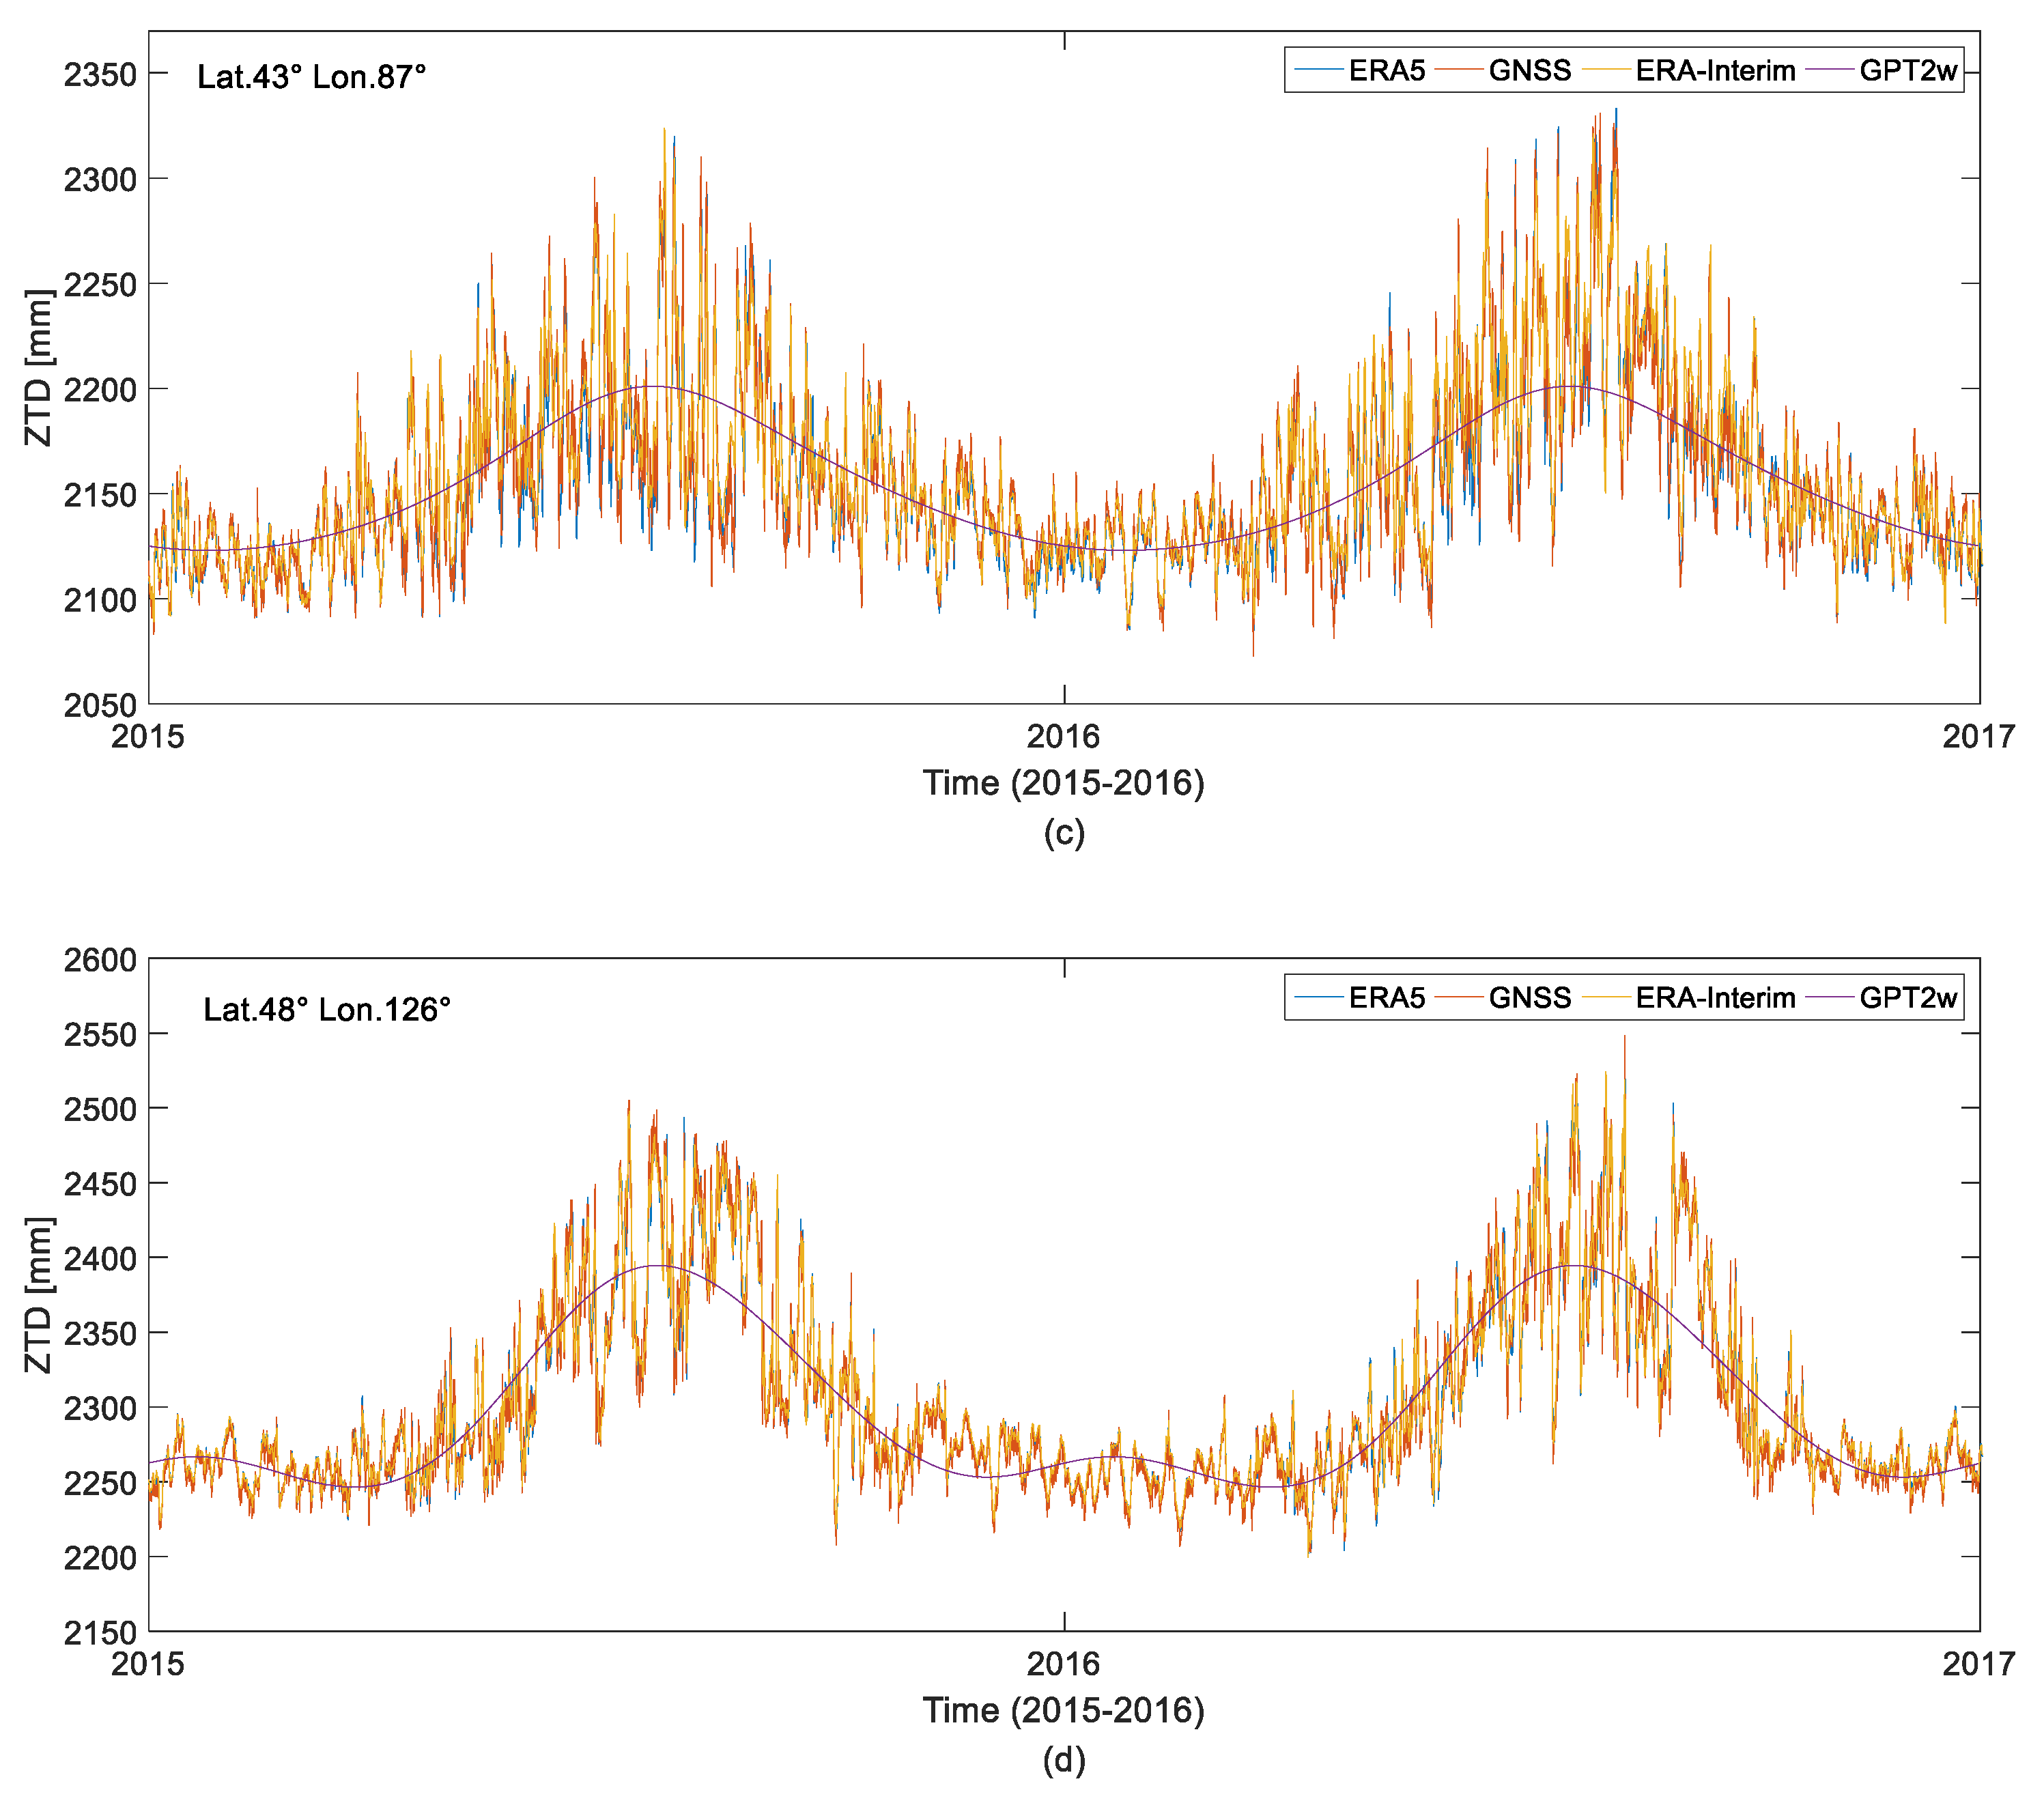
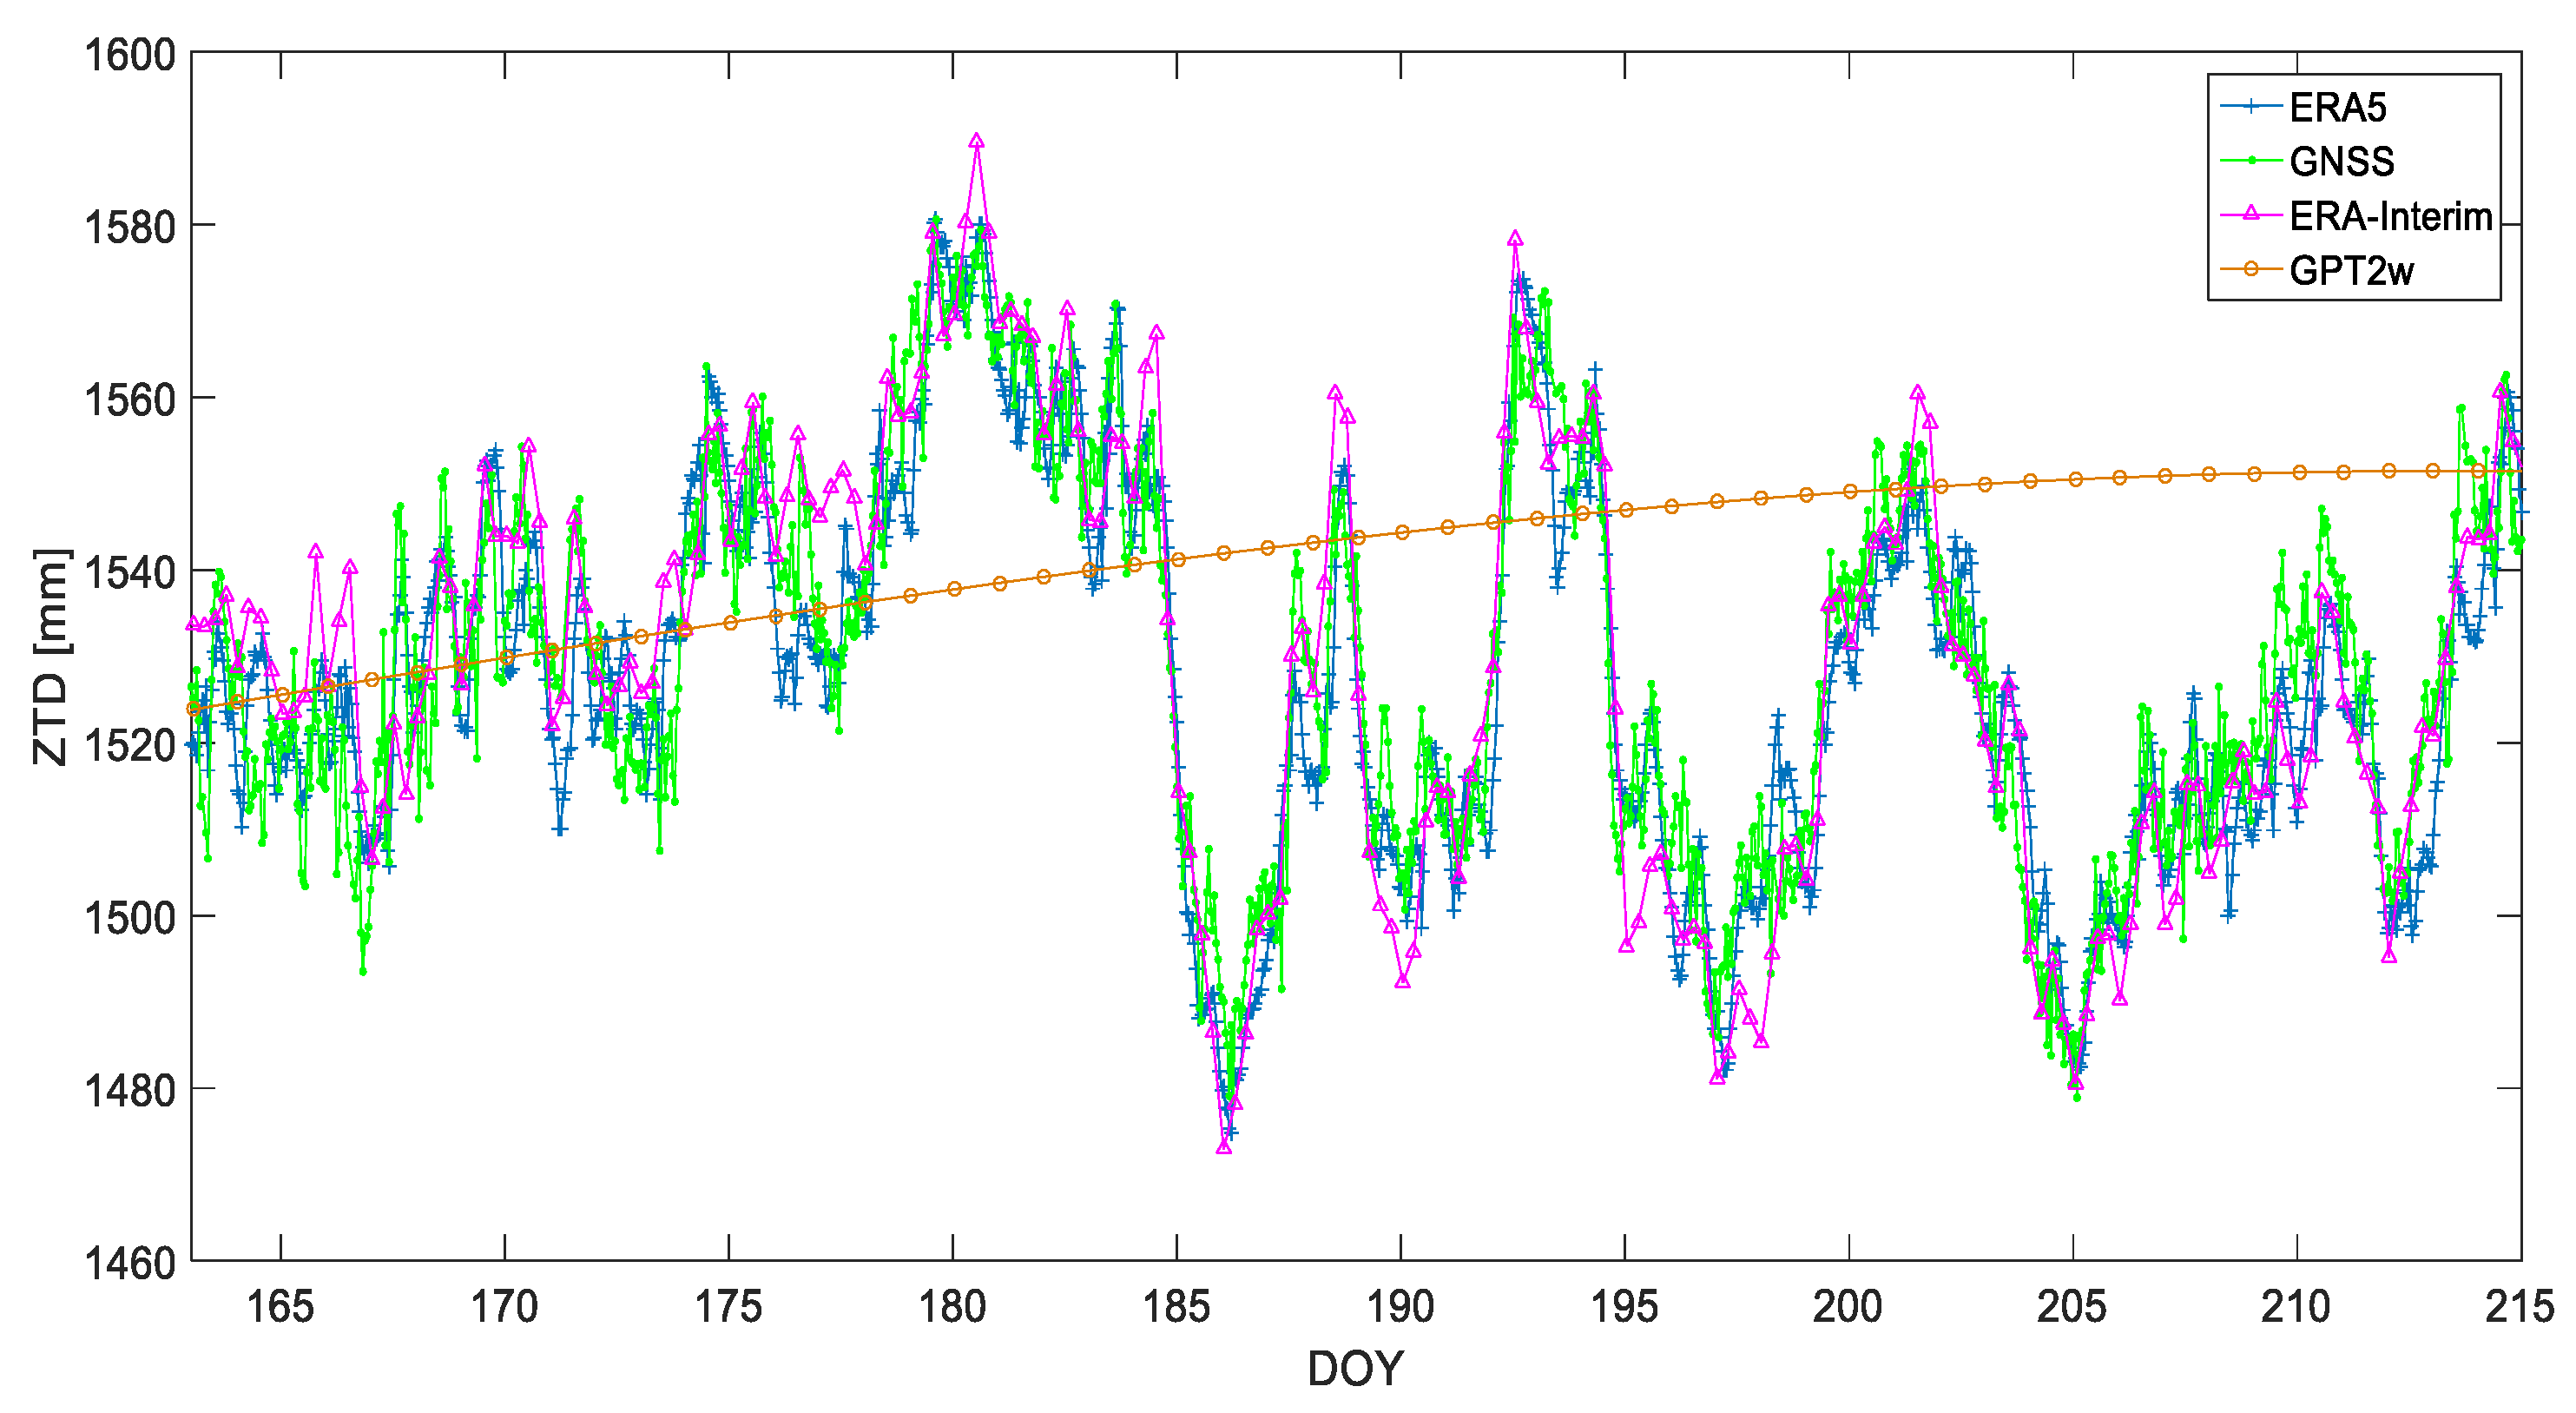
To further analyze the performance of ERA5 ZTD calculated by integration method, it was compared with GNSS, ERA-Interim, and GPT2w ZTD time series during the two years period from 2015 to 2016. The ZTD time series of above-mentioned four schemes at four stations selected with different latitude and longitude are presented in Figure 8. Figure 9 is the ZTD time series of the first station in Figure 8 during a month in order to further reflect the temporal resolution of four schemes for calculating ZTD.
From Figure 8 and Figure 9, it can be seen the ERA5 ZTD agrees well with the ZTD derived from GNSS. The accuracy and temporal resolution of ERA5 ZTD are higher than those of ERA-Interim. The sub-daily variations of the tropospheric delay can be accurately reflected by the ERA5 which further indicates the better performance of the ERA5 than the GPT2w model and ERA-Interim.
3.5. The Spatial and Temporal Distribution Characteristics of ERA5 ZTD Precision
Figure 10, Figure 11 and Figure 12 show the distribution of annual average RMS and bias of ERA5 ZTD over China.
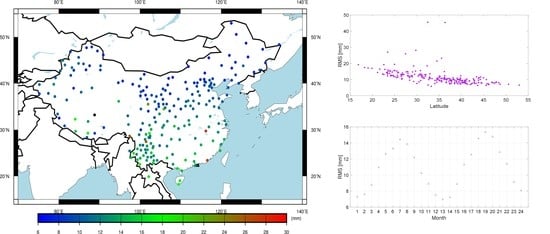
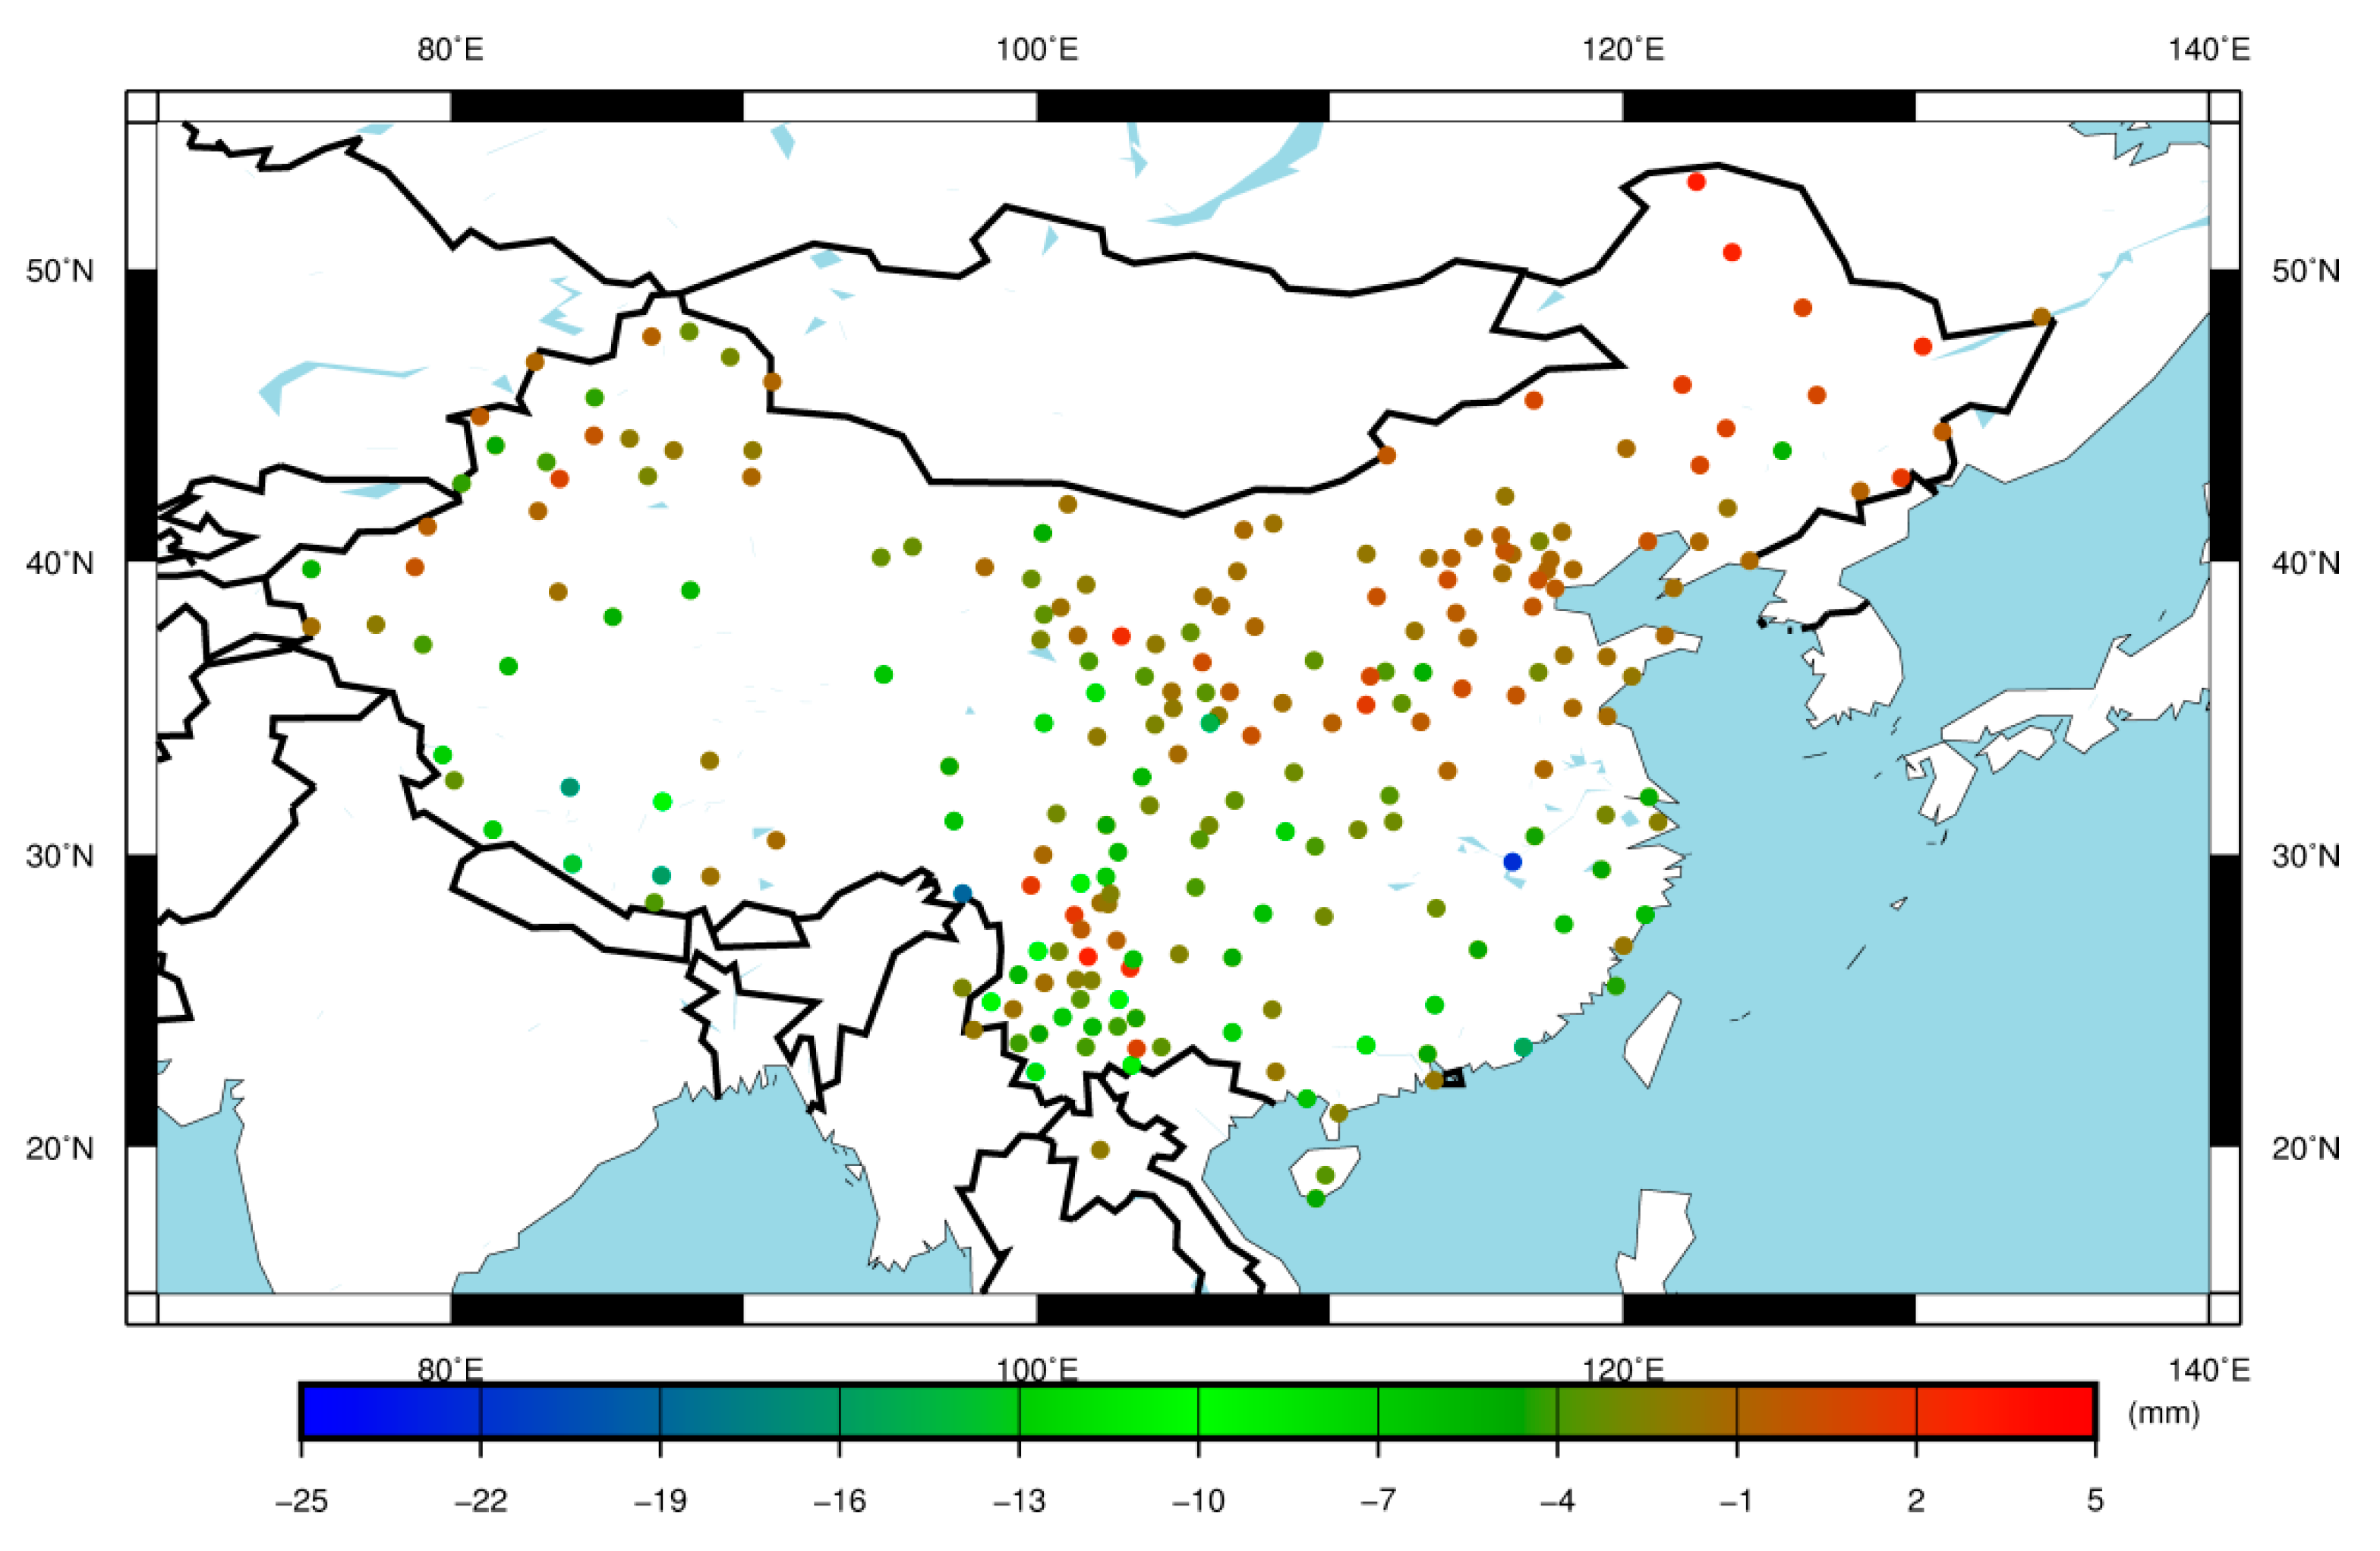
It can be seen that the agreements between the ERA5 ZTD and GPS ZTD vary from region to region. The trend of ERA5 ZTD bias in latitude is not so obvious, whereas RMS appears a clear trend. The values of RMS is larger at low latitude region and smaller at high latitude region. It has the same conclusion as Mops’s paper that the accuracy of ZTD varies in space, which is mainly related to latitude [43]. Thus, ERA5 ZTD agrees better with GNSS ZTD in the northern region with high latitude than in the southern region with low latitude. In the southern region of China with low latitude, the water vapor change is relatively active, which makes the error of ERA5 ZTD larger, resulting in larger bias and RMS. There are also differences between the east and west of the southern region. This feature is more likely due to the different terrain of the two areas (mountains and basin), which causes large difference of the altitude between grid points and GNSS stations. Another important reason is the complicated and changeable water vapor in mountainous region. The trend of ERA5 ZTD MAE is similar as the trend of RMS.
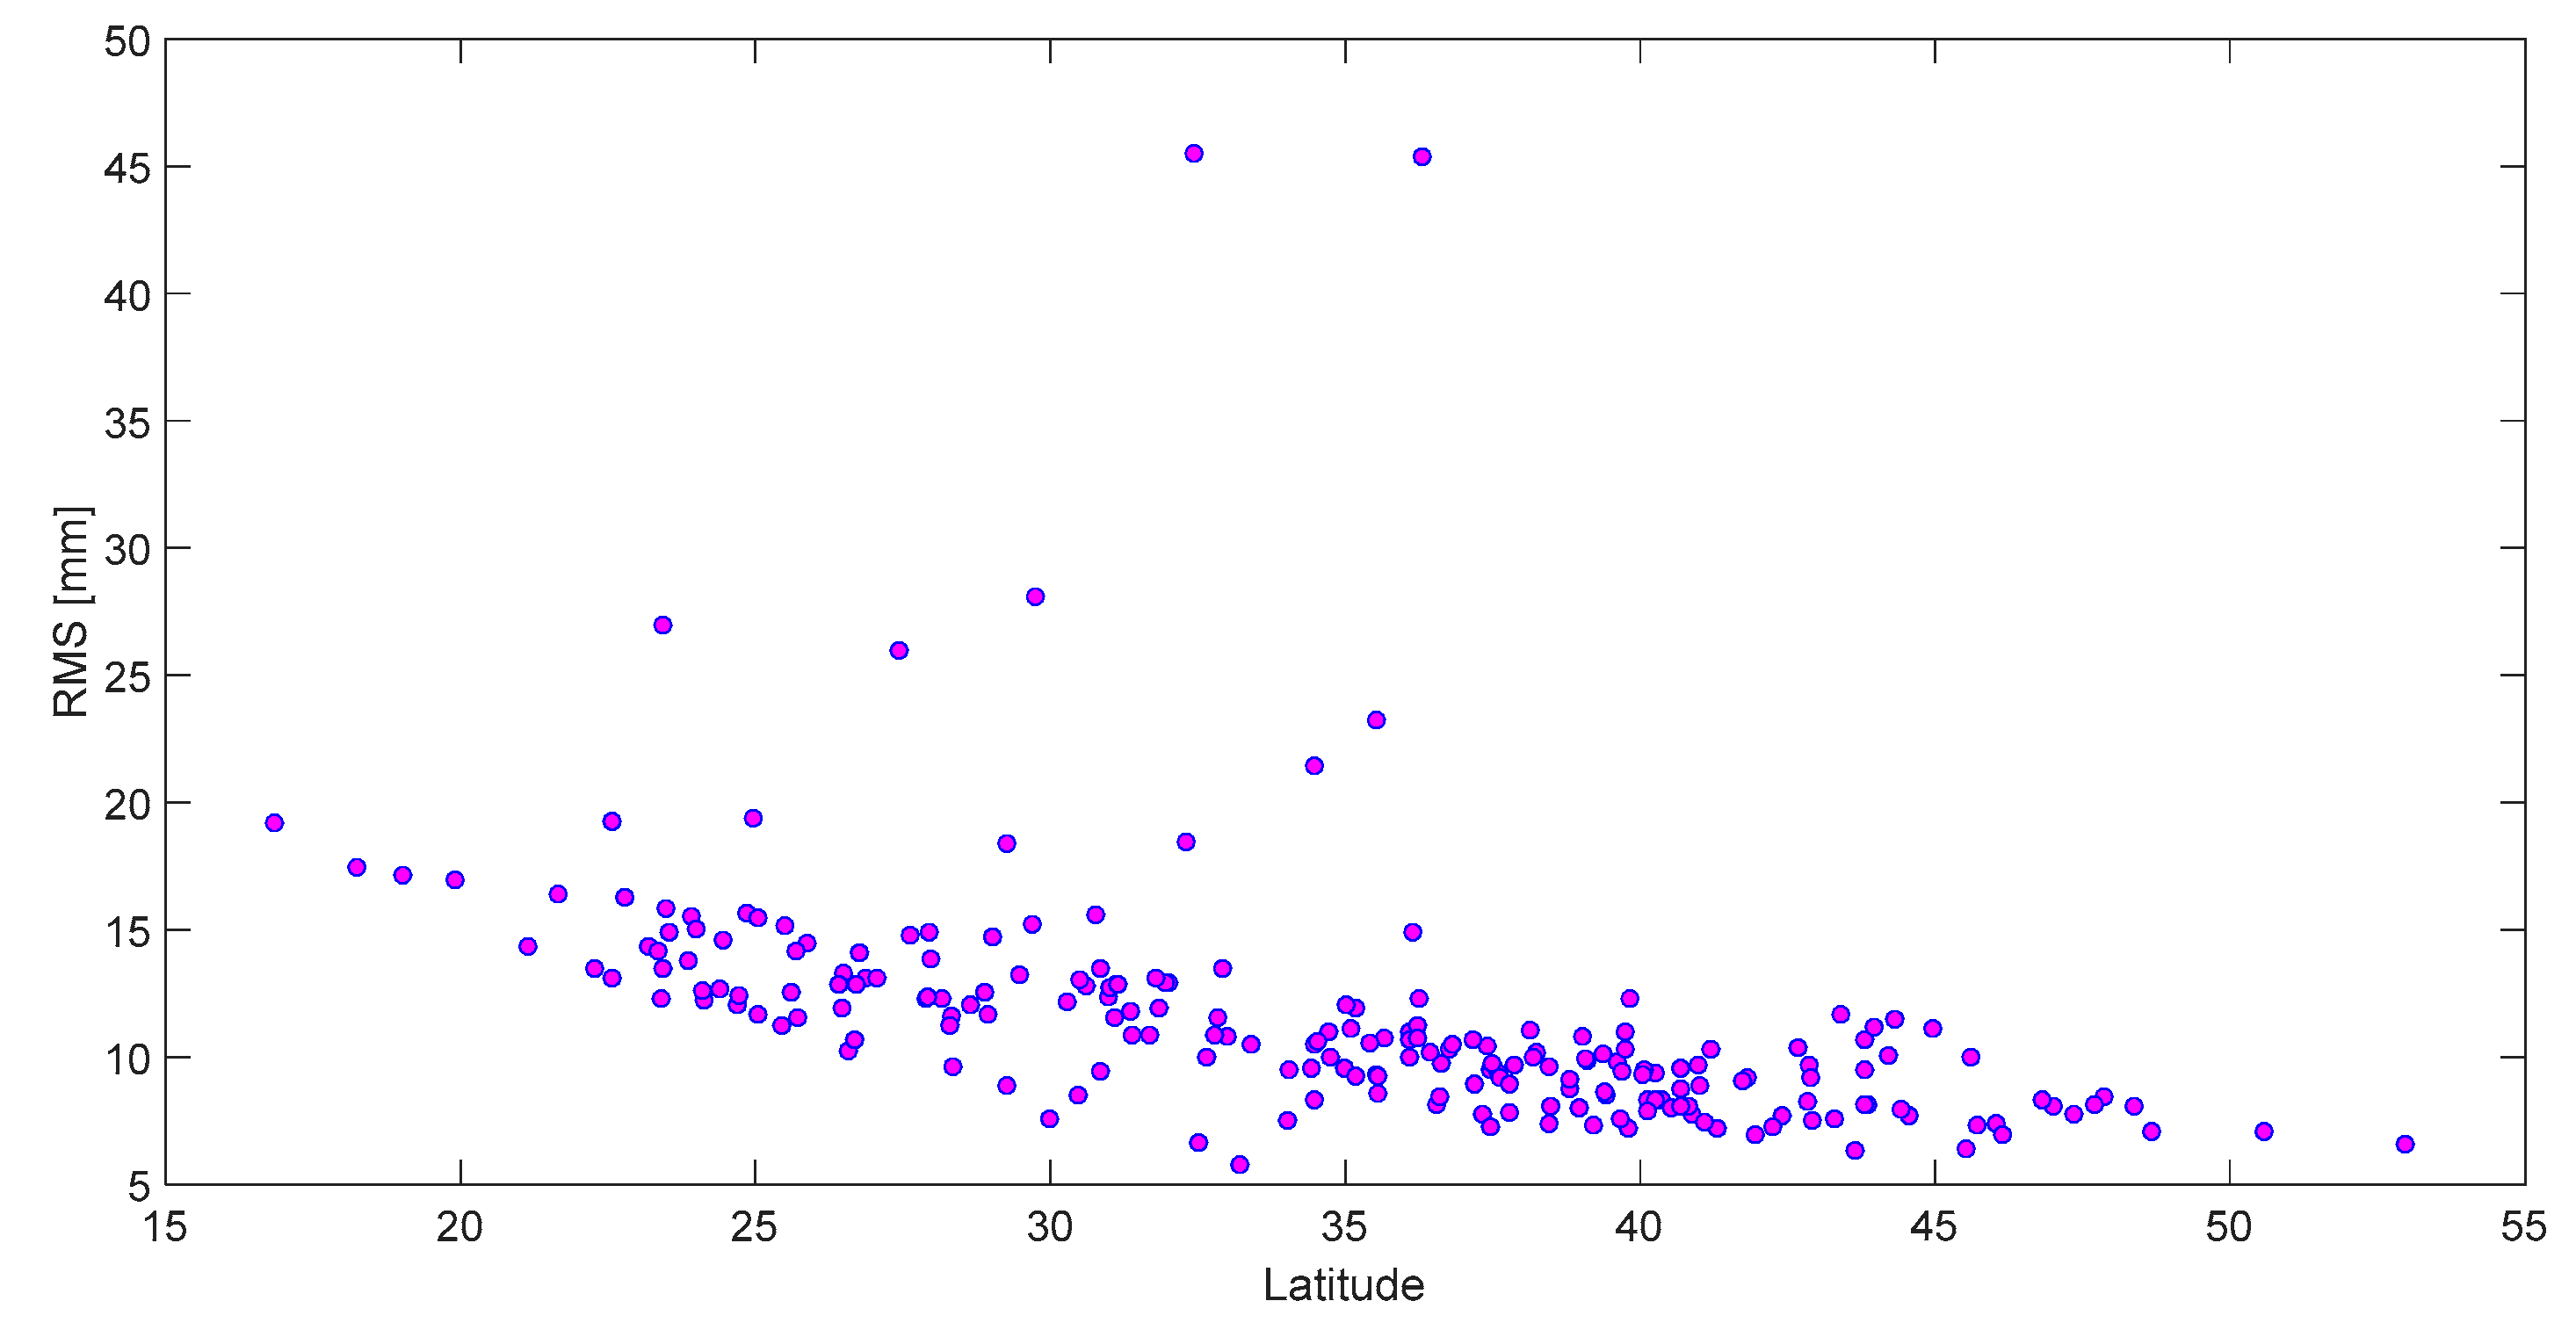
Further, the RMS of ERA5 ZTD compared with GNSS ZTD for 219 selected stations over China is shown in Figure 13. It can be seen from the figure that the lower the latitude of the station is, the larger the RMS of ERA5 ZTD deviation is, which shows the same trend as the former analysis. The reason for this phenomenon may be the tropospheric activity and water vapor distribution. On the one hand, affected by the continental monsoon climate over China, the lower the latitude, the higher the water vapor content is. On the other hand, the tropospheric activity is directly affected by surface heat. In the lower latitude region, the heat is higher and the tropospheric activity is stronger, as a result the uncertainty of tropospheric calculation-related parameters derived from ERA5 increase, and the accuracy of the ZTD decreases [44,45].
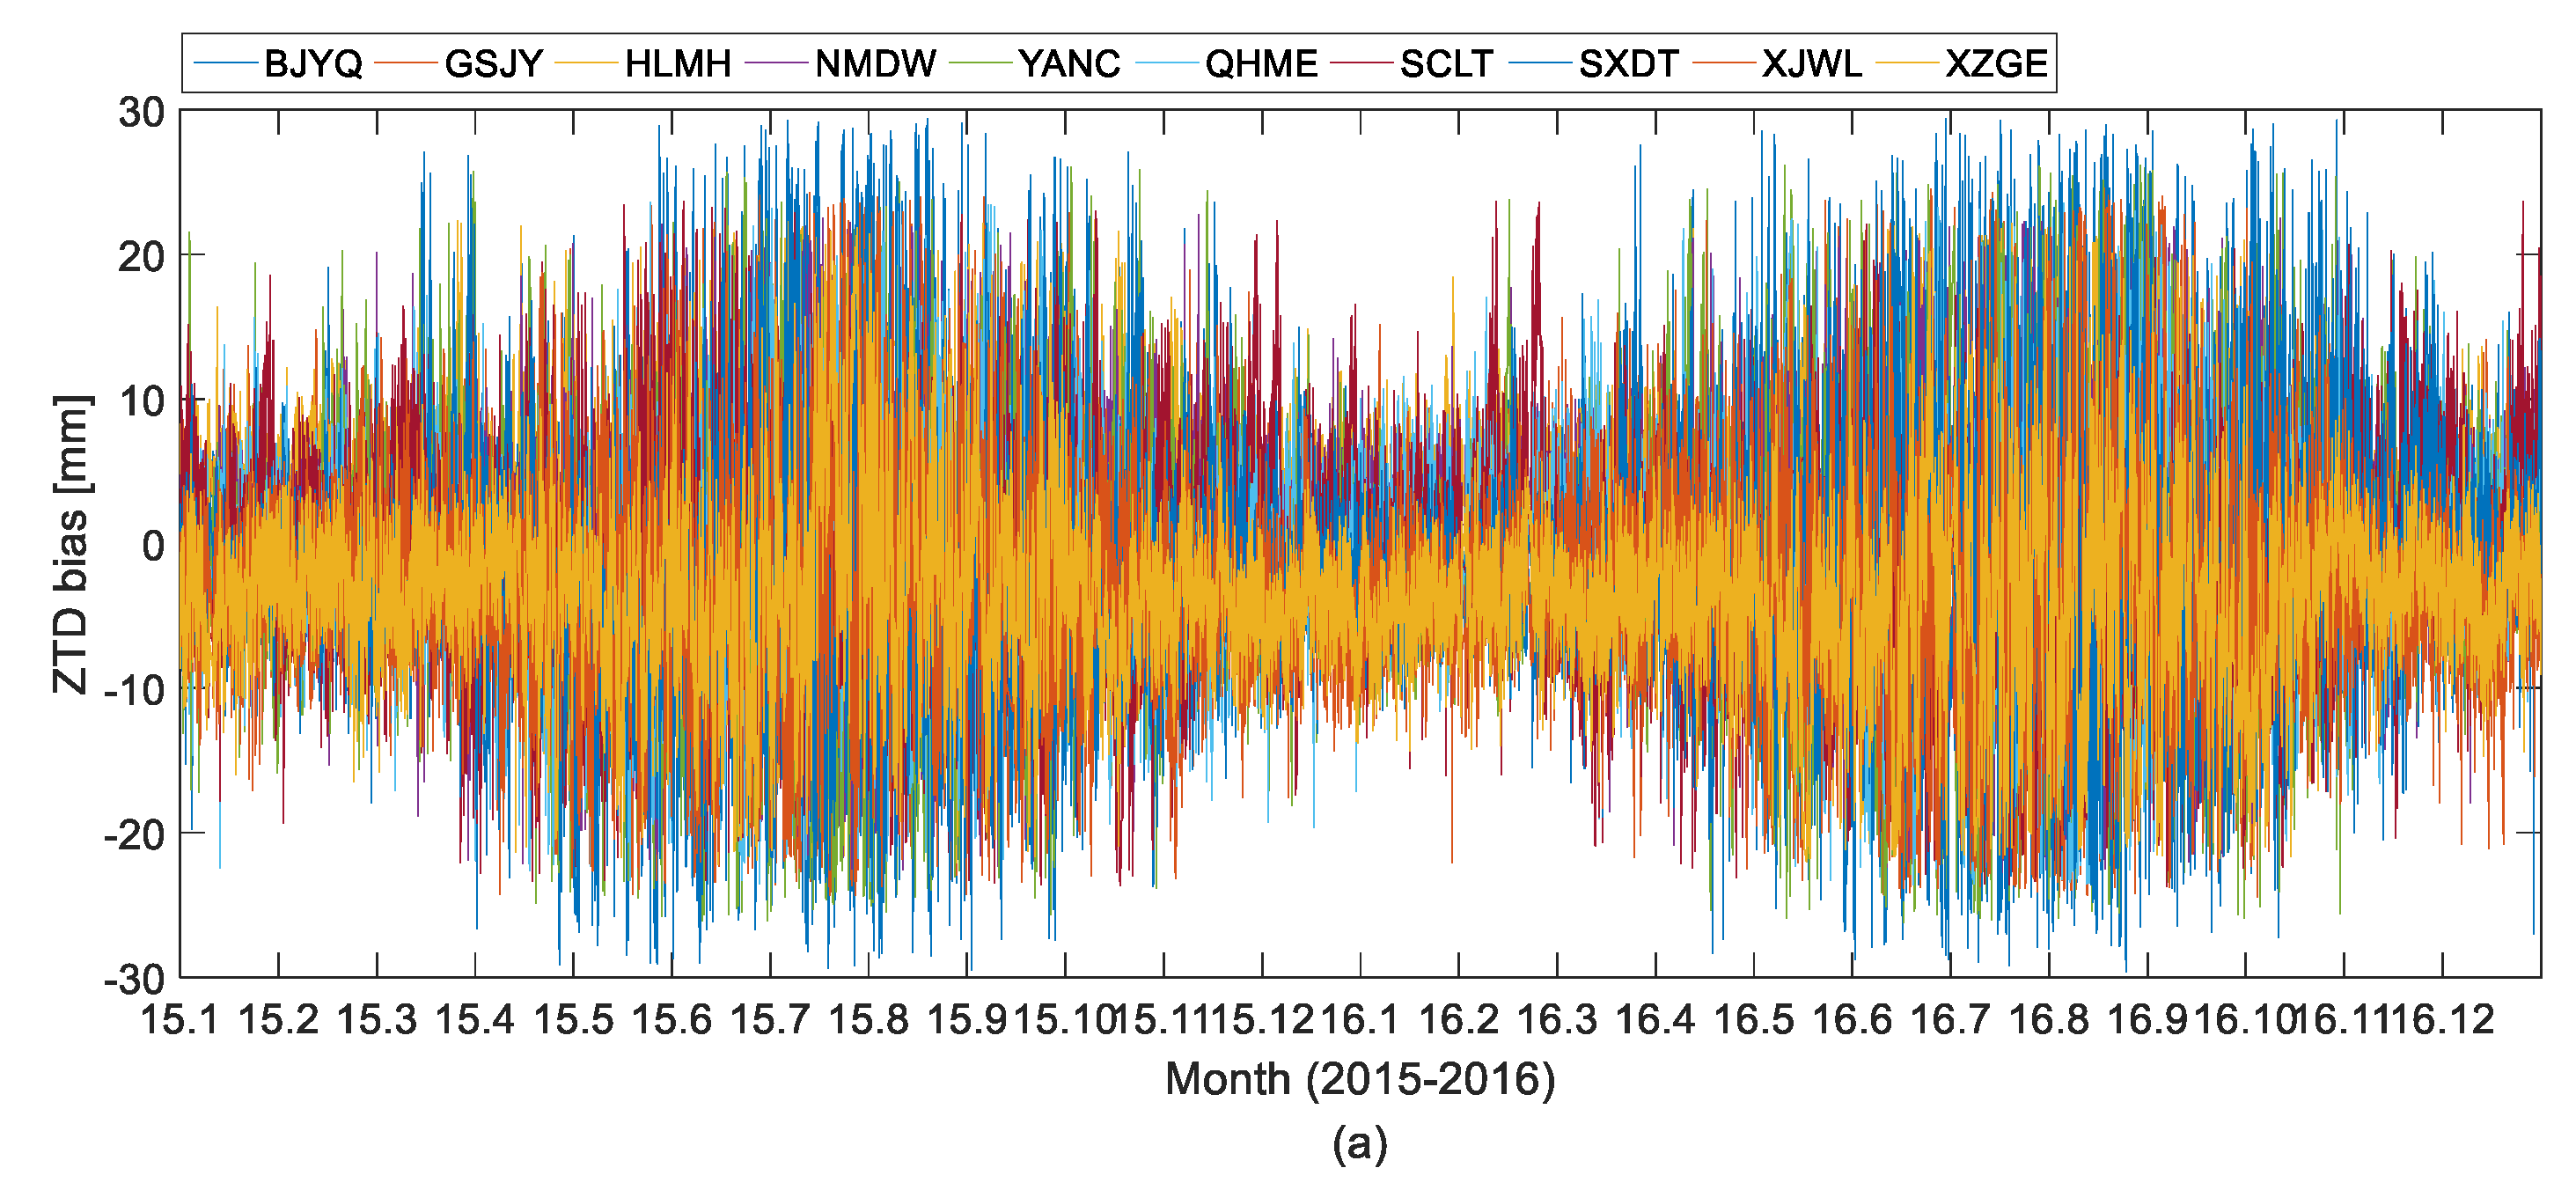
The ZTD bias time series from 10 GNSS stations are selected to further analyze the variation of ERA5 ZTD deviation with season. The criterion for selecting these 10 sites were as follows: (1) the sites should be relatively evenly distributed over China; (2) the site elevation should be representative, including plain, hilly and plateau terrain; (3) the site should have less missing observation. The average deviation and boxplots from 2015 to 2016 are shown in Figure 14.
As shown in Figure 14, most of the biases values are within ±30 mm which shows the accuracy of these ZTD time series. On the other hand, from the first subfigure in Figure 14, it can be found that the ERA5 ZTD agrees better with GNSS ZTD during winter, with the worst agreement being during summer at all 10 test GNSS stations.
To further analyze the temporal variation features of ERA5 ZTD over China, the month average bias, MAE and RMS of the ERA5 ZTD at all 219 GNSS stations from 2015 to 2016 were calculated, and the results are shown in Figure 15, Figure 16 and Figure 17.
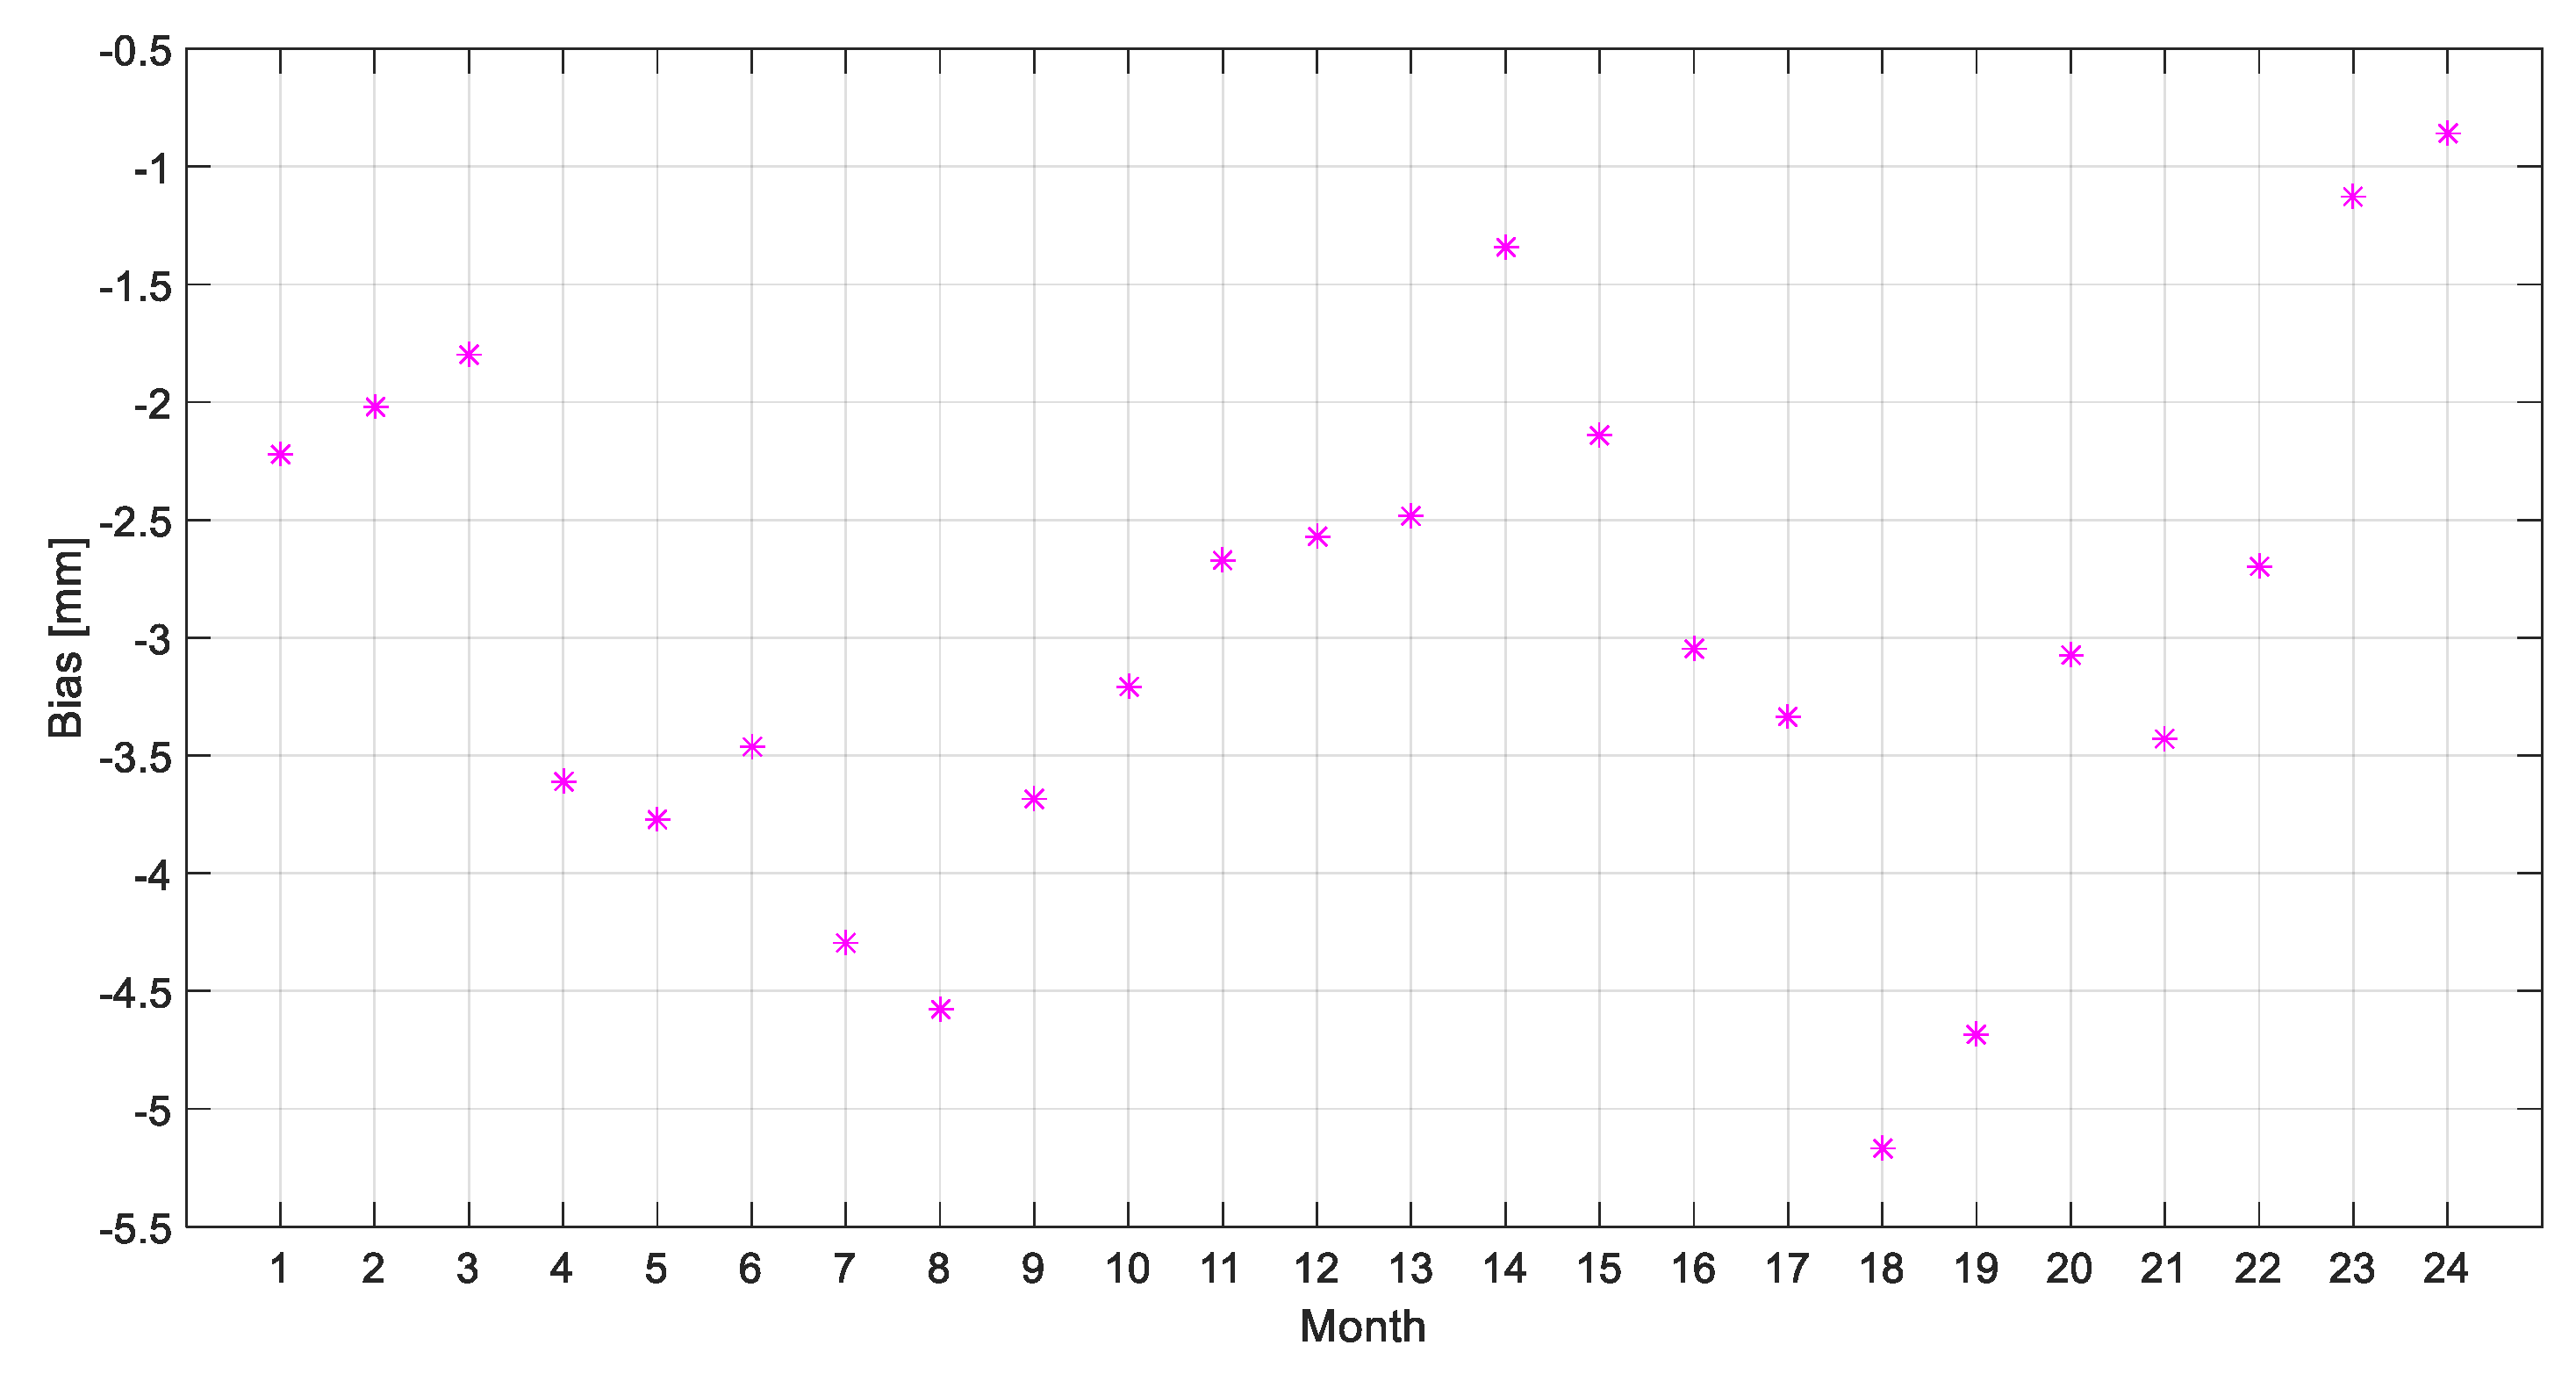
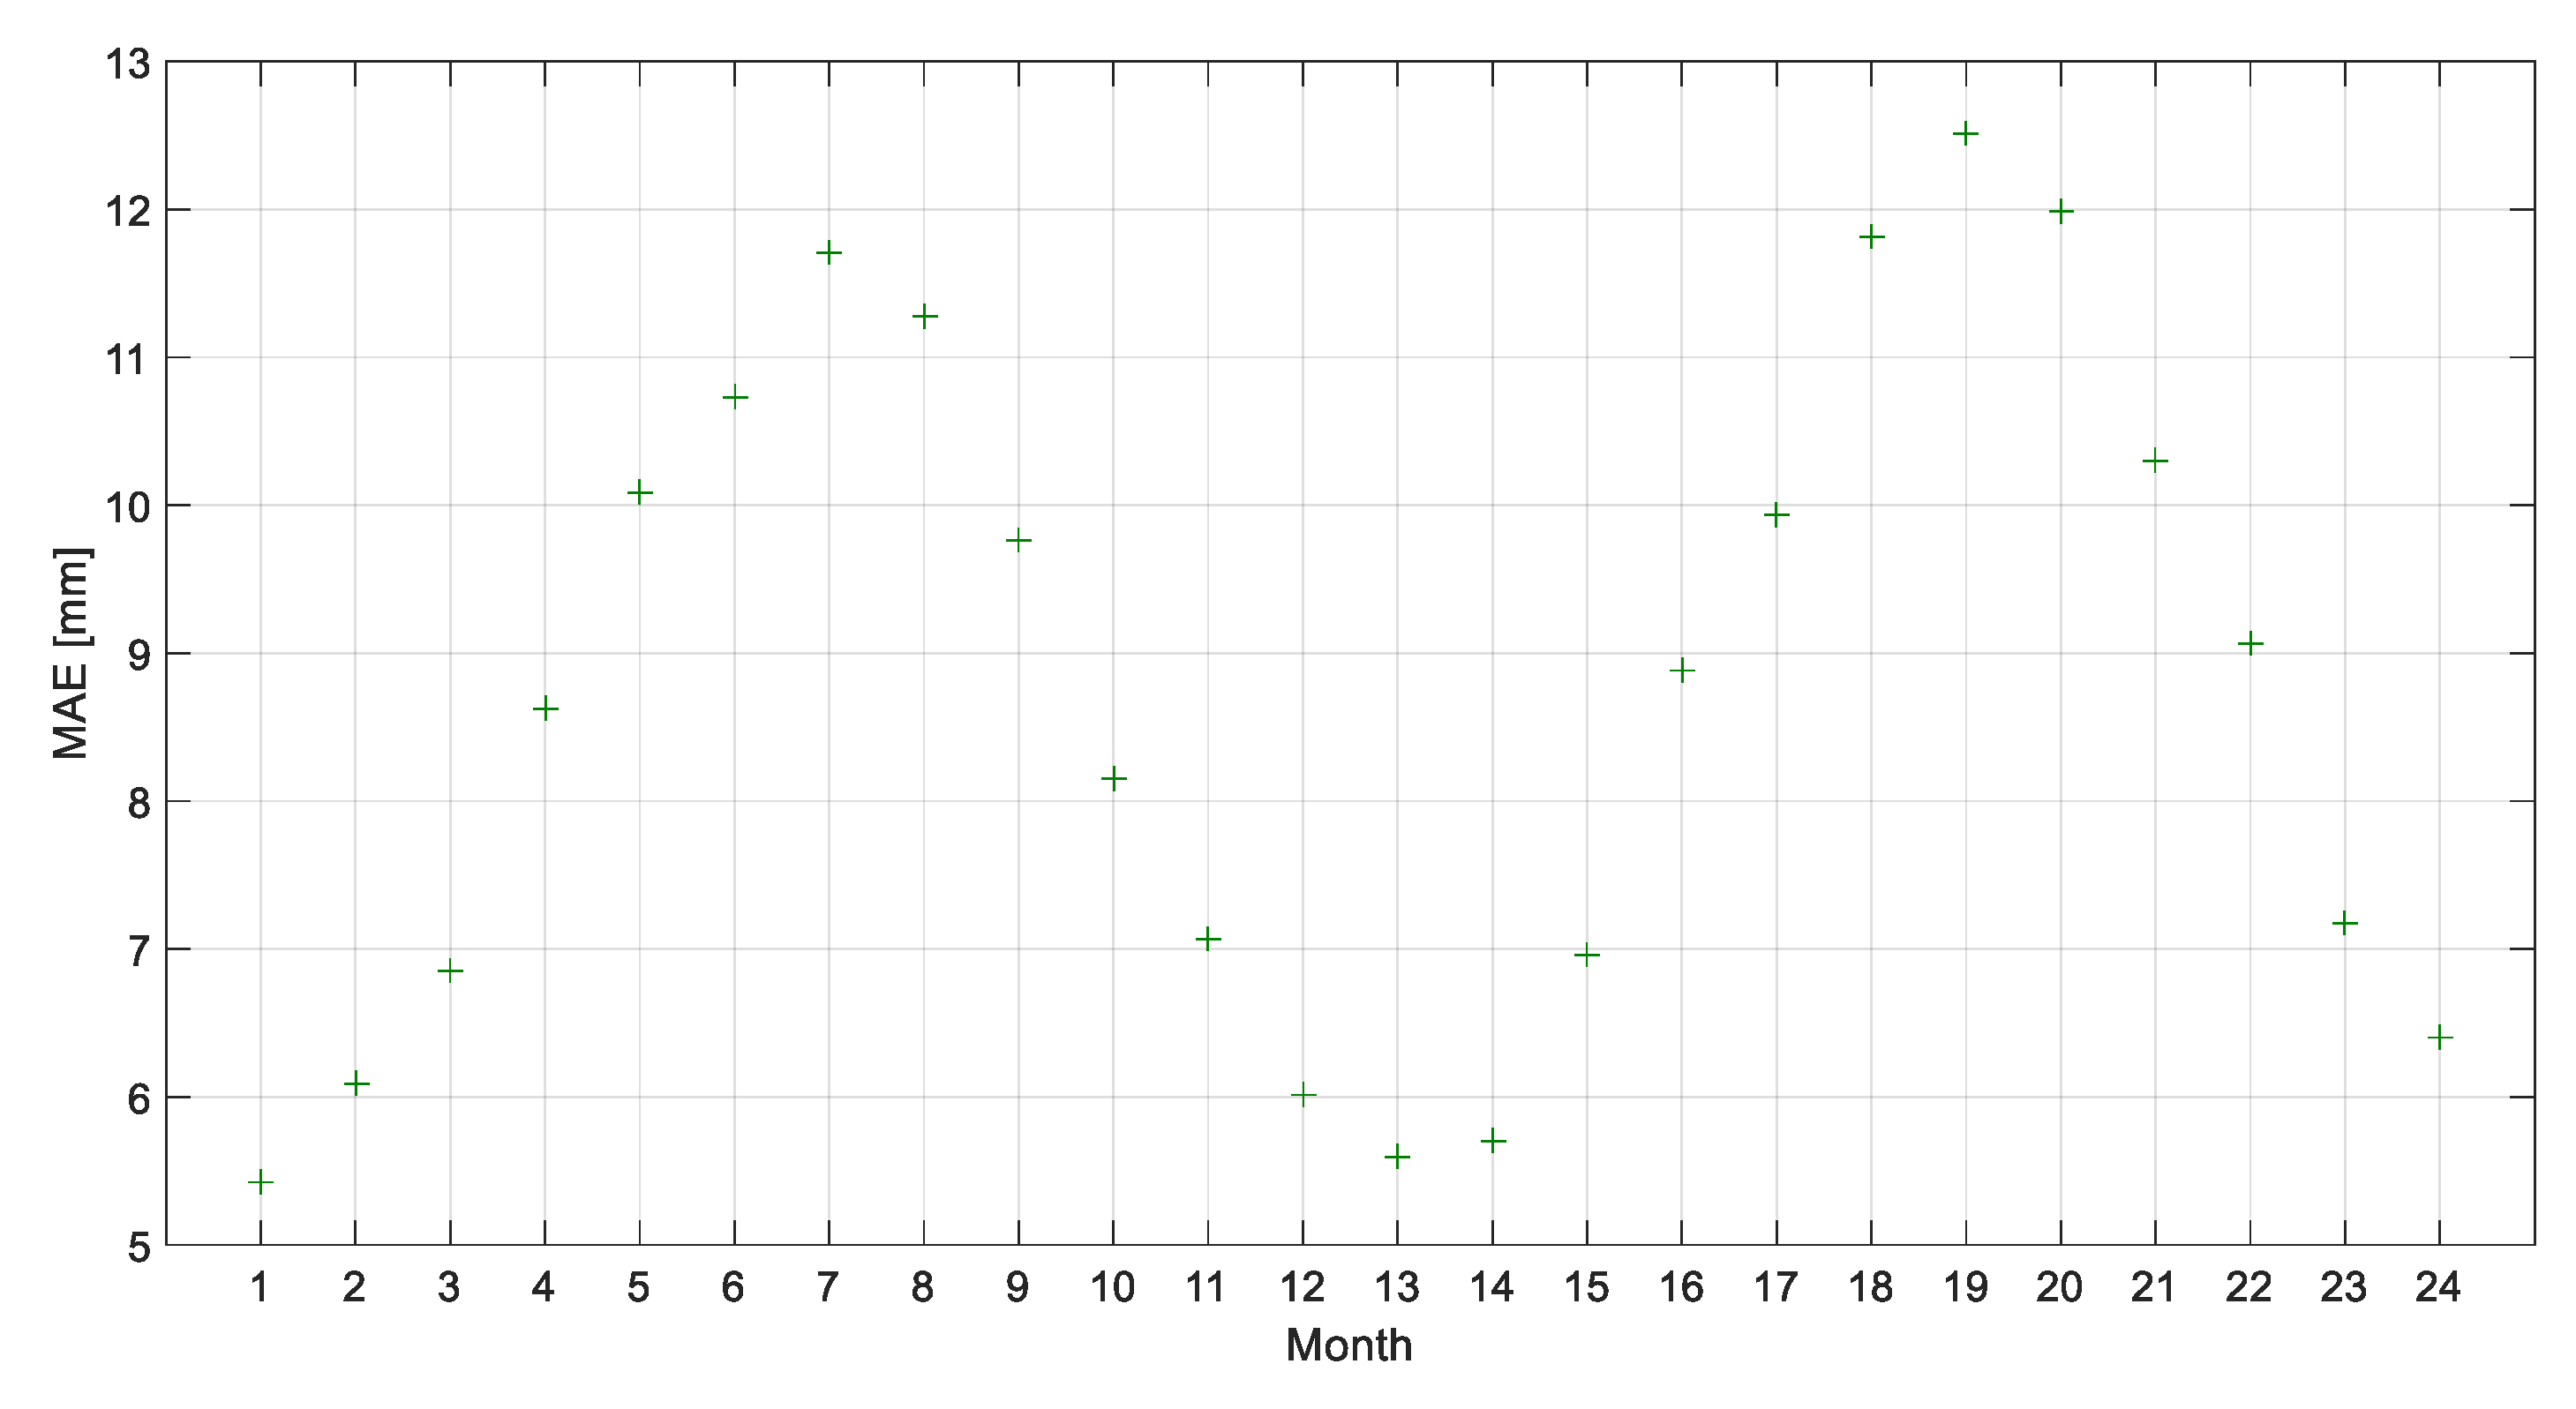
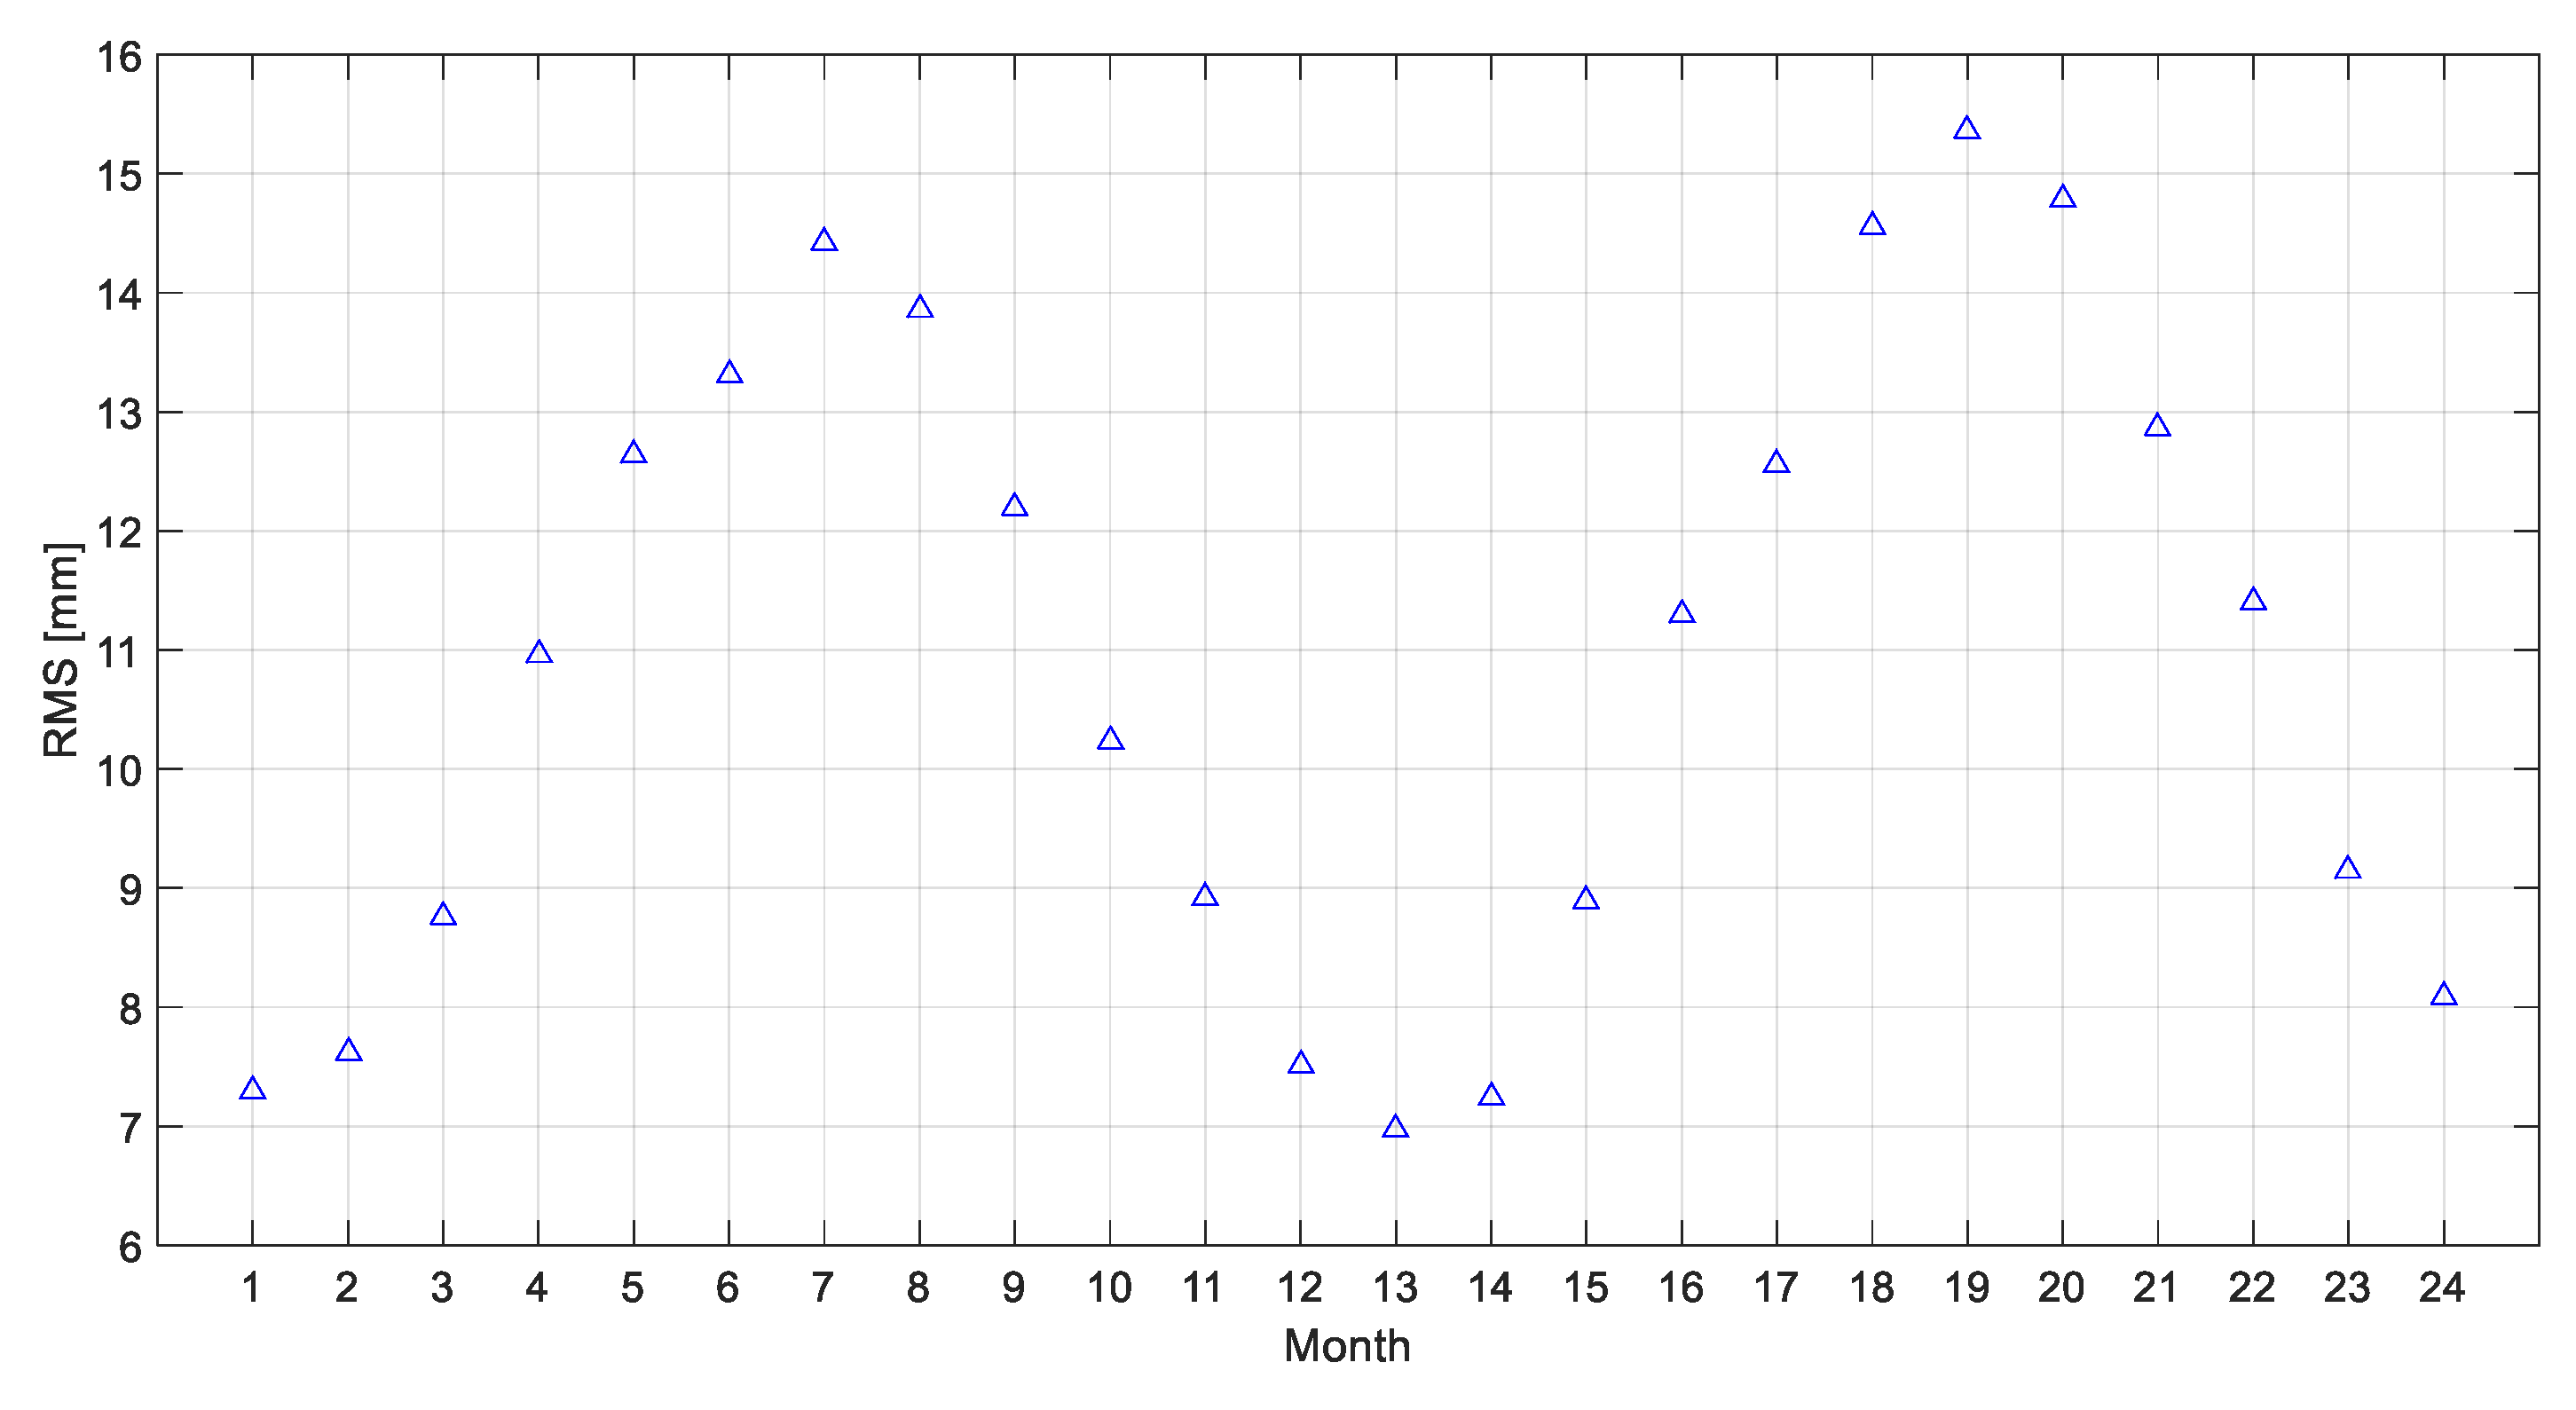
It can be seen from Figure 15 that all monthly average biases are negative and there appears to be a seasonal trend, indicating that the ZTD derived from ERA5 is lower than the GNSS ZTD over China. The monthly average biases is greater in summer, smaller in winter and medium in autumn and spring. Figure 16 and Figure 17 show that the temporal variation trend of MAE and RMS are more obvious. Since MAE and RMS both reflect the precision characteristics of ERA5 ZTD, the monthly average MAE and RMS values have similar trends. It can be found that from January to July, the MAE and RMS have an obvious increasing trend, while from July to December they have a slow decreasing trend in the two years, which indicates their obvious seasonal variation features. Due to the influence of land-sea thermal differences, the climate is complicated and changeable in summer, with heavy rainfall and large water vapor content which leads to the increase of the uncertainty of ERA5 ZTD. As a result, RMS, MAE and bias values in summer are larger than those in winter.
4. Conclusions
High-precision ZTD plays a vital role in GNSS positioning and meteorological study. Compared with GNSS ZTD, this paper evaluates the accuracy of ERA5 ZTD and analyzes the spatial distribution of ZTD RMS and bias, as well as the seasonal variation feature. The accuracies of temperature and pressure are assessed by comparing with measured GNSS meteorological observation data firstly. The bias values between interpolated atmospheric temperature and pressure derived from ERA5 and the measured temperature and pressure data from 193 GNSS stations is about 2.31 °Cand 1.26 mbar respectively. It implies that ERA5 pressure and temperature can be used to calculate the ZTD over China with enough accuracy, which is important for GNSS tropospheric delay correction at stations that are not equipped with meteorological sensors.
The performance of ZTD derived from ERA5 is systematically evaluated using GNSS measurements from 2015 to 2016 at 219 GNSS stations of CMONOC. The average bias and RMS of ERA5 pressure-level ZTD at 219 selected GNSS stations are approximately 2.97 mm and 11.49 mm respectively, and those of ERA5 surface-level ZTD are 7.97 mm, 39.25 mm, which indicates that ERA5 pressure-level ZTD has a higher accuracy over China. To further analyze the accuracy improvement of ERA5 ZTD, the calculation of ZTD from ERA-Interim is conducted for comparison. It is shown that the accuracies of ZTD derived from ERA5 pressure-level and surface-level data are approximately 13.8% and 10.8% higher, respectively, than those from of ERA-Interim pressure-level and surface-level data. Moreover, the comparison of ZTD time series of ERA5, GNSS, ERA-Interim, GPT2w shows that ERA5 ZTD agrees well with the GNSS ZTD and ERA5 can well capture the sub-daily variation feature of the ZTD, which indicates the superiority of the ERA5 to the GPT2w model and ERA-Interim.
Additionally, the temporal and spatial variation features of ZTD bias and RMS are analyzed over China. The results show that, due to the effects of latitude and altitude, the accuracy of ZTD in southern China is lower than that in northern China. Furthermore, it is found that the ERA5 ZTD over China has obvious seasonality, with higher accuracy in winter and lower accuracy in summer.
In summary, the latest generation of global reanalysis data, ERA5, has higher precision than ERA-Interim with improved temporal and spatial resolution, which indicates ERA5 is quite promising in tropospheric modeling and application over China. Due to China’s vast territory, diverse climate types, and wide range of altitudes, the conclusions drawn in this paper may still be useful for research in other regions. Further research will focus on regional or global modeling of ZTD and long-term analysis on the water vapor variability and trend using ERA5 data.
Author Contributions
Conceptualization, C.J., S.W. and T.X.; Funding acquisition, T.X.; Methodology, S.W. and C.J.; Analysis and Validation, C.J., W.N. and Z.S.; Writing-original draft, C.J.; Writing-review & editing, C.J., T.X., S.W., W.N. and Z.S. All authors have read and agreed to the published version of the manuscript.
Funding
This research was founded by the National Key Research Program of China, grant number 2016YFB0501900 and 2016YFB0501701, and the National Natural Science Foundation of China, grant number 41874032, 41731069 and 41574013.
Acknowledgments
The authors would like to extend their sincere gratitude to ECEMWF and CMONOC for providing the relevant data.
Conflicts of Interest
The authors declare no conflict of interest.
References
- Xu, G.; Xu, Y. GPS: Theory, Algorithms and Applications; Springer: Berlin, Heidelberg, 2016. [Google Scholar]
- Dousa, J.; Vaclavovic, P. Real-time zenith tropospheric delays in support of numerical weather prediction applications. Adv. Space Res. 2014, 53, 1347–1358. [Google Scholar] [CrossRef]
- Bevis, M.; Businger, S.; Herring, T.A.; Rocken, C.; Anthes, R.A.; Ware, R.H. GPS meteorology: Remote sensing of atmospheric water vapor using the Global Positioning System. J. Geophys. Res. 1992, 97, 15787–15801. [Google Scholar] [CrossRef]
- Melbourne, W.G.; Davis, E.S.; Duncan, C.B.; Hajj, G.A.; Hardy, K.R.; Kursinski, E.R.; Yunck, T.P. The Application of Spaceborne GPS to Atmospheric Limb Sounding and Global Change Monitoring. Available online: https://ntrs.nasa.gov/archive/nasa/casi.ntrs.nasa.gov/19960008694.pdf (accessed on 16 February 2020).
- Rohm, W.; Yuan, Y.; Biadeglgne, B.; Zhang, K.; Le Marshall, J. Ground-based GNSS ZTD/IWV estimation system for numerical weather prediction in challenging weather conditions. Atmos. Res. 2014, 138, 414–426. [Google Scholar] [CrossRef]
- Emardson, T.R.; Elgered, G.; Johansson, J.M. Three months of continuous monitoring of atmospheric water vapor with a network of Global Positioning System receivers. J. Geophys. Res. 1998, 103, 1807–1820. [Google Scholar] [CrossRef]
- Saastamoinen, J. Atmospheric Correction for the Troposphere and Stratosphere in Radio Ranging Satellites. The Use of Artificial Satellites for Geodesy. Available online: https://agupubs.onlinelibrary.wiley.com/doi/abs/10.1029/GM015p0247 (accessed on 16 February 2020).
- Zheng, F.; Lou, Y.; Gu, S.; Gong, X.; Shi, C. Modeling tropospheric wet delays with national GNSS reference network in China for Beidou precise point positioning. J. Geod. 2018, 92, 545–560. [Google Scholar] [CrossRef]
- Škerlak, B.; Sprenger, M.; Wernli, H. A global climatology of stratosphere-troposphere exchange using the ERA-Interim data set from 1979 to 2011. Atmos. Chem. Phys. 2014, 14, 913–937. [Google Scholar]
- Dee, D.P.; Uppala, S. Variational Bias Correction of Satellite Radiance Data in the ERA-Interim Reanalysis. Available online: https://rmets.onlinelibrary.wiley.com/doi/abs/10.1002/Qj.493 (accessed on 16 February 2020).
- Böhm, J.; Heinkelmann, R.; Schuh, H. Short note: A global model of pressure and temperature for geodetic applications. J. Geod. 2007, 81, 679–683. [Google Scholar] [CrossRef]
- Böhm, J.; Möller, G.; Schindelegger, M.; Pain, G.; Weber, R. Development of an improved empirical model for slant delays in the troposphere (GPT2w). GPS Solut. 2015, 19, 433–441. [Google Scholar] [CrossRef] [Green Version]
- Lagler, K.; Schindelegger, M.; Böhm, J.; Krásná, H.; Nilsson, T. GPT2: Empirical slant delay model for radio space geodetic techniques. Geophys. Res. Lett. 2013, 40, 1069–1073. [Google Scholar] [CrossRef] [Green Version]
- Yao, Y.; Xu, C.; Shi, J.; Cao, N.; Zhang, B.; Yang, J. ITG: Anew global GNSS tropospheric correction model. Sci. Rep. 2015, 5, 10273. [Google Scholar] [CrossRef] [Green Version]
- Landskron, D.; Böhm, J. VMF3/GPT3: Refined discrete and empirical troposphere mapping functions. J. Geod 2018, 92, 349–360. [Google Scholar] [CrossRef]
- Schuler, T. On Ground-Based GPS Tropospheric Delay Estimation. Doctor’s Thesis, Studiengang Geodsie und Geoinformation, Universitt der Buundeswehr Munchen, Neubiberg, Germany, 2001. [Google Scholar]
- Bevis, M.; Businger, S.; Chiswell, S.; Herring, T.A.; Anthes, R.A.; Rocken, C.; Ware, R.H. GPS meteorology: Mapping zenith wet delays onto precipitable water. J. Appl. Meteorol. 1994, 33, 379–386. [Google Scholar] [CrossRef]
- Andrei, C.O.; Chen, R. Assessment of time-series of troposphere zenith delays derived from the global data assimilation system numerical weather model. GPS Solut. 2009, 13, 109–117. [Google Scholar] [CrossRef]
- Yu, L.; Zhang, Z.; Zhou, M.; Zhong, S.; Lenschow, D.; Hsu, H.; Sun, B. Validation of ECMWF and NCEP-NCAR reanalysis data in Antarctica. Adv. Atmos. Sci. 2010, 27, 1151–1168. [Google Scholar] [CrossRef] [Green Version]
- Decker, M.; Brunke, M.A.; Wang, Z.; Sakaguchi, K.; Zeng, X.; Bosilovich, M.G. Evaluation of the reanalysis products from GSFC, NCEP, and ECMWF using flux tower observations. J. Clim. 2012, 25, 1916–1944. [Google Scholar] [CrossRef]
- Mooney, P.A.; Mulligan, F.J.; Fealy, R. Comparison of ERA-40, ERA-Interimand NCEP/NCAR reanalysis data with observed surface air temperatures over Ireland. Int. J. Climatol. 2011, 31, 545–557. [Google Scholar] [CrossRef] [Green Version]
- Bao, X.; Zhang, F. Evaluation of NCEP-CFSR, NCEP-NCAR, ERA-Interim, and ERA-40 reanalysis datasets against independent sounding obervations over the Tibetan Plateau. J. Clim. 2013, 26, 206–214. [Google Scholar] [CrossRef] [Green Version]
- Bromwich, D.H.; Wang, S.H. Evaluation of the NCEP–NCAR and ECMWF 15-and 40-yr reanalyses using rawinsonde data from two independent Arctic field experiments. Mon. Weather Rev. 2005, 133, 3562–3578. [Google Scholar] [CrossRef]
- Boccara, G.; Hertzog, A.; Basdevant, C.; Vial, F. Accuracy of NCEP/NCAR reanalyses and ECMWF analyses in the lower stratosphere over Antarctica in 2005. J. Geophy. Res. 2008, 113. [Google Scholar] [CrossRef]
- Pany, T.; Pesec, P.; Stangl, G. Elimination of Tropospheric Path Delays in GPS Observations with the ECMWF Numerical Weather Model. Available online: https://www.sciencedirect.com/science/article/pii/S1464189501000898 (accessed on 16 February 2020).
- Ghoddousi-Fard, R.; Dare, P.; Langley, R.B. Tropospheric delay gradients from numerical weather prediction models: effects on GPS estimated parameters. GPS Solut. 2009, 13, 281–291. [Google Scholar] [CrossRef]
- Ibrahim, H.E.; El-Rabbany, A. Regional stochastic models for NOAA-based residual tropospheric delays. J. Navig. 2008, 61, 209–219. [Google Scholar] [CrossRef]
- Chen, Q.; Song, S.; Heise, S.; Liou, Y.A.; Zhu, W.; Zhao, J. Assessment of ZTD derived from ECMWF/NCEP data with GPS ZTD over China. GPS Solut. 2011, 15, 415–425. [Google Scholar] [CrossRef]
- Hersbach, H.; de Rosnay, P.; Bell, B.; Schepers, D.; Simmons, A.; Soci, C.; Abdalla, S.; Alonso-Balmaseda, M.; Balsamo, G.; Bechtold, P.; et al. Operational global reanalysis: progress, future directions and Synergies with NWP. ECMWF Re-Anal. Proj. Rep. Ser. 2018, 27. [Google Scholar] [CrossRef]
- Wang, Q.; Zhang, P. The Initial Result of Crust Movement Observation Network of China: GPS-Derived Velocity Field (1998–2001). Available online: https://www.sciencedirect.com/science/article/pii/S1464189501000898 (accessed on 16 February 2020).
- Kaihua, D.; Zhicai, L.; Rong, Z.; Qi, W. Model analysis of crust motion in the Chinese mainland by CMONOC. Geod. Geodyn. 2014, 5, 1–8. [Google Scholar] [CrossRef] [Green Version]
- Deng, L.; Jiang, W.; Li, Z.; Chen, H.; Wang, K.; Ma, Y. Assessment of second-and third-order ionospheric effects on regional networks: case study in China with longer CMONOC GPS coordinate time series. J. Geod. 2017, 91, 207–227. [Google Scholar] [CrossRef]
- Wei, W.; Dijin, W.; Bin, Z.; Yong, H.; Caihong, Z.; Kai, T.; Shaomin, Y. Horizontal crustal deformation in Chinese Mainland analyzed by CMONOC GPS data from 2009–2013. Geod. Geodyn. 2014, 5, 41–45. [Google Scholar] [CrossRef] [Green Version]
- Dach, R.; Lutz, S.; Walser, P.; Fridez, P. Bernese GNSS Software Version 5.2; Astronomical Institute: University of Bern, Switzerland, 2015. [Google Scholar]
- Zhang, W.; Zhang, H.; Liang, H.; Lou, Y.; Cai, Y.; Liu, W. On the suitability of ERA5 in hourly GPS precipitable water vapor retrieval over China. J. Geod. 2019, 93, 1897–1909. [Google Scholar] [CrossRef]
- Jade, S.; Vijayan, M.S.M. GPS-based atmospheric precipitable water vapor estimation using meteorological parameters interpolated from NCEP global reanalysis data. J. Geophys. Res. 2008, 113. [Google Scholar] [CrossRef] [Green Version]
- Meteorologist, G.; Berg, H. Allgemeine Meteorologie: Einführung in die Physik der Atmosphäre. Dümmler; Ferd. Dümmler’s Verlag: Bonn, Germany, 1948. [Google Scholar]
- Askne, J.; Nordius, H. Estimation of tropospheric delay for microwaves from surface weather data. Radio. Sci. 1987, 22, 379–386. [Google Scholar] [CrossRef]
- Pavlis, N.K.; Holmes, S.A.; Kenyon, S.C.; Factor, J.K. The development and evaluation of the Earth Gravitational Model 2008 (EGM2008). J. Geophys. Res. 2012, 117. [Google Scholar] [CrossRef] [Green Version]
- Haase, J.; Ge, M.; Vedel, H.; Calais, E. Accuracy and variability of GPS tropospheric delay measurements of water vapor in the western Mediterranean. J. Appl. Meteorol. 2003, 42, 1547–1568. [Google Scholar] [CrossRef]
- MacMillan, D.S. Atmospheric gradients from very long baseline interferometry observations. Geophys. Res. Lett. 1995, 22, 1041–1044. [Google Scholar] [CrossRef]
- Steigenberger, P.; Boehm, J.; Tesmer, V. Comparison of GMF/GPT with VMF1/ECMWF and implications for atmospheric loading. J. Geod. 2009, 83, 943. [Google Scholar] [CrossRef]
- MOPS, W. Minimum Operational Performance Standards for Global Positioning System/Wide Area Augmentation System Airborne Equipment. Available online: http://read.pudn.com/downloads775/ebook/3071458/RTCA%20DO-229D.pdf (accessed on 16 February 2020).
- Zhai, P.; Eskridge, R.E. Atmospheric water vapor over China. J. Clim. 1997, 10, 2643–2652. [Google Scholar] [CrossRef]
- Tang, C.; Li, X.; Li, J.; Dai, C.; Deng, L.; Wei, H. Distribution and trends of the cold-point tropopause over China from 1979 to 2014 based on radiosonde dataset. Atmos. Res. 2017, 193, 1–9. [Google Scholar] [CrossRef]
Figure 1.
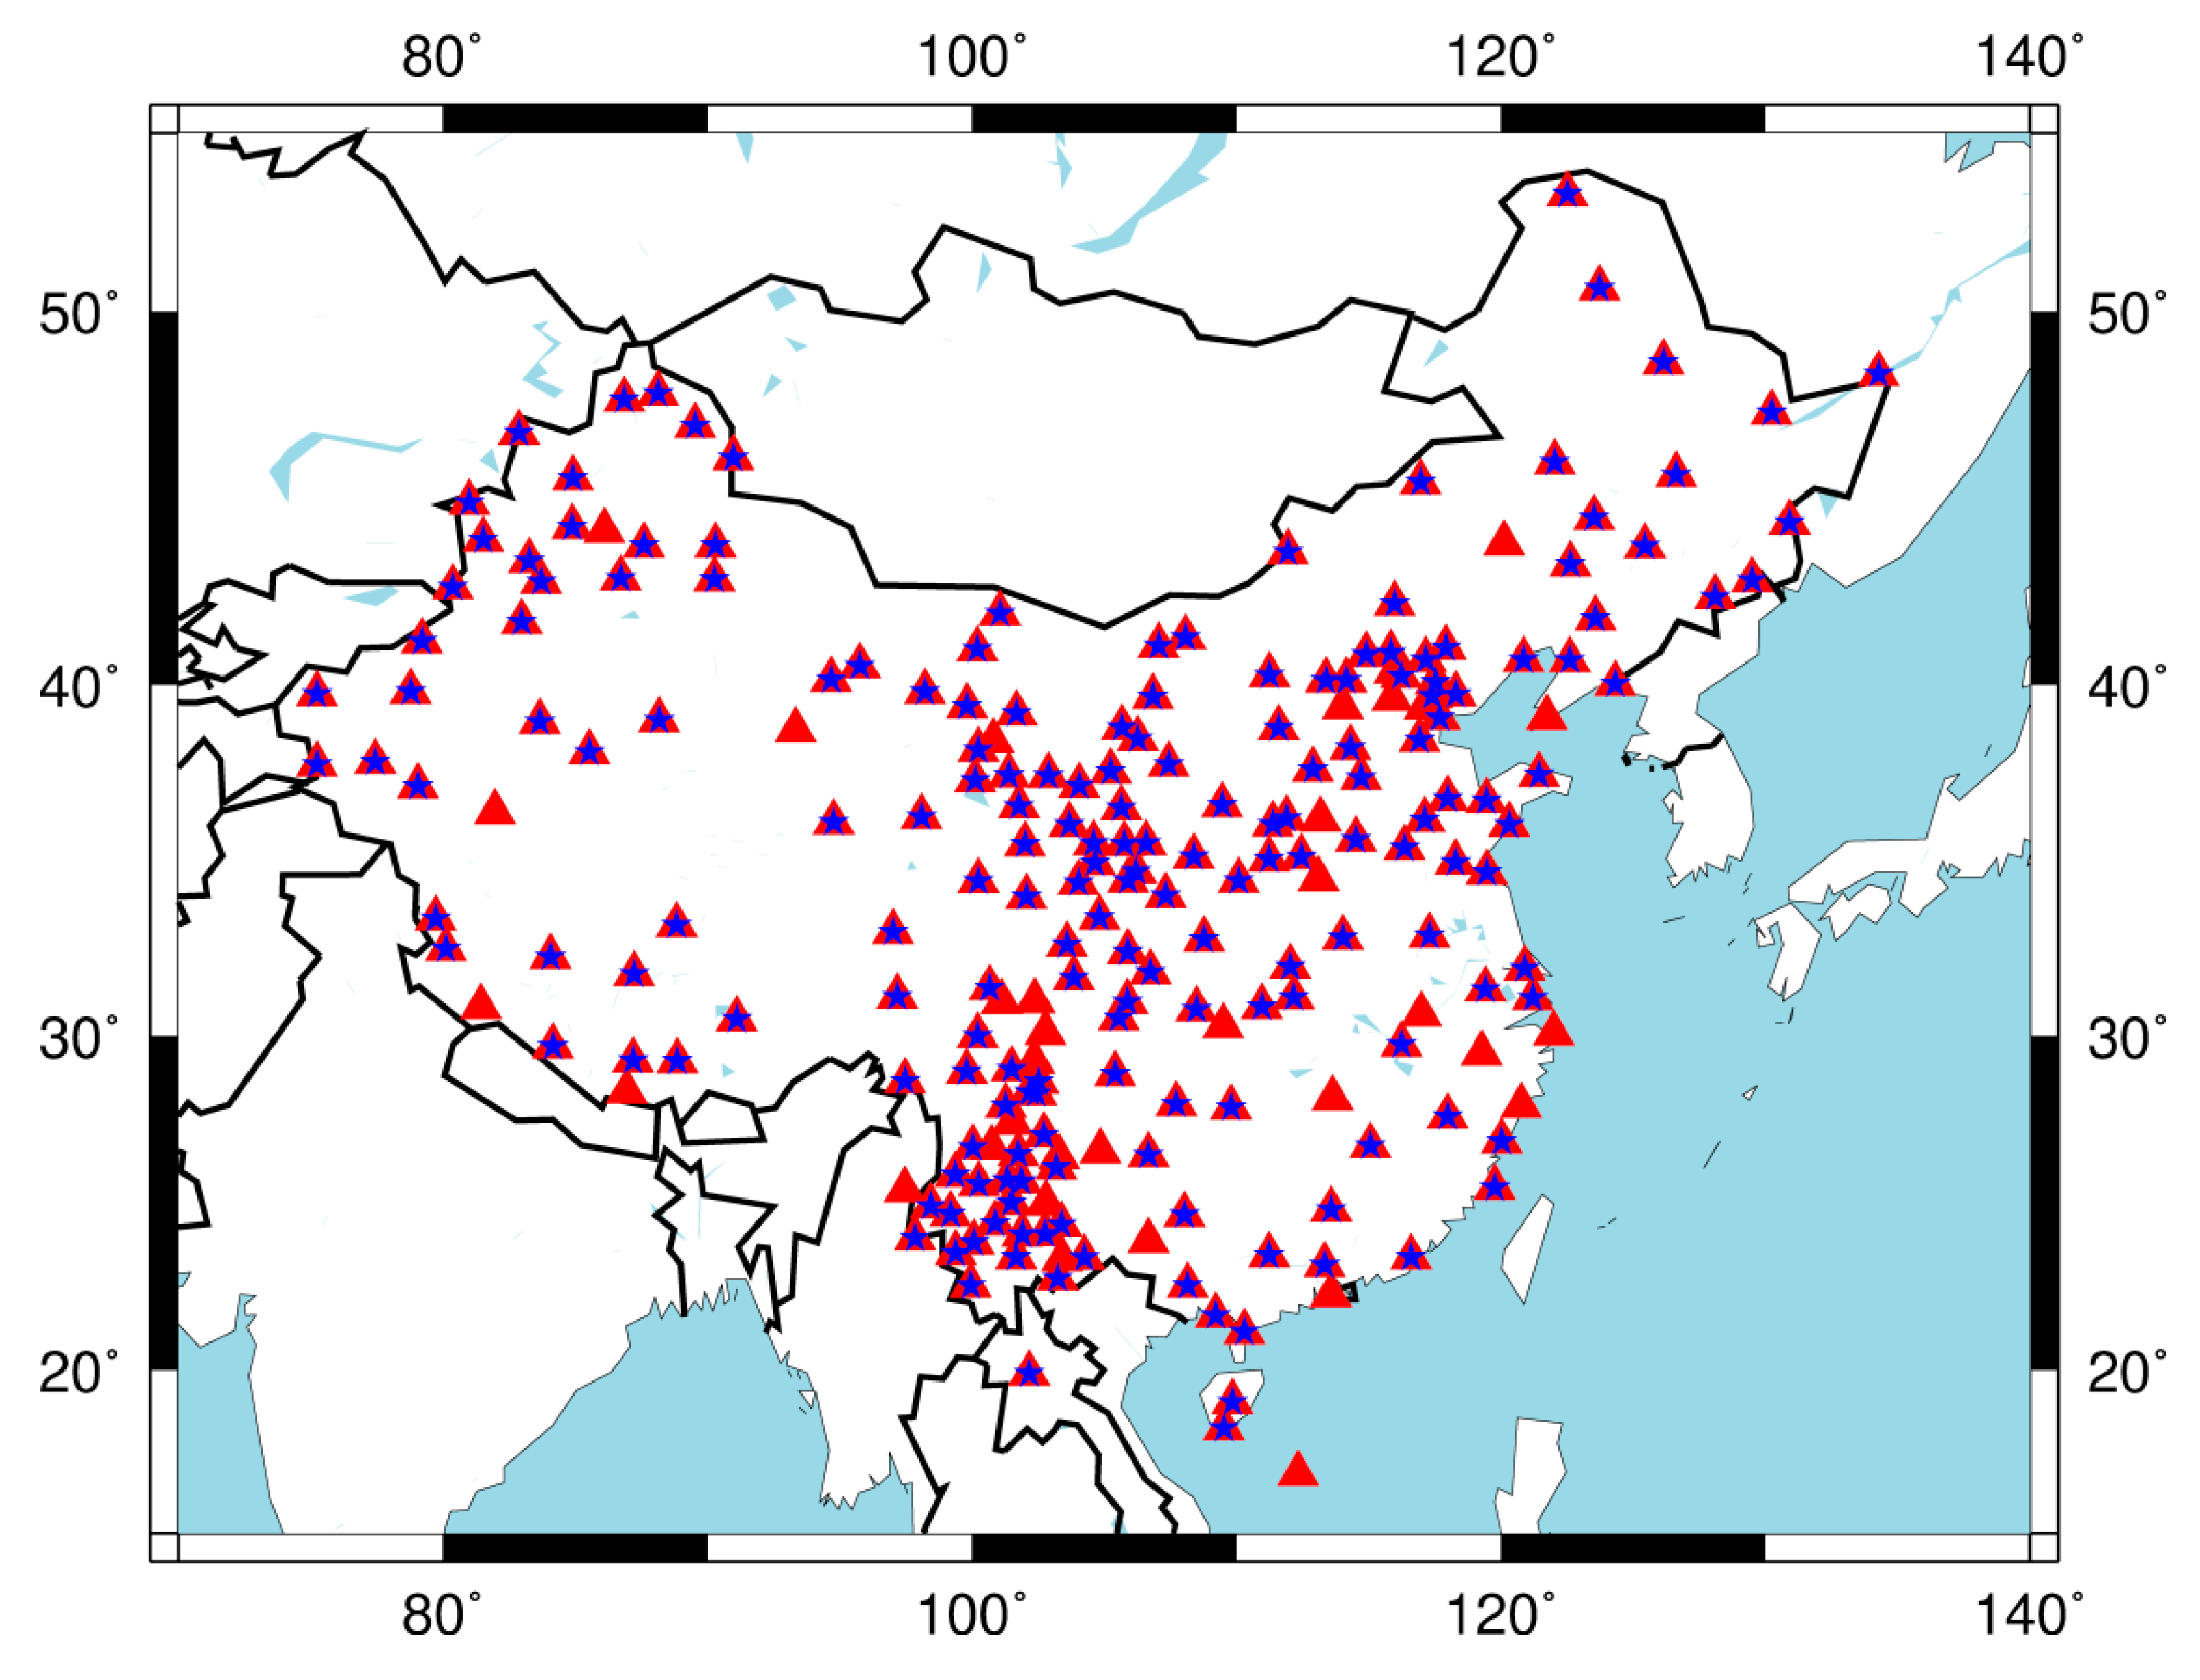
Distribution of Global Navigation Satellite System (GNSS) stations used in evaluating ERA5 Zenith Tropospheric Delay (ZTD). Red triangles denote stations used for calculation of GNSS ZTD and blue pentagrams denote sites selected for temperature and pressure comparison.
Figure 1.
Distribution of Global Navigation Satellite System (GNSS) stations used in evaluating ERA5 Zenith Tropospheric Delay (ZTD). Red triangles denote stations used for calculation of GNSS ZTD and blue pentagrams denote sites selected for temperature and pressure comparison.

Figure 2.
Root Mean Square (RMS) of the pressure derived from ERA5 pressure-level data with respect to the pressure observed by 193 GNSS stations during 2015.
Figure 2.
Root Mean Square (RMS) of the pressure derived from ERA5 pressure-level data with respect to the pressure observed by 193 GNSS stations during 2015.

Figure 3.
Root Mean Square (RMS) of the temperature derived from ERA5 pressure-level data with respect to the pressure observed by 193 GNSS stations during 2015.
Figure 3.
Root Mean Square (RMS) of the temperature derived from ERA5 pressure-level data with respect to the pressure observed by 193 GNSS stations during 2015.

Figure 4.
Root Mean Square (RMS), Mean Absolute Error (MAE) and bias of ERA5 ZTD from pressure-level data with respect to GNSS ZTD at 219 stations from 2015 to 2016.
Figure 4.
Root Mean Square (RMS), Mean Absolute Error (MAE) and bias of ERA5 ZTD from pressure-level data with respect to GNSS ZTD at 219 stations from 2015 to 2016.

Figure 5.
Root Mean Square (RMS), MAE and bias of ERA5 ZTD from surface-level data with respect to GNSS ZTD at 219 stations from 2015 to 2016.
Figure 5.
Root Mean Square (RMS), MAE and bias of ERA5 ZTD from surface-level data with respect to GNSS ZTD at 219 stations from 2015 to 2016.

Figure 6.
RMS of ZTD derived from ERA5 and ERA-Interim pressure-level data with respect to GNSS ZTD at 219 stations from 2015 to 2016.
Figure 6.
RMS of ZTD derived from ERA5 and ERA-Interim pressure-level data with respect to GNSS ZTD at 219 stations from 2015 to 2016.

Figure 7.
RMS of ZTD derived from ERA5 and ERA-Interim surface-level data with respect to GNSS ZTD at 219 stations from 2015 to 2016.
Figure 7.
RMS of ZTD derived from ERA5 and ERA-Interim surface-level data with respect to GNSS ZTD at 219 stations from 2015 to 2016.

Figure 8.
ZTD time series of station (a) SCLT, (b) GSDX, (c) URU2, (d) HLWD derived from ERA5, GPT2w model, ERA-Interim and GNSS from 2015 to 2016.
Figure 8.
ZTD time series of station (a) SCLT, (b) GSDX, (c) URU2, (d) HLWD derived from ERA5, GPT2w model, ERA-Interim and GNSS from 2015 to 2016.


Figure 9.
ZTD time series of the first station derived from ERA5, GPS, ERA-Interim and GPT2w model in a month.
Figure 9.
ZTD time series of the first station derived from ERA5, GPS, ERA-Interim and GPT2w model in a month.

Figure 10.
RMS of difference between ERA5 ZTD and GNSS ZTD during the period from 2015 to 2016.

Figure 11.
MAE of difference between ERA5 ZTD and GNSS ZTD during the period from 2015 to 2016.

Figure 12.
Bias of difference between ERA5 ZTD and GNSS ZTD during the period from 2015 to 2016.

Figure 13.
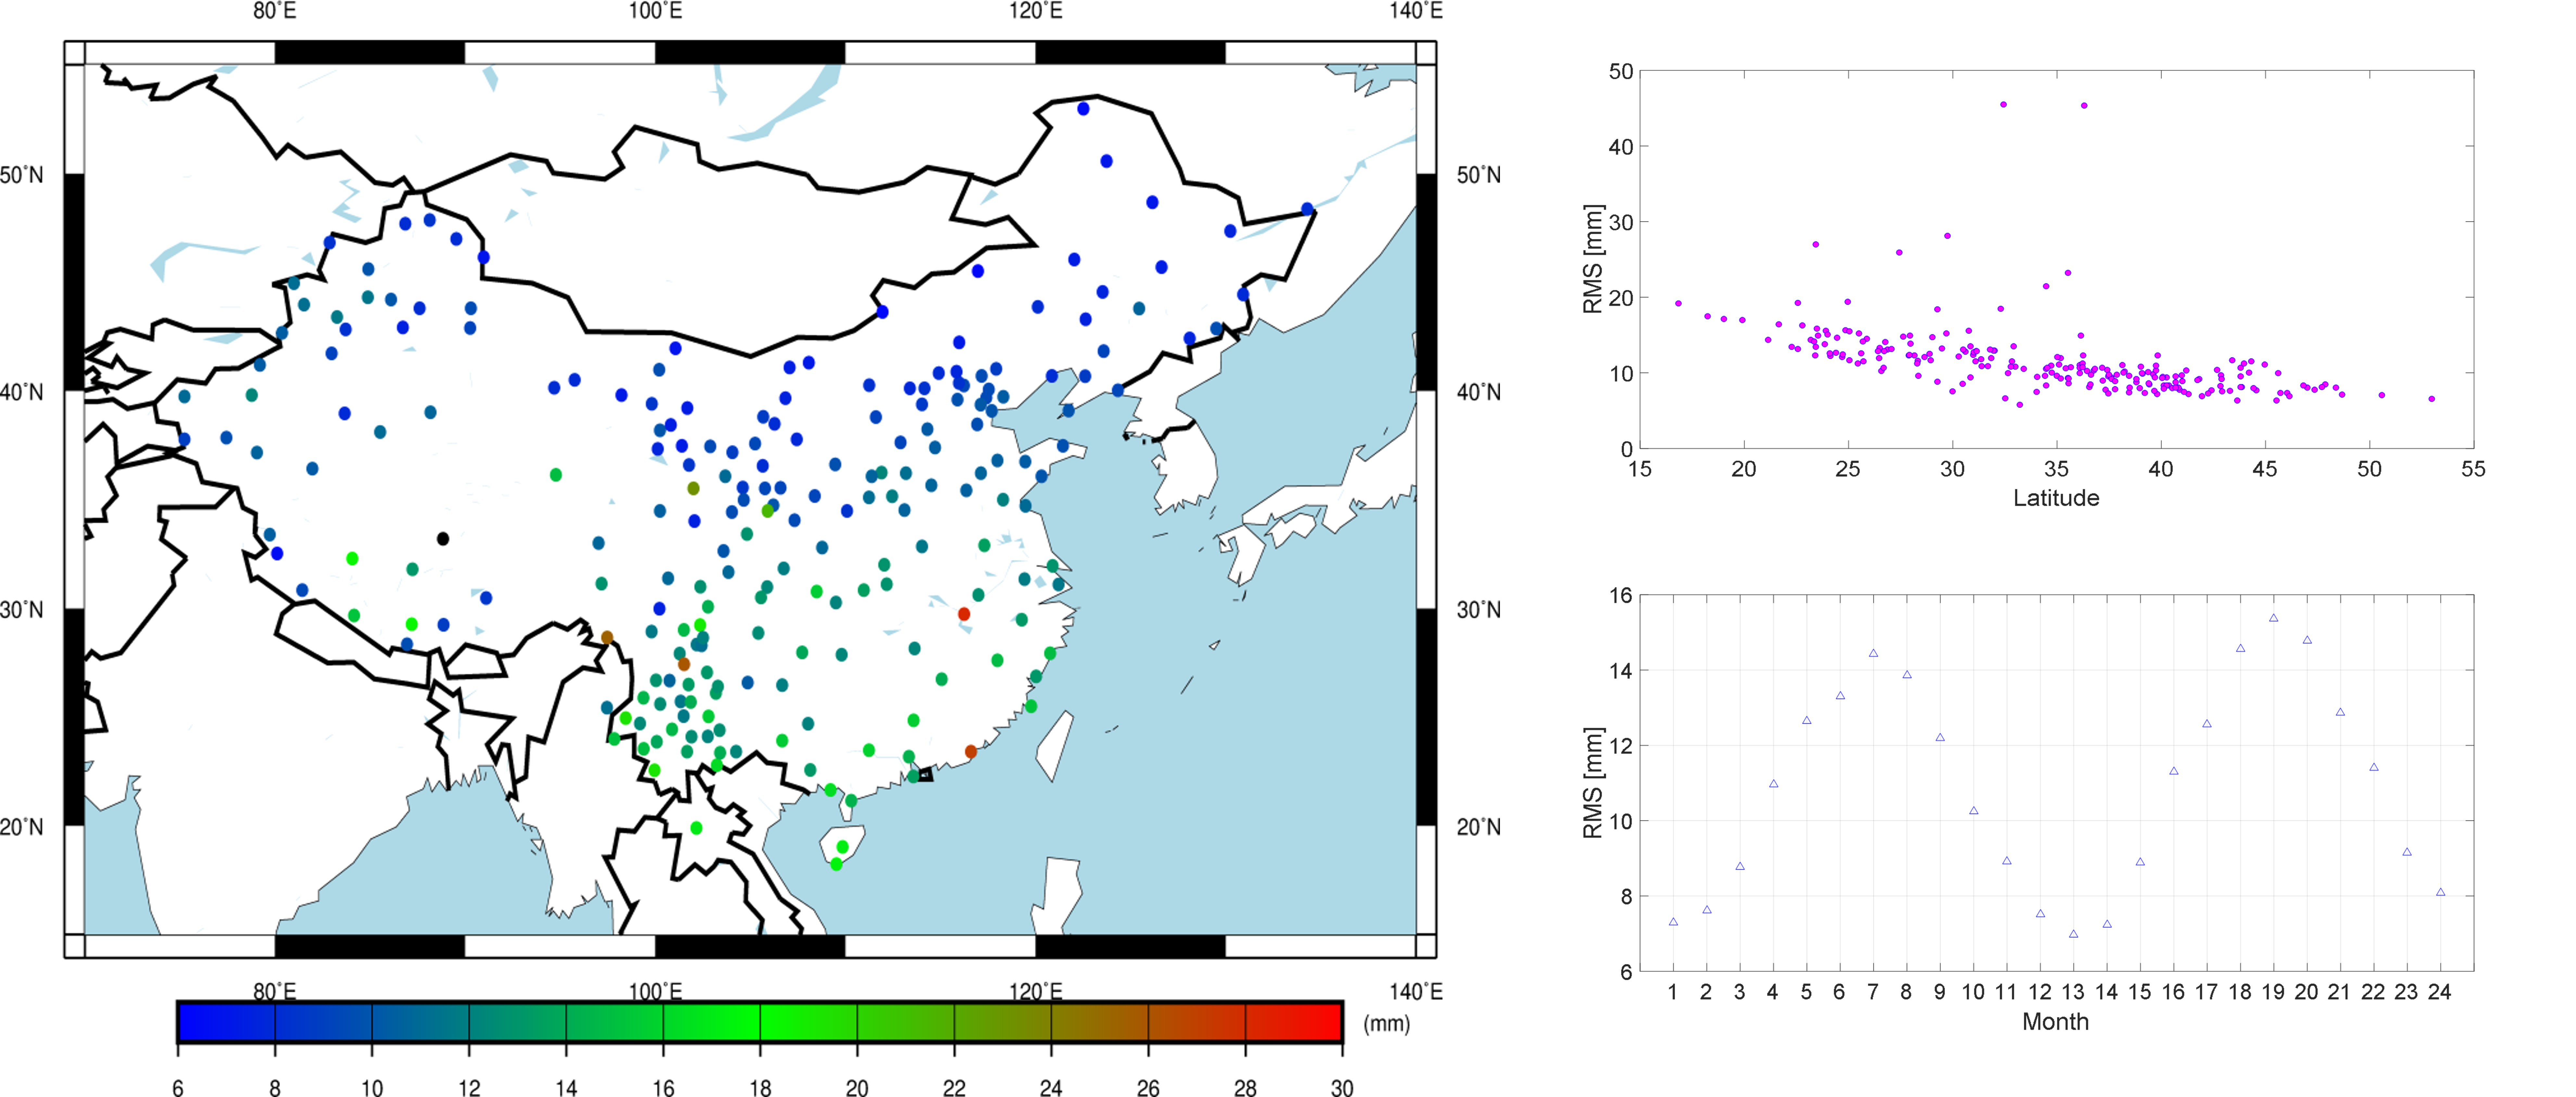
RMS of ERA5 ZTD compared with GNSS ZTD for 219 GNSS stations over China.

Figure 14.
(a) Time series of ERA5 ZTD bias and (b) boxplots of each station from 2015 to 2016 at 10 test GNSS stations over China.
Figure 14.
(a) Time series of ERA5 ZTD bias and (b) boxplots of each station from 2015 to 2016 at 10 test GNSS stations over China.


Figure 15.
Monthly average bias of ERA5 ZTD at 219 GNSS stations over China from 2015-16.

Figure 16.
Monthly average MAE of ERA5 ZTD at 219 GNSS stations over China from 2015-16.

Figure 17.
Monthly average RMS of ERA5 ZTD at 219 GNSS stations over China from 2015-16.


Table 1.
Zenith Tropospheric Delay (ZTD) solution strategy with BERNESE 5.2.
| Measurement and Model | |
|---|---|
| Mode | Precise Point Positioning (PPP) |
| Satellite system | GPS |
| Data interval | 30s |
| measurement | Ionospheric-free measurement with zero-differenced processes |
| Elevation cutoff angle | 3° |
| Mapping function | VMF |
| Troposphere model | VMF_DRY |
| Gradient model | tanZ |
| Zenith delay parameterized | Constant during 1-hour time span for each station |
| Solution rate | 1 h |
| Satellite orbit | Orbit from the Center for Determination in Europe (CODE) (ftp://ftp.aiub.unibe.ch/CODE_MGEX/CODE/) |
Table 2.
General statistics of the bias and Root Mean Square (RMS) for temperature and pressure from ERA5 surface-level and pressure-level reanalysis data over China during 2015.
Table 2.
General statistics of the bias and Root Mean Square (RMS) for temperature and pressure from ERA5 surface-level and pressure-level reanalysis data over China during 2015.
| Pressure | Surface | Pressure | Surface | |
|---|---|---|---|---|
| P (mbar) | P (mbar) | T (°C) | T (°C) | |
| BIAS | −1.04 | −1.65 | 0.42 | −0.04 |
| STD | 0.59 | 0.87 | 3.01 | 2.09 |
| RMS | 1.26 | 1.91 | 3.32 | 2.31 |
Table 3.
Statistics of the RMS, Mean Absolute Error (MAE) and bias for ERA5 ZTD from pressure-level and surface-level data over China from 2015 to 2016.
Table 3.
Statistics of the RMS, Mean Absolute Error (MAE) and bias for ERA5 ZTD from pressure-level and surface-level data over China from 2015 to 2016.
| ERA5 | Pressure- ZTD | Pressure- ZTD | Pressure- ZTD | Surface- ZTD | Surface- ZTD | Surface- ZTD |
|---|---|---|---|---|---|---|
| RMS (mm) | bias (mm) | MAE (mm) | RMS (mm) | bias (mm) | MAE (mm) | |
| mean | 11.49 | −2.97 | 8.73 | 39.25 | 7.97 | 31.19 |
| minimum | 5.75 | −0.01 | 4.54 | 10.69 | 0.05 | 7.53 |
| maximum | 45.48 | −22.19 | 30.07 | 156.86 | 139.62 | 139.8 |
Table 4.
Statistics of the RMS, MAE and bias for ZTD from ERA-Interim pressure-level and surface-level data over China from 2015 to 2016.
Table 4.
Statistics of the RMS, MAE and bias for ZTD from ERA-Interim pressure-level and surface-level data over China from 2015 to 2016.
| ERAI | Pressure- ZTD | Pressure- ZTD | Pressure- ZTD | Surface- ZTD | Surface- ZTD | Surface- ZTD |
|---|---|---|---|---|---|---|
| RMS (mm) | bias (mm) | MAE (mm) | RMS (mm) | bias (mm) | MAE (mm) | |
| mean | 13.33 | 13.33 | 10.02 | 44.07 | 15.57 | 35.21 |
| minimum | 6.52 | 6.52 | 5.12 | 10.8 | 0.01 | 8.22 |
| maximum | 54.96 | 54.96 | 35.62 | 182.24 | −39.76 | 168.17 |
© 2020 by the authors. Licensee MDPI, Basel, Switzerland. This article is an open access article distributed under the terms and conditions of the Creative Commons Attribution (CC BY) license (http://creativecommons.org/licenses/by/4.0/).
Share and Cite
MDPI and ACS Style
Jiang, C.; Xu, T.; Wang, S.; Nie, W.; Sun, Z. Evaluation of Zenith Tropospheric Delay Derived from ERA5 Data over China Using GNSS Observations. Remote Sens. 2020, 12, 663. https://doi.org/10.3390/rs12040663
AMA Style
Jiang C, Xu T, Wang S, Nie W, Sun Z. Evaluation of Zenith Tropospheric Delay Derived from ERA5 Data over China Using GNSS Observations. Remote Sensing. 2020; 12(4):663. https://doi.org/10.3390/rs12040663
Chicago/Turabian StyleJiang, Chunhua, Tianhe Xu, Shuaimin Wang, Wenfeng Nie, and Zhangzhen Sun. 2020. "Evaluation of Zenith Tropospheric Delay Derived from ERA5 Data over China Using GNSS Observations" Remote Sensing 12, no. 4: 663. https://doi.org/10.3390/rs12040663
Note that from the first issue of 2016, this journal uses article numbers instead of page numbers. See further details here.