Article

Improved 3D Stem Mapping Method and Elliptic Hypothesis-Based DBH Estimation from Terrestrial Laser Scanning Data

1
GNSS Research Center, Wuhan University, 129 Luoyu Road, Wuhan 430079, China
2
Department of Remote Sensing and Photogrammetry, Finnish Geospatial Research Institute, 02431 Masala, Finland
3
State Key Laboratory of Information Engineering in Surveying, Mapping and Remote Sensing, Wuhan University, Wuhan 430079, China
*
Author to whom correspondence should be addressed.
Remote Sens. 2020, 12(3), 352; https://doi.org/10.3390/rs12030352
Submission received: 20 December 2019 / Revised: 15 January 2020 / Accepted: 19 January 2020 / Published: 21 January 2020

Abstract

:
The detailed structure information under the forest canopy is important for forestry surveying. As a high-precision environmental sensing and measurement method, terrestrial laser scanning (TLS) is widely used in high-precision forestry surveying. In TLS-based forestry surveys, stem-mapping, which is focused on detecting and extracting trunks, is one of the core data processing tasks and the basis for the subsequent calculation of tree attributes; one of the most basic attributes is the diameter at breast height (DBH). This article explores and improves the methods for stem mapping and DBH estimation from TLS data. Firstly, an improved 3D stem mapping algorithm considering the growth direction in random sample consistency (RANSAC) cylinder fitting is proposed to extract and fit the individual tree point cloud section. It constructs the hierarchical optimum cylinder of the trunk and introduces the growth direction into the establishment of the backbone buffer in the next layer. Experimental results show that it can effectively remove most of the branches and reduce the interference of the branches to the discrimination of trunks and improve the integrity of stem extraction by about 36%. Secondly, a robust least squares ellipse fitting method based on the elliptic hypothesis is proposed for DBH estimation. Experimental results show that the DBH estimation accuracy of the proposed estimation method is improved compared with other methods. The mean root mean squared error (RMSE) of the proposed estimation method is 1.14 cm, compared with other methods with a mean RMSE of 1.70, 2.03, and 2.14 cm. The mean relative accuracy of the proposed estimation method is 95.2%, compared with other methods with a mean relative accuracy of 92.9%, 91.9%, and 90.9%.

Graphical Abstract

1. Introduction

Assessing the spatial organization of trees within the forest is a key objective for both forest managers and researchers [1]. Forest inventory measures the structural parameters on a sample plot, which provides an important basis for obtaining the quantity, quality, stand structure, and growth pattern of the wood, and determines the biomass, stem volume, forest carbon cycle, biodiversity, and changes in these attributes [2,3]. The individual tree is the basic measurement unit for forest inventory, and the stem is an important component of it. Stem volume is the most targeted variable in commercial forest management [4]. In addition, stems are closely related to the extraction of forest attributes, including tree locations [5,6], heights [7,8], diameters at breast height (DBH) [9,10,11], stem curves [12], crown widths [13,14], wood volumes [15,16], biomass [17,18,19], and so on. In the conventional forest resources surveys, the detailed stem attributes are measured by investigators by using caliper and altimeter in the field [2,7]. This survey method, which relies on manual measurement, is time-consuming and can only obtain limited data.
With the development of remote sensing, light detection and ranging (LiDAR) becomes one of the most promising remote sensing technologies for estimating various biophysical properties and structure parameters of forests [20,21]. Terrestrial laser scanning (TLS) is an effective tool for obtaining detailed structural information under the tree crown at the regional and forest holding level, because it can obtain high accuracy and high-density point clouds under the forest canopy [2]. Based on TLS, the geometry attributes can be measured efficiently, which are based on stem mapping that detects and extracts the stem from the point cloud. Many researches have studied and proposed some solutions and algorithms for stem detection and extraction from the TLS data in forest areas. These methods can be divided into three main categories: (1) Image-based methods; (2) 2D-based methods; and (3) 3D-point-based methods.
The first method groups the pixels in the range image based on local properties, such as the distance or surface curvature, and then uses the image process approaches to extract laser points belonging to the tree stems [22,23,24].
The second method divides the point cloud into slices in the vertical direction, and then conducts shape detection on the slices in order to detect the stem laser points. Tree stems are identified by point clustering and the detecting shape algorithm, e.g., circle fitting [10], cylinder fitting [25], and the Hough‑transform-based circle fitting method [26]. This method mainly considers the two‑dimensional geometric characteristic, which is simple and of lower computational cost. However, stem point detection becomes a problem when there are branches overlapping in the layer. In addition, a digital terrain model (DTM) needs to be produced before constructing the slice at a certain height, because the knowledge of the terrain is necessary.
The last method extracts and classifies 3D point clouds directly based on geometric, physical, and other features, which can be further divided into point-based methods and segment-based methods. Point-based stem extraction methods, which detect the stem points based on the points’ features, have been studied by many researchers. Liang et al. [27] proposed a method to identify stem points based on flatness and normal direction. Lalonde et al. [28] introduced a method that classifies the points according to three geometric features, including scatter, linear, and surface with the Bayesian classification method. The linear points are treated as the stem points to be extracted. However, the geometric features that vary with the radius of the neighborhood need to be calculated at each point by its surrounding points [29], which will result in a heavy computational burden. In addition to the points’ geometric features, some scholars have also proposed the point-based stem extraction method based on other point characteristics, such as the intensity and radiometric [30], to extract the stem points in point clouds. However, the intensity of laser reflection is affected by many factors, and the calibration of intensity is complicated [31]. Segment-based methods perform a classification based on point clouds’ segments. They consider the geometric features of the 3D point clouds’ segments instead of the point, which can reduce the calculation and improve the calculation speed [32]. These methods divide point clouds into fragments by segmentation algorithms, such as shape detection [33] and region growing [34], and then classify them according to the characteristics and shapes of fragments. Burt et al. [35] proposed a cylindrical fitting method based on random sample consistency (RANSAC) to extract the stem up to the position of first branching. Liang et al. [36] proposed a method that constructed a series of overlapping cylinders along the stem to compose a full trunk model. Based on the concepts of tree topology and cover sets, Raumonen et al. [37] proposed a method to divide point clouds into stems and branches by using surface patches and checking the local connectivity of a moving surface region. Most of these methods assume the tree stem as segmented cylindrical models and extract the stem points by the fitting method, such as direct cylinder fitting and random sample consistency (RANSAC). However, in the process of cylindrical fitting, the points of branches will affect the fitting result and even result in the failure of fitting, which will lead to some parts of the stem not being able to be detected. Especially in the upper half of the tree stem, where the stem is thinner, the number of stem points is fewer. The points of the branches will seriously affect the results of cylindrical fitting. Therefore, the existing methods can extract the lower part of the stem, but it is difficult to extract the stem near the top of the tree, which affects the integrity of the trunk extraction.
After the tree stem is extracted, the attribute parameters of the tree need to be further estimated. DBH is one of the most important factors in forest surveying that provides a basis for calculating the stem volume and constructing a growth model. Thus, the accurate estimation of DBH is important for high precision forest surveying. The main task is to estimate the optimal DBH parameters from the point cloud of the trunk at the corresponding height. Many articles have proposed many DBH estimation methods, such as linearized or nonlinear least square circle fitting [3,7,24], Hough‑transform [26], cylinder fitting [15,38], random sample consensus (RANSAC) algorithm [8,39], and random Hough transform [31,40]. Most of these methods model the stem profiles as a circle and fit the diameter parameter from the stem points at the breast height. Although, the shape of the stem profiles is very similar to a circle, it is not standard, which introduces errors into the fitting process. Moreover, although DBH is called a diameter parameter, it is determined by the perimeter of the tree stem at the breast height, which is measured in the forest survey (the DBH is estimated by dividing the perimeter by pi). Therefore, we do not have to use a circular model to get the DBH parameter and are able to choose a more accurate model to fit and get a more accurate perimeter, which can estimate a more accurate DBH parameter. The extracted stem points may include a few outliers and noise points, which will also degrade the fitting accuracy. Hence, we should reduce the effect of these branch points in fitting.
To summarize, to improve the integrity of individual stem extractions for stem mapping and the accuracy of DBH estimation, we improved an RANSAC-based stem extraction method and proposed an improved DBH estimation method. The main contribution included the following: (1) The sectional RANSAC cylindrical fitting method is improved by considering the growth direction. The growth direction of the stem is calculated and utilized to exclude the branches points in the establishment of the stem buff, which improves the integrity of stem extraction. (2) A robust least squares ellipse algorithm is proposed to fit the stem section and reduce the influence of branches’ points in fitting, which can improve the accuracy of the DBH estimation.
The rest of this paper is organized as follows. The automatic extraction process of tree parameters, including the trunk extraction method and robust least squares ellipse algorithm, is introduced in Section 2. Field experiment and experimental results are presented in Section 3. The discussion and conclusions are drawn in Section 4.

2. Materials and Methods

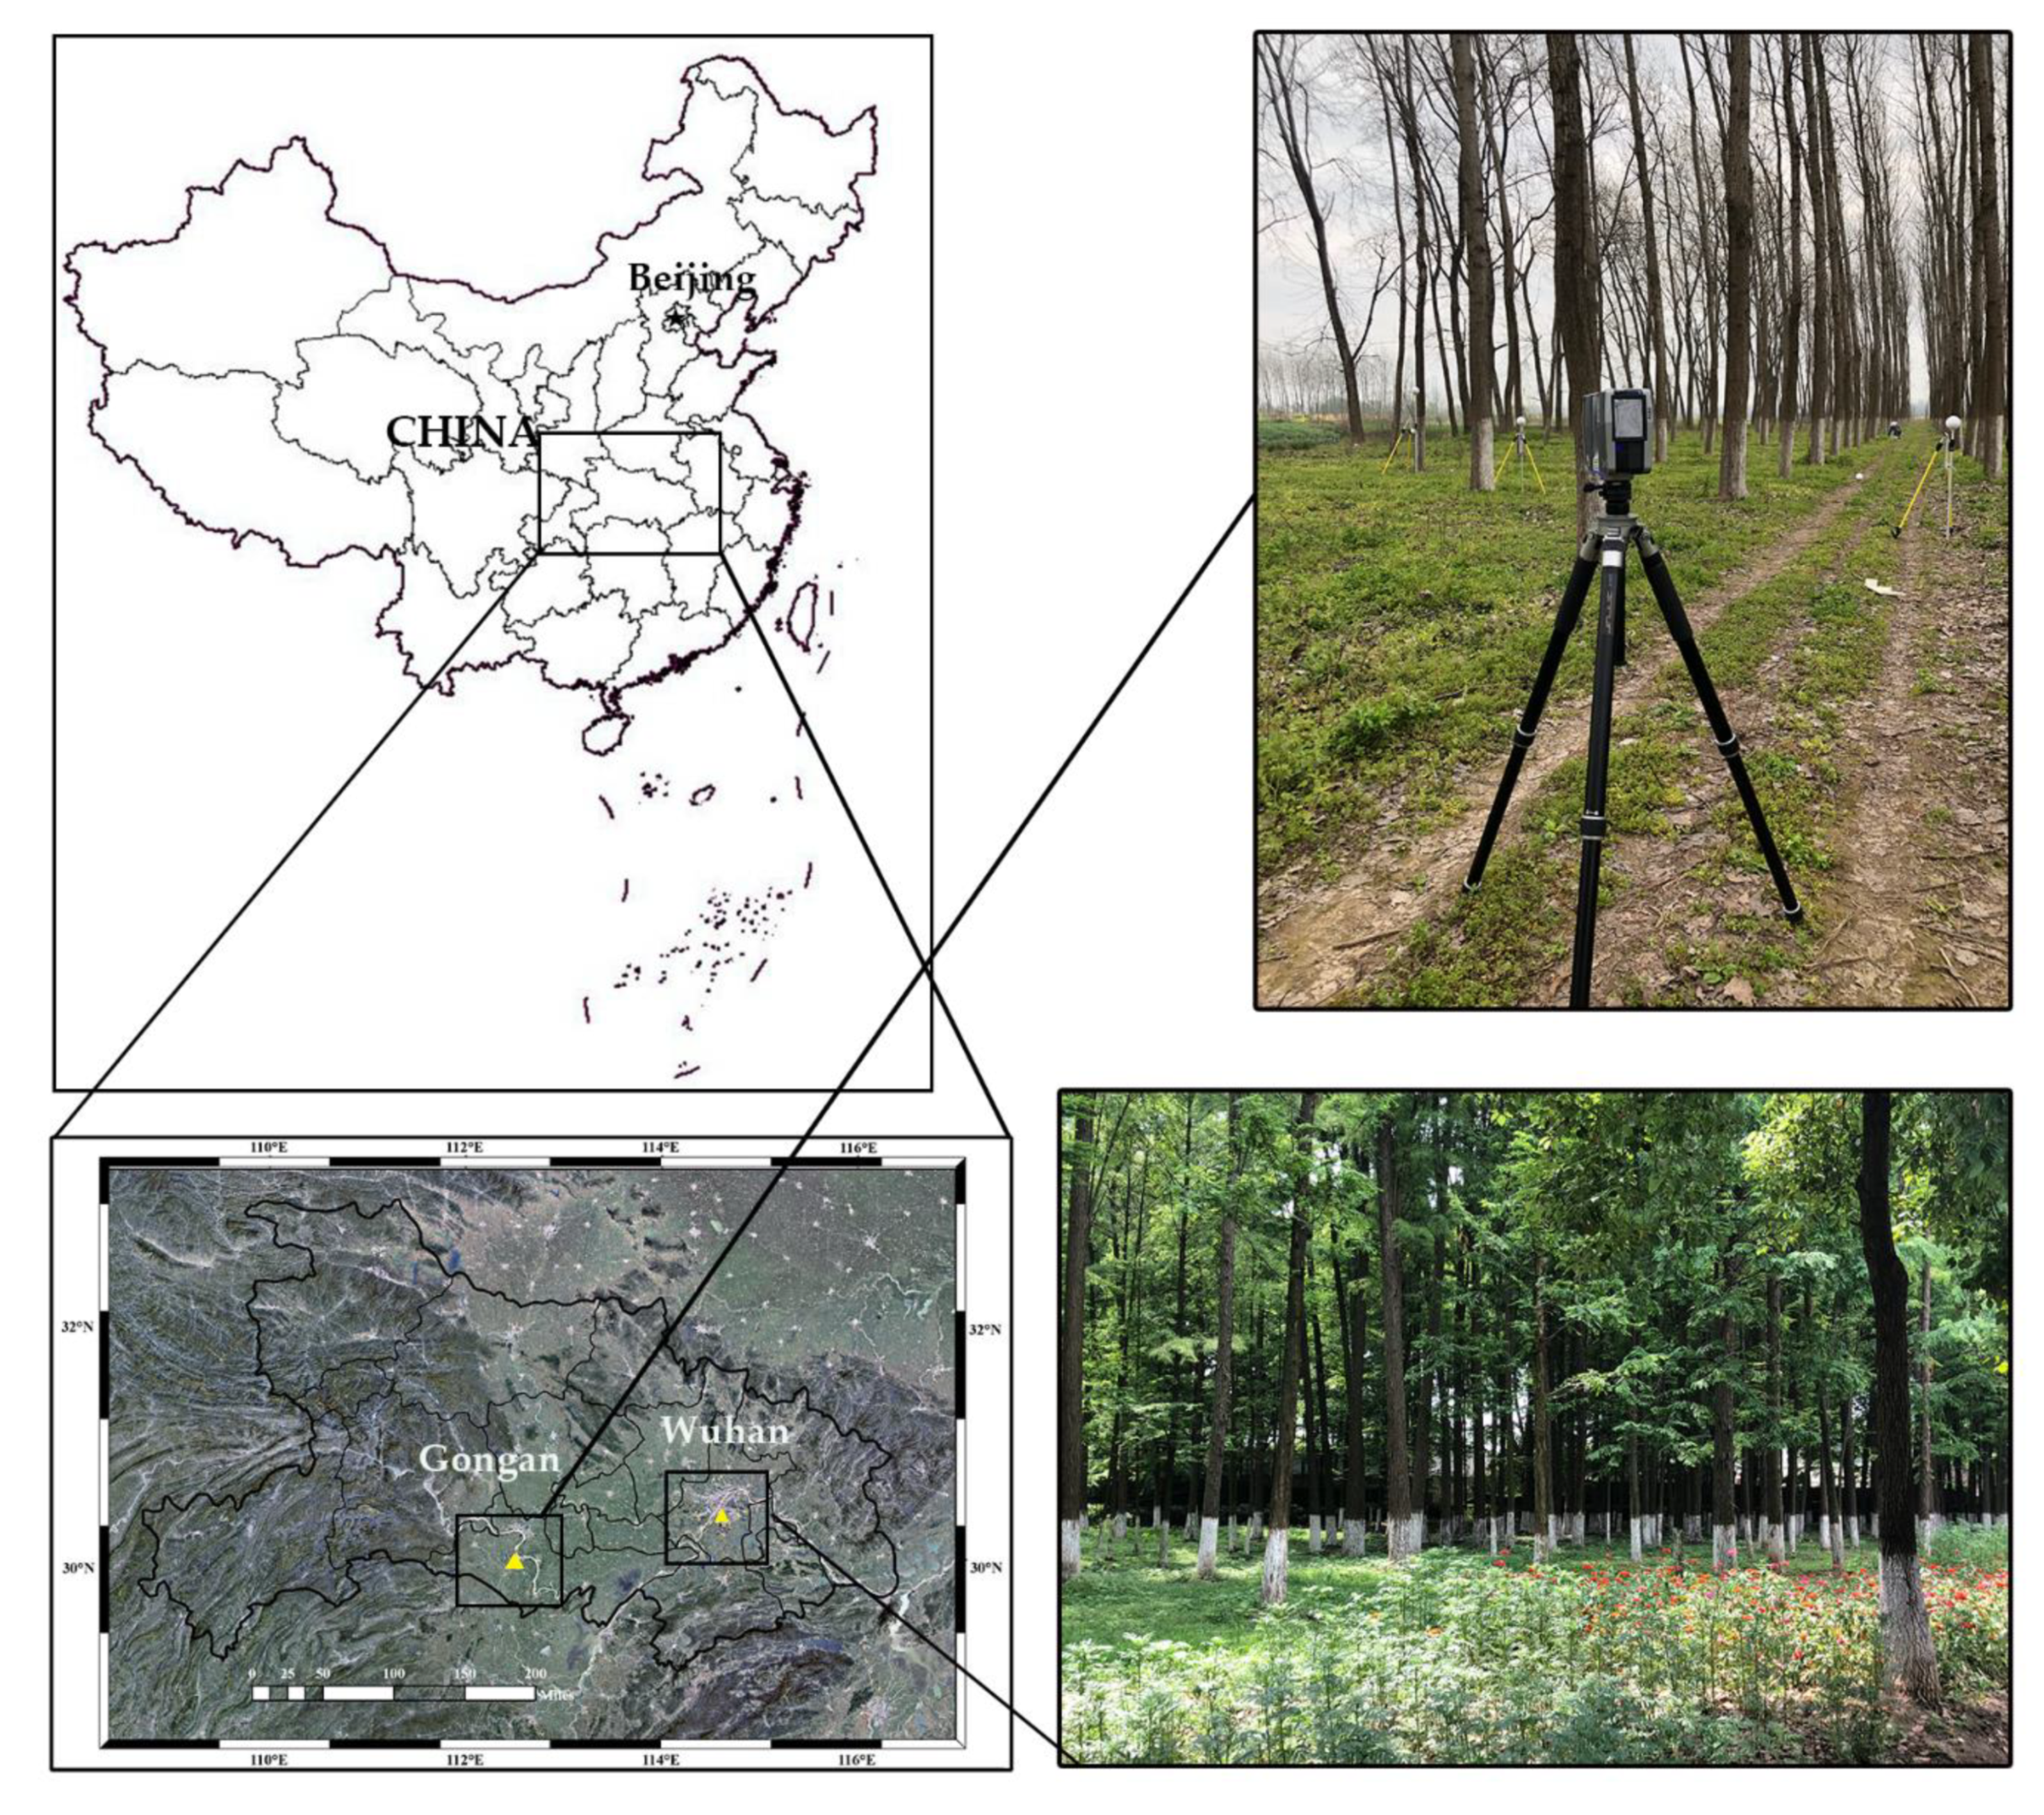
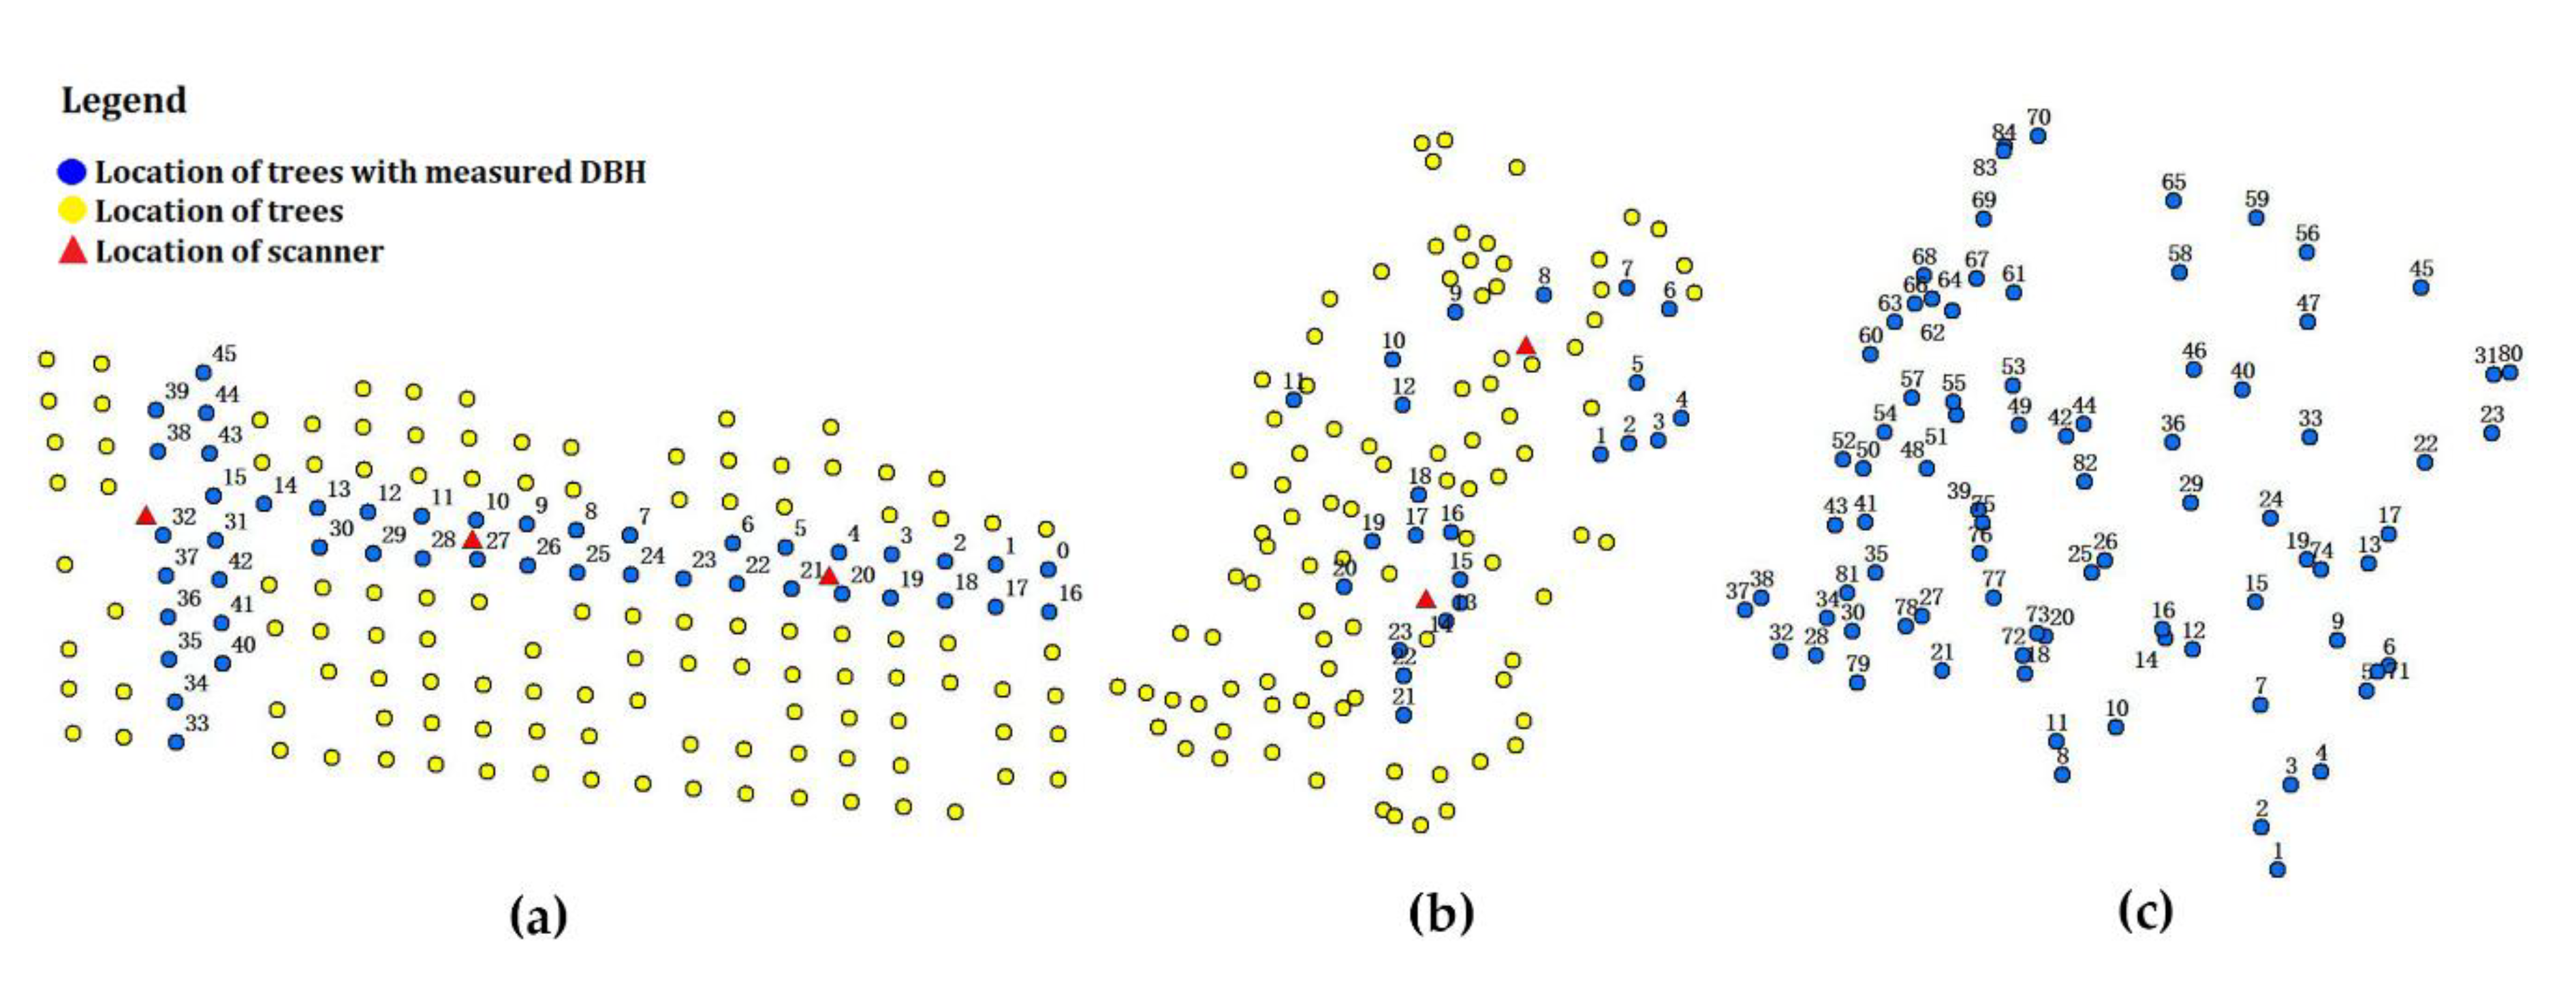
2.1. Research Plot and Data Description

Three research plots’ data were studied, two of which were measured in the Hubei Province, China, and the other one was from the open data in the TLS benchmarking project.
Wuhan is located in the east of the Hubei Province, China (30.54°N, 114.31°E). Gongan is located in the south-central part of the Hubei Province, China (30.07°N, 112.32°E), which is a typical plain lake area with a 32% forest coverage. The TLS datasets used in this study were obtained from a Populus euramerican forest plot in Yangjiachang Town, Gongan, 40 by 100 m, and a metasequoia forest plot in Ziyang Park, Wuhan city, 30 by 50 m. Two study areas located in Hubei Province are shown in Figure 1. The open data in the TLS benchmarking project are distributed in a southern boreal forest in Evo, Finland (61.19°N, 25.11°E). Each plot has a fixed size, 32 by 32 m. The main tree species are Scots pine (Pinus sylvestris L.), Norway spruce (Picea abies L. Karst.), and silver (Betula pendula Roth) and downy (Betula pubescens Ehrh.) birches. In order to distinguish, the three data are named plot Gongan, plot Wuhan, and plot Finland.
In order to obtain the best visibility for all the trees, multi-scan mode was used to collect forest point cloud data. In the multi-scan mode, several scans are performed within the forest plots to collect more detailed point clouds to represent the sample plot. Two scans were performed in the Wuhan plot and three scans in the Gongan plot. These scans were co-registered by using spherical targets that were manually placed throughout the plot.
The point cloud data were obtained by the laser scanner FARO Focus3D X 130 (FARO Technologies, Inc., USA) in 2019. The instrument specifications of the scanner are shown in Table 1. In Table 2, the detailed data descriptions of 3 plots are listed, which includes the mean DBH, sum of trees, stand conditions, density, and main species. All the trees in three plots were used for a stem point extraction experiment. Parts of trees with a measured DBH in plots Wuhan and Gongan and all trees in plot Finland were used for the DBH extraction experiment. The trees involved in DBH extraction experiments were measured by caliper in the field and marked sequentially in Figure 2. In the DBH extraction experiment, the experimental samples in Gongan were 46 trees planted along the trails in the woodland, and the experimental samples in Wuhan were 23 randomly selected trees.

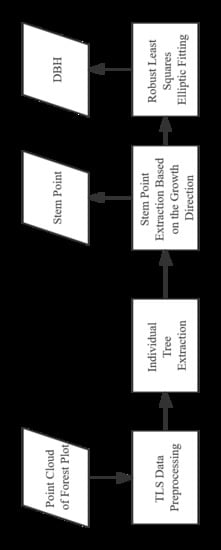
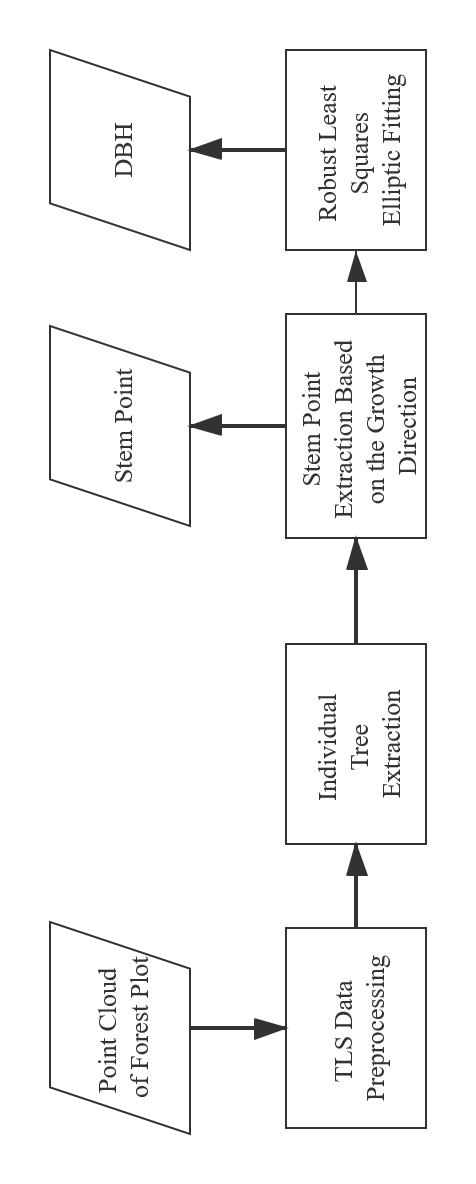
2.2. TLS Data Preprocessing

2.2.1. Co-Registration, Ground Filtering, and TLS Data Thinning

Point cloud data preprocessing includes co-registration, ground filtering, and TLS data thinning. Co-registration is used to convert the different scans into the same coordinate system by using the common points. In multi-station scanning, there are five visible spherical targets between each station and the coordinates of the reference targets are used as the common points in the point cloud co‑registration of different scans. Then, we completed the point cloud co-registration with SCENE, which is a software packaged with the laser scanner FARO. According to the processing report of SCENE, the co-registration error was less than 6 mm.
Ground filtering is a necessary preprocessing process for isolating the individual trees. The scanned forest point clouds not only include trees but also a large number of ground points, which will hinder the detection and extraction of tree point clouds. In addition, ground filtering is a prerequisite for disconnecting the stem from the ground, and non-ground point clouds are easier to achieve in individual tree segmentation. The cloth simulation filter method is a ground filtering method based on a physical process. It utilizes the nature of cloth and modifies the physical process of cloth simulation to adapt to point cloud filtering [41]. Zhang et al. [31] used the cloth simulation filter method to filter the ground. The ground points and non-ground points were also segmented by the cloth simulation filter method in our study. This function is integrated into the open source software Cloud Compare, which can complete the ground filtering operation with the software.
Finally, the non-ground point cloud was sampled in the pre-processing. Due to data redundancy, the processing takes a long time and data thinning is a necessary process to improve processing efficiency. We streamlined the data by the voxel grid filter, which down-sampled the original point cloud data and each voxel was 1 cm3 in size, which could sample the point cloud without losing accuracy in tree detection [42].

2.2.2. Individual Tree Extraction

The individual tree is the basic measurement unit. Individual tree clouds are the basis of automatic extraction of tree attributes. The next step is the segmentation of the non-ground cloud into individual tree points. Many individual tree segmentation algorithms have been proposed, such as connected component labeling [40], mean shift method [43], point cloud directly segmentation [44], and Euclidean distance clustering [45]. Euclidean distance clustering and connected component labeling were used for individual tree extraction in this research. Euclidean distance clustering in a Euclidean sense can be implemented by making use of a 3D grid subdivision of the space by a k-dimensional tree (kd‑tree) structure in order to find the nearest neighbors. It is suitable for the segmentation of the sample plot with low tree density. The label connected components algorithm can be used to find the connected components within organized point cloud data. The input point cloud is divided into small parts by a 3D gird, which is deduced from the octree structure. Based on the point cloud part, connected component labeling can be used to connect point cloud parts and complete the segmentation of the tree stem from stratified point clouds [40]. The detailed procedures can be found in [40,45]. Finally, the isolated points and point clusters were then detected and deleted in the segmentation process.

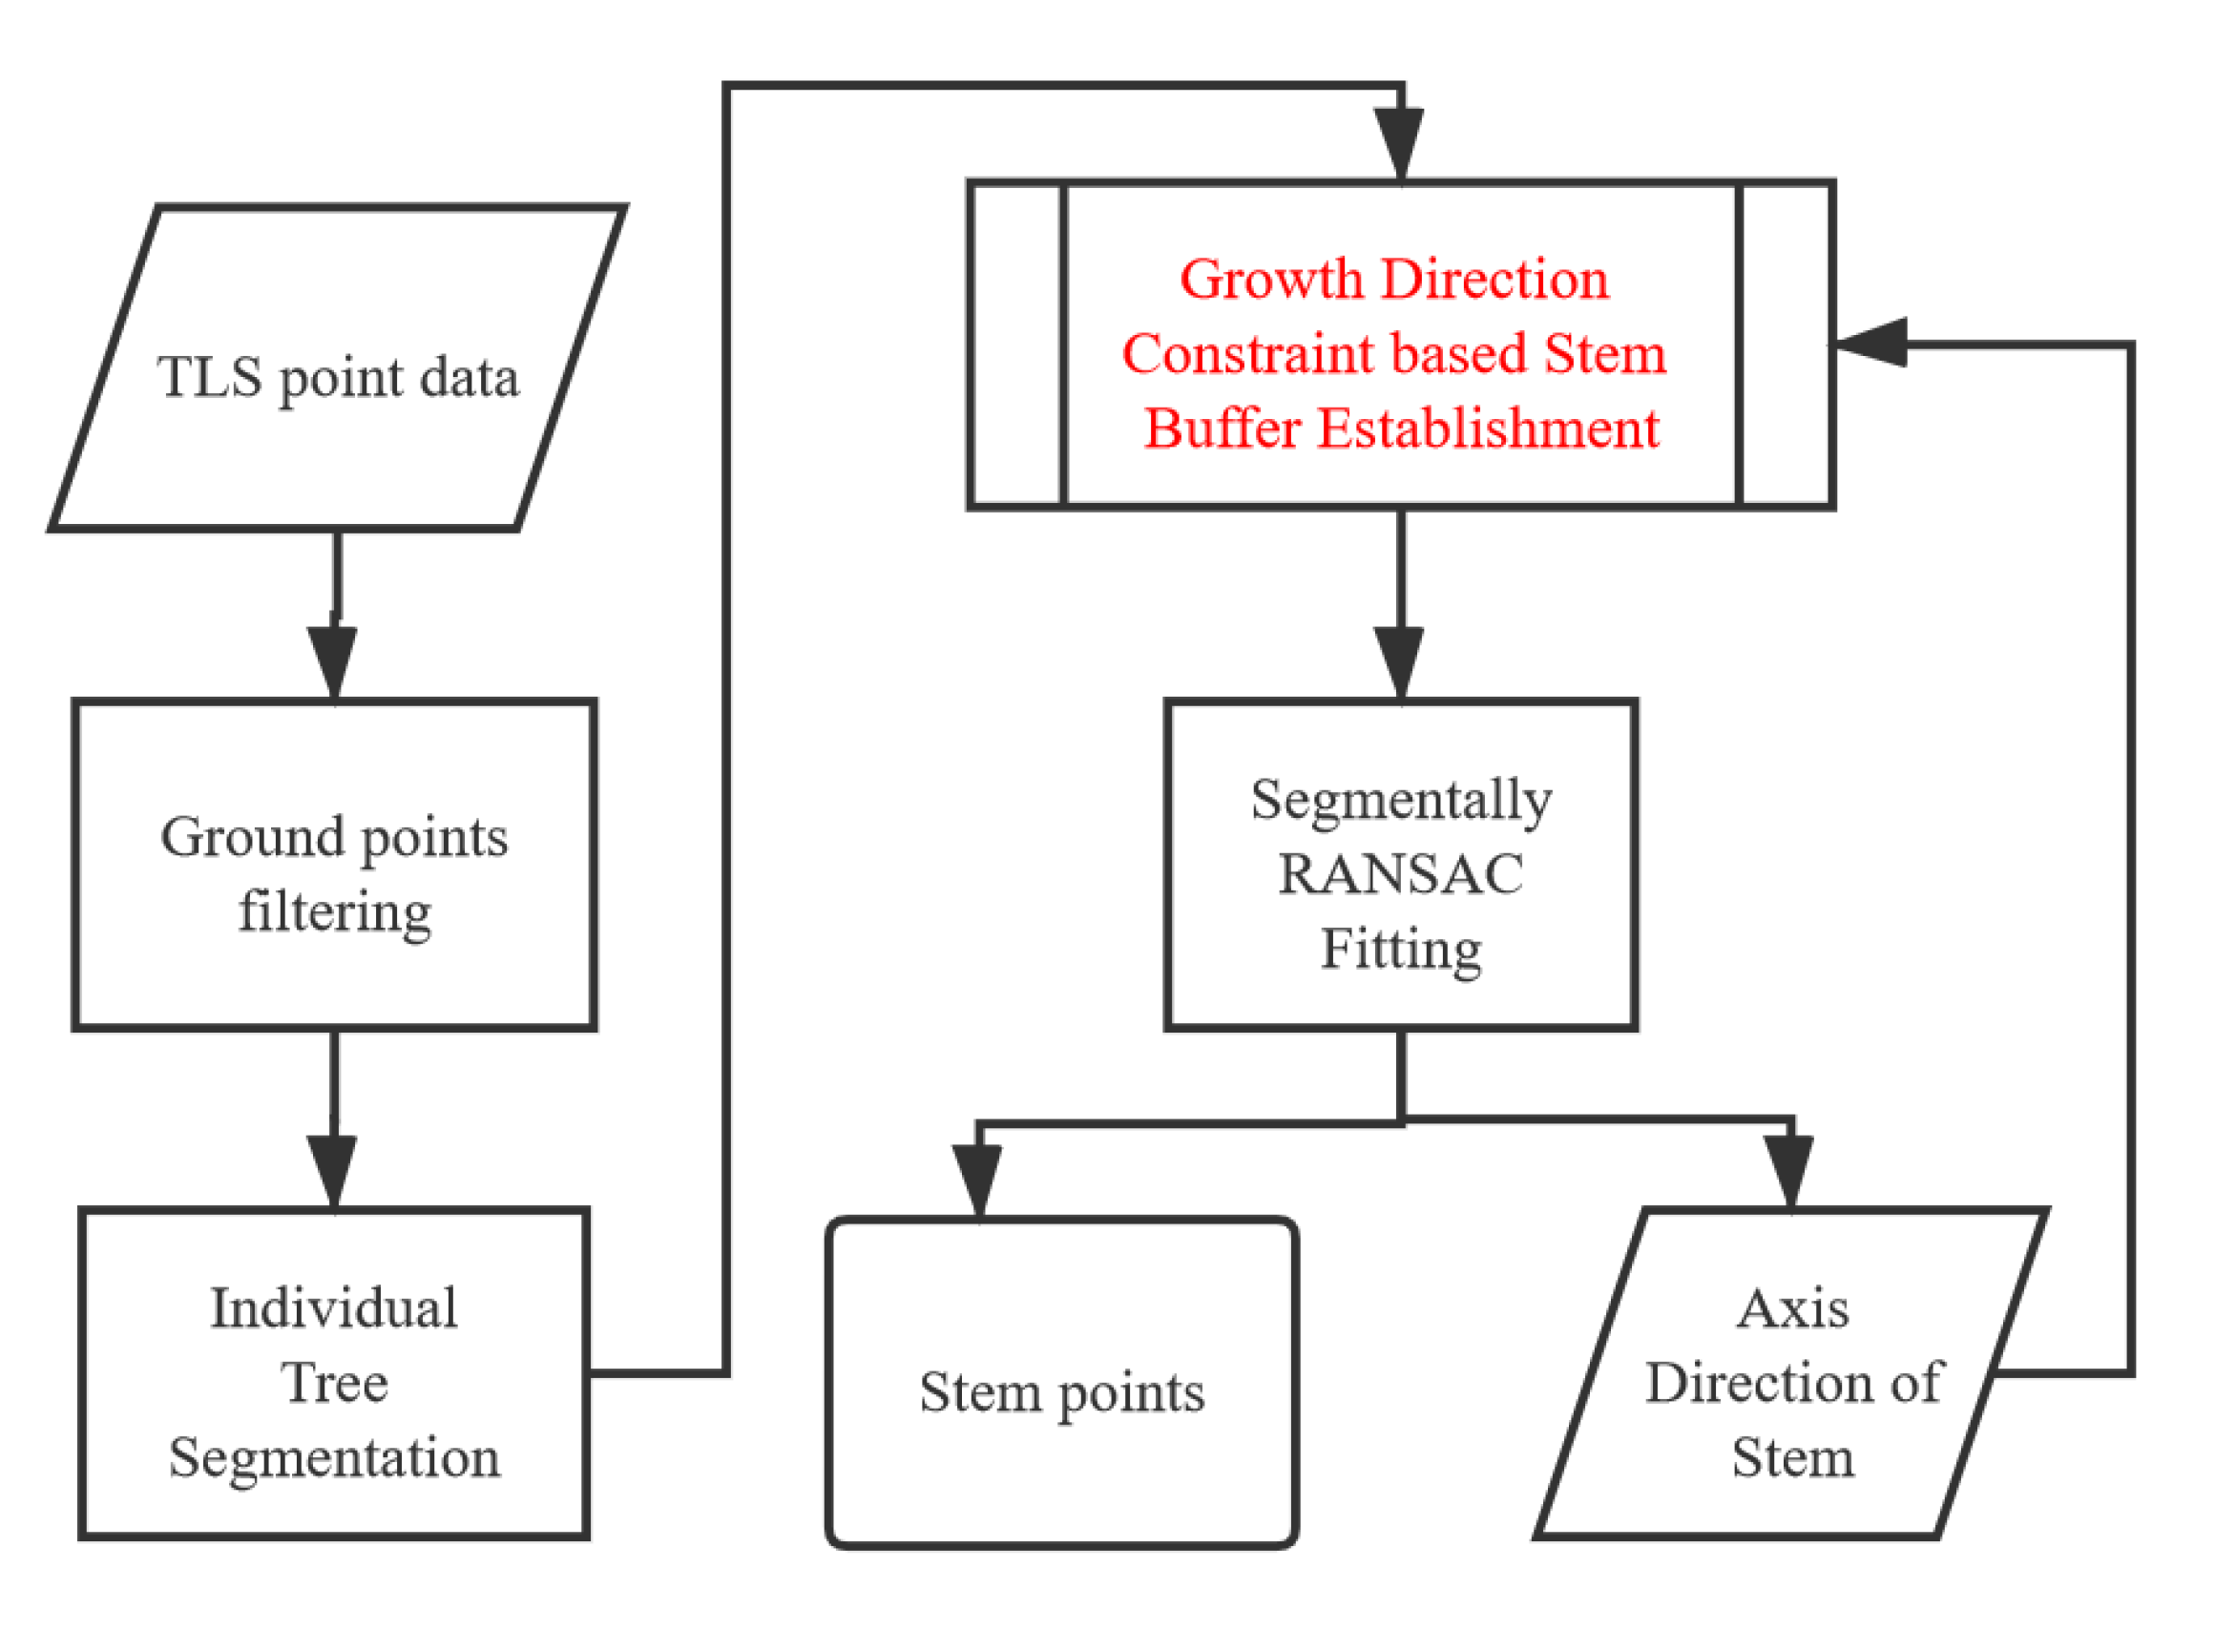
2.3. Stem Point Extraction Based on the Growth Direction

After individual trees are extracted, the individual tree not only contains the trunk but also the canopy, branches, leaves, and other components. For 3D stem mapping, the 3D stem points should be extracted further from the individual tree points. Some methods treat the trunk as a vertical cylinder with pole-like characteristics and identify it by using a single vertical cylinder model [46]. However, a single cylinder model cannot describe the trunk exactly, which will degrade the stem extraction result. Therefore, improved methods are proposed by utilizing the multi-cylinders model instead of the single cylinder model, which can describe the trunk better [12].
Based on the multi-cylinder model, the tree stem points can be extracted according to the fitting results. The RANSAC algorithm has the characteristics of fewer iterations and a strong ability of resisting gross errors [35], which is a robust fitting method and was utilized. In the fitting process, a stem buffer is created firstly, which will include other tree components, such as branches, that would introduce the errors in fitting. If a stem buffer is created using the growth direction constraint, which can remove the interference components (e.g., branches) in the point cloud of the candidate area in advance, the accuracy of the RANSAC calculation results can be enhanced.
Figure 3 shows the process for stem extraction. Firstly, we divided the tree point cloud into sections based on height and sorted them from the bottom to the top. The first stem buffer was established containing the points of bottom section. The RANSAC algorithm was applied for fitting optimal cylindrical parameters that describe the buffer best. Then, the central axis of the cylinder was calculated by the cylindrical parameters. Considering that the growth direction of the adjacent sections of the tree stem is similar, the next stem buffer was established with the central axis parameter of the former section, which can reject part of the points of other components from the stem buffer and improve the RANSAC fitting result. Considering that the growth direction of trees is not fixed, the frustum-shaped buffer zone was more robust than the cylindrical buffer zone. It can reduce the misjudgment of the stem caused by the deviation of the growth direction and allow more main stems to be included in the buffer to be calculated. This process was repeated until the last section.
The stem buffer establishment with the central axis parameter is the key to stem point extraction based on the growth direction. As shown in Figure 4a, the cylindrical axis parameter, L ( l , m , n ) , can be defined and calculated by the two points on the cylindrical axis, which are P ( x , y , z ) and P 0 ( x 0 , y 0 , z 0 ) in the figure. R is the radius of the cylinder. The steps of the next stem section extraction considering the L and R are as follows:
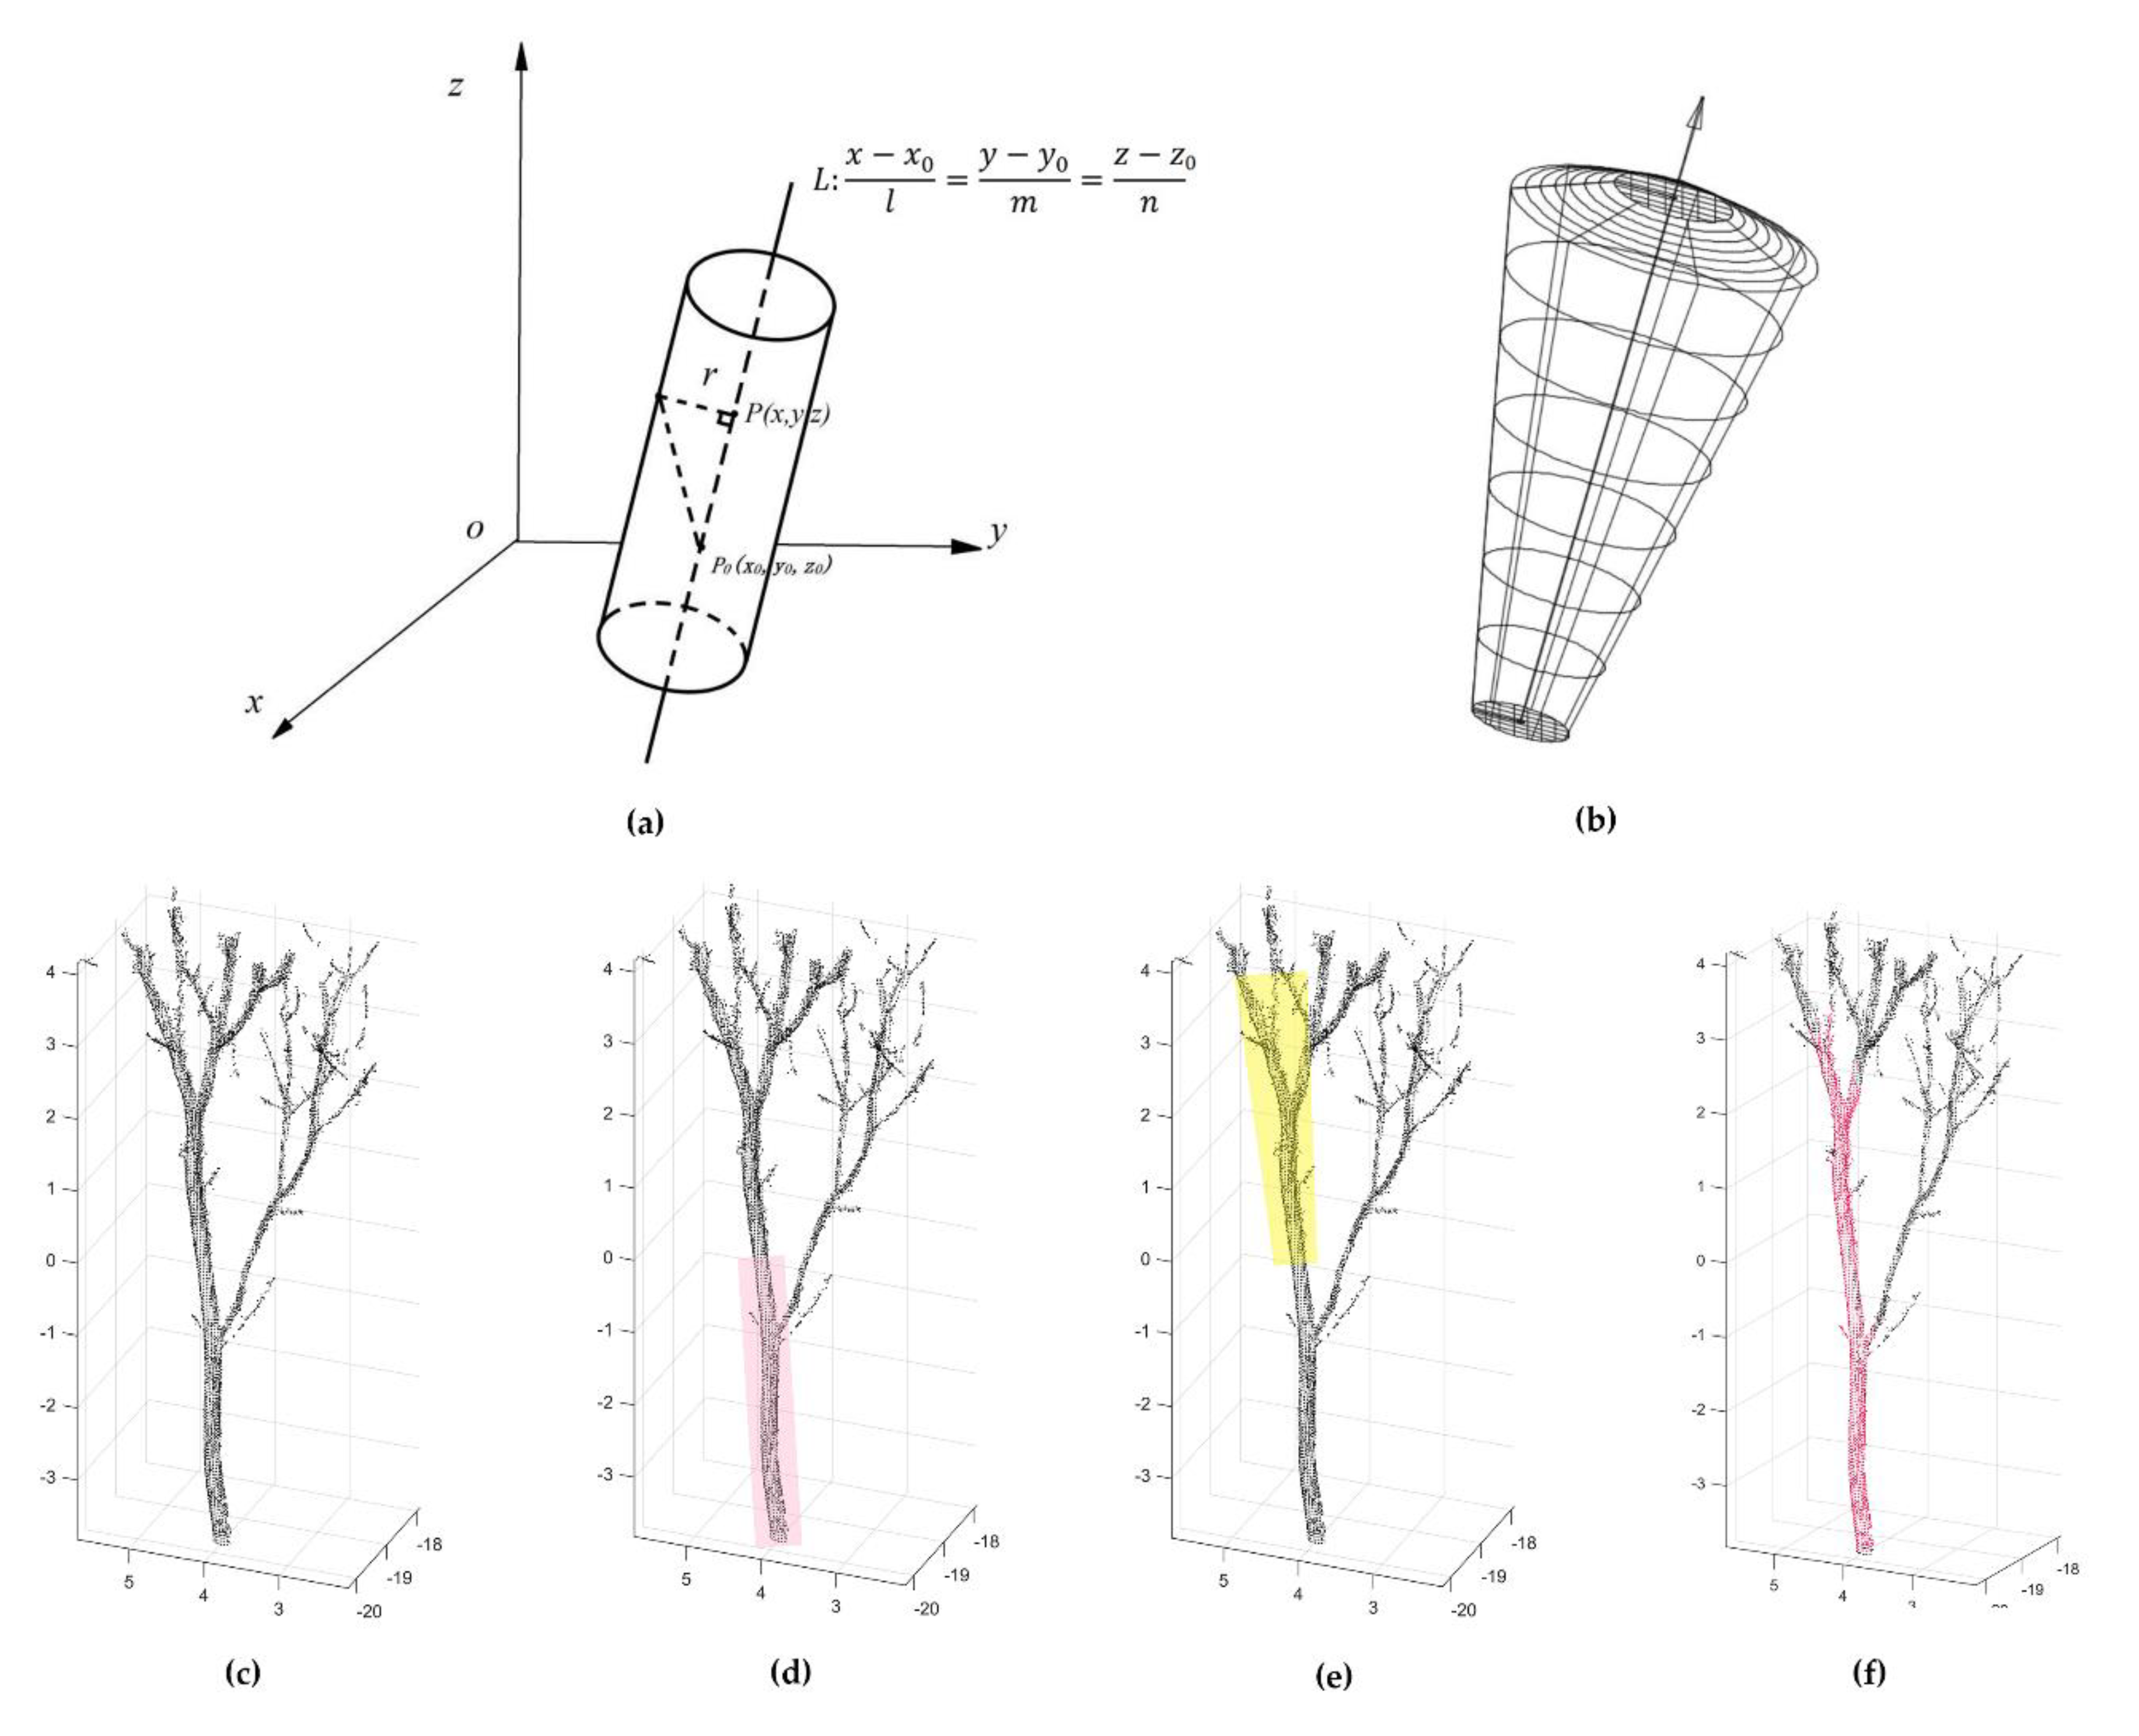
  • As Figure 4b shows, a frustum buffer was established by the coordinates of a point on the axis, L and R . The frustum buffer can be regarded as the result of the angle of rotation of the fitted RANSAC cylinder around the central axis of the cylinder;
  • As shown in Figure 4d, the pink cylinder is represented by the RANSAC cylinder that best fits the trunk of this section. The inside point of the RANSAC cylindrical model is considered the stem point;
  • As shown in Figure 4e, the yellow area in the figure is a frustum buffer created based on the cylinder parameters provided by the RANSAC cylinder; and
  • Figure 4f shows that the central trunk components of tree clustering were extracted layer by layer with fixed steps. By splicing the extraction results of each layer together, the splicing results can be regarded as the trunk of an individual tree.

2.4. Robust Least Squares Elliptic Fitting for DBH Estimation

After stem extraction, the DBH can be estimated from the stem points at breast height. There have been many DBH methods proposed, such as linear least square (Landau algorithm) circle fitting [3,10], nonlinear least squares (Gauss Newton) circle fitting [7], crescent moon method proposed by Kiraly and Brolly [47], RANSAC circle detection [39], Hough transform, and random Hough transform [26,31,40]. However, most of them are based on the assumption that the stem section is circular.
Although the shape of stem profiles is similar to a circle, there are still small differences. Compared with the circular model, the elliptic model can describe the shape of stem profiles, which also includes the circular model, and hence can improve the fitting parameters’ accuracy of stem profiles. Moreover, the elliptic model cannot directly calculate the diameter. It needs to calculate the perimeter of the ellipse according to the model parameters and then divide it by pi to obtain the DBH parameters, which is also the same for the actual measurement method of the current forestry survey.
The accuracy of the fitting is reduced because the extracted stems cannot completely remove the branch points. At the same time, the outliers of the measurement will also affect the fitting results. The DBH estimation method should reduce the effect of these errors on the estimation results. Robust estimation is an estimation method widely used in the measurement field, which can alleviate the influence of outliers [48]. IGG III is one of the widely used robust estimation methods.
This paper applies robust least squares based on the IGG III method to ellipse fitting. The IGG III weight function can effectively remove the interference of the coarse data points on the result by assigning zero weights to the coarse domain data and enhance the robustness of the algorithm.
For sliced DBH point cloud data, we regarded them as ellipses and used robust least squares elliptic fitting to find the best fitting for the given set of points. The mathematical representation of use is the conics equation of the ellipse, which is:
E l l i p s e = A x 2 + B x y + C y 2 + D x + E y + F = 0 ,
In order to avoid the trivial solution,   [ A   B   C   D   E   F ] T = 0 6 × 1 , the constraint F = −1 is applied. Note that F does not depend on edge point ( x , y ) , so Equation (2) is a least squares problem instead of a total least squares problem [48]:
f ( a , x ) = a T x 1 = A x 2 + B x y + C y 2 + D x + E y 1 = 0 ,
where ellipse parameters are given by a = [ A   B   C   D   E ] T , and the data point is   X = [ x 2   x y   y 2   x   y ] T . The fitting of a general conic may be approached by minimizing the sum of squared algebraic distances:
g ( a ) = i = 1 I f 2 ( a , x i ) .
According to Equation (3), a least squares fit is performed on the quantities that do not satisfy the equation; then, the equations can be written in the matrix form (Equation (4)):
V = G X L ,
where,
V = [ v 1 v i v N ] ,   G = [ x 1 2 x 1 y 1   y 1 2 x 1   y 1 x i 2 x i y i   y i 2 x i   y i x N 2 x N y N   y N 2 x N   y N ]   ,   X = [ A B C D E ]   ,   L = [ 1 1 1 ] .
According to the principle of least squares, there are the following formulas:
X = ( G T P ¯ G ) 1 ( G T P ¯ L ) ,
where P ¯ is the equivalent weight matrix of the edge points of an ellipse. In order to improve the accuracy of the ellipse parameter solution, we introduced the robust method and selected the robust weight function as follows:
w i = { 1 | v ¯ i | k 0 k 0 ( k 1 | v ¯ i | ) | v ¯ i | ( k 1 k 0 ) k 0 | v ¯ i | k 1 0 | v ¯ i | k 1 ,
where v i is the residuals’ error of the measurement, σ 0   is the standard deviation of the measurement error, | v ¯ i | = | v i | σ 0 is the standardized residuals, and k 0 and k 1 are the modulation coefficients of the robust threshold. According to Equation (7), the normal data is retained, the weight of suspicious data is reduced, and bad data is eliminated. It can effectively eliminate the effect of gross errors on ellipse fitting.
According to elliptic coefficients, it can be calculated as follows: Ellipse center coordinate ( x 0 , y 0 ) , two semi-axes a e and b e , and orientation θ . The perimeter of the ellipse and the DBH can be calculated by the following formula:
C e l l i p s e = 4 ( a e + b e ) 4 [ 4   π + 0.1218 ( a e b e ) 2 ( a e + b e ) 2 + 2.8 a e b e ]   a e b e a e + b e ,
D B H e l l i p s e = C _ ellipse / π .
The proposed robust least square ellipse fitting (RLSEF) method and the other three commonly used DBH estimation methods, random sampling consistency circle fitting (RANSAC_CF), random sampling consistency ellipse fitting (RANSAC_EF), and random Hough transform (RHT), were compared. In the RLSEF and RANSAC_EF methods, the perimeter of the ellipse is calculated first by the model parameters, and DBH is calculated by the perimeter divided by π. In the RANSAC_CF and RHT methods, the DBH can be calculated directly by the model parameters.

2.5. Evaluation Methods

In tree extraction, two types of error were quantified in this study. Type I error, or omission, is represented by the number of trees not extracted. Type II error, or commission, is the number of trees falsely extracted [36]. In accordance with the TLS benchmarking project [49], the accuracy of tree extraction was assessed by the completeness, correctness, and mean accuracy of detection. The completeness is defined by the percentage of the extracted trees in the field. The correctness measures the percentage of the trees extracted correctly. The mean accuracy is the joint probability that an extracted tree randomly chosen is correct. They were calculated as:
C o m p l e t e n e s s = n m a t c h n r e f ,
C o r r e c t n e s s = n m a t c h n e x t r ,
M e a n   a c c u r a c y   o f   d e t e c t i o n = 2 n m a t c h ( n r e f + n e x t r ) .
Ravaglia et al. used the maximum extraction height that is defined as the height above the ground of the highest diameter of the stem to evaluate three tree stem diameter algorithms [50]. In our study, the integrity of stem extraction was calculated further to evaluate the ability of algorithms for stem extraction by the maximum extraction height, H m a x , and tree height, H t r e e , in the scanned points cloud. The H m a x is calculated by z m a x and z g r o u n d , where z m a x is the height of the extracted highest off-ground stem point and z g r o u n d is the height at which the tree intersects the ground. H t r e e is calculated by the z t r e e and z g r o u n d , and z t r e e is obtained manually from the individual tree point cloud:
H m a x = z m a x z g r o u n d ,   H t r e e = z t r e e z g r o u n d .
The integrity is calculated as:
I n t e g r i t y = H m a x H t r e e .
Mean DBH is the diameter corresponding to the average basal area of the dominant tree species, which is a basic index reflecting the forest roughness. The accuracy of DBH estimation has also been addressed by other authors. The accuracy of the estimated DBH at tree level was evaluated by calculating R2, bias, root mean squared error (RMSE), relative bias, relative RMSE, and relative accuracy in this study. The relative bias, relative RMSE, and relative accuracy were calculated according to the following formula, where di is the estimated DBH, Di is the measured DBH, and n is the total number of trees in forest sample plots:
B i a s = 1 n i = 1 n ( d i D i ) ,
R M S E = 1 n i = 1 n ( d i D i ) 2 ,
r a l a t i v e   B i a s = B i a s m e a n   D B H ,
r e l a t i v e   R M S E = R M S E m e a n   D B H ,
r e l a t i v e   a c c u r a c y = 1   r e l a t i v e   R M S E .

3. Results

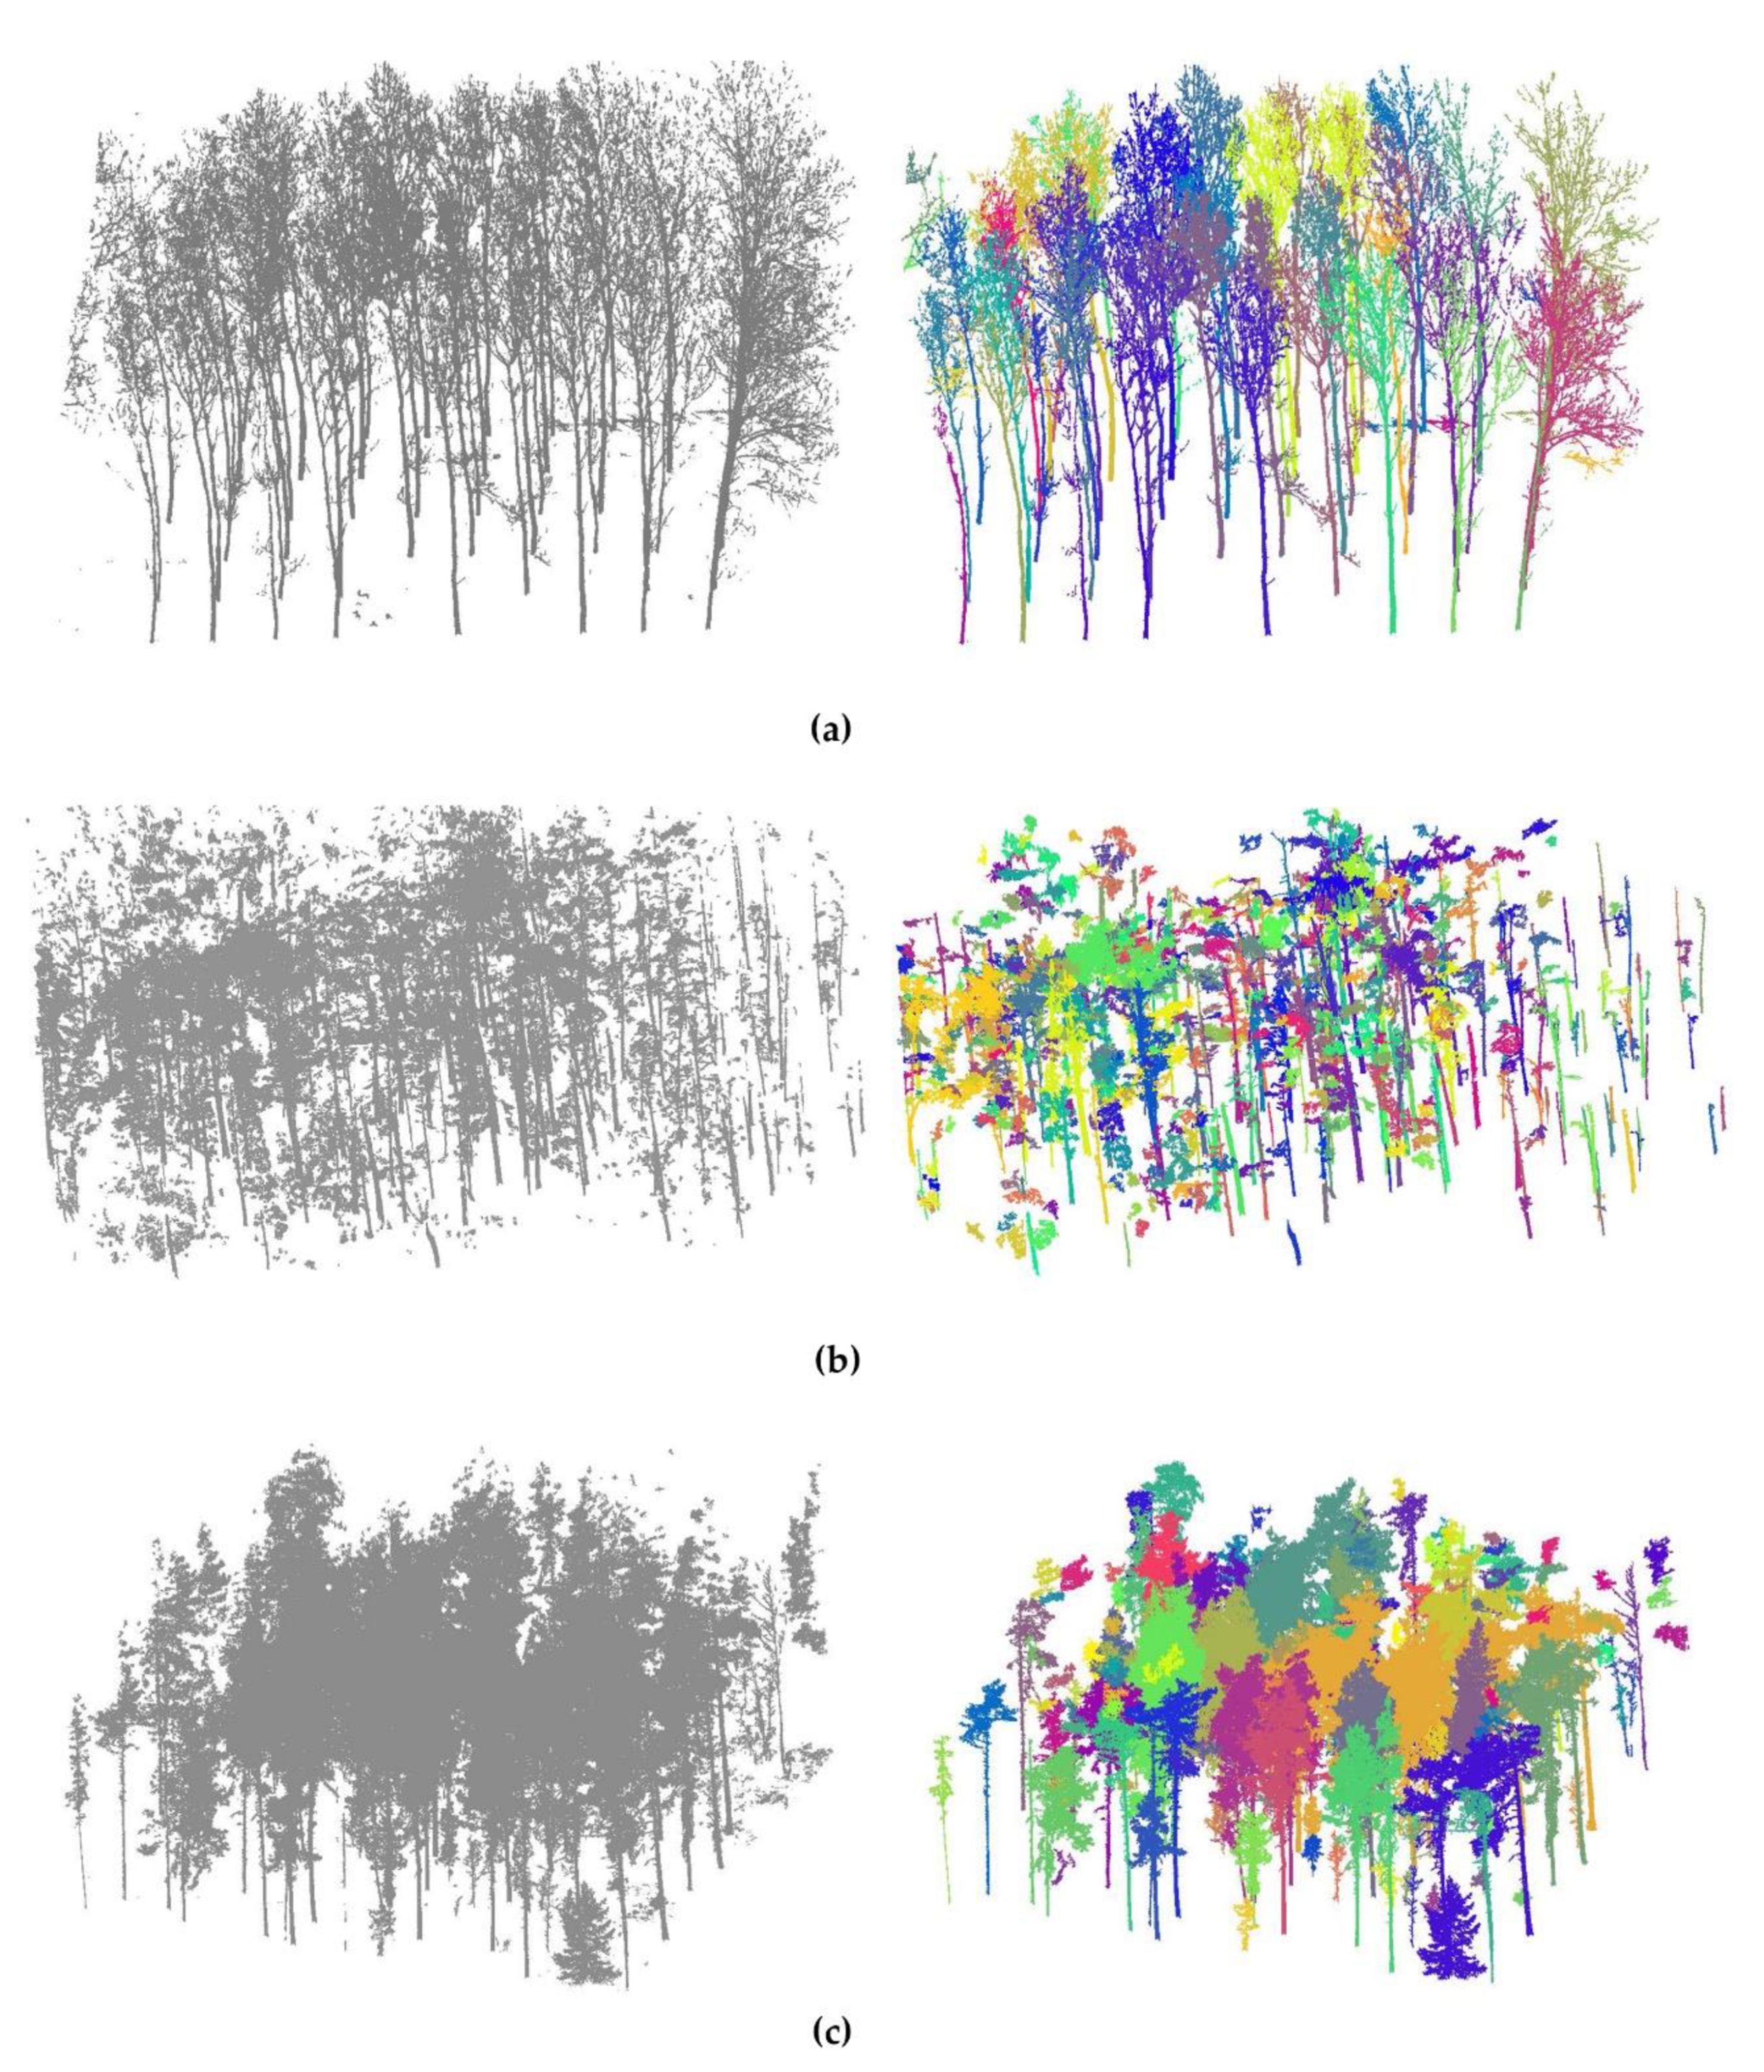
3.1. Individual Tree Extraction Result

Firstly, the ground point and the non-ground point were segmented by the cloth simulation filter in the open source software Cloud Compare. For plot Gongan, the Euclidean clustering algorithm in the PCL (Point Cloud Library) was used to segment ground points. The planting distance of each tree in plot Gongan was about four meters, so the search radius of the nearest neighbor search was set as 0.1 m, which can effectively divide the forest into individual trees. By setting the minimum cluster size to 500, outlier point clusters could be deleted.
For plot Finland and plot Wuhan, we used the label connected components algorithm that has been integrated into Cloud Compare to find the connected components within organized point cloud data. When the octree level equals 10, trunks, shrubs, and weeds show better separability and the amount of data increased substantially when the octree level is bigger than 10 [40]. We used a 3D grid to extract the connected components. This grid was deduced from the octree structure, and the octree level was set to 10. As can be seen from the Figure 5, the non-ground point cloud can be divided into individual trees’ point clouds after segmentation.
In order to analyze the results of tree extraction, the number of trees in the original data was counted manually as in the reference. The numbers of trees that were extracted correctly and incorrectly were counted separately. Table 3 lists the accuracy assessments for three plots. The tree density of plot Gongan is 400 stems/ha. All trees were correctly extracted. In plot Wuhan, 11 of the extracted trees belong to type II error. Eight of them contained some clusters from the another tree, and three of them contained several trees. In plot Finland, six of the extracted trees belonged to Type II error and all of them contained several trees. The statistical results are shown in Table 3. According to the standard in [49], the individual tree extraction is effective.

3.2. Stem Point Extraction Result

For the separated individual tree point cloud, we used the improved 3D stem-mapping algorithm by considering the growth direction in RANSAC multi-cylinder fitting to extract the stem point. The results, without considering the growth direction, were compared. The maximum extraction heights for the piecewise RANSAC cylinder fitting method and piecewise RANSAC cylinder fitting method constrained by the growth direction were calculated, respectively. To analyze the integrity of stem mapping, the visible heights of the tree stems were measured manually from the original point cloud.
Extraction of the individual tree and stem were performed on all trees on three plots. Some representative extraction results were selected to reflect our algorithm and the stem extraction results of the two methods for stem extraction, which is shown in Figure 6. The left figure is the piecewise RANSAC cylinder fitting method, and the right figure is our improved algorithm. The black points in the figure are the tree points, and the red points are the extracted stem points. As shown in Figure 6a,b, the stem extraction results of two typical trees in plot Finland by the two methods were compared to show the improvement. As shown in Figure 6c,d, the stem extraction results of two randomly selected trees in plots Gongan and Wuhan by the two methods were compared.
From Figure 6, it is obvious that the maximum extraction heights by the improved method are higher in three plots, which means the integrity of the extracted stem points is improved. For quantitative analysis, the mean maximum extraction heights and mean tree heights were calculated by all the trees of three plots, respectively. The mean integrities in three plots were calculated further. As shown in Table 4, the statistic of the mean tree height and the mean maximum extraction height of each plot are listed. In three plots, the integrity of stem extraction is improved by 31%, 19.8%, and 56.8%. The mean integrity of the proposed method in the three plots is 84.0%, compared with the other method with a mean integrity of 62.3%. The mean improvement is 36%.

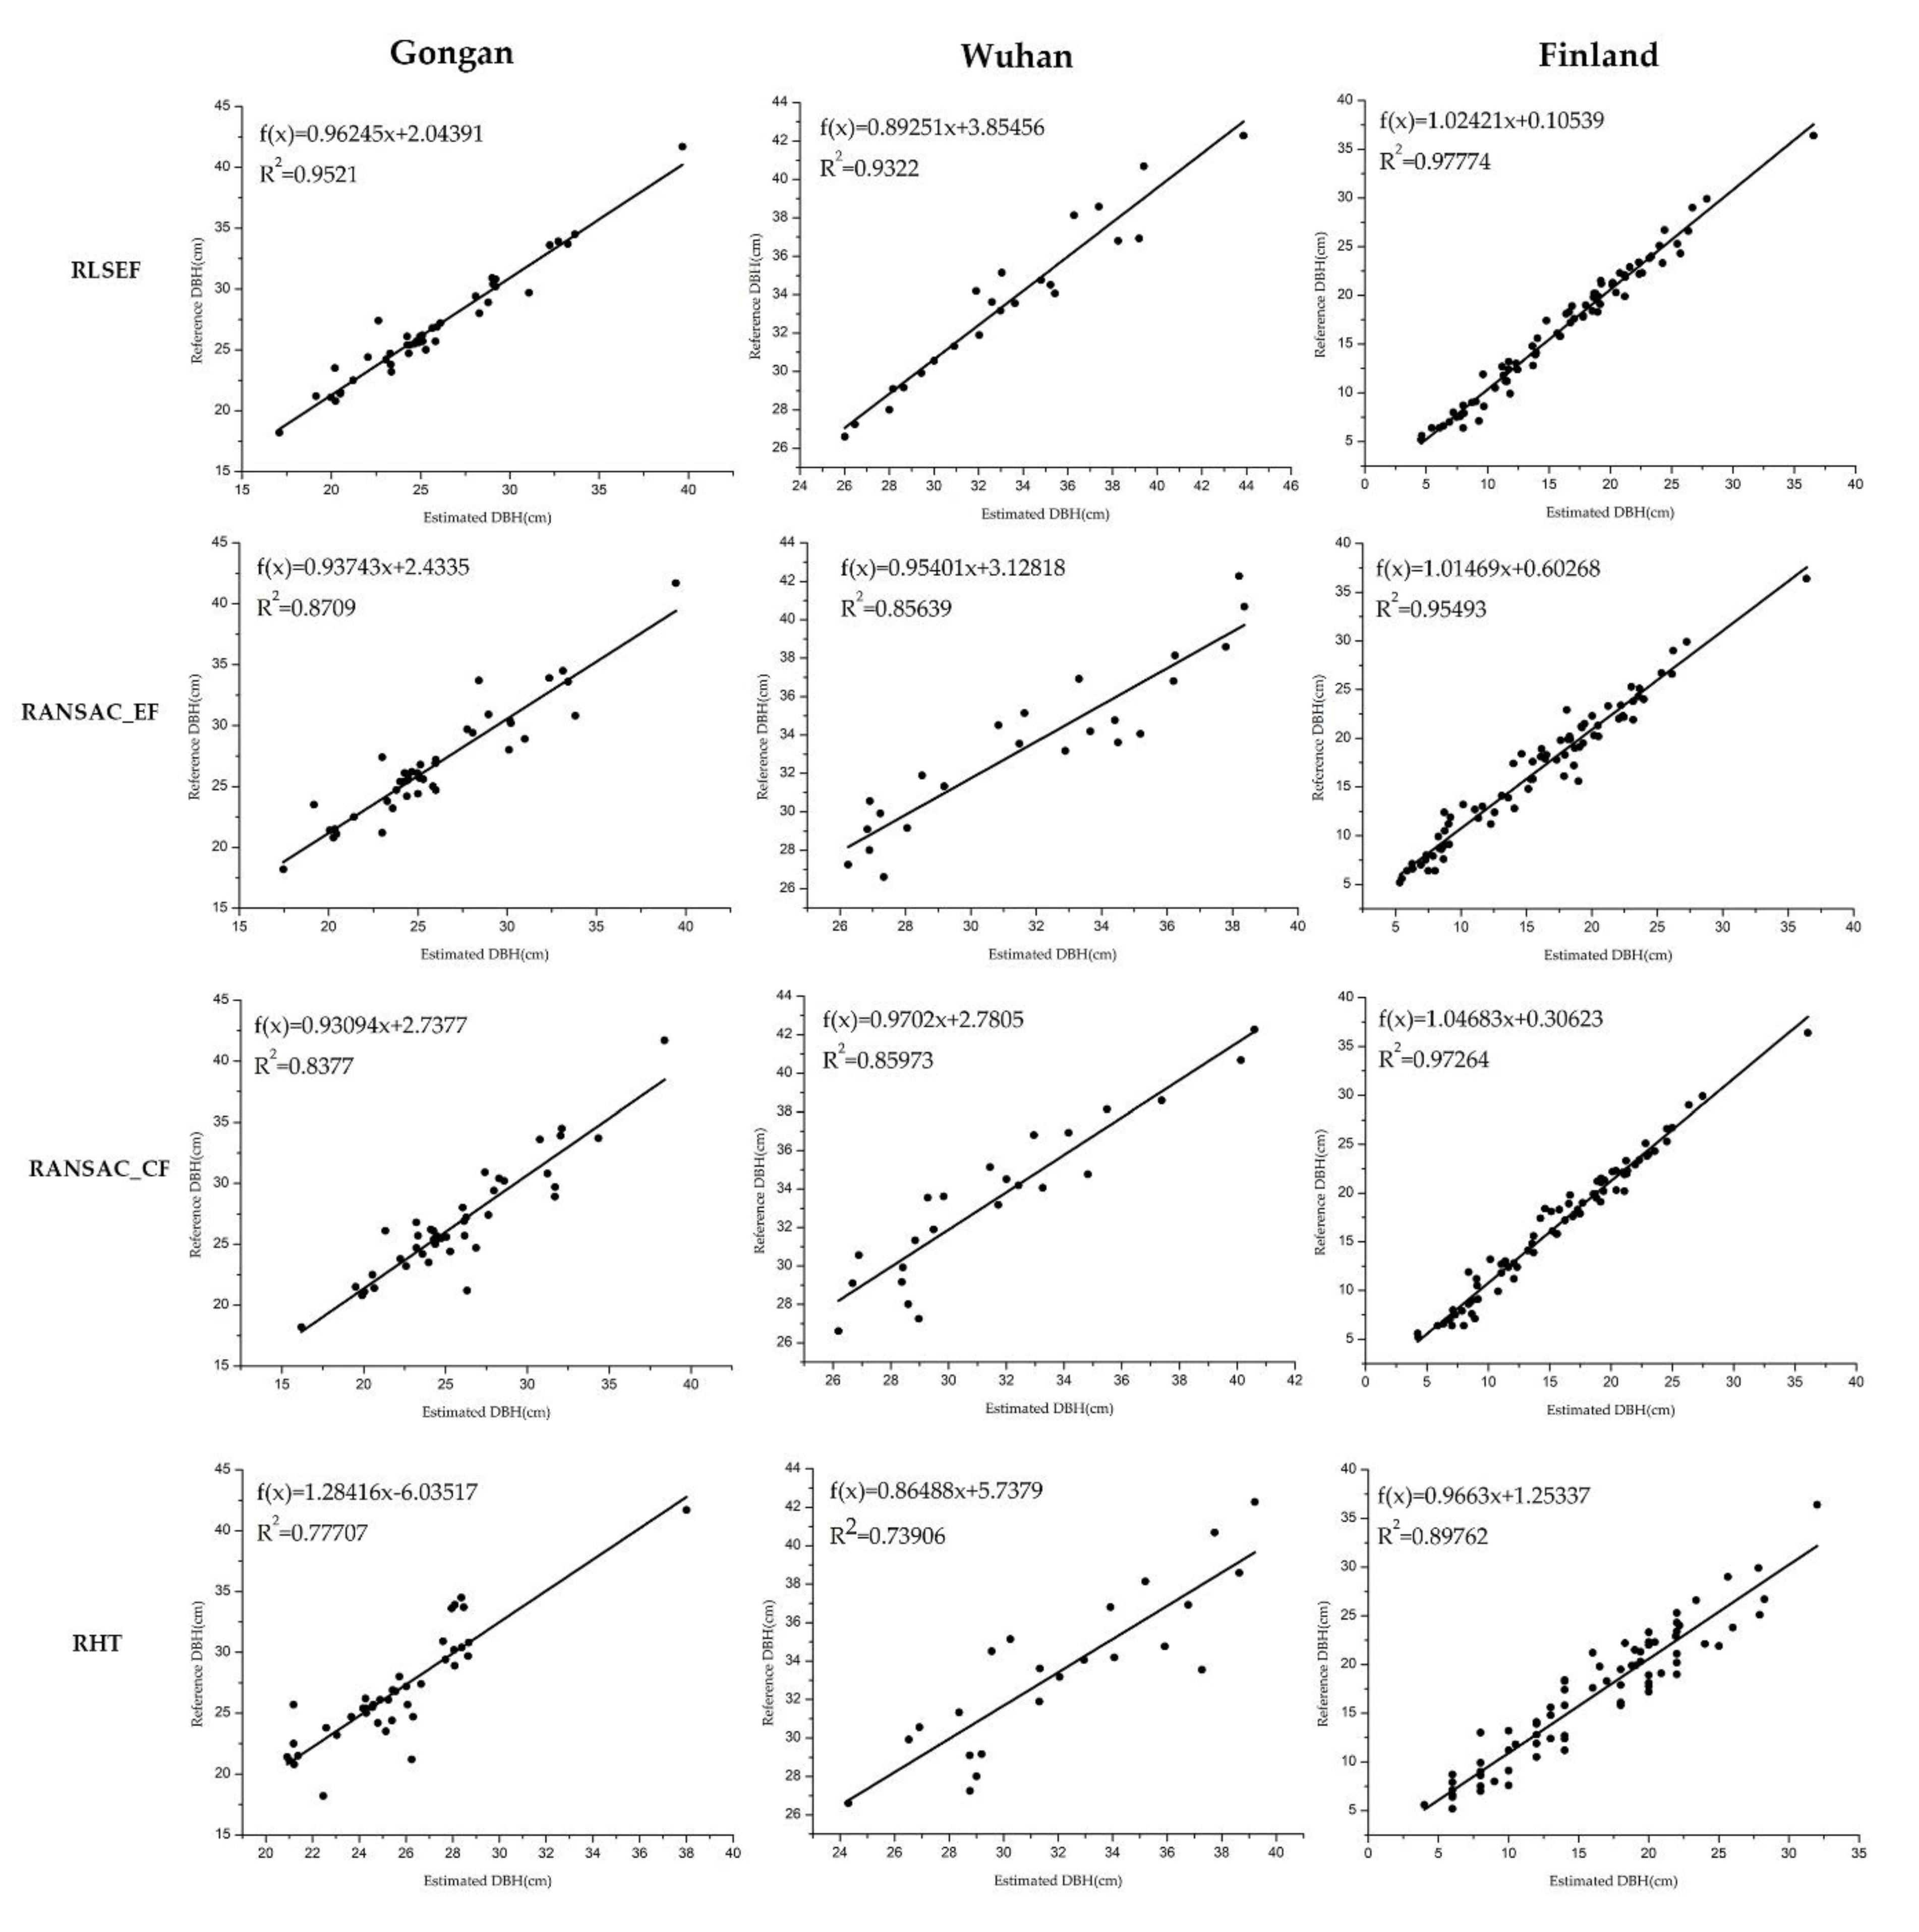
3.3. DBH Estimation Result

A point cloud with a height of 1.275 to 1.325 m was selected for slicing, called a DBH point cloud, and projected onto the XOY plane. Instead of the circle model, the elliptical model was applied in the robust least square elliptic fitting algorithm for DBH estimation.
To evaluate the accuracy of the DBH estimation, the true DBHs of some trees were measured by the diameter ruler, which are shown in the Figure 2. There are 45 trees in the Gongan, 23 trees in the Wuhan, and 77 trees in the Finnish plot, with true DBHs analyzed to evaluate the accuracy of DBH estimation.
The proposed RLSEF method and the other three commonly used DBH estimation methods, RANSAC_EF, RANSAC_CF, and RHT, were compared. We used the coefficient of determination (R2), bias, RMSE, relative bias, relative RMSE, and relative accuracy to measure the accuracy of DBH estimation.
Figure 7 shows the scatter plot of TLS-estimated DBH and field-measured DBH in three plots. From the graph, the goodness-of-fit of the RLSEF method is the highest. The R-squared of this method is also the highest of the four methods. The results show that the RLSEF method produces lower mean errors for the three plots than with the other three algorithms.
From Table 5, we can see that the robust least squares ellipse fitting performs the best out of the four algorithms. The mean RMSE of the proposed estimation method is 1.14 cm, compared with the other methods’ mean RMSE values of 1.70, 2.03, and 2.14 cm. The mean relative accuracy of the proposed estimation method is 95.2%; compared with other methods, the mean relative accuracy is 92.9%, 91.9%, and 90.9%. Stem profiles are elliptical, and as the DBH increases, this elliptical shape becomes more pronounced. The average DBH of the trees in plots Wuhan and the Gongan are both greater than 26 cm and the relative RMSE and relative accuracy of the robust least square ellipse fitting algorithm in these two plots is higher than that in Finland. This proves that the elliptical model can describe the stem profiles better. The result is also verified in Figure 8, which shows the fitted results of three plots. Obvious ellipse characteristics are seen from the experimental stem profiles of Wuhan and Public Security. The average DBH of the Finnish plot is less than 17 cm. Furthermore, each index in Table 5 shows that robust least squares ellipse fitting is the best fitting method among them. It should be mentioned that, due to the voting mechanism of the random Hough transform, the detected circle results have a certain false positive rate. For example, the best fitting circles of two trees in plot Gongan are not unique while using the RHT method, and the fitted circle is significantly smaller, which is shown in Figure 9.

4. Discussion

In the stem extraction experiment, the mean integrities of the proposed method in three plots are higher than those with the cylindrical RANSAC fitting method. Especially in plot Finland, the mean integrity of the proposed method is 87.7%; compared with the cylindrical RANSAC fitting method, the mean integrity is 56.03%. The experimental results show that the improved 3D stem‑mapping method can improve the maximum extraction height significantly, especially in the Finland plot where the trees have dense branches. This is because when the candidate points for fitting contain many branch points, the cylindrical RANSAC fitting may fail to fit the cylinder, which will lead to the failure of stem extraction. Because the stem points are decreasing while branch points are increasing in the upper part of the trunk, the fitting method cannot work effectively. By introducing the growth direction into the establishment of the candidate points buffer in the next layer, most of the branch points can be removed, which will help the fitting process. Hence, the improved 3D stem mapping method is effective for the stem extraction of trees with dense branches.
In the DBH estimation experiment, the mean RMSE of the proposed estimation method is 1.14 cm; compared with other methods, it is 1.70, 2.03, and 2.14 cm. The mean relative accuracy of the proposed estimation method is 95.2%, and compared with other methods, it is 92.9%, 91.9%, and 90.9%. The experimental results show that the elliptic model fitting method can improve the accuracy of the DBH estimation, which verifies that the DBH calculated based on perimeter is also equivalent to the existing measurement method. Even when the shape of the stem section is close to a circle in the Finland plot, the elliptic model fitting method can still obtain the equivalent DBH estimate accurately compared with the circular model methods. The robust least squares elliptic fitting shows the best fitting effect and robustness, and it can fit all scatter points in the maximum range. The results indicate that extracting DBH through the robust least squares ellipse fitting method is feasible and shows better accuracy. This is because when the circular model cannot describe the stem section well, the fitting model will introduce the errors in DBH estimation. An elliptic model can include the possibility of a circular model and be more robust to fit the stem section. Furthermore, the robust least squares elliptic fitting method can reduce the weight of gross errors and noise points, which can improve the accuracy of fitting compared with the RANSAC method.
Furthermore, the DBH estimation accuracy of random Hough transform is relatively lower than other methods, because rasterization of the 2D layer at DBH will cause a loss of accuracy. The first reason is that random Hough circle detection after pixel transformation decreases the accuracy and data format conversion reduces the availability of data. The second reason is that circle fitting does not adapt to the actual shape of the tree breast height, thus resulting in a decline of the detection accuracy.

5. Conclusions

This paper improved a 3D stem mapping algorithm to collect individual tree information from plot-level terrestrial laser scanning data. This method can effectively remove most of the branches and reduce the interference of the branches in the discrimination of trunks. This paper also presented a robust least square ellipse fitting method that better fits the actual shape of the stem section and can improve the accuracy of DBH estimation.
The methods were tested by the data from forest plots in Gongan, Wuhan, and Finland. According to the experimental results, the following conclusions were drawn:
  • With the combination of the tree growth direction and the sectional RANSAC cylindrical fitting method, the integrity of stem extraction is improved compared with that without considering the growth direction. Therefore, the growth direction is an important attribute of the stem and should be considered in stem extraction methods;
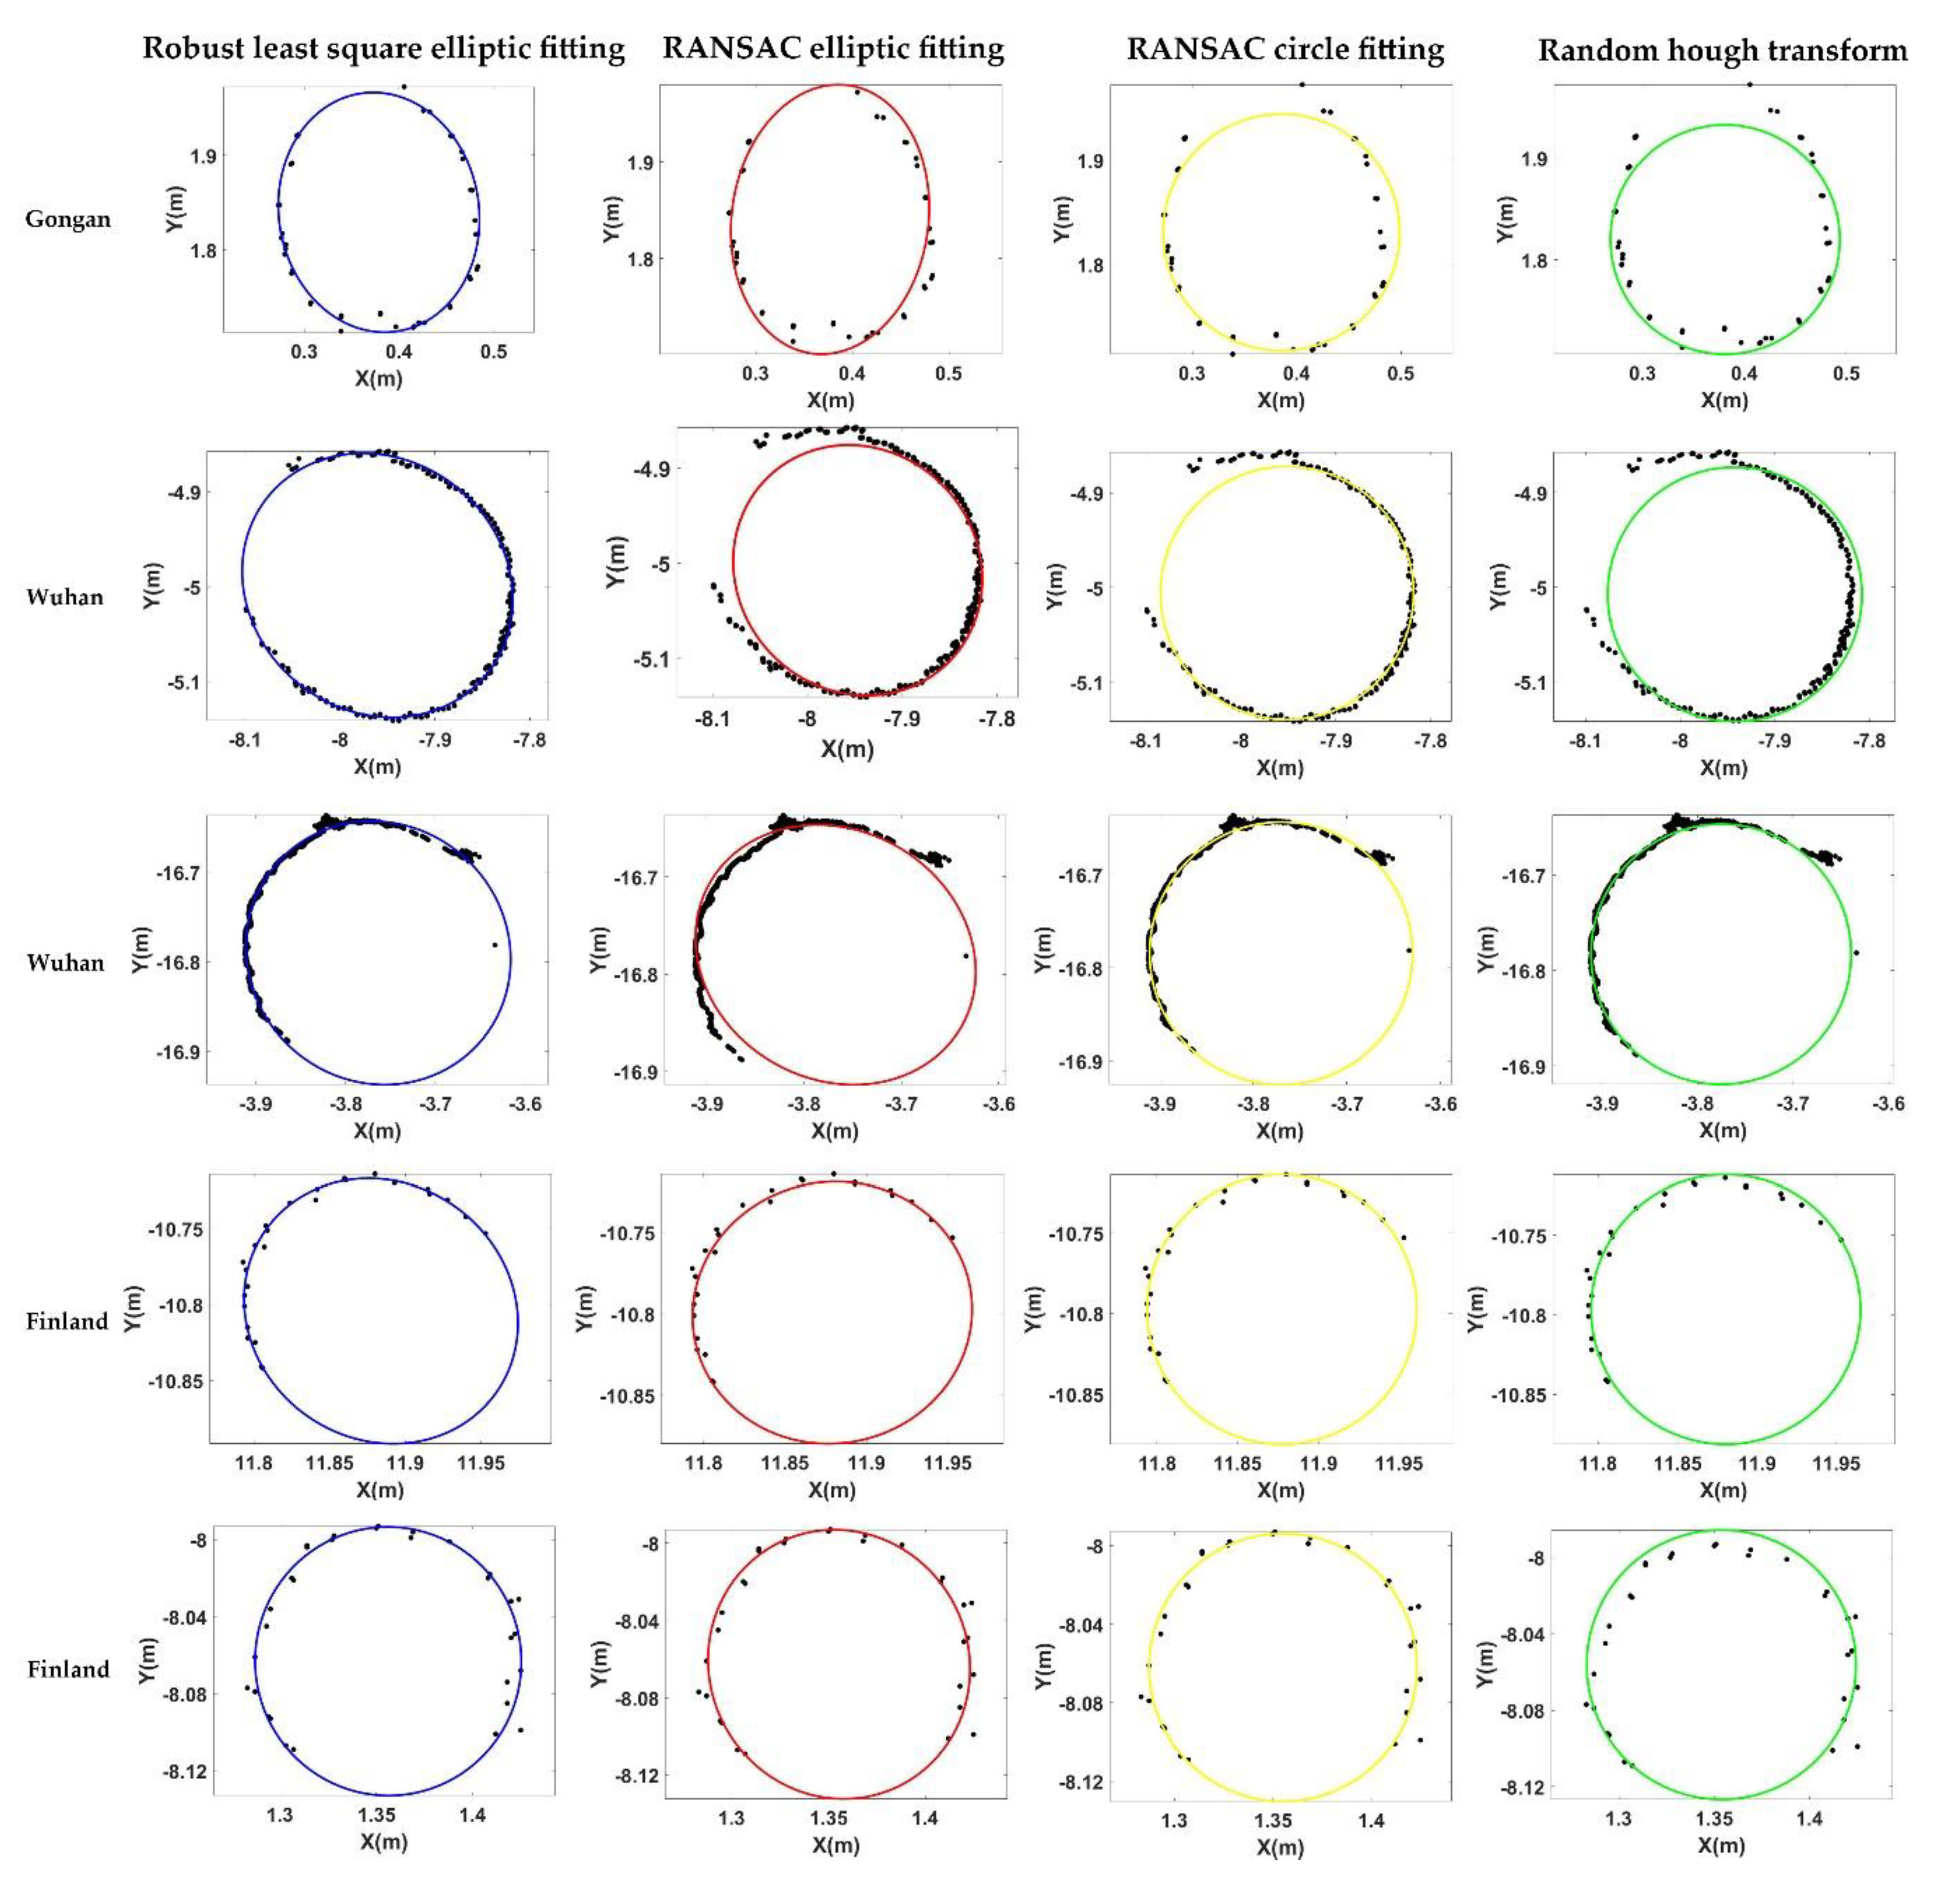
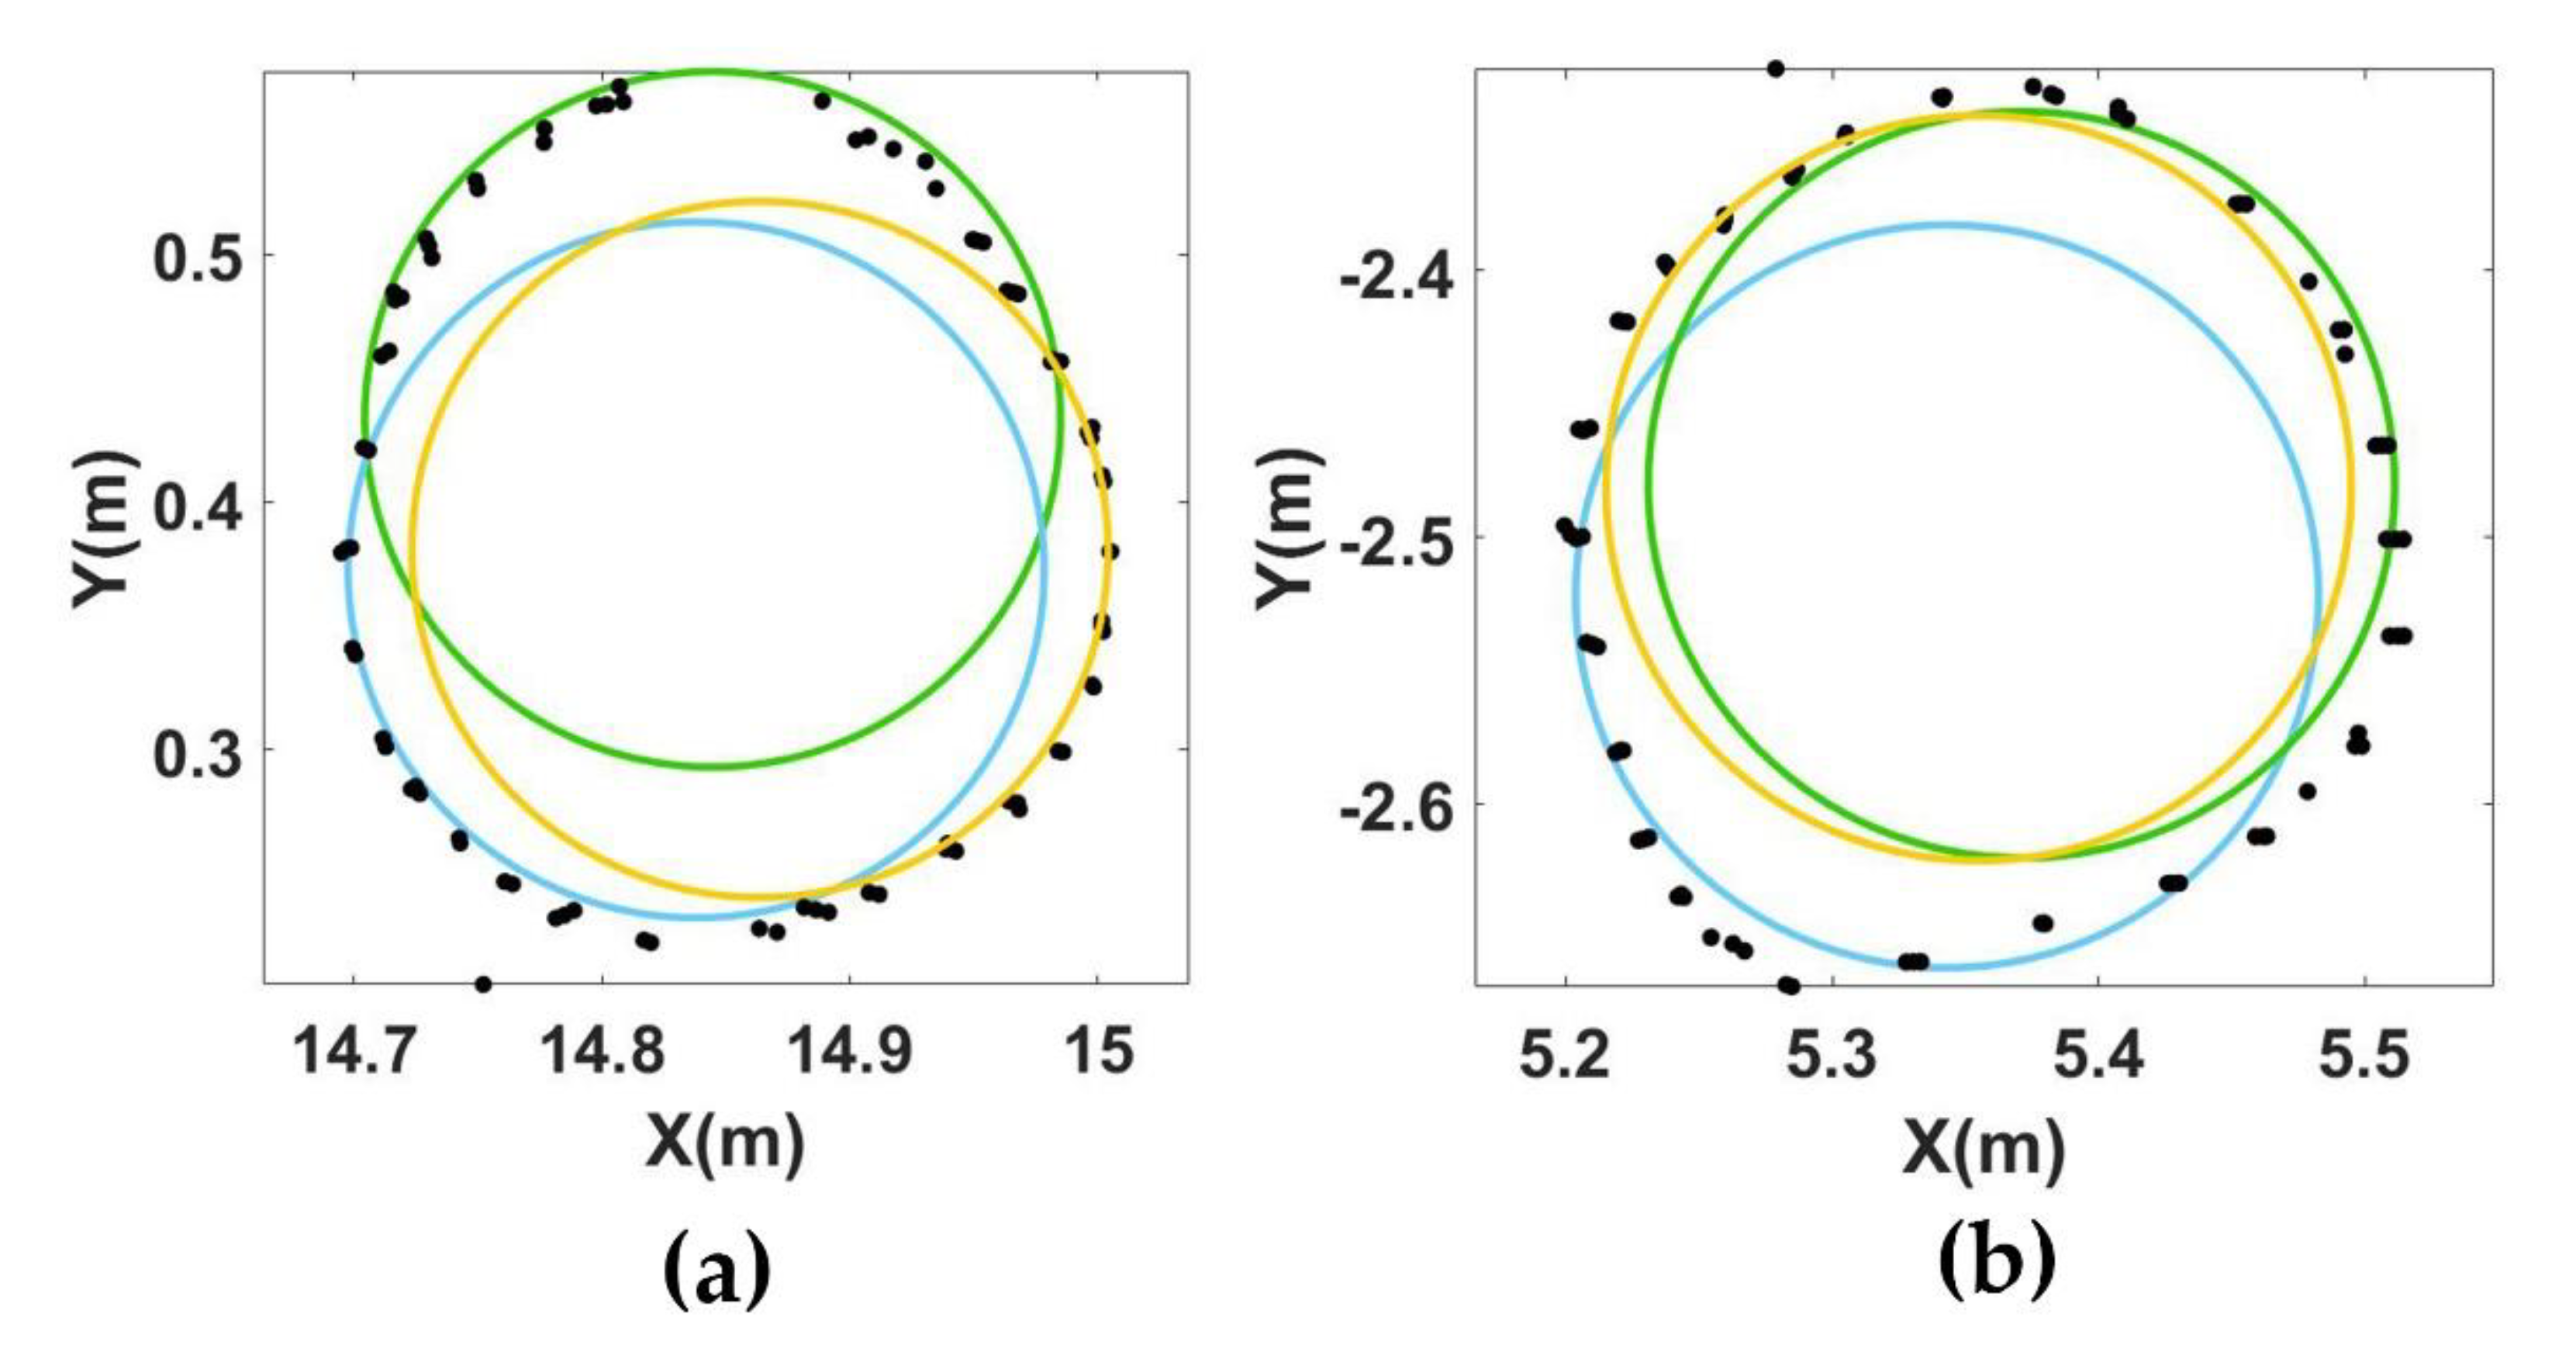
  • Compared with the circular model, the elliptic model can describe the stem section better, and the DBH estimation accuracy based on the elliptic fitting method is higher than that based on circular fitting methods; and
  • Compared with other algorithms, the robust least square ellipse fitting method has performed best in the estimation of DBH, with an average RMSE of 1.14 cm, which can greatly improve the accuracy of DBH estimation based on TLS.
At present, the entire process requires the use of multiple software products and is complicated and time consuming. In future research, automation is an important task in order to apply the methods in actual forestry surveys.

Author Contributions

Algorithm materials, data analysis and writing—original draft preparation, W.Y.; experimental design and writing—review and editing, C.Q.; experimental data collection, X.F.; review, J.T., H.L., X.L., and H.Z. All authors have read and agreed to the published version of the manuscript.

Funding

This study was financially supported by the Fundamental Research Funds for the Central Universities (No. 2042019KF0034).

Conflicts of Interest

The authors declare no conflict of interest.

References

  1. Dassot, M.; Constant, T.; Fournier, M. The use of terrestrial LiDAR technology in forest science: Application fields, benefits and challenges. Ann. For. Sci. 2011, 68, 959–974. [Google Scholar] [CrossRef] [Green Version]
  2. Liang, X.; Kankare, V.; Hyyppä, J.; Wang, Y.; Kukko, A.; Haggrén, H.; Yu, X.; Kaartinen, H.; Jaakkola, A.; Guan, F.; et al. Terrestrial laser scanning in forest inventories. ISPRS J. Photogramm. Remote Sens. 2016, 115, 63–77. [Google Scholar] [CrossRef]
  3. Liu, C.; Xing, Y.; Duanmu, J.; Tian, X. Evaluating Different Methods for Estimating Diameter at Breast Height from Terrestrial Laser Scanning. Remote Sens. 2018, 10, 513. [Google Scholar] [CrossRef] [Green Version]
  4. de Conto, T.; Olofsson, K.; Görgens, E.B.; Rodriguez, L.C.E.; Almeida, G. Performance of stem denoising and stem modelling algorithms on single tree point clouds from terrestrial laser scanning. Comput. Electron. Agric. 2017, 143, 165–176. [Google Scholar] [CrossRef]
  5. Edson, C.; Wing, M.G. Airborne Light Detection and Ranging (LiDAR) for Individual Tree Stem Location, Height, and Biomass Measurements. Remote Sens. 2011, 3, 2494–2528. [Google Scholar] [CrossRef] [Green Version]
  6. Liang, X.; Kukko, A.; Hyyppä, J.; Lehtomäki, M.; Pyörälä, J.; Yu, X.; Kaartinen, H.; Jaakkola, A.; Wang, Y. In-situ measurements from mobile platforms: An emerging approach to address the old challenges associated with forest inventories. ISPRS J. Photogramm. Remote Sens. 2018, 143, 97–107. [Google Scholar] [CrossRef]
  7. Cabo, C.; Ordóñez, C.; López-Sánchez, C.A.; Armesto, J. Automatic dendrometry: Tree detection, tree height and diameter estimation using terrestrial laser scanning. Int. J. Appl. Earth Obs. Geoinf. 2018, 69, 164–174. [Google Scholar] [CrossRef]
  8. Olofsson, K.; Holmgren, J.; Olsson, H. Tree Stem and Height Measurements using Terrestrial Laser Scanning and the RANSAC Algorithm. Remote Sens. 2014, 6, 4323–4344. [Google Scholar] [CrossRef] [Green Version]
  9. Bu, G.; Wang, P. Adaptive circle-ellipse fitting method for estimating tree diameter based on single terrestrial laser scanning. J. Appl. Remote Sens. 2016, 10, 6040. [Google Scholar] [CrossRef]
  10. Thomas, S.M. A simple approach for the estimation of circular arc center and its radius. Comput. Vis. Graph. Image Process. 1989, 45, 362–370. [Google Scholar] [CrossRef]
  11. Čerňava, J.; Mokroš, M.; Tuček, J.; Antal, M.; Slatkovská, Z. Processing Chain for Estimation of Tree Diameter from GNSS-IMU-Based Mobile Laser Scanning Data. Remote Sens. 2019, 11, 615. [Google Scholar] [CrossRef] [Green Version]
  12. Xinlian, L.; Kankare, V.; Xiaowei, Y.; Hyyppa, J.; Holopainen, M. Automated Stem Curve Measurement Using Terrestrial Laser Scanning. IEEE Trans. Geosci. Remote Sens. 2014, 52, 1739–1748. [Google Scholar] [CrossRef]
  13. Itakura, K.; Hosoi, F. Automatic individual tree detection and canopy segmentation from three-dimensional point cloud images obtained from ground-based lidar. J. Agric. Meteorol. 2018, 74, 109–113. [Google Scholar] [CrossRef] [Green Version]
  14. Brede, B.; Lau, A.; Bartholomeus, H.M.; Kooistra, L. Comparing RIEGL RiCOPTER UAV LiDAR Derived Canopy Height and DBH with Terrestrial LiDAR. Sensors 2017, 17, 2371. [Google Scholar] [CrossRef] [PubMed]
  15. Brede, B.; Calders, K.; Lau, A.; Raumonen, P.; Bartholomeus, H.M.; Herold, M.; Kooistra, L. Non-destructive tree volume estimation through quantitative structure modelling: Comparing UAV laser scanning with terrestrial LIDAR. Remote Sens. Environ. 2019, 233, 1355. [Google Scholar] [CrossRef]
  16. Tao, S.; Guo, Q.; Li, L.; Xue, B.; Kelly, M.; Li, W.; Xu, G.; Su, Y. Airborne Lidar-derived volume metrics for aboveground biomass estimation: A comparative assessment for conifer stands. Agric. For. Meteorol. 2014, 198–199, 24–32. [Google Scholar] [CrossRef]
  17. Fernández-Sarría, A.; López-Cortés, I.; Estornell, J.; Velázquez-Martí, B.; Salazar, D. Estimating residual biomass of olive tree crops using terrestrial laser scanning. Int. J. Appl. Earth Obs. Geoinf. 2019, 75, 163–170. [Google Scholar] [CrossRef]
  18. He, Q.; Chen, E.; An, R.; Li, Y. Above-Ground Biomass and Biomass Components Estimation Using LiDAR Data in a Coniferous Forest. Forests 2013, 4, 984–1002. [Google Scholar] [CrossRef] [Green Version]
  19. Nie, S.; Wang, C.; Zeng, H.; Xi, X.; Li, G. Above-ground biomass estimation using airborne discrete-return and full-waveform LiDAR data in a coniferous forest. Ecol. Indic. 2017, 78, 221–228. [Google Scholar] [CrossRef]
  20. Koreň, M.; Mokroš, M.; Bucha, T. Accuracy of tree diameter estimation from terrestrial laser scanning by circle-fitting methods. Int. J. Appl. Earth Obs. Geoinf. 2017, 63, 122–128. [Google Scholar] [CrossRef]
  21. Lixin, D. New Development of Forest Canopy Height Remote Sensing. Remote Sens. Technol. Appl. 2016, 31, 833–845. [Google Scholar]
  22. Haala, N.; Reulke, R.; Thies, M.; Aschoff, T. Combination of terrestrial Laser Scanning with high resolution panoramic Images for Investigations in Forest Applications and tree species recognition. In Proceedings of the Panoramic Photogrammetry Workshop, Berlin, Germany, 24–25 February 2005. [Google Scholar]
  23. Forsman, P.; Halme, A. 3-D mapping of natural environments with trees by means of mobile perception. IEEE Trans. Robot. 2005, 21, 482–490. [Google Scholar] [CrossRef]
  24. Forsman, M.; Börlin, N.; Holmgren, J. Estimation of tree stem attributes using terrestrial photogrammetry. In Proceedings of the ISPRS-International Archives of the Photogrammetry, Remote Sensing and Spatial Information Sciences, Melbourne, Australia, 25 August–01 September 2012; pp. 261–265. [Google Scholar]
  25. Yang, B.; Dai, W.; Dong, Z.; Liu, Y. Automatic Forest Mapping at Individual Tree Levels from Terrestrial Laser Scanning Point Clouds with a Hierarchical Minimum Cut Method. Remote Sens. 2016, 8, 372. [Google Scholar] [CrossRef] [Green Version]
  26. Huang, H.; Li, Z.; Gong, P.; Cheng, X.; Clinton, N.; Cao, C.; Ni, W.; Wang, L. Automated Methods for Measuring DBH and Tree Heights with a Commercial Scanning Lidar. Photogramm. Eng. Remote Sens. 2011, 77, 219–227. [Google Scholar] [CrossRef]
  27. Strahler, A.H.; Jupp, D.L.B.; Woodcock, C.E.; Schaaf, C.B.; Yao, T.; Zhao, F.; Yang, X.; Lovell, J.; Culvenor, D.; Newnham, G.; et al. Retrieval of forest structural parameters using a ground-based lidar instrument (Echidna®). Can. J. Remote Sens. 2014, 34, S426–S440. [Google Scholar] [CrossRef] [Green Version]
  28. Lalonde, J.F.; Vandapel, N.; Huber, D.F.; Hebert, M. Natural terrain classification using three-dimensional Ladar data for ground robot mobility. J. Field Robot. 2010, 23, 839–861. [Google Scholar] [CrossRef]
  29. Xia, S.; Wang, C.; Pan, F.; Xi, X.; Zeng, H.; Liu, H.J.F. Detecting stems in dense and homogeneous forest using single-scan TLS. Forests 2015, 6, 3923–3945. [Google Scholar] [CrossRef] [Green Version]
  30. Zhu, X.; Skidmore, A.K.; Darvishzadeh, R.; Niemann, K.O.; Liu, J.; Shi, Y.; Wang, T. Foliar and woody materials discriminated using terrestrial LiDAR in a mixed natural forest. Int. J. Appl. Earth Obs. Geoinf. 2018, 64, 43–50. [Google Scholar] [CrossRef]
  31. Zhang, W.; Wan, P.; Wang, T.; Cai, S.; Chen, Y.; Jin, X.; Yan, G. A Novel Approach for the Detection of Standing Tree Stems from Plot-Level Terrestrial Laser Scanning Data. Remote Sens. 2019, 11, 211. [Google Scholar] [CrossRef] [Green Version]
  32. Zhang, J.; Lin, X.; Ning, X. SVM-Based Classification of Segmented Airborne LiDAR Point Clouds in Urban Areas. Remote Sens. 2013, 5, 3749–3775. [Google Scholar] [CrossRef] [Green Version]
  33. Schnabel, R.; Wahl, R.; Klein, R. Efficient RANSAC for Point-Cloud Shape Detection. Comput. Graph. Forum 2007, 26, 214–226. [Google Scholar] [CrossRef]
  34. Vo, A.-V.; Truong-Hong, L.; Laefer, D.F.; Bertolotto, M. Octree-based region growing for point cloud segmentation. Isprs J. Photogramm. Remote Sens. 2015, 104, 88–100. [Google Scholar] [CrossRef]
  35. Burt, A.; Disney, M.; Calders, K.; Goslee, S. Extracting individual trees from lidar point clouds using treeseg. Methods Ecol. Evol. 2018. [Google Scholar] [CrossRef] [Green Version]
  36. Liang, X.; Litkey, P.; Hyyppa, J.; Kaartinen, H.; Vastaranta, M.; Holopainen, M. Automatic stem mapping using single-scan terrestrial laser scanning. IEEE Trans. Geosci. Remote Sens. 2011, 50, 661–670. [Google Scholar] [CrossRef]
  37. Raumonen, P.; Kaasalainen, M.; Åkerblom, M.; Kaasalainen, S.; Kaartinen, H.; Vastaranta, M.; Holopainen, M.; Disney, M.; Lewis, P. Fast Automatic Precision Tree Models from Terrestrial Laser Scanner Data. Remote Sens. 2013, 5, 491–520. [Google Scholar] [CrossRef] [Green Version]
  38. Wieser, M.; Mandlburger, G.; Hollaus, M.; Otepka, J.; Glira, P.; Pfeifer, N. A Case Study of UAS Borne Laser Scanning for Measurement of Tree Stem Diameter. Remote Sens. 2017, 9, 1154. [Google Scholar] [CrossRef] [Green Version]
  39. Pitkänen, T.P.; Raumonen, P.; Kangas, A. Measuring stem diameters with TLS in boreal forests by complementary fitting procedure. Isprs J. Photogramm. Remote Sens. 2019, 147, 294–306. [Google Scholar] [CrossRef]
  40. Liu, G.; Wang, J.; Dong, P.; Chen, Y.; Liu, Z. Estimating Individual Tree Height and Diameter at Breast Height (DBH) from Terrestrial Laser Scanning (TLS) Data at Plot Level. Forests 2018, 9, 398. [Google Scholar] [CrossRef] [Green Version]
  41. Zhang, W.; Qi, J.; Wan, P.; Wang, H.; Xie, D.; Wang, X.; Yan, G. An Easy-to-Use Airborne LiDAR Data Filtering Method Based on Cloth Simulation. Remote Sens. 2016, 8, 501. [Google Scholar] [CrossRef]
  42. Kankare, V.; Puttonen, E.; Holopainen, M.; Hyyppä, J. The effect of TLS point cloud sampling on tree detection and diameter measurement accuracy. Remote Sens. Lett. 2016, 7, 495–502. [Google Scholar] [CrossRef]
  43. Ferraz, A.; Bretar, F.; Jacquemoud, S.; Gonçalves, G.; Pereira, L.; Tomé, M.; Soares, P. 3-D mapping of a multi-layered Mediterranean forest using ALS data. Remote Sens. Environ. 2012, 121, 210–223. [Google Scholar] [CrossRef]
  44. Li, W.; Guo, Q.; Jakubowski, M.K.; Kelly, M. A New Method for Segmenting Individual Trees from the Lidar Point Cloud. Photogramm. Eng. Remote Sens. 2012, 78, 75–84. [Google Scholar] [CrossRef] [Green Version]
  45. Yu, Y.; Li, J.; Guan, H.; Zai, D.; Wang, C. Automated Extraction of 3D Trees from Mobile LiDAR Point Clouds. In Proceedings of the ISPRS-International Archives of the Photogrammetry, Remote Sensing and Spatial Information Sciences, Riva del Garda, Italy, 23–25 June 2014; pp. 629–632. [Google Scholar] [CrossRef] [Green Version]
  46. Berveglieri, A.; Tommaselli, A.M.G.; Liang, X.; Honkavaara, E. Vertical Optical Scanning with Panoramic Vision for Tree Trunk Reconstruction. Sensors 2017, 17, 2791. [Google Scholar] [CrossRef] [PubMed] [Green Version]
  47. Király, G.; Brolly, G. Tree height estimation methods for terrestrial laser scanning in a forest reserve. Geol. Comput. Sci. 2007, 36, 211–215. [Google Scholar]
  48. Liang, J.; Zhang, M.; Liu, D.; Zeng, X.; Ojowu, O., Jr.; Zhao, K.; Li, Z.; Liu, H. Robust ellipse fitting based on sparse combination of data points. IEEE Trans. Image Process. 2013, 22, 2207–2218. [Google Scholar] [CrossRef]
  49. Liang, X.; Hyyppä, J.; Kaartinen, H.; Lehtomäki, M.; Pyörälä, J.; Pfeifer, N.; Holopainen, M.; Brolly, G.; Francesco, P.; Hackenberg, J.; et al. International benchmarking of terrestrial laser scanning approaches for forest inventories. ISPRS J. Photogramm. Remote Sens. 2018, 144, 137–179. [Google Scholar] [CrossRef]
  50. Ravaglia, J.; Fournier, R.A.; Bac, A.; Véga, C.; Côté, J.-F.; Piboule, A.; Rémillard, U. Comparison of Three Algorithms to Estimate Tree Stem Diameter from Terrestrial Laser Scanner Data. Forests 2019, 10, 599. [Google Scholar] [CrossRef] [Green Version]
Figure 1. Forest sample plots in Gongan County and Wuhan City, Hubei, China.
Remotesensing 12 00352 g001
Figure 2. Schematic map of tree points in the forest sample. (a) Plot Gongan; (b) plot Wuhan; (c) plot Finland.
Remotesensing 12 00352 g002
Figure 3. Flow chart of the segment-based method for detecting tree stem points.
Remotesensing 12 00352 g003
Figure 4. Sketch map of the stem point extraction. (a) Schematic diagram of the cylinder and its parameters; (b) frustum schematic; (c) individual tree; (d) random sample consistency (RANSAC) cylinder fitting for the first section of tree points; (e) frustum-shaped buffer established based on cylindrical parameters; (f) stem points extracted.
Remotesensing 12 00352 g004
Figure 5. Individual tree extraction result. (a) Plot Gongan; (b) plot Wuhan; (c) plot Finland.
Remotesensing 12 00352 g005
Figure 6. Comparison of piecewise random sample consistency (RANSAC) cylinder fitting and piecewise RANSAC cylinder fitting constrained by growth direction. (a) Plot Finland; (b) plot Finland; (c) plot Gongan; (d) plot Wuhan. (Left: sectional RANSAC fitting. Right: RANSAC fitting combined with growth direction. Stem points are shown in red and tree points are shown in black).
Remotesensing 12 00352 g006
Figure 7. Scatter plot of estimated diameter at breast height (DBH) values.
Remotesensing 12 00352 g007
Figure 8. Comparison of the fitting results of four methods in DBH estimation.
Remotesensing 12 00352 g008
Figure 9. DBH of two trees estimated by random Hough transform in plot Gongan.
Remotesensing 12 00352 g009
Table 1. Technical specifications of the Focus3D X130.
ParameterValue
Data acquisition speed976,000 points/s
Maximum range153 m
Maximum resolutionVerticalHorizontal
0.009°0.009°
Field of view angle300 × 360°
Scanner line speed97 Hz
Measurement accuracy± 2 mm
Wavelength1550 nm
Table 2. Plot descriptions of the 3 sample plots.
PlotMean DBH (cm)Sum of TreesStand ConditionsDensity (stems/ha)Main Species
Gongan26.91160leaf-off400Poplar
Wuhan33.49122leaf-on813Metasequoia
Finland16.6684leaf-on820Scots pine
Table 3. Accuracy of trunk extraction using the terrestrial laser scanning (TLS) data.
PlotReferenceMappedType I ErrorType II ErrorTrue CulmsCompleteness (%)Correctness (%)Mean Accuracy
Gongan16016000160100100100
Wuhan12211821110787.7090.6889.17
Finland8478267285.7192.3188.89
Table 4. Stem extraction with two algorithms.
PlotMean Tree Height(m)Piecewise RANSACPiecewise RANSAC Constrained by Growth Direction
Mean Maximum Extraction Height(m)Mean Integrity (%)Mean Maximum Extraction Height (m)Mean Integrity (%)
Gongan27.0317.2263.71 22.5783.50
Wuhan17.8211.9967.28 14.3780.64
Finland13.697.6756.03 12.0387.87
Table 5. Accuracy comparison of four methods for estimating the diameter at breast height (DBH).
PlotAlgorithmsR2RMSE (cm)Bias (cm)RMSE%Bias%Relative Accuracy
GonganRLSEF0.9521.1141.1884.14.40.959
RANSAC_EF0.8711.21.400 4.55.2 0.955
RANSAC_CF0.8382.1611.683 86.30.92
RHT0.7771.6451.920 6.17.10.939
WuhanRLSEF0.9321.1850.9503.52.80.965
RANSAC_EF0.8562.2631.903 6.85.7 0.932
RANSAC_CF0.862.3772.044 7.16.10.929
RHT0.7392.5462.052 7.66.1 0.924
FinlandRLSEF0.9781.120.8766.75.30.933
RANSAC_EF0.9551.6431.235 9.97.4 0.901
RANSAC_CF0.9731.541.247 9.27.50.908
RHT0.8972.2331.951 13.411.7 0.866

