1. Introduction
Torreparedones is an archaeological site located in the municipal districts of Baena and Castro del Río in the province of Cordoba, Spain. The site, which is situated at an elevation of 569 m above sea-level, covers a total area of 10.5 ha, of which only 1.5% has been excavated. A general view of the site is provided in
Figure 1. According to the historical documentation [
1,
2,
3], Torreparedones was occupied for at least 3500 years, from the Copper Age to the late Middle Ages. The most important remains are of Iberian and Roman origin. Torreparedones has been proposed as the site of the Roman city of
Colonia Iulia Virtus Ituci, since it contains the essential architectural components of Roman cities: a forum, temples, a basilica, a curia, a market, domestic architecture, and streets. Like other Roman cities with an amphitheater, Torreparedones must have also had a theater, which has not yet been discovered. As this was a small city covering just 11 ha, the theater may have been located within the confines of the city walls.
The area of interest was located at the western edge of the Roman forum (
Figure 1), near the main road that provided access to the fortified city. Archaeological deposits have been identified on a portion of Miocene materials formed by marls, bioclastic sandstone, and sands [
4]. We could distinguish two types of lithological cover in the area: ochre silts in the south, and white marls in the north. The presence of abundant rock pieces has also been recorded in the northern part of the sector, while these elements are more scattered in the southern area. A surface archaeological inspection has also revealed Iberian and Roman ceramic remains.
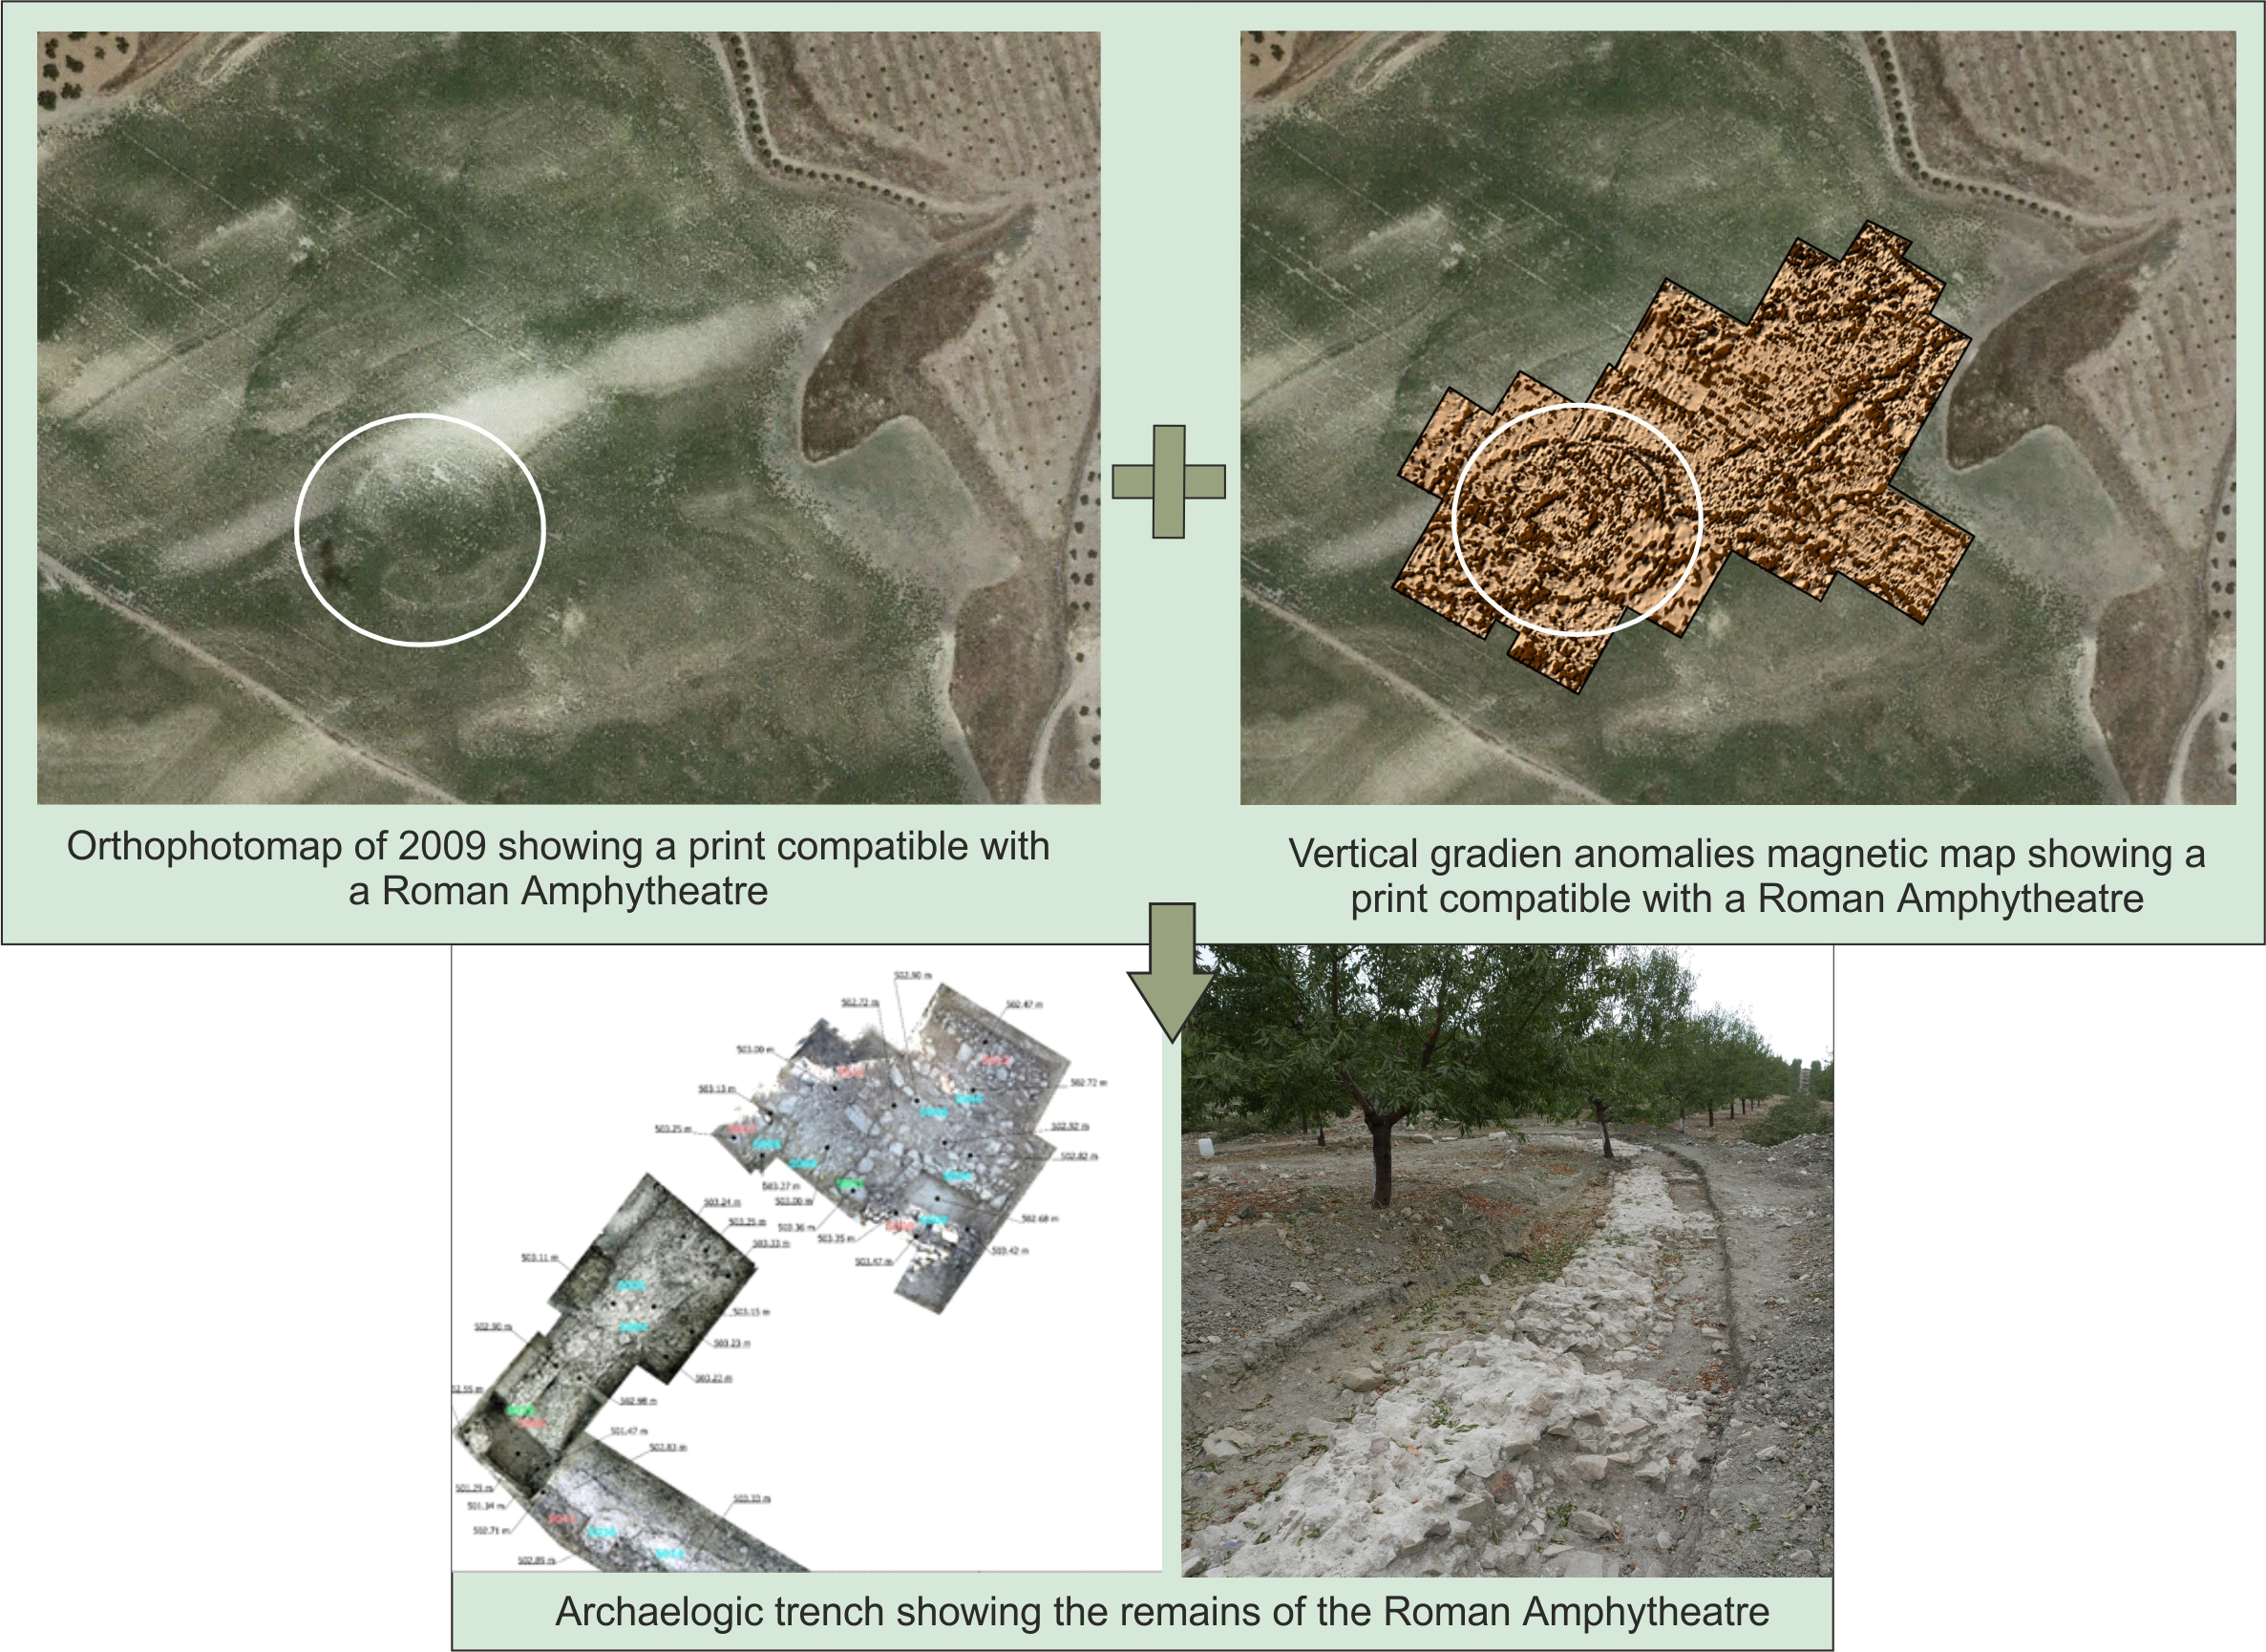
The location of the amphitheater in the western sector of the city near the walls was proposed by Monterroso-Checa [
5]. Using resources from the National Geographic Institute of Spain (IGN), mainly aerial images and digital elevation models (DEM) obtained from light detecting and ranging (LiDAR) archives, Monterroso-Checa proposed the location and dimensions of this structure. Aerial photos and Digital Terrain Model-LiDAR have been used in this way for archaeological detection in other sites [
6,
7,
8]. In this study, we have improved some of the DEM and aerial imagery acquired by the IGN and related them to the new documentation. Following this proposal, geophysical surveys and an archaeological excavation were carried out. Other amphitheaters in Spain have been identified with similar processes, as with the relevant case of
Contributa Iulia, that served as a model for us [
9].
The exploration of buried archaeological structures using non-destructive techniques is at the cutting-edge frontier of field archaeology [
10,
11]. Remote sensing and geophysical methods are capable of generating images and models of buried remains [
12,
13,
14,
15,
16], but also provide more complete information such as the geoarchaeological characterization and geotechnical context of the site. In addition, these methods can indicate the best location for future excavations, in order to understand the archaeological framework and establish preservation measures.
Magnetic gradiometer [
17,
18], electrical resistivity tomography (ERT) [
19,
20], and ground-penetrating radar (GPR) [
21,
22] methods were used to define the geometry and determine, to the greatest possible extent, the degree of preservation of this structure. Although imaging technology is increasingly being used to identify buried archaeological remains, one of the drawbacks of this non-destructive approach is the lower resolution of the images compared to excavations [
23,
24]. For this reason, an archaeological excavation was carried out on the aerial and geophysical anomalies. The results confirm that the buried remains have a good correlation with the models obtained using indirect methods.
2. Materials and Methods
2.1. Remote Sensing Analysis: Aerial Platforms
As mentioned above, remote sensing was used to detect the geometries of the surface terrain that could suggest the presence of a buried archaeological structure. For this purpose, a set of image maps obtained from aerial platforms at various times and by different methods was used (
Table 1).
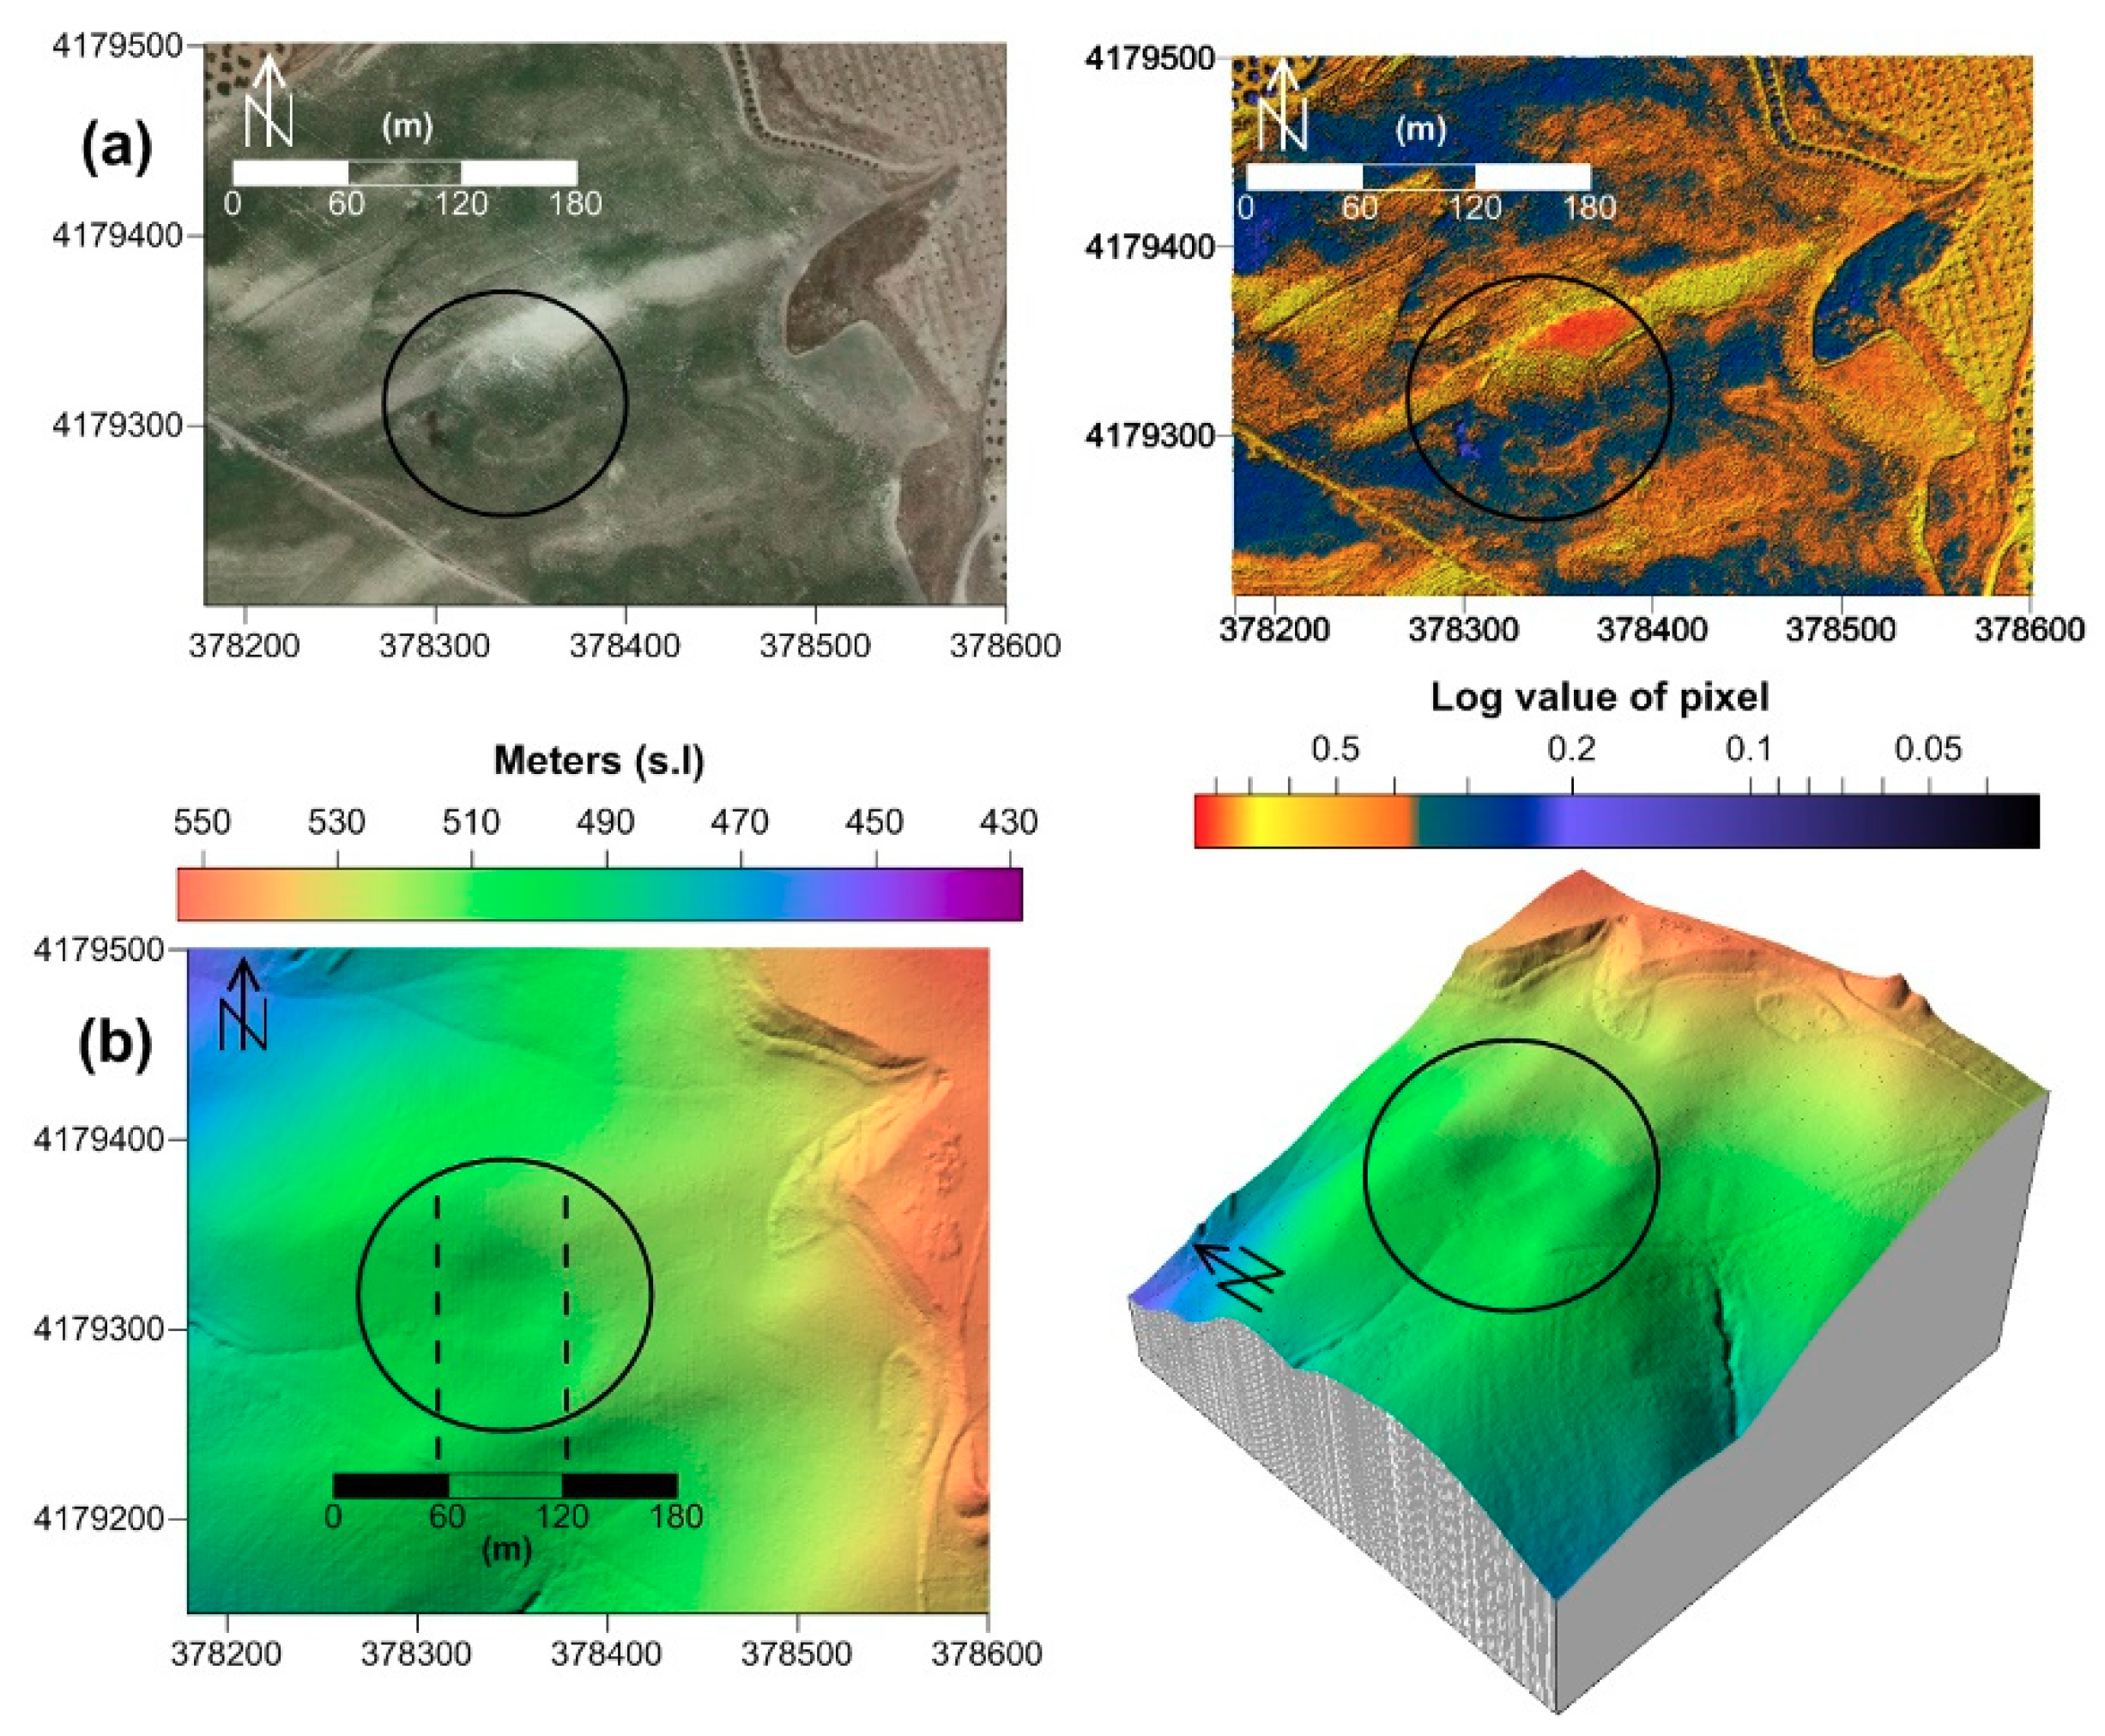
In the first phase of the study, the 2009 and the historical ortophoto maps sets were processed in a similar way. The basic processing flow was performed using a commercial code Surfer (V.15.Golden Inc), where the main concept was to consider the color value of the pixels a as z-coordinate. These original values have been modified mathematically in order to enhance the footprint of the Roman Amphitheater; mainly stretching, normalizing, and filtering [
25]. As can be seen in
Figure 2, the data revealed the circular footprint of a Roman amphitheater with a radius of approximately 60–65 m. As there is a recent almond plantation in the study zone (see
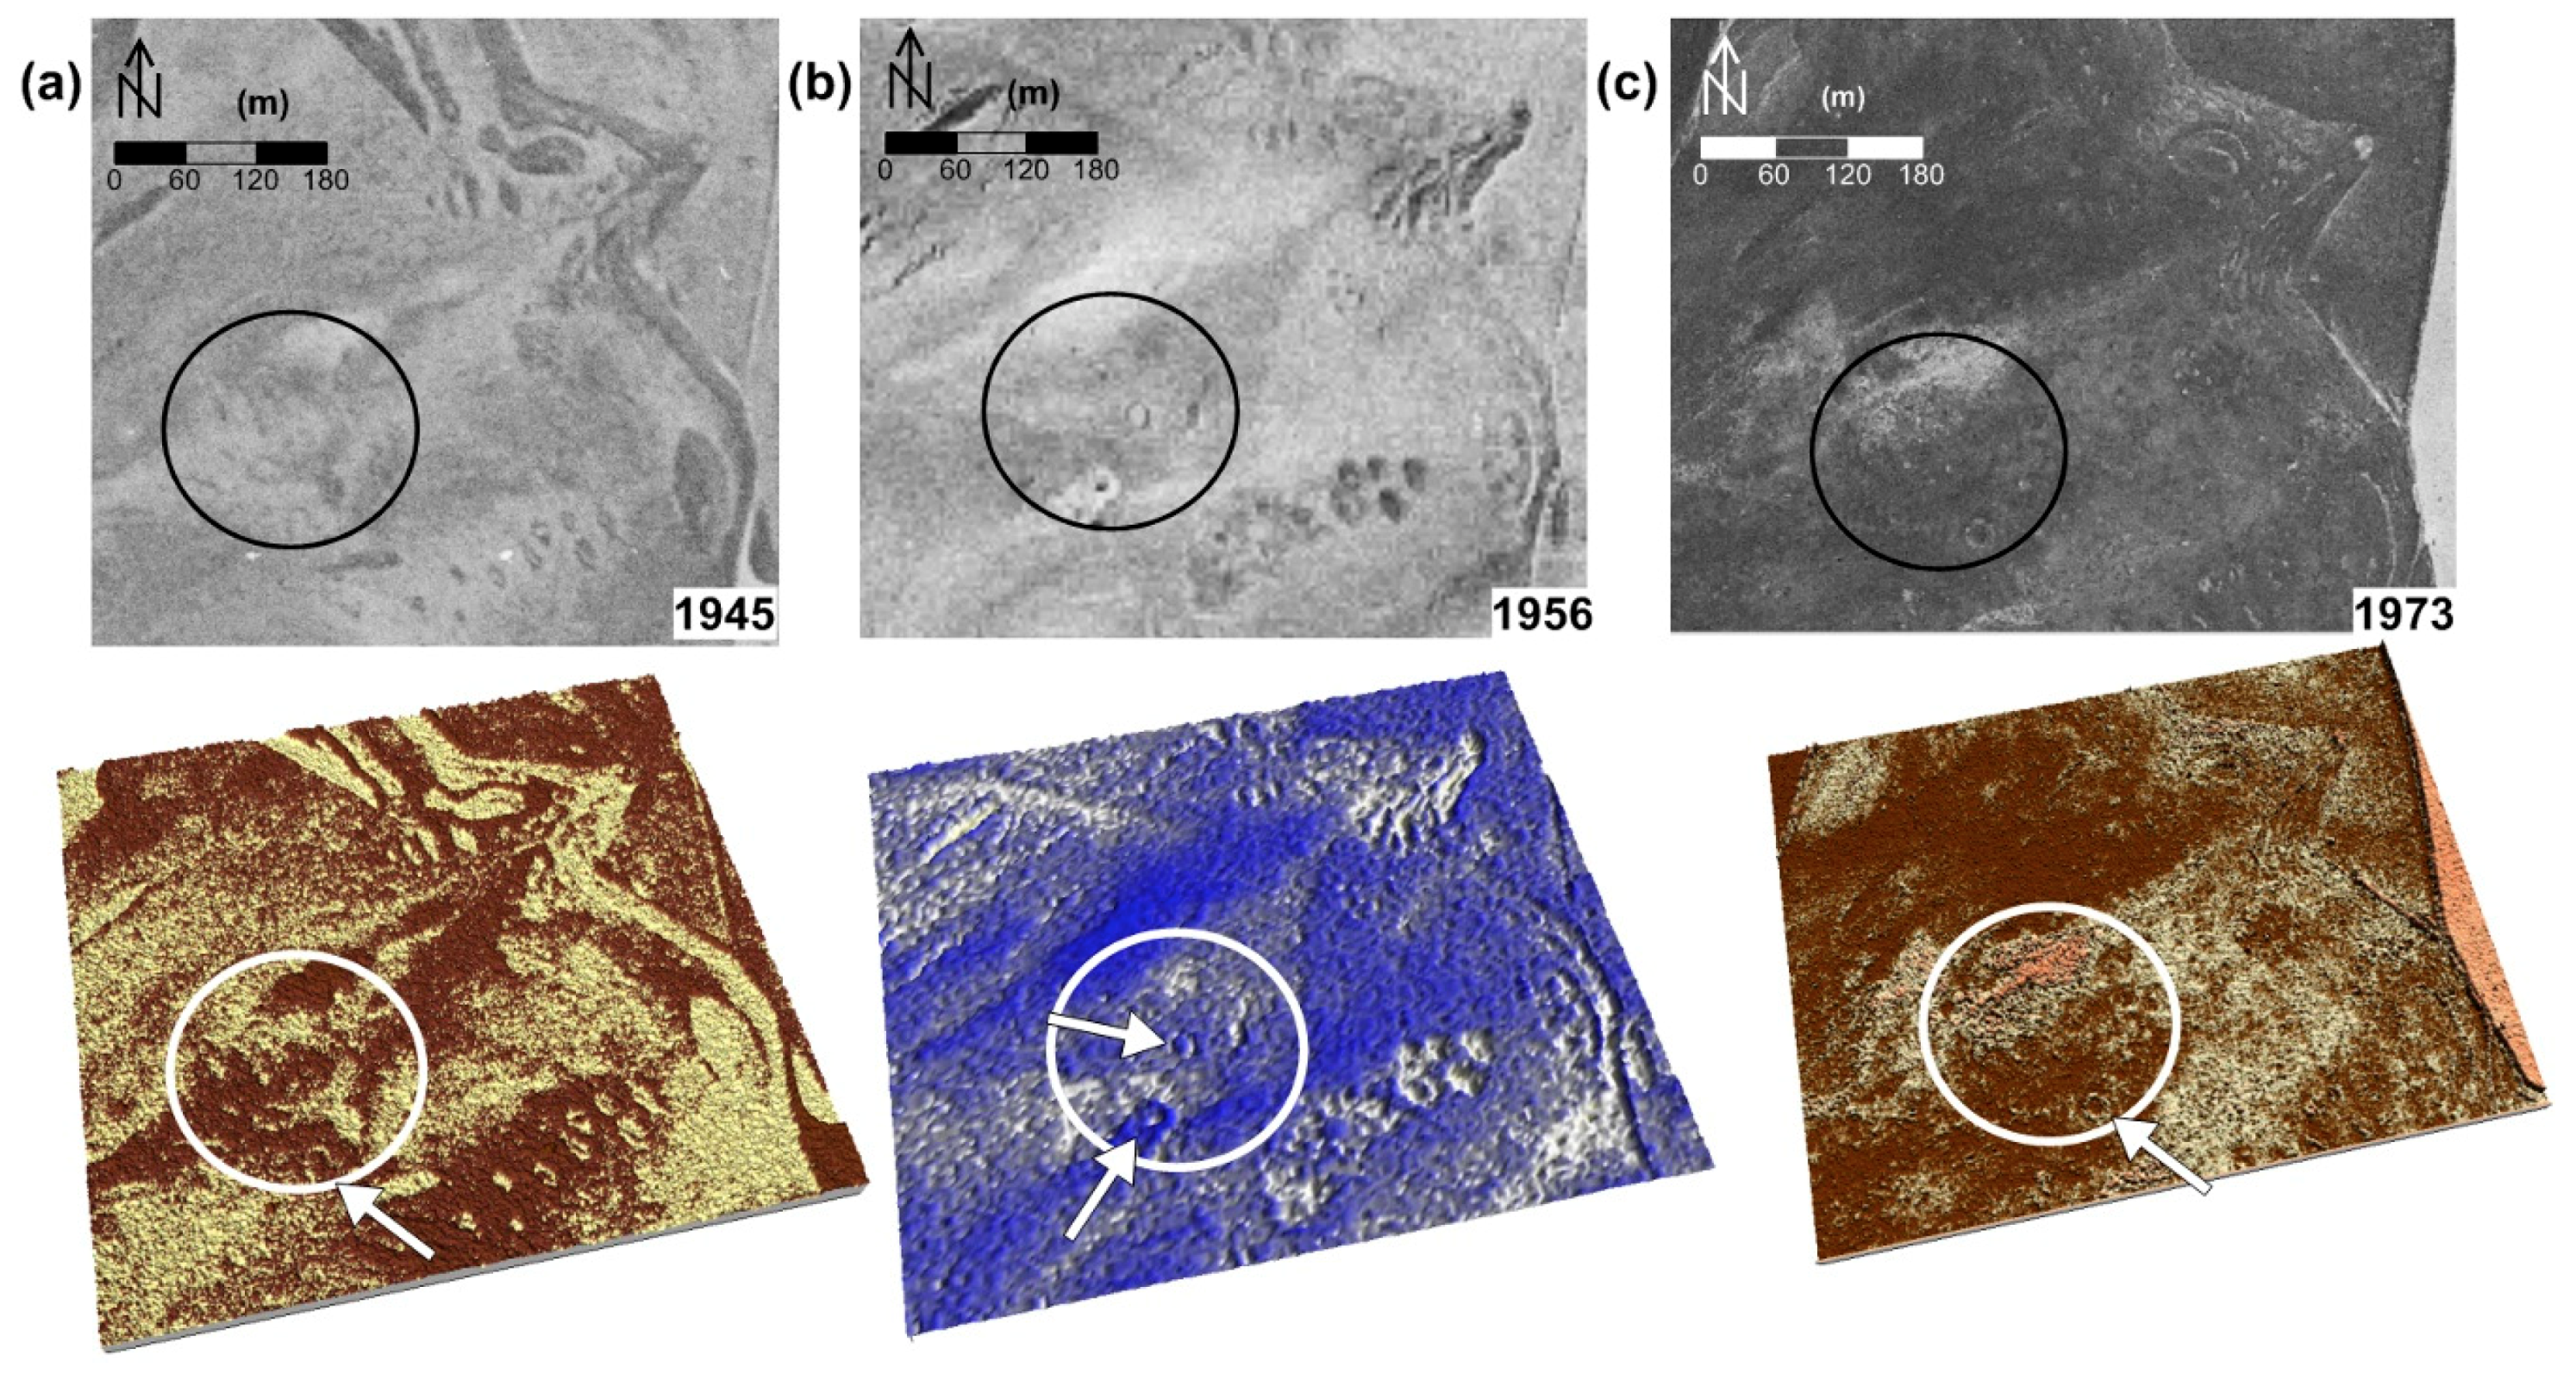
Figure 1), historical aerial photos were examined to obtain information on recent geomorphological changes. The analysis of these images (
Figure 3) revealed that until the almond trees were planted in 2017, the area had not suffered any agricultural interventions. However, these old photos indicate small morphological changes that could be related to shepherd settlements. It is noteworthy that some of these changes were located inside the southern part of the circle (arrows in lower images of
Figure 3).
2.2. Geophysical Survey
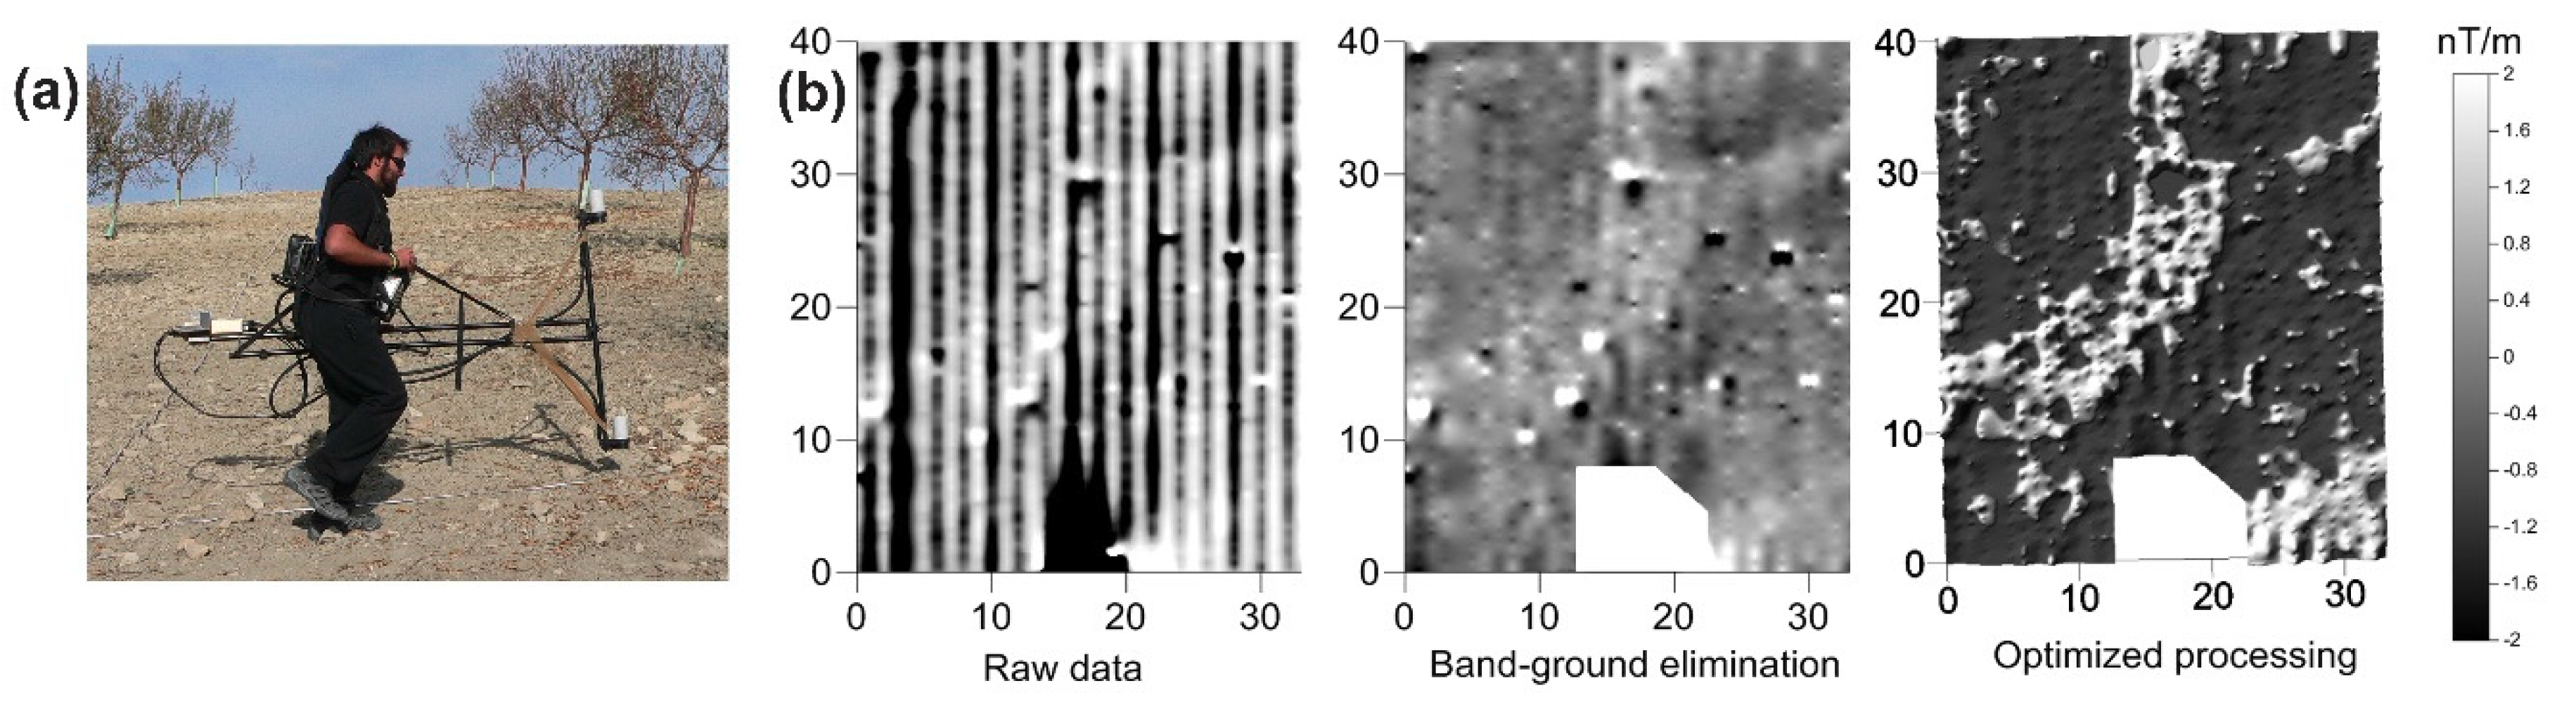
In order to investigate the archaeological potential of the footprint detected in previous aerial images, a non-destructive geophysical survey was carried out in 2018, when the almond trees were still small. Tree geophysical methods, based on different principles, were used as follows: (i) Vertical pseudo-gradient magnetic exploration to obtain the magnetic anomalies map for the entire study area; (ii) ground-penetrating radar (2D-GPR) with traces in selected perpendicular and parallel profiles to cross-validate the magnetic anomaly of the amphitheater; and (iii) two electric resistivity tomography (2D-ERT) profiles to identify the geological context of the site.
2.2.1. Vertical Pseudo-Gradient Magnetic Survey
In this study, a gradient magnetic survey (GEM) system potassium gradiometer was utilized for ground recognition. This equipment is sensitive to fine variations of the magnetic field (± 0.01 nT / m). To obtain the magnetic anomalies map, the total area was divided into rectangular sectors. Each sector was swept in parallel profiles 1 m apart, resulting in a dense grid. The data processing was carried out with our own code [
26], to eliminate the strong band-ground that overlapped the weak magnetic anomalies (
Figure 4). After this step, a careful processing flow was performed to avoid artificial effects due to the low signal-to-noise ratio of this dataset. The resulting anomalies maps are shown in
Figure 4.
2.2.2. Ground-penetrating radar profiles
2D-GPR profiles crossing the vertical and the longitudinal axes of the aerial amphitheater print and the related magnetic anomaly were obtained using a 400 MHz antenna and a SIR-2000 system (GSSI, Inc). The field conditions were not good due to the presence of soil clods, and the low resistivity of the subsurface materials (marls and silts). This causes poor antenna coupling and poor penetration depth, which affects data quality [
27]. The radargrams were processed using the RADAN V7 commercial code (GSSI, Inc) and our own modules. Effort was made to remove the background (horizontal noise bands) and correct the reflection amplitudes produced by the decoupling between the antenna and the ground (
Figure 5).
2.2.3. Resistivity Profiles
We obtained two electric profiles (2D-ERT) using a Terrameter LS-12 resistivity meter (ABEM, Inc.). Electrode spacing was set at 0.5 m, and the electrodes were moved to cover the entire length of the profile (roll-along technique). A total of 84 electrodes were placed on the surface at the same time, and the array configuration to measure apparent resistivity data was a gradient device [
28]. These profiles were made to match the GPR lines. The data were inverted using the Resix2Dinv code (Geotomo Software S.L., Looke M.H., 1996), and both of the final resistivity models finished at seven iterations with low absolute errors of 1.3 and 2% (
Figure 6), for ERT-1 and ERT-2, respectively. The locations of these two profiles are shown below, and they have been matched with the two GPR profiles.
3. Results
Remote sensing provided detailed information on the Roman amphitheater of the Torreparedones archaeological site. The orthophoto of 2009 and the LiDAR MDT model showed the circular footprint of the structure, which had a radius of 60–65 m. These images allowed us to draw the first archaeological hypothesis regarding this structure.
Despite the low magnetic contrast between the soil and the archaeological structures, the high sensitivity of the gradiometer provided a good vertical anomalies map. Both images in
Figure 7 show the same magnetic anomalies map with lower values in the ±2 nT/m range, where the lighter grey and brown tones show the higher induced magnetism.
The upper magnetic map was interpreted using the analogous features of the aerial photos shown in
Figure 2 and
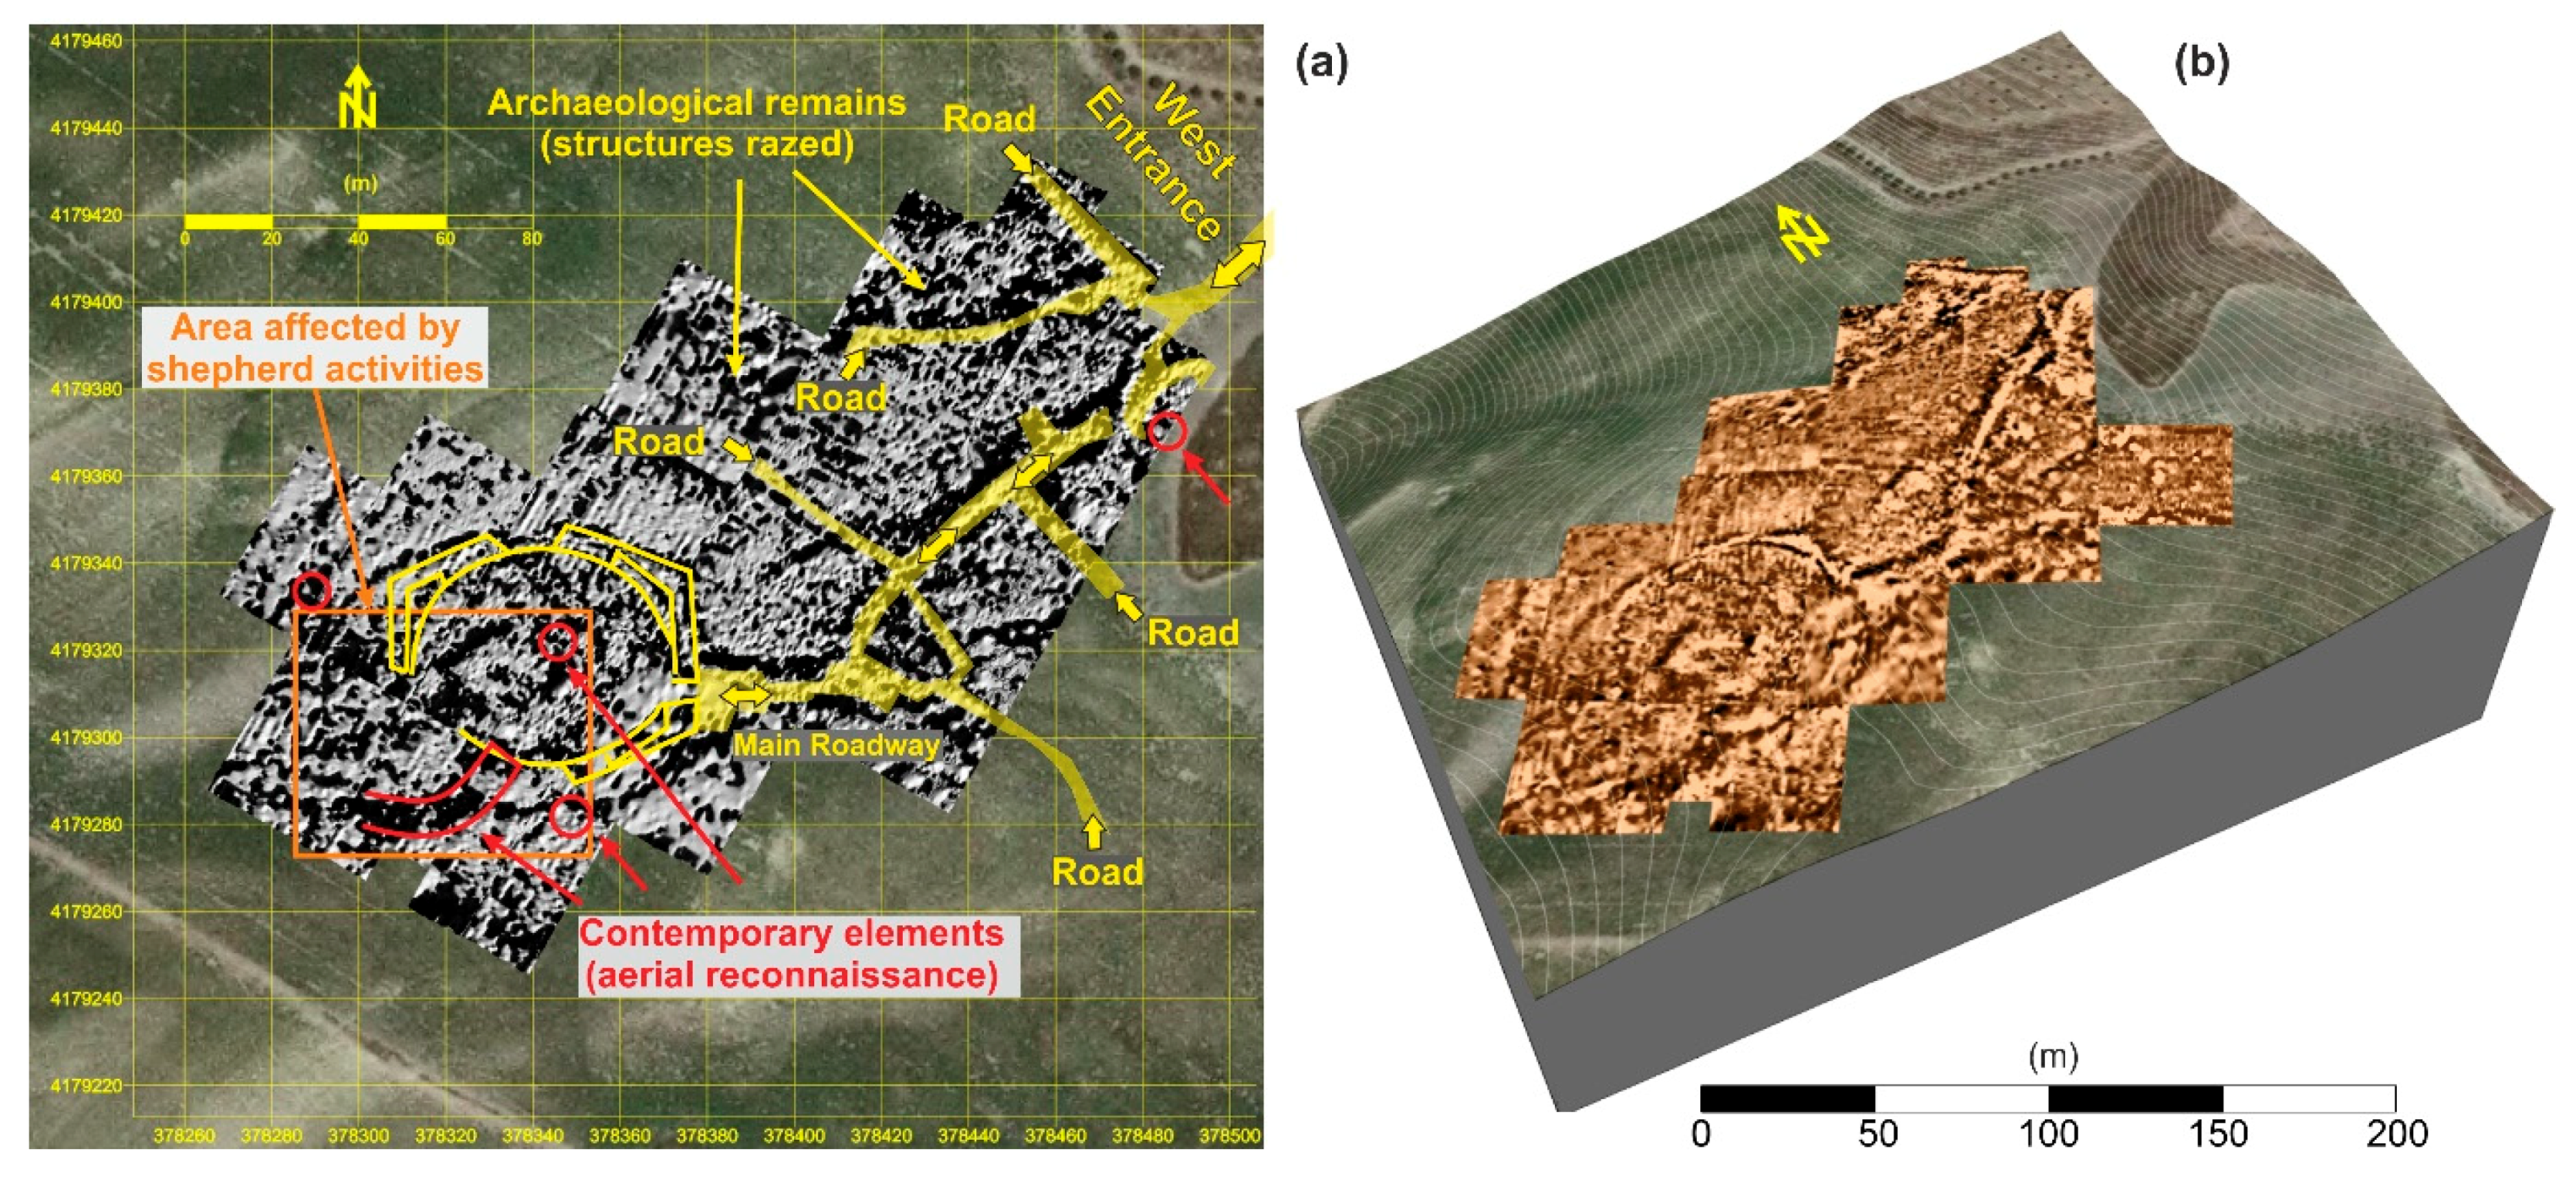
Figure 3 (elements in red), and the elements detected in the brown magnetic map that was adapted to the DTM-LiDAR. The lower image shows that the city may have been constructed on terraces following the topography of the terrain. This was indicated by the magnetic linear features associated with a network of roads adapted to the contour lines (see brown magnetic map). A clear outline of the amphitheater could also be seen, as well as some surrounding structures in the area where the major roadway linked the western entrance to the Roman city with the amphitheater. In the southwest sector, coinciding with the aerial photos, the radial shape of the amphitheater was blurred by the overlapping of other anomalies, thus suggesting the later presence of shepherds in this sector (sheds, stables, sheepfolds, etc.).
The low dielectric contrast did not provide relevant GPR information, but the cross-validation between the GPR profiles with the equivalent ERT profiles confirmed the remains of the amphitheater and revealed the extent of its structures.
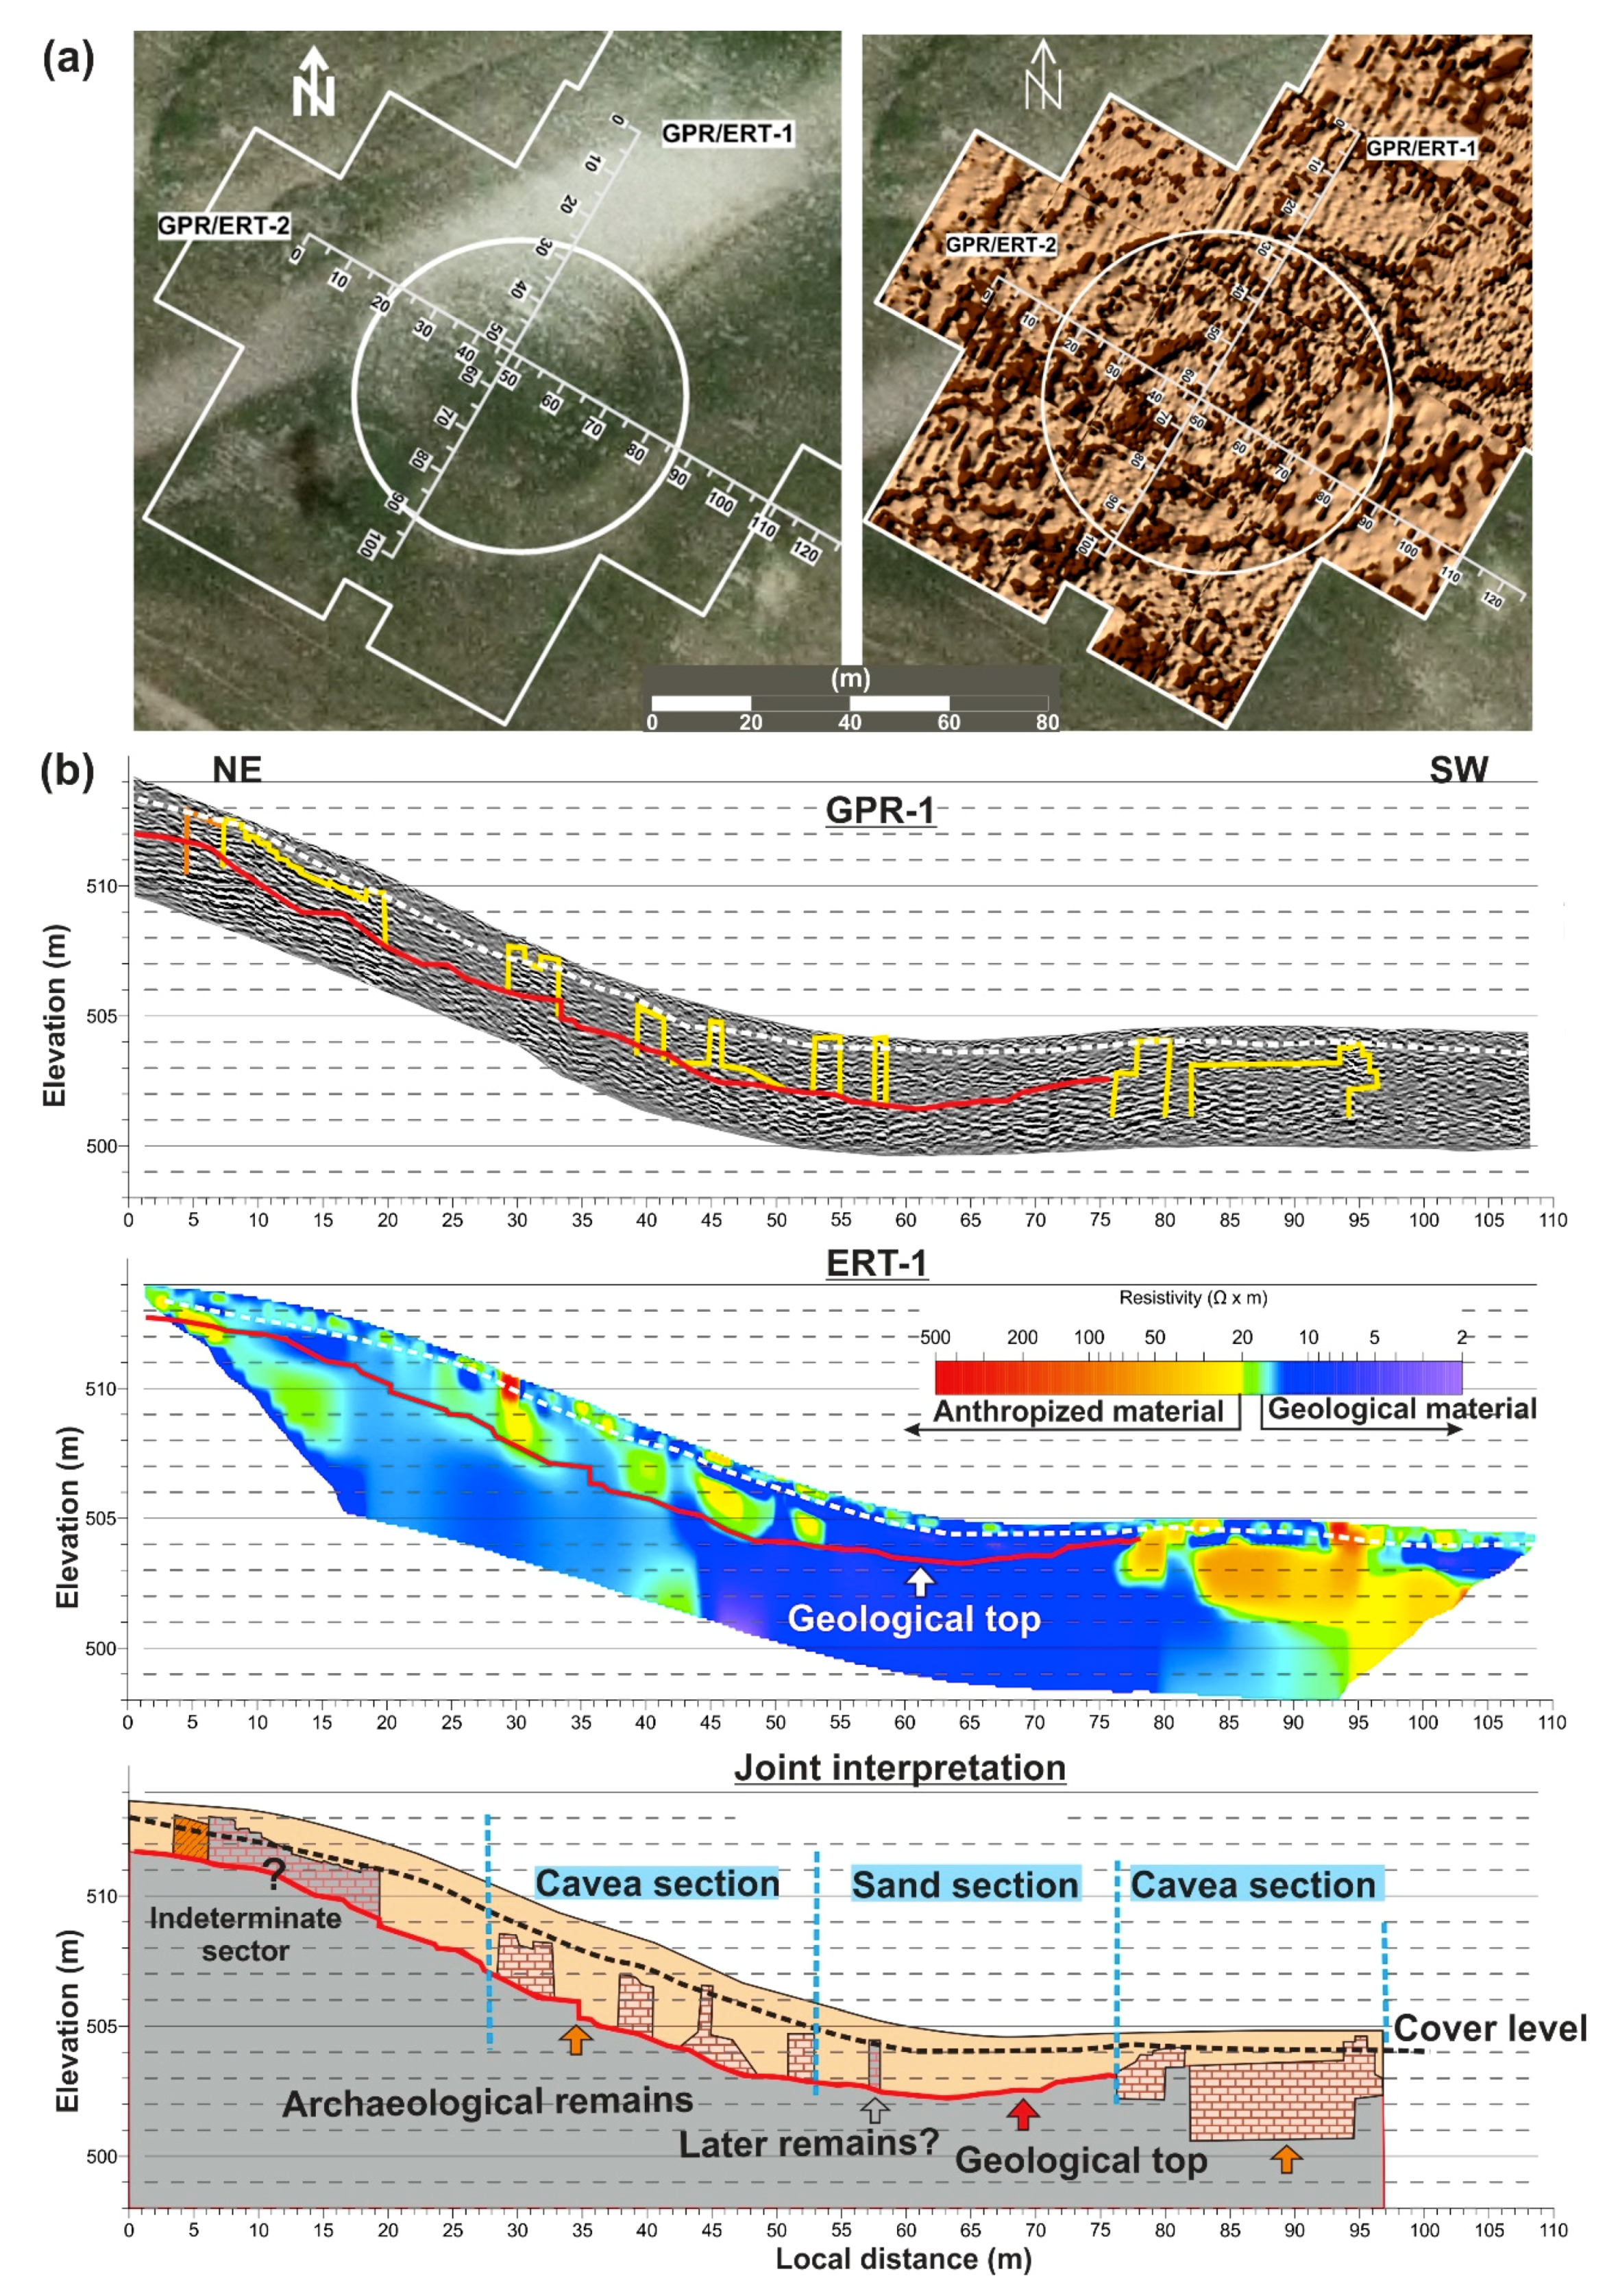
Figure 8 shows the joint interpretation for the NE-SE geophysical transect, that crosses the magnetic anomaly and the aerial print of the amphitheater. Both models detected the roof of the structures very superficially, from 20 to 75 cm in depth (white line in GPR-1 and ERT-1),
Figure 8) and a variable depth ranging from 1 to 3 m (red line in GPR-1 and RT-1,
Figure 8). The interpreted sand section was marked by the electric model from 48 and 77 m, which was defined by a homogeneous and conductive part (15 Ωm -7 Ωm). The sections located at 29–52 and 77–96 m were associated with the
cavea, were heterogeneous, and had high resistivities (greater than 15 Ωm).
A comparison of the resistive anomalies and the GPR reflections revealed two GPR reflectors with low (or null) electric response on the north-east end (outside the amphitheater circle) and inside the sandy section, thus suggesting that they were made of very similar materials to those of the latching body (
Figure 9). This introduces an uncertainty in the interpretation, since they could be post-Roman structures constructed in a crude manner (mud, adobe), as they were only distinguished (with the GPR) by their different internal organization. The red line marks a geological basement that was basically homogeneous and conductive, thus indicating that it was formed mainly by marls. Similar results were found for the NW-SE geophysical transect.
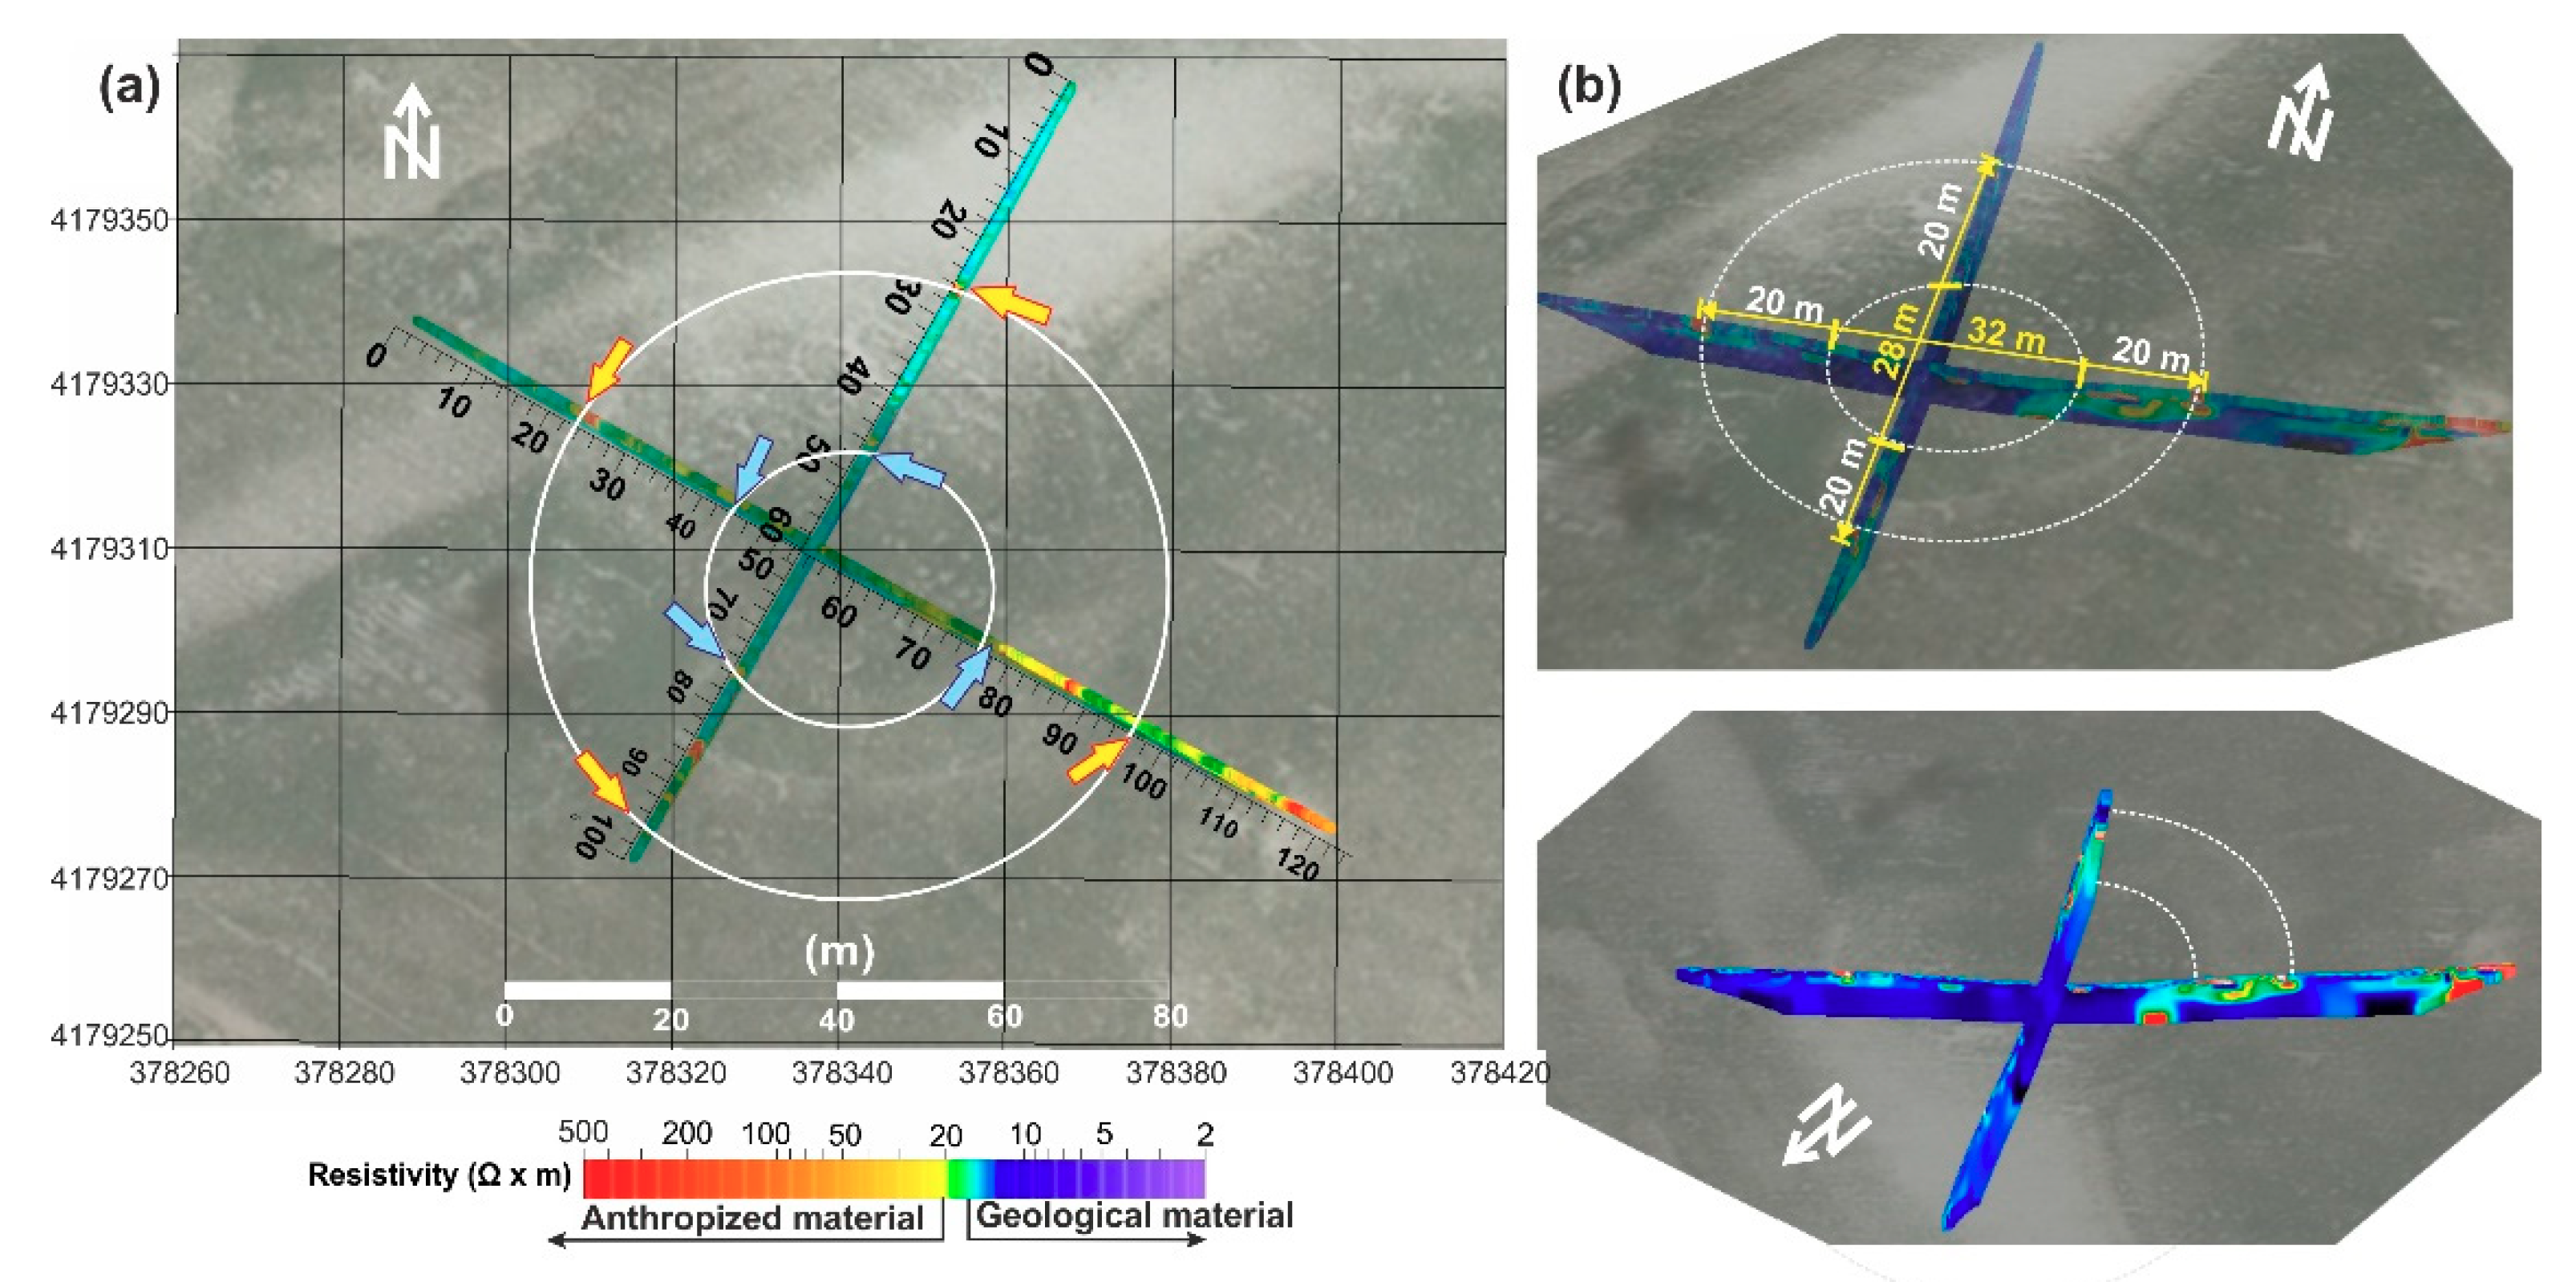
Figure 9 shows three views of the 2009 aerial orthophoto and the spatial ERT profiles representing the ensemble evidence to establish the main geometric dimensions of the amphitheater. This information is summarized in
Table 2.
4. Discussion: The Archaeological Excavation
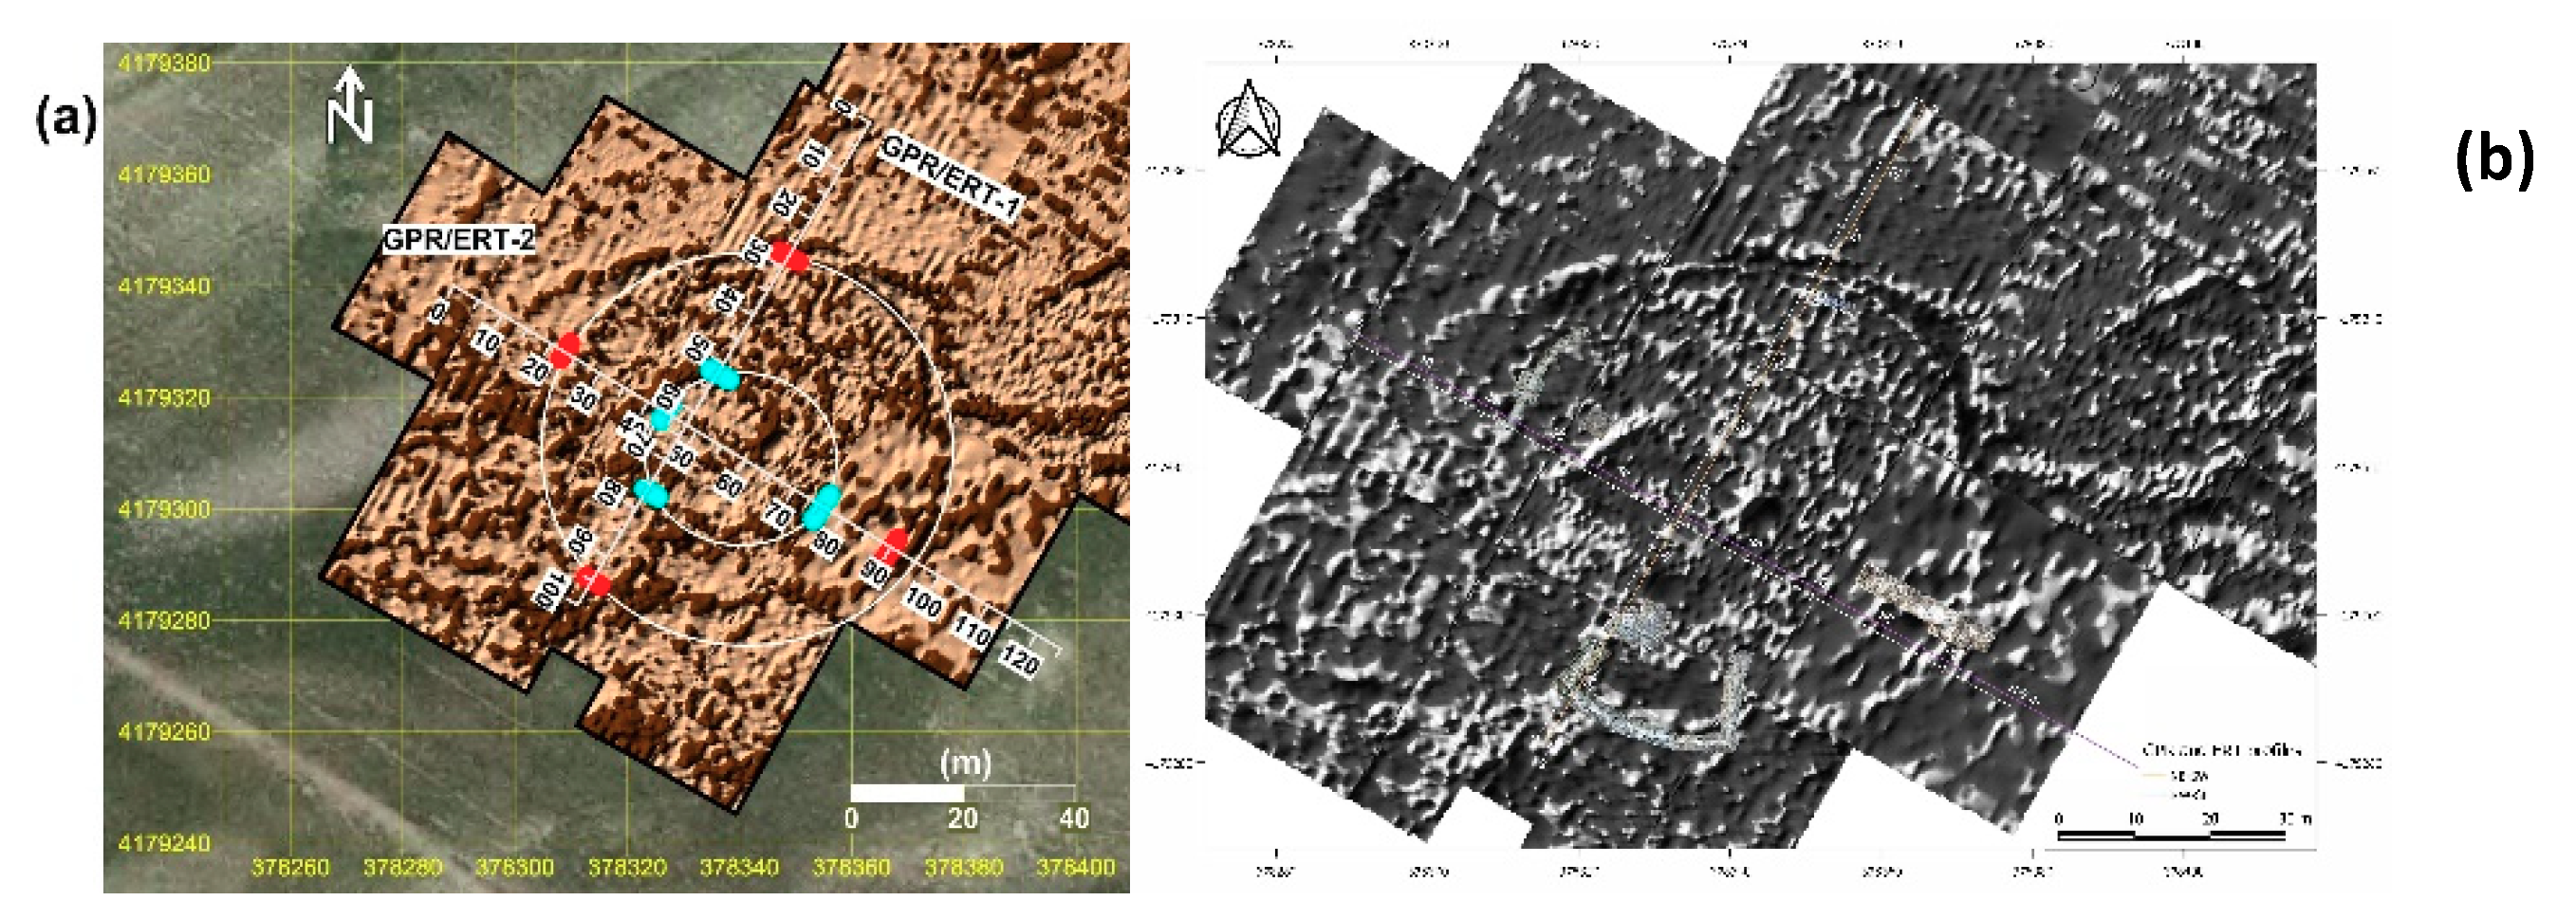
When transferring the data from the ground geophysical surveys to the Area of Interest, three-dimensional, physical and measurable archaeological structures appeared at the four cardinal points. Archaeological trenches were dug at points where walls were assumed to exist, resulting in a set of lithic volumes and transit spaces that demonstrated the presence of remains of the Torreparedones amphitheater. The most prominent examples were documented in trenches one, three, four, five, and six of the 2018 campaign (
Figure 10).
4.1. Trench 1
In the north-east area of the amphitheater, the geophysical survey data suggested that the GPR anomalies present in the NE-SW geophysical survey profile between metric points 27 and 30 might be ruins of the north stands of the amphitheater (
Figure 8). The archaeological excavation allowed us to clarify that these anomalies corresponded to the northern façade of the amphitheater (Unit 1005), which was discovered 10 cm under the modern ground level and is 60 cm in width (
Figure 10 and
Figure 11). The wall was constructed using the
opus vittatum technique.
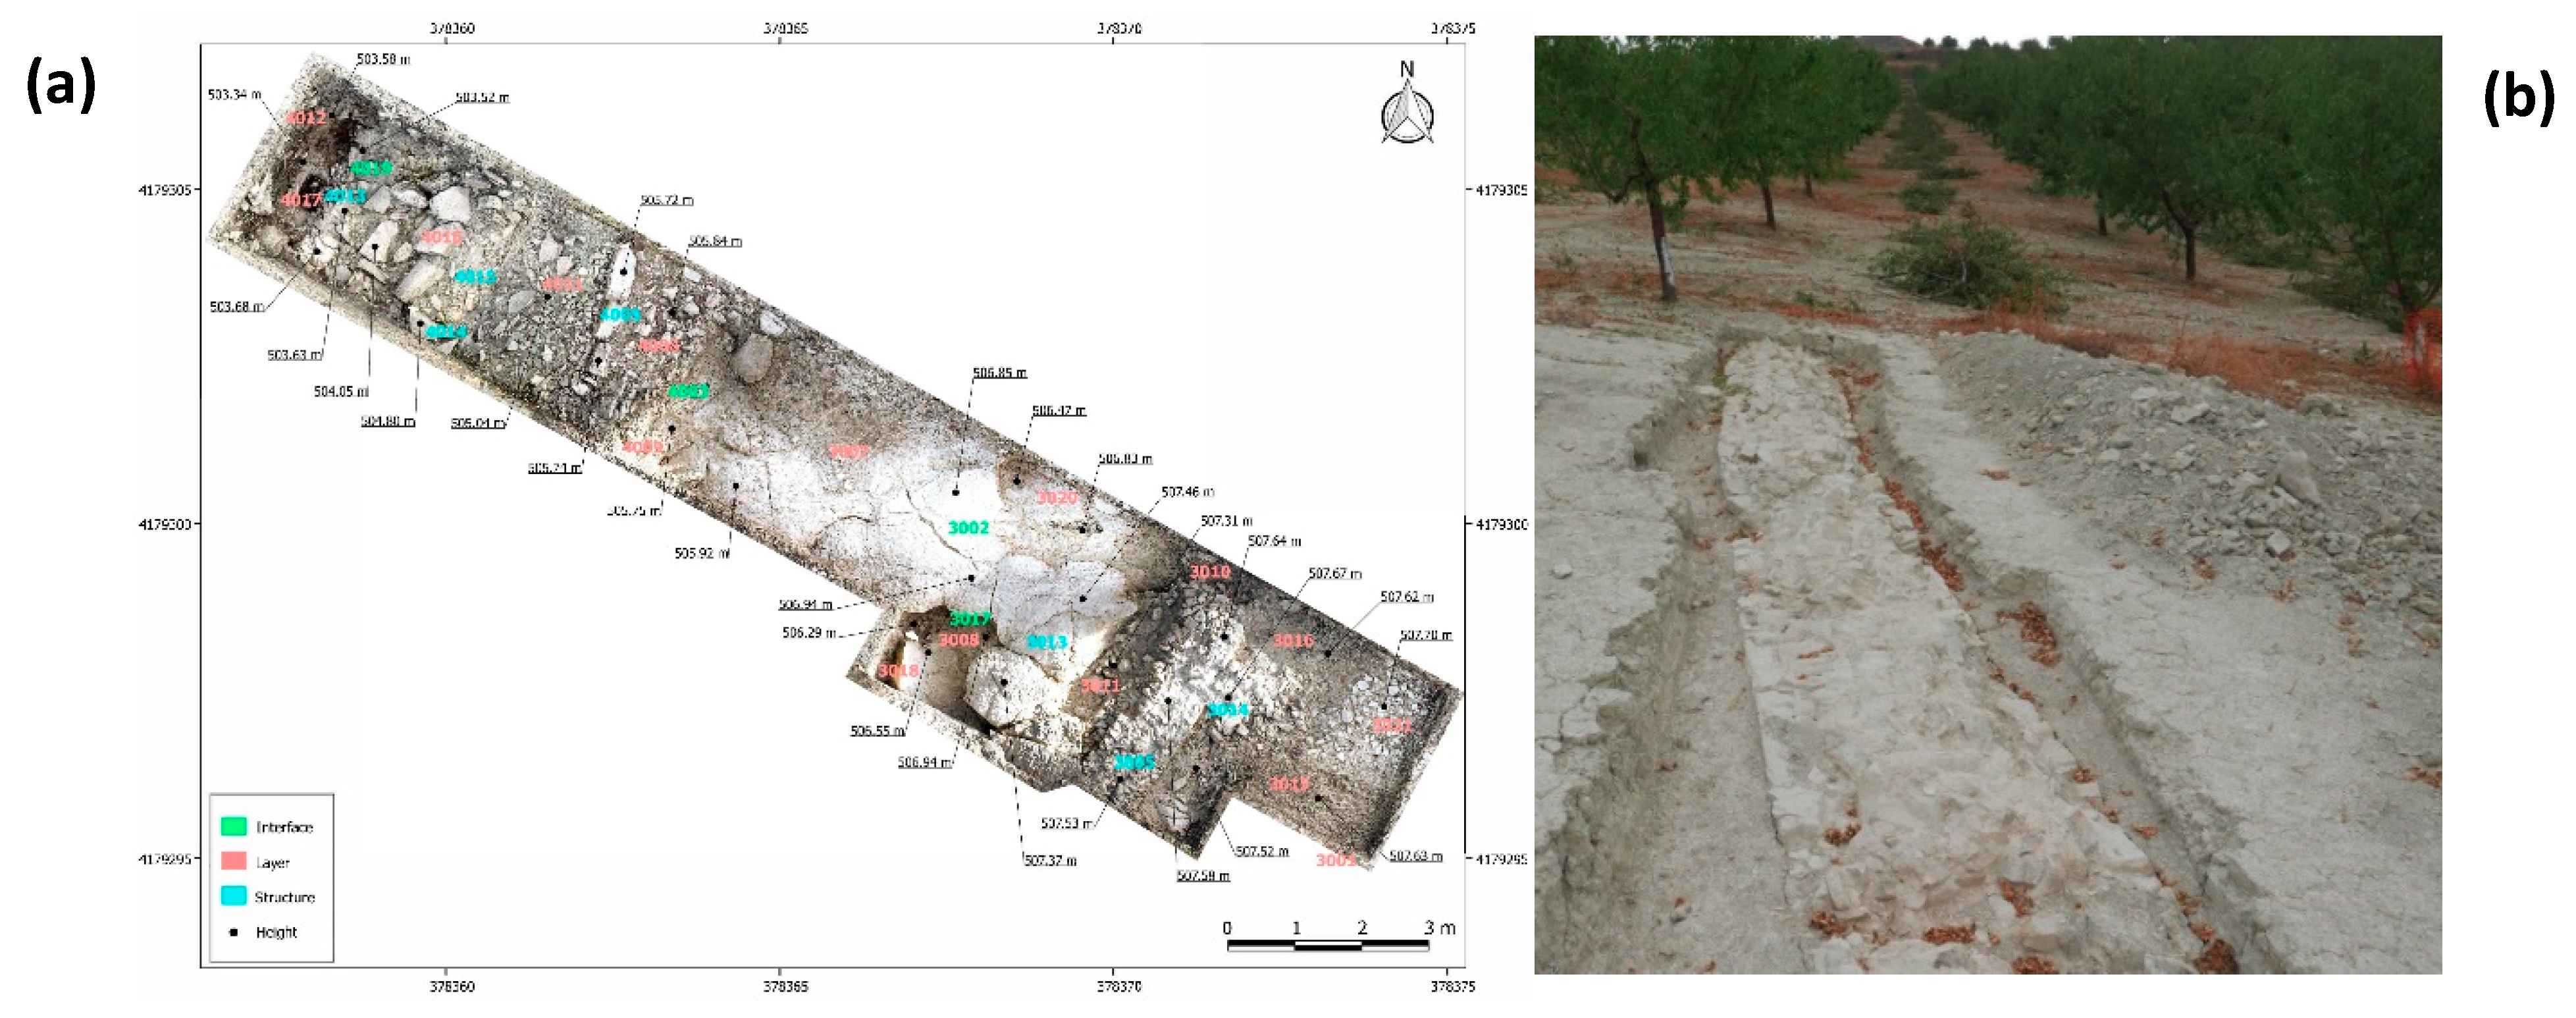
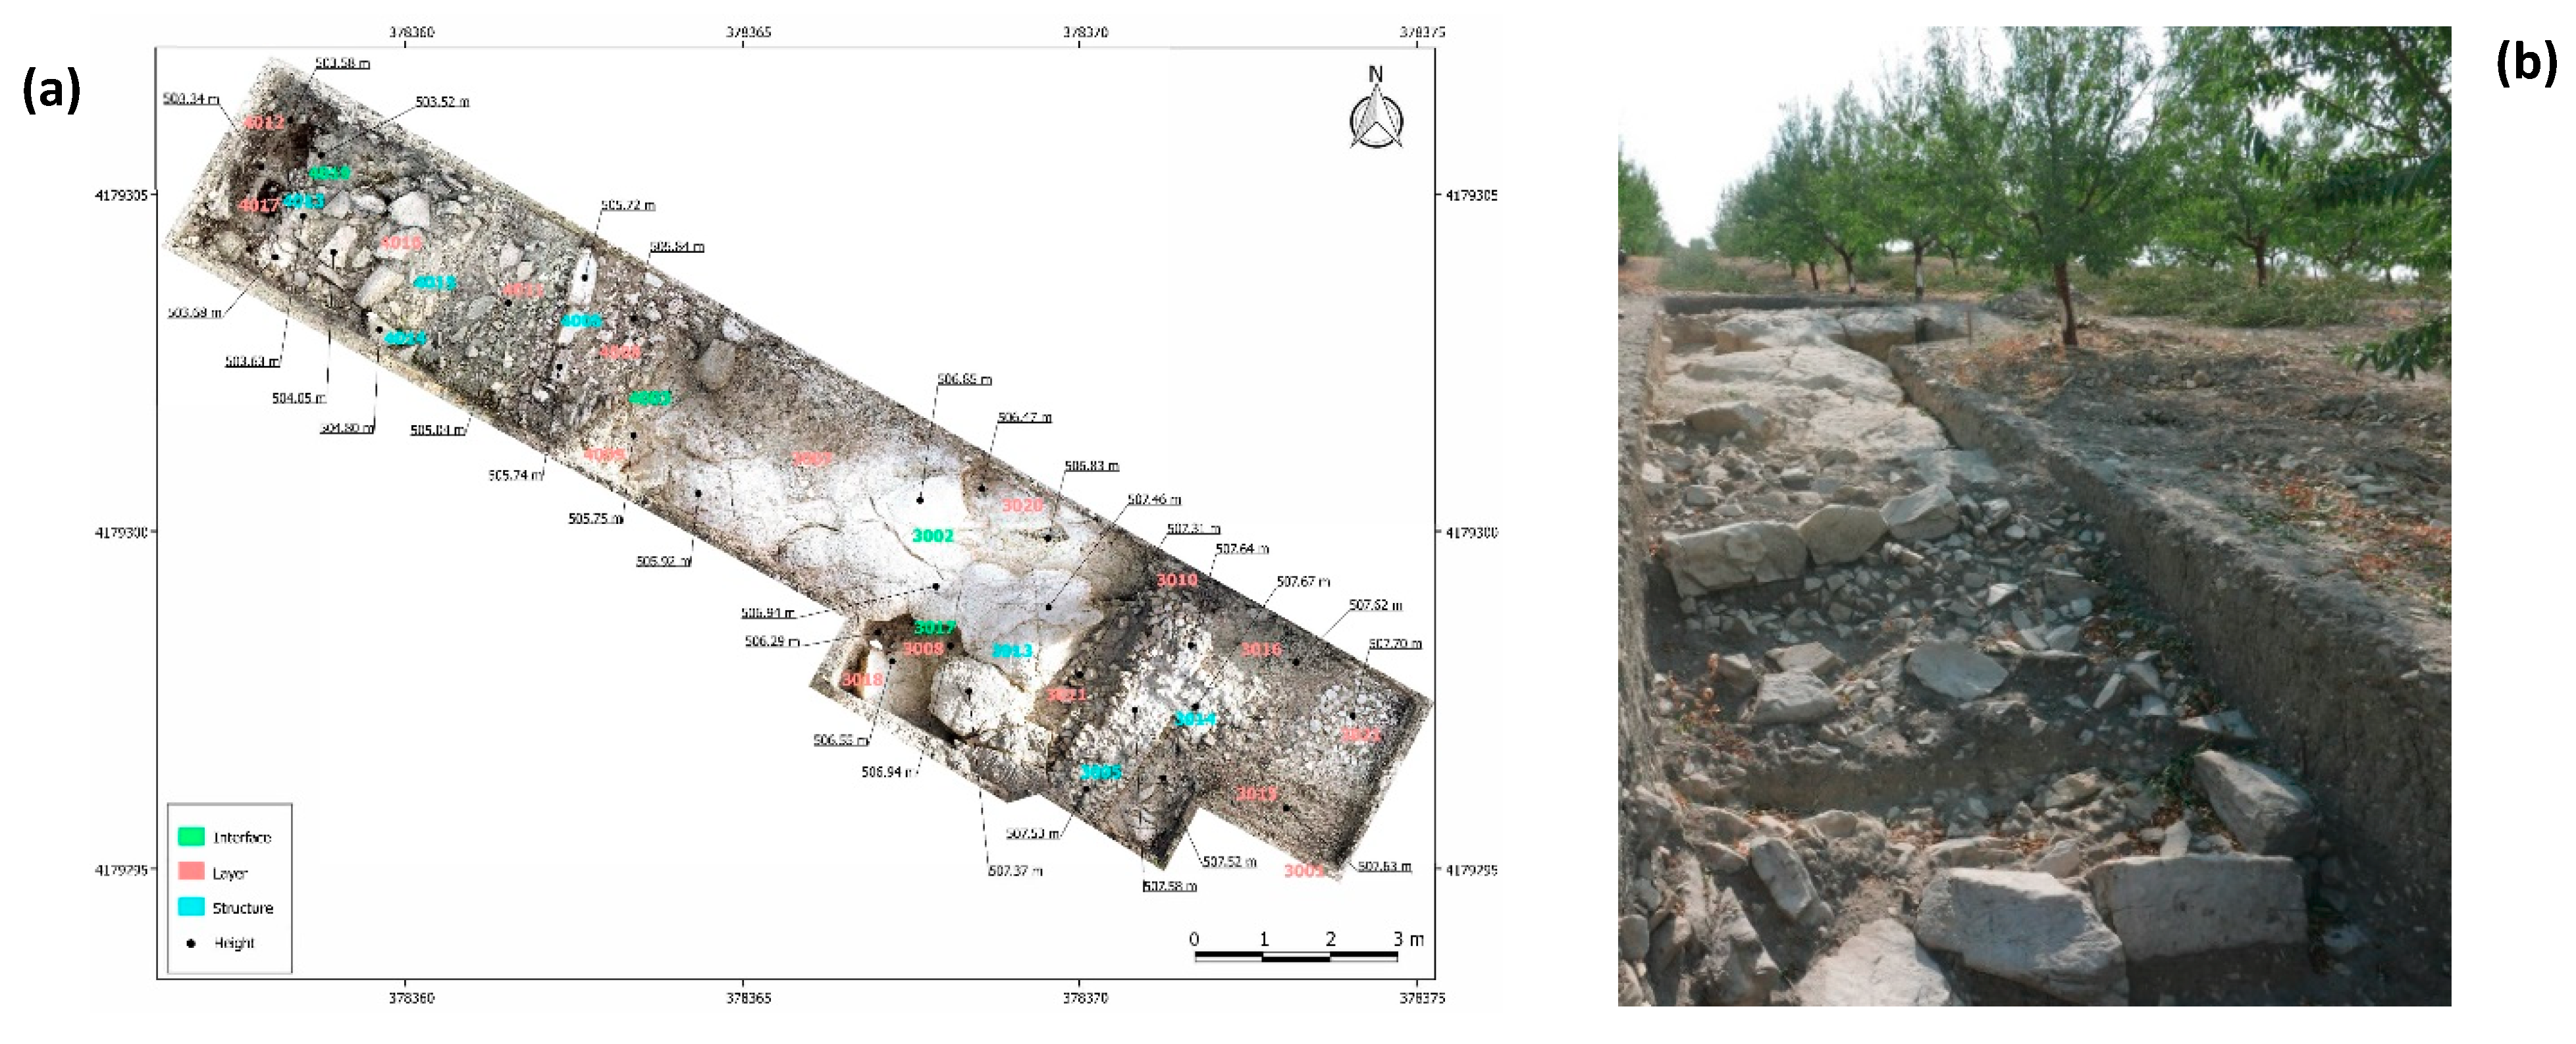
4.2. Trenches 3 and 4
In the SE area of the amphitheater, trenches three and four were located 4 meters to the north with respect to the NW-SE geophysical survey profile (
Figure 10). This circumstance was motivated by the appearance of surface structures. As in the previous case, the aim was to document the eastern façade of the amphitheater and the construction technique used. Unit 3003 corresponds to a bioclastic sandstone vein with numerous crevices cut into the stone, that denote the extraction of trapezoidal ashlars. Therefore, this was probably a quarry front whose hollow spaces had been reused later as a basement for the eastern stands of the amphitheater.
The structures of the amphitheater were built on this carved hillside at a later date. Among them, it is important to mention Unit 3005, which delimits the eastern façade wall of the amphitheater. This wall was built with uniform, medium-sized stones using the opus vittatum technique, and appears to be quite razed although it has not been completely excavated. A buttress (Unit 3014) associated with the perimeter wall that was attached to the amphitheater’s eastern façade wall was also discovered and filled the construction trench (Unit 3013).
The comparison between the NW-SE geophysical survey profile and the archaeological excavation allowed us to clearly identify the geophysical anomalies of the bioclastic sandstone vein (Unit 3003) and the façade wall (Unit 3005). In the NW-SE radargram, between metric points 64 and 80, the anomaly was interpreted as a possible basement corresponding to the bioclastic sandstone vein (Unit 3003). In the same radargram, the anomaly was identified between metric points 88 and 89, and interpreted as the façade wall of the amphitheater, which was confirmed by the archaeological excavation (
Figure 9 and
Figure 12).
4.3. Trench 5
Due to the presence of almond trees, once the structures that coincided with the geophysical data had been located in the area, trench five had to be moved one meter to the west and trench six one meter to the north (
Figure 10).
Trench five, which was located between metric points 77 and 92 of the NE-SW geophysical survey profile, revealed the structures of the eastern jamb of the southern vomitorium. In the SW corner of the trench and perpendicular to the façade wall of Unit 5014, we documented Units 5004 and 5005. These units corresponded to the walls that mark the right and left limits of the vomitorium that provided access to the southern stands of the amphitheater. The walls, built using the opus vittatum technique, were present in a NE-SW orientation.
Unit 5035 marks the space that provided access to the southern stands of the amphitheater and was flanked by Units 5004 and 5005. The southern stands measured 15 m width in the NE-SW direction. Unit 5009 corresponded to the wall that separates the ima cavea from the media cavea of the amphitheater. Part of a staircase (Unit 5031) to enter the southern stands was preserved in situ. The praecinctio was marked by Unit 5044. In front of the praecinctio, we identified some aligned limestone gravel and ashlars (Unit 5045) that may have formed part of the foundation of the ima cavea.
The interpretation of the geophysical data of the NE-SW survey profile showed a perfect correspondence with the building structures that formed the southern
vomitorium (
Figure 8 and
Figure 13). In the NE-SW radargram between metric points 75 and 78, some structures were interpreted as possible basements, which the archaeological data revealed to be Unit 5045 (foundation of the
ima cavea).
Between metric points 85 and 90 of the NE-SW radargram, the anomalies were interpreted as an undetermined building structure. The archaeological excavation allowed us to define and better understand this structure. We discovered that these anomalies corresponded to Unit 5004. The NE-SW geoelectric profile also revealed the entire longitudinal width of this wall.
4.4. Trench Six
Trench six, which is of interest due to the presence of this façade wall, was located one meter to the north with respect to the geophysical survey profile (
Figure 10).
Following the NW-SE profile of the geophysical survey, Unit 6003 was located. This unit corresponded to the western façade wall of the amphitheater, which was built with uniform, medium-sized stones using the
opus vittatum technique. Attached to the façade wall were two buttresses (Units 6004 and 6005) which presented with the same building features (
Figure 14).
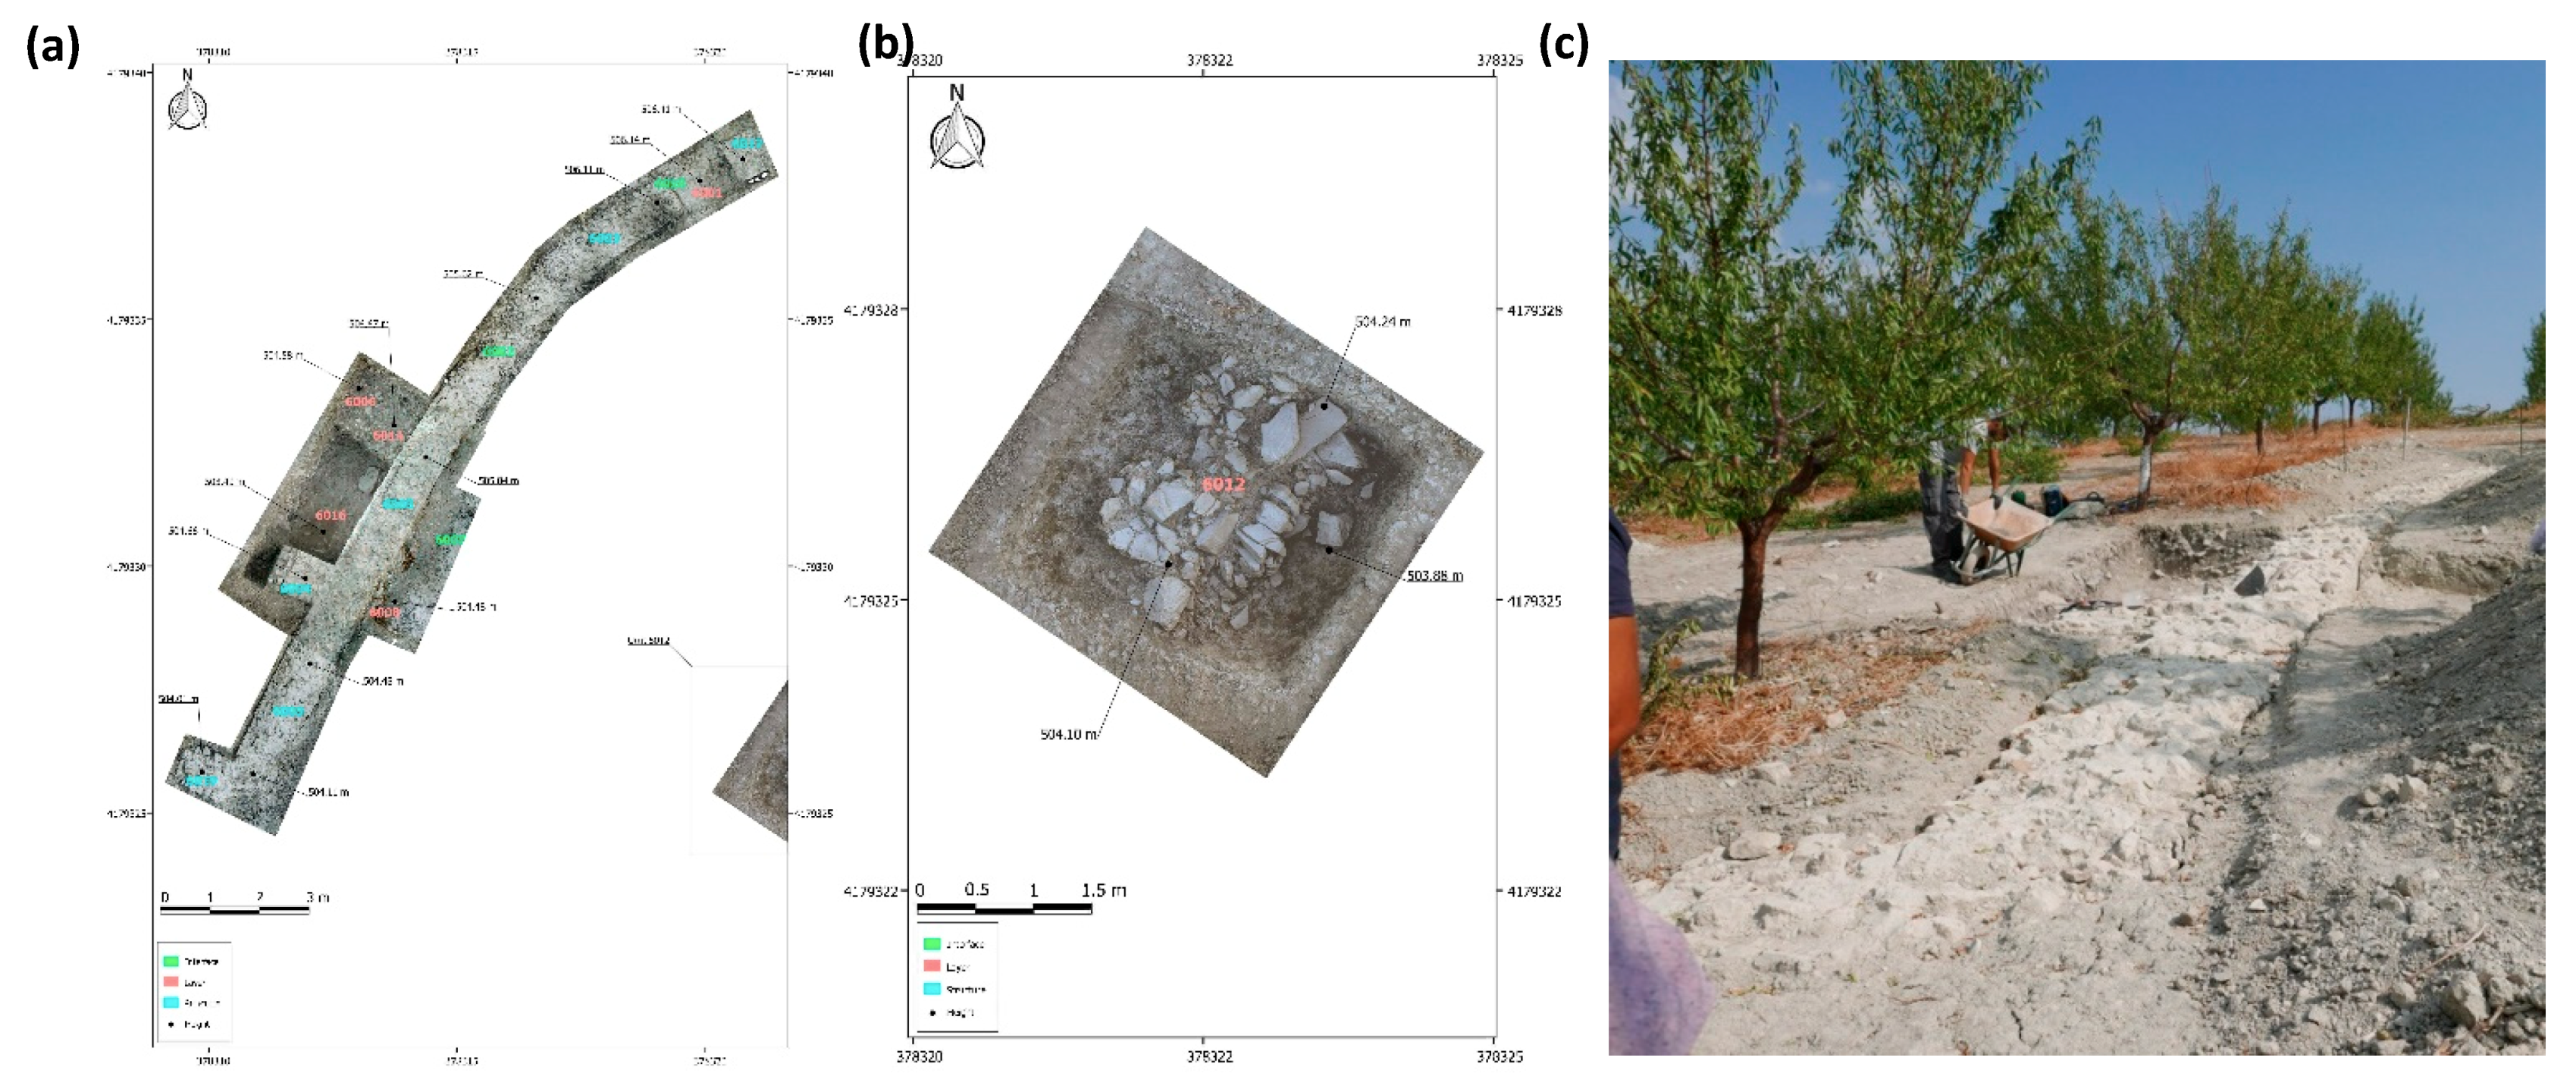
To the east, in the direction of the structures of the podium wall of the amphitheater, we discovered a set of ashlars and limestone slabs (Unit 6012) aligned with a section of the west stands (
Figure 14). Unit 6012 coincided with the structures identified in the NW-SE radargram at metric point 36. However, the structure of what may have been the podium wall was most likely built of removed or pillaged pieces.
5. Conclusions
This study is an example of how the cross-validation of different methods indicate that cropmark remote sensing has very good capability for detecting buried archaeological structures. The later archaeological trenches have allowed us to validate the existence of the amphitheater, thus supporting the results of our indirect investigations.
In this context, the georeferencing of geophysical data is a crucial aspect since this information was then linked with the prints in the orthophoto aerial images. Specifically, we were able to define the archaeological structures with an estimated error lower than 0.25 m over an area of about 3 ha.
The non-destructive techniques used in this study produced an image that was itself a map of this part of the site, which revealed images of particular buried features. The aerial photos provided a complete view of the site and the cropmarks of the buried features of the amphitheater. Nevertheless, these prints do not always allow features of structures that are still in situ to be clearly discriminated (e.g., walls, floors, streets). Therefore, a comparison with geophysical methods is still necessary to assess the preservation of buried structures.
Among the geophysical techniques applied, magnetic gradiometer and ERT were the most efficient for the purpose of this study. The magnetometry survey provided a detailed superficial map, as well as new and important clues regarding the structures located inside and surrounding the amphitheater, which are not visible in aerial photos. The ERT profiles produced detailed 2D-profiles at depths of 7–10 m that detected some inner structures not visible with the superficial maps, because they were slightly sensitive to the present lithologies of the site (sands, silts, marls, and bioclastic sandstones). The GPR profiles allowed us to trace the greater walls but failed to detect small structures, due to the poor dielectric contrast between the different materials. However, the results suggest that future geophysical surveys, eventually with more detailed sampling in some sectors, should mainly rely on the ERT method (2D and 3D techniques).
The archaeological reconstruction indicated that the Roman amphitheater was located outside the perimeter wall of the Roman city. In this western sector, the city was distributed on terraces following the topography of the terrain and had a network of streets and roads that were adapted to the contour lines (associated with the magnetic linear features). In this context, the amphitheater was connected to the major roadway that linked the western entrance to the Roman city. As it has small dimensions, the Roman amphitheater of Torreparedones is similar to the Contributa Iulia, or Segobriga cases. This evidence confirms that small cities in Roman Spain had amphitheaters no higher than 70m in the central axis. Remote Sensing, geophysics techniques and excavations developed confirm that Torreparedones is the third case in this set of small cases in Roman Spain.
Author Contributions
Conceptualization, A.M.-C.; Data curation, T.T., M.G., J.A.P., S.R., and J.C.M.; Formal analysis, M.G., J.A.P., S.R., and J.C.M.; Funding acquisition, J.A.M.; Investigation, A.M.-C., T.T., J.A.P., and S.R.; Methodology, A.M.-C., T.T., M.G., J.A.P., S.R., and J.C.M.; Project administration, J.A.M.; Software, T.T., M.G., J.A.P., and J.C.M.; Supervision, A.M.-C. and T.T.; Validation, A.M.-C., T.T. and J.A.P.; Visualization, J.A.P.; Writing—original draft, A.M.-C., T.T., M.G., and J.A.P.; Writing—review & editing, A.M.-C., T.T., and J.A.P.
Funding
This research was funded by HUM 882, Research Group-University of Córdoba, the Municipality of Baena, and the Municipality of Castro del Río. Funding from the European Regional Development Fund (ERDF) is also acknowledged.
Acknowledgments
Numerous colleagues have contributed to the debate on the issues presented in this paper, but major thanks are given: The geophysical prospection was carried out using instruments provided by the Instituto Andaluz de Geofísica at the University of Granada (IAG-UGR). We thank Prof. Jose Carlos Gómez Villamandos, Rector of the University of Córdoba, for institutional support. We thank Carlos Marquez, head of HUM 882 Research Group for the archaeological discussion and research group support. We thank Alejandro Ibáñez, head of cultural heritage in the province of Córdoba, for support with the legal authorization. We thank Juan Carrillo for his daily support during the excavations. We thank finally Martha Gaustad, for revising the English of the manuscript.
Conflicts of Interest
The authors declare no conflict of interest.
References
- Márquez Ventura, C.; Morena, J.A.; De la Llave, R. Torreparedones -Baena, Córdoba-investigaciones arqueológicas; Universidad de Córdoba (UCO Press): Córdoba, Spain, 2014. [Google Scholar]
- Morena, J.A. El Santuario Ibérico de Torreparedones (Cstro del Río-Baena, Córdoba); Diputación Provincial: Córdoba, Spain, 1989. [Google Scholar]
- Morena, J.A. El parque arqueológico de Torreparedones (Baena, Córdoba): Un Proyecto de desarrollo rural desde el Patrimonio Histórico. Arte Arqueol. Hist. 2012, 19, 249–258. [Google Scholar]
- Spanish Geological Map, IGME-945. Available online: https://datos.gob.es/es/catalogo/ea0010987-mapa-geologico-de-espana-e-1-50-000-hoja-945-castro-del-rio (accessed on 30 October 2019).
- Monterroso Checa, A. Remote Sensing and Archaeology from Spanish LiDAR-PNOA. Identifying the amphitheatre of the Roman City of Torreparedones. Mediterr. Archaeol. Archaeom. 2017, 7, 15–22. [Google Scholar] [CrossRef]
- Musson, C.; Palmer, R.; Campana, S. Flights into the Past: Aerial Photography, PhotoInterpretation and Mapping for Archaeology; Occasional Publication No. 4; Aerial Archaeology Research Group: Firenze, Italy, 2013; p. 545. [Google Scholar]
- Lasaponara, R.; Coluzzi, R.; Masini, N. Flights into the past: Full-waveform airbornelaser scanning data for archaeological investigation. J. Archaeol. Sci. 2011, 38, 2061–2070. [Google Scholar] [CrossRef]
- Ceraudo, G. Aerial Photography in Archaeology. In Good Practice in Archaeological Diagnostics; Corsi, C., Slapšak, B., Vermeulen, F., Eds.; Natural Science in Archaeology; Springer: Cham, Switzerland, 2013; pp. 11–30. [Google Scholar]
- Pizzo, A.; Mateos, P.; Mayoral, V. El anfiteatro de Contributa Iulia Ugultunia. Identificación y primer análisis arqueológico. Arch. Español Arqueol. 2016, 89, 249–271. [Google Scholar] [CrossRef] [Green Version]
- Caspari, G.; Sadykov, T.; Blochin, J.; Buess, M.; Nieberle, M.; Balz, T. Integrating Remote Sensing and Geophysics for Exploring Early Nomadic Funerary Architecture in the “Siberian Valley of the Kings”. Sensors 2019, 19, 3074. [Google Scholar] [CrossRef] [PubMed] [Green Version]
- Krivánek, R. Comparison Study to the Use of Geophysical Methods at Archaeological Sites Observed by Various Remote Sensing Techniques in the Czech Republic. Geosciences 2017, 7, 81. [Google Scholar] [CrossRef] [Green Version]
- Gaffney, C. Detecting trends in the prediction of the buried past: A review of geophysical techniques in archaeology. Archaeometry 2008, 50, 313–336. [Google Scholar] [CrossRef]
- Mozzi, P.; Fontana, A.; Ferrarese, F.; Ninfo, A.; Campana, S. The Roman City of Altinum, Venice Lagoon, from Remote Sensing and Geophysical Prospection. Archaeol. Prospect. 2016, 23, 27–44. [Google Scholar] [CrossRef]
- Sarris, A.; Papadopoulos, N.; Agapiou, A.; Salvi, M.C.; Hadjimitsis, D.G.; Parkinson, W.A.; Yerkes, R.W.; Gyucha, A.; Duffy, P.R. Integration of geophysical surveys, ground hyperspectral measurements, aerial and satellite imagery for archaeological prospection of prehistoric sites: The case study of Vésztő-Mágor Tell, Hungary. J. Archaeol. Sci. 2013, 40, 1454–1470. [Google Scholar] [CrossRef]
- Leucci, G.; Di Giacomo, G.; Ditaranto, I.; Miccoli, I.; Scardozzi, G. Integrated Ground-penetrating Radar and Archaeological Surveys in the Ancient City of Hierapolis of Phrygia (Turkey). Archaeol. Prospect. 2013, 20, 285–301. [Google Scholar] [CrossRef]
- Trinks, I.; Neubauuer, W.; Hinterleinter, A. First high-resolution GPR and magnetic archaeological prospection at the Viking Age settlement of Birka in Sweden. Archaeol. Prospect. 2014, 21, 185–199. [Google Scholar] [CrossRef]
- Aspinall, A.; Gaffney, C.; Schmidt, A. Magnetometry for Archaeologists; Altamira Press: Lanham, MD, USA, 2008. [Google Scholar]
- Becker, H. Caesium-magnetometry for landscapearchaeology. In Seeing the Unseen, Geophysics and Landscape Archaeology; Campana, S., Piro, S., Eds.; CRC Press: London, UK, 2009; pp. 129–165. [Google Scholar]
- Berge, M.A.; Drahor, M.G. Electrical resistivity tomography investigations of multilayered archaeological settlements: Part I—Modelling. Archaeol. Prospect. 2011, 18, 159–171. [Google Scholar] [CrossRef]
- Teixidó, T.; Artigot, E.G.; Peña, J.A.; Molina, F.; Nájera, T.; Carrión, F. Geoarchaeological Context of the Motilla de la Vega Site (Spain) Based on Electrical Resistivity Tomography. Archaeol. Prospect. 2013, 20, 11–22. [Google Scholar] [CrossRef]
- Fernández, G.; Teixidó, T.; Peña, J.A.; Burillo, F.; Claros, J. Using shallow geophysical methods to characterise the monumental building at the Segeda I site (Spain). J. Archeol. Sci. Rep. 2015, 2, 427–436. [Google Scholar] [CrossRef]
- Caldeira, B.; Oliveira, R.J.; Teixidó, T.; Borges, J.F.; Heriques, R.; Carneiro, A.; Peña, J.A. Studying the Construction of Floor Mosaics in the Roman Villa of Pisões (Portugal) Using Noninvasive Methods: High-Resolution 3D GPR and Photogrammetry. Remote Sens. 2019, 11, 1182. [Google Scholar] [CrossRef] [Green Version]
- Novo, A.; Leckebusch, J.; Goodman, D.; Morelli, G.; Piro, S.; Catanzariti, G. Advances in GPR imaging with multi-channel radar systems. J. Surv. Mapp. Eng. 2013, 1, 1–6. [Google Scholar] [CrossRef] [Green Version]
- Teixidó, T.; Peña, J.A. The Utility of Geophysical Models in Archaeology: Illustrative Case Studies. In Archeophyhysics, State of the Art and Case Studies; El-Qady, G., Metwaly, M., Eds.; Natural Science in Archaeology; Springer: Cham, Switzerland, 2018; ISBN 978-3-319-78860-9 ISBN 978-3-319-78861-6 (eBook); Available online: http://www.springer.com/series/3703 (accessed on 04 November 2019). [CrossRef]
- Haralick, R.; Sternberg, S.R.; Zhuang, X. Image analysis using mathematical morphology. IEEE Trans. Pattern Anal. Mach. Intell. 1987, 532–550. [Google Scholar] [CrossRef] [PubMed]
- Peña, J.A.; Teixidó, T. Imagemap; Programa de tratamiento de datos procedentes del método de pseudo-gradiente magnético; Internal code of Instituto Andaluz de Geofísica, de la Universidad de Granada, Área de Geofísica Aplicada: Granada, Spain, 2013. [Google Scholar]
- Daniels, D.J. (Ed.) Ground-Penetrating Radar, 2nd ed.; The Institution of Electrical Engineers: London, UK, 2004; p. 726. ISBN 0-86341-360-9. [Google Scholar]
- Dahlin, T.; Zhou, B. Multiple-gradient array measurements for multichannel 2D resistivity imaging. European Association of Geoscientists & Engineers. Near Surf. Geophys. 2006, 4, 113–123. [Google Scholar]
Figure 1.
(a) Location of the Torreparedones Archaeological Site. (b) Archaeological remains in Torreparedones superimposed to Plan Nacional de Ortofotografía Aérea (PNOA) 2018 aerial image. (A) The site houses an Iberian sector located mainly to the south. (B) Roman forum structures located in the center of the site. (C) Remains of a medieval castle in the northern sector. The yellow rectangles indicate the sectors explored with magnetic surveys.
Figure 2.
(a) Original and processed orthophotos of PNOA 2009 showing a footprint compatible with a Roman amphitheater. In the processed map (right), the color scale shows the log values of pixels. (b) Digital terrain model obtained from the PNOA-LiDAR ground reflection. The color scale shows the Z values referenced to the see level. In (b)-right image the elevation (z-axis) is twice the scale of X-Y axes.
Figure 3.
(
a) 1945, (
b) 1956, and (
c) 1973 historical aerial images from IGN. Below (
a), (
b), and (
c), are their respective processed images. All images are georeferenced the same as maps of
Figure 2. The circular footprint is visible in all the images. The arrows indicate possible shepherd settlements that could have affected the Roman structure.
Figure 4.
(a) Representative magnetic acquisition data. (b) Representative processing steps for raw data sector. (Note the low contrast, because the anomalies ranged between ±2 nT/m). Meters are displayed on the left and below each image. Grey scale shows the nanovariations.
Figure 4.
(a) Representative magnetic acquisition data. (b) Representative processing steps for raw data sector. (Note the low contrast, because the anomalies ranged between ±2 nT/m). Meters are displayed on the left and below each image. Grey scale shows the nanovariations.
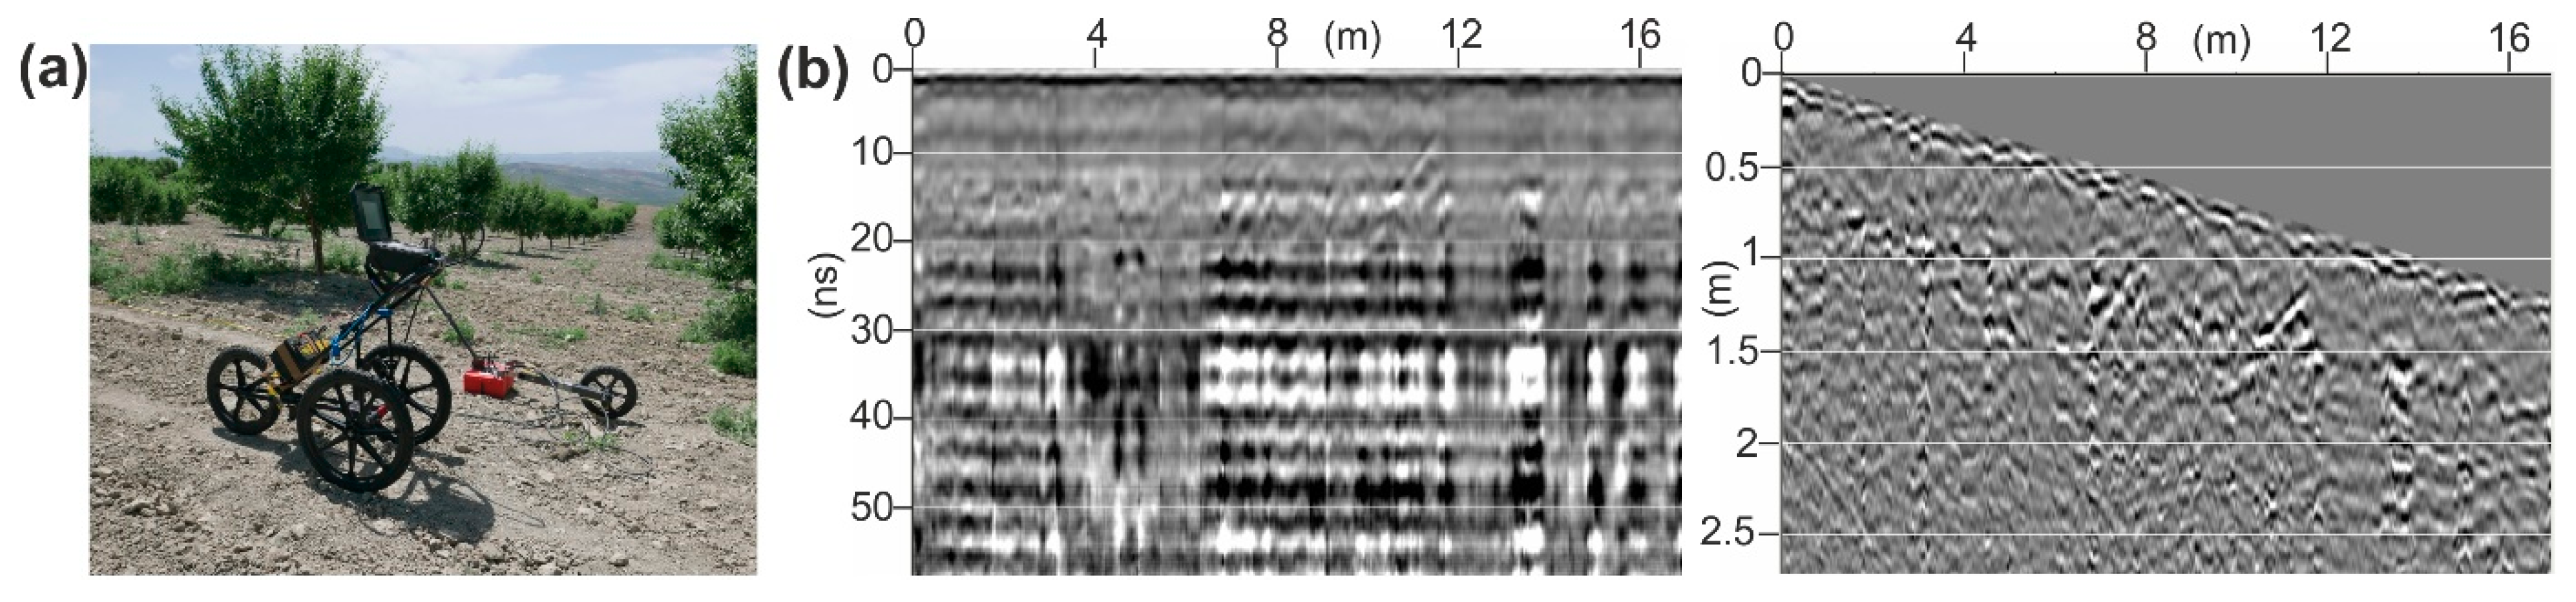
Figure 5.
(a) Ground-penetrating radar (GPR) 400 MHz antenna and the SIR-2000 (GSSI) system. (b) Raw GPR profile and the same GPR profile after applying the flow processing and the topographic correction. Meters are displayed above. Deeps is displayed on the left of each image.
Figure 5.
(a) Ground-penetrating radar (GPR) 400 MHz antenna and the SIR-2000 (GSSI) system. (b) Raw GPR profile and the same GPR profile after applying the flow processing and the topographic correction. Meters are displayed above. Deeps is displayed on the left of each image.
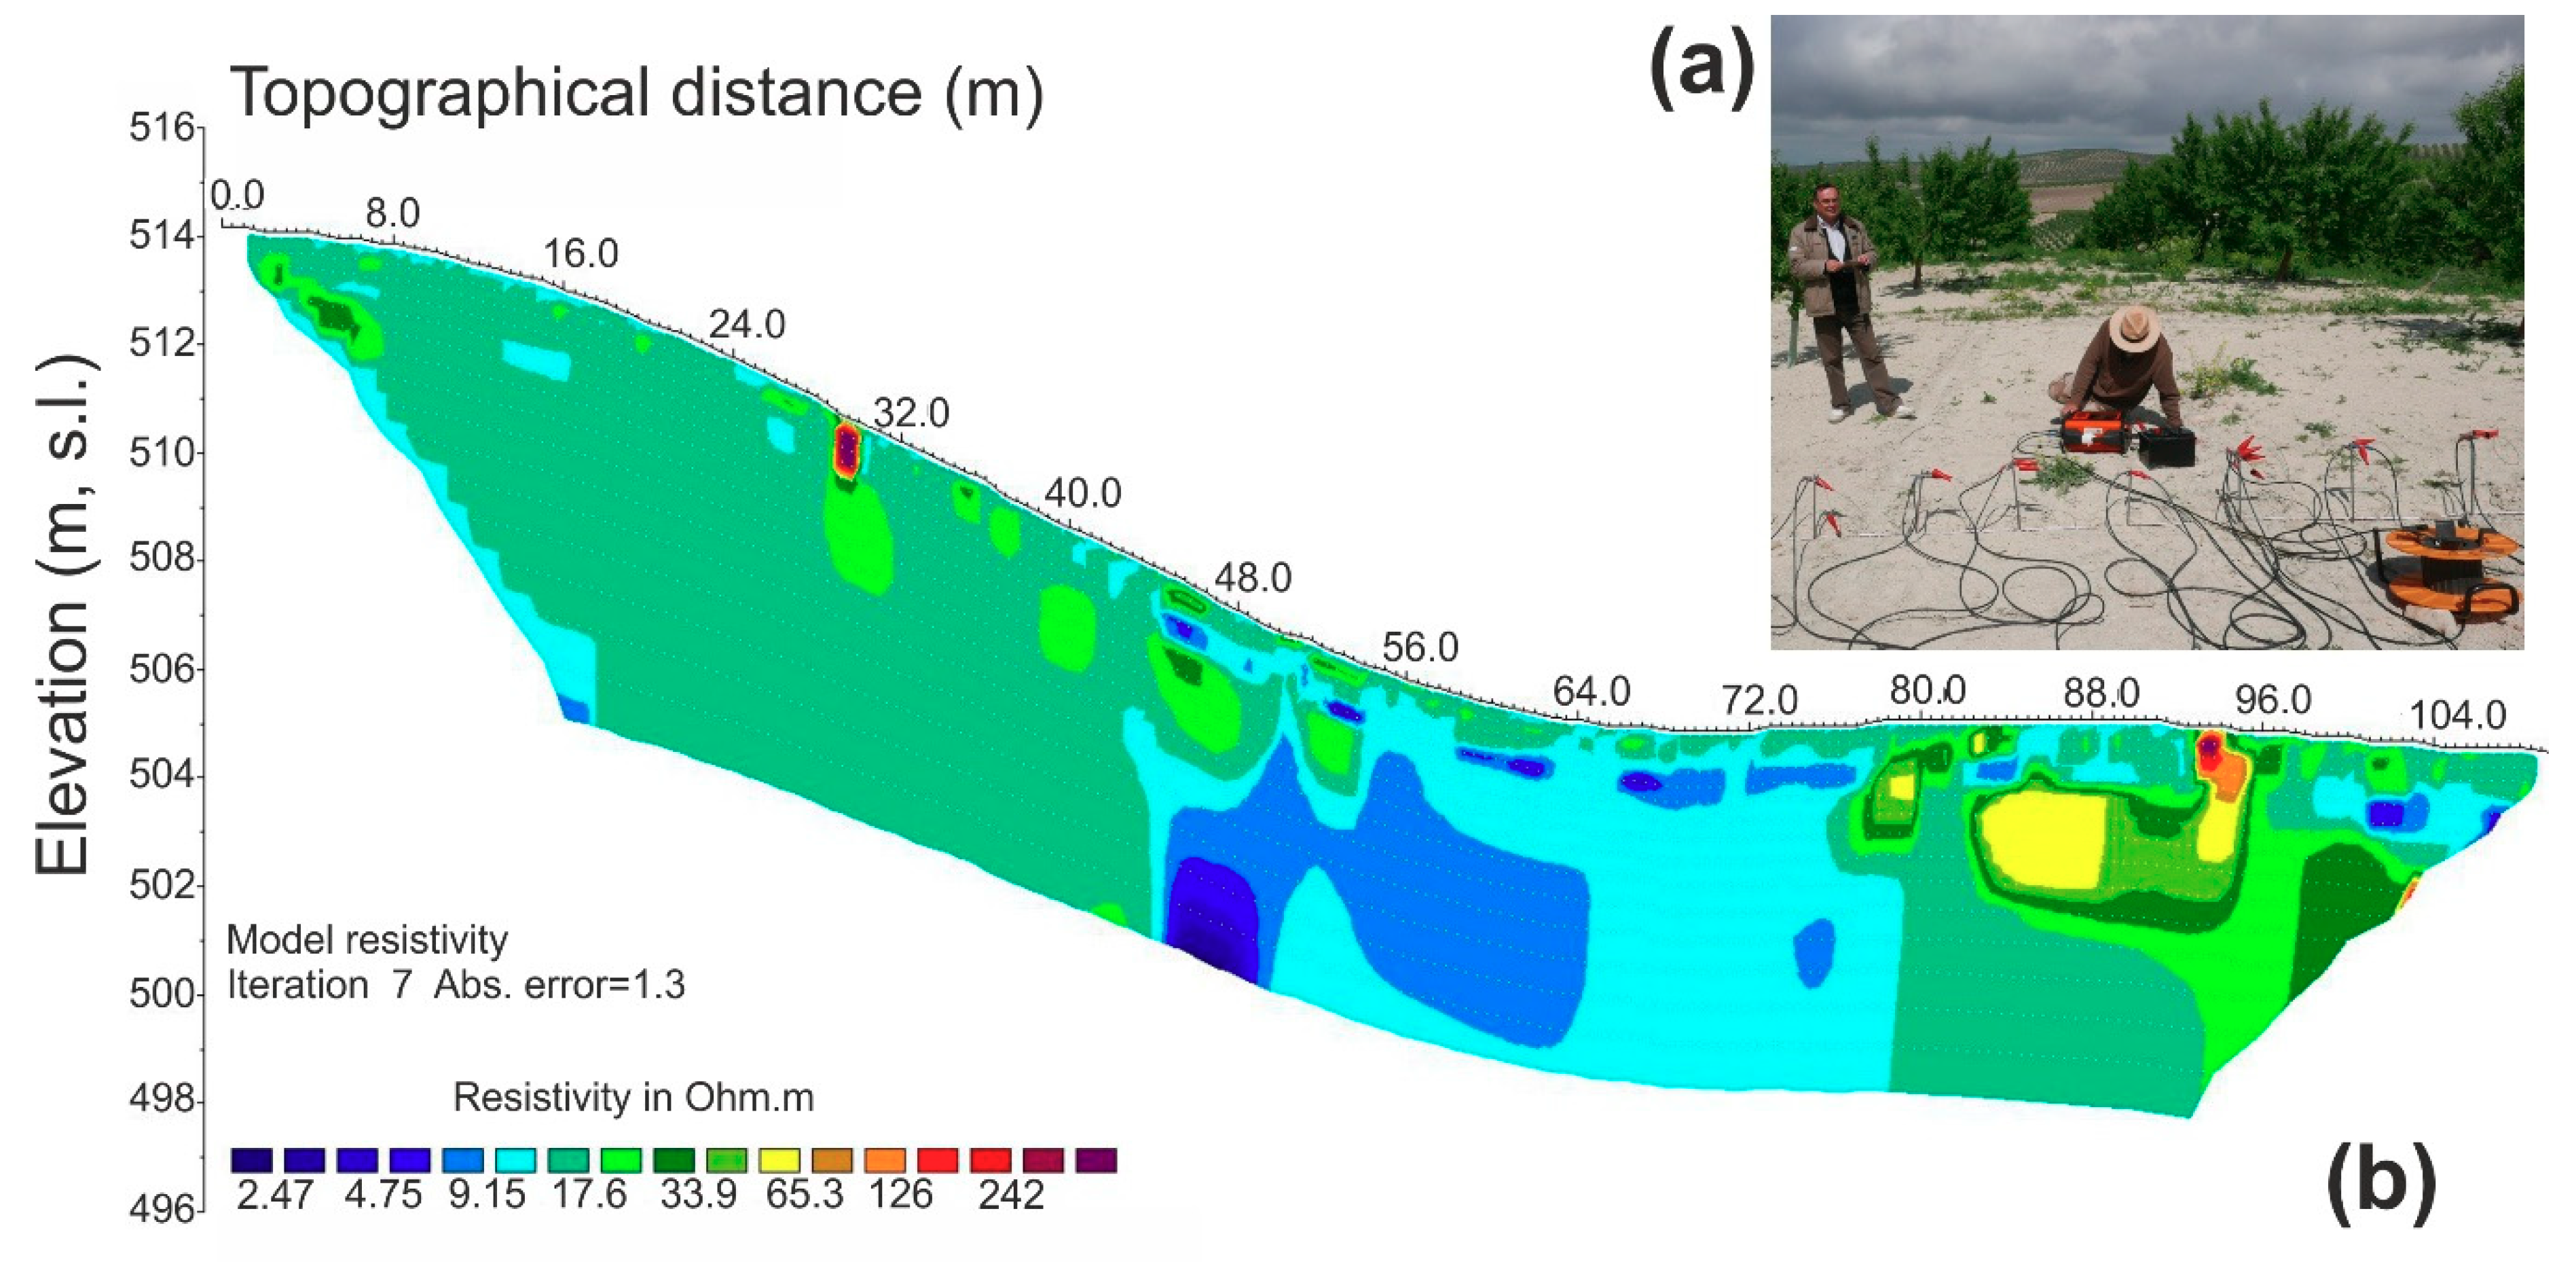
Figure 6.
(a) ABEM resistivity meter and the electrodes set up during the data acquisition. (b) Resistivity model obtained from the inversion process (direct screen output) for the electrical resistivity tomography profile (ERT-1) (see Figure 8). Meters are displayed in the model. The color scale shows the resistivity in Ohm.m.
Figure 7.
Dual views of the same magnetic anomalies map. (a) Map over the orthophoto of PNOA 2009 in the background. (b) The same magnetic map over the orthophoto superimposed on the DTM processed from PNOA-LiDAR data. Anomalies adapt to the relief, revealing a terraced urban development. In both maps the magnetic values scale is ± 2 nT/m.
Figure 8.
The 2D-GPR and 2D-ERT profiles confirmed the remains of the amphitheater and revealed the main inner structures. (a) Shows two GPR and ERT profiles (meters are displayed) crossing the aerial print of PNOA 2009 image (left), and the magnetic anomaly (right) of the amphitheater. (b) Shows the joint interpretation deduced from the information of the models for the NE-SW profile. Note that the elevation scale is twice the local distance scale. Meters are displayed below each image. Meters above sea level (M.a.s.l.) are displayed on the left of each image.
Figure 9.
(a) 2D-ERT profiles superimposed to the aerial orthophoto of PNOA-2009. (b) Oblique perspective of 2D-ERT profiles with the interpretation of the perimeter of the amphitheater.
Figure 9.
(a) 2D-ERT profiles superimposed to the aerial orthophoto of PNOA-2009. (b) Oblique perspective of 2D-ERT profiles with the interpretation of the perimeter of the amphitheater.
Figure 10.
(a) Geomagnetic map overlapped with the GPR and ERT survey profiles. (b) Trenches dug superimposed to geomagnetic map.
Figure 10.
(a) Geomagnetic map overlapped with the GPR and ERT survey profiles. (b) Trenches dug superimposed to geomagnetic map.
Figure 11.
(a) Photogrammetric orthomosaic of trench one dug in 2018. (b) General view of Trench one.
Figure 11.
(a) Photogrammetric orthomosaic of trench one dug in 2018. (b) General view of Trench one.
Figure 12.
(a) Photogrammetric orthomosaic of trenches three and four realized in 2018. (b) General view.
Figure 12.
(a) Photogrammetric orthomosaic of trenches three and four realized in 2018. (b) General view.
Figure 13.
(a) Photogrammetric orthomosaic of trench 5 realized in 2018. (b) General views.
Figure 13.
(a) Photogrammetric orthomosaic of trench 5 realized in 2018. (b) General views.
Figure 14.
(a) Photogrammetric orthomosaic of trench six. (b) Trench six, unit 6012. (c) General view.
Figure 14.
(a) Photogrammetric orthomosaic of trench six. (b) Trench six, unit 6012. (c) General view.
Table 1.
Aerial imagery and light detecting and ranging (LiDAR) data used in this study.
Table 1.
Aerial imagery and light detecting and ranging (LiDAR) data used in this study.
| Images | Ground Resolution (m) | Features | Date | Source |
|---|
| Historical Orthophoto maps | 0.5–1m/pixel | Black and white | 1945
1956
1973 | ©IGN (Instituto Geográfico Nacional) |
| Orthophoto maps | 0.5 m/pixel | Color | 2009
2018 | ©PNOA-IGN(Instituto Geográfico Nacional and Instituto de Estadística y Cartografía de Andalucía) |
| LIDAR | 0.5 points/m2 | Laser points | 2014 | ©PNOA-LiDAR (Instituto Geográfico Nacional) |
Table 2.
Main dimensions detected for the amphitheater (1 Roman foot = 0.2957 m).
Table 2.
Main dimensions detected for the amphitheater (1 Roman foot = 0.2957 m).
| | Length (m) | Roman Feet |
|---|
| Exterior contour | ~70 | 237 |
| Arena contour | ~31 | 105 |
| Width of cavea | ~20 | 67 |
| Main entrance azimuth N 33° E | |
© 2019 by the authors. Licensee MDPI, Basel, Switzerland. This article is an open access article distributed under the terms and conditions of the Creative Commons Attribution (CC BY) license (http://creativecommons.org/licenses/by/4.0/).

 ,
, 


