Ionospheric Peak Parameters Retrieved from FY-3C Radio Occultation: A Statistical Comparison with Measurements from COSMIC RO and Digisondes Over the Globe


Abstract
:
1. Introduction
2. Data and Methods
2.1. RO Data
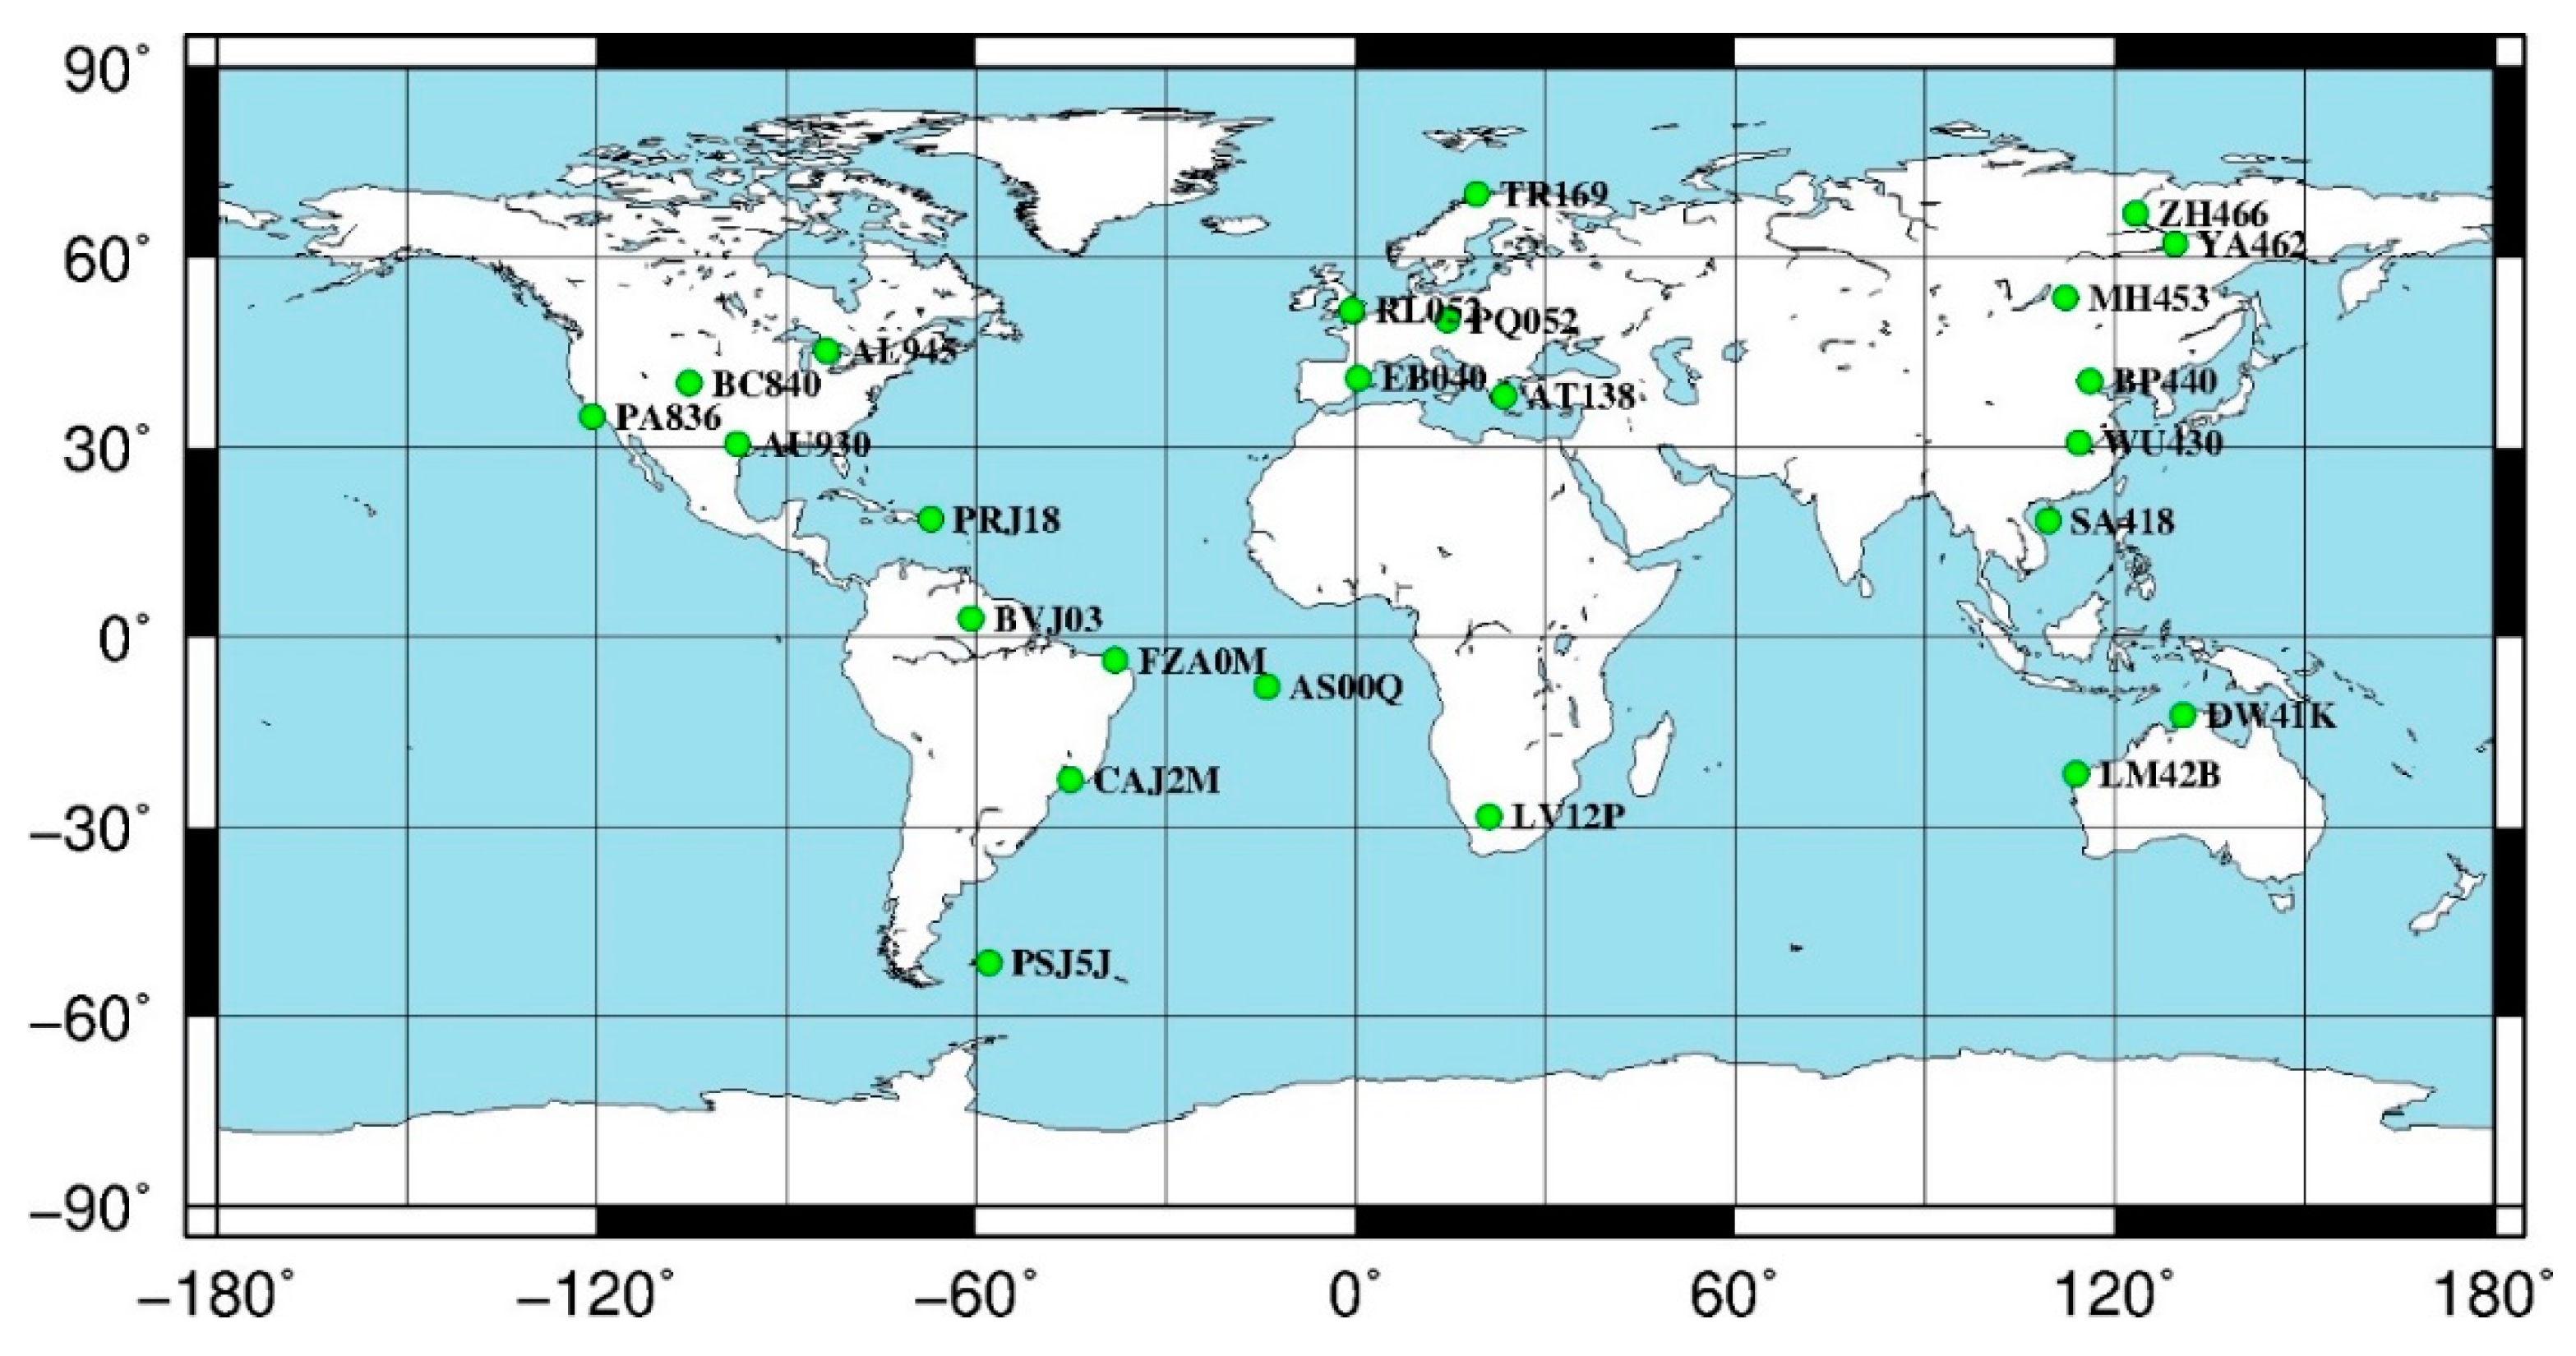
2.2. Digisonde Data
2.3. Statistical Method
3. Results and Analyses
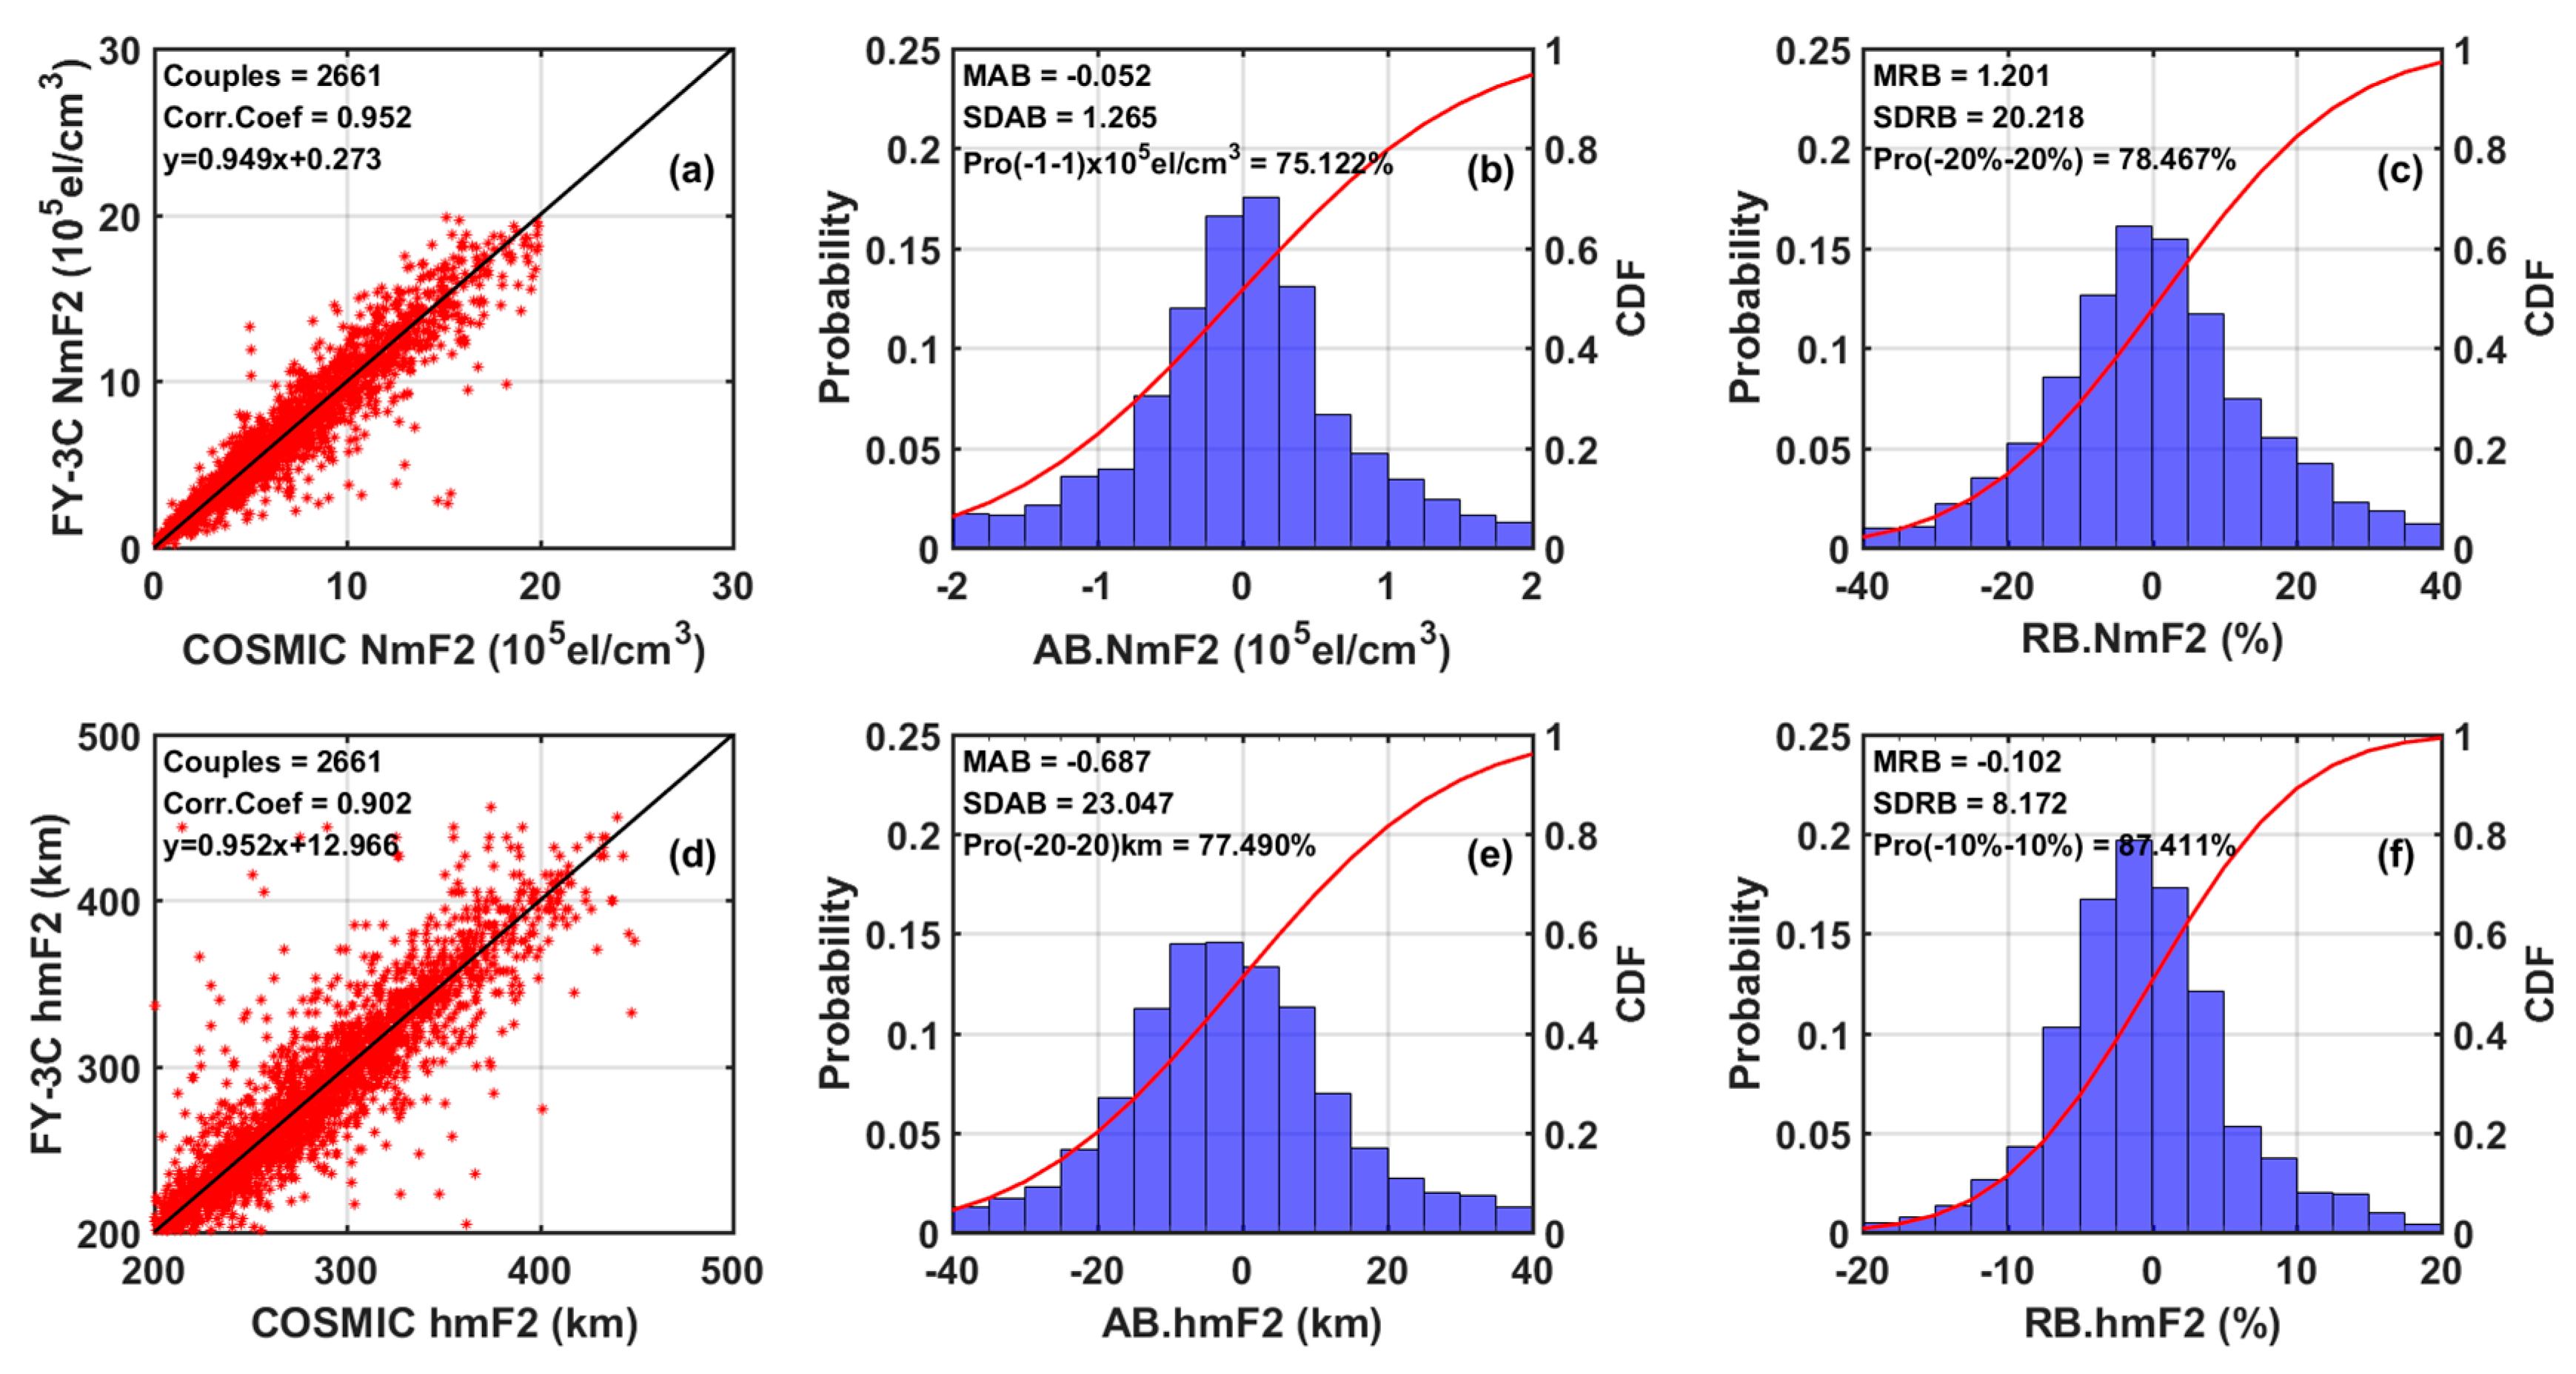
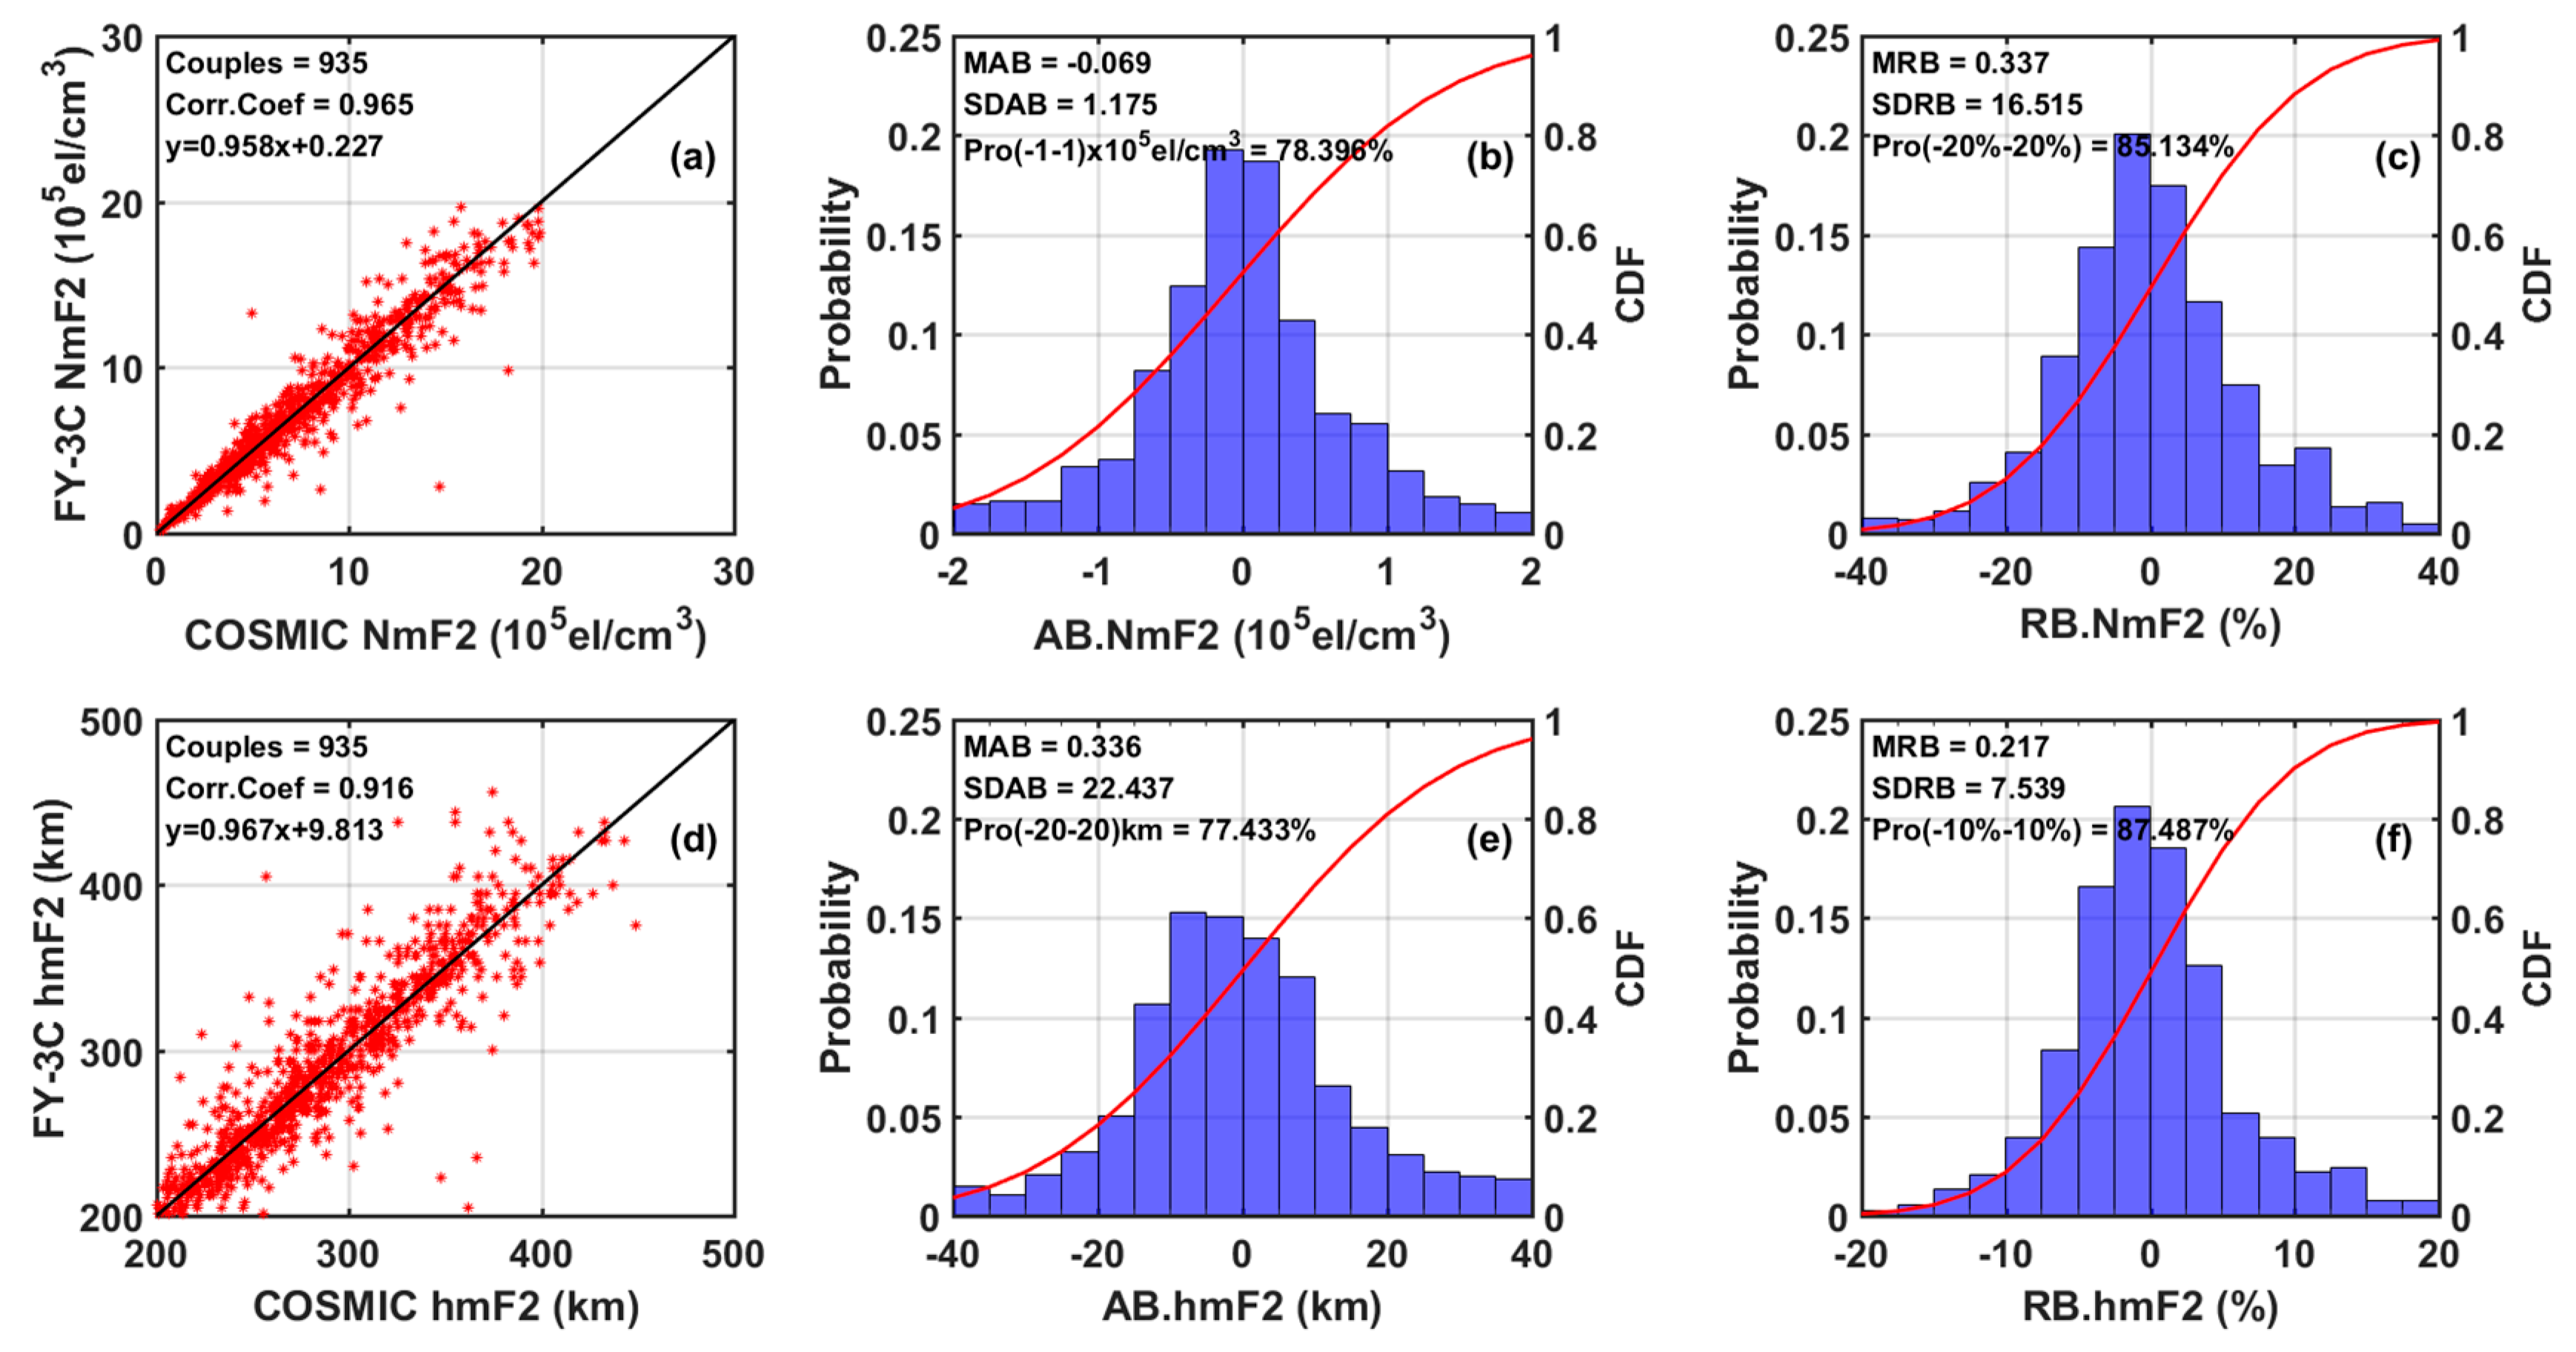
3.1. The Correlations and Biases between the ICPs Derived from FY-3C RO and Other Observations
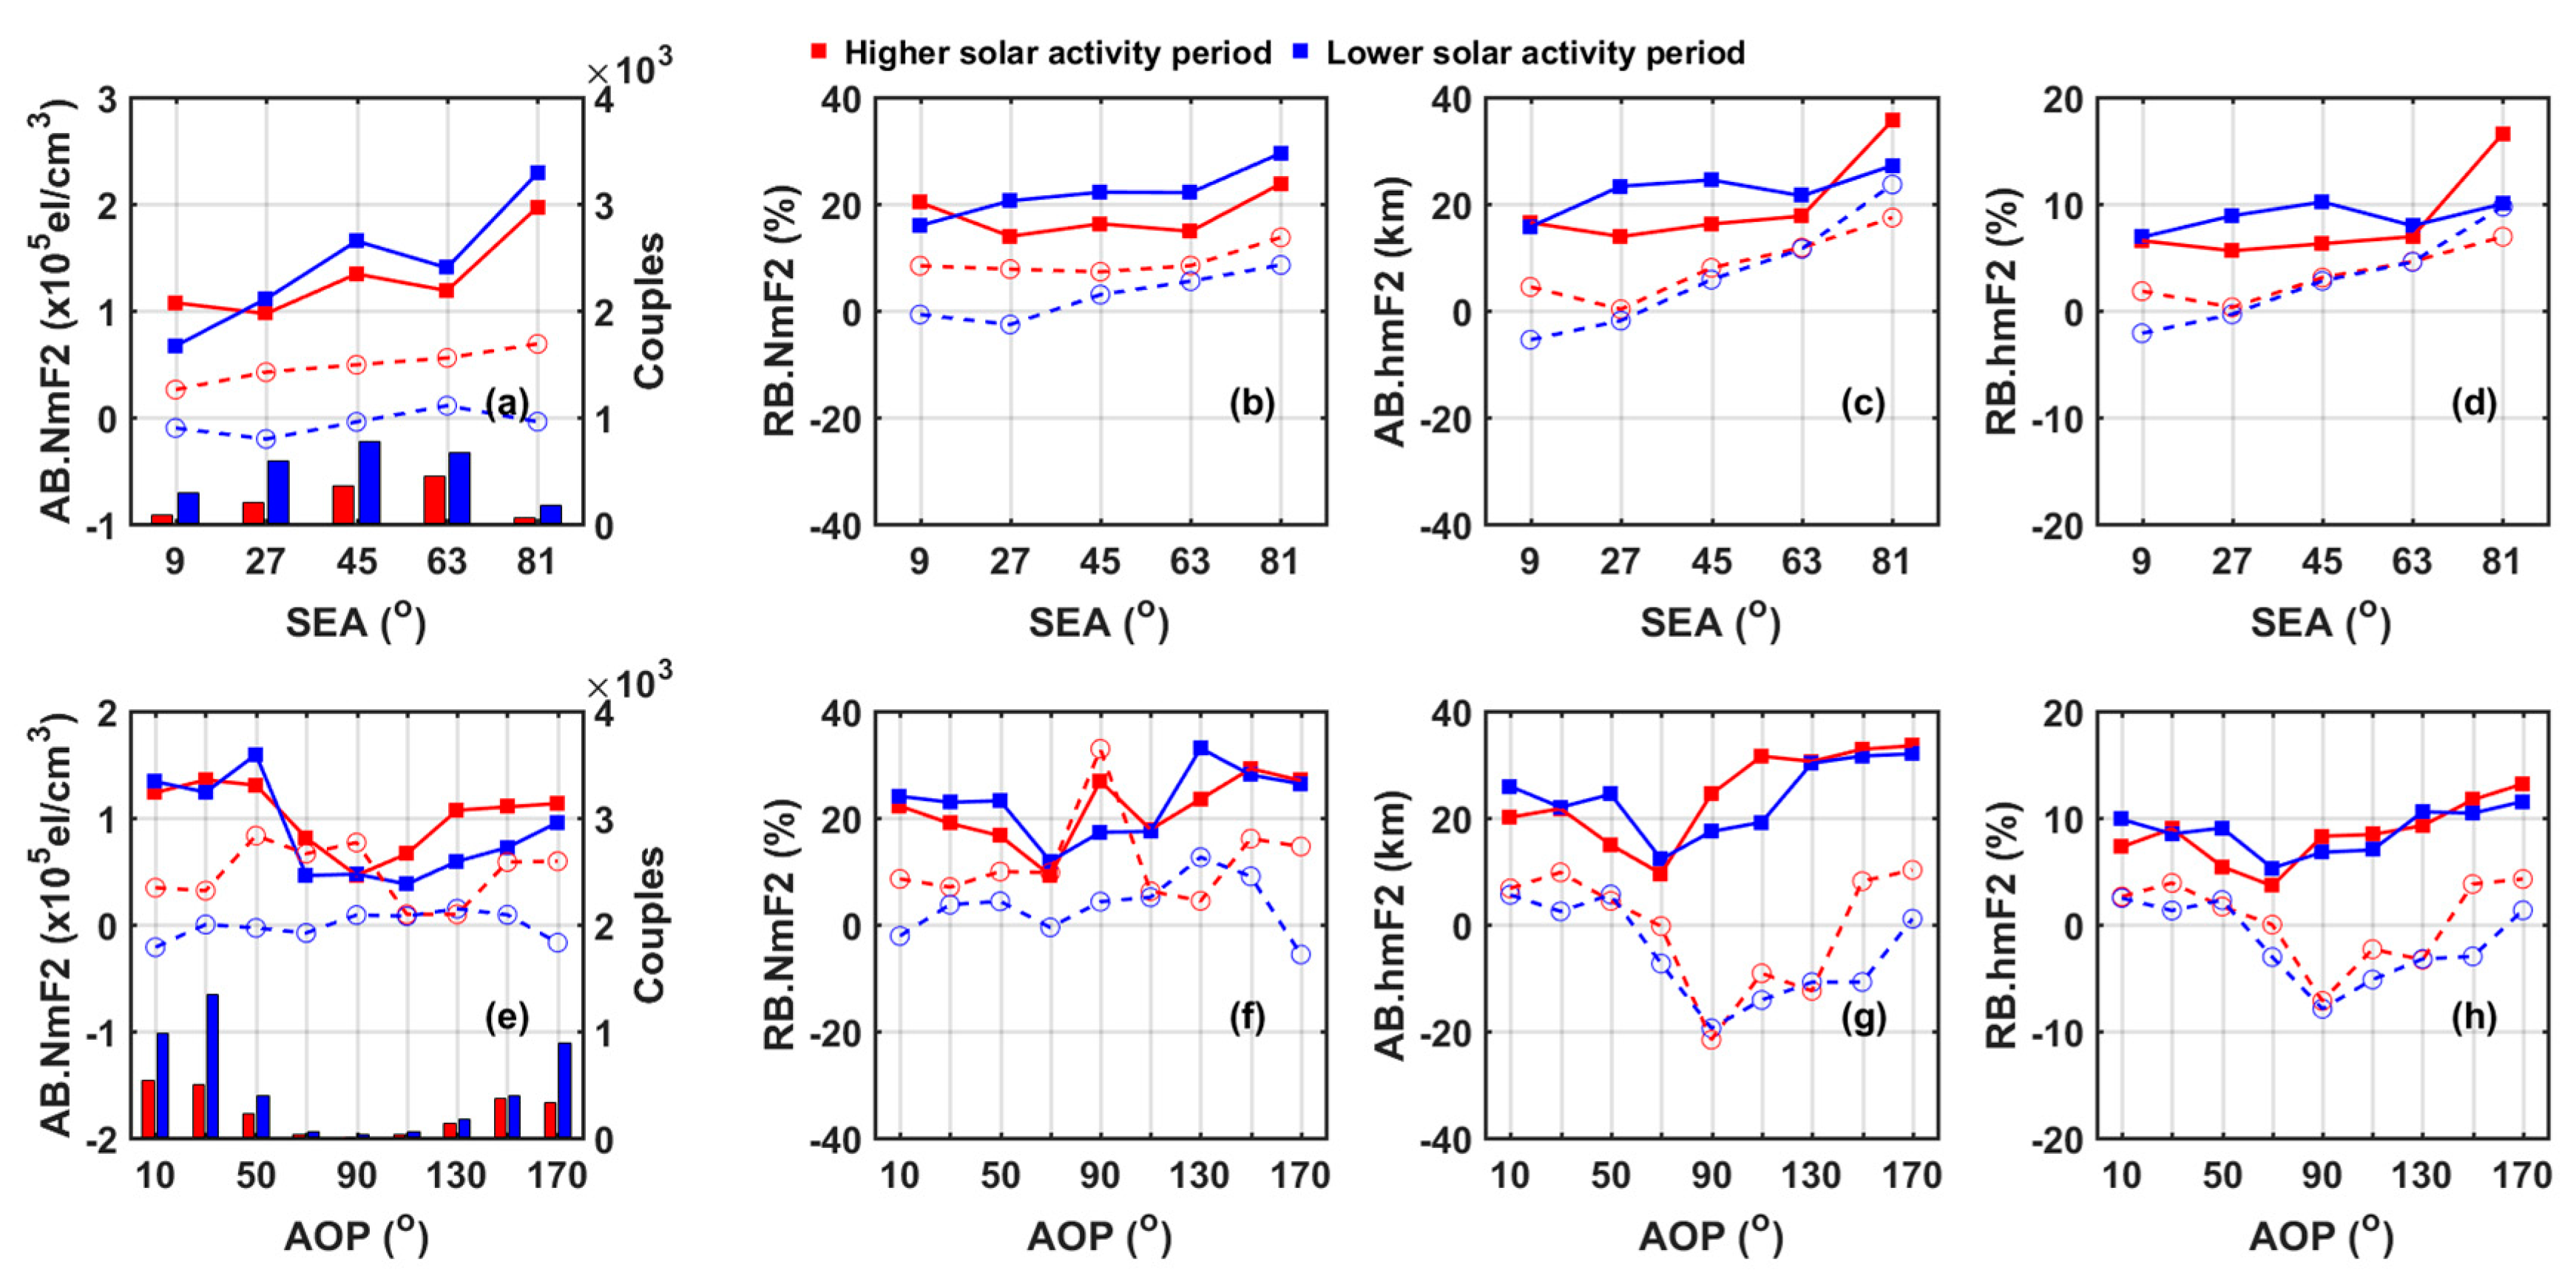
3.2. The Variation of the Quality of FY-3C RO-Derived ICPs with SEAs and AOPs in Different Solar Activity Periods
4. Discussion
5. Conclusions
- (1)
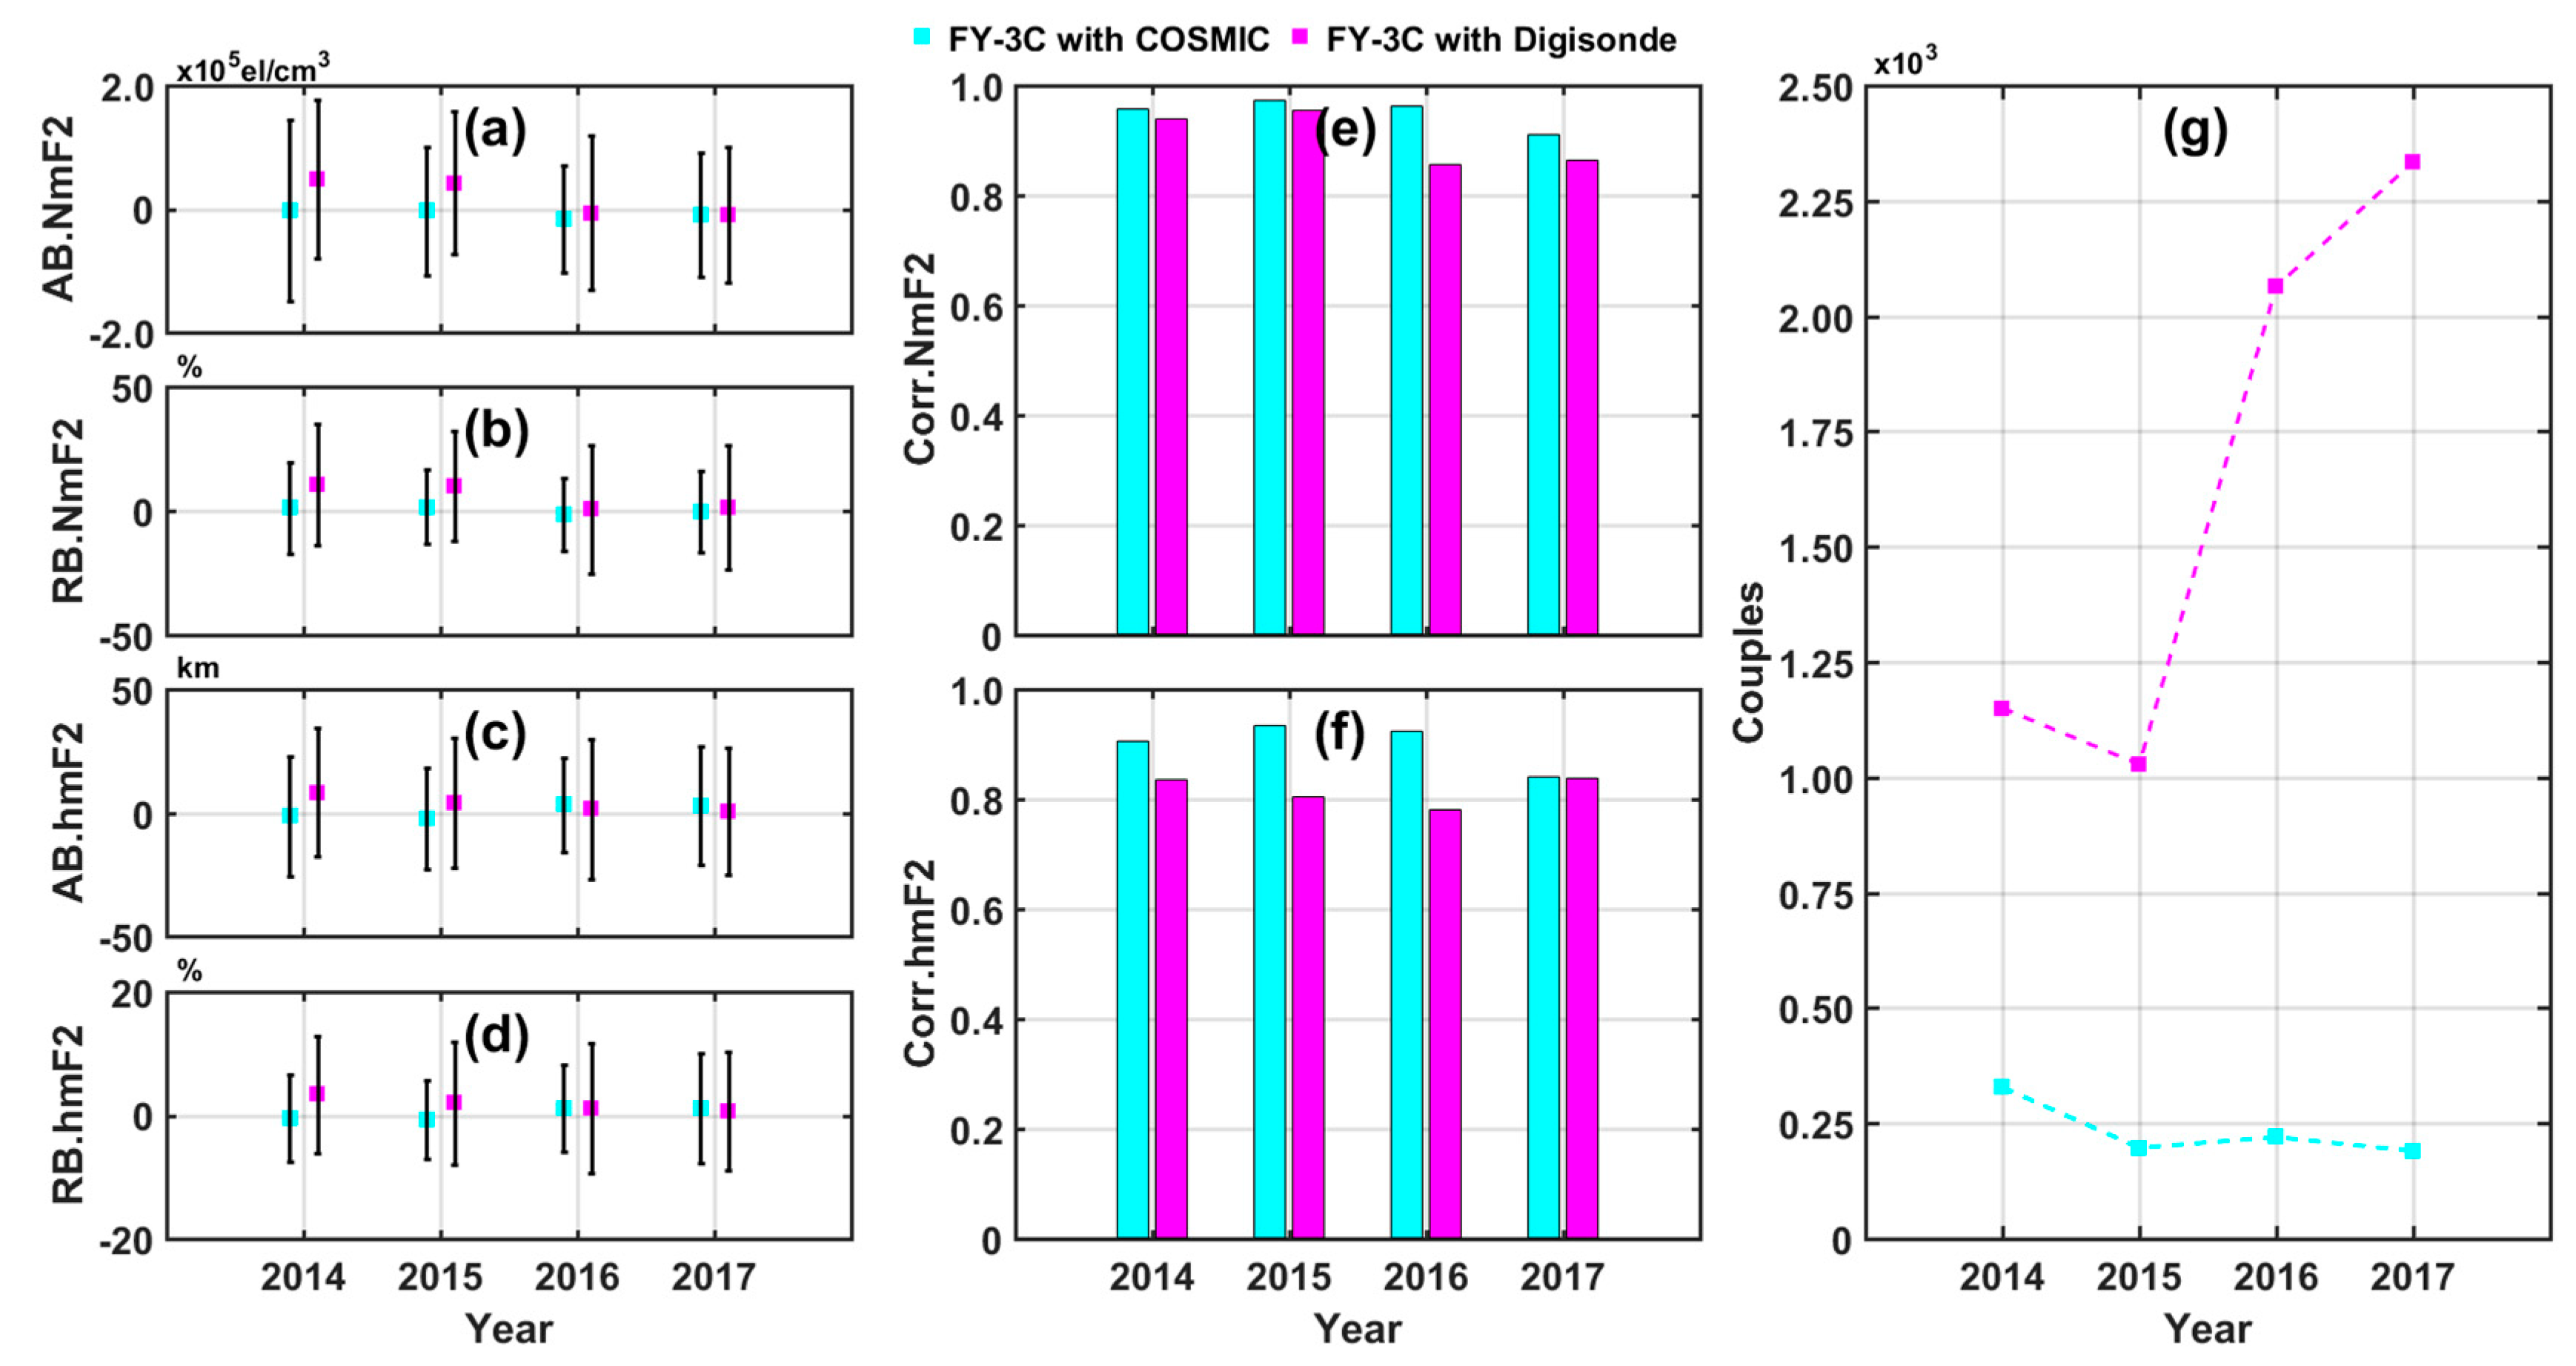
- There was good agreement between the ICPs derived from FY-3C RO and those provided by other observations (COSMIC RO and digisonde). Specifically, the CC (MAB and MRB) of the ICPs derived from FY-3C RO and those from other observations were all of high (low) values in each year from 2014 to 2017 and for the whole time period. It is convincing that the ionospheric products provided by FY-3C RO were reliable enough for further ionospheric and geophysical applications.
- (2)
- The CC of NmF2 was, in general, higher than that of hmF2 when comparing FY-3C RO with other observations, and the MAB and MRB of FY-3C RO-derived ICPs compared with other observations were generally higher during the higher solar activity period than those during the low solar activity period. It is noteworthy that the differences between the two RO missions were smaller than the differences between FY-3C RO and digisondes.
- (3)
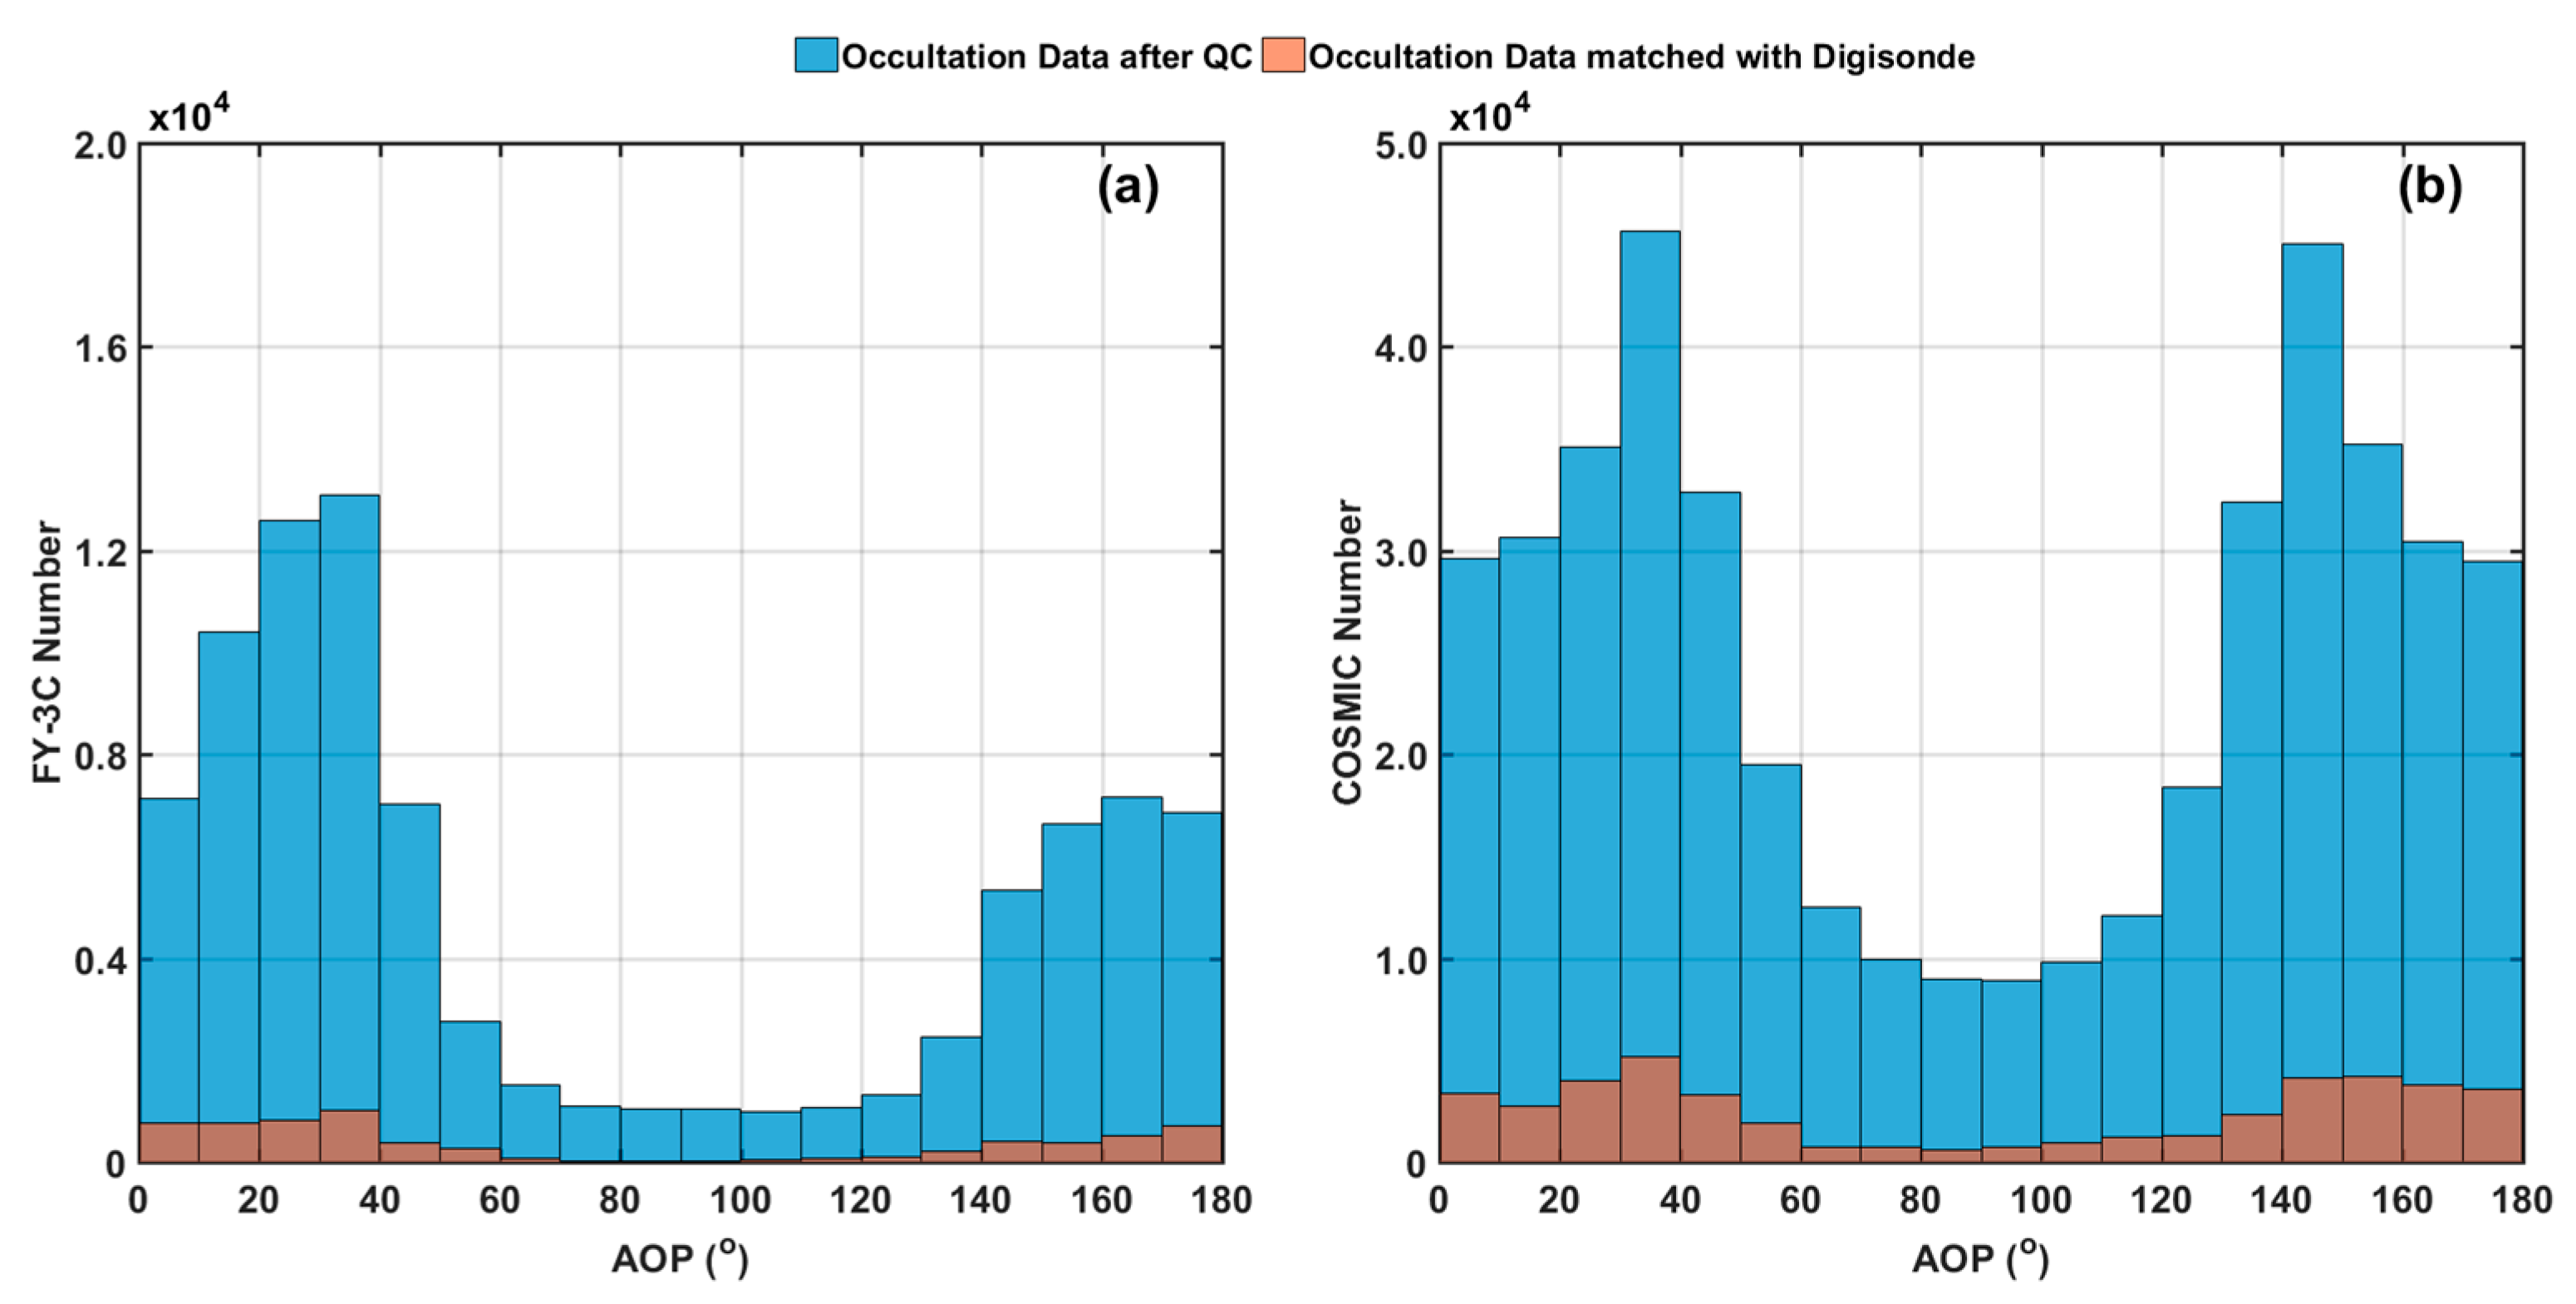
- The AOP plays an essential role in the quality analysis of RO-derived ICPs. It was found that, in general, the SDAB and SDRB of RO-derived ICPs both get the minimum values when the AOP was near to 90°, specifically, for the AOP interval of [60°, 120°].
- (4)
- In a certain solar activity period, the SDAB and SDRB of RO-derived ICPs compared with the digisonde-derived ICPs generally increased with the increase of SEA, and the quality of RO-derived ICPs was the worst when SEA reached the maximum. When analyzing the quality of the ionospheric products derived from RO, it is meaningful to use SEA as a new impact factor, which reflects the integrated influence of the three traditionally used factors including latitude, season, and local time.
Author Contributions
Funding
Conflicts of Interest
References
- Kursinski, E.R.; Hajj, G.A.; Schofield, J.T.; Linfield, R.P. Observing Earth’s atmosphere with radio occultation measurements using the global positioning system. J. Geophys. Res. Biogeosci. 1997, 102, 23429–23465. [Google Scholar] [CrossRef]
- Hajj, G.A.; Kursinski, E.R.; Romans, L.J.; Bertiger, W.I.; Leroy, S.S. Technical description of atmospheric sounding by GPS occultation. J. Atmos. Sol. Terr. Phys. 2002, 64, 451–469. [Google Scholar] [CrossRef]
- Anthes, R.A. Exploring Earth’ atomosphere with radio occultation: Contributions to weather, climate and space weather. Atmos. Meas. Tech. 2011, 4, 1077–1103. [Google Scholar] [CrossRef]
- Hajj, G.A.; Romans, L.J. Ionospheric electron density profiles obtained with the Global Positioning System: Results from the GPS/MET experiment. Radio Sci. 1998, 33, 175–190. [Google Scholar] [CrossRef] [Green Version]
- Schreiner, W.S.; Sokolovskiy, S.V.; Rocken, C.; Hunt, D.C. Analysis and validation of GPS/MET radio occultation data in the ionosphere. Radio Sci. 1999, 34, 949–966. [Google Scholar] [CrossRef]
- Yue, X.; Schreiner, W.S.; Pedatella, N.; Anthes, R.A.; Mannucci, A.J.; Straus, P.R.; Liu, J.Y. Space Weather Observations by GNSS Radio Occultation: From FORMOSAT-3/COSMIC to FORMOSAT-7/COSMIC-2. Space Weather 2014, 12, 616–621. [Google Scholar] [CrossRef]
- Wickert, J.; Reigber, C.; Beyerle, G.; König, R.; Marquardt, C.; Schmidt, T.; Grunwaldt, L.; Galas, R.; Meehan, T.K.; Melbourne, W.G.; et al. Atmosphere sounding by GPS radio occultation: First results from CHAMP. Geophys. Res. Lett. 2001, 28, 3263–3266. [Google Scholar] [CrossRef] [Green Version]
- Beyerle, G.; Wickert, J.; Schmidt, T.; Reigber, C. GPS radio occultation with GRACE: Atmospheric profiling utilizing the zero difference technique. Geophys. Res. Lett. 2005, 32, L13806. [Google Scholar] [CrossRef]
- Anthes, R.A.; Ector, D.; Hunt, D.C.; Kuo, Y.-H.; Rocken, C.; Schreiner, W.S.; Sokolovskiy, V.S.; Syndergaard, S.; Wee, T.K.; Zeng, Z. The COSMIC/FORMOSAT-3 mission: Early results. Bull. Am. Meteorol. Soc. 2008, 89, 313–333. [Google Scholar] [CrossRef]
- Rapp, M.; Dörnbrack, A.; Kaifler, B. An intercomparison of stratospheric gravity wave potential energy densities from METOP GPS radio occultation measurements and ECMWF model data. Atmos. Meas. Tech. 2018, 11, 1031–1048. [Google Scholar] [CrossRef] [Green Version]
- Bi, Y.; Yang, Z.; Zhang, P.; Sun, Y.; Bai, W.; Du, Q.; Yang, G.; Chen, J.; Liao, M. An introduction to China FY3 radio occultation mission and its measurement simulation. Adv. Space Res. 2012, 49, 1191–1197. [Google Scholar] [CrossRef]
- Mao, T.; Sun, L.; Yang, G.; Yue, X.; Yu, T.; Huang, C.; Zeng, Z.; Wang, Y.; Wang, J. First Ionospheric Radio-Occultation Measurements From GNSS Occultation Sounder on the Chinese Feng-Yun 3C Satellite. IEEE Trans. Geosci. Remote Sens. 2016, 54, 5044–5053. [Google Scholar] [CrossRef]
- Brahmanandam, P.S.; Uma, G.; Liu, J.Y.; Chu, Y.H.; Latha Devi, N.S.M.P.; Kakinami, Y. Global S4 index variations observed using FORMOSAT-3/COSMIC GPS RO technique during a solar minimum year. J. Geophys. Res. 2012, 117, A09322. [Google Scholar] [CrossRef]
- Straus, P. Ionospheric climatology derived from gps occultation observations made by the ionospheric occultation experiment. GPS Solut. 2005, 9, 164–173. [Google Scholar] [CrossRef]
- Arras, C.; Wickert, J.; Jacobi, C.; Heise, S.; Beyerle, G.; Schmidt, T. A global climatology of ionospheric irregularities derived from GPS radio occultation. Geophys. Res. Lett. 2008, 35, L14809. [Google Scholar] [CrossRef]
- Watson, C.; Pedatella, N.M. Climatology and characteristics of medium-scale F region ionospheric plasma irregularities observed by COSMIC radio occultation receivers. J. Geophys. Res. Space Phys. 2018, 123, 8610–8630. [Google Scholar] [CrossRef]
- Bai, W.H.; Sun, Y.Q.; Du, Q.F.; Yang, G.L.; Yang, Z.D.; Zhang, P.; Bi, Y.M.; Wang, X.Y.; Cheng, C.; Han, Y. An introduction to the FY3 GNOS instrument and mountain-top tests. Atmos. Meas. Tech. 2014, 7, 1817–1823. [Google Scholar] [CrossRef] [Green Version]
- Zeng, T.; Sui, L.F.; Jia, X.L. Results and Analysis of BDS Precise Orbit Determination with the Enhancement of Fengyun-3C. Acta Geod. Cartogr. Sin. 2017, 59, 419–425. [Google Scholar]
- Yang, G.L.; Sun, Y.Q.; Bai, W.H.; Zhang, X.X.; Liu, C.L.; Meng, X.G.; Bi, Y.M.; Wang, D.W.; Zhao, D.Y. Validation results of NmF2 and hmF2 derived from ionospheric density profiles of GNOS on FY-3C satellite. Sci. China Technol. Sci. 2018, 61, 1372–1383. [Google Scholar] [CrossRef]
- Huang, X.; Reinisch, B.W. Vertical electron density profiles from the Digisonde network. Adv. Space Res. 1996, 18, 121–129. [Google Scholar] [CrossRef]
- Reinisch, B.W.; Huang, X.; Galkin, I.A.; Paznukhov, V.; Kozlov, A. Recent advances in real-time analysis of ionograms and ionospheric drift measurements with digisondes. J. Atmos. Sol. Terr. Phys. 2005, 67, 1054–1062. [Google Scholar] [CrossRef]
- Reinisch, B.W.; Galkin, I.A.; Khmyrov, G.M.; Kozlov, A.V.; Bibl, K.; Lisysyan, I.A.; Cheney, G.P.; Huang, X.; Kitrosser, D.F.; Paznukhov, V.V.; et al. New Digisonde for research and monitoring applications. Radio Sci. 2009, 44, RS0A24. [Google Scholar] [CrossRef]
- Yue, X.A.; Schreiner, W.S.; Lei, J.H.; Sokolovskiy, S.V.; Rocken, C.; Hunt, D.C.; Kuo, Y.H. Error analysis of Abel retrieved electron density profiles from radio occulation measurements. Ann. Geophys. 2010, 28, 217–222. [Google Scholar] [CrossRef]
- Shaikh, M.; Notarpietro, R.; Nava, B. The impact of spherical symmetry assumption on radio occultation data inversion in the ionosphere: An assessment study. Adv. Space Res. 2014, 53, 599–608. [Google Scholar] [CrossRef]
- Pedatella, N.M.; Yue, X.; Schreiner, W.S. An improved inversion for FORMOSAT-3/COSMIC ionosphere electron density profiles. J. Geophys. Res. Space Phys. 2015, 120, 8942–8953. [Google Scholar] [CrossRef]
- Yang, J.J.; Huang, J.; Xu, J.; Deng, B.C.; Quan, H.J. Study of Sporadic E Layers Based on Occultation Data Observed by FY-3C Satellite. Space Sci. 2016, 36, 305–311. (In Chinese) [Google Scholar]
- Reinisch, B.W.; Cooke, D.L.; McNamara, L.F.; Valladares, C.E. Comparison of CHAMP and Digisonde plasma frequencies at Jicamarca, Peru. Radio Sci. 2007, 42, RS2005.1–RS2005.14. [Google Scholar]
- Chu, Y.H.; Su, C.L.; Ko, H.T. A global survey of COSMIC ionospheric peak electron density and its height: A comparison with ground-based ionosonde measurements. Adv. Space Res. 2010, 46, 431–439. [Google Scholar] [CrossRef]
- Ely, C.V.; Batista, I.S.; Abdu, M.A. Radio occultation electron density profiles from the FORMOSAT-3/COSMIC satellites over the Brazilian region: A comparison with Digisonde data. Adv. Space Res. 2012, 49, 1553–1562. [Google Scholar] [CrossRef]
- Hu, L.; Ning, B.; Liu, L.; Zhao, B.; Li, G.; Wu, B.; Huang, Z.; Hao, X.; Chang, S.; Wu, Z. Validation of COSMIC ionospheric peak parameters by the measurements of an ionosonde chain in China. Ann. Geophys. 2014, 32, 1311–1319. [Google Scholar] [CrossRef] [Green Version]
- Luo, J.; Sun, F.F.; Xu, X.H.; Wang, H. Ionospheric F2-Layer critical frequency retrieved from COSMIC radio occultation: A statistical comparison with measurements from a meridional ionosonde chain over Southeast Asia. Adv. Space Res. 2019, 63, 327–336. [Google Scholar] [CrossRef]
- Wu, X.; Hu, X.; Gong, X.; Zhang, X.; Wang, X. Analysis of inversion errors of ionospheric radio occultation. GPS Solut. 2009, 13, 231–239. [Google Scholar] [CrossRef]
- Hernandez-Pajares, M.; Juan, J.M.; Sanz, J. Improving the Abel inversion by adding ground GPS data to LEO radio occultations in ionospheric sounding. Geophys. Res. Lett. 2000, 27, 2473–2476. [Google Scholar] [CrossRef] [Green Version]
- Garcia-Fernandez, M.; Hernandez-Pajares, M.; Juan, J.M.; Sanz, J. Improvement of ionospheric electron density estimation with GPSMET occultations using Abel inversion and VTEC information. J. Geophys. Res. 2003, 108, 1338. [Google Scholar] [CrossRef]
- Garcia-Fernandez, M.; Hernandez-Pajares, M.; Juan, J.M.; Sanz, J. Performance of the improved Abel transform to estimate electron density profiles from GPS Occultation data. GPS Solut. 2005, 9, 105–110. [Google Scholar] [CrossRef]
- Lei, J.H.; Syndergaard, S.; Burns, A.G.; Solomon, S.C.; Wang, W.B.; Zeng, Z.; Roble, R.G.; Wu, Q.; Kuo, Y.H.; Holt, J.M.; et al. Comparison of COSMIC ionospheric measurements with ground-based observations and model predictions: Preliminary results. J. Geophys. Res. 2007, 112, A07308. [Google Scholar] [CrossRef]
- Yang, K.F.; Chu, Y.H.; Su, C.L.; Ko, H.T.; Wang, C.Y. An examination of FORMOSAT-3/COSMIC ionospheric electron density profile: Data quality criteria and comparisons with the IRI model. Terr. Atmos. Ocean. Sci. 2009, 20, 193–206. [Google Scholar] [CrossRef]
- Uma, G.; Brahmanandam, P.S.; Chu, Y.H. A long-term study on the deletion criterion of questionable electron density profiles caused by ionospheric irregularities-COSMIC radio occulation technique. J. Space Res. 2016, 57, 2452–2463. [Google Scholar] [CrossRef]
- Guo, P.; Xu, X.; Zhang, G.X. Analysis of the ionospheric equivalent slab thickness based on ground-based GPS-TEC and GPS/COSMIC RO measurement. J. Atmos. Sol.-Terr. Phys. 2011, 73, 839–846. [Google Scholar] [CrossRef]
- Luo, J.; Wang, H.; Xu, X.; Sun, F.F. The influence of the spatial and temporal collocation windows on the comparisons of the ionospheric characteristic parameters derived from COSMIC Radio Occultation and Digisondes. Adv. Space Res. 2019, 63, 3088–3101. [Google Scholar] [CrossRef]
- Kumar, S.; Singh, R.P.; Tan, E.L.; Singh, A.K.; Ghodpage, R.N.; Siingh, D. Temporal and spatial deviation in F-2 peak parameters derived from FORMOSAT-3/COSMIC. Space Weather 2016, 14, 391–405. [Google Scholar] [CrossRef]
- Galkin, I.A.; Reinisch, B.W.; Huang, X.; Khmyrov, G.M. Confidence score of ARTIST-5 ionogram autoscaling. In INAG Technical Memorandum; 25 November 2013; pp. 1–7. Available online: http://www.ursi.org/files/CommissionWebsites/INAG/web-73/confidence_score.pdf (accessed on 1 March 2014).
- McNamara, L.F.; Thompson, D.C. Validation of COSMIC values of foF2 and M(3000)F2 using ground-based ionosondes. Adv. Space Res. 2015, 55, 163–169. [Google Scholar] [CrossRef]
- McNamara, L.F.; Wilkinson, P.J. Spatial correlations of foF2 deviations and their implications for global ionospheric models: 1. Ionosondes in Australia and Papua New Guinea. Radio Sci. 2009, 44, RS2016. [Google Scholar] [CrossRef]
- Huang, Z.; Yuan, H. An analysis of ionospheric characteristic parameters retrieved from COSMIC and IRI at Jicamarca during the period of 2007-2013. Chin. J. Geophys. 2016, 59, 2333–2343. (In Chinese) [Google Scholar]
- Sun, B.; Reale, A.; Seidel, D.J.; Hunt, D.C. Comparing radiosonde and COSMIC atmospheric profile data to quantify differences among radiosonde types and the effects of imperfect collocation on comparison statistics. J. Geophys. Res. 2010, 115, D23104. [Google Scholar] [CrossRef]
- Xu, G.R.; Wan, W.X.; Ning, B.Q. Applying partial correlation method to analyzing the correlation between ionospheric NmF2 and height of isobaric level in the lower atmosphere. Chin. Sci. Bull. 2007, 52, 2413–2419. [Google Scholar] [CrossRef]
- Sun, L.F.; Zhao, B.Q.; Yue, X.A.; Mao, T. Comparison between ionospheric character parameters retrieved from FORMOSAT3 measurement and ionosonde observation over China. Chin. J. Geophys. 2014, 57, 3625–3632. (In Chinese) [Google Scholar]


| Quality Control Parameter | Formula or Sources | Qualified Condition | Note |
|---|---|---|---|
| Given in the EDP files | |||
| Given in the EDP files |
| Collocation Criteria | FY-3C RO and COSMIC RO | FY-3C RO and Digisonde | |
|---|---|---|---|
| Number of Pairs | 2661 | 935 | 6576 |
| CC of NmF2 | 0.952 | 0.965 | 0.924 |
| MAB of NmF2 () | –0.052 | –0.069 | 0.100 |
| MRB of NmF2 (%) | 1.201 | 0.337 | 4.102 |
| SDAB of NmF2 () | 1.265 | 1.175 | 1.218 |
| SDRB of NmF2 (%) | 20.218 | 16.515 | 25.065 |
| CC of hmF2 | 0.902 | 0.916 | 0.832 |
| MAB of hmF2 (km) | –0.687 | 0.336 | 2.734 |
| MRB of hmF2 (%) | –0.102 | 0.217 | 1.515 |
| SDAB of hmF2 (km) | 23.047 | 22.437 | 26.931 |
| SDRB of NmF2 (%) | 8.172 | 7.539 | 9.910 |
| ROC of | ||||
|---|---|---|---|---|
| SDAB.NmF2 (× 105 el/cm3/°) | SDRB.NmF2 (%/°) | SDAB.hmF2 (km/°) | SDRB.hmF2 (%/°) | |
| Higher solar activity period | 0.806 | 0.305 | 0.752 | 0.734 |
| Lower solar activity period | 0.921 | 0.930 | 0.779 | 0.604 |
© 2019 by the authors. Licensee MDPI, Basel, Switzerland. This article is an open access article distributed under the terms and conditions of the Creative Commons Attribution (CC BY) license (http://creativecommons.org/licenses/by/4.0/).
Share and Cite
Wang, H.; Luo, J.; Xu, X. Ionospheric Peak Parameters Retrieved from FY-3C Radio Occultation: A Statistical Comparison with Measurements from COSMIC RO and Digisondes Over the Globe. Remote Sens. 2019, 11, 1419. https://doi.org/10.3390/rs11121419
Wang H, Luo J, Xu X. Ionospheric Peak Parameters Retrieved from FY-3C Radio Occultation: A Statistical Comparison with Measurements from COSMIC RO and Digisondes Over the Globe. Remote Sensing. 2019; 11(12):1419. https://doi.org/10.3390/rs11121419
Chicago/Turabian StyleWang, Han, Jia Luo, and Xiaohua Xu. 2019. "Ionospheric Peak Parameters Retrieved from FY-3C Radio Occultation: A Statistical Comparison with Measurements from COSMIC RO and Digisondes Over the Globe" Remote Sensing 11, no. 12: 1419. https://doi.org/10.3390/rs11121419