Ten Years of Experience with Scientific TerraSAR-X Data Utilization
by
 , ,
, ,
Achim Roth
1,*, 
Ursula Marschalk
1,
Karina Winkler
2,
Birgit Schättler
3,
Martin Huber
1,
Isabel Georg
2,
Claudia Künzer
1 and
Stefan Dech
1 1
German Remote Sensing Data Center (DFD), German Aerospace Center (DLR), Münchener Strasse 20, D-82234 Weßling, Germany
2
SLU-Sachverständigenbüro für Luftbildauswertung und Umweltfragen, Kohlsteiner Str. 5, D-81243 Munich, Germany
3
Remote Sensing Technology Institute (IMF), German Aerospace Center (DLR), Münchener Strasse 20, D-82234 Weßling, Germany
*
Author to whom correspondence should be addressed.
Remote Sens. 2018, 10(8), 1170; https://doi.org/10.3390/rs10081170
Submission received: 22 June 2018
/
Revised: 6 July 2018
/
Accepted: 21 July 2018
/
Published: 24 July 2018
(This article belongs to the Special Issue Ten Years of TerraSAR-X—Scientific Results)
Abstract
:This paper presents the first comprehensive review on the scientific utilization of earth observation data provided by the German TerraSAR-X mission. It considers the different application fields and technical capabilities to identify the key applications and the preferred technical capabilities of this high-resolution SAR satellite system from a scientific point of view. The TerraSAR-X mission is conducted in a close cooperation with industry. Over the past decade, scientists have gained access to data through a proposal submission and evaluation process. For this review, we have considered 1636 data utilization proposals and analyzed 2850 publications. In general, TerraSAR-X data is used in a wide range of geoscientific research areas comprising anthroposphere, biosphere, cryosphere, geosphere, and hydrosphere. Methodological and technical research is a cross-cutting issue that supports all geoscientific fields. Most of the proposals address research questions concerning the geosphere, whereas the majority of the publications focused on research regarding “methods and techniques”. All geoscientific fields involve systematic observations for the establishment of time series in support of monitoring activities. High-resolution SAR data are mainly used for the determination and investigation of surface movements, where SAR interferometry in its different variants is the predominant technology. However, feature tracking techniques also benefit from the high spatial resolution. Researchers make use of polarimetric SAR capabilities, although they are not a key feature of the TerraSAR-X system. The StripMap mode with three meter spatial resolution is the preferred SAR imaging mode, accounting for 60 percent of all scientific data acquisitions. The Spotlight modes with the highest spatial resolution of less than one meter are requested by only approximately 30 percent of the newly acquired TerraSAR-X data.
1. Introduction
On 15 June 2007, Germany’s first operational radar satellite TerraSAR-X was launched into space. The TerraSAR-X mission is organized in a public–private partnership (PPP) between the German Aerospace Center (DLR) and the European Aeronautic Defence and Space Company (EADS) Astrium GmbH (since 2014 Airbus Defence and Space (DS)) [1]. Representing the German government, DLR solely owns and operates the satellite and coordinates the scientific utilization of the TerraSAR-X data and products. The commercial exploitation rights are exclusively granted to Airbus DS. The X-band SAR can be operated in Spotlight, StripMap and ScanSAR mode providing different spatial resolutions and areal coverages with two polarizations in various combinations.
The TerraSAR-X mission pursues two main goals. The first is the provision of high-quality, multimode X-band SAR-data for scientific research and applications. The second goal is to support the establishment of a commercial earth observation (EO) market and to develop a sustainable EO-service business, based on derived information products. This paper reviews the TerraSAR-X mission solely from the perspective of scientific data utilization. It considers technical and operational issues and provides a resume of the mission’s utilization and a background for future EO mission designs.
In general, earth observation data are an invaluable source of information for geoscientific research which, in turn, has resulted in a growing body of associated publications. NASA’s Seasat was the first successful civilian SAR project in space, operating for 100 days in 1978 [2]. The SIR-C/X-SAR mission provided the unique capability for investigating the suitability of different frequencies and polarizations for applications in ecology, geology, hydrology, and oceanography [3]. Europe, in particular the European Space Agency, Canada and Japan have run SAR missions since the early 1990s. In this regard, these SAR missions [4,5,6,7], their objectives [8,9] and design, the sensors and other technical aspects were of interest [1,2,9,10,11,12,13,14]. Also the summary of a research call [15] and the potential for specific geoscientific applications are presented [16,17,18,19,20]. To date however, a comprehensive review of a high-resolution SAR system such as TerraSAR-X considering the technical capabilities, individual user needs in the relevant application fields and the system utilization associated with it has not been published in the peer-reviewed literature yet. Hence, this paper aims to answer the following questions: What are the key applications and modes of TerraSAR-X and how does the scientific user community generally utilize the mission? Therefore, we briefly summarize the TerraSAR-X mission, its technical capabilities and the product provision mechanism for scientific purposes. Based on the analysis of 1636 data utilization proposals, we determine the thematic scope as well as user motivations and expectations for using high resolution X-band SAR data. We examine all data takes acquired on requests by scientific users to assess the share of the different modes and polarizations and to identify the preferred settings and geographic areas of interest. We analyze the published results based on TerraSAR-X data in peer-reviewed scientific literature. Finally, we compare and discuss the revealed findings.
1.1. The TerraSAR-X Mission
Since the late 1970s, the German Aerospace Center (DLR) has supported a long and successful technology development line for high frequency X-band SAR systems. On 15 June 2007, a key milestone was achieved when Germany’s first operational radar satellite TerraSAR-X was launched into space. Operational product ordering and delivery was opened to scientific and commercial users on 1 January 2008 after a six month commissioning phase. TanDEM-X, a twin-satellite to TerraSAR-X, was launched in June 2010. Both satellites fly in a close formation enabling single pass interferometry [21] and serving two purposes. The TerraSAR-X mission utilizes one of the satellites when just a single acquisition is needed, while the TanDEM-X mission simultaneously acquires two images from the same area on the ground using both satellites. The main goal of the latter has been the generation of global, consistent and high-quality digital elevation models (DEMs) [21].
The SAR sensors of TerraSAR-X and TanDEM-X operate at X-band with 9.65 GHz center frequency. Depending on the SAR imaging mode, the transmitted bandwidth is 55 to 100, 150, or 300 MHz [22]. The satellite was positioned in a polar sun-synchronous dawn-dusk orbit with an inclination of 97.44 degrees and an altitude of 515 km. The repeat cycle is 11 days, with ground track repeatability within ±250 m for the TerraSAR-X satellite. One repeat period consists of 167 consecutive orbits. TerraSAR-X features different modes and polarizations. The SpotLight, StripMap, and ScanSAR-modes provide high-resolution SAR images for detailed analysis as well as wide swath capability whenever a larger coverage is required. Operational imaging is possible in single and dual polarization. Quad-polarized data are available on an experimental basis only. Beam steering enables observations at different incidence angles and double side access can be realized by satellite roll maneuvers.
Within the StripMap and ScanSAR modes, a continuous data take of up to 1500 km until the flight direction can be realized. This is not possible in the Spotlight modes. Here, the sensor rather focusses on a predefined position on the ground during the overflight. This enhances the synthetic aperture and, thus, provides a high spatial resolution in azimuth. The range bandwidth resolution is 150 MHz for Spotlight mode. The High Resolution Spotlight and the Staring Spotlight are acquired with the 300 MHz variant. The mission’s potential was upgraded in 2013 when two new modes were implemented. The Staring Spotlight capability increases the spatial resolution in azimuth to 24 cm. The new WideScanSAR mode (6 ScanSAR beams) extends the spatial coverage to 200 km. The characteristics of the operational ScanSAR and StripMap modes are provided in Table 1, the specifications of the Spotlight mode are displayed in Table 2.
The TerraSAR-X Ground Segment [24] controls and operates the satellite platform as well as the SAR sensor [25], performs instrument calibration [26], acquisition and archiving of the SAR data and the generation of user-defined products on request [22].
The Mission Control Center is located at DLR in Oberpfaffenhofen, Germany. The central receiving station for the TerraSAR-X mission is at DLR in Neustrelitz, Germany. Additionally, commercial data requests are downloaded at direct-access stations. The demand for TerraSAR-X products increased over the years and data downlink became a limiting factor. Since 2015, extra downlink capacity has been purchased at other receiving stations. Near-real-time access was realized at the DLR stations in Neustrelitz and O’Higgins in Antarctica.
All data acquired from the TerraSAR-X and TanDEM-X missions are stored in the multimission archive of DLR. By the end of June 2017, more than 235,000 individual data takes were ingested corresponding to almost 290 TBytes of SAR raw data. The raw data are processed to SAR Level 1b products following user requests.
1.2. Scientific Access to TerraSAR-X Data
Access to TerraSAR-X data for scientific purposes needs to be gained via a proposal submission and evaluation process. Here, interested users describe the intended research, their project partners and team organization, the expected schedule, an estimate of the number of TerraSAR-X products needed and the location of the test site. A principle investigator (PI) submits the proposal and acts as project lead and single point of contact to DLR. The evaluation is usually completed within two months. The evaluation includes an assessment whether the data is used for scientific purposes and would, therefore, conform to the mandate of DLR.
DLR issued several calls for proposals, so-called announcement of opportunities (AO). The first was the pre-launch AO, released already in 2004. Seven additional calls followed, four of which addressing specific issues such as promoting the new modes or enabling collaborations with the Canadian Space Agency (CSA) as an international partner were of limited duration. Three calls remain open for submission at any time during the mission. The archived data AO provides simplified access to archived TerraSAR-X data older than 18 months at the time of ordering. Archived experimental data, e.g., in full-polarimetric mode, can be requested through the Special Products AO. New acquisitions or more recently acquired data can be accessed through the general AO.
Users with accepted proposals get an account with access to DLR’s EOWEB GeoPortal EGP [27]. The account’s functionality is configured according to the corresponding AO, enabling for example access to future acquisitions or ordering products from the archive. When new observations are needed, the PI gets full flexibility to select and order the best suited mode, polarization and acquisition date. In case of acquisition conflicts, a priority scheme is applied by DLR’s mission planning in order to automatically generate the acquisition timeline [25].
The TerraSAR-X mission is governed by national security regulations because of the high spatial resolution capability. In particular, these take effect when users request the Spotlight modes or StripMap Single Look Slant range Complex products (SSC). The provision of such products may become sensitive depending on the geographical region or the urgency of the data delivery. The latter can usually be simplified if the default latency of five days is acceptable for the user. Otherwise, DLR as the provider has to apply for the data release from the relevant state authority.
The vast majority of the scientific orders could generally be delivered without any extra actions. Altogether, a total of 154,000 scientific orders requested TerraSAR-X products, either from the archive or new data acquisitions. Only 306 of them needed further clarification. From these, 279 requests were accepted for delivery and, in only 27 cases, the corresponding products could not be provided.
2. TerraSAR-X Proposals, Scientific Orders and Literature Review
2.1. TerraSAR-X Proposals
The access to TerraSAR-X data for scientific purposes is granted via a proposal mechanism. TerraSAR-X data are usually exploited by a team of scientists headed by a PI, with partners acting as Co-Investigators (Co-Is). In total, 955 Principle Investigators from 617 institutions in 55 different countries submitted requests for TerraSAR-X products until the end of June 2017. Figure 1 shows countries of the institution with which the PIs were affiliated.
Please note that the location of the investigator’s affiliated institution but not the PI’s nationality is considered. A further 1396 Co-Is from 1062 institutions in 79 countries collaborate with the PIs in the related projects.
Some of the PIs handed in several proposals so that in total 1636 proposals were submitted until the end of June 2017. A keyword scan was applied to all of the 1636 proposals in order to investigate which user community uses TerraSAR-X data for what purposes. Here, 55 thematic and 25 technique-related keywords were considered. On that basis, we assigned every proposal to one of the following six areas of research (=sphere):
- Anthroposphere (e.g., urban areas, infrastructure, mining, vulnerability studies).
- Biosphere (e.g., agriculture, forestry, grassland, wetland).
- Cryosphere (e.g., glacier, snow, permafrost, sea ice).
- Hydrosphere (e.g., sea conditions, ocean current, tidal flats and coastal areas, soil moisture, hydrological cycle).
- Geosphere (e.g., earthquakes, volcanos, landslides, soil conditions).
- Methods and techniques (e.g., new image analysis and processing techniques, preparation of new imaging modes).
Note that a proposal can just belong to one sphere so that the sum of proposals over all spheres is 100 percent. Each sphere is subdivided into characteristic thematic fields. Thus, one keyword may occur multiple times within title and keyword list. These keywords are used to characterize the corresponding research and application more specifically. Here, the number of keywords used within the respective sphere is given as a percentage, though the sum is not necessarily 100 percent. A more detailed analysis of the proposals is provided in Sections 3.1–3.7, which are supplemented by references to published results.
2.2. Scientific TerraSAR-X Acquisitions
By the end of June 2017, more than 235,000 individual data takes were acquired and stored in the TerraSAR-X mission archive. A data take is a continuously acquired strip of SAR raw data which can consist of several individual scenes. 100,711 of them were initiated for scientific and mission control purposes. Figure 2 shows their yearly distribution between 19 June 2007 and 30 June 2017. General ordering was opened up on 1 January 2008. Hence, all acquisitions in 2007 were exclusively related to commissioning activities. Therefore, they are not considered in the following analyses.
For the purpose of this review, all data takes acquired on request of scientific users after 1 January 2008 are examined to examine the role of different modes and polarizations, to identify the preferred settings and geographic areas of interest.
2.3. Scientific Publications
The publication of research results represents an important indicator for the assessment of key applications of a high-resolution SAR system and the scientific utilization of the TerraSAR-X mission. For this purpose, an analysis of renowned journals was performed based on Elsevier’s Scopus data base, a comprehensive abstract and citation data base of peer-reviewed literature. For this study, we only considered papers written in English and published in scientific journals and books. Conference proceedings were not taken into account. In order to avoid confusion with the TanDEM-X mission, papers addressing a bistatic use of SAR data were excluded from this analysis. In total, 2850 publications refer to the TerraSAR-X mission.
Similar to the analysis of the TerraSAR-X proposals, a keyword scan was applied to all titles, authors and index keywords within the Scopus data base. Here, the 80 keywords of the proposal analysis were supplemented by another 36. Those 116 keywords were grouped in a specific way to represent the same fields of research as applied for the proposals. The publications were then assigned to the research sphere with the majority of hits revealed from the keywords search. Like the proposals, a publication can only belong to one sphere so that the sum of all proposals is 100 percent.
3. Results
3.1. Proposal Analysis Overview
All 1636 proposals were classified into one of the six spheres as a result of the keyword scan. Generally, a largely homogeneous distribution over the different fields of research can be noticed, as shown in Figure 3. The share ranges from 13 percent for methodological and technical developments to 20 percent for research in the geosphere domain.
3.1.1. Anthroposphere
The focus of 17 percent of all TerraSAR-X proposals is the environment created by humans (see also Figure 4). Today, more than half of the world’s population live in cities and the trend of migration into urban areas is still increasing. Urban sprawl, expanding, and increasing exposure to hazards are only some of the associated challenges. High-resolution TerraSAR-X data are utilized for mapping the urban extent [28,29,30] and its temporal evolution [31]. Especially the StripMap mode’s ground resolution of approximately three meters enables an automated derivation of built-up areas on a global scale [32]. Furthermore, TerraSAR-X StripMap time series are employed for investigating the impact of urban growth and associated anthropogenic activities like tunnel excavation, or ground water pumping [33].
The very high-resolution Spotlight modes are utilized on a local scale. Here, the reconstruction of individual buildings and the observation of settlements are of interest [34,35]. Not only buildings but also infrastructure like expressways [36], railway tracks [37], bridges [38], and dams [39] are investigated. Very high-resolution data are even employed to measure thermal expansion of buildings and infrastructure [40,41]. Mostly, interferometric techniques are applied.
All TerraSAR-X modes are employed for investigating flooding events [42,43,44] and identifying areas with a higher risk of being flooded [45]. Damage assessment [46] as well as the monitoring of reconstruction activities are research fields utilizing high-resolution SAR data [47]. A new application field arises with the use of remote sensing data for archaeological purposes. This includes the investigation of historical sites and their surrounding areas [48,49,50] as well as the monitoring of historical sites endangered by natural or human-made hazards or under pressure from settlement expansion [51,52]. Moreover, looting activities are observed in areas which are not accessible due to armed conflicts [53]. Most of the archaeological applications benefit from the high spatial resolution of TerraSAR-X.
SAR interferometric techniques are applied to monitor mining activities [54,55]. This includes active mining but also the effects of already sealed underground mines on above-ground settlements. Furthermore, the impact of geothermal drilling is investigated [56].
More than 50 percent of all proposals in the anthroposphere domain address SAR interferometry in general or a particular interferometric measurement technique. Due to the high spatial resolution, more scatterers with a stable backscattering behavior over time can be identified, enabling for example the persistent scatterer technique. Further, SAR tomography employs SAR data acquired from different incidence angles. It allows not only the reconstruction of the three-dimensional position of stable scatterers along a building facade but also their spatial dynamics over time when time series are available. Notably, SAR polarimetry is not a driver when SAR data are used for mapping and monitoring of urban areas.
3.1.2. Biosphere
Geoscientific research in the biosphere domain is addressed by 15 percent of the proposals (see Figure 5), the majority of which is concerned with agricultural issues, specifically crop type mapping and monitoring. Most commonly, spatio-temporal backscatter variations are employed for crop type discrimination [57], crop production forecast [58], and mapping of phenological conditions [59]. In addition, surface characteristics like soil moisture [60] and their change due to tillage and harvesting activities are of interest [61]. Further studies map [62] and monitor rice growth [63,64,65].
Mapping and monitoring of forests is another essential issue in biosphere-related applications. Here, high-resolution SAR data are used for the derivation of forest stand attributes, forest structure and biomass estimations. Generally, three basic sources of information from SAR data are utilized: Backscatter, coherence and phase-based approaches [66]. Besides, radargrammetry is used for biomass estimation by determining tree heights through surface and terrain models [67,68]. Also, changes of the forest cover over time are investigated, such as the impact of forest fires [69], degradation, deforestation and forest health [70].
Several proposals target rather general issues of vegetation and land cover mapping such as the assessment of soil erosion processes [71], shrub growth monitoring [72], the detection and characterization of hedgerows [73], or biodiversity monitoring [73,74].
Wetlands are threatened by population growth, extension of agricultural land, and general human interventions in the water budget. Goals of the research community are, for example, to assess and better understand the wetland functions to improve land and water management [75]. Proposals and research with focus on reed belts [76] and other wetland vegetation [77] belong to this group. Additionally, the possibility of applying differential interferometry for measuring water level and water level changes is investigated [78].
A relatively small group of proposals addresses mapping and monitoring of grassland. The identification of grassland and especially its conversion into cropland is a relevant topic for studies on sustainable land use [79]. El Hajj et al. [80] identify the economic use of grassland for hay production. SAR data are used for biomass estimation and monitoring of cutting activities [81].
Most of the applications in the biosphere group use TerraSAR-X data for monitoring (65 percent of the proposals) and mapping purposes. Compared to 30 percent of the users requesting polarimetric data, SAR interferometry plays a minor role, but still 11 percent utilize InSAR products. Furthermore, change detection is addressed in 9 percent of the proposals. TerraSAR-X data are often synergistically used with other EO data in order to benefit from both the higher spatial resolution and higher frequency of the X-band in combination with other SAR and optical systems. This is evident through the 24 percent of the biosphere proposals describing multisensoral approaches.
3.1.3. Cryosphere
The influence of climate and the climate variability on ice- and snow-covered areas of the Earth (see Figure 6) is investigated by 17 percent of the proposals. Almost 50 percent concentrate on the observation of ice caps and glaciers including monitoring of glacier outlines [82] and their spatiotemporal variability [83,84] and, changing of calving rates at the shore line [85]. The major application field, however, is the determination of the glacier flow velocity [86,87], an essential factor for the assessment and understanding of mountain [88,89,90], rock [91] and polar glacier dynamics. The latter is often combined with the determination of the glacier’s grounding line [92,93]. TerraSAR-X data are used to monitor the collapse of ice shelves [94,95,96] and to investigate their internal and basal structure [97].
Mapping of snow-covered areas is a key aspect of 28 percent of the cryosphere proposals. A detailed knowledge of snow-covered areas, snow height [98] and the structure and physical properties of the snow pack [99] are important for many applications such as water supply, flood and avalanche risk prediction, weather forecast as well as the understanding of climate change in the long term. Not only snow cover over land is observed but also its impact on sea ice cover and breakup dynamics [100].
About 27 percent of the proposals monitor the river and lake ice phenology [101,102,103,104,105]. Water resource distribution and accessibility, the use of frozen rivers and lakes for travel and transportation purposes as well as an improved hydropower management are some of the motivations for research. Additionally, thermokarst lakes are key elements of the permafrost landscape. With permafrost thawing and associated greenhouse gas production limited to the period of unfrozen lakes, the ice phenology can be regarded as an indicator for climate change.
Permafrost research is focus of 16 percent of the proposals. This ecosystem faces dramatic changes caused by climate warming and increasing human activities in the Arctic. TerraSAR-X data are used to determine the thickness [103] of the so-called active layer, the soil above the permafrost where most of the ecological, hydrological and biological activities take place. The seasonal thawing and refreezing of the active layer causes surface deformations, posing a challenge for infrastructure and engineering [104]. Also surface changes of the permafrost landscape [105,106] and arctic wetlands [107] as well as the erosion of permafrost coastlines and riverbanks [108] are monitored.
The retreat of sea ice in the Arctic is a clear indicator and a visible sign of global warming. The determination of the sea ice thickness [109], composition and extent [110,111] as well as iceberg monitoring [112] provides essential information for operational ice services as well as the modelling of the interaction between the polar oceans and the atmosphere. Information derived from TerraSAR-X data about the sea ice state and in particular the dynamic processes forcing the sea ice breakup are used for ice breaker support [113,114]. Also, the formation and dynamics of polynyas, which are persistent areas of open water even during the polar winter, are monitored [115]. Sea-ice related issues are investigated by 13 percent of the cryosphere proposals.
TerraSAR-X data are mainly used for mapping purposes. Apart from that, the derivation of glacier flow velocity and velocity change is significant. About a third of the cryosphere proposals address this issue. Here, both interferometric and feature tracking techniques are applied. The latter especially benefits from the high spatial resolution of TerraSAR-X. For 18 percent of the proposals, polarimetric data are requested.
3.1.4. Geosphere
Most of the TerraSAR-X proposals are related to the geosphere—one-fifth intends to use the data to improve the understanding of the dynamics of the Earth’s crust as well as soil properties and erosion processes (see Figure 7). 37 percent of the geosphere proposals address tectonic issues. Co- and post-seismic surface deformations after an earthquake event are investigated by providing displacement fields and trends [116,117]. The findings help, for example, to improve the understanding and identification of the local tectonic settings [118] and even the interaction between two subsequent earthquake events [119] by combining the TerraSAR-X derived displacement field with GPS measurements and elastic dislocation models. Earthquakes can also be triggered by ground water extraction [120].
Observation of active volcanos is addressed by 27 percent of the geosphere-related proposals. Since their surface is constantly and rapidly changing, TerraSAR-X data are used to determine surface deformation caused by emptying and refilling of magma reservoirs [121]. Also, the growth and collapse of lava domes is monitored [122]. High-resolution X-band data are particularly utilized for the identification and analysis of small scale surface deformations at the caldera’s rim and walls [123]. Moreover, the rapidly changing geomorphology and deposits of eruptive volcanos is investigated by evaluating the backscatter changes [124]. TerraSAR-X data are further used for the monitoring of geothermal fields [125,126,127]
The identification of landslides, their spatial extent and dynamics is focus of 25 percent of the proposals. Landslides mostly appear on hill slopes dominated by weakly consolidated sediments [128]. They can be triggered by earthquakes, hydrological factors [129], melting of permafrost [130] and other erosion processes [131], but also human activities like cutting steep slopes to accommodate roads [132]. Inventories help to assess landslide hazards to protect people, properties and infrastructure [133,134].
A smaller share of proposals (12 percent) concentrate on soil mapping. Here, high-resolution X-band data are utilized for top-soil mapping [135], soil surface texture [136] and the investigation of erosion and sedimentation processes [137]. Other proposals assess the impact of ground water extraction [138]. A special case is the formation of sinkholes when subsurface cavities are formed which suddenly collapse [139].
All these applications benefit from the high spatial resolution and the short wavelength of TerraSAR-X. These features, together with the high observation frequency, provide a very sensitive observation and mapping tool. Accordingly, the higher resolution StripMap and Spotlight modes are requested. SAR interferometry is by far the dominant measurement technique of this research field and is mentioned in 84 percent of the proposals. SAR polarimetry is rarely applied; only 4 percent request polarimetric data.
3.1.5. Hydrosphere
The hydrosphere is the second largest group, accounting for 18 percent of all proposals. Here, research questions referring to oceans, coastal areas, limnology, soil moisture and overarching the hydrological cycle in general are addressed (see Figure 8).
Wind field and sea state retrieval is the major application, with 53 percent of the hydrosphere-related proposals. The latter mainly benefits from the higher spatial resolution which enables the derivation of shorter ocean waves with the shorter wavelength X-band system [140,141]. High radiometric performance is essential for wind field retrieval [142,143]. The high precision is utilized for offshore wind farming support [144]. The relatively low orbit of TerraSAR-X supports an improved observation of features on the sea surface compared to other L- and C-band sensors. Extreme weather conditions like storm observations and rogue waves generation [145] are investigated as well as the wind and wave interactions with ice [146].
The mapping of inland waters is focus of 45 percent of the proposals. Seasonal changes [147,148] are monitored and the available amount of water is estimated [149]. Special attention is paid to water management [150].
A third of the proposals deal with coastal applications. Tidal flats [151,152], salt marshes [153] and submarine ground water discharge [154] are monitored. Intertidal bedform shifts are investigated and the impact on sediments and benthic macrofauna [155] is assessed. For coastal protection purposes, oil spill detection and monitoring is performed [156,157,158].
Mapping and monitoring of soil moisture in arid and semi-arid environment is another key application (15 percent of the proposals) [159,160]. Here, soil moisture is important for water resources and irrigation management, but also for runoff estimations and land surface degradation processes.
Another 14 percent are engaged in the identification and observation of vessels. This includes not only ships, but oil platforms and other sea based infrastructure as well. Ship surveillance is performed to increase security [161] and safety [162]. Apart from the ship identification and classification, ship heading and velocity estimation [163] is dealt with. Also, near real time services have been developed [164].
Furthermore, ocean currents are of interest for 10 percent of the proposals. Here, the capability of Along Track Interferometry (ATI) is evaluated [165]. Variations in the backscatter intensity are likewise utilized, e.g., for the investigation of bottom topography-induced current front in a tidal channel [166].
The bathymetry, especially of coastal areas, is of interest for 5 percent of the proposals. The bottom topography is derived by observing the wave behavior in shallow waters [167] and by evaluating the temporal correlation between the backscatter intensity and the water level [168].
Only 20 percent of the proposals mention interferometric measurement techniques. 6 percent of these intend to apply along-track interferometry, while 19 percent request polarimetric data.
3.1.6. Methods and Techniques
A small share of the proposals—13 percent—addresses methodological and technical developments rather than specific application fields. Figure 9 shows the major techniques where further developments were proposed.
Close to a third (32 percent) of the proposals target improvements of techniques for measuring surface movements like persistent scatterer interferometry [169], distributed scatterer interferometry [170] and subpixel offset techniques [171]. The common goal is to overcome the limitations of the differential interferometry like geometric and temporal decorrelation, atmospheric artifacts and the one-dimensional line of sight sensitivity. Along track interferometry combines data sets acquired during a single overflight and enable the observation of internal waves [172] and tidal energy resource assessment [173].
The goal of 27 percent of the proposals is to assess the polarimetric information in TerraSAR-X data. Some examples are the derivation of polarimetric information for mapping purposes [174], the improvement of the image segmentation of high-resolution polarimetric data [175,176], novel classification approaches [177] or texture tracking in polarimetric SAR data [178].
The development of techniques for the identification of changes is focus of 13 percent of the methods related TerraSAR-X proposals. The high spatial resolution and the SAR image speckle cause significant backscatter intensity variations even within a single object on ground. In order to simplify and optimize change detection, techniques such as image segmentation [179,180] and similarity cross tests based on polarimetric features [181] are applied.
SAR tomography is another development of the persistent scatterer interferometry that utilizes multi-incidence angle observations of the same targets on ground. It thereby enables the 3d-localization and motion of scattering objects [182,183]. The 3D coordinates can also be derived by radargrammetry [184,185]. Here, an image set acquired from at least two different positions in space is processed similar to the elevation model generation from optical data with a stereo-like view. The so called SAR imaging geodesy enables solid Earth tide measurements [186] by utilizing the very high spatial resolution and range measurement accuracy.
In summary, SAR interferometry is the main application for TerraSAR-X data. Fifty-two percent of all proposals investigate various kinds of surface movements. Different differential interferometric measurement and feature tracking techniques are employed. Twenty-seven percent request single polarized TerraSAR-X data for mapping purposes. Nineteenpercent ask for dual- and quad-polarized data. The remaining 2 percent are interested in SAR experiments and the development of new modes.
3.2. Analysis of the Scientific TerraSAR-X Acquisitions
The predominant share of the acquisitions (59 percent) throughout the entire operational phase of the TerraSAR-X mission was ordered in the three to five meter resolution StripMap mode. Only 14 percent were acquired in ScanSAR mode, benefitting from the coverage of larger areas. The highest spatial resolution is offered by the different Spotlight modes and 28 percent are allotted to these modes. This report does not distinguish between the different polarizations. Single, dual and quad-polarized data are jointly considered. The trends and the share of the different modes over time are presented in Figure 10.
The interest in the different modes was quite uniform at the beginning of the mission. In the following years the demand varied but has been stable since 2012. Approximately two-thirds of all acquisitions are performed in StripMap mode, 30 percent require the high spatial resolution of the Spotlight modes and the remaining 5 percent are interested in a larger coverage and order ScanSAR products. Figure 11 provides more detail about the utilization of the Spotlight modes.
The interest in the highest resolution modes was the highest at the beginning of the mission. Almost 40 percent of all acquisitions were performed in the Spotlight modes. This demand dropped until 2011, but then increased again to a relatively constant level of 30 percent. In 2013, the Staring Spotlight mode was introduced. Remarkably, the very high-resolution potential is well accepted but did not lead to a systematic increase of the percentage of Spotlight orders in relation to the other modes.
The proportion of single and dual polarized acquisitions has been relatively constant throughout the mission’s operating phase. However, an increase in the request of dual polarized data since 2016 is noticeable. On average, 79 percent of all scientific data takes were acquired in either HH or VV polarization. 21 percent requested dual polarization (HH/VV, HH/HV, VV/VH) and a few experimental data sets acquired in full polarization (0.4 percent). In 2017, the proportion changed to 60 percent of the acquisitions in single and 40 percent in dual polarization.
Figure 12 shows the geographic and quantitative distribution of the 100,711 scientific acquisitions of the TerraSAR-X mission. Note that the number of acquired scenes and not the number of individual PIs was taken into account for this map. Hence, areas where more scenes were acquired for scientific studies are represented to a higher extent. The number of scenes available in the archive per 1° × 1° tile decreases from red (representing intensively observed areas) via orange, yellow and green to blue.
The research sites are globally distributed, with a large concentration on central Europe. However, other sites are regularly monitored whenever the system is not fully utilized. TerraSAR-X data are provided in the frame of several internationally coordinated activities as well, including the GEOHazard initiative [187], which monitors volcanos and earthquake-threatened areas, the Global Forest Observations Initiative (GFOI) [188] and the Polar Space Task Group [189]. In these cases, TerraSAR-X provides high-resolution SAR data of hot spots for local analyses.
3.3. Analysis of the Scientific Publications based on TerraSAR-X Data
Analogous to the analysis of the 1636 TerraSAR-X proposals, a keyword scan was performed in Scopus to all titles, author and index keywords of the 2850 publications referring to TerraSAR-X. In total, 116 keywords were selected and grouped in a way so that they represent the same six fields of research as for the proposals. The publications were then assigned to the research area (sphere) which best represents the keyword search (see also Section 2.1). Figure 13 shows the corresponding results.
A noticeably high percentage of papers deal with methodological and technical issues (36 percent), followed by a large number of papers in the hydrosphere group (22 percent). The geosphere (13 percent) represents the second largest geoscientific group. Whereas the fractions of anthroposphere (11 percent) and biosphere (10 percent) are very similar, the cryosphere (8 percent) shows a relative small number of publications. It should be noted that there are overlaps between the different research fields, particularly between hydrosphere and cryosphere as well as anthroposphere and geosphere. Snow and glaciers are at the center of attention in cryosphere research but at the same time they also play an important role in the hydrological cycle, e.g., as water source and reservoir. The observations of volcanos and earthquakes improve the understanding of the tectonically active areas of the Earth in terms of location and areal extent, dynamics and intensity. Many of those areas are densely populated and, thus, relevant for anthropogenic research as well.
Figure 14 presents the number of TerraSAR-X related publications from 2003 to 2016. Prior to the launch of the TerraSAR-X satellite in 2007, only a small number of papers about preparatory work were published. Three years after the launch, a significant increase of publication activities can be noticed, with an increase from 153 publications in 2010 to 510 in 2016. The number of articles continuously increased in all research fields until 2015. This trend continues for the anthroposphere, hydrosphere and geosphere. The number of publications related to cryosphere issues remains fairly constant, while those related to biosphere and methods decreased between 2015 and 2016.
Analysis of the scientific literature suggests that the dominant use of high-resolution SAR data is the derivation of surface movements. 1044 publications address this topic, 834 (29 percent of all TerraSAR-X related publications) of them deal with deformation and displacement of the solid land surface including glacier flow and 210 with movements of the ocean surface like currents, wave and wind fields. 720 articles (25 percent) used SAR interferometry including its different processing variants like PSInSAR or SAR-tomography. Feature tracking techniques were applied in 214 publications (8 percent), in 72 cases in combination with SAR interferometry. SAR polarimetry is the focus of 256 papers (9 percent). Change detection is carried out in 8 percent of the published articles and proposals.
The analysis further reveals monitoring as one of the main applications, referred to in 425 articles from the keyword search. Mostly monitoring comes along with the detection and understanding of changes of the land cover composition and extent. A regular observation of the area of interest is required, and longer time series are employed to analyze seasonal and multi-year dynamics. A significant number of publications (237 papers) deal with changes and change detection. Not only longer-term but also short-term events like natural disasters are part of scientific investigations. 122 papers used TerraSAR-X data for hazard mapping and vulnerability analyses.
4. Discussion
This paper assesses the utilization of the TerraSAR-X mission by the international scientific user community with respect to research themes. Furthermore it identifies key applications and preferred imaging modes and settings. The study is mainly based upon 1636 scientific TerraSAR-X data proposals. This number corresponds to the experience from other missions [15]. Here, more than 1000 projects were initiated based on European remote sensing satellite (ERS) data. In response to the Envisat prelaunch AO, 577 scientific proposals requested access to ASAR data. While researchers from 40 countries participated in the Envisat-AO in 2001, the TerraSAR-X user community increased to 57 countries in 2017. This indicates the growing interest in SAR data in general and is a sign of the positive development of the EO market that all SAR missions jointly serve. During its 17 years of operation, RADARSAT-1 provided images to governmental, commercial, and scientific users in 60 countries worldwide [5].
The analysis of the proposals and publications reveals that high-resolution X-band data are requested from all fields of geo-research. It even shows a largely homogenous distribution over the different spheres. Science projects supported by ALOS-2 are grouped into biosphere, geosphere, cryosphere, marine and disaster [9]. Similar categories were defined for RADARSAT-1 and RADARSAT-2 [18]. The potential of Sentinel-1 for scientific ocean, cryosphere, and land applications is summarized in [7]. All three publications describe the required capabilities, established by intensive studies and expert consultations before the launch. The approach of this TerraSAR-X study is to analyze the entirety of individual proposals and related publications and thus directly the utilization by the scientific user community when the mission is in the operational phase. The thematic fields of this study (see Figure 4, Figure 5, Figure 6, Figure 7 and Figure 8) correspond very well to those of other SAR missions, although the fields of research (Figure 3) slightly differ from the ones in [7,9,18]. This confirms the general applicability and appreciation of SAR data for these applications.
Every SAR mission has its assets and advantages. They depend on the technical layout like wave length and spatial resolution, but also on the mission operation design. The features of TerraSAR-X are the high spatial resolution, the short wave-length, a high orbit repetition rate of 11 days with a short revisit time of less than three days and the multimode capability. The high spatial resolution is the main asset of TerraSAR-X as it enables investigations in all fields of research at a high level of detail. The evaluation of surface displacements is the prime application of a high-resolution SAR system like TerraSAR-X and is the principal topic of 63 percent of all proposals. The preferred method is SAR interferometry and its different variants, with feature tracking techniques being employed as well. SAR interferometry benefits from the higher number and density of long-term stable scatterers, but also from the high repeat cycle of 11 days. Feature tracking can be applied to data sets with a longer temporal baseline, but strongly depends on the identification of terrain features and structures to be tracked.
The majority of proposals request single polarized data. The investigation and utilization of multipolarized SAR data is of interest for nine percent of the proposals. TerraSAR-X can only be ordered in dual-polarization mode which is sufficient for applications like snow and ice mapping. However, the development and application of polarimetric decomposition techniques is limited. Nevertheless, the demand for dual-polarized TerraSAR-X data has increased since 2014.
TerraSAR-X is designed to provide users with the highest level of flexibility for selecting suitable resolution, coverage, and polarization for their research. As a consequence, the data are mostly acquired for a specific need and not necessarily suitable for multi-use purposes. Other missions like Sentinel-1 and ALOS-2 strictly follow a systematic and predefined observation plan [4,10], aiming at global mapping and optimized multi-use at the expense of flexibility. The most requested mode in the TerraSAR-X mission for scientific applications is StripMap (59 percent) in single polarization, followed by the high-resolution Spotlight (28 percent) and ScanSAR modes (13 percent). StripMap data are easy to process and provide the best ratio of resolution versus coverage. The Spotlight modes are appreciated by the user community for very detailed spatial analyses. The introduction of the even higher resolution Staring Spotlight mode in 2013 initially led to a slight increase of the percentage of Spotlight orders, but then stabilized at 30 percent. ScanSAR offers larger area observation capability. A rough estimate based on the coverages per mode of RADARSAT-2 [6] indicate a share of 20 percent for the highest spatial resolution modes, 30 percent for medium and 50 percent for the coarsest ScanSAR modes. However, these numbers are dominated by commercial use and the needs of operational services like the Canadian Ice Service. Often, the X-band is synergistically evaluated with other sensors either by adding high frequency information or by shortening the revisit time for a specific point on ground by for example placing a TerraSAR-X acquisition between two consecutive RADARSAT-2 observations.
5. Conclusions
The main aim of this paper was the identification of key applications and technical modes and settings for a high-resolution X-band system like TerraSAR-X. A further goal was to determine how the mission is utilized by the scientific user community. Generally, data are requested from all fields of geo-research with a largely homogeneous distribution of the corresponding number of proposals over the different spheres. The general applicability and appreciation of SAR data was confirmed. However, the evaluation of surface displacements is clearly revealed as the key application of a high-resolution SAR system. Mostly, SAR interferometry is applied, but also feature tracking techniques are of increasing importance. Future high-resolution SAR systems should support and strengthen this application, e.g., by maintaining and improving the orbit precision and interferometric baseline stability.
The three-meter spatial resolution of the StripMap mode is well-suited for systematic monitoring on a regional scale while meter and submeter resolution of the Spotlight mode enables detailed but spatially limited analyses. A future mission would benefit from an extended across track coverage of the three meter StripMap mode. Spatially higher resolution of less than one meter would improve local studies and the evaluation of surface displacements.
Scientific users make use of polarimetric SAR capabilities, although these are not a main feature of TerraSAR-X. The demand has been growing over the recent years and a future system would benefit from the availability of fully polarized SAR data.
All geoscientific fields request systematic monitoring and the creation of time series for the investigation of seasonal, interannual, and even decadal variations. The use of single scenes for analyzing local and singular events is a minor issue.
Author Contributions
A.R. as the TerraSAR-X Science Coordinator reviewed all TerraSAR-X proposals and wrote the paper. U.M. performed the keyword analysis of the TerraSAR-X scientific proposals. K.W. carried out the literature review and the corresponding keyword analysis. B.S. evaluated the TerraSAR-X archive and prepared the scientific acquisitions statistics. M.H. prepared the geographic distribution of scientific acquisitions. I.G. performed the English editing. C.K. and S.D. strengthened the paper through critical discussion and review. All authors contributed to the paper by discussions and revisions of the manuscript.
Funding
This research received no external funding.
Acknowledgments
In this section you can acknowledge any support given which is not covered by the author contribution or funding sections. This may include administrative and technical support, or donations in kind (e.g., materials used for experiments).
Conflicts of Interest
The authors declare no conflict of interest.
References
- Werninghaus, R.; Buckreuss, S. The TerraSAR-X mission and system design. IEEE Trans. Geosci. Remote Sens. 2010, 48, 606–614. [Google Scholar] [CrossRef] [Green Version]
- Evans, D.; Alpers, W.; Cazenave, A.; Elachi, C.; Farr, T.; Glackin, D.; Holt, B.; Jones, L.; Liu, W.; McCandless, W.; et al. Seasat—A legacy of success. Remote Sens. Environ. 2005, 94, 384–404. [Google Scholar] [CrossRef]
- Schmullius, C.; Evans, D. Review article Synthetic aperture radar (SAR) frequency and polarization requirements for applications in ecology, geology, hydrology, and oceanography: A tabular status quo after SIR-C/X-SAR. Int. J. Remote Sens. 1997, 18, 2713–2722. [Google Scholar] [CrossRef]
- eoPortal Directory. Copernicus: Sentinel-1. Available online: https://directory.eoportal.org/web/eoportal/satellite-missions/c-missions/copernicus-sentinel-1 (accessed on 4 July 2018).
- eoPortal Directory. RADARSAT-1. Available online: https://directory.eoportal.org/web/eoportal/satellite-missions/r/radarsat-1 (accessed on 4 July 2018).
- eoPortal Directory. RADARSAT-2. Available online: https://directory.eoportal.org/web/eoportal/satellite-missions/r/radarsat-2 (accessed on 4 July 2018).
- eoPortal Directory. ALOS-2. Available online: https://directory.eoportal.org/web/eoportal/satellite-missions/a/alos-2 (accessed on 4 July 2018).
- Malenovský, Z.; Rott, H.; Cihlar, J.; Schaepman, M.; García-Santos, G.; Fernandes, R.; Berger, M. Sentinels for Science: Potential of Sentinel-1, -2 and -3 missions for scientific observations of ocean, cryosphere and land. Remote Sens. Environ. 2012, 120, 91–101. [Google Scholar] [CrossRef]
- Shimada, M. ALOS-2 science program. In Proceedings of the International Geoscience and Remote Sensing Symposium (IGARSS), Melbourne, Australia, 21–26 July 2013; pp. 2400–2403. [Google Scholar] [CrossRef]
- Shinichi, S.; Kankaku, Y.; Shimada, M. ALOS-2 acquisition strategy. In Proceedings of the International Geoscience and Remote Sensing Symposium (IGARSS), Melbourne, Australia, 21–26 July 2013; pp. 2412–2415. [Google Scholar] [CrossRef]
- Torres, R.; Snoeij, P.; Geudtner, D.; Bibby, D.; Davidson, M.; Attema, E.; Potin, P.; Rommen, B.; Floury, N.; Brown, M.; et al. GMES Sentinel-1 mission. Remote Sens. Environ. 2012, 120, 9–20. [Google Scholar] [CrossRef]
- Hillman, A.; Rolland, P.; Chabot, M.; Périard, R.; Ledantec, P.; Martens, N. RADARSAT-2 mission operations status. In Proceedings of the International Geoscience and Remote Sensing Symposium (IGARSS), Vancouver, BC, Canada, 24–29 July 2011; pp. 3480–3483. [Google Scholar] [CrossRef]
- Covello, F.; Battazza, F.; Coletta, A.; Manoni, G.; Valentini, G. COSMO-SkyMed mission status: Three out of four satellites in orbit. In Proceedings of the International Geoscience and Remote Sensing Symposium (IGARSS), Cape Town, South Africa, 12–17 July 2009; pp. II773–II776. [Google Scholar] [CrossRef]
- Rosenqvist, A.; Shimada, M.; Ito, N.; Watanabe, M. ALOS PALSAR: A pathfinder mission for global-scale monitoring of the environment. IEEE Trans. Geosci. Remote Sens. 2007, 45, 3307–3316. [Google Scholar] [CrossRef]
- Desnos, Y.-L.; Palazzo, F.; Regner, P.; Zehner, C.; Benveniste, J.; Doherty, M. Research activities in response to the Envisat Announcement of Opportunity. ESA Bull. 2001, 106, 118–127. Available online: http://www.esa.int/esapub/bulletin/bullet106/bul106_11.pdf (accessed on 19 June 2018).
- Nagler, T.; Rott, H.; Hetzenecker, M.; Wuite, J.; Potin, P. The Sentinel-1 mission: New opportunities for ice sheet observations. Remote Sens. 2015, 7, 9371–9389. [Google Scholar] [CrossRef]
- Salvi, S.; Stramondo, S.; Funning, G.J.; Ferretti, A.; Sarti, F.; Mouratidis, A. The Sentinel-1 mission for the improvement of the scientific understanding and the operational monitoring of the seismic cycle. Remote Sens. Environ. 2012, 120, 164–174. [Google Scholar] [CrossRef]
- Van der Sanden, J. Anticipated applications potential of RADARSAT-2 data. Can. J. Remote Sens. 2004, 30, 369–379. [Google Scholar] [CrossRef]
- Attema, A.; Alpers, W.; Askne, J.; Gray, L.; Herland, E.; Hounam, D.; Keyte, G.; Le Toan, T.; Rocca, F.; Rott, H.; et al. Envisat ASAR Science and Applications; European Space Agency (ESA): Noordwijk, The Netherlands, 1998; Volume SP-1225, pp. 1–59. Available online: https://earth.esa.int/c/document_library/get_file?folderId=13019&name=DLFE-615.pdf (accessed on 19 June 2018).
- Fletcher, K. ERS Missions 20 Years of Observing Earth; European Space Agency (ESA): Noordwijk, The Netherlands, 2013; Volume SP-1326, Available online: https://ftp.space.dtu.dk/pub/Altimetry/CLS/SP-1326_ERS_lores.pdf (accessed on 19 June 2018).
- Krieger, G.; Moreira, A.; Fiedler, H.; Hajnsek, I.; Werner, M.; Younis, M.; Zink, M. TanDEM-X: A satellite formation for high-resolution SAR interferometry. IEEE Trans. Geosci. Remote Sens. 2007, 45, 3317–3341. [Google Scholar] [CrossRef] [Green Version]
- Breit, H.; Fritz, T.; Balss, U.; Lachaise, M.; Niedermeier, A.; Vonavka, M. TerraSAR-X Processing and products. IEEE Trans. Geosci. Remote Sens. 2010, 48, 727–740. [Google Scholar] [CrossRef]
- Eineder, M.; Fritz, T. TerraSAR-X Ground Segment Basic Product Specification Document; Doc: TX-GS-DD-3302; German Aerospace Center (DLR): Wessling, Germany, 2009; Issue 1.6; p. 108. Available online: https://tandemx-science.dlr.de/pdfs/TX-GS-DD-3302_Basic-Products-Specification-Document_V1.9.pdf (accessed on 22 September 2017).
- Buckreuss, S.; Schättler, B. The TerraSAR-X Ground Segment. IEEE Trans. Geosci. Remote Sens. 2010, 48, 623–632. [Google Scholar] [CrossRef]
- Maurer, E.; Mrowka, F.; Braun, A.; Geyer, M.P.; Wasser, Y.; Wickler, M. The Mission Planning System: Automated command generation for spacecraft operations. IEEE Trans. Geosci. Remote Sens. 2010, 48, 642–648. [Google Scholar] [CrossRef]
- Steinbrecher, U.; Schulze, D.; Böer, J.; Mittermayer, J. TerraSAR-X instrument operations rooted in the system engineering and calibration project. IEEE Trans. Geosci. Remote Sens. 2010, 48, 633–640. [Google Scholar] [CrossRef]
- Rotzoll, H.; Dietrich, D.; Dengler, K.; Buckl, B.; Kiemle, S.; Heinen, T. From discovery to download. In Proceedings of the PV Conference, Darmstadt, Germany, 3–5 November 2015. [Google Scholar]
- Esch, T.; Marconcini, M.; Felbier, A.; Roth, A.; Heldens, W.; Huber, M.; Schwinger, M.; Taubenböck, H.; Müller, A.; Dech, S. Urban footprint processor—Fully automated processing chain generating settlement masks from global data of the TanDEM-X mission. IEEE Geosci. Remote Sens. Lett. 2013, 10, 1617–1621. [Google Scholar] [CrossRef] [Green Version]
- Gamba, P.; Aldrighi, M.; Stasolla, M. Robust Extraction of urban area extents in HR and VHR SAR images. IEEE J. Sel. Top. Appl. Earth Obs. Remote Sens. 2011, 4, 27–34. [Google Scholar] [CrossRef]
- Leinenkugel, P.; Esch, T.; Künzer, C. Settlement detection and impervious surface estimation in the Mekong Delta using optical and SAR remote sensing data. Remote Sens. Environ. 2011, 115, 3007–3019. [Google Scholar] [CrossRef]
- Taubenböck, H.; Esch, T.; Felbier, A.; Wiesner, M.; Roth, A.; Dech, S. Monitoring urbanization in mega cities from space. Remote Sens. Environ. 2012, 117, 162–176. [Google Scholar] [CrossRef]
- Esch, T.; Heldens, W.; Hirner, A.; Keil, M.; Marconcini, M.; Roth, A.; Zeidler, J.; Dech, S.; Strano, E. Breaking new ground in mapping human settlements from space—The Global Urban Footprint. ISPRS J. Photogramm. Remote Sens. 2017, 134, 30–42. [Google Scholar] [CrossRef]
- Bai, L.; Jiang, L.; Wang, H.; Sun, Q. Spatiotemporal characterization of land subsidence and uplift (2009-2010) over Wuhan in central China revealed by TerraSAR-X InSAR analysis. Remote Sens. 2016, 8, 350. [Google Scholar] [CrossRef]
- Gernhardt, S.; Bamler, R. Deformation monitoring of single buildings using meter-resolution SAR data in psi. ISPRS J. Photogramm. Remote Sens. 2012, 73, 68–79. [Google Scholar] [CrossRef]
- Lan, H.; Li, L.; Liu, H.; Yang, Z. Complex urban infrastructure deformation monitoring using high resolution psi. IEEE J. Sel. Top. Appl. Earth Obs. Remote Sens. 2012, 5, 643–651. [Google Scholar] [CrossRef]
- Shi, X.; Liao, M.; Wang, T.; Zhang, L.; Shan, W.; Wang, C. Expressway deformation mapping using high-resolution TerraSAR-X images. IEEE Geosci. Remote Sens. Lett. 2014, 5, 194–203. [Google Scholar] [CrossRef]
- Liu, G.; Jia, H.; Zhang, R.; Zhang, H.; Jia, H.; Yu, B.; Sang, M. Exploration of subsidence estimation by persistent scatterer InSAR on time series of high resolution TerraSAR-X images. IEEE J. Sel. Top. Appl. Earth Obs. Remote Sens. 2011, 4, 159–170. [Google Scholar] [CrossRef]
- Lazecky, M.; Hlavacova, I.; Bakon, M.; Sousa, J.J.; Perissin, D.; Patricio, G. Bridge displacements monitoring using space-borne X-band SAR interferometry. IEEE J. Sel. Top. Appl. Earth Obs. Remote Sens. 2017, 10, 205–210. [Google Scholar] [CrossRef]
- Emadali, L.; Motagh, M.; Haghshenas Haghighi, M. Characterizing post-construction settlement of the Masjed-Soleyman embankment dam, southwest Iran, using TerraSAR-X spotlight radar imagery. Eng. Struct. 2017, 143, 261–273. [Google Scholar] [CrossRef]
- Crosetto, M.; Monserrat, O.; Cuevas-González, M.; Devanthéry, N.; Luzi, G.; Crippa, B. Measuring thermal expansion using x-band persistent scatterer interferometry. ISPRS J. Photogramm. Remote Sens. 2015, 100, 84–91. [Google Scholar] [CrossRef]
- Anghel, A.; Vasile, G.; Boudon, R.; d’Urso, G.; Girard, A.; Boldo, D.; Bost, V. Combining spaceborne SAR images with 3D point clouds for infrastructure monitoring applications. ISPRS J. Photogramm. Remote Sens. 2016, 111, 45–61. [Google Scholar] [CrossRef]
- Martinis, S.; Kersten, J.; Twele, A. A fully automated TerraSAR-X based flood service. ISPRS J. Photogramm. Remote Sens. 2015, 104, 203–212. [Google Scholar] [CrossRef]
- Liu, W.; Yamazaki, F.; Gokon, H.; Koshimura, S.-I. Extraction of tsunami-flooded areas and damaged buildings in the 2011 Tohoku-Oki earthquake from TerraSAR-X intensity images. Earthq. Spectra 2013, 29 (Suppl. 1), S183–S200. [Google Scholar] [CrossRef]
- Mason, D.C.; Giustarini, L.; Garcia-Pintado, J.; Cloke, H.L. Detection of flooded urban areas in high resolution synthetic aperture radar images using double scattering. Int. J. Appl. Earth Obs. Geoinf. 2014, 28, 150–159. [Google Scholar] [CrossRef]
- Künzer, C.; Guo, H.; Schlegel, I.; Tuan, V.Q.; Li, X.; Dech, S. Varying scale and capability of Envisat ASAR-WSM, TerraSAR-X ScanSAR and TerraSAR-X StripMap data to assess urban flood situations: A case study of the Mekong delta in Can Tho province. Remote Sens. 2013, 5, 5122–5142. [Google Scholar] [CrossRef] [Green Version]
- Dekker, R.J. High-resolution radar damage assessment after the earthquake in Haiti on 12 January 2010. IEEE J. Sel. Top. Appl. Earth Obs. Remote Sens. 2011, 4, 960–970. [Google Scholar] [CrossRef]
- Liu, W.; Yamazaki, F.; Sasagawa, T. Monitoring of the recovery process of the Fukushima Daiichi nuclear power plant from VHR SAR images. J. Disaster Res. 2016, 11, 236–245. [Google Scholar] [CrossRef]
- Bachofer, F.; Quénéhervé, G.; Märker, M. The delineation of paleo-shorelines in the Lake Manyara Basin using TerraSAR-X data. Remote Sens. 2014, 6, 2195–2212. [Google Scholar] [CrossRef]
- Linck, R.; Busche, T.; Buckreuss, S. Visual analysis of TerraSAR-X backscatter imagery for archaeological prospection. Photogramm. Fernerkund. Geoinf. 2014, 1, 55–65. [Google Scholar] [CrossRef]
- Balz, T.; Caspari, G.; Fu, B.; Liao, M. Discernibility of burial mounds in high-resolution X-band SAR images for archaeological prospections in the Altai Mountains. Remote Sens. 2016, 8, 817. [Google Scholar] [CrossRef]
- Tomás, R.; García-Barba, J.; Cano, M.; Sanabria, M.P.; Ivorra, S.; Duro, J.; Herrera, G. Subsidence damage assessment of a gothic church using differential interferometry and field data. Struct. Health Monit. 2012, 11, 751–762. [Google Scholar] [CrossRef] [Green Version]
- Confuorto, P.; Plank, S.; Novellino, A.; Tessitore, S.; Ramondini, M. Implementation of DInSAR methods for the monitoring of the archaeological site of Hera Lacinia in Crotone (southern Italy). Rend. Online Soc. Geol. Ital. 2016, 41, 231–234. [Google Scholar] [CrossRef]
- Tapete, D.; Cigna, F.; Donoghue, D.N.M. ‘Looting marks’ in space-borne SAR imagery: Measuring rates of archaeological looting in Apamea (Syria) with TerraSAR-X Staring Spotlight. Remote Sens. Environ. 2016, 178, 42–58. [Google Scholar] [CrossRef]
- Chen, B.; Deng, K.; Fan, H.; Yu, Y. Combining SAR interferometric phase and intensity information for monitoring of large gradient deformation in coal mining area. Eur. J. Remote Sens. 2015, 48, 701–717. [Google Scholar] [CrossRef] [Green Version]
- Fan, H.; Xu, Q.; Hu, Z.; Du, S. Using temporarily coherent point interferometric synthetic aperture radar for land subsidence monitoring in a mining region of western China. J. Appl. Remote Sens. 2017, 11, 1–17. [Google Scholar] [CrossRef]
- Lubitz, C.; Motagh, M.; Kaufmann, C. Ground surface response to geothermal drilling and the following counteractions in Staufen im Breisgau (Germany) investigated by TerraSAR-X time series analysis and geophysical modeling. Remote Sens. 2014, 6, 10571–10592. [Google Scholar] [CrossRef]
- Kenduiywo, B.K.; Bargiel, D.; Soergel, U. Higher order dynamic conditional random fields ensemble for crop type classification in radar images. IEEE Trans. Geosci. Remote Sen. 2017, 55, 4638–4654. [Google Scholar] [CrossRef]
- McNairn, H.; Kross, A.; Lapen, D.; Caves, R.; Shang, J. Early season monitoring of corn and soybeans with TerraSAR-X and RADARSAT-2. Int. J. Appl. Earth Obs. Geoinf. 2014, 28, 252–259. [Google Scholar] [CrossRef]
- Sonobe, R.; Tani, H.; Wang, X.; Kobayashi, N.; Shimamura, H. Discrimination of crop types with terrasar-x-derived information. Phys. Chem. Earth Parts A/B/C 2015, 83, 2–13. [Google Scholar] [CrossRef]
- Baghdadi, N.; Boyer, N.; Todoroff, P.; El Hajj, M.; Bégué, A. Potential of SAR sensors TerraSAR-X, ASAR/Envisat and Palsar/ALOS for monitoring sugarcane crops on Reunion Island. Remote Sens. Environ. 2009, 113, 1724–1738. [Google Scholar] [CrossRef]
- Zhao, L.; Yang, J.; Li, P.; Zhang, L. Characteristics analysis and classification of crop harvest patterns by exploiting high-frequency multipolarization SAR data. IEEE J. Sel. Top. Appl. Earth Obs. Remote Sens. 2014, 7, 3773–3783. [Google Scholar] [CrossRef]
- Gebhardt, S.; Huth, J.; Nguyen, L.D.; Roth, A.; Künzer, C. A comparison of TerraSAR-X quadpol backscattering with RapidEye multispectral vegetation indices over rices fields in the Mekong Delta, Vietnam. Int. J. Remote Sens. 2012, 33, 7644–7661. [Google Scholar] [CrossRef]
- Yuzugullu, O.; Erten, E.; Hajnsek, I. Rice growth monitoring by means of X-band co-polar SAR: Feature clustering and bbch scale. IEEE Geosci. Remote Sens. Lett. 2015, 12, 1218–1222. [Google Scholar] [CrossRef]
- Lopez-Sanchez, J.M.; Cloude, S.R.; Ballester-Berman, J.D. Rice phenology monitoring by means of SAR polarimetry at X-band. IEEE Trans. Geosci. Remote Sen. 2012, 50, 2695–2709. [Google Scholar] [CrossRef]
- Koppe, W.; Gnyp, M.L.; Hütt, C.; Yao, Y.; Miao, Y.; Chen, X.; Bareth, G. Rice monitoring with multi-temporal and dual-polarimetric TerraSAR-X data. Int. J. Appl. Earth Obs. Geoinf. 2012, 21, 568–576. [Google Scholar] [CrossRef]
- Koch, B. Status and future of laser scanning, synthetic aperture radar and hyperspectral remote sensing data for forest biomass assessment. ISPRS J. Photogramm. Remote Sens. 2010, 65, 581–590. [Google Scholar] [CrossRef]
- Solberg, S.; Riegler, G.; Nonin, P. Estimating forest biomass from TerraSAR-X StripMap radargrammetry. IEEE Trans. Geosci. Remote Sens. 2015, 53, 154–161. [Google Scholar] [CrossRef]
- Perko, R.; Raggam, H.; Deutscher, J.; Gutjahr, K.; Schardt, M. Forest assessment using high resolution SAR data in X-band. Remote Sens. 2011, 3, 792–815. [Google Scholar] [CrossRef]
- Tanase, M.A.; Santoro, M.; Wegmüller, U.; de la Riva, J.; Pérez-Cabello, F. Properties of X-, C- and L-band repeat-pass interferometric SAR coherence in Mediterranean pine forests affected by fires. Remote Sens. Environ. 2010, 114, 2182–2194. [Google Scholar] [CrossRef]
- Lausch, A.; Erasmi, S.; King, D.J.; Magdon, P.; Heurich, M. Understanding forest health with remote sensing-part I—A review of spectral traits, processes and remote-sensing characteristics. Remote Sens. 2016, 8, 1029. [Google Scholar] [CrossRef]
- Bargiel, D.; Herrmann, S.; Jadczyszyn, J. Using high-resolution radar images to determine vegetation cover for soil erosion assessments. J. Environ. Manag. 2013, 124, 82–90. [Google Scholar] [CrossRef] [PubMed]
- Duguay, Y.; Bernier, M.; Lévesque, E.; Tremblay, B. Potential of C and X band SAR for shrub growth monitoring in sub-arctic environments. Remote Sens. 2015, 7, 9410–9430. [Google Scholar] [CrossRef]
- Betbeder, J.; Nabucet, J.; Pottier, E.; Baudry, J.; Corgne, S.; Hubert-Moy, L. Detection and characterization of hedgerows using TerraSAR-X imagery. Remote Sens. 2014, 6, 3752–3769. [Google Scholar] [CrossRef]
- Künzer, C.; Ottinger, M.; Wegmann, M.; Guo, H.; Wang, C.; Zhang, J.; Dech, S.; Wikelski, M. Earth observation satellite sensors for biodiversity monitoring: Potentials and bottlenecks. Int. J. Remote Sens. 2014, 35, 6599–6647. [Google Scholar] [CrossRef]
- Betbeder, J.; Rapinel, S.; Corgne, S.; Pottier, E.; Hubert-Moy, L. TerraSAR-X dual-pol time-series for mapping of wetland vegetation. ISPRS J. Photogramm. Remote Sens. 2015, 107, 90–98. [Google Scholar] [CrossRef] [Green Version]
- Heine, I.; Jagdhuber, T.; Itzerott, I. Classification and monitoring of reed belts using dual-polarimetric TerraSAR-X time series. Remote Sens. 2016, 8, 552. [Google Scholar] [CrossRef]
- Schmitt, A.; Brisco, B. Wetland monitoring using the curvelet-based change detection method on polarimetric SAR imagery. Water 2013, 5, 1036–1052. [Google Scholar] [CrossRef]
- Hong, S.-H.; Wdowinski, S.; Kim, S.-W. Evalution of TerraSAR-X observations for wetland InSAR applications. IEEE Trans. Geosci. Remote Sens. 2010, 48, 864–873. [Google Scholar] [CrossRef]
- Dusseux, P.; Corpetti, T.; Hubert-Moy, L.; Corgne, S. Combined use of multi-temporal optical and radar satellite images for grassland monitoring. Remote Sens. 2014, 6, 6163–6182. [Google Scholar] [CrossRef]
- El Hajj, M.; Baghdadi, N.; Belaud, G.; Zribi, M.; Cheviron, B.; Courault, D.; Hagolle, O.; Charron, F. Irrigated grassland monitoring using a time series of TerraSAR-X and Cosmo-Skymed X-band SAR data. Remote Sens. 2014, 6, 10002–10032. [Google Scholar] [CrossRef] [Green Version]
- Voormansik, K.; Jagdhuber, T.; Zalite, K.; Noorma, M.; Hajnsek, I. Observations of cutting practices in agricultural grasslands using polarimetric SAR. IEEE J. Sel. Top. Appl. Earth Obs. Remote Sens. 2017, 9, 1382–1396. [Google Scholar] [CrossRef]
- Yang, Y.; Li, Z.; Huang, L.; Tian, B.; Chen, Q. Extraction of glacier outlines and water-eroded stripes using high-resolution SAR imagery. Int. J. Remote Sens. 2016, 37, 1016–1034. [Google Scholar] [CrossRef]
- Neelmeijer, J.; Motagh, M.; Wetzel, H.-U. Estimating spatial and temporal variability in surface kinematics of the Inylchek Glacier, Central Asia, using TerraSAR-X data. Remote Sens. 2014, 6, 9239–9259. [Google Scholar] [CrossRef]
- Ponton, F.; Trouvé, E.; Gay, M.; Walpersdorf, A.; Fallourd, R.; Nicolas, J.-M.; Vernier, F.; Mugnier, J.-L. Observation of the Argentière glacier flow variability from 2009 to 2011 by TerraSAR-X and GPS displacement measurements. IEEE J. Sel. Top. Appl. Earth Obs. Remote Sens. 2014, 7, 3274–3284. [Google Scholar] [CrossRef]
- Luckman, A.; Benn, D.I.; Cottier, F.; Bevan, S.; Nilsen, F.; Inall, M. Calving rates at tidewater glaciers vary strongly with ocean temperature. Nat. Commun. 2015, 6, 1–7. [Google Scholar] [CrossRef] [PubMed] [Green Version]
- Schubert, A.; Faes, A.; Kääb, A.; Meier, E. Glacier surface velocity estimation using repeat TerraSAR-X images: Wavelet- vs. correlation-based image matching. ISPRS J. Photogramm. Remote Sens. 2013, 82, 49–62. [Google Scholar] [CrossRef]
- Fang, L.; Xu, Y.; Yao, W.; Stilla, U. Estimation of glacier surface motion by robust phase correlation and point like features of SAR intensity images. ISPRS J. Photogramm. Remote Sens. 2016, 121, 92–112. [Google Scholar] [CrossRef]
- Fallourd, R.; Trouvé, E.; Roşu, D.; Vernier, F.; Bolon, P.; Harant, O.; Gay, M.; Bombrun, L.; Vasile, G.; Nicolas, J.-M.; et al. Monitoring temperate glaciers by multi-temporal TerraSAR-X images and continuous GPS measurements. IEEE J. Sel. Top. Appl. Earth Obs. Remote Sens. 2011, 4, 372–386. [Google Scholar] [CrossRef]
- Godon, C.; Mugnier, J.L.; Fallourd, R.; Paquette, J.L.; Pohl, A.; Buoncristiani, J.F. The Bossons Glacier protects Europe’s summit from erosion. Earth Planet. Sci. Lett. 2013, 375, 135–147. [Google Scholar] [CrossRef]
- Benoit, L.; Dehecq, A.; Pham, H.-T.; Vernier, F.; Trouvé, E.; Moreau, L.; Martin, O.; Thom, C.; Pierrot-Deseilligny, M.; Briole, P. Multi-method monitoring of glacier d’Argentière dynamics. Ann. Glaciol. 2015, 56, 118–128. [Google Scholar] [CrossRef]
- Neckel, N.; Loibl, D.; Rankl, M. Recent slowdown and thinning of debris-covered glaciers in south-eastern Tibet. Earth Planet. Sci. Lett. 2017, 464, 95–102. [Google Scholar] [CrossRef]
- Joughin, I.; Shean, D.E.; Smith, B.E.; Dutrieux, P. Grounding line variability and subglacial lake drainage on Pine Island Glacier, Antarctica. Geophys. Res. Lett. 2016, 43, 9093–9102. [Google Scholar] [CrossRef]
- Marsh, O.J.; Rack, W.; Floricioiu, D.; Golledge, N.R.; Lawson, W. Tidally induced velocity variations of the Beardmore Glacier, Antarctica, and their representation in satellite measurements of ice velocity. Cryosphere 2013, 7, 1375–1384. [Google Scholar] [CrossRef] [Green Version]
- Willis, M.J.; Melkonian, A.K.; Pritchard, M.E. Outlet glacier response to the 2012 collapse of the Matusevich Ice Shelf, Severnaya Zemlya, Russian Arctic. J. Geophys. Res. Earth Surf. 2015, 120, 2040–2055. [Google Scholar] [CrossRef]
- Rott, H.; Müller, F.; Nagler, T.; Floricioiu, D. The imbalance of glaciers after disintegration of Larsen-b ice shelf, Antarctic Peninsula. Cryosphere 2011, 5, 125–134. [Google Scholar] [CrossRef] [Green Version]
- Braun, M.; Humbert, A. Recent retreat of Wilkins Ice Shelf reveals new insights in ice shelf breakup mechanisms. IEEE Geosci. Remote Sens. Lett. 2009, 6, 263–267. [Google Scholar] [CrossRef]
- Humbert, A.; Steinhage, D.; Helm, V.; Hoerz, S.; Berendt, J.; Leipprand, E.; Christmann, J.; Plate, C.; Müller, R. On the link between surface and basal structures of the Jelbart Ice Shelf, Antarctica. J. Glaciol. 2015, 61, 975–986. [Google Scholar] [CrossRef]
- Leinss, S.; Parrella, G.; Hajnsek, I. Snow height determination by polarimetric phase differences in X-band SAR data. IEEE J. Sel. Top. Appl. Earth Obs. Remote Sens. 2014, 7, 3794–3810. [Google Scholar] [CrossRef]
- Phan, X.V.; Ferro-Famil, L.; Gay, M.; Durand, Y.; Dumont, M.; Morin, S.; Allain, S.; D’Urso, G.; Girard, A. 1D-Var multilayer assimilation of X-band SAR data into a detailed snowpack model. Cryosphere 2014, 8, 1975–1987. [Google Scholar] [CrossRef] [Green Version]
- Paul, S.; Willmes, S.; Hoppmann, M.; Hunkeler, P.A.; Wesche, C.; Nicolaus, M.; Heinemann, G.; Timmermann, R. The impact of early-summer snow properties on Antarctic landfast sea-ice X-band backscatter. Ann. Glaciol. 2015, 56, 263–273. [Google Scholar] [CrossRef] [Green Version]
- Antonova, S.; Duguay, C.R.; Kääb, A.; Heim, B.; Langer, M.; Westermann, S.; Boike, J. Monitoring bedfast ice and ice phenology in lakes of the Lena river delta using TerraSAR-X backscatter and coherence time series. Remote Sens. 2016, 8, 903. [Google Scholar] [CrossRef]
- Sobiech, J.; Dierking, W. Observing lake- and river-ice decay with SAR: Advantages and limitations of the unsupervised k-means classification approach. Ann. Glaciol. 2013, 54, 65–72. [Google Scholar] [CrossRef]
- Wildham, B.; Bartsch, A.; Leibman, M.; Khomutov, A. Active-layer thickness from X-band SAR backscatter intensity. Cryosphere 2017, 11, 483–496. [Google Scholar] [CrossRef]
- Short, N.; Brisco, B.; Couture, N.; Pollard, W.; Murnaghan, K.; Budkewitsch, P. A comparison of TerraSAR-X, Radarsat-2 and ALOS-Palsar interferometry for monitoring permafrost environments, case study from Herschel Island. Can. J. Remote Sens. 2011, 115, 3491–3506. [Google Scholar] [CrossRef]
- Antonova, S.; Kääb, A.; Heim, B.; Langer, M.; Boike, J. Spatio-temporal variability of X-band radar backscatter and coherence over the Lena river delta, Siberia. Remote Sens. Environ. 2016, 182, 169–191. [Google Scholar] [CrossRef]
- Ullmann, T.; Schmitt, A.; Roth, A.; Duffe, J.; Dech, S.; Hubberten, H.-W.; Baumhauer, R. Land cover characterization and classification of arctic tundra environments by means of polarized synthetic aperture X- and C-band radar (polsar) and Landsat 8 multispectral imagery—Richards Island, Canada. Remote Sens. 2014, 6, 8565–8593. [Google Scholar] [CrossRef]
- Muster, S.; Heim, B.; Abnizova, A.; Boike, J. Water body distributions across scales: A remote sensing based comparison of three arctic tundra wetlands. Remote Sens. 2013, 5, 1498–1523. [Google Scholar] [CrossRef] [Green Version]
- Stettner, S.; Beamish, A.L.; Bartsch, A.; Heim, B.; Grosse, G.; Roth, A.; Lantuit, H. Monitoring Inter- and Intra-Seasonal Dynamics of Rapidly Degrading Ice-Rich Permafrost Riverbanks in the Lena Delta with TerraSAR-X Time Series. Remote Sens. 2018, 10, 51. [Google Scholar] [CrossRef]
- Kim, J.-W.; Kim, D.-J.; Hwang, B.J. Characterization of arctic sea ice thickness using high-resolution spaceborne polarimetric SAR data. IEEE Trans. Geosci. Remote Sens. 2012, 50, 13–22. [Google Scholar] [CrossRef]
- Ressel, R.; Singha, S.; Lehner, S.; Rosel, A.; Spreen, G. Investigation into different polarimetric features for sea ice classification using X-band synthetic aperture radar. IEEE J. Sel. Top. Appl. Earth Obs. Remote Sens. 2016, 9, 3131–3143. [Google Scholar] [CrossRef] [Green Version]
- Eriksson, L.E.B.; Borenäs, K.; Dierking, W.; Berg, A.; Santoro, M.; Pemberton, P.; Lindh, H.; Karlson, B. Evaluation of new spaceborne SAR sensors for sea-ice monitoring in the Baltic Sea. Can. J. Remote Sens. 2010, 35 (Suppl. 1), S56–S73. [Google Scholar] [CrossRef]
- Frost, A.; Ressel, R.; Lehner, S. Automated iceberg detection using high-resolution X-band SAR images. Can. J. Remote Sens. 2016, 42, 354–366. [Google Scholar] [CrossRef]
- Liu, H.; Li, X.-M.; Guo, H. The dynamic processes of sea ice on the east coast of Antarctica-a case study based on spaceborne synthetic aperture radar data from TerraSAR-X. IEEE J. Sel. Top. Appl. Earth Obs. Remote Sens. 2016, 9, 1187–1198. [Google Scholar] [CrossRef]
- Park, J.-W.; Kim, H.-C.; Hong, S.-H.; Kang, S.-H.; Graber, H.C.; Hwang, B.; Lee, C.M. Radar backscattering changes in arctic sea ice from late summer to early autumn observed by space-borne X-band HH-polarization SAR. IEEE Geosci. Remote Sens. Lett. 2016, 7, 551–560. [Google Scholar] [CrossRef]
- Dmitrenko, I.A.; Wegner, C.; Kassens, H.; Kirillov, S.A.; Krumpen, T.; Heinemann, G.; Helbig, A.; Schröder, D.; Hölemann, J.A.; Klagge, T.; et al. Observations of supercooling and frazil ice formation in the Laptev sea coastal polynya. J. Geophys. Res. Oceans 2010, 115. [Google Scholar] [CrossRef]
- Yague-Martinez, N.; Eineder, M.; Cong, X.Y.; Minet, C. Ground displacement measurement by TerraSAR-X image correlation: The 2011 Tohoku-Oki earthquake. IEEE Geosci. Remote Sens. Lett. 2012, 9, 539–543. [Google Scholar] [CrossRef]
- Liu, W.; Yamazaki, F.; Matsuoka, M.; Nonaka, T.; Sasagawa, T. Estimation of three-dimensional crustal movements in the 2011 Tohoku-Oki, Japan, earthquake from TerraSAR-X intensity images. Nat. Hazards Earth Syst. Sci. 2015, 15, 637–645. [Google Scholar] [CrossRef] [Green Version]
- Benekos, G.; Derdelakos, K.; Bountzouklis, C.; Kourkouli, P.; Parcharidis, I. Surface displacements of the 2014 Cephalonia (Greece) earthquake using high resolution SAR interferometry. Earth Sci. Inf. 2015, 8, 309–315. [Google Scholar] [CrossRef]
- Hamling, I.J.; D’Anastasio, E.; Wallace, L.M.; Ellis, S.; Motagh, M.; Samsonov, S.; Palmer, N.; Hreinsdõttir, S. Crustal deformation and stress transfer during a propagating earthquake sequence: The 2013 Cook Strait sequence, central New Zealand. J. Geophys. Res. B: Solid Earth. 2014, 119, 6080–6092. [Google Scholar] [CrossRef] [Green Version]
- Frontera, T.; Concha, A.; Blanco, P.; Echeverria, A.; Goula, X.; Arbiol, R.; Khazaradze, G.; Pérez, F.; Suriñach, E. Dinsar coseismic deformation of the May 2011 mw 5.1 Lorca earthquake (southeastern Spain). Solid Earth 2012, 3, 111–119. [Google Scholar] [CrossRef] [Green Version]
- Delgado, F.; Pritchard, M.E.; Basualto, D.; Lazo, J.; Córdova, L.; Lara, L.E. Rapid reinflation following the 2011–2012 rhyodacite eruption at Cordón Caulle volcano (Southern Andes) imaged by Insar: Evidence for magma reservoir refill. Geophys. Res. Lett. 2016, 43, 9552–9562. [Google Scholar] [CrossRef]
- Walter, T.R.; Subandriyo, J.; Kirbani, S.; Bathke, H.; Suryanto, W.; Aisyah, N.; Darmawan, H.; Jousset, P.; Luehr, B.-G.; Dahm, T. Volcano-tectonic control of Merapi’s lava dome splitting: The November 2013 fracture observed from high resolution TerraSAR-X data. Tectonophysics 2015, 639, 23–33. [Google Scholar] [CrossRef]
- Richter, N.; Poland, M.P.; Lundgren, P.R. TerraSAR-X interferometry reveals small-scale deformation associated with the summit eruption of Kilauea Volcano, Hawai’i. Geophys. Res. Lett. 2013, 40, 1279–1283. [Google Scholar] [CrossRef]
- Wadge, G.; Cole, P.; Stinton, A.; Komorowski, J.-C.; Stewart, R.; Toombs, A.C.; Legendre, Y. Rapid topographic change measured by high-resolution satellite radar at Soufriere Hills volcano, Montserrat, 2008–2010. J. Volcanol. Geotherm. Res. 2011, 199, 142–152. [Google Scholar] [CrossRef]
- Feigl, K.L.; Le Mével, H.; Ali, S.T.; Córdova, L.; Andersen, N.L.; DeMets, C.; Singer, B.S. Rapid uplift in Laguna del Maule volcanic field of the Andean southern volcanic zone (Chile) 2007–2012. Geophys. J. Int. 2013, 196, 885–901. [Google Scholar] [CrossRef]
- Vasco, D.W.; Rutqvist, J.; Ferretti, A.; Rucci, A.; Bellotti, F.; Dobson, P.; Oldenburg, C.; Garcia, J.; Walters, M.; Hartline, C. Monitoring deformation at the Geysers geothermal field, California using C-band and X-band interferometric synthetic aperture radar. Geophys. Res. Lett. 2013, 40, 2567–2572. [Google Scholar] [CrossRef]
- Ali, S.T.; Akerley, J.; Baluyut, E.C.; Cardiff, M.; Davatzes, N.C.; Feigl, K.L.; Foxall, W.; Fratta, D.; Mellors, R.J.; Spielman, P.; et al. Time-series analysis of surface deformation at Brady Hot Springs geothermal field (Nevada) using interferometric synthetic aperture radar. Geothermics 2016, 61, 114–120. [Google Scholar] [CrossRef]
- Motagh, M.; Wetzel, H.-U.; Roessner, S.; Kaufmann, H. A TerraSAR-X Insar study of landslides in southern Kyrgyzstan, Central Asia. IEEE Geosci. Remote Sens. Lett. 2013, 4, 657–666. [Google Scholar] [CrossRef]
- Jiang, Y.; Liao, M.; Zhou, Z.; Shi, X.; Zhang, L.; Balz, T. Landslide deformation analysis by coupling deformation time series from SAR data with hydrological factors through data assimilation. Remote Sens. 2016, 8, 179. [Google Scholar] [CrossRef]
- Meng, Y.; Lan, H.; Li, L.; Wu, Y.; Li, Q. Characteristics of surface deformation detected by X-band SAR interferometry over Sichuan-Tibet grid connection project area, China. Remote Sens. 2015, 7, 12265–12281. [Google Scholar] [CrossRef]
- Barboux, C.; Strozzi, T.; Delaloye, R.; Wegmüller, U.; Collet, C. Mapping slope movements in alpine environments using TerraSAR-X interferometric methods. ISPRS J. Photogramm. Remote Sens. 2015, 109, 178–192. [Google Scholar] [CrossRef]
- Rauste, Y.; Lateh, H.B.; Jefriza, J.; Wan Mohd, M.W.I.; Lönnqvist, A.; Häme, T. TerraSAR-X data in cut slope soil stability monitoring in Malaysia. IEEE Trans. Geosci. Remote Sens. 2012, 50, 3354–3363. [Google Scholar] [CrossRef]
- Oliveira, S.C.; Zêzere, J.L.; Catalão, J.; Nico, G. The contribution of PSInsar interferometry to landslide hazard in weak rock-dominated areas. Landslides 2015, 12, 703–719. [Google Scholar] [CrossRef]
- Liu, G.; Guo, H.; Perski, Z.; Fan, J.; Bai, S.; Yan, S.; Song, R. Monitoring the slope movement of the Shuping landslide in the Three Gorges reservoir of China, using X-band time series SAR interferometry. Adv. Space Res. 2016, 57, 2487–2495. [Google Scholar] [CrossRef]
- Bachofer, F.; Quénéhervé, G.; Hochschild, V.; Maerker, M. Multisensoral topsoil mapping in the semiarid Lake Manyara region, northern Tanzania. Remote Sens. 2015, 7, 9563–9586. [Google Scholar] [CrossRef]
- Zribi, M.; Kotti, F.; Lili-Chabaane, Z.; Baghdadi, N.; Ben Issa, N.; Amri, R.; Duchemin, B.; Chehbouni, A. Soil texture estimation over a semiarid area using TerraSAR-X radar data. IEEE Geosci. Remote Sens. Lett. 2012, 9, 353–357. [Google Scholar] [CrossRef] [Green Version]
- Baade, J.; Schmullius, C. Interferometric microrelief sensing with TerraSAR-X-first results. IEEE Trans. Geosci. Remote Sens. 2010, 48, 965–970. [Google Scholar] [CrossRef]
- Chen, M.; Tomás, R.; Li, Z.; Motagh, M.; Li, T.; Hu, L.; Gong, H.; Li, X.; Yu, J.; Gong, X. Imaging land subsidence induced by groundwater extraction in Beijing (China) using satellite radar interferometry. Remote Sens. 2016, 8, 468. [Google Scholar] [CrossRef]
- Theron, A.; Engelbrecht, J.; Kemp, J.; Kleynhans, W.; Turnbull, T. Detection of sinkhole precursors through SAR interferometry: Radar and geological considerations. IEEE Geosci. Remote Sens. Lett. 2017, 14, 871–875. [Google Scholar] [CrossRef]
- Bruck, M.; Lehner, S. Coastal wave field extraction using TerraSAR-X data. J. Appl. Remote Sens. 2013, 7, 1–19. [Google Scholar] [CrossRef]
- Thompson, D.R.; Horstmann, J.; Mouche, A.; Winstead, N.S.; Sterner, R.; Monaldo, F.M. Comparison of high-resolution wind fields extracted from TerraSAR-X SAR imagery with predictions from the WRF mesoscale model. J. Geophys. Res. Oceans 2012, 117, 1–17. [Google Scholar] [CrossRef]
- Kuzmić, M.; Grisogono, B.; Li, X.; Lehner, S. Examining deep and shallow Adriatic bora events. Q. J. R. Meteorol. Soc. 2015, 141, 3434–3438. [Google Scholar] [CrossRef]
- Díaz Méndez, G.M.; Lehner, S.; Ocampo-Torres, F.J.; Li, X.M.; Brusch, S. Wind and wave observations off the south pacific coast of Mexico using TerraSAR-X imagery. Int. J. Remote Sens. 2010, 31, 4933–4955. [Google Scholar] [CrossRef] [Green Version]
- Li, X.M.; Lehner, S. Observation of TerraSAR-X for studies on offshore wind turbine wake in near and far fields. IEEE J. Sel. Top. Appl. Earth Obs. Remote Sens. 2013, 6, 1757–1768. [Google Scholar] [CrossRef] [Green Version]
- Pleskachevsky, A.L.; Lehner, S.; Rosenthal, W. Storm observations by remote sensing and influences of gustiness on ocean waves and on generation of rogue waves. Ocean Dyn. 2012, 62, 1335–1351. [Google Scholar] [CrossRef]
- Gebhardt, C.; Bidlot, J.; Jacobsen, S.; Lehner, S.; Persson, P.O.G.; Pleskachevsky, A.L. The potential of TerraSAR-X to observe wind wave interaction at the ice edge. IEEE J. Sel. Top. Appl. Earth Obs. Remote Sens. 2017, 10, 2799–2809. [Google Scholar] [CrossRef]
- Moser, L.; Schmitt, A.; Wendleder, A.; Roth, A. Monitoring of the Lac Bam Wetland extent using dual-polarized X-band SAR data. Remote Sens. 2016, 8, 302. [Google Scholar] [CrossRef]
- Heine, I.; Francke, T.; Rogass, C.; Medeiros, P.H.A.; Bronstert, A.; Foerster, S. Monitoring seasonal changes in the water surface areas of reservoirs using TerraSAR-X time series data in semiarid northeastern Brazil. IEEE J. Sel. Top. Appl. Earth Obs. Remote Sens. 2014, 7, 3190–3199. [Google Scholar] [CrossRef]
- Baup, F.; Frappart, F.; Maubant, J. Combining high-resolution satellite images and altimetry to estimate the volume of small lakes. Hydrol. Earth Syst. Sci. 2014, 18, 2007–2020. [Google Scholar] [CrossRef] [Green Version]
- Klemenjak, S.; Waske, B.; Valero, S.; Chanussot, J. Automatic detection of rivers in high-resolution SAR data. IEEE J. Sel. Top. Appl. Earth Obs. Remote Sens. 2012, 5, 1364–1372. [Google Scholar] [CrossRef]
- Gade, M.; Melchionna, S. Joint use of multiple synthetic aperture radar imagery for the detection of bivalve beds and morphological changes on intertidal flats. Estuar. Coast. Shelf Sci. 2016, 171, 1–10. [Google Scholar] [CrossRef]
- Choe, B.-H.; Kim, D.-J. Retrieval of surface parameters in tidal flats using radar backscattering model and multi-frequency SAR data. Korean J. Remote Sens. 2011, 27, 225–234. [Google Scholar] [CrossRef] [Green Version]
- Lee, Y.-K.; Park, J.-W.; Choi, J.-K.; Oh, Y.; Won, J.-S. Potential uses of TerraSAR-X for mapping herbaceous halophytes over salt marsh and tidal flats. Estuar. Coast. Shelf Sci. 2012, 115, 366–376. [Google Scholar] [CrossRef]
- Kim, D.-J.; Moon, W.M.; Kim, G.; Park, S.-E.; Lee, H. Submarine groundwater discharge in tidal flats revealed by space-borne synthetic aperture radar. Remote Sens. Environ. 2011, 115, 793–800. [Google Scholar] [CrossRef]
- Adolph, W.; Jung, R.; Schmidt, A.; Ehlers, M.; Heipke, C.; Bartholomä, A.; Farke, H. Integration of TerraSAR-X, Rapideye and airborne lidar for remote sensing of intertidal bedforms on the upper flats of Norderney (German Wadden Sea). Geo-Mar. Lett. 2017, 37, 193–205. [Google Scholar] [CrossRef]
- Li, X.-M.; Jia, T.; Velotto, D. Spatial and temporal variations of oil spills in the North Sea observed by the satellite constellation of TerraSAR-X and TanDEM-X. IEEE J. Sel. Top. Appl. Earth Obs. Remote Sens. 2016, 9, 4941–4947. [Google Scholar] [CrossRef]
- Velotto, D.; Migliaccio, M.; Nunziata, F.; Lehner, S. Dual-polarized TerraSAR-X data for oil-spill observation. IEEE Trans. Geosci. Remote Sens. 2011, 49, 4751–4762. [Google Scholar] [CrossRef]
- Ivanov, A.Y. The oil spill from a shipwreck in Kerch Strait: Radar monitoring and numerical modeling. Int. J. Remote Sens. 2010, 31, 4853–4868. [Google Scholar] [CrossRef]
- Gorrab, A.; Zribi, M.; Baghdadi, N.; Mougenot, B.; Fanise, P.; Chabaane, Z.L. Retrieval of both soil moisture and texture using TerraSAR-X images. Remote Sens. 2015, 7, 10098–10116. [Google Scholar] [CrossRef] [Green Version]
- Baghdadi, N.; Camus, P.; Beaugendre, N.; Issa, O.M.; Zribi, M.; Desprats, J.F.; Rajot, J.L.; Abdallah, C.; Sannier, C. Estimating surface soil moisture from TerraSAR-X data over two small catchments in the Sahelian part of western Niger. Remote Sens. 2011, 3, 66–1283. [Google Scholar] [CrossRef] [Green Version]
- Brusch, S.; Lehner, S.; Fritz, T.; Soccorsi, M.; Soloviev, A.; Van Schie, B. Ship surveillance with TerraSAR-X. IEEE Trans. Geosci. Remote Sens. 2011, 49, 1092–1103. [Google Scholar] [CrossRef]
- Vespe, M.; Greidanus, H. SAR image quality assessment and indicators for vessel and oil spill detection. IEEE Trans. Geosci. Remote Sens. 2012, 50, 4726–4734. [Google Scholar] [CrossRef]
- Graziano, M.D.; D’Errico, M.; Rufino, G. Ship heading and velocity analysis by wake detection in SAR images. Acta Astronaut. 2016, 128, 72–82. [Google Scholar] [CrossRef]
- Chaturvedi, S.K.; Yang, C.-S.; Ouchi, K.; Shanmugam, P. Ship recognition by integration of SAR and AIS. J. Navig. 2012, 65, 323–337. [Google Scholar] [CrossRef]
- Romeiser, R.; Suchandt, S.; Runge, H.; Steinbrecher, U.; Grünler, S. First analysis of TerraSAR-X along-track Insar-derived current fields. IEEE Trans. Geosci. Remote Sens. 2010, 48, 820–829. [Google Scholar] [CrossRef]
- Wang, X.; Zhang, H.; Li, X.; Fu, B.; Guan, W. SAR imaging of a topography-induced current front in a tidal channel. Int. J. Remote Sens. 2015, 36, 3563–3574. [Google Scholar] [CrossRef]
- Brusch, S.; Held, P.; Lehner, S.; Rosenthal, W.; Pleskachevsky, A. Underwater bottom topography in coastal areas from TerraSAR-X data. Int. J. Remote Sens. 2011, 32, 4527–4543. [Google Scholar] [CrossRef]
- Catalao, J.; Nico, G. Multitemporal backscattering logistic analysis for intertidal bathymetry. IEEE Trans. Geosci. Remote Sens. 2017, 55, 1066–1073. [Google Scholar] [CrossRef]
- Devanthéry, N.; Crosetto, M.; Monserrat, O.; Cuevas-González, M.; Crippa, B. An approach to persistent scatterer interferometry. Remote Sens. 2014, 6, 6662–6679. [Google Scholar] [CrossRef]
- Goel, K.; Adam, N. A distributed scatterer interferometry approach for precision monitoring of known surface deformation phenomena. IEEE Trans. Geosci. Remote Sens. 2014, 52, 5454–5468. [Google Scholar] [CrossRef]
- Singleton, A.; Li, Z.; Hoey, T.; Muller, J.-P. Evaluating sub-pixel offset techniques as an alternative to D-Insar for monitoring episodic landslide movements in vegetated terrain. Remote Sens. Environ. 2014, 147, 133–144. [Google Scholar] [CrossRef]
- Romeiser, R.; Graber, H.C. Advanced remote sensing of internal waves by spaceborne along-track Insar-a demonstration with TerraSAR-X. IEEE Trans. Geosci. Remote Sens. 2015, 53, 6735–6751. [Google Scholar] [CrossRef]
- Ferreira, R.M.; Estefen, S.F.; Romeiser, R. Under what conditions sar along-track interferometry is suitable for assessment of tidal energy resource. IEEE J. Sel. Top. Appl. Earth Obs. Remote Sens. 2016, 9, 5011–5022. [Google Scholar] [CrossRef]
- Schmitt, A.; Wendleder, A.; Hinz, S. The Kennaugh element framework for multi-scale, multi-polarized, multi-temporal and multi-frequency SAR image preparation. ISPRS J. Photogramm. Remote Sens. 2015, 102, 122–139. [Google Scholar] [CrossRef]
- Chen, Q.; Li, L.; Xu, Q.; Yang, S.; Shi, X.; Liu, X. Multi-feature segmentation for high-resolution polarimetric SAR data based on fractal net evolution approach. Remote Sens. 2017, 9, 570. [Google Scholar] [CrossRef]
- Dabboor, M.; Karathanassi, V.; Braun, A. A multi-level segmentation methodology for dual-polarized SAR data. Int. J. Appl. Earth Obs. Geoinf. 2011, 13, 376–385. [Google Scholar] [CrossRef]
- Krylov, V.A.; Moser, G.; Serpico, S.B.; Zerubia, J. Supervised high-resolution dual-polarization SAR image classification by finite mixtures and copulas. IEEE J. Sel. Top. Signal Process. 2011, 5, 554–566. [Google Scholar] [CrossRef] [Green Version]
- Harant, O.; Bombrun, L.; Vasile, G.; Ferro-Famil, L.; Gay, M. Displacement estimation by maximum-likelihood texture tracking. IEEE J. Sel. Top. Signal Process. 2011, 5, 398–407. [Google Scholar] [CrossRef] [Green Version]
- Yousif, O.; Ban, Y. A novel approach for object-based change image generation using multitemporal high-resolution SAR images. Int. J. Remote Sens. 2016, 38, 1765–1787. [Google Scholar] [CrossRef]
- Schmitt, A.; Wessel, B.; Roth, A. An innovative curvelet-only-based approach for automated change detection in multi-temporal SAR imagery. Remote Sens. 2014, 6, 2435–2462. [Google Scholar] [CrossRef]
- Lê, T.T.; Atto, A.M.; Trouvé, E.; Solikhin, A.; Pinel, V. Change detection matrix for multitemporal filtering and change analysis of SAR and polsar image time series. ISPRS J. Photogramm. Remote Sens. 2015, 107, 64–76. [Google Scholar] [CrossRef]
- Zhu, X.X.; Montazeri, S.; Gisinger, C.; Hanssen, R.F.; Bamler, R. Geodetic SAR tomography. IEEE Trans. Geosci. Remote Sens. 2016, 54, 18–35. [Google Scholar] [CrossRef]
- Siddique, M.A.; Wegmüller, U.; Hajnsek, I.; Frey, O. Single-look SAR tomography as an add-on to PSI for improved deformation analysis in urban areas. IEEE Trans. Geosci. Remote Sens. 2016, 54, 6119–6137. [Google Scholar] [CrossRef]
- Gutjahr, K.; Perko, R.; Raggam, H.; Schardt, M. The epipolarity constraint in stereo-radargrammetric DEM generation. IEEE Trans. Geosci. Remote Sens. 2014, 52, 5014–5022. [Google Scholar] [CrossRef]
- Goel, K.; Adam, N. Three-dimensional positioning of point scatterers based on radargrammetry. IEEE Trans. Geosci. Remote Sens. 2012, 50, 2355–2363. [Google Scholar] [CrossRef]
- Eineder, M.; Minet, C.; Steigenberger, P.; Cong, X.; Fritz, T. Imaging geodesy—Toward centimeter-level ranging accuracy with TerraSAR-X. IEEE Trans. Geosci. Remote Sens. 2011, 49, 661–671. [Google Scholar] [CrossRef]
- GEO. Group on Earth Observations: Geohazard Supersites & Natural Laboratories. Available online: http://supersites.earthobservations.org/ (accessed on 9 April 2018).
- SDCG Element-3 Strategy: Satellite Data in Support of Research & Development (R&D) Activities for the Global Forest Observations Initiative for CEOS SIT-31. April 2016. Available online: http://www.gfoi.org/documents (accessed on 9 April 2018).
- Polar Space Task Group—SAR Coordination Working Group. Data Compendium—A Summary Documentation of SAR Satellite Data Collections, Plans and Activities. April 2016. Available online: http://www.wmo.int/pages/prog/sat/pstg-sarcwg_en.php (accessed on 9 April 2018).
Figure 1.
Countries of the principle investigator’s (PI) institutions: 955 PIs submitted proposals. All countries with more than 20 PIs were considered.
Figure 1.
Countries of the principle investigator’s (PI) institutions: 955 PIs submitted proposals. All countries with more than 20 PIs were considered.

Figure 2.
Number of scientific data takes of the TerraSAR-X mission between 19 June 2007 and 30 June 2017.
Figure 2.
Number of scientific data takes of the TerraSAR-X mission between 19 June 2007 and 30 June 2017.

Figure 3.
Histogram of TerraSAR-X related fields of research, expressed in percent based on the analysis of 1636 proposals.
Figure 3.
Histogram of TerraSAR-X related fields of research, expressed in percent based on the analysis of 1636 proposals.

Figure 4.
Thematic fields of anthroposphere-related TerraSAR-X proposals sorted by frequency, addressing the built-up area in general, individual buildings and infrastructure (e.g., dams, bridges, roads, railway tracks), the impact of natural disasters (in particular flooding), archaeology and manmade activities like mining.

Figure 5.
Thematic fields of biosphere-related TerraSAR-X proposals, sorted by frequency, specifically addressing agriculture, forest, wetland and grassland issues or, more generally, vegetation and land cover.
Figure 5.
Thematic fields of biosphere-related TerraSAR-X proposals, sorted by frequency, specifically addressing agriculture, forest, wetland and grassland issues or, more generally, vegetation and land cover.

Figure 6.
Thematic fields of cryosphere-related TerraSAR-X proposals, sorted by frequency, addressing polar and mountain glaciers, snow, permafrost, sea-, lake- and river-ice.
Figure 6.
Thematic fields of cryosphere-related TerraSAR-X proposals, sorted by frequency, addressing polar and mountain glaciers, snow, permafrost, sea-, lake- and river-ice.

Figure 7.
Thematic fields of geosphere related TerraSAR-X proposals, sorted by frequency addressing small- and large-scale surface deformations caused by the Earth crust’s dynamic (tectonics), volcanic activities, landslides and soil mapping including erosion.
Figure 7.
Thematic fields of geosphere related TerraSAR-X proposals, sorted by frequency addressing small- and large-scale surface deformations caused by the Earth crust’s dynamic (tectonics), volcanic activities, landslides and soil mapping including erosion.

Figure 8.
Thematic fields of hydrosphere-related TerraSAR-X proposals, sorted by frequency addressing oceanographic applications, coastal zones, inland waters, soil moisture and the identifications and observation of ships and ship traffic.
Figure 8.
Thematic fields of hydrosphere-related TerraSAR-X proposals, sorted by frequency addressing oceanographic applications, coastal zones, inland waters, soil moisture and the identifications and observation of ships and ship traffic.

Figure 9.
Thematic fields of methodological and technical research related TerraSAR-X proposals, sorted by frequency addressing differential SAR interferometry including its further developments such as PSInSAR, polarimetry, automated detection of changes, SAR tomography, and radargrammetry for 3d mapping.

Figure 10.
Proportion (in percent) of TerraSAR-X modes on an annual basis from 1 January 2008 to 30 June 2017: High-resolution Spotlight mode displayed on top, the medium resolution StripMap mode in the middle and the coarser resolution ScanSAR mode at the bottom.
Figure 10.
Proportion (in percent) of TerraSAR-X modes on an annual basis from 1 January 2008 to 30 June 2017: High-resolution Spotlight mode displayed on top, the medium resolution StripMap mode in the middle and the coarser resolution ScanSAR mode at the bottom.

Figure 11.
Proportion (in percent) of TerraSAR-X Spotlight modes on an annual basis from 1st January 2008 to 30th June 2017: The highest resolution Staring Spotlight mode displayed on top, the high-resolution HR-Spotlight mode in the middle and the standard resolution Spotlight mode at the bottom.
Figure 11.
Proportion (in percent) of TerraSAR-X Spotlight modes on an annual basis from 1st January 2008 to 30th June 2017: The highest resolution Staring Spotlight mode displayed on top, the high-resolution HR-Spotlight mode in the middle and the standard resolution Spotlight mode at the bottom.

Figure 12.
Geographic and quantitative distribution of scientific areas of interest observed by TerraSAR-X between 2007 and 2017, the color indicates the number of acquisitions per 1° × 1° tile.
Figure 12.
Geographic and quantitative distribution of scientific areas of interest observed by TerraSAR-X between 2007 and 2017, the color indicates the number of acquisitions per 1° × 1° tile.

Figure 13.
Histogram of TerraSAR-X related fields of research, expressed in percent based on the analysis of 2850 publications.
Figure 13.
Histogram of TerraSAR-X related fields of research, expressed in percent based on the analysis of 2850 publications.

Figure 14.
Accumulation of TerraSAR-X related research papers for thematic areas between 2003 and 2016.
Figure 14.
Accumulation of TerraSAR-X related research papers for thematic areas between 2003 and 2016.


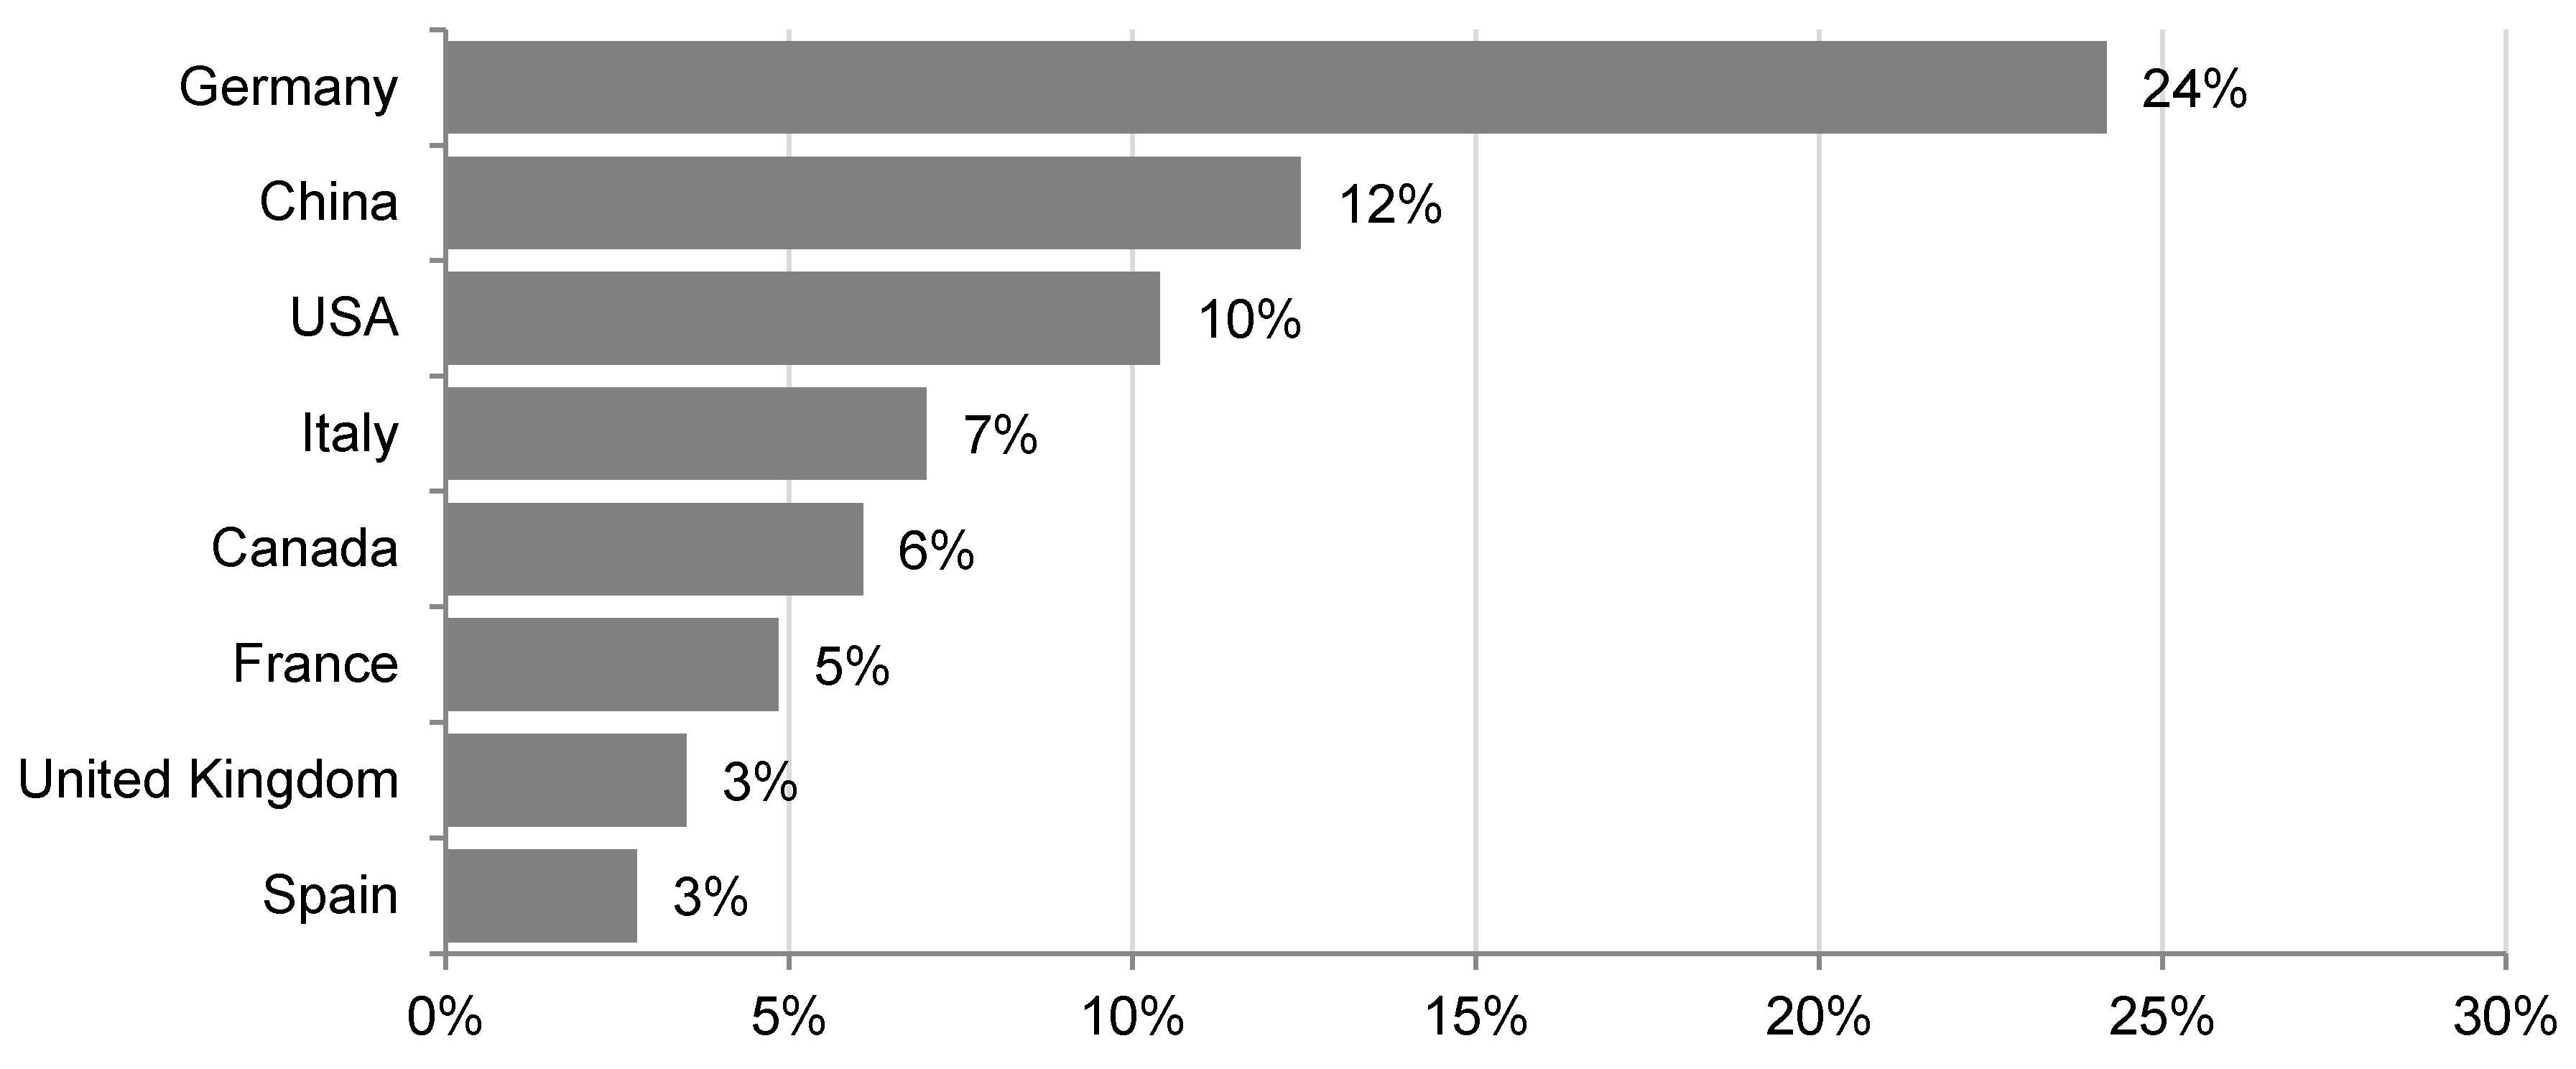
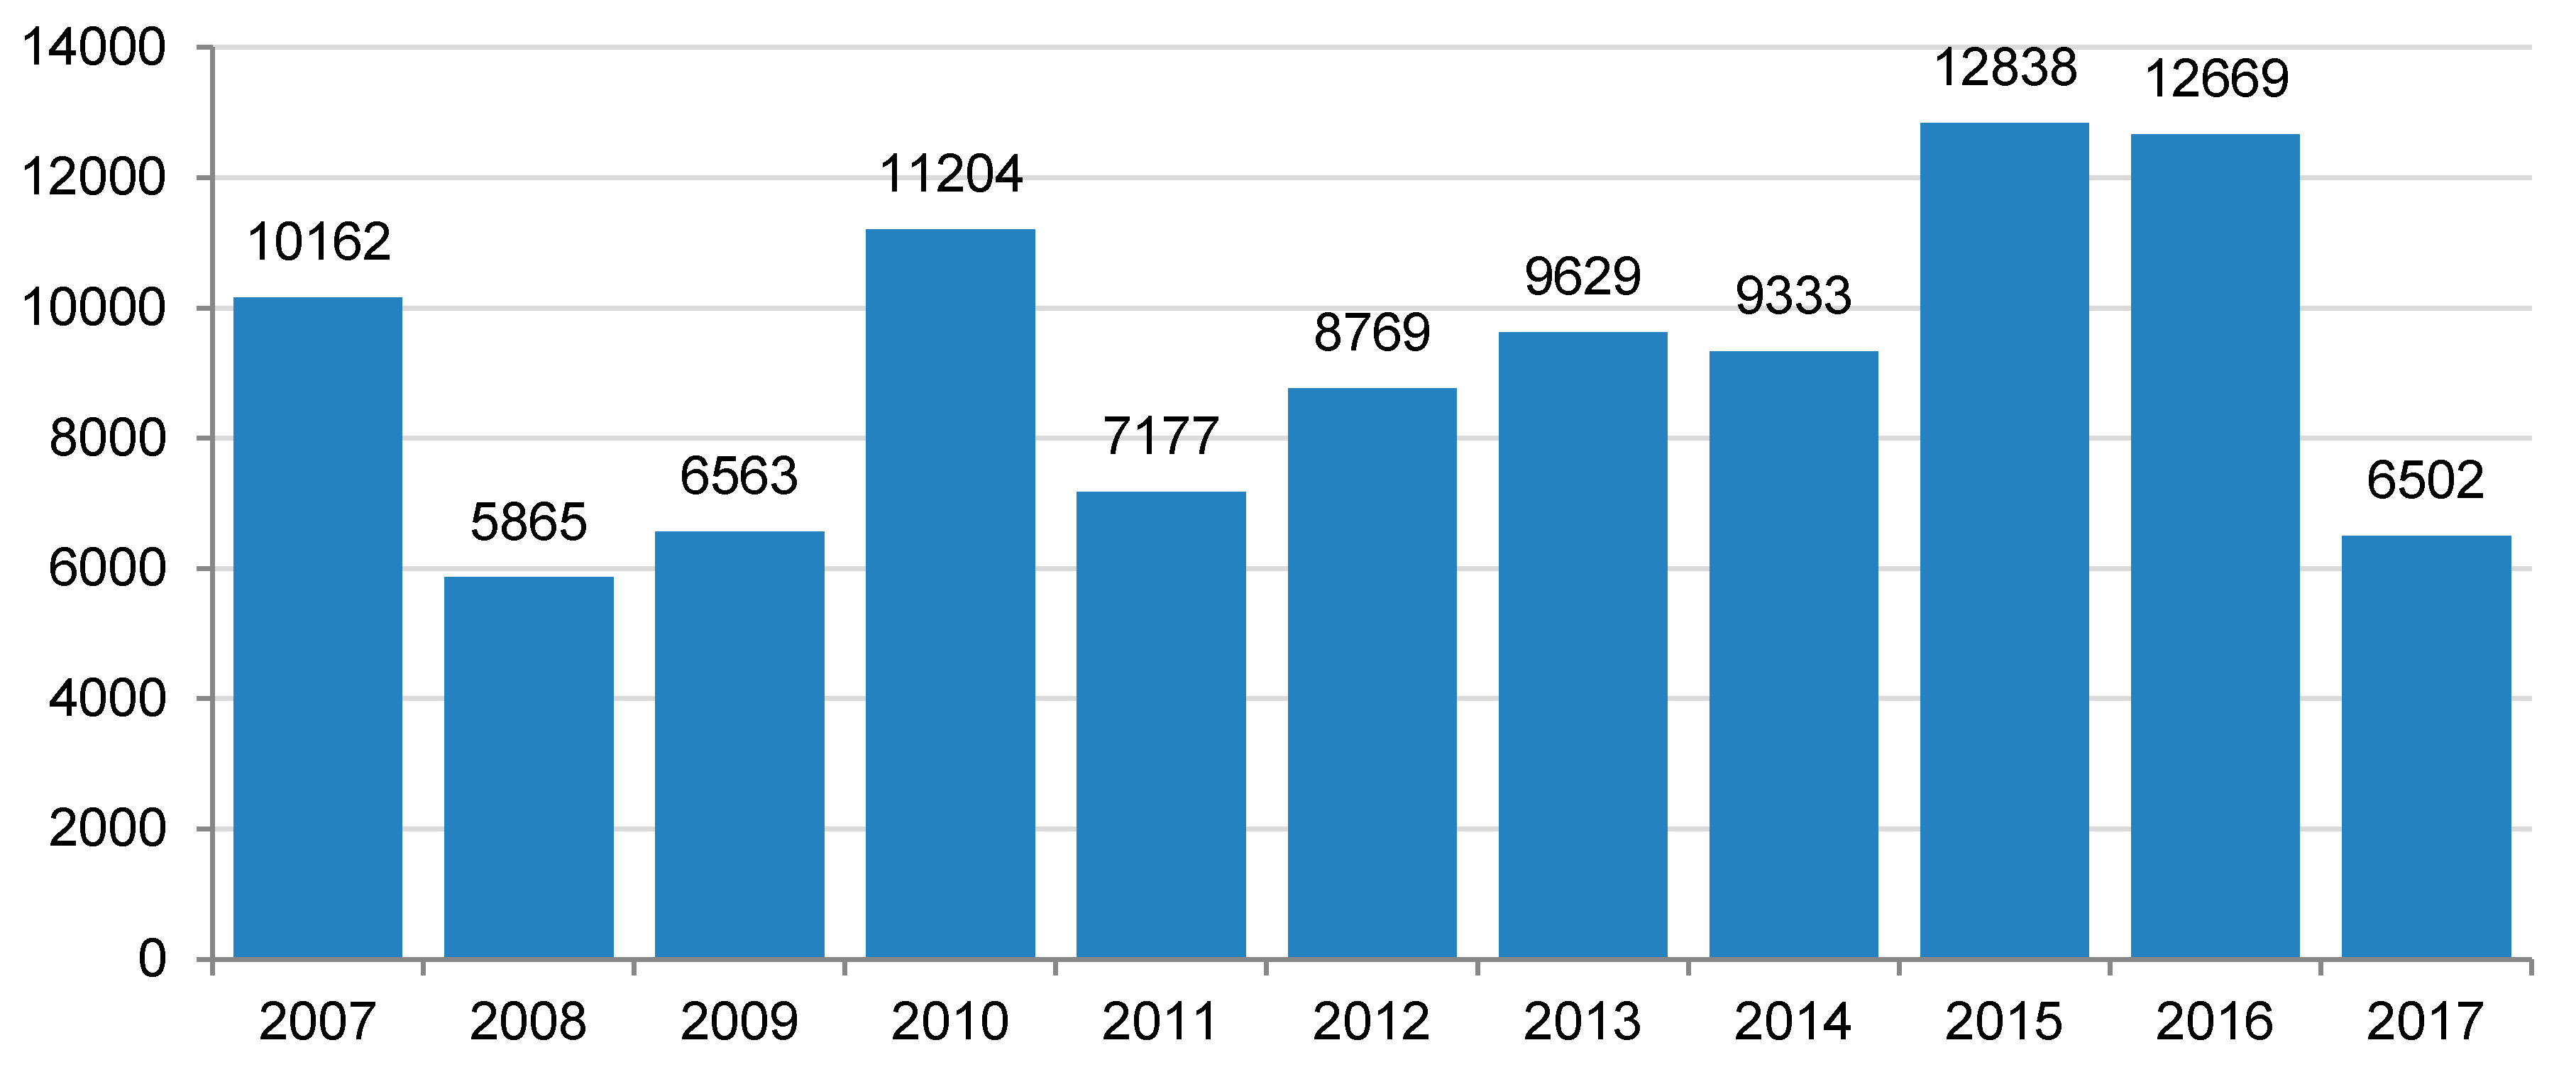
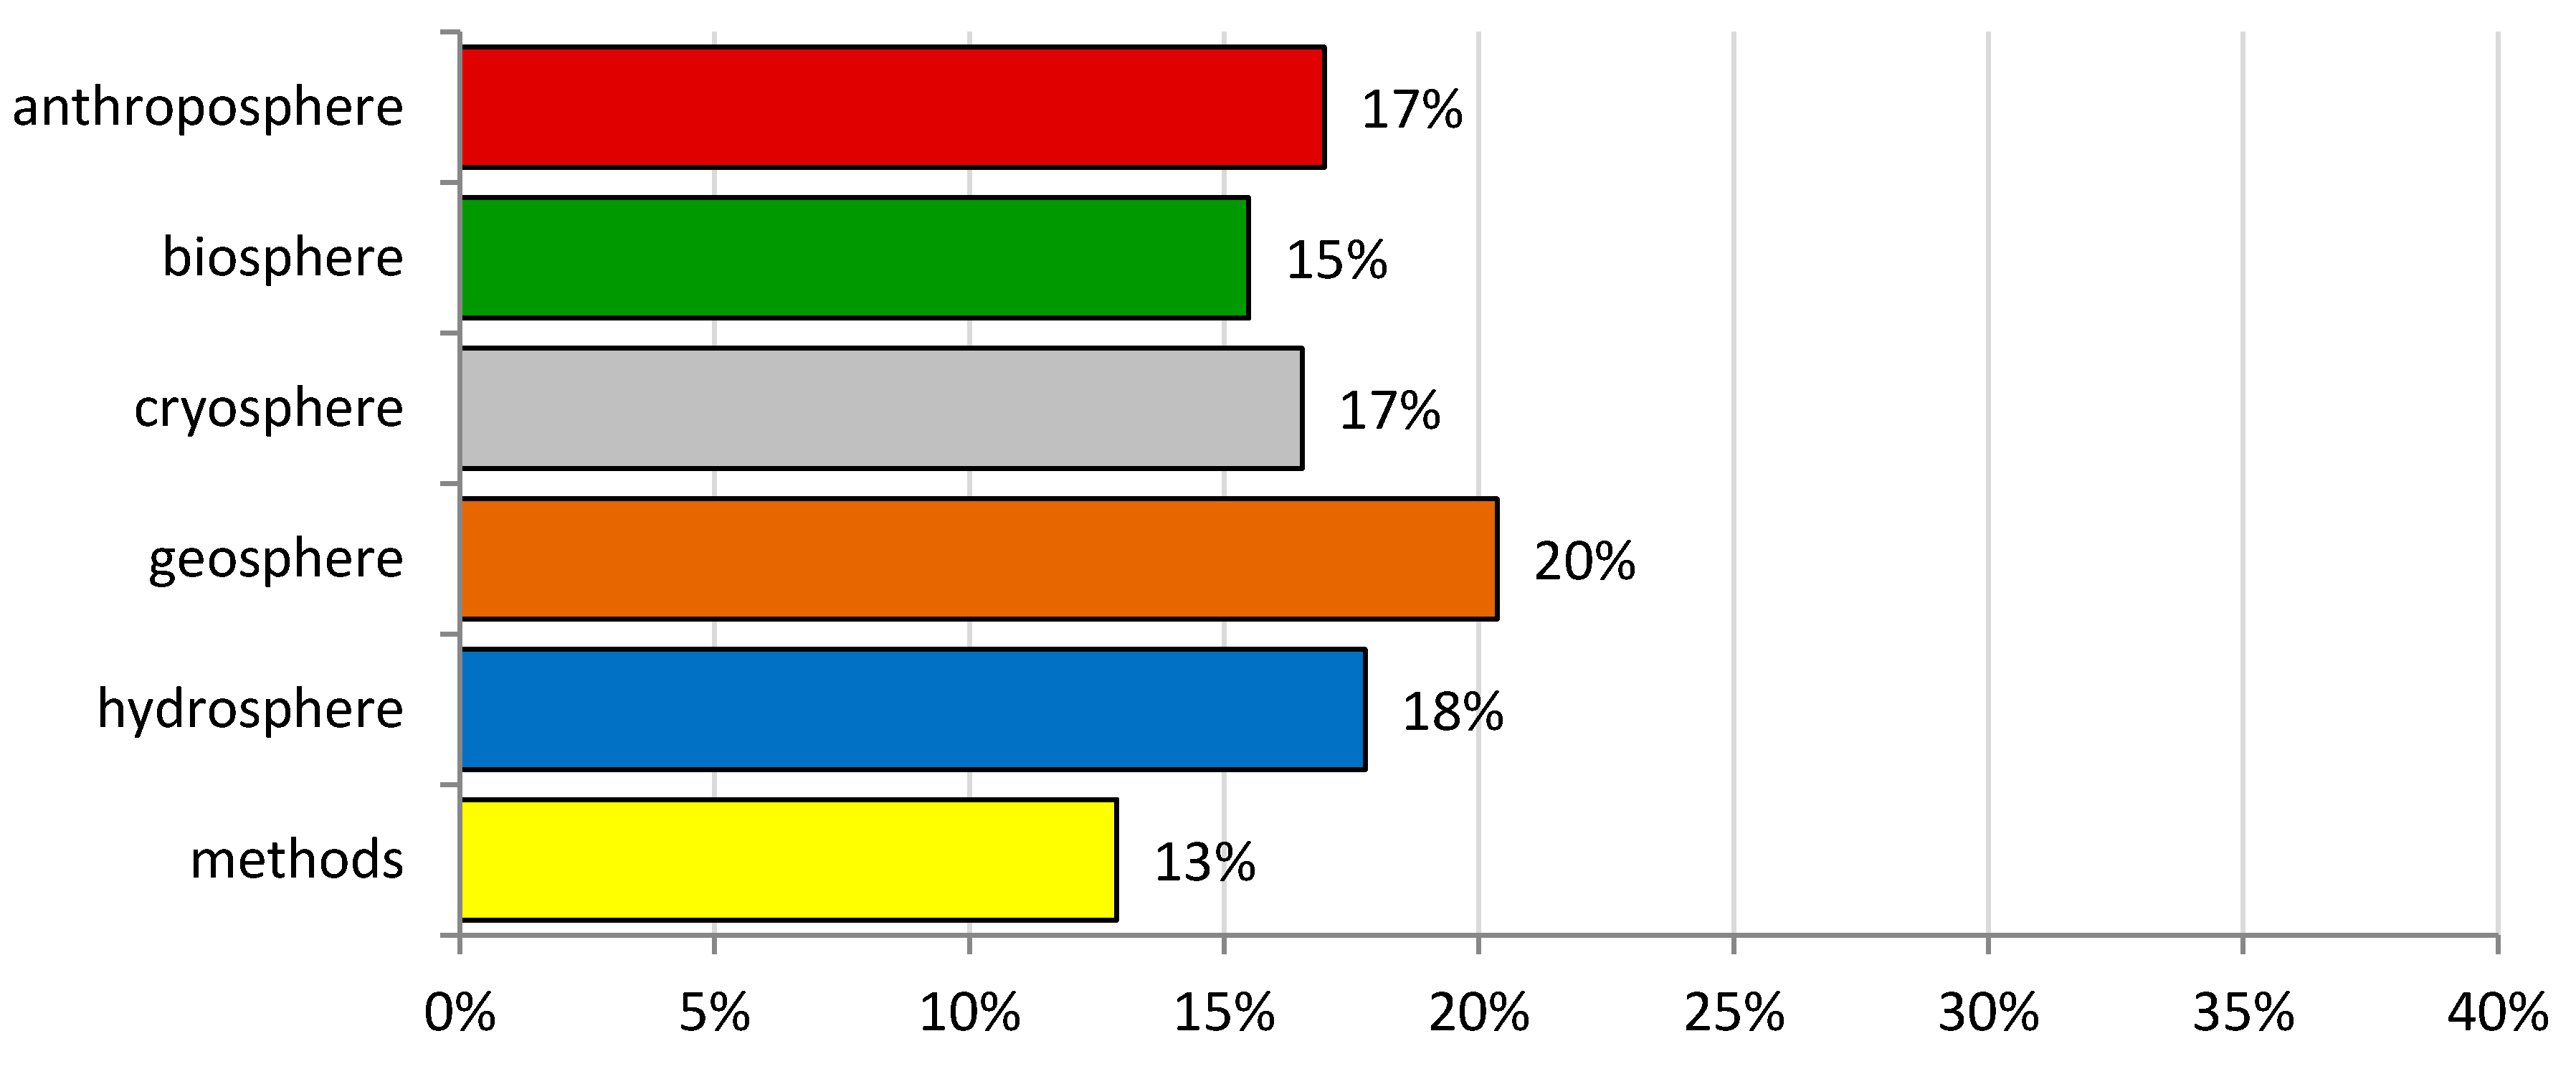
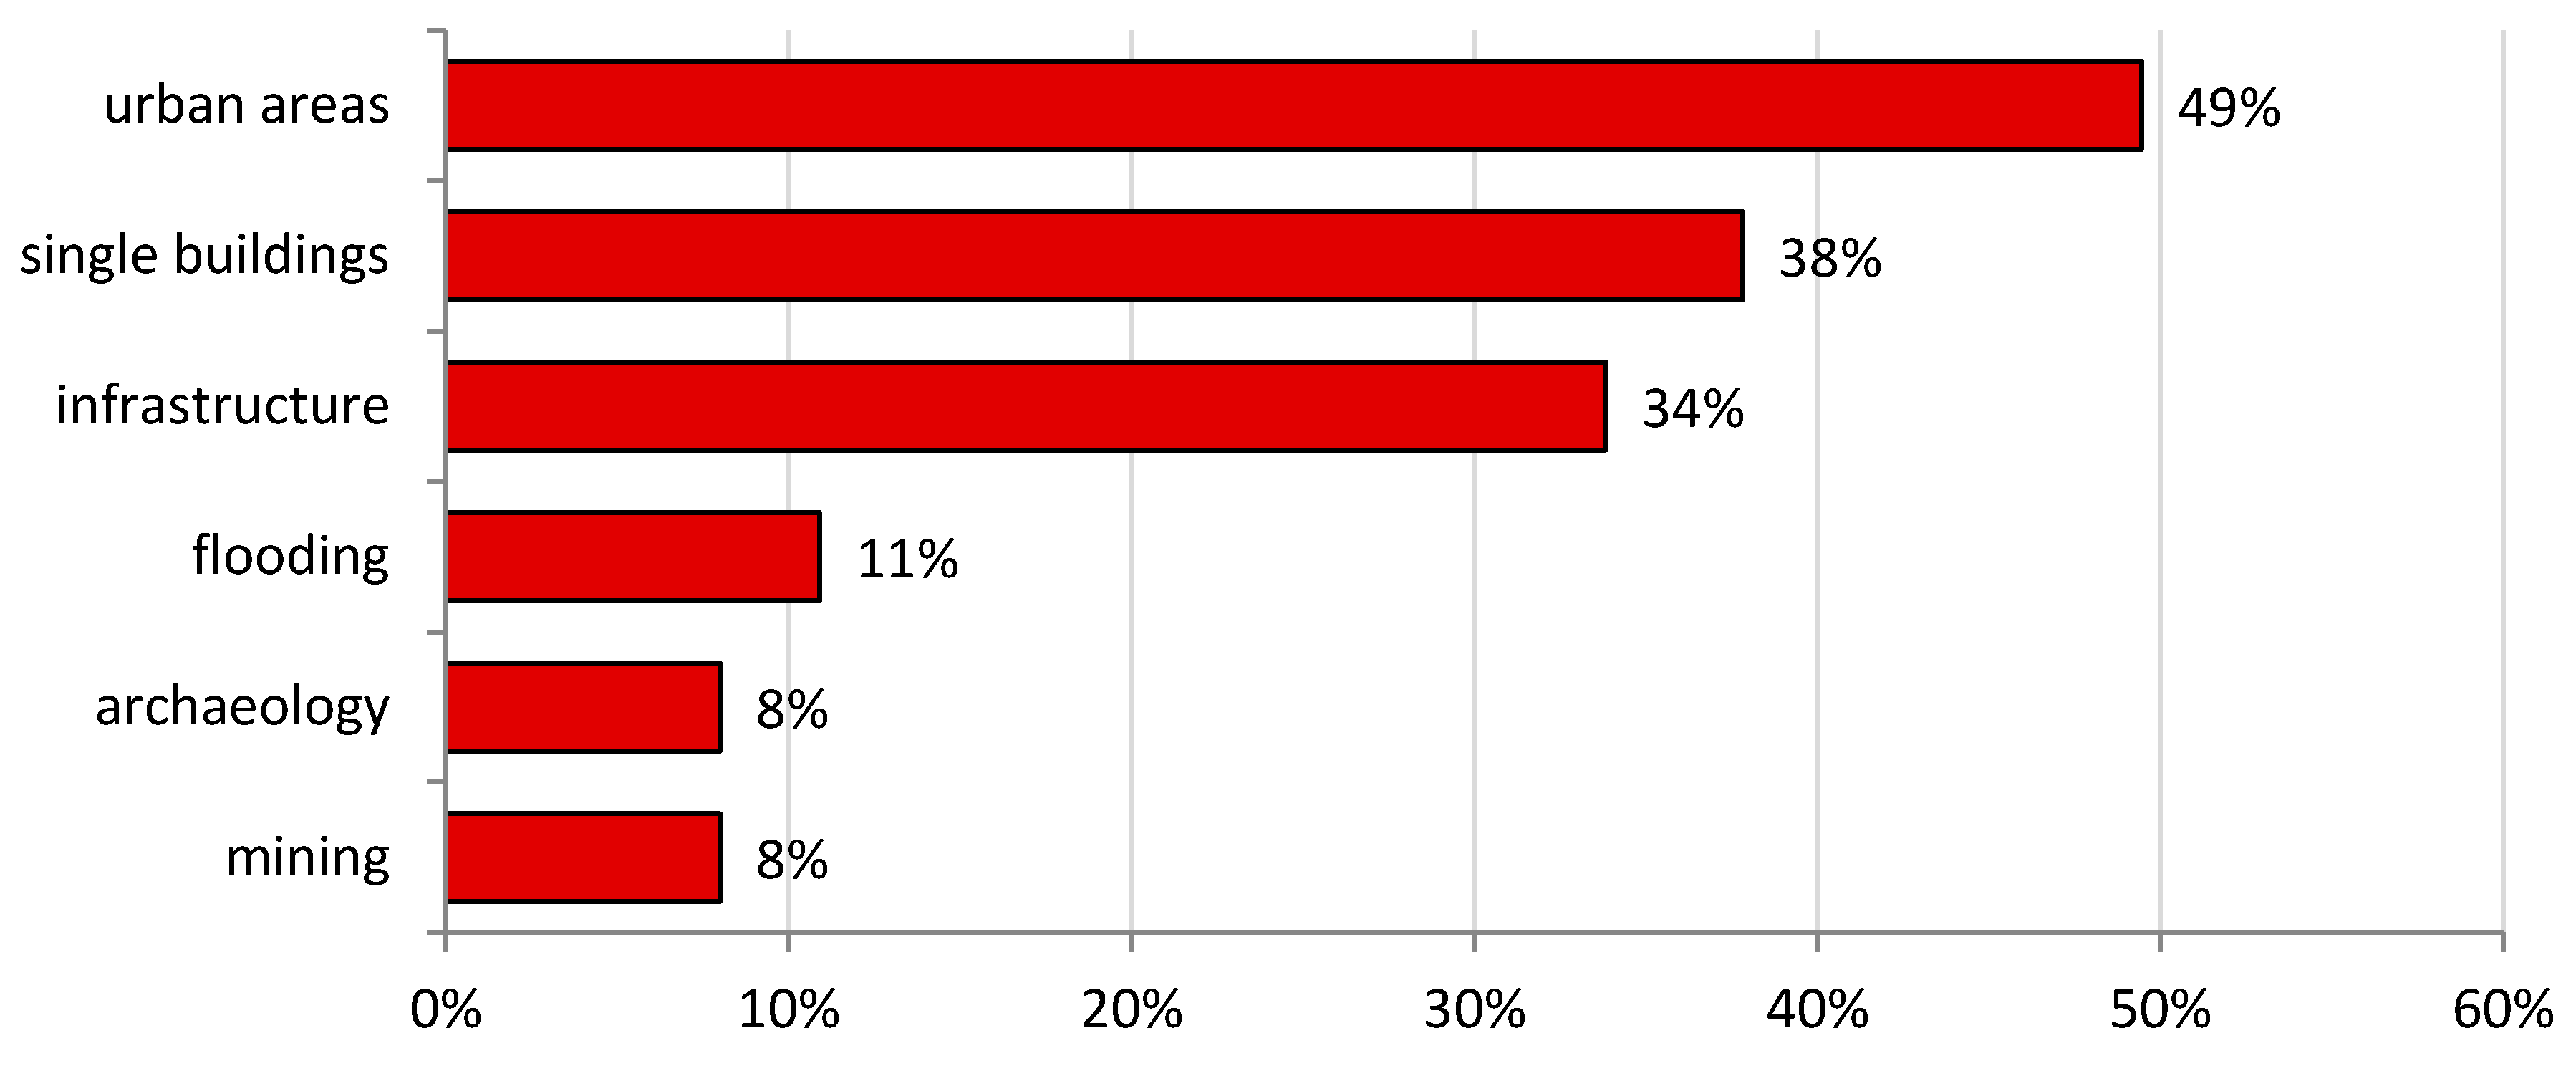
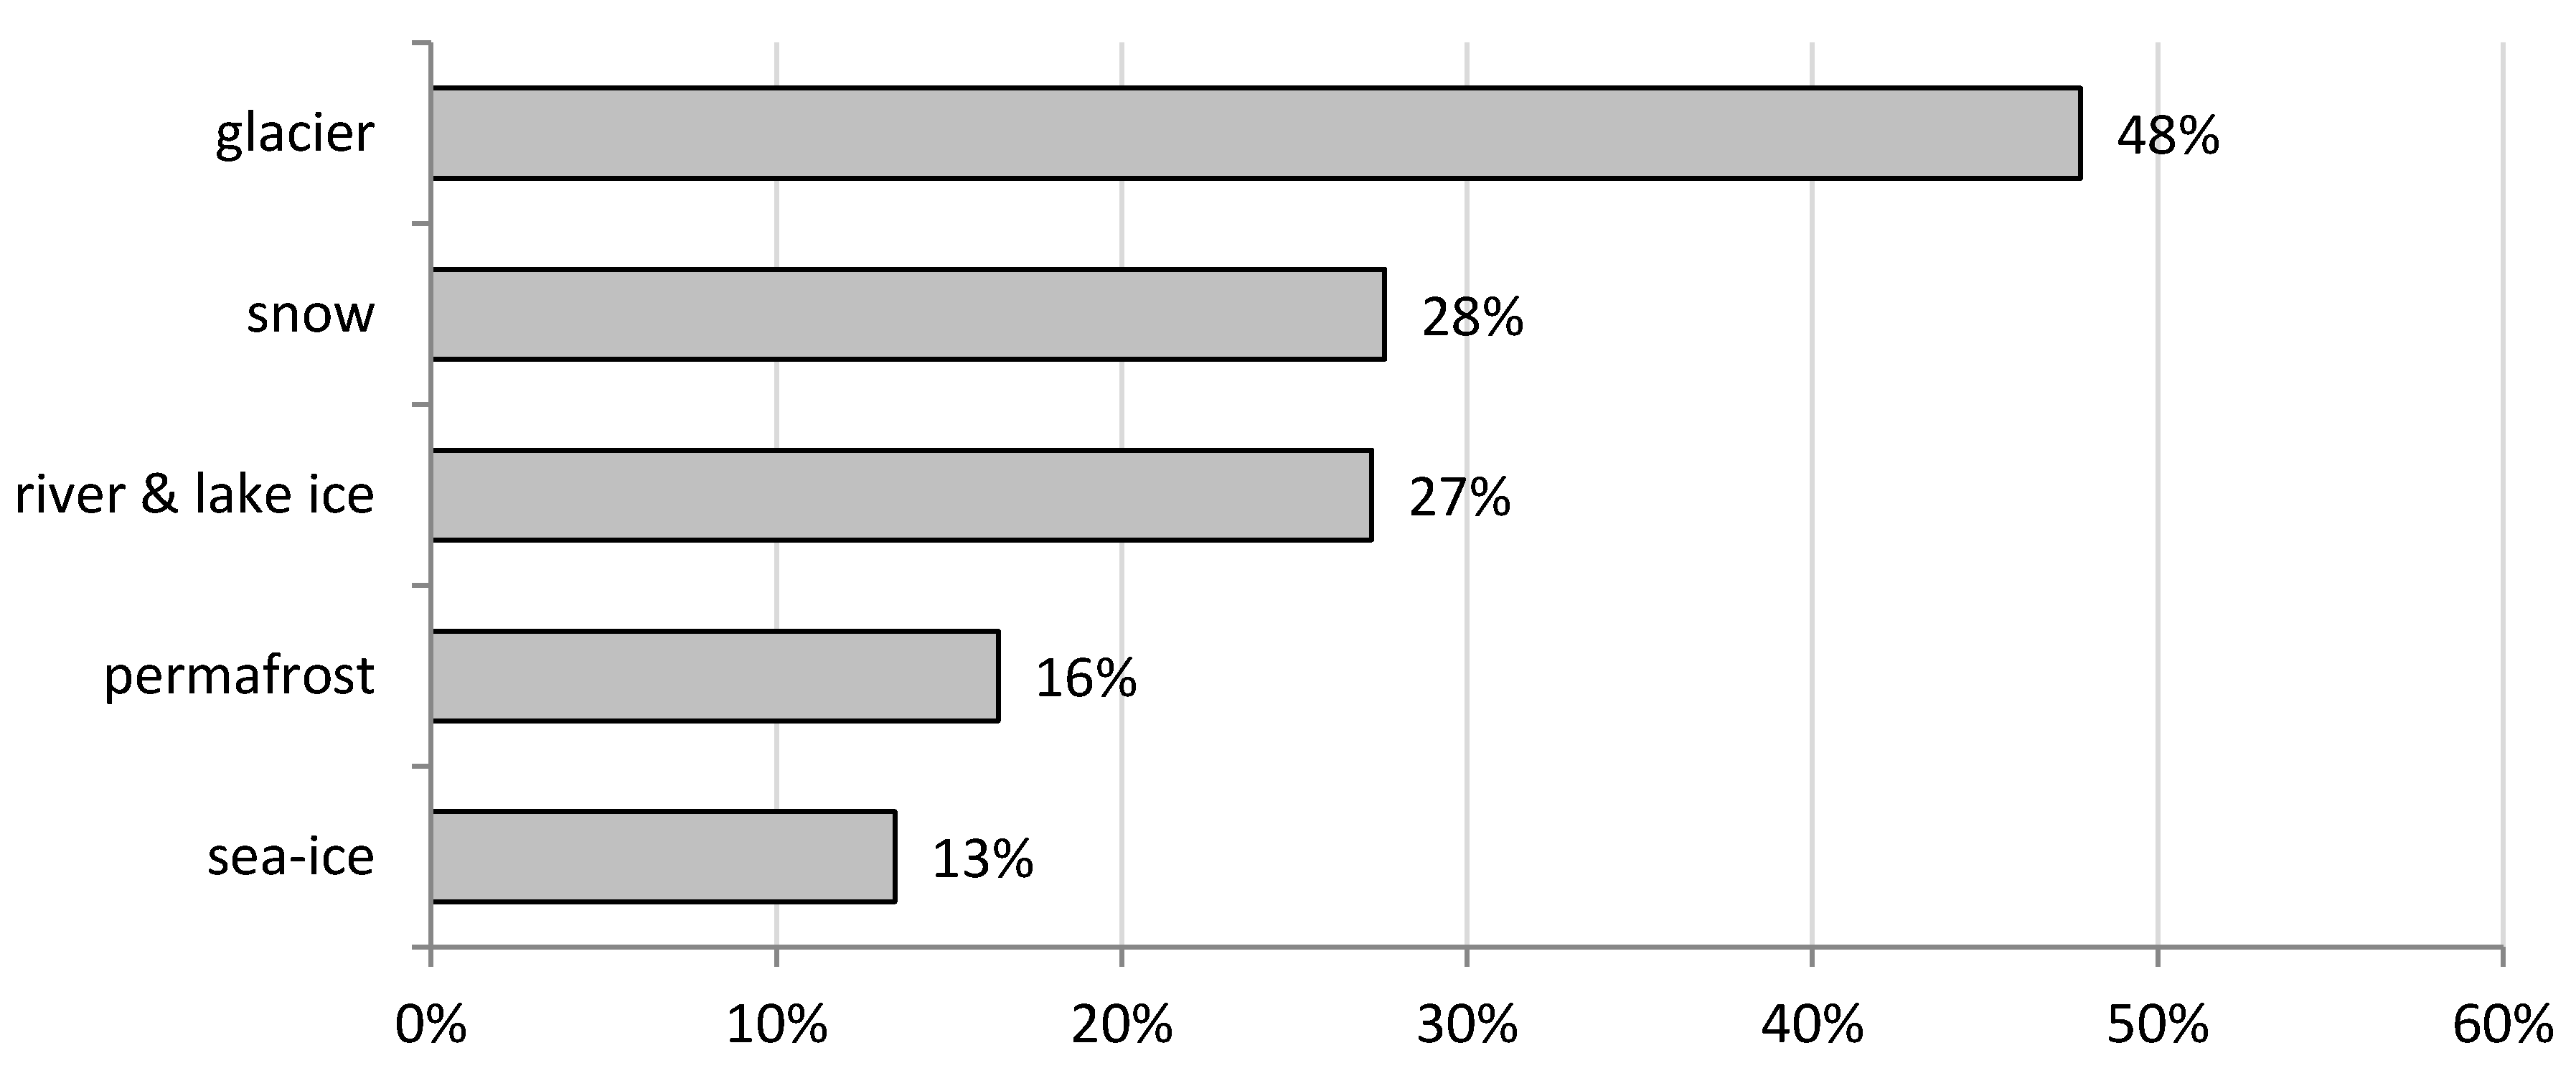
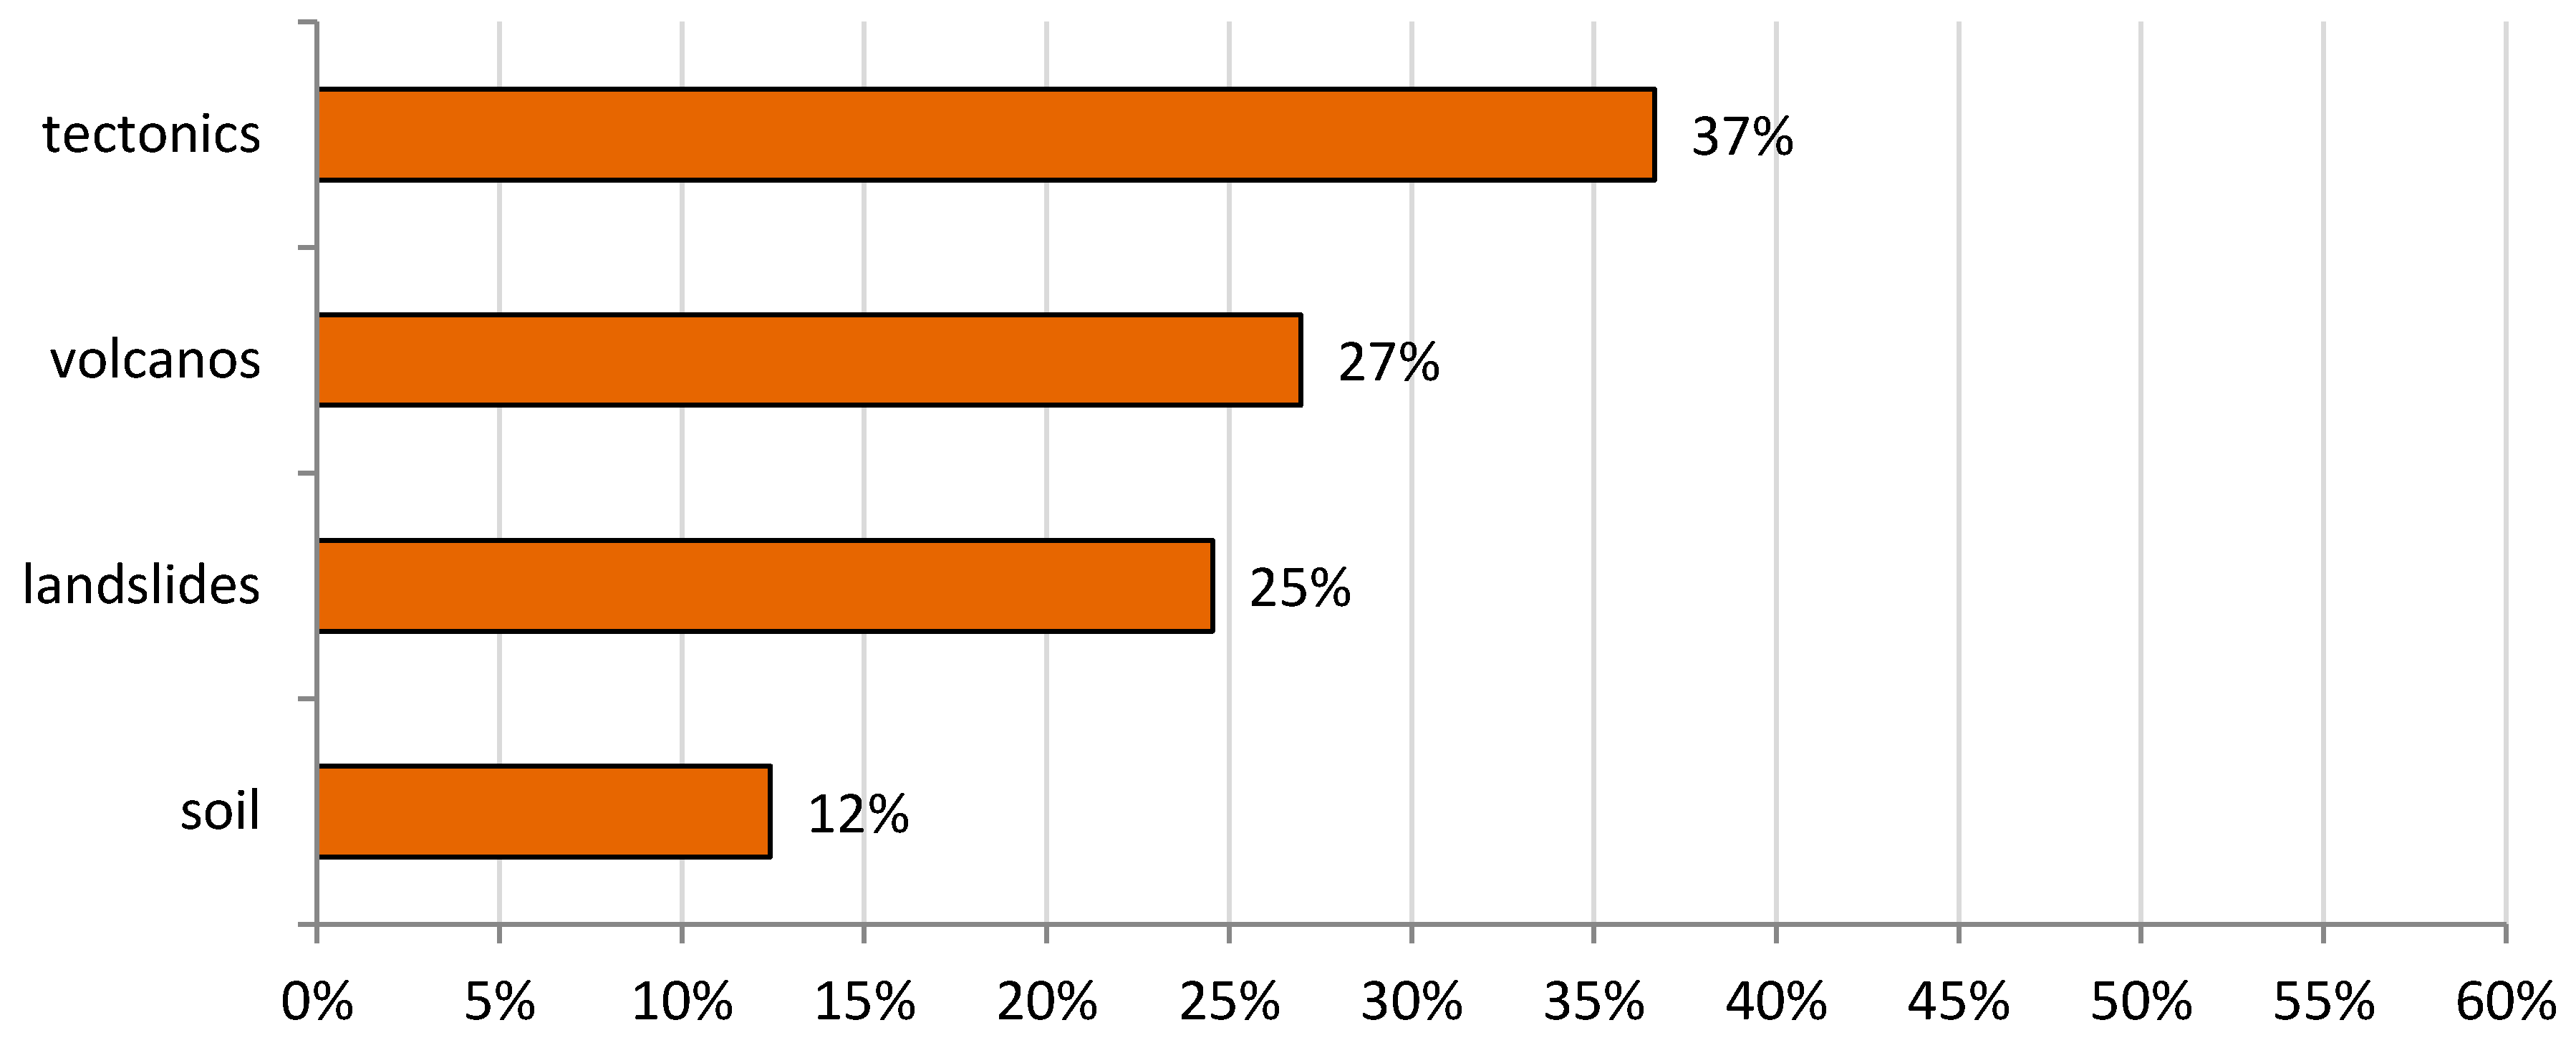
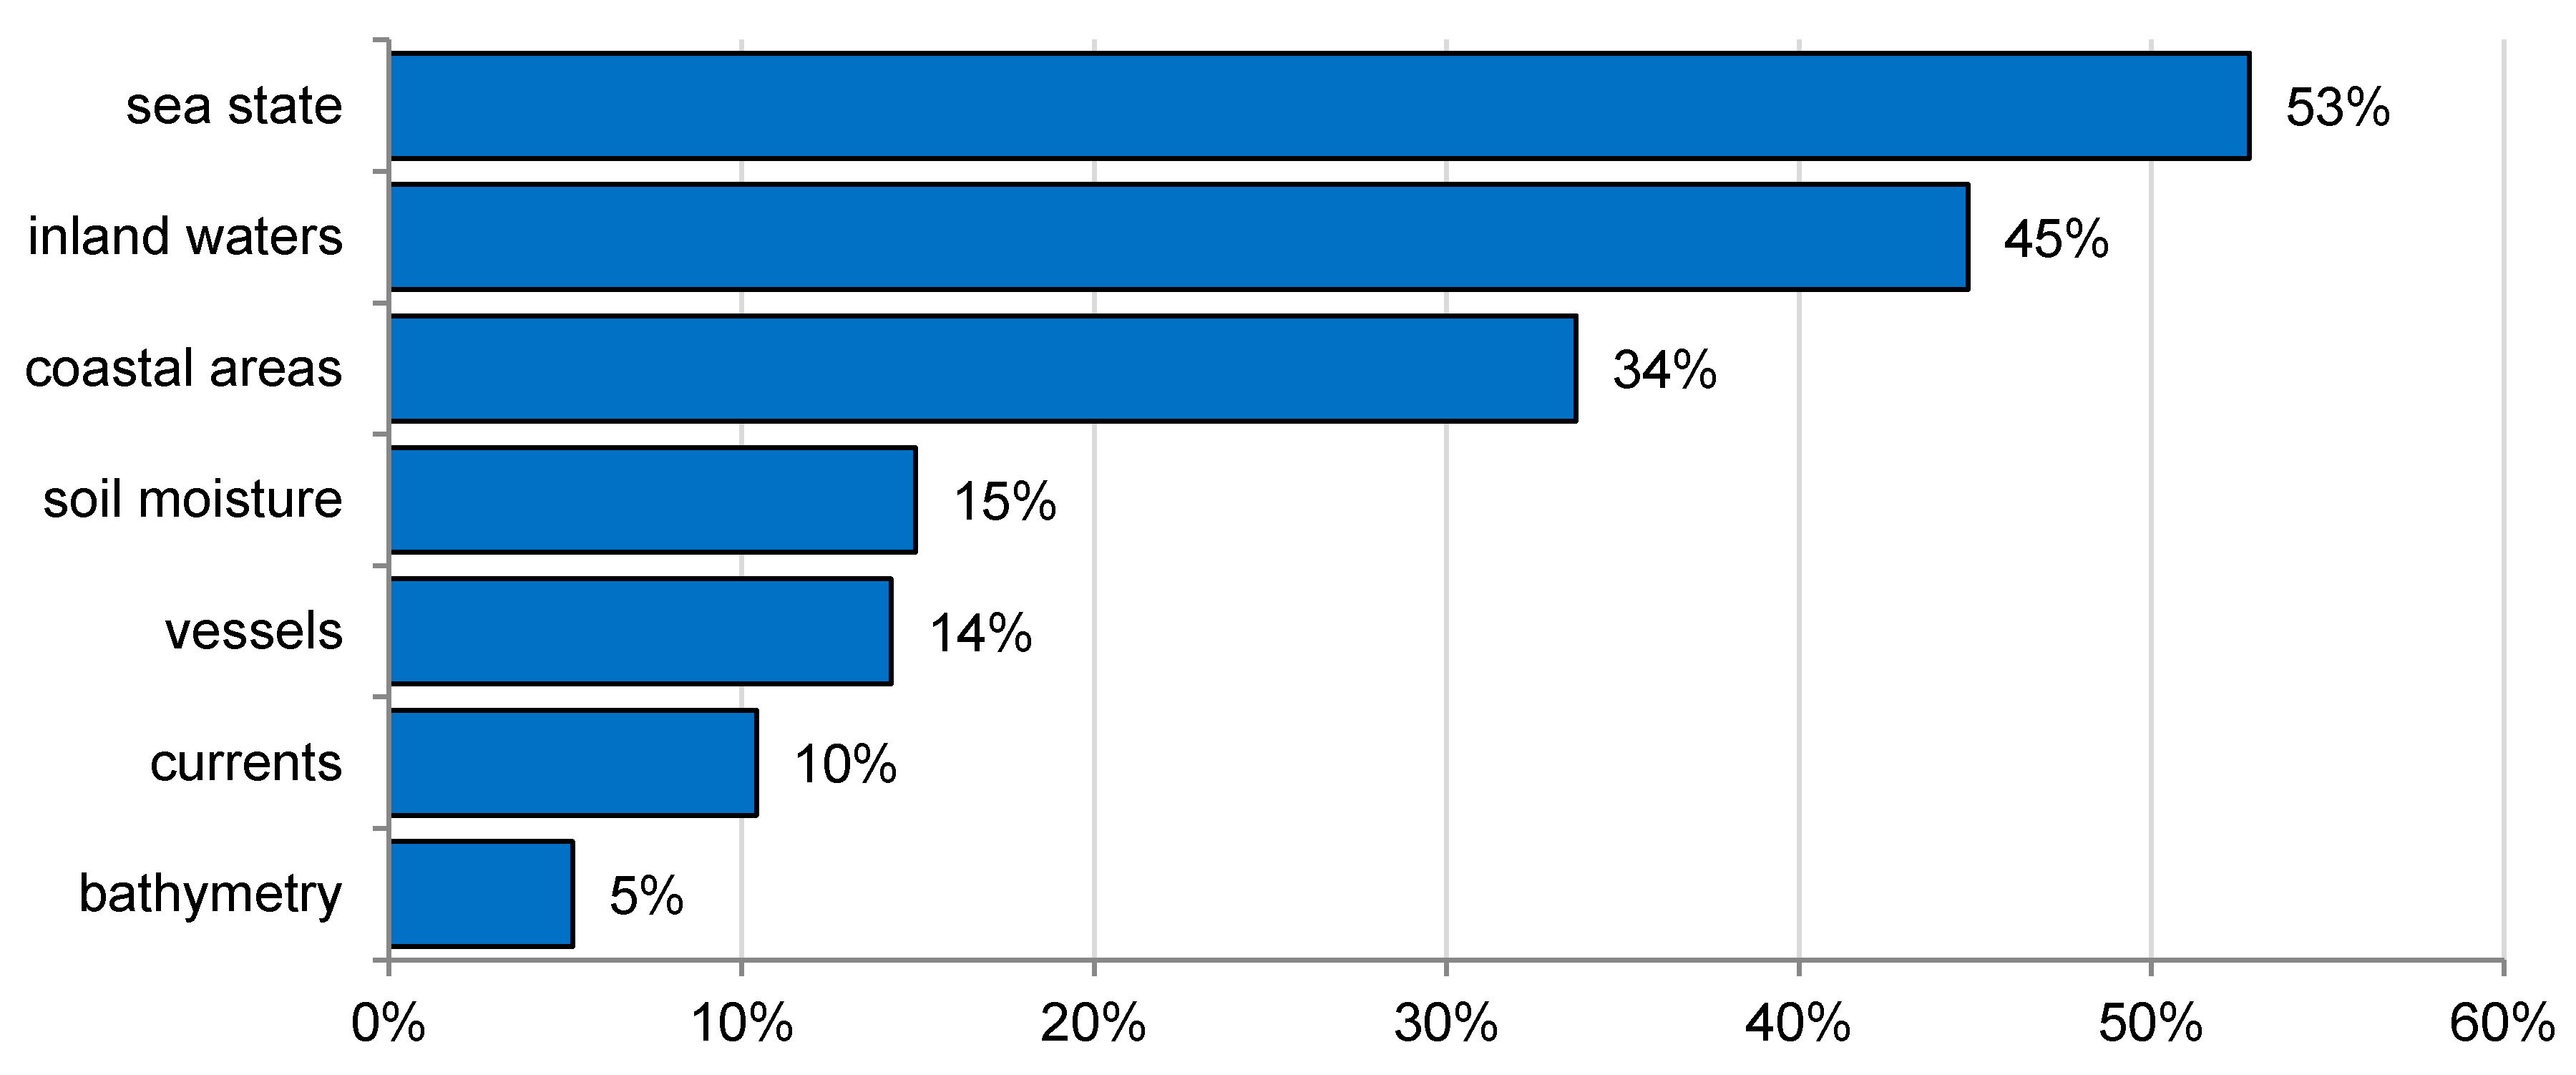
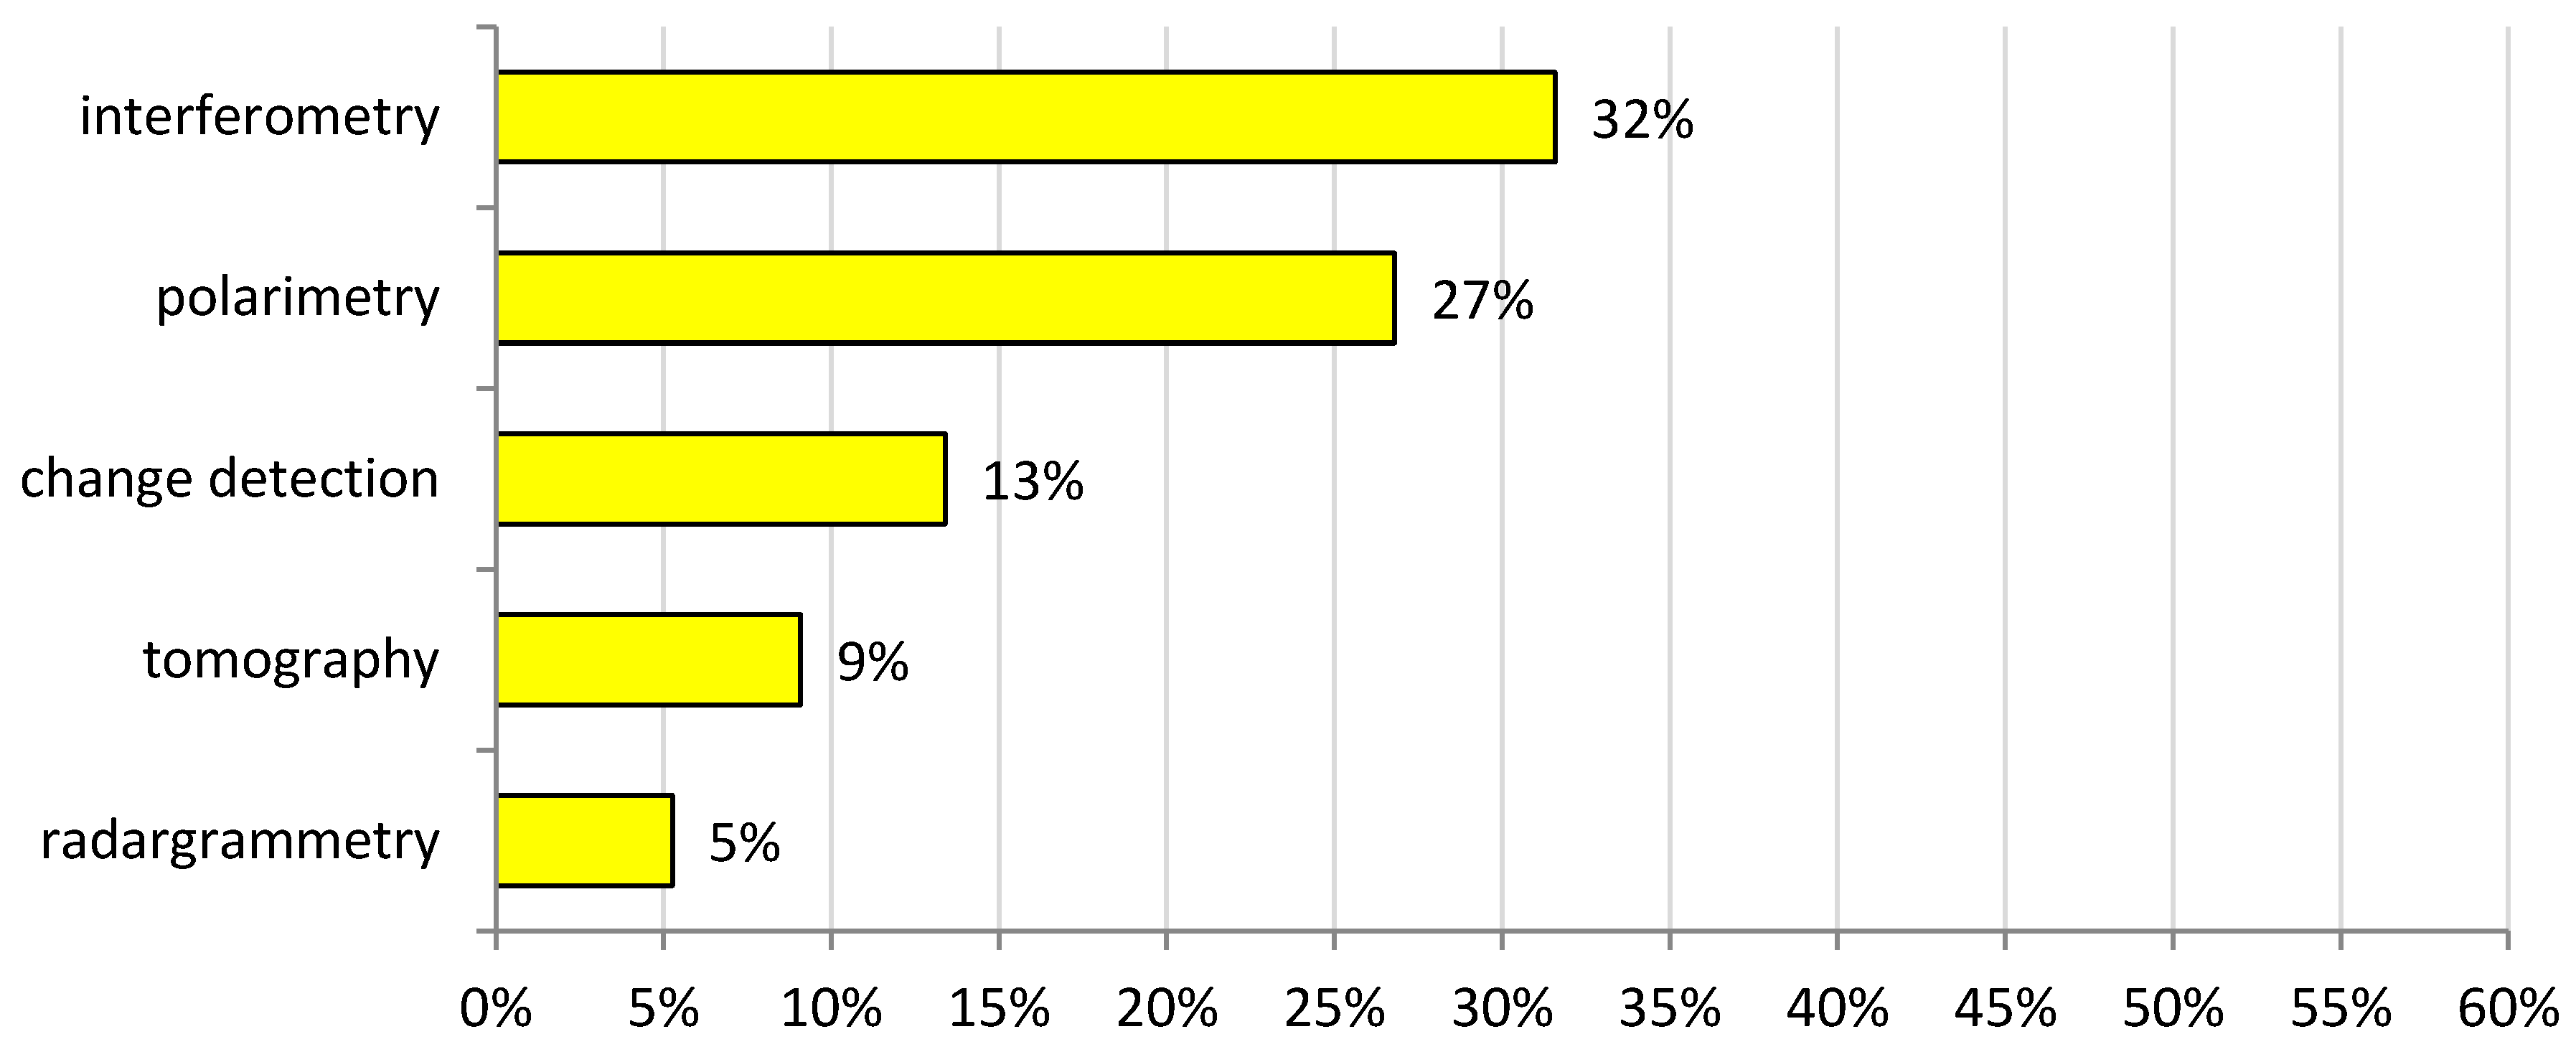
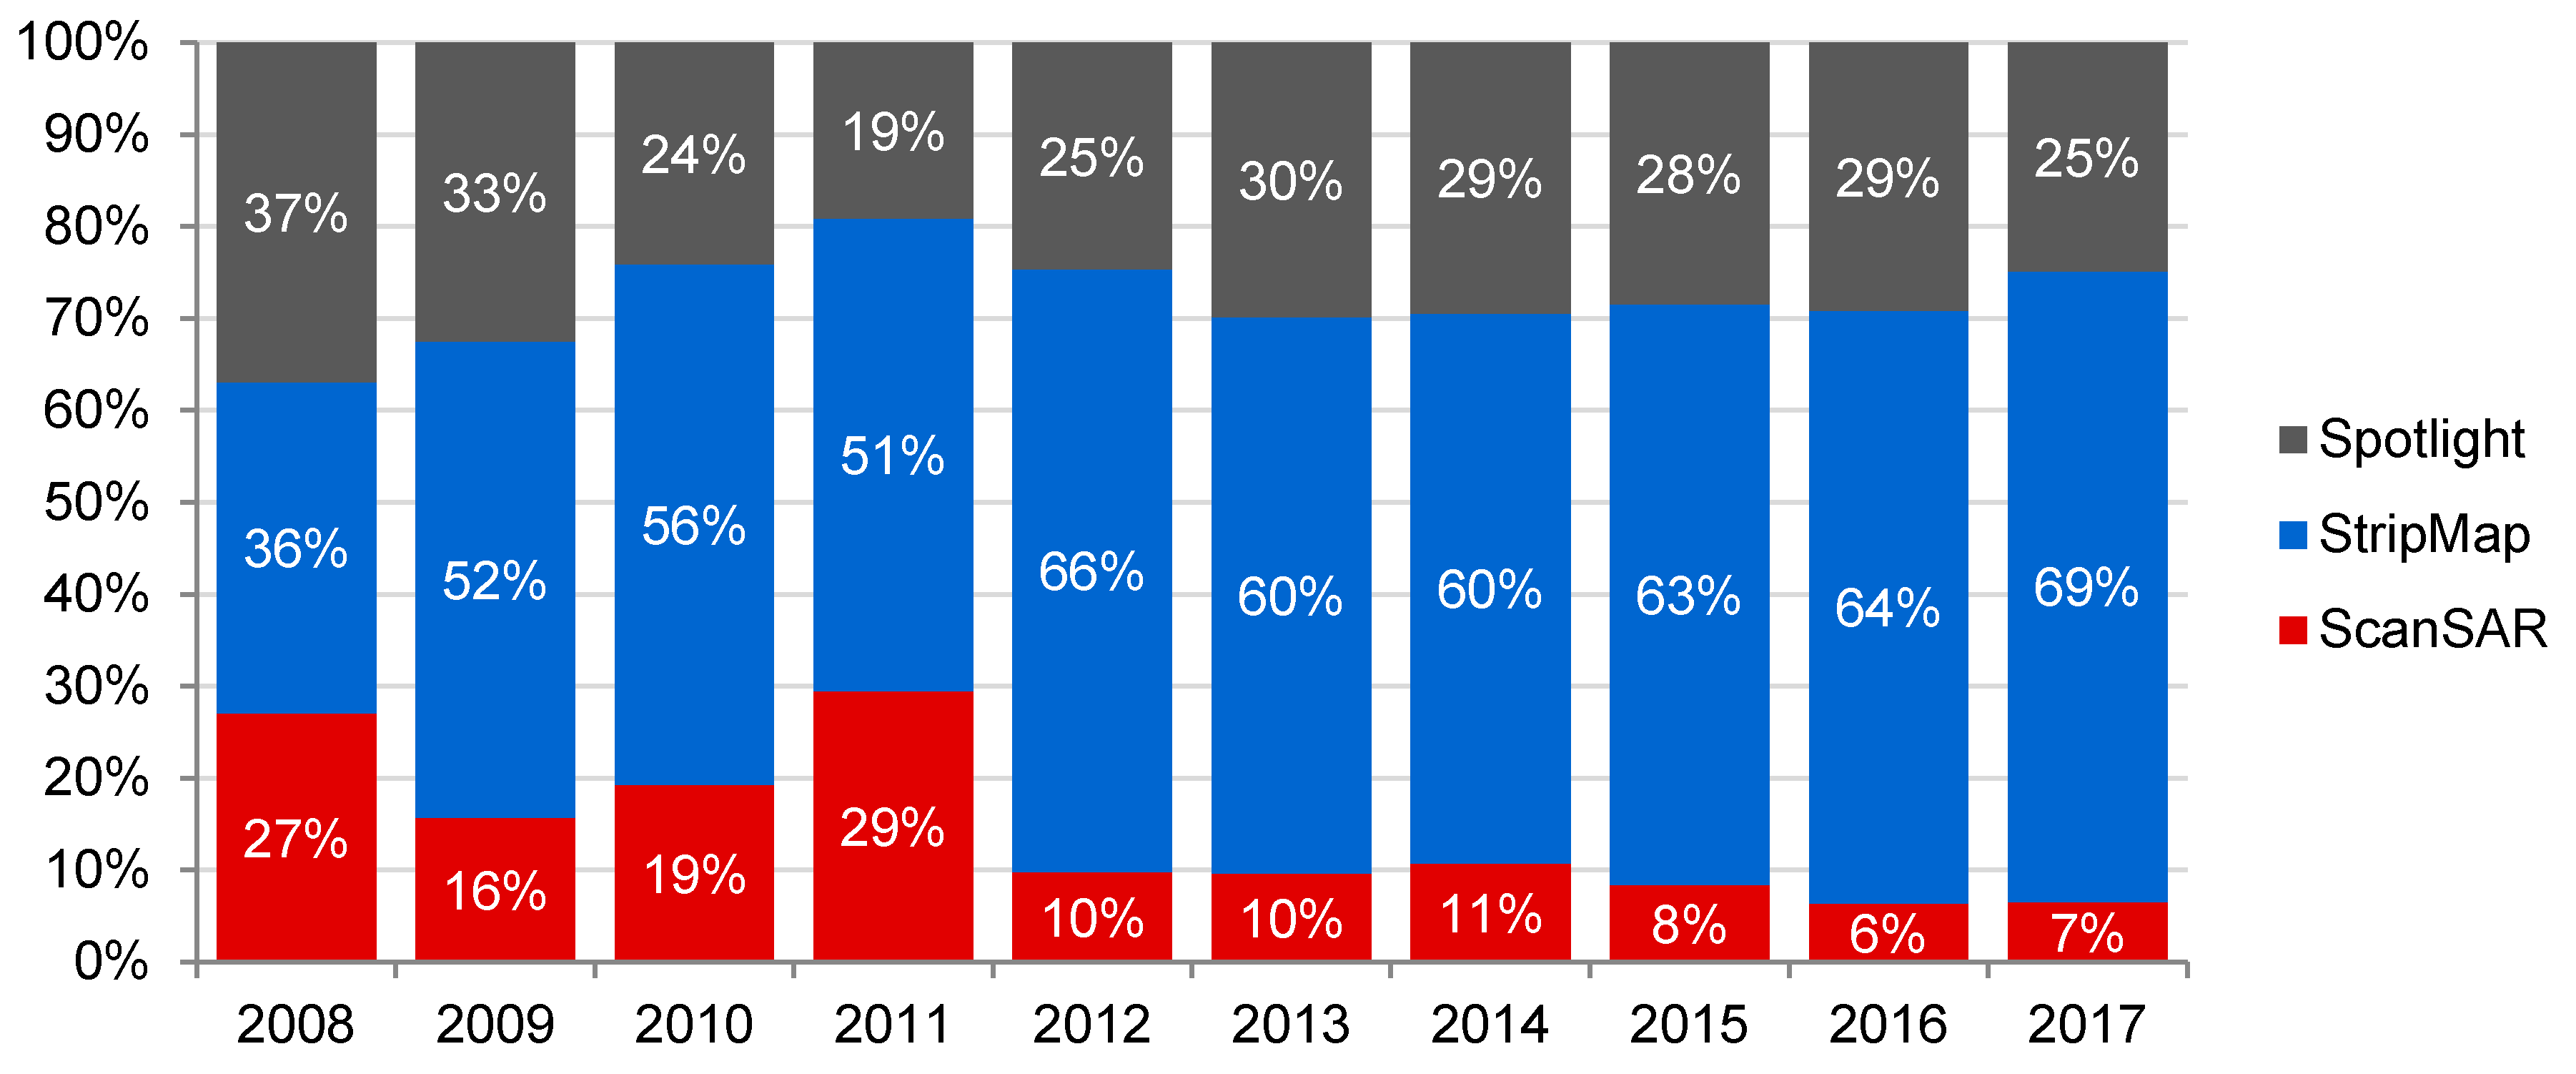
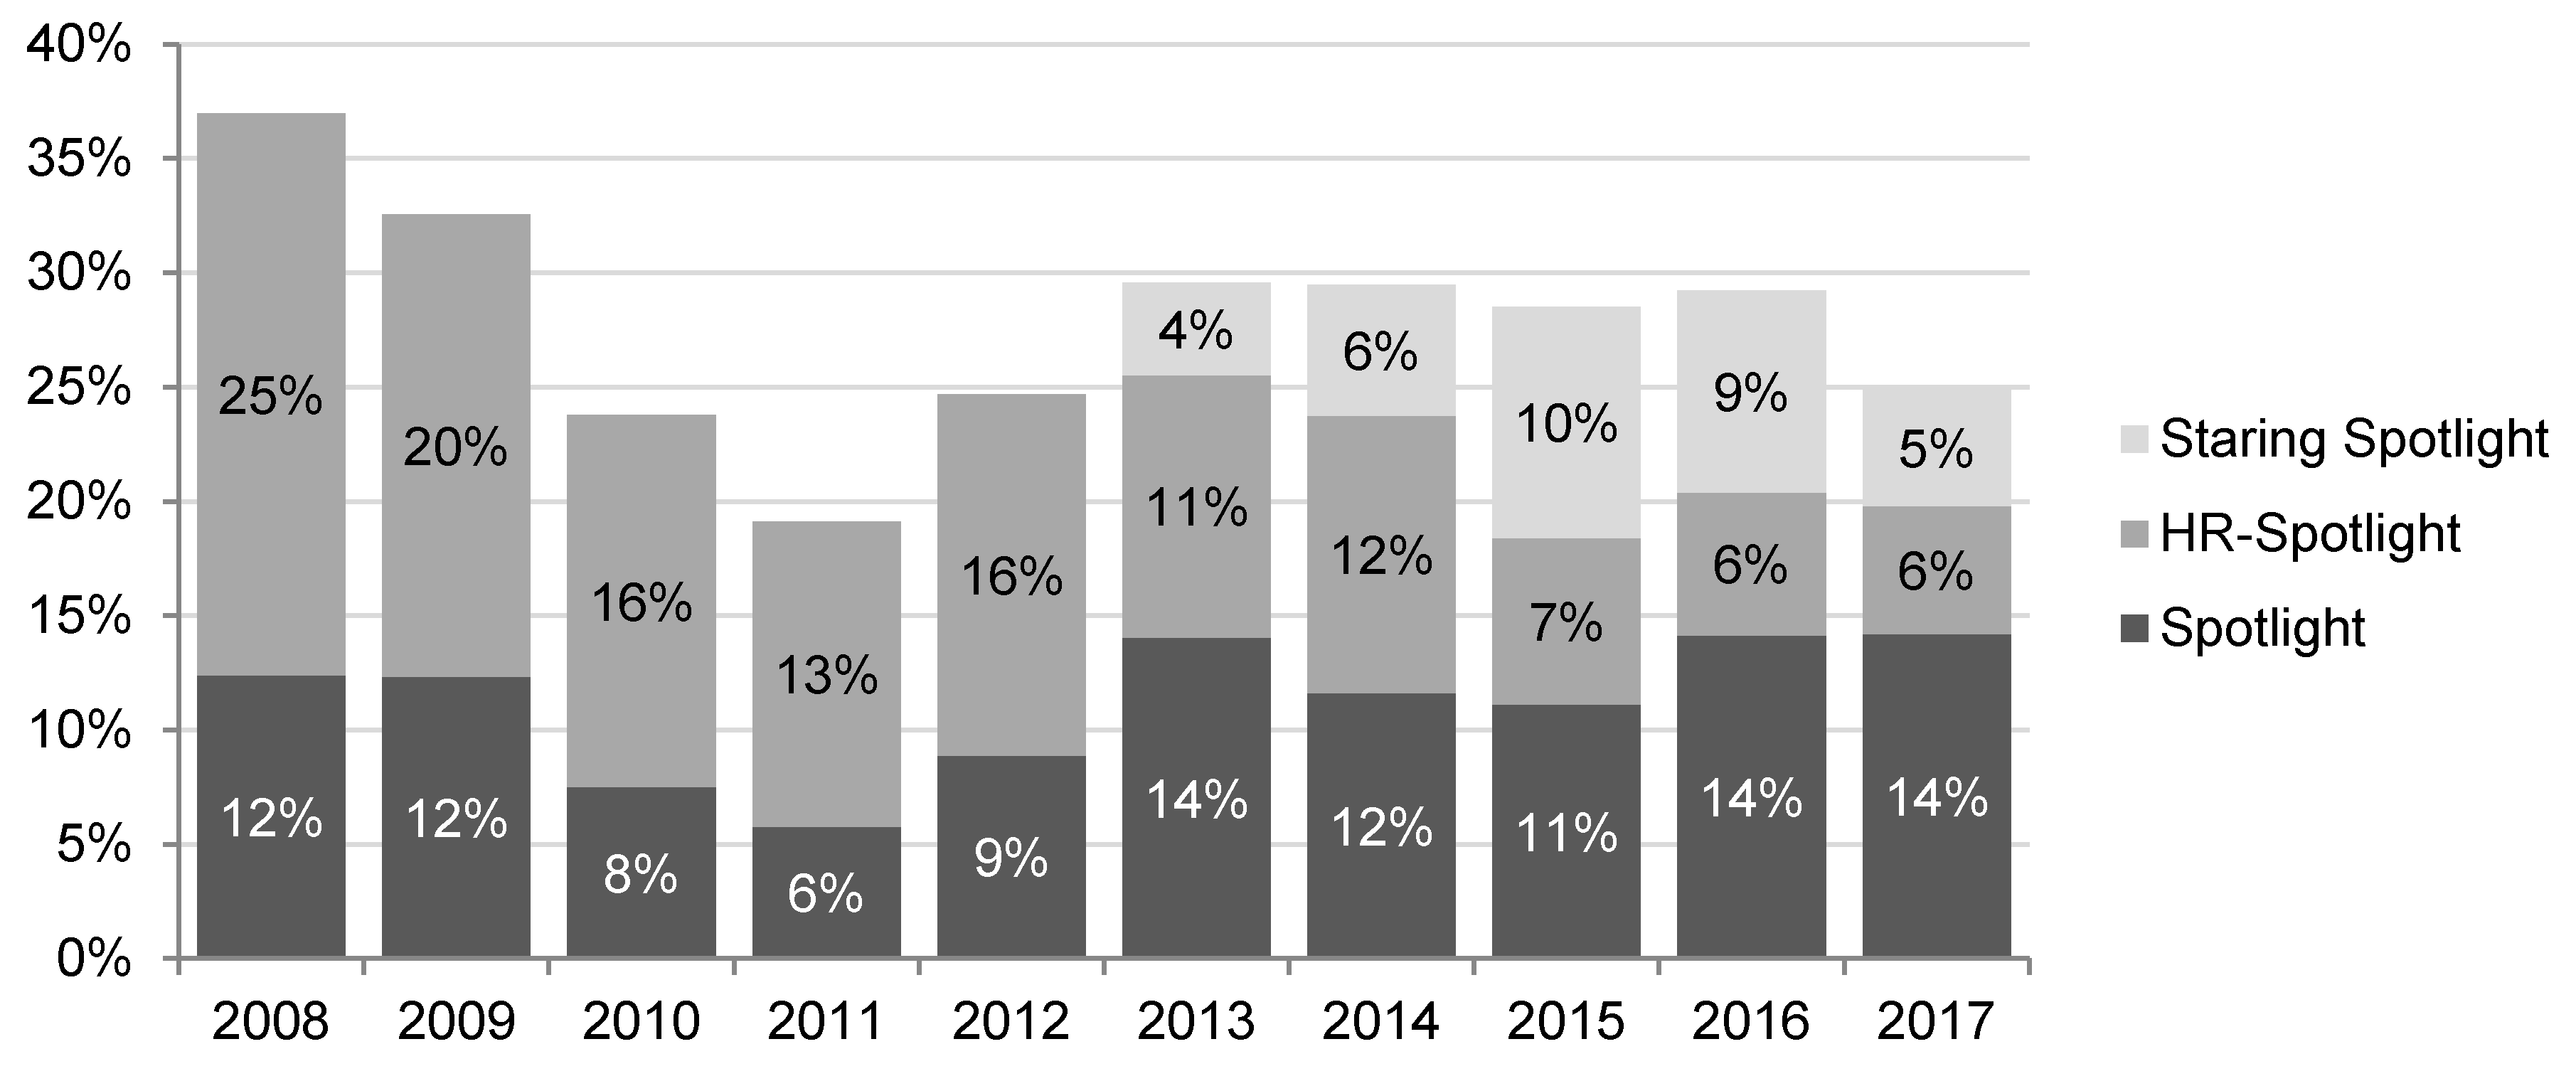
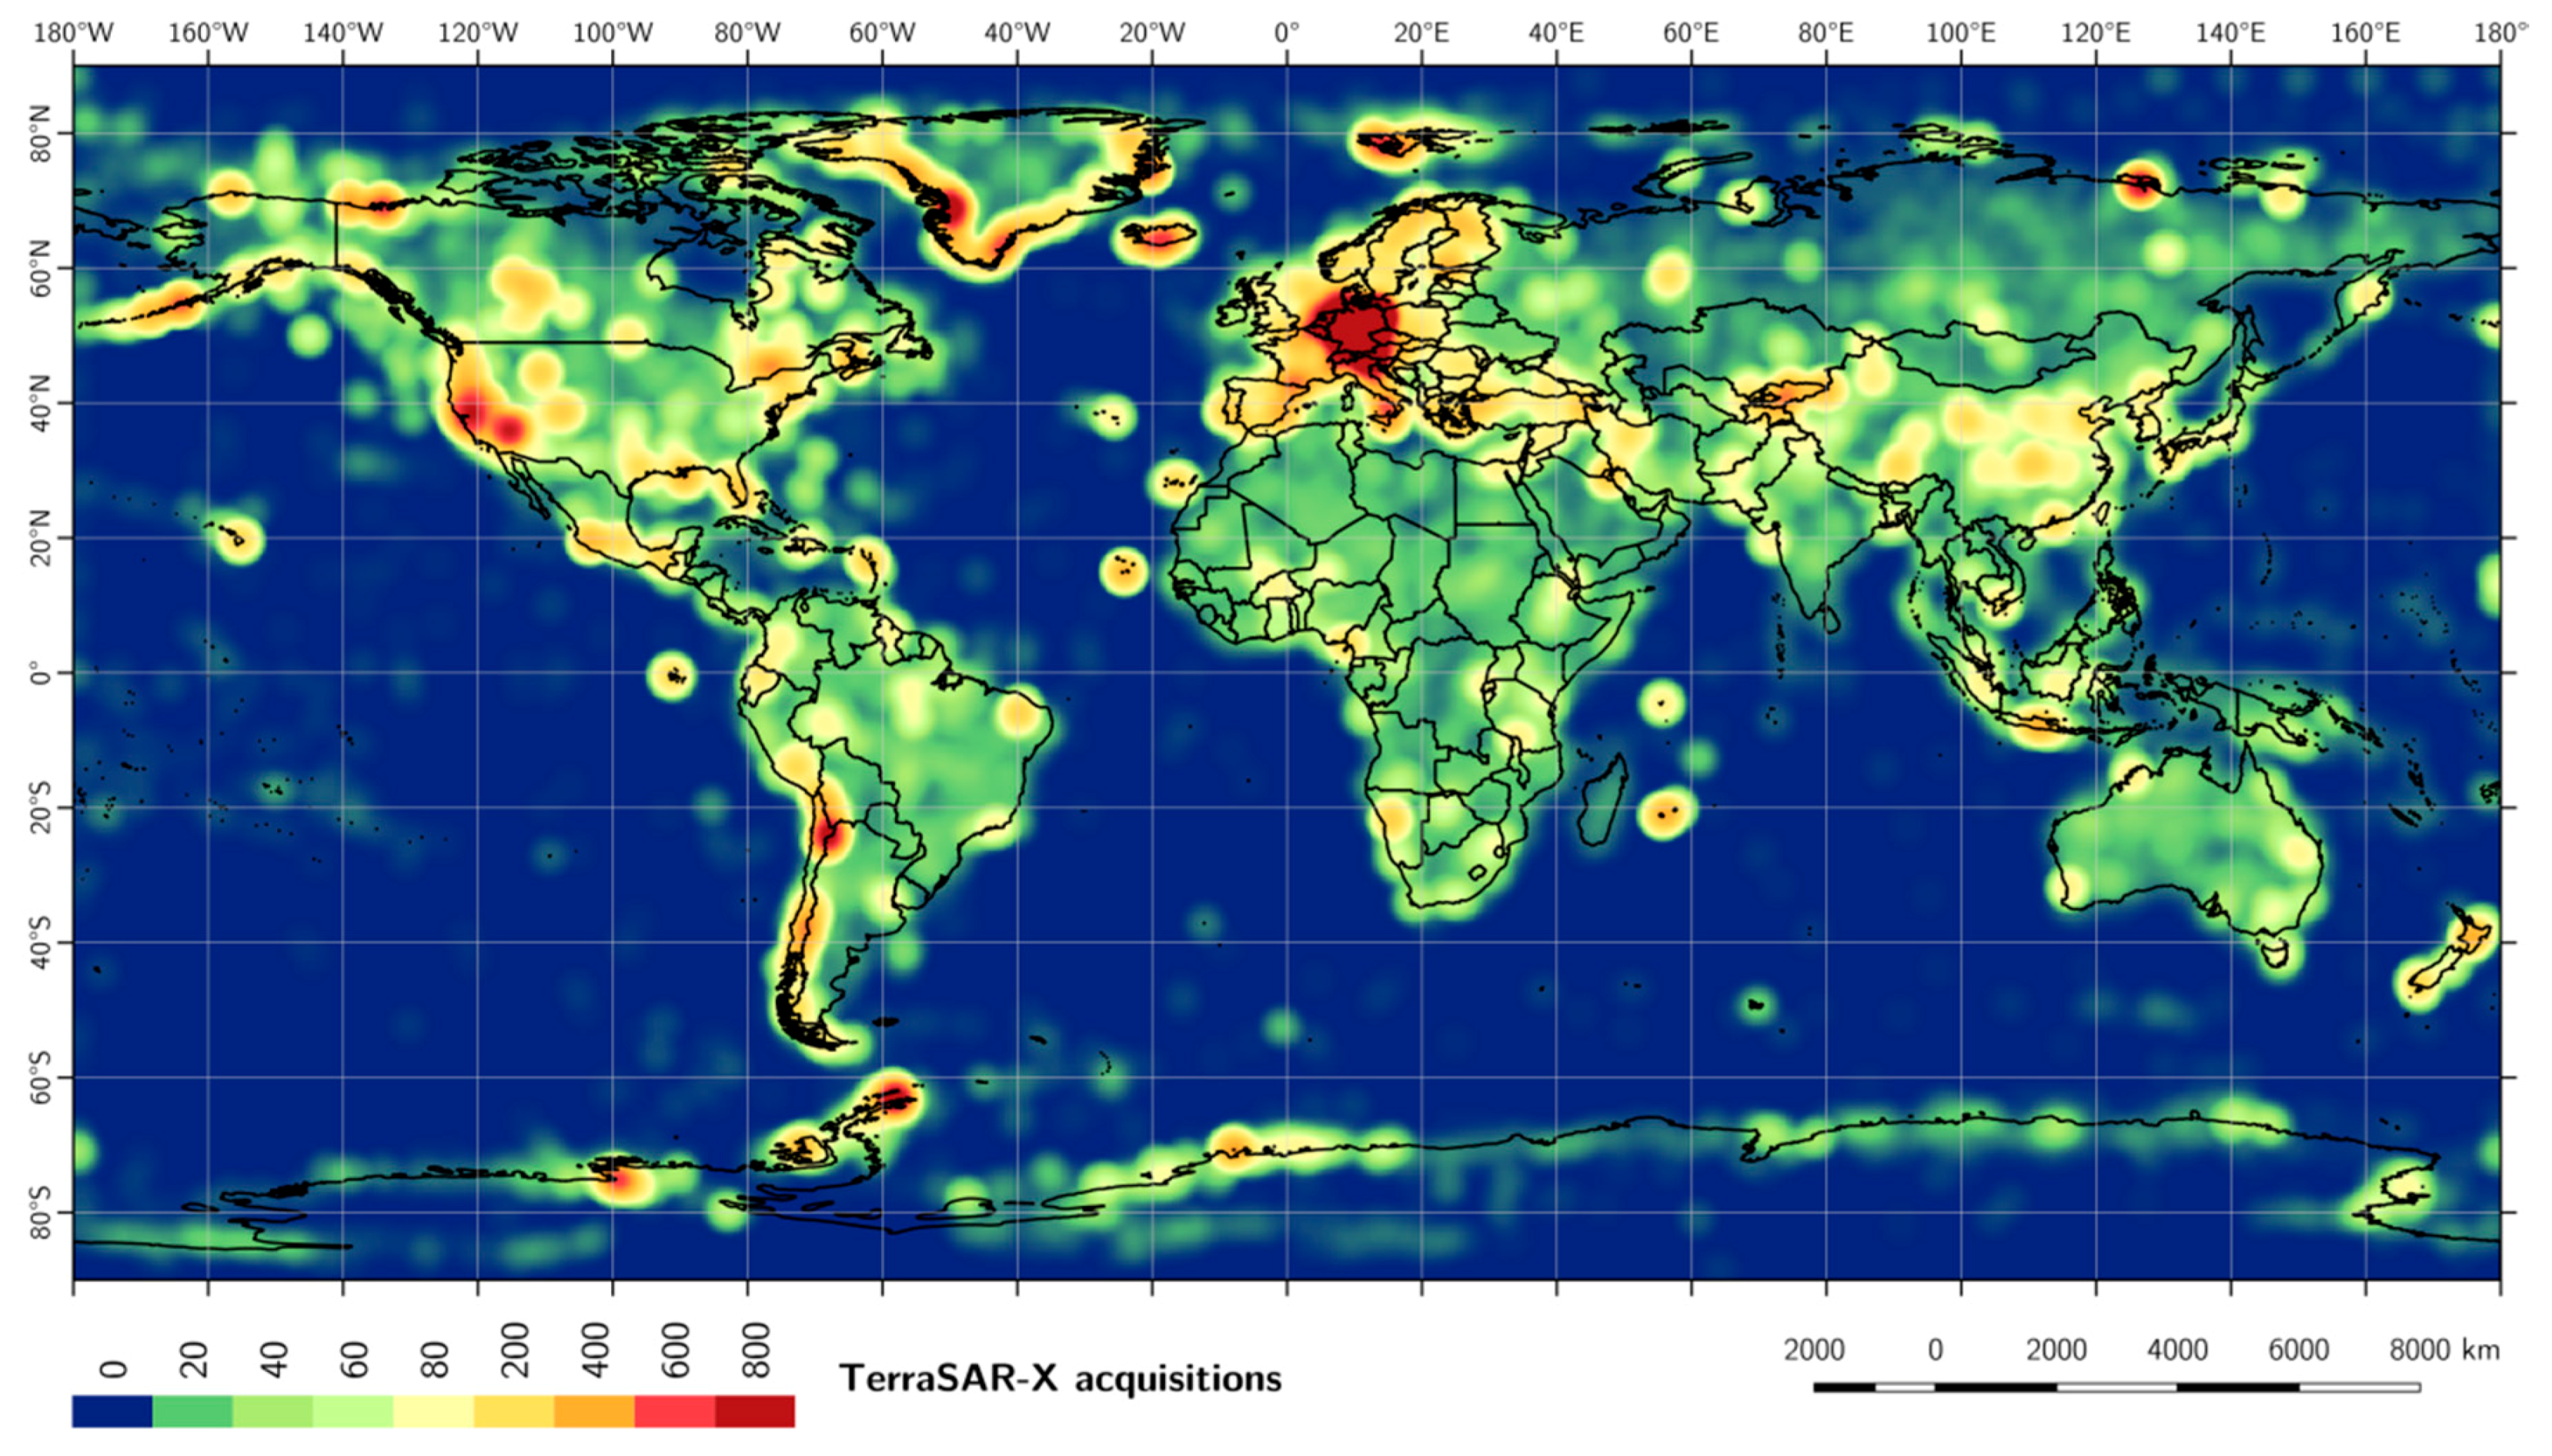
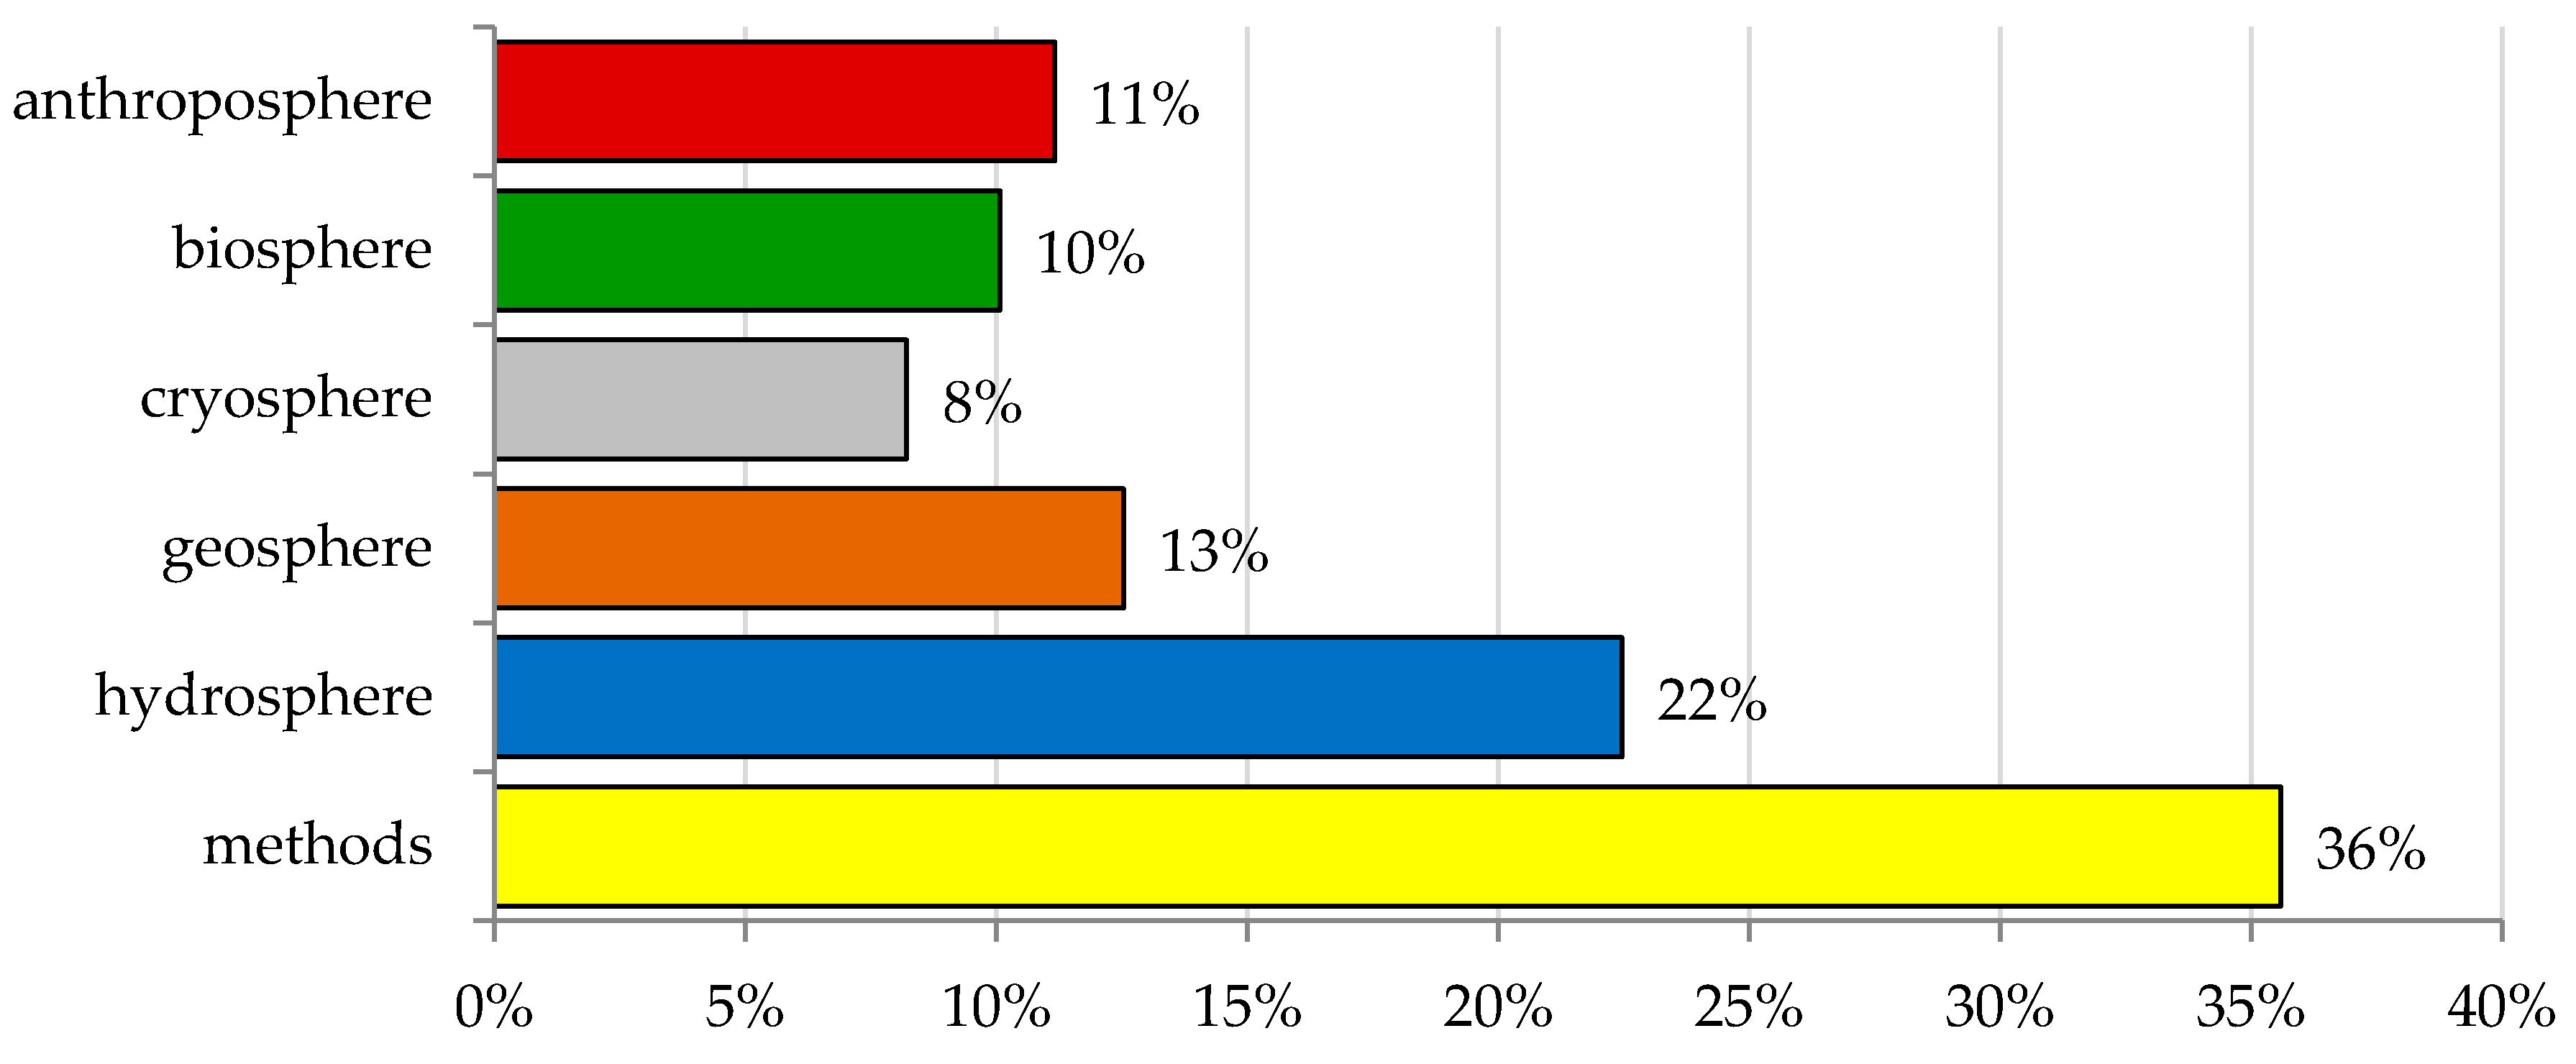
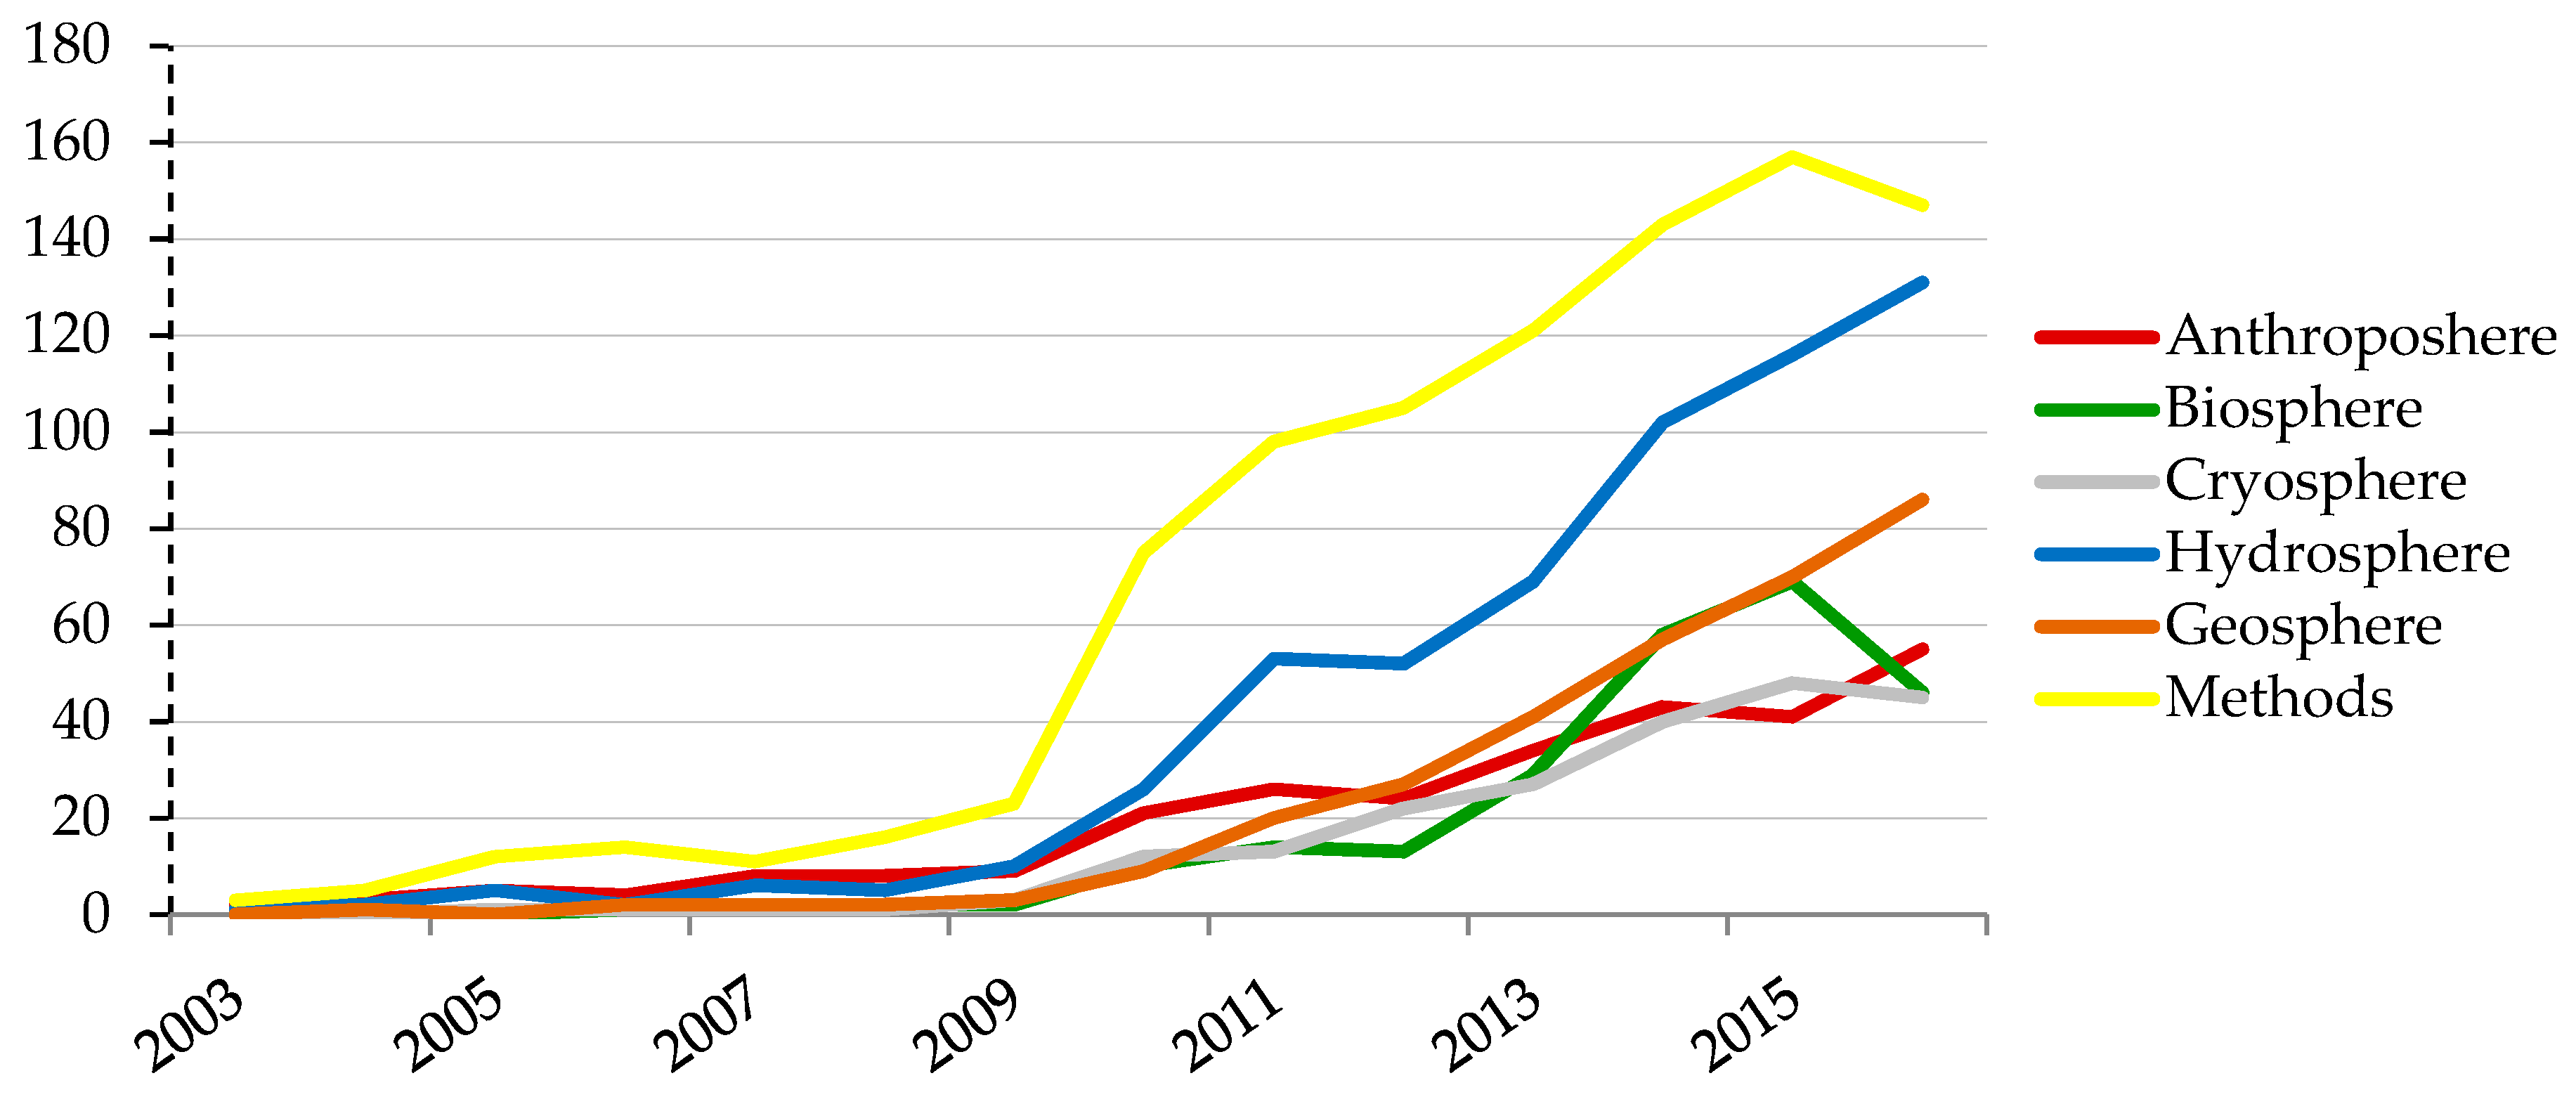
Table 1.
TerraSAR-X’s StripMap and ScanSAR mode parameters (modified from [23]).
Table 1.
TerraSAR-X’s StripMap and ScanSAR mode parameters (modified from [23]).
| Parameter | StripMap | 4 Beams ScanSAR | 6 Beams ScanSAR |
|---|---|---|---|
| Number of subswaths | 1 | 4 | 6 |
| Swath width (ground range) | 30 km 1, 15 km 2 | 100 km | 194 to 266 km |
| Nominal L1b product length | 50 km | 150 km | 200 km |
| Full performance incid. angle range | 20°–45° | 20°–45° | 15.6°–49° |
| Data access incidence angle range | 15°–60° | 15°–60° | 15.6°–49° |
| Azimuth resolution | 3.3 m 1, 6.6. m 2 | 18.5 m | 40 m |
| Ground range resolution | 1.7 m–3.49 m | 1.7 m–3.49 m | <7 m |
| Polarizations | HH or VV 1 HH/VV, HH/HV, VV/VH 2 | HH or VV | HH or VV |
1 single pol, 2 dual pol.
Table 2.
TerraSAR-X Spotlight mode parameters (modified from [23]).
Table 2.
TerraSAR-X Spotlight mode parameters (modified from [23]).
| Parameter | Spotlight | High Resolution Spotlight | Staring Spotlight |
|---|---|---|---|
| Number of subswaths | 1 | 4 | 6 |
| Scene extent (azimuth x ground range) | 5 km × 10 km | 5 km × 10 km | 2.5 km × 6 km |
| Full performance incid. angle range | 20°–55° | 20°–55° | 20°–45° |
| Data access incidence angle range | 15°–60° | 15°–60° | 15°–60° |
| Azimuth steering angle | Up to ± 0.75° | Up to ± 0.75° | ±2.2° |
| Azimuth resolution | 1.7 m 1, 3.4. m 2 | 1.1 m 1, 2.2. m 2 | 0.24 m 1 |
| Ground range resolution | 1.48 m–3.49 m | 1.48 m–3.49 m (150 MHz) | 0.85 m–1.77 m |
| 0.74 m–1.77 m (300 MHz) | |||
| Polarizations | HH or VV 1 | HH or VV 1 | HH or VV 1 |
| HH/VV 2 | HH/VV 2 |
1 single pol, 2 dual pol.
© 2018 by the authors. Licensee MDPI, Basel, Switzerland. This article is an open access article distributed under the terms and conditions of the Creative Commons Attribution (CC BY) license (http://creativecommons.org/licenses/by/4.0/).
Share and Cite
MDPI and ACS Style
Roth, A.; Marschalk, U.; Winkler, K.; Schättler, B.; Huber, M.; Georg, I.; Künzer, C.; Dech, S. Ten Years of Experience with Scientific TerraSAR-X Data Utilization. Remote Sens. 2018, 10, 1170. https://doi.org/10.3390/rs10081170
AMA Style
Roth A, Marschalk U, Winkler K, Schättler B, Huber M, Georg I, Künzer C, Dech S. Ten Years of Experience with Scientific TerraSAR-X Data Utilization. Remote Sensing. 2018; 10(8):1170. https://doi.org/10.3390/rs10081170
Chicago/Turabian StyleRoth, Achim, Ursula Marschalk, Karina Winkler, Birgit Schättler, Martin Huber, Isabel Georg, Claudia Künzer, and Stefan Dech. 2018. "Ten Years of Experience with Scientific TerraSAR-X Data Utilization" Remote Sensing 10, no. 8: 1170. https://doi.org/10.3390/rs10081170
Note that from the first issue of 2016, this journal uses article numbers instead of page numbers. See further details here.