Extraction of γ-Alumina from Low-Cost Kaolin


Department of Earth and Environmental Sciences, Hashemite University, P.O. Box 150459, Zarqa 13115, Jordan
*
Author to whom correspondence should be addressed.
Resources 2018, 7(4), 63; https://doi.org/10.3390/resources7040063
Submission received: 30 July 2018
/
Revised: 19 September 2018
/
Accepted: 20 September 2018
/
Published: 25 September 2018
Abstract
:A combined process is proposed for the utilization of local kaolin to produce alumina particles. The applied process is made in two stages: calcination at 700 °C with sodium chloride and leaching with sulfuric followed by hydrochloric acids. The optimal extraction efficiency can be obtained when the conditions are as follows: leaching temperature is at 140 °C, leaching time is 3 h 45 min and concentration of sulfuric acid is 40 wt.%. The results show that the purity of alumina reaches 79.28%, which is suitable for the production of aluminum metal. It is evident that this method of extraction of alumina from the kaolin ash is practical and feasible. The structural and morphological properties of the calcined microcrystalline powder was characterized by X-ray diffraction and scanning electron microscope (SEM).
1. Introduction
Alumina is an important industrial mineral, which can be used as catalyst, abrasive and as adsorbent [1,2,3,4]. Alumina exists as stable form (α-alumina) and in a variety of meta-stable forms including γ-, η-, δ-, θ-, κ- and χ-alumina [5,6]. Alumina occurs naturally pure in form of the mineral corundum, although the most important natural ore for alumina is bauxite. Bauxites have been widely used in industry to produce alumina via the Bayer process [7]. Bauxite occurrences were not reported in Jordan. However, one of the alternative sources is the Al-rich kaolin, which is a hydrous aluminum silicate (Al2Si2O5(OH)4) made of the mineral kaolinite.
The development of a process for the extraction of alumina from clay was first proposed by Hoffman et al. [8]. The process consists of: (1) roasting clay at about 700 °C; (2) digesting the roasted product with dilute hydrochloric acid; (3) filtering to separate the insoluble siliceous matter from the solution containing the aluminum and soluble impurities, such as iron and alkali salts; (4) concentrating the solution; (5) precipitating the aluminum as the hydrated chloride from the concentrated solution by adding hydrochloric acid gas; (6) removing the crystals of hydrated aluminum chloride; (7) washing the crystals to remove adhering impurities; (8) calcining the hydrated chloride to obtain alumina; and (9) recovering hydrochloric acid from the waste products at the end of the process. Synthesis of alumina from kaolin were also described by Hulbert and Huff [9] by comparing acid-leaching of a calcined kaolin using nitric, sulfuric and hydrochloric acid. They concluded that the rate of alumina leaching is fastest with hydrochloric acid, slower with sulfuric acid, and slowest with nitric acid. Recent development regarding alumina production can be found in several publications [4,7,10,11,12,13]. Some examples of alumina production from kaolin comes from Nigeria and Saudi Arabia. γ-Al2O3 was synthesized using Kankara kaolin in Nigeria [4]. The process consists of calcination at 750 °C for 2 h to prepare metakaolin, followed by leaching with 96 wt.% H2SO4 and reaction with ammonium sulfate to form ammonium aluminum sulfate. Calcination at 850 °C for 3 h of ammonium aluminum sulfate was employed to obtain the γ-alumina [4]. The corresponding alumina extraction was about 85%. Kaolin from Riyadh area in Saudi Arabia was calcined at temperatures varying between 400 °C and 800 °C for different calcination periods (5–120 min). The calcined kaolin was then leached with 3 M HCl acid under different leaching conditions [11]. The corresponding alumina extraction was about 63%.
Wide occurrences of kaolin are reported in Jordan [14,15,16], the most important of which are those occurring in south Jordan. Kaolin in south Jordan is thought as a suitable substitute from which alumina of high purity can be produced. The demand for alumina is increasing in Jordan as it is used in the ever-growing phosphoric acid and fertilizer industry, therefore increase in Jordan imports for alumina and other Al-sources are reported. Al-source is used to produce aluminum fluoride as a by-product. The objective of the paper is to assess the suitability of producing alumina by utilizing low cost raw materials such as the known huge kaolin deposits in south Jordan occurring in Harad Formation and the rock salt (sodium chloride) that occurs in huge amount in the Dead Sea and being extracted as by-product during potash harvesting. The process we applied in alumina extraction is a modified process different from these described earlier. The main goal of modification is to reduce preparation costs by utilizing low-price raw materials and enhance purity of the product by increasing the efficiency of alumina extraction.
2. Geological Setting
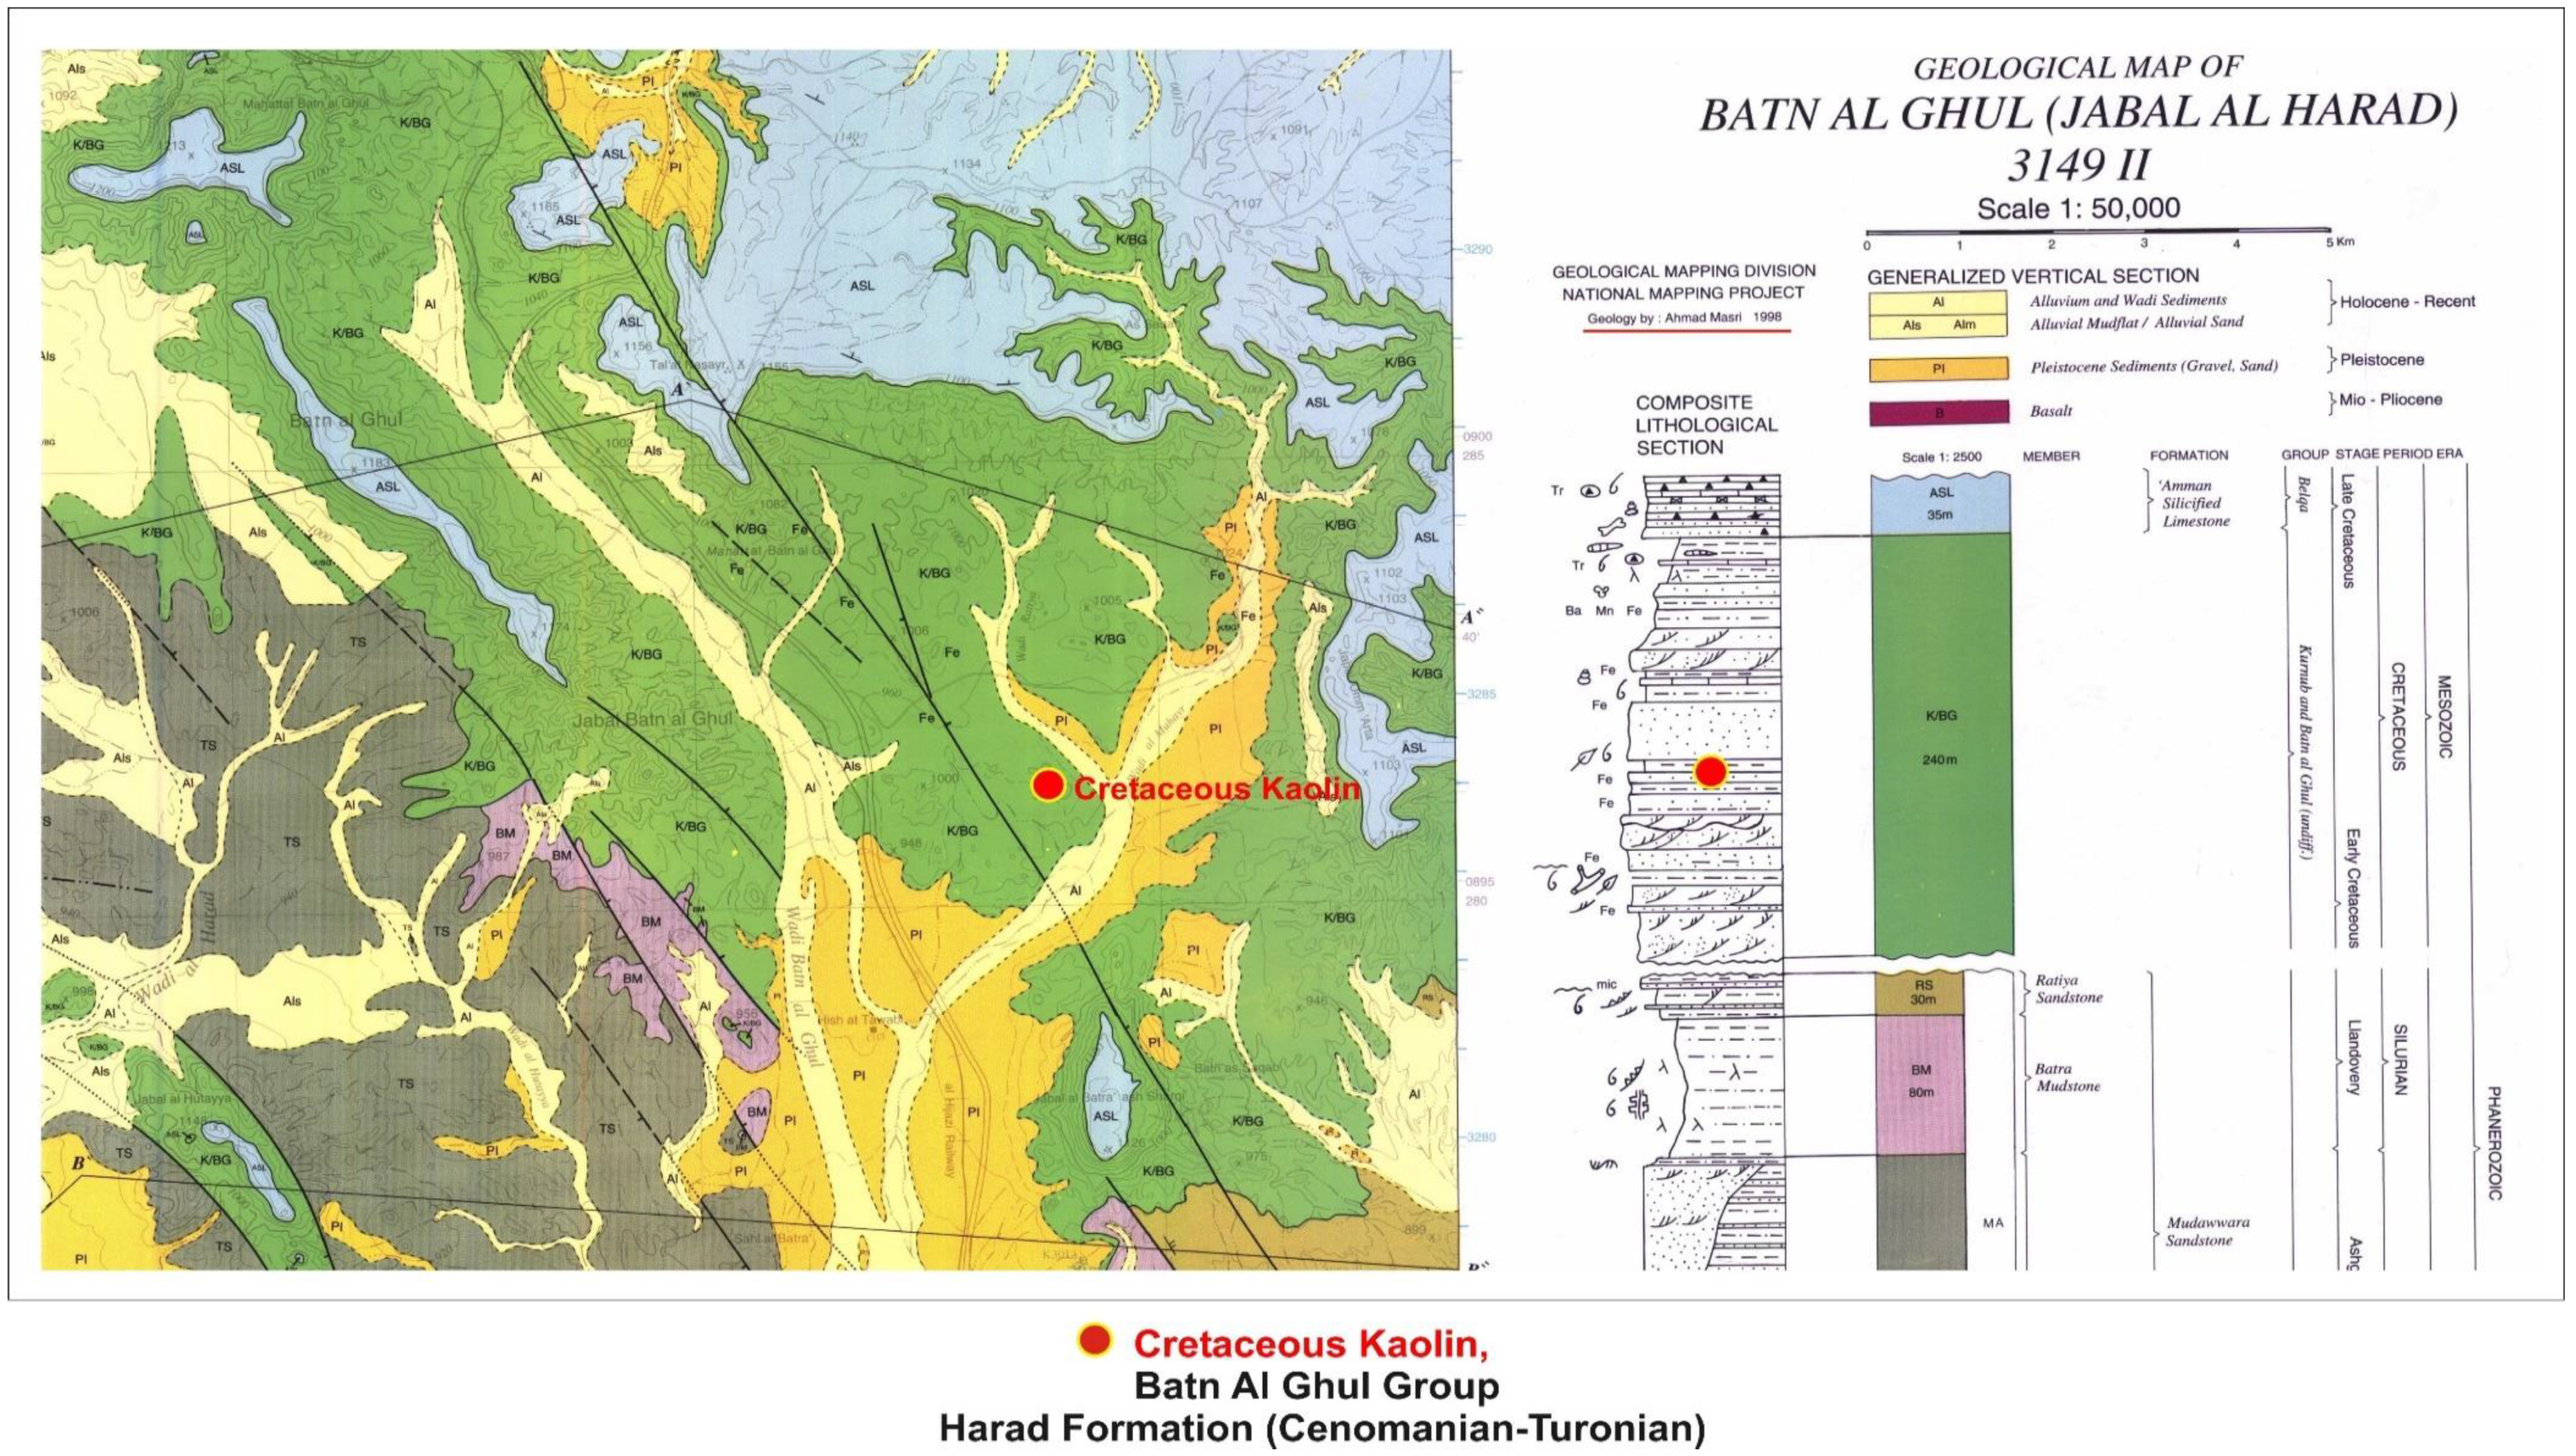
The combined name Kurnub/Batn Al Ghul (K/BG) was first used by Masri [17] and later by others [18,19] to incorporate the entire siliciclastic sequence exposed in Batn Al Ghul area underlain by Paleozoic rocks and overlain by the Campanian Amman Silicified Limestone (Figure 1). The K/BG is 240–150 m thick, generally consists of fine-, medium- to coarse-grained, varicolored, cross-bedded, moderate to well-sorted sand and sandstone interbedded with silty clay, clay, mottled clayey silt, clayey sand, siltstone and iron crusts [18,19]. It has been subdivided into two formations which are Harad and Fassu’a formations [19]. Kaolin samples of this study are Cenomanian-Turonian age [17]. They were collected from the Harad Formation, about 75 Km to southeast of Ma’an city within coordinates (29°39′3.94″ N and 35°57′20.17″ E).
Preliminary evaluation of the Harad Formation kaolin deposit indicates that the kaolin, after beneficiation process, is suitable for low price applications such as manufacturing of common bricks, medium-fired bricks and sanitary ware [20]. According to Yasin and Ghannam [16], the total inferred resource of the kaolin in the Harad Formation is about 2.2 billion ton with thickness varying from 7.5 to 47 m. The annual extraction in 2004 and 2005 was 30,000 Ton. The produced kaolin is used mainly in cement and ceramic industries and prices are always low, less than 5 US$/ton [16].
3. Material and Method
Representative kaolin sample was first cleaned from the weathering crust and carbonate by using diluted acetic acid and distilled water. The sample was then crushed and powdered and screened to particles size below 75 μm. All of chemical used are analytical grades. Mineralogical and chemical characterization of the kaolin sample and the end products was carried out by X-ray diffraction (XRD) technique and X-ray Fluorescence (XRF). The following analytical instruments were used: Shimadzu X-ray diffractometer (MAXima XRD-7000); Shimadzu X-ray Fluorescence (Lap Center XRF-1800); and Bruker X-ray Fluorescence (S4 Pioneer). For morphological structure and identification of the powder size, samples were analyzed using SEM.
4. Experimental Work
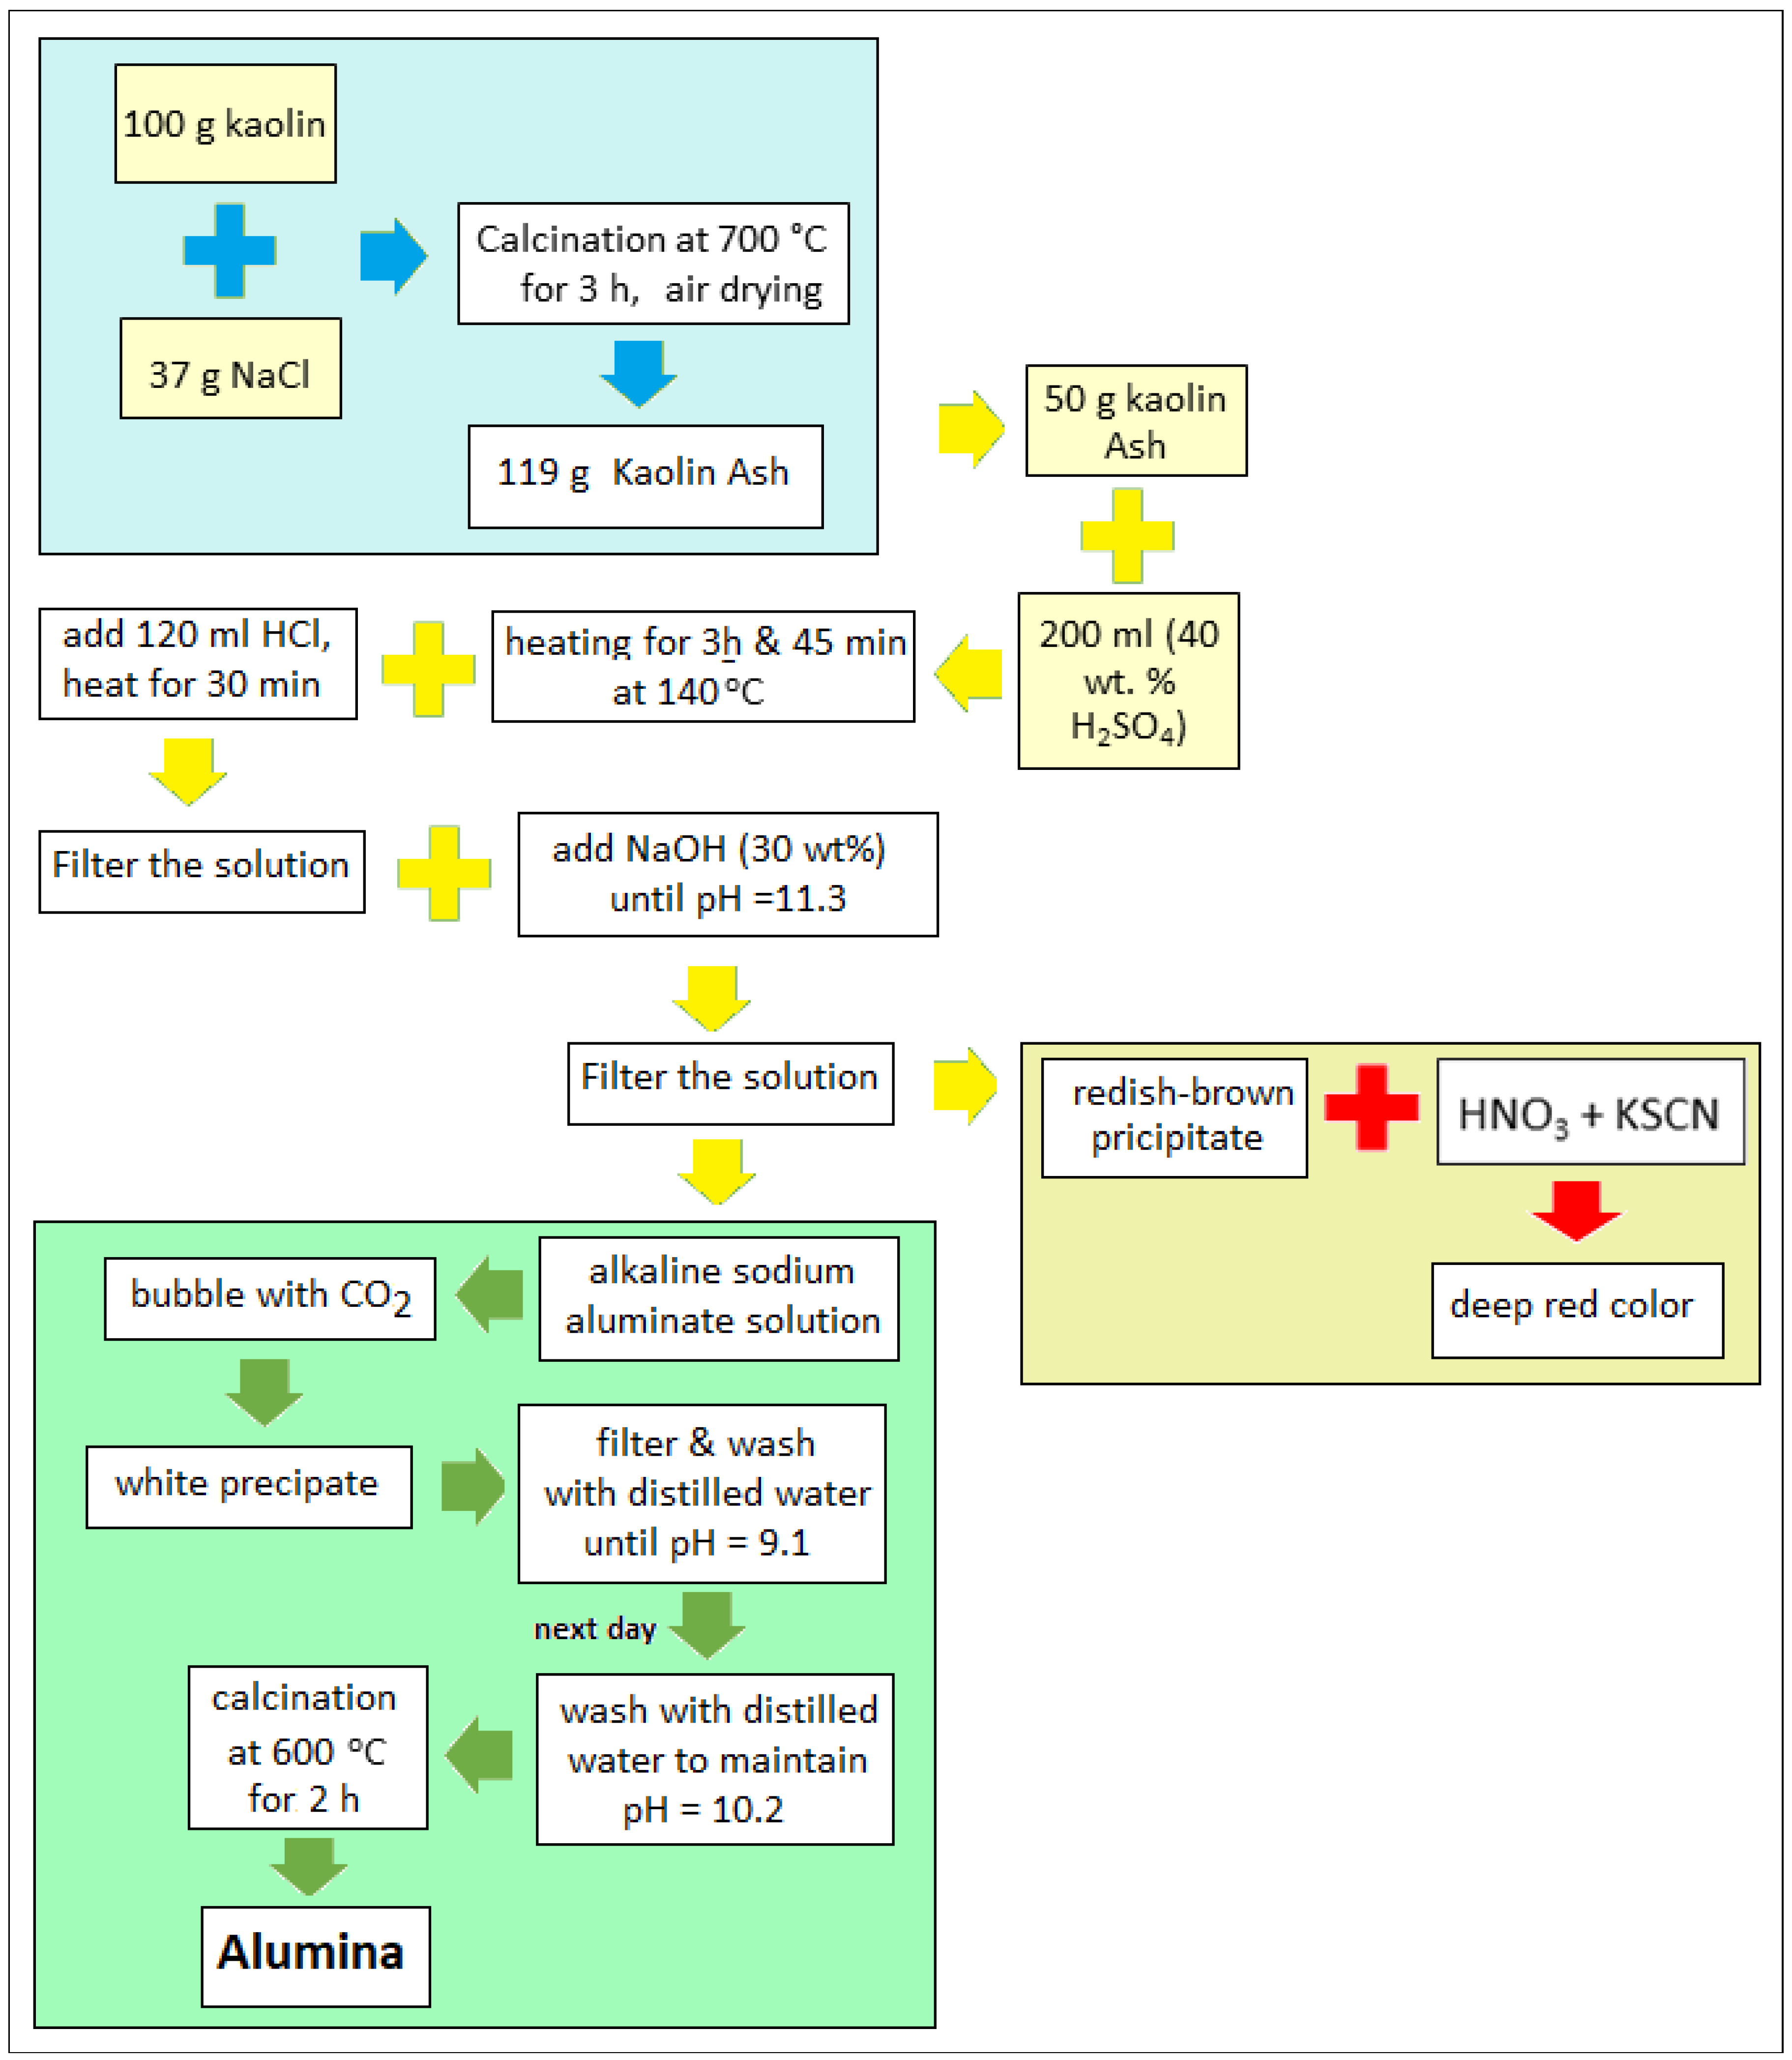
A porcelain boat, containing 100 g kaolin and 37 g halite (sodium chloride), was calcined at 700 °C for 3 h and then air-dried and 119 g of kaolin ash were obtained as illustrated in the flowchart in Figure 2. The use of halite in the calcination is a slight modification from the processes described earlier by Hoffman et al. [8], Hulbert and Huff [9] and others [4,7,10,11,12,13]. The advantage of using halite is to reduce quantities and concentration of H2SO4 compared with other works which lead to reduce cost of production and enhanced extraction efficiency.
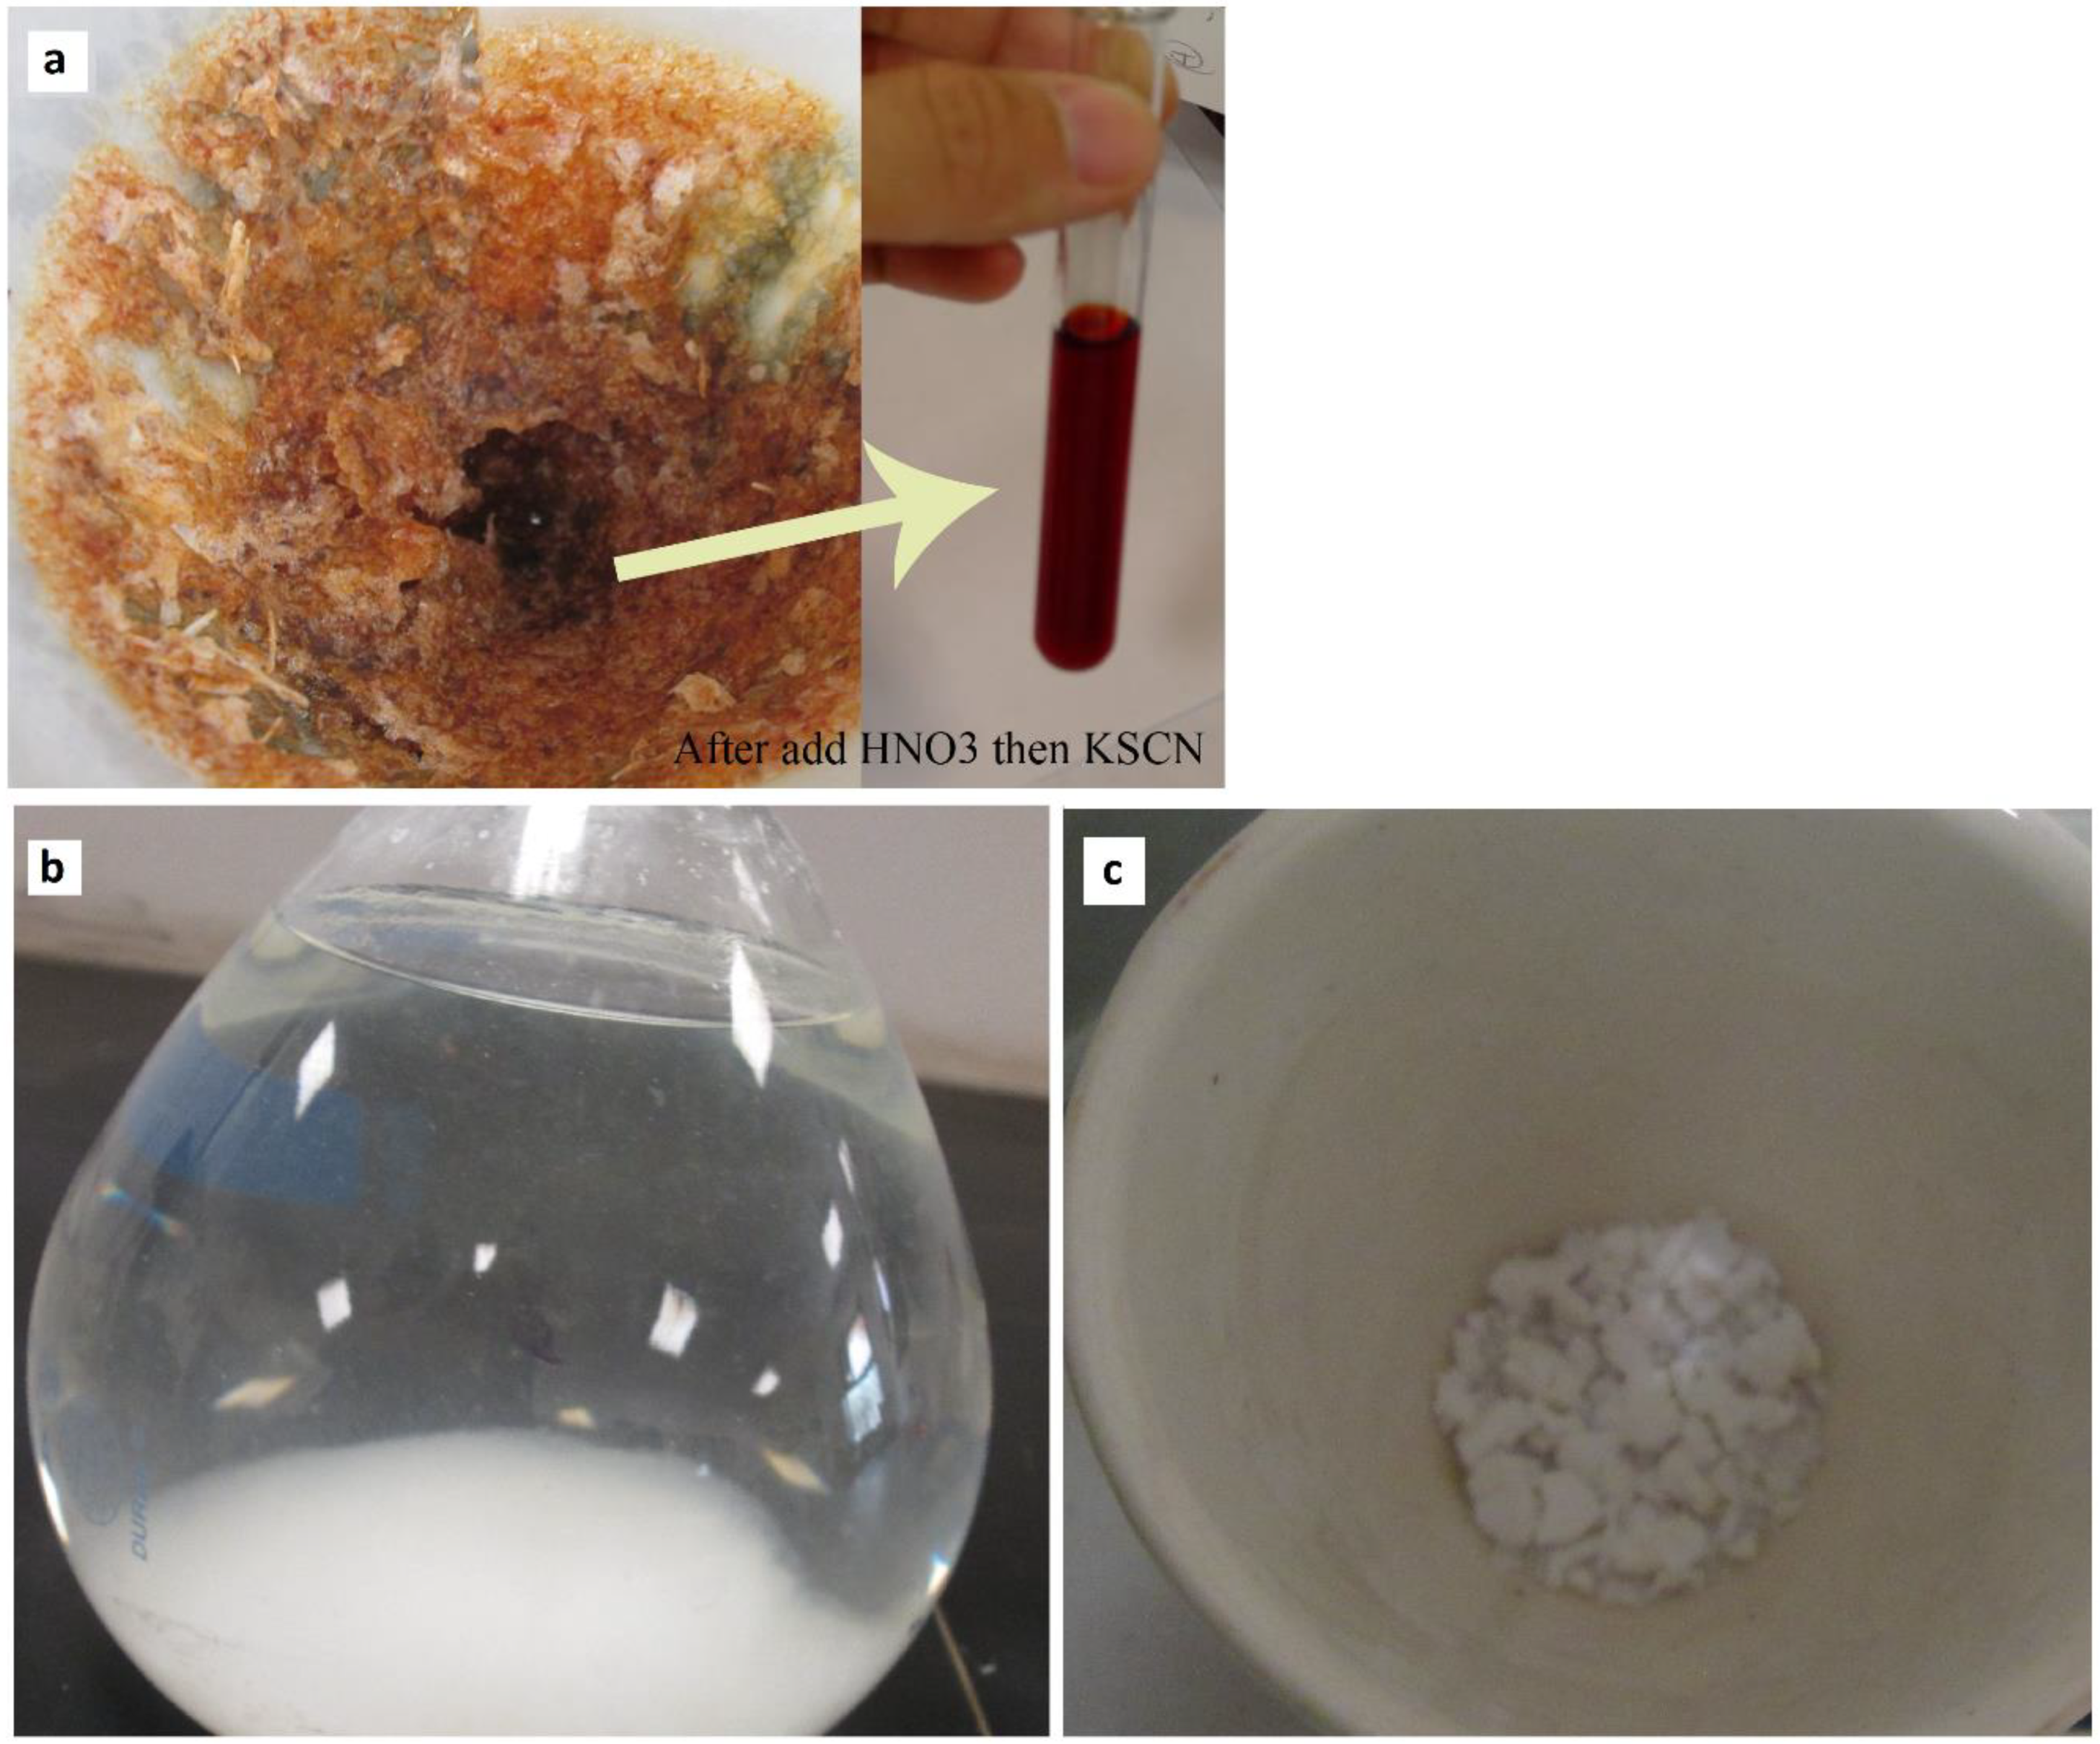
Fifty grams of kaolin ash were leached by 200 mL of sulfuric acid solution (40 wt.% H2SO4) in a Pyrex round-bottom flask equipped with a reflux condenser in oil bath at constant temperature about 140 °C under constant stirring for 3 h and 45 min. Afterwards, 120 mL of HCl were added in a round-bottom flask in a hot water for 30 min. This resulted in the appearance of small amount of solution that was filtered by filter paper. Sodium hydroxide solution (30 wt.%, NaOH) was added to the filtrate until the pH value became equal to 11.3. The addition of NaOH to the process is another modification from previous works. The objective was to enhance the removal efficiency of the impurities in the end-product such as iron and titanium oxides. Following the addition of sodium hydroxide, dark reddish-brown precipitates were readily formed (Figure 3). Then, the mixture was filtered to produce the alkaline sodium aluminate solution. A reddish-brown precipitate was tested by HNO3 and potassium thiocyanate (KSCN) to test for iron, and the resultant solution became deep red color (Figure 3a).
As in the flowchart in Figure 2, the alkaline sodium aluminate solution obtained in this process was bubbled with carbon dioxide gas until a white precipitation was formed (Figure 3b). The white precipitate was filtered and washed with distilled water several times until the pH value became equal to 9.1. On the next day, the pH increased to 10.9 and was rewashed with distilled water several times until the pH decreased to 10.2, and then calcined at 600 °C for 2 h and sent for characterization (Figure 3c).
5. Results and Discussion
5.1. Original Kaolin
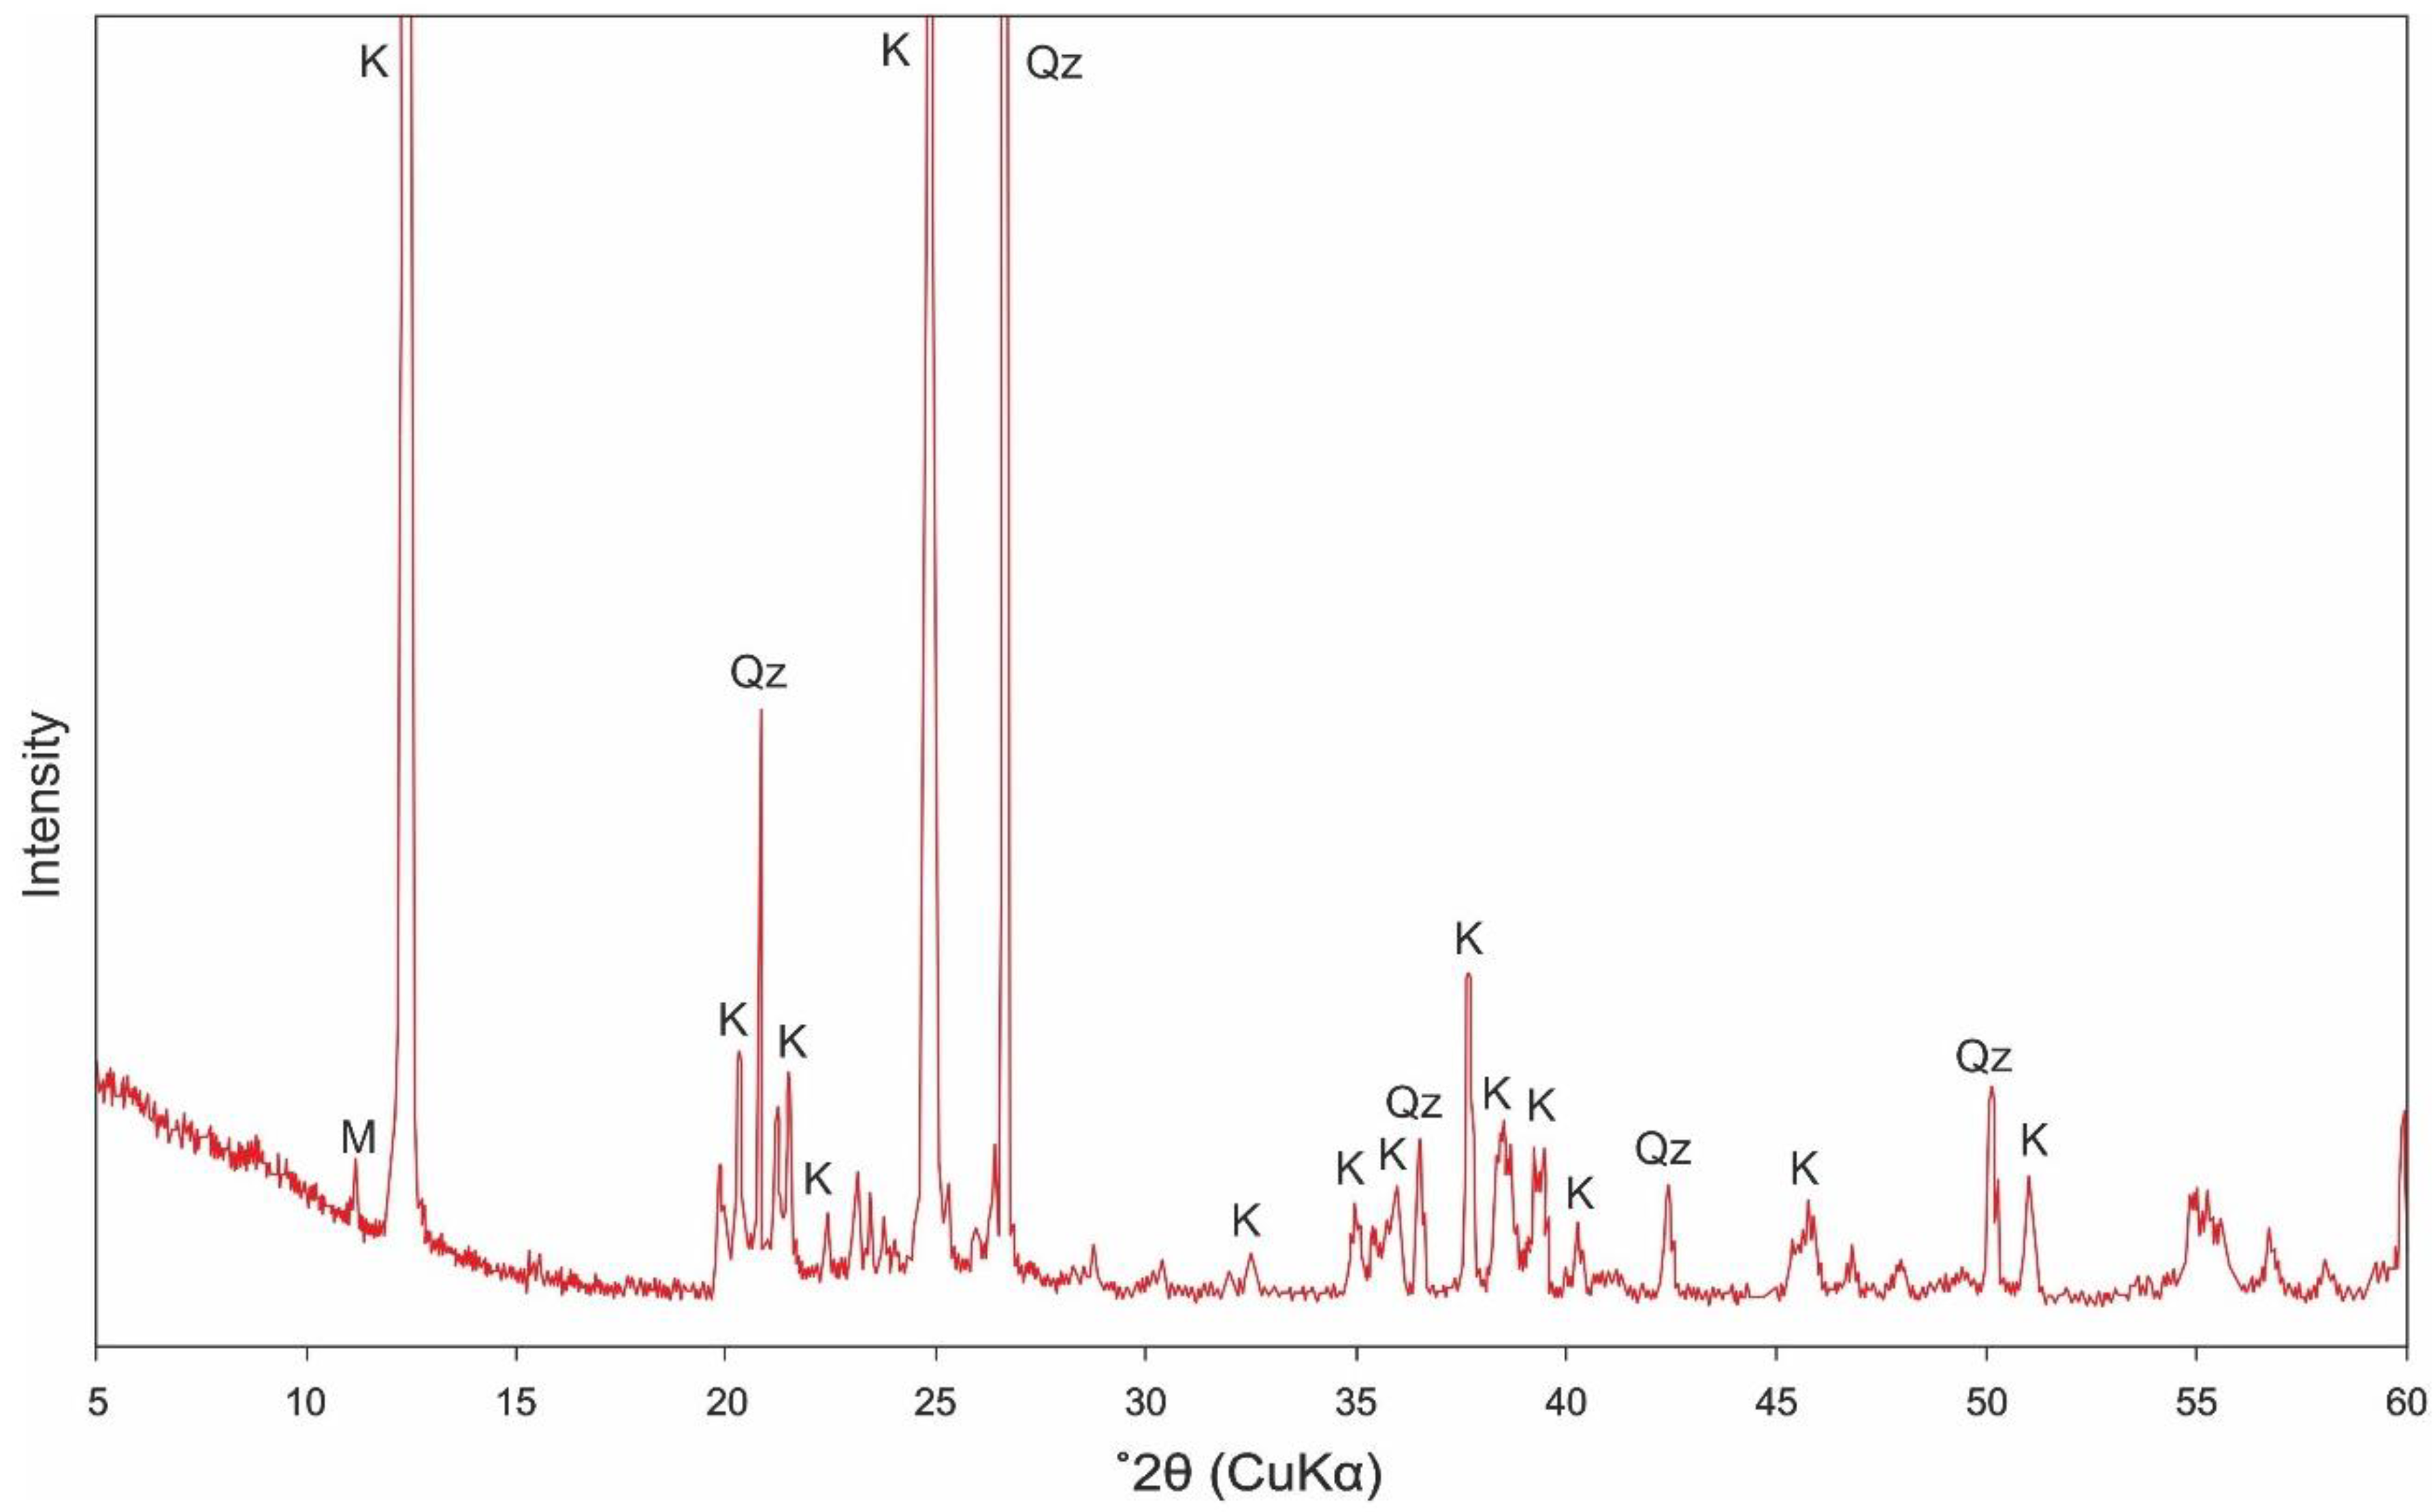
Chemical analysis of the original kaolin sample from the Harad Formation and the resultant calcined kaolin ash are presented in Table 1. Chemical analysis of the original kaolin indicates that it contains 53.90 wt.% SiO2 and 29.90 wt.% of Al2O3. Similar results were obtained by Gougazeh and Buhl [20] for SiO2 (58.02 wt.%) and for Al2O3 (28.00%). The SiO2/Al2O3 ratio in the original kaolin is equal to 1.80. The SiO2/Al2O3 ratio in kaolinite mineral is usually 1.178 [21]. The high content of SiO2 in the sample implies the presence of free silica in the form of quartz. This is evident from the X-ray diffractogram of the sample in Figure 4. Kaolinite was the predominant mineral, followed by quartz. Traces of other minerals were indicated, such as illite-muscovite, Fe-bearing minerals (hematite), anatase and feldspar.
Chemical analysis of the original kaolin sample contains variable amounts of other oxides which indicate presence of impurities as they are not related to kaolinite structure. The oxides include mainly Fe2O3 and TiO2. The former makes about 1.80 wt.% and the latter is 1.87 wt.%. Both oxides are probably related to the presence of hematite, ilmenite and rutile as accessory mineral phases in the kaolin deposit.
Chemical analysis of the kaolin ash (Table 1) indicates that it contains 44.70 wt.% of SiO2 and 23.90 wt. of Al2O3 with SiO2/Al2O3 ratio equal to 1.87, which is similar to the ratio in the original kaolin sample. Na2O increased from 0.02% in the original kaolin to 16.40% in the kaolin ash due to calcination with NaCl (see Figure 2).
5.2. Reddish-Brown Precipitate
The reddish-brown precipitate formed in the sample during the experiment (Figure 3a) was evaluated.
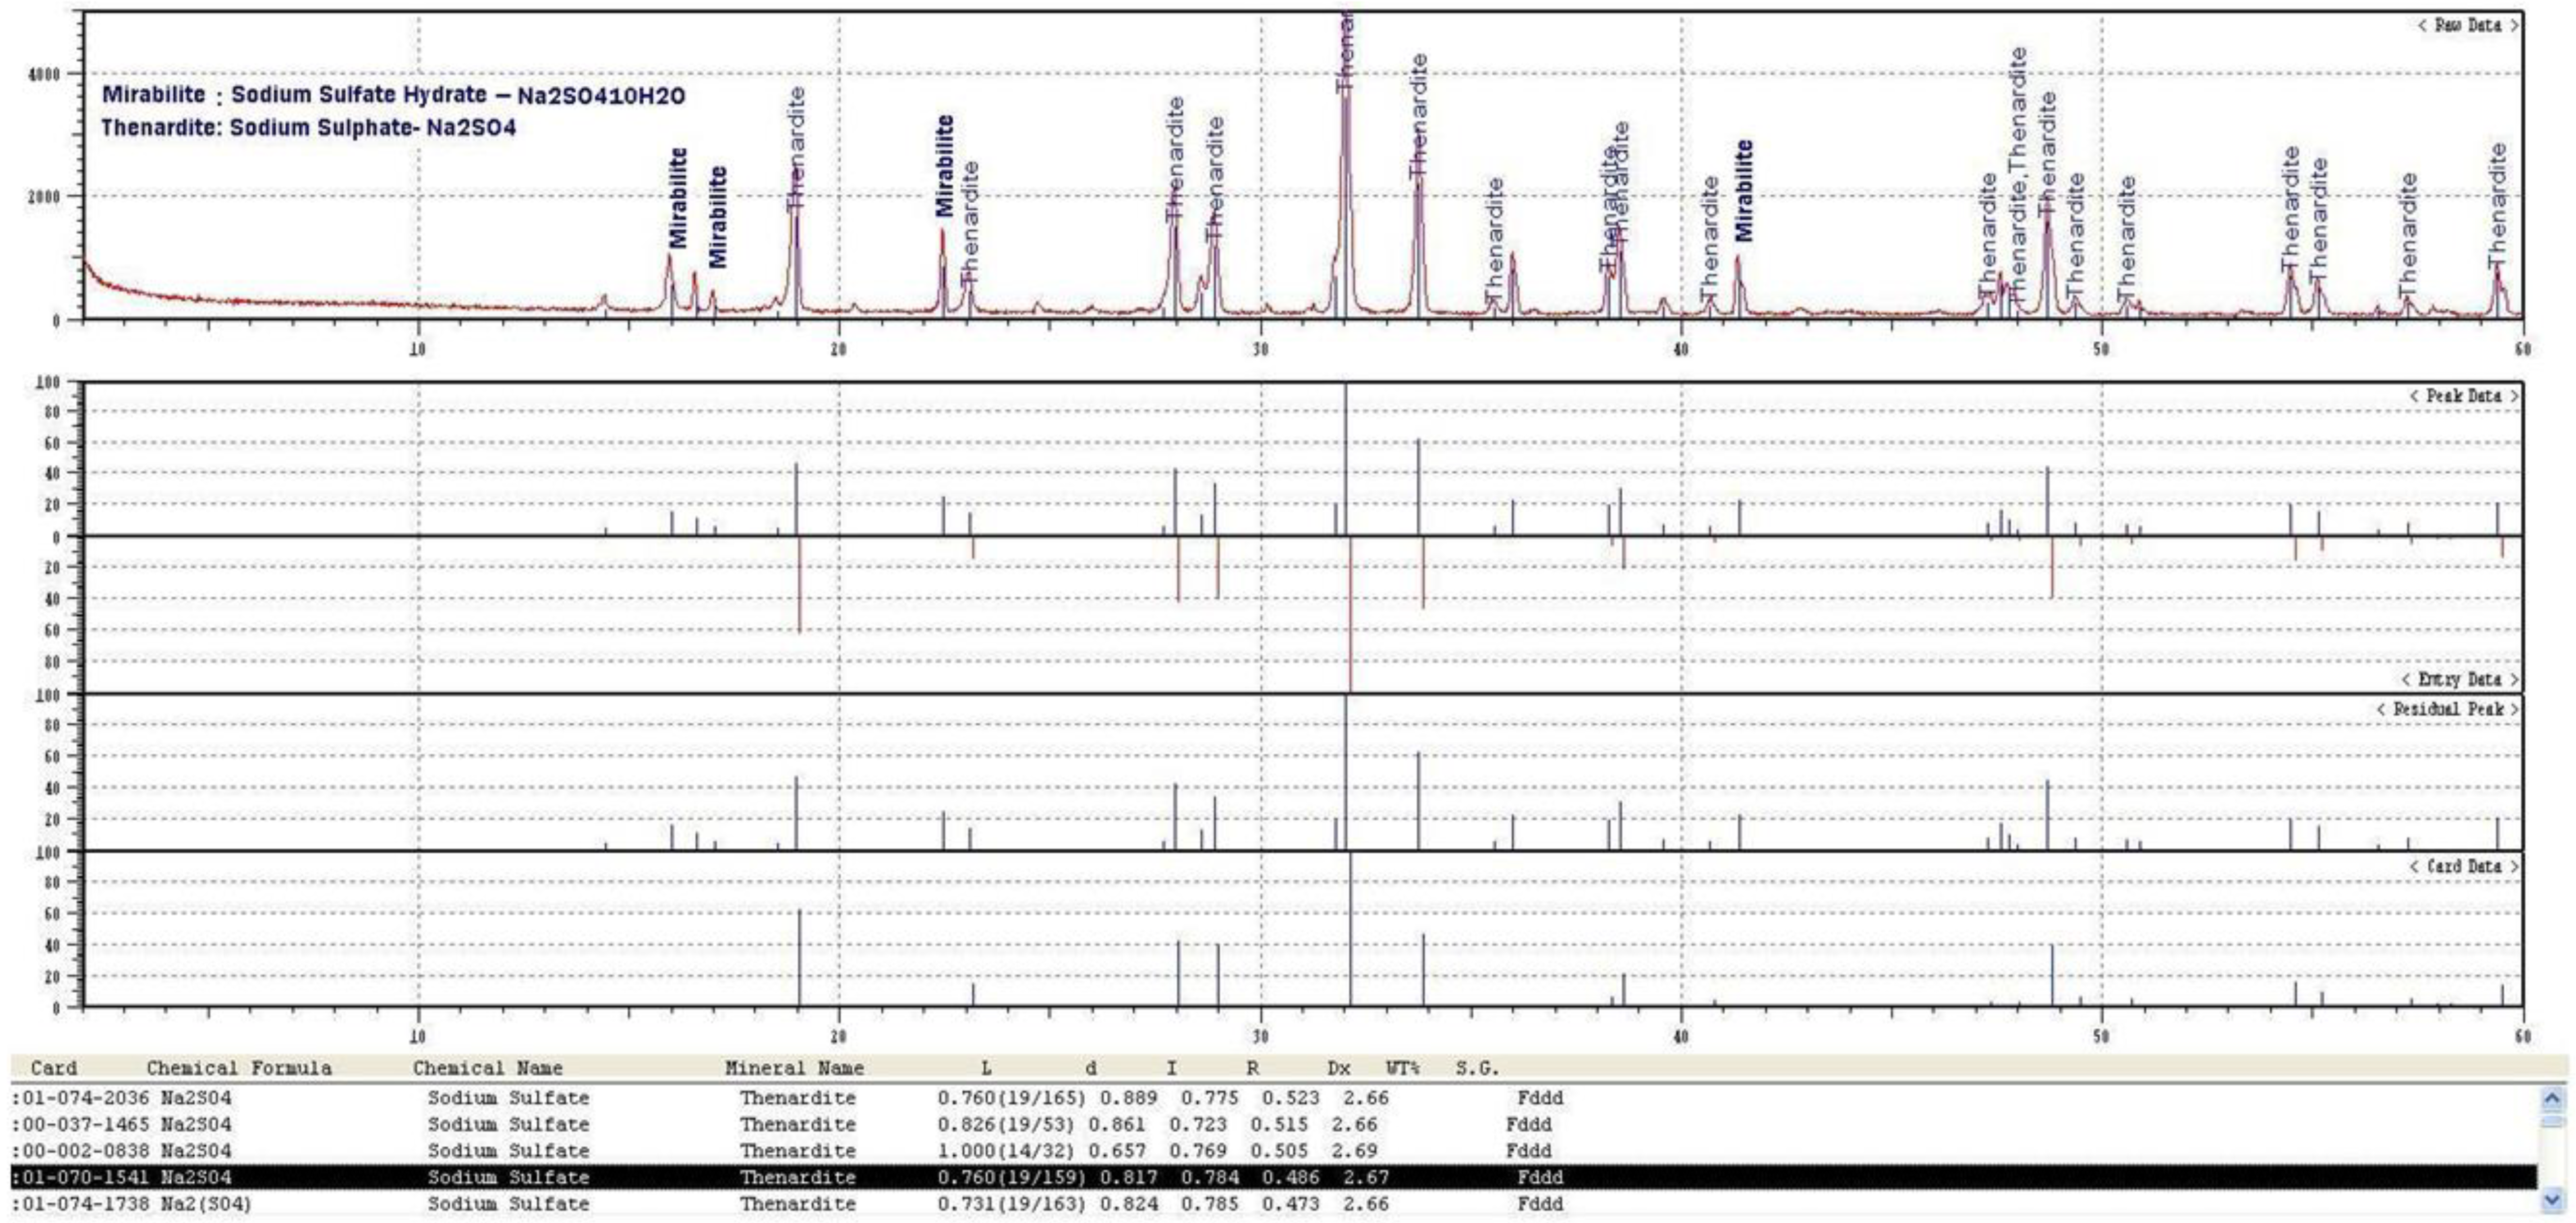
The average chemical composition of the red precipitate as measured from two samples indicate that it is enriched with Na2O and SO3, as illustrated in Table 2. The Na2O makes up to 54.99 wt.% and the SO3 is 27.74 wt.%, with Na2O/SO3 ratio equal to 1.98. Both components are the main constituents of the mineral phases thernadite and mirabilite, which have Na2O/SO3 ratio equal to 0.774. Mineralogical investigation by the XRD method indicates that the red precipitate exhibits thernadite structure, as shown in Figure 5. The high Na2O/SO3 ratio in the sample compared with thernadite implies presence of other phases that host the excess Na2O. Considerable amounts of SiO2 and Al2O3 and CaO are reported in the red precipitate. They along with the excess Na2O probably relate to the formation of sodium aluminum silicates possibly as analcime zeolites and calcium silicates in the form of plombierite (Figure 5). Formation of other combined phases cannot be ruled out.
The red color resulted from the addition of HNO3 and KSCN to the precipitate indicates presence of iron. The Fe2O3 content in the precipitate is 0.98%.
5.3. Alumina
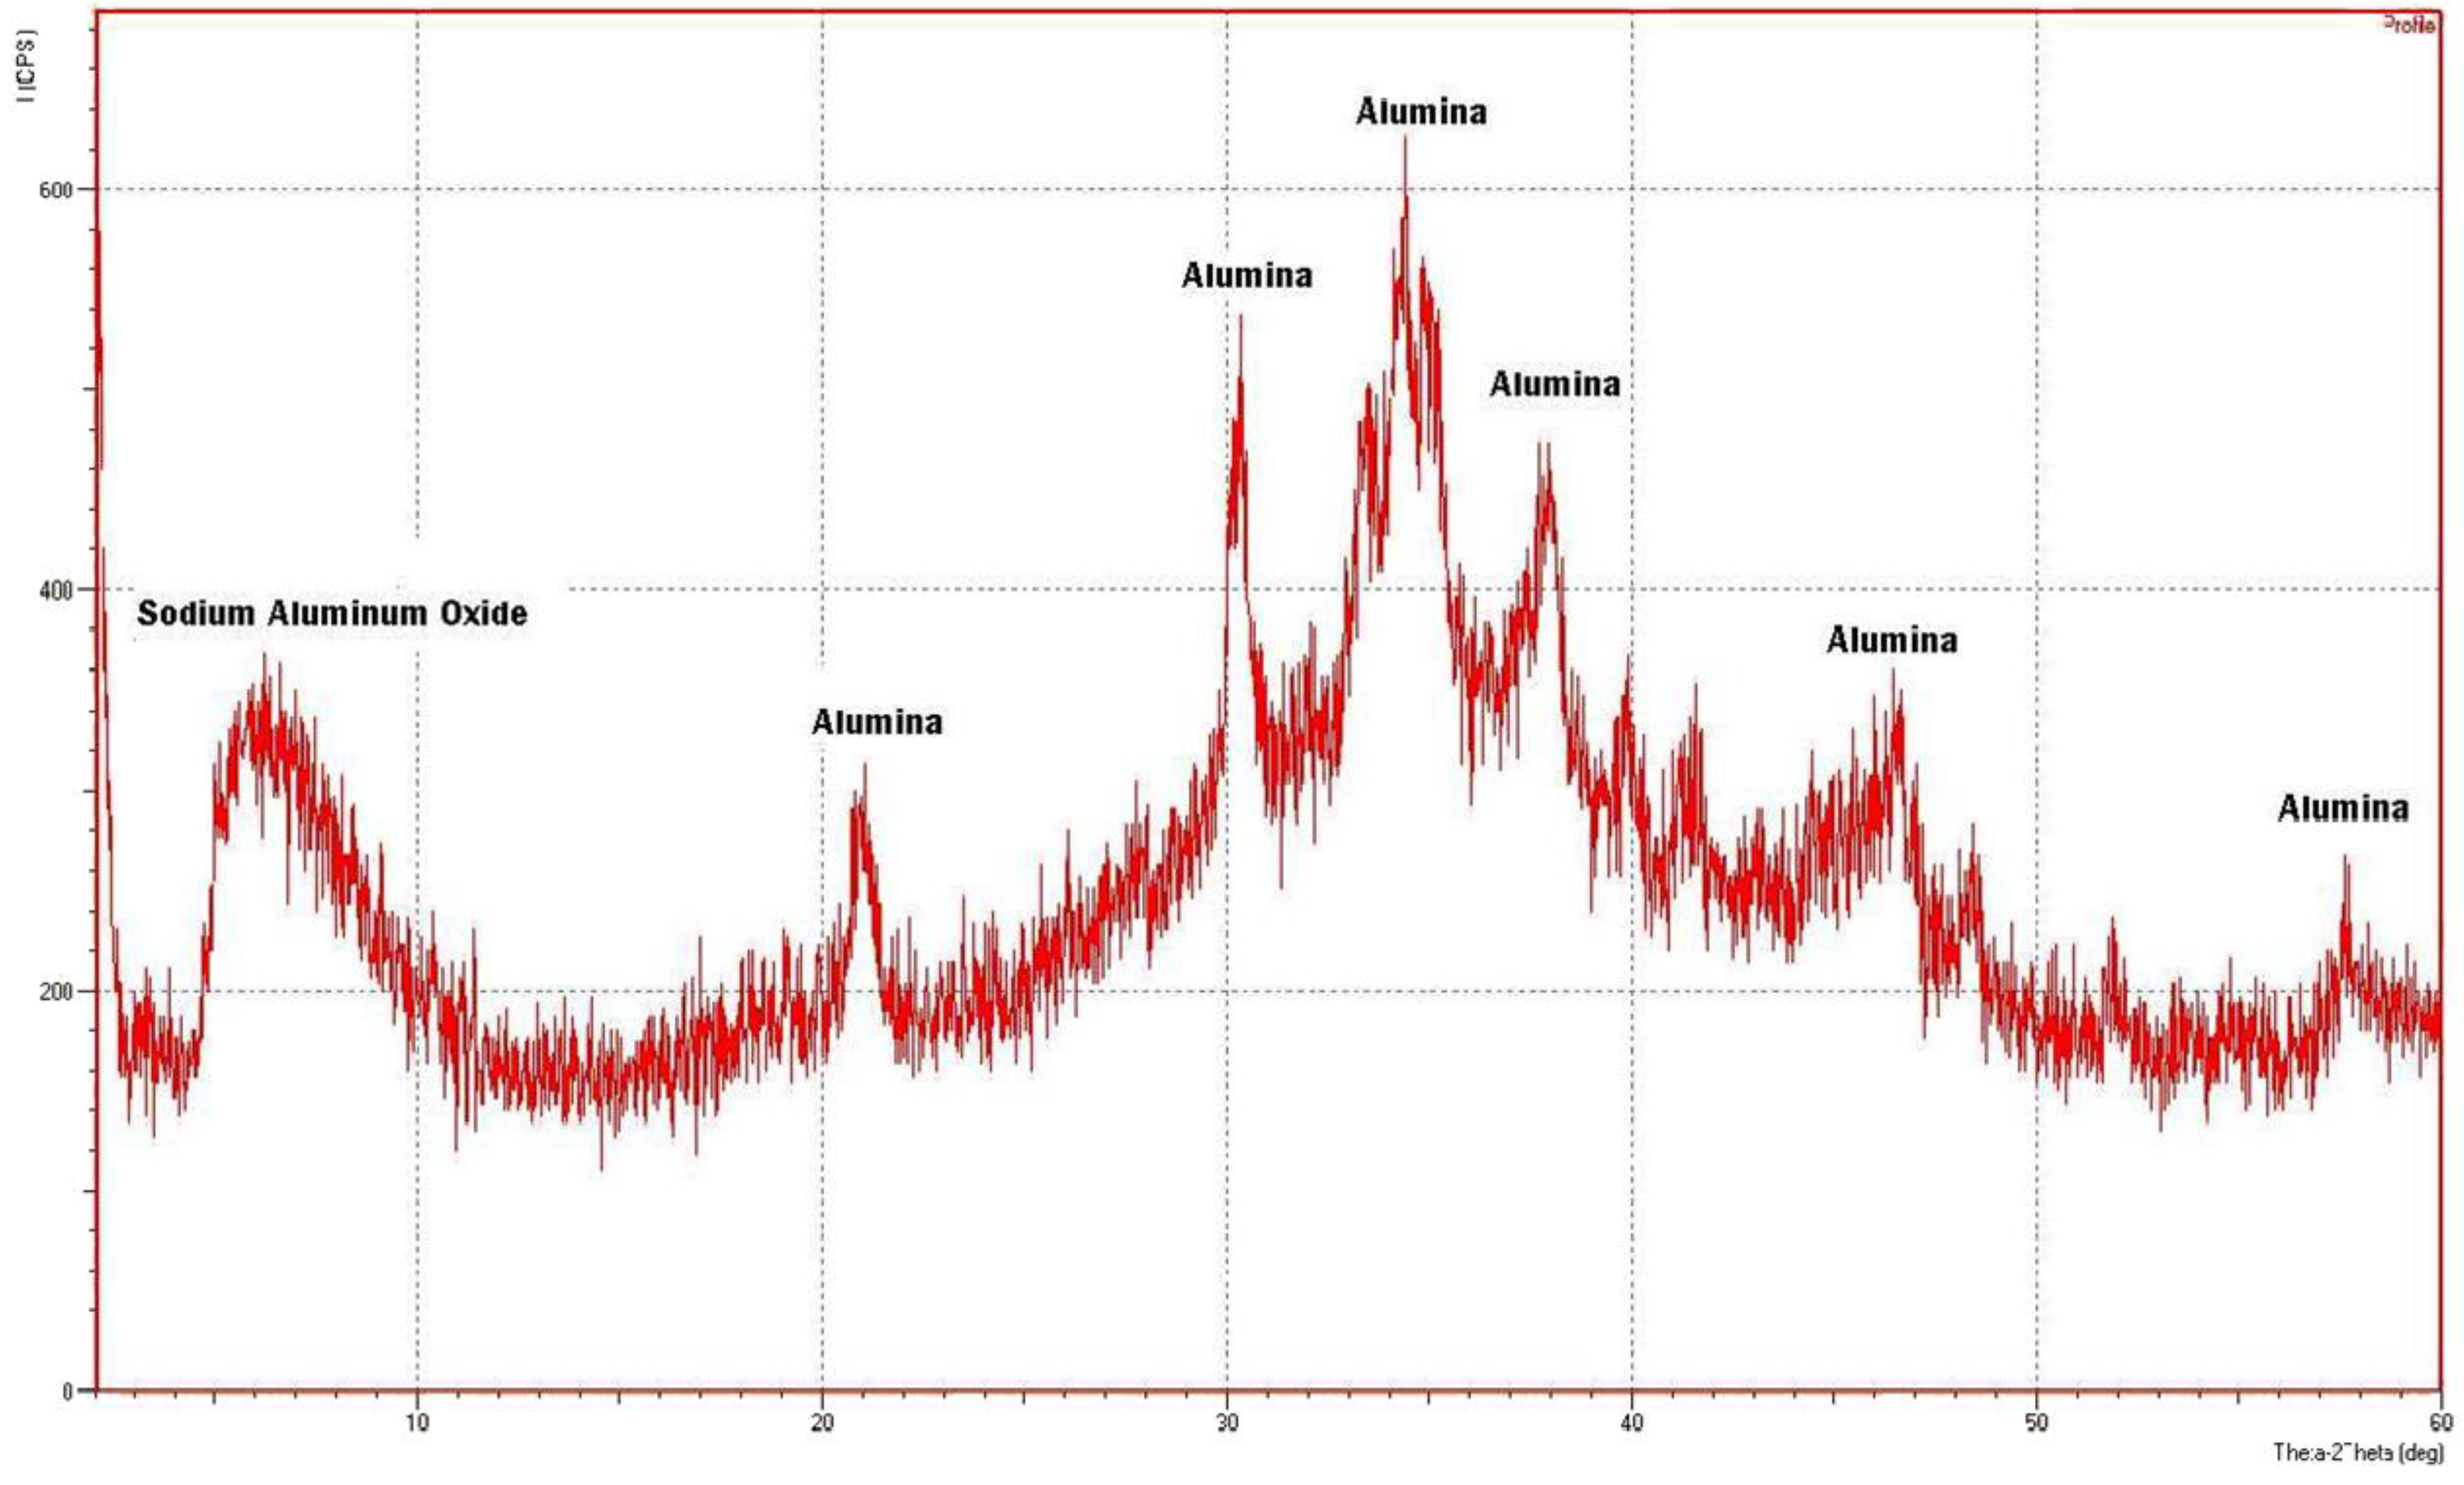
The characterization of the calcined white powder using X-ray diffraction, Scanning Electron Microscope (SEM), SEM-EDX and chemical analysis by XRF indicates the presence of alumina as the major constituent. The X-ray diffractogram presented in Figure 6 indicates presence of meta-stable forms γ-alumina as a major constituent along with traces of sodium aluminum oxide (sodium aluminate). The formation of γ-alumina was supported through comparing with JCPDS 29-63 and with X-ray diffractogram given by Hosseini et al. [7].
The presence of Na-phase within the γ-alumina is emphasized from the XRF and SEM-EDX analyses. As listed in Table 2, the Al2O3 wt.% extraction in the final product is 79.28%, which is higher than the alumina extraction (63%) observed by Al-Zahrani and Abdul-Majid [11]. The Al2O3 content resembles the value obtained by Kianinia et al. [12] for alumina produced from Hamedan kaolin. The impurities in the γ-alumina are attributed to presence of Na2O equal to 19.48 wt.%, along with traces of SiO2 (0.56%), CaO (0.14%) and Fe2O3 (0.10%).
In general, γ-alumina can be used as catalyst or as catalyst support. This is due to its high specific surface area and thermal stability until temperature of 1030 °C. According to Belver et al. [22], thermal stability of γ-alumina can be improved in the presence of some additives including CaO and SiO2. Therefore, it can be concluded that the presence of such impurities in the prepared alumina will enhance its thermal stability.
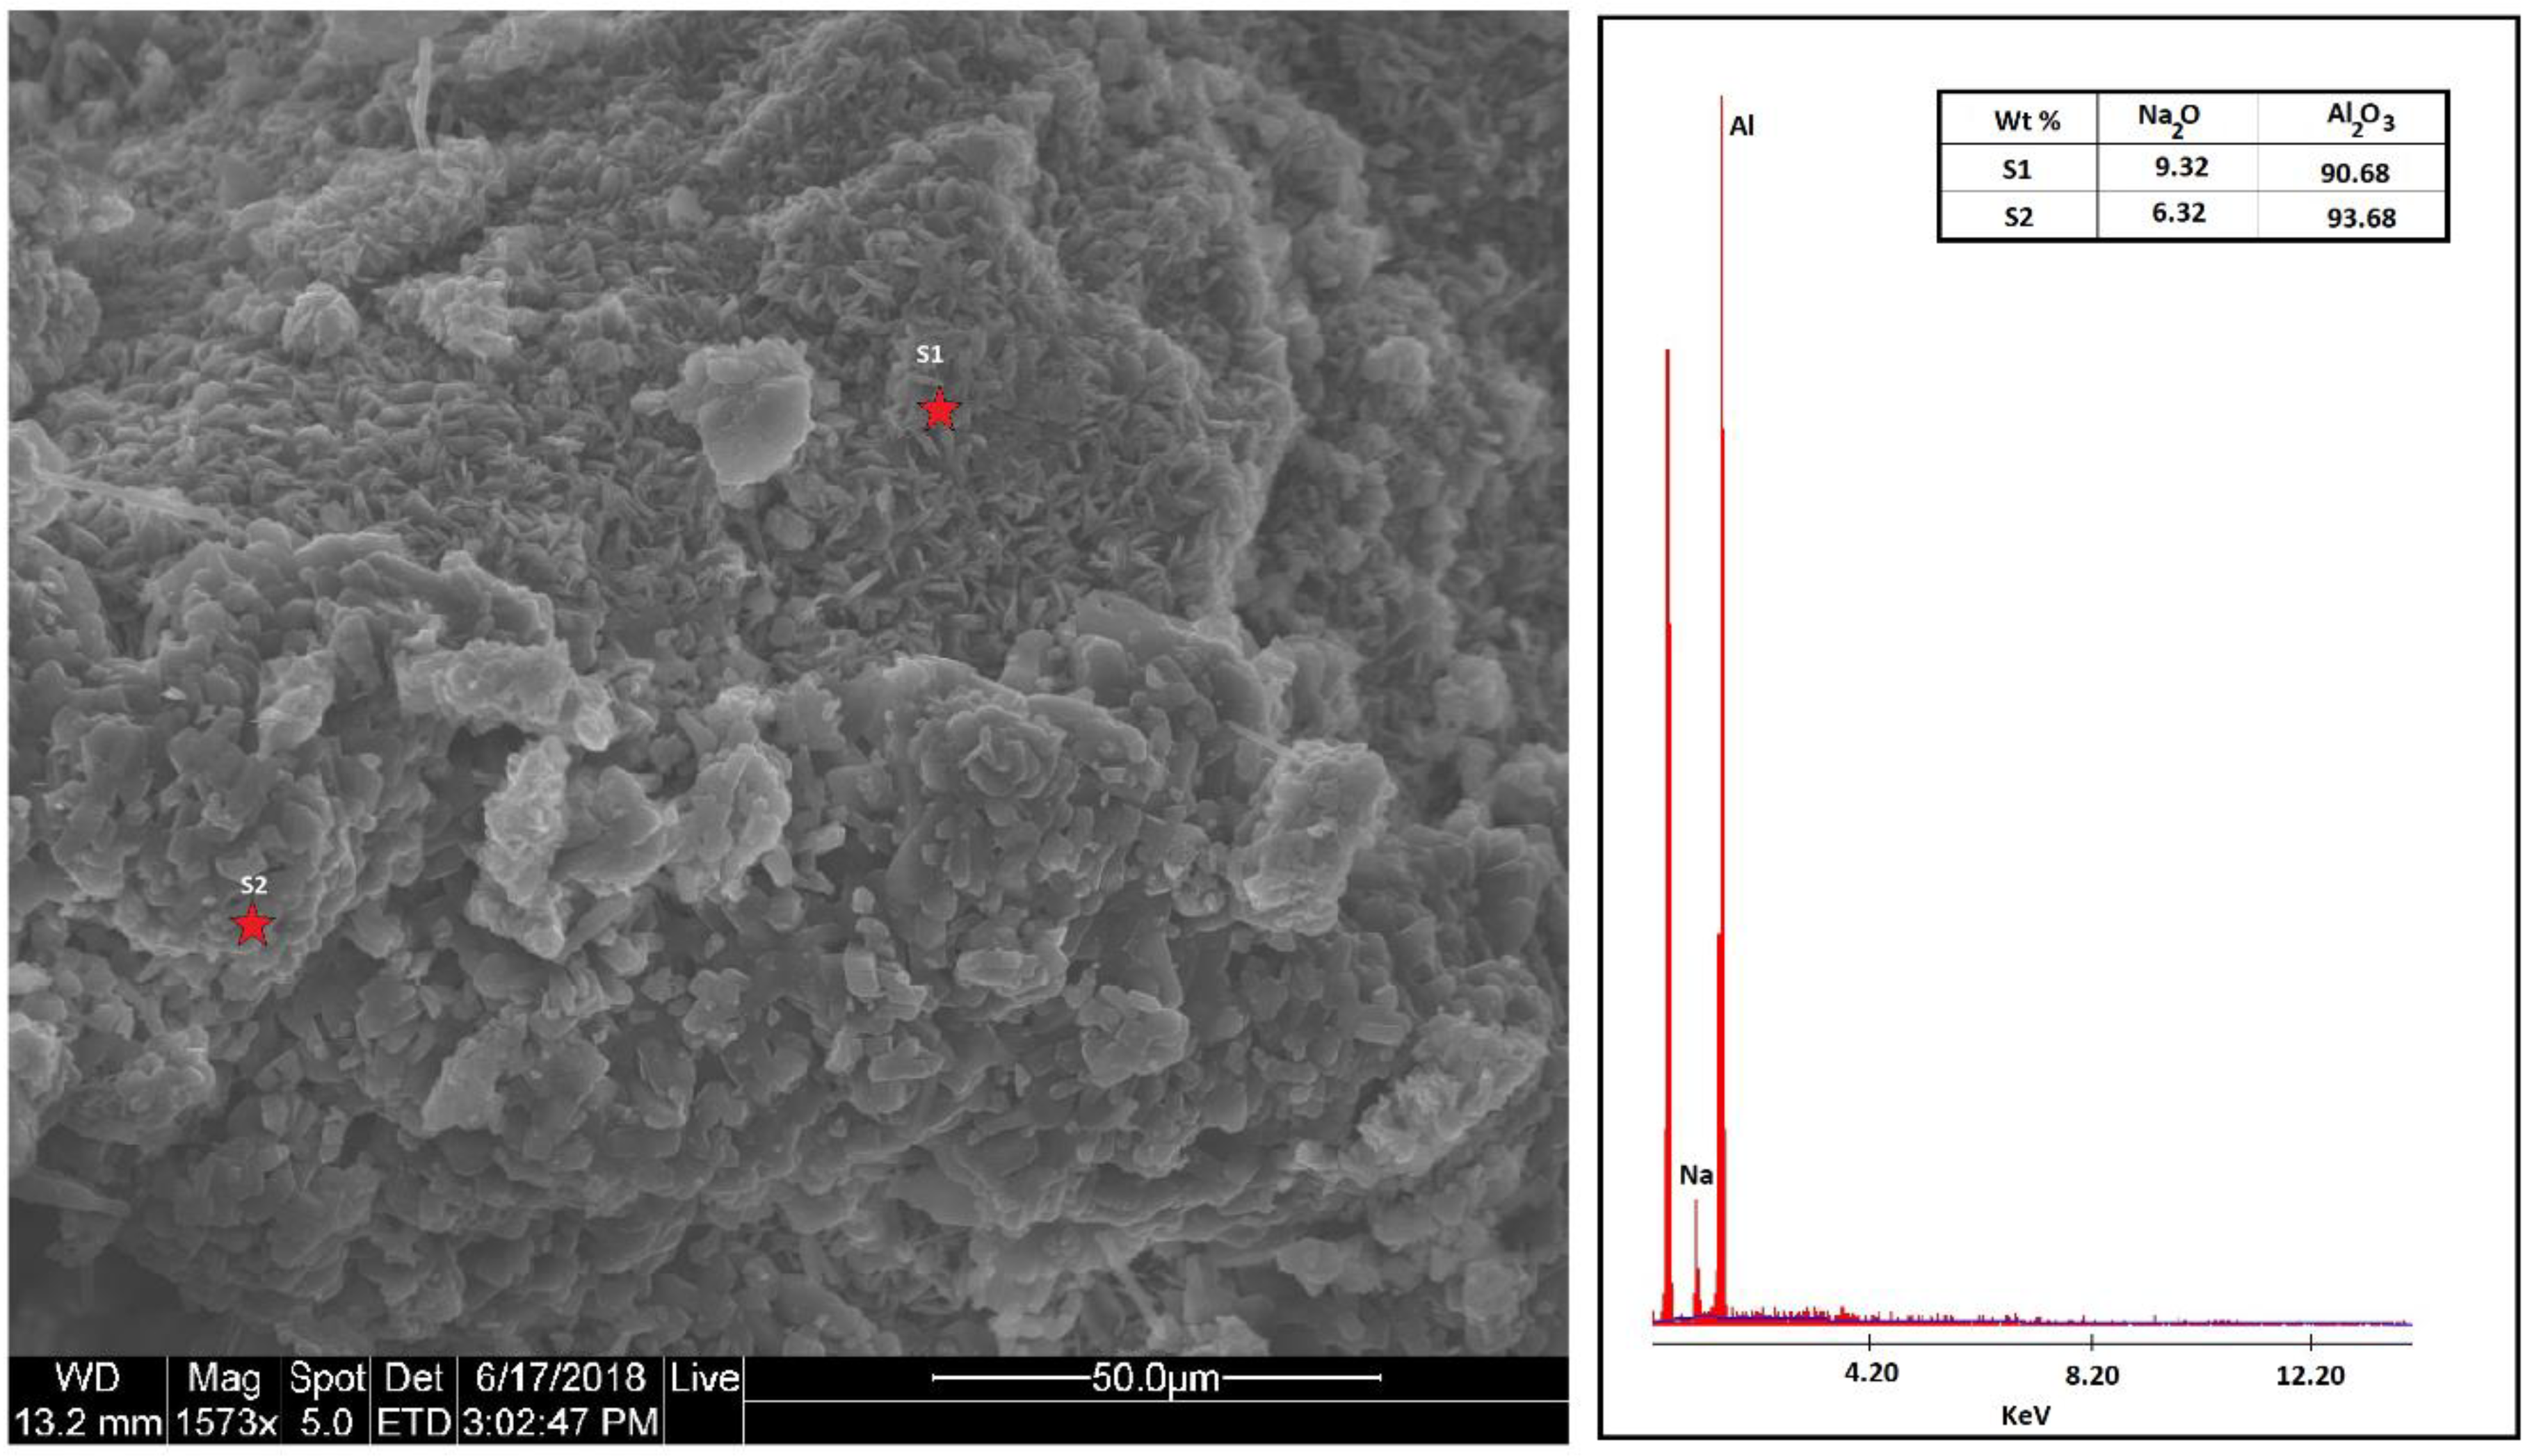
The SEM micrograph in Figure 7 shows that the alumina grains have flack shape and are uniform in size. Most of the grains are less than 10 µm, but some grains may reach up to 40 µm. The grains seem larger than those synthesized by Hosseini et al. [7] through reaction of meta-kaolin with H2SO4 solution using direct precipitation in ethanol. Two spot SEM-EDX analysis show that Al2O3 is more than 90% and Na2O is less than 10% (Figure 7)
6. Conclusions
The overall objective of this study was to propose and develop a process for the extraction of alumina from the kaolin deposits that occur in huge quantities in south Jordan. The process we applied in alumina extraction is a modified process different from those described earlier. The modification reduced preparation costs by utilizing low price raw materials and increased alumina extraction efficiency.
The extraction process comprised of calcination with NaCl followed by two stages of leaching with acids. The alumina extraction of kaolinite ash was optimally synthesized at the experimental conditions of: 200 mL H2SO4 solution (40 wt.%), 140 °C, 3 h 45 min reaction time, 120 mL HCl for 0.5 h, and NaOH solution (30 wt.%,). The process leads to synthesis of alumina powder from the kaolin ash. The purity of Al2O3 was 79.28 wt.%, which is suitable for production of aluminum metal or to produce aluminum fluoride as a by-product from phosphoric acid production. The alumina impurities are attributed mainly to presence of sodium aluminate.
Author Contributions
K.M.I. contributed the literature search, supervised the experimental work and chemical analysis, participated in data interpretation and wrote the paper; M.K.M. and S.K.M. contributed the literature search, designed and performed the experiments, performed the chemical analysis and participated in data interpretation.
Funding
This research was funded by JOSCO Award for Applied Scientific Research.
Acknowledgments
The authors greatly acknowledge Jordan Oil Shale Company (JOSCO) for financial support and Hashemite University for the logistic support including laboratory facilities. Thanks are extended to the Geology Directorate staff, Ministry of Mineral and Energy Resource for providing kaolin samples. We are indebted to the technicians who help us operate the laboratory facilities at Hashemite University and the University of Jordan. Thanks are also extended to the reviewers of this article for their critical comments and suggestions.
Conflicts of Interest
The authors declare no conflict of interest.
References
- Wu, Z. Preparation of nanoparticle alumina and its application in catalysis. Ind. Catal. 2004, 2. Available online: http://en.cnki.com.cn/Article_en/CJFDTOTAL-GYCH200402009.htm (accessed on 24 September 2018).
- Li, G.; Li, W.; Zhang, M.; Tao, K. Characterization and catalytic application of homogeneous nano-composite oxides ZrO2-Al2O3. Catal. Today 2004, 93, 595–601. [Google Scholar] [CrossRef]
- Afkhami, A.; Saber-Tehrani, M.; Bagheri, H. Simultaneous removal of heavy-metal ions in wastewater samples using nano-alumina modified with 2,4-dinitrophenylhydrazine. J. Hazard. Mater. 2010, 181, 836–844. [Google Scholar] [CrossRef] [PubMed]
- Salahudeen, N.; Ahmed, A.S.; Al-Muhtaseb, A.H.; Dauda, M.; Waziri, S.M.; Baba, Y.; Jibril, B.Y. Synthesis of gamma alumina from Kankara kaolin using a novel technique. Appl. Clay Sci. 2015, 105–106, 170–177. [Google Scholar] [CrossRef]
- Wang, S.; Li, X.; Wang, S.; Li, Y.; Zhai, Y. Synthesis of gamma-alumina via precipitation in ethanol. Mater. Lett. 2009, 62, 3552–3554. [Google Scholar] [CrossRef]
- Wang, Y.H.; Wang, J.; Shen, M.Q.; Wang, W.L. Synthesis and properties of thermostable γ-alumina prepared by hydrolysis of phosphide aluminum. J. Alloys Compd. 2009, 467, 405–412. [Google Scholar] [CrossRef]
- Hosseini, S.A.; Niaei, A.; Dariush, S. Production of γ-Al2O3 from kaolin. Open J. Phys. Chem. 2011, 1, 23–27. [Google Scholar] [CrossRef]
- Hoffman, J.I.; Leslie, R.T.; Caul, H.J.; Clark, L.J.; Hoffman, J.D. Development of a Hydrochloric Acid Process for the Production of Alumina from Clay; U.S. Department of Commerce, National Bureau of Standards, RP 1756: Washington, DC, USA, 1946; Volume 37, pp. 409–428.
- Hulbert, S.F.; Huff, D.E. Kinetics of alumina removal from a calcined kaolin with nitric, sulphuric and hydrochloric acids. Clay Miner. 1970, 8, 337–345. [Google Scholar] [CrossRef]
- Yusoff, M.S.M.; Muslim, M.; Foo, C.T.; Murshidi, J.A. High purity alumina and zeolite from local low-grade Kaolin. In Proceedings of the 1st International Conference on Natural Resources Engineering & Technology, Putrajaya, Malaysia, 24–25 July 2006; pp. 471–478. [Google Scholar]
- Al-Zahrani, A.A.; Abdul-Majid, M.H. Extraction of alumina from local clays by Hydrochloric Acid Process. JKAU Eng. Sci. 2009, 20, 29–41. [Google Scholar] [CrossRef]
- Kianinia, Y.; Darban, A.K.; Taheri-Nassaj, E.; Rahnama, B.; Foroutan, A. Synthesis of Nano sized mesoporous γ—Al2O3 powder from domestic Hamedan kaolin. Iran. J. Mater. Sci. Eng. 2015, 12, 59–65. [Google Scholar]
- Bawa, S.G.; Ahmed, A.S.; Okonkwo, P.C. Synthesis of gamma-alumina from Kankara kaolin as potential zeolite active matrix. Niger. J. Basic Appl. Sci. 2016, 24, 66–72. [Google Scholar] [CrossRef]
- Khoury, H.; El Sakka, W. Mineralogical and industrial characteristics of Batun El Goul clay deposit, southern Jordan. Appl. Sci. 1986, 1, 321–351. [Google Scholar]
- Ibrahim, M.K.; Abdekhamid, G. Al Yamaniyya clay deposits, Jordan. In Proceedings of the 4th Jordan Geological Conference, Amman, Jordan, 2–5 November 1991; pp. 30–42. [Google Scholar]
- Yasin, S.M.; Ghannam, A. Kaolin; Natural Resources Authority, Geological Survey Administration: Amman, Jordan, 2006; p. 30.
- Masri, A. Geological Map of Batn Al Ghoul (Jabal Al Harad) Map Sheet No. (3149-II) Scale 1:50000; Geological Mapping Division, Natural Resources Authority: Amman, Jordan, 1998. [Google Scholar]
- Moumani, K.A. The Geology of Jabal Al Batra (Jibal Thalaja) Area Map Sheet No. (3149-IV); Bulletin 52; Geological Mapping Division, Natural Resources Authority: Amman, Jordan, 2002. [Google Scholar]
- Halasa, W. Ash Shadiyya (Fassu’a) Map Sheet No. (3149-I) Scale1:50000; Geological Mapping Division, Natural Resources Authority: Amman, Jordan, 1996. [Google Scholar]
- Gougazeh, M.; Buhl, J.-C. Geochemical and mineralogical characterization of the Jabal Al-Harad kaolin deposit, southern Jordan, for its possible utilization. Clay Miner. 2010, 45, 301–314. [Google Scholar] [CrossRef]
- Kaolinite Mineral Data. Available online: http://www.webmineral.com/data//Kaolinite.shtml#.W1CcIfZuLIU (accessed on 29 July 2018).
- Belver, C.; Munoz, M.A.B.; Vicente, M.A. Chemical activation of a kaolinite under acid and alkaline conditions. Chem. Mater. 2002, 4, 2033–2043. [Google Scholar] [CrossRef]
Figure 1.
Geological map of the sampled Cretaceous kaolin deposit in south Jordan [17].
Figure 1.
Geological map of the sampled Cretaceous kaolin deposit in south Jordan [17].

Figure 2.
Flowchart summarizes steps of alumina extraction from the kaolin.

Figure 3.
Products formed during the experiment: (a) reddish-brown precipitate (thernadite); and (b,c) white precipitate (alumina).
Figure 3.
Products formed during the experiment: (a) reddish-brown precipitate (thernadite); and (b,c) white precipitate (alumina).

Figure 4.
X-ray diffractogram of the kaolin sample: M, illite muscovite; K, kaolinite; and Qz, quartz.
Figure 4.
X-ray diffractogram of the kaolin sample: M, illite muscovite; K, kaolinite; and Qz, quartz.

Figure 5.
X-ray diffractogram of the reddish-brown precipitate.

Figure 6.
X-ray diffractogram of the extracted alumina.

Figure 7.
Scanning electron micrograph and EDX analysis of the extracted alumina.


Table 1.
Chemical analysis of major oxides (wt.%) before and after calcination.
| Material | Fe2O3 | TiO2 | SiO2 | Al2O3 | K2O | MgO | Na2O | CaO | LOI | Total |
|---|---|---|---|---|---|---|---|---|---|---|
| Original kaolin | 1.80 | 1.87 | 53.90 | 29.90 | 0.18 | 0.093 | 0.019 | 0.14 | 12.00 | 99.90 |
| Kaolin ash | 1.55 | 1.50 | 44.70 | 23.90 | 0.63 | 0.127 | 16.40 | 0.34 | 10.70 | 99.85 |
Table 2.
Chemical analysis of major oxides (wt.%) in the final products.
| Material | Fe2O3 | SiO2 | Al2O3 | K2O | MgO | Na2O | SO3 | CaO | Total |
|---|---|---|---|---|---|---|---|---|---|
| Red Precipitate | 0.98 | 5.20 | 7.70 | 0.80 | 0.91 | 54.99 | 27.74 | 1.67 | 100.00 |
| Alumina | 0.10 | 0.56 | 79.28 | - | - | 19.48 | 0.08 | 0.14 | 99.64 |
© 2018 by the authors. Licensee MDPI, Basel, Switzerland. This article is an open access article distributed under the terms and conditions of the Creative Commons Attribution (CC BY) license (http://creativecommons.org/licenses/by/4.0/).
Share and Cite
MDPI and ACS Style
Ibrahim, K.M.; Moumani, M.K.; Mohammad, S.K. Extraction of γ-Alumina from Low-Cost Kaolin. Resources 2018, 7, 63. https://doi.org/10.3390/resources7040063
AMA Style
Ibrahim KM, Moumani MK, Mohammad SK. Extraction of γ-Alumina from Low-Cost Kaolin. Resources. 2018; 7(4):63. https://doi.org/10.3390/resources7040063
Chicago/Turabian StyleIbrahim, Khalil M., Mohammad K. Moumani, and Salsabeela K. Mohammad. 2018. "Extraction of γ-Alumina from Low-Cost Kaolin" Resources 7, no. 4: 63. https://doi.org/10.3390/resources7040063
Note that from the first issue of 2016, this journal uses article numbers instead of page numbers. See further details here.