Issues and Challenges Confronting the Achievement of Zero Plastic Waste in Victoria, Australia


1
College of Engineering and Science, Victoria University, Melbourne, VIC 8001, Australia
2
Institute for Sustainable Industries & Livable Cities, Victoria University, P.O. Box 14428, Melbourne, VIC 8001, Australia
*
Author to whom correspondence should be addressed.
Recycling 2021, 6(1), 9; https://doi.org/10.3390/recycling6010009
Submission received: 3 November 2020
/
Revised: 13 January 2021
/
Accepted: 16 January 2021
/
Published: 1 February 2021
Abstract
:Despite the increase in popularity of the zero waste (ZW) concept, the successful implementation of this concept in waste management is still facing many challenges. The plastic recycling rate in Australia is at only about 9.4% (in 2017–2018). The state of Victoria (in Australia) has proposed an ambitious 10-year plan to upgrade its waste and recycling system and to divert about 80% of waste from landfills by 2030. The aim of this research is to study this currently proposed waste management plan and to develop a simulation model to assess the feasibility of achieving 80% diversion rate by 2030. The feasibility of achieving zero plastic waste by 2035 has also been assessed. In this direction, the existing knowledge of global ZW implementation has been reviewed to gain understanding of the challenges, obstacles, and uncertainties in achieving the ZW target. A simulation model is established using a method called double baselines. This method was developed to address the limitation of data availability for the model development. The model was run in 4 scenarios including one for Victoria’s current 10-year plan. Outcomes from the model are produced using six key considerations, including the rate of plastic consumption, waste to landfill, diversion rate, recycling rate, relative accumulative effort, and cost. The findings of this study point out that Victoria’s current plan for achieving an 80% diversion rate by 2030 is possible. On the other hand, the study results also suggest that achieving zero plastic waste by 2035 is less likely to happen. Hence, opportunities for improvement especially towards achieving the zero plastic waste are also presented.
1. Introduction
Zero waste (ZW) concept was initially defined in 1973 and its application was to remove chemical contamination from waste. This concept has started to become a growing movement since the end of the 20th century [1,2]. Among numerous solutions related to waste management, waste disposal to landfills are known as the conventional method, which is detrimental to the environment in many ways. Harmful chemicals and gases from landfill waste pollute the soil and groundwater. The construction of new landfills, which are caused by the rapid growth of population, destroy the natural landscape. In contrast, recycling offers many environmental-friendly solutions. While waste that ends up in landfill is useless and hazardous, waste recycled properly can become a new product and moreover, the recycling process consumes much less energy and resources than the conventional production of that product. Other than the environmental issues, governments all over the world are also facing a shortage of landfill capacity in urban space, and they must seek other effective and eco-friendly solutions [3]. From those considerations, the implementation of the ZW concept has been an alternative waste management strategy that helps to reduce waste diverted to landfills. A significant number of policymakers in several countries have involved the ZW concept in urban development planning, and this concept is described as the most holistic innovation of the 21st century for achieving sustainable waste management systems [4]. Nevertheless, the successful implementation of this concept in waste management is still hindered. Leading countries in the field of environmental protection have introduced their own strategies to achieve ZW; however, majority of them are currently at the beginning stage and are struggling to reach their targets within the set timeframes. The reasons behind those difficulties could possibly be rapid population growth, unforeseeable changes in residents’ lifestyles and behaviors, and the variability of the waste market.
In Australia, a low plastic waste recycling rate of only 9.4% was recorded in 2017–2018 [5]. The country recycled only 12% of the total produced waste in 2019 [6]. The state of Victoria in Australia is one of the states that is facing recycling issues the most due to various factors, including a sudden termination of its major plastic waste collection partner [7]. On the other hand, the state exported a significant amount of plastic waste (62%) overseas for reprocessing [8]. The strong dependence on global waste exportation of recovered plastics created a sort of mini-crisis after the ban of plastic waste imports into China and Malaysia [9,10]. The state government responded to this crisis by developing a new 10-year policy and waste management plan as an effort to reduce waste production, divert more waste from going to landfills, and enhance the recycling rate by 2030 [11].
The aim of this research is to study Victoria’s current 10-year waste management plan and to develop a simulation model for assessing the feasibility of achieving 80% diversion rate by 2030. The study will also assess the feasibility of achieving zero plastic waste in Victoria by 2035. In this direction, a review of cities around the world that have successfully implemented ZW programs has been undertaken to gain an understanding of the challenges, obstacles, and uncertainties involved in achieving the ZW target. The lessons learnt from several cities leading in ZW implementation will form a strong foundation for ensuring the accuracy and reliability of the proposed model.
This paper is structured as follows. Section 2 presents a background to plastic waste management globally, in Australia and in the state of Victoria. This section also presents three selected case studies of cities from around the world that have successfully implemented ZW programs. The methodology and the simulation model developed in this study to evaluate Victoria’s current 10-year plan and assess its feasibility to achieve the set targets is presented in Section 3. The results and analysis of the outputs from the simulation model are presented in Section 4. Section 5 presents a detailed discussion of the outputs from the simulation model and finally conclusions drawn from this study are provided in Section 6.
2. Background
2.1. Plastic Waste
2.1.1. An Overview of Global Plastic Waste
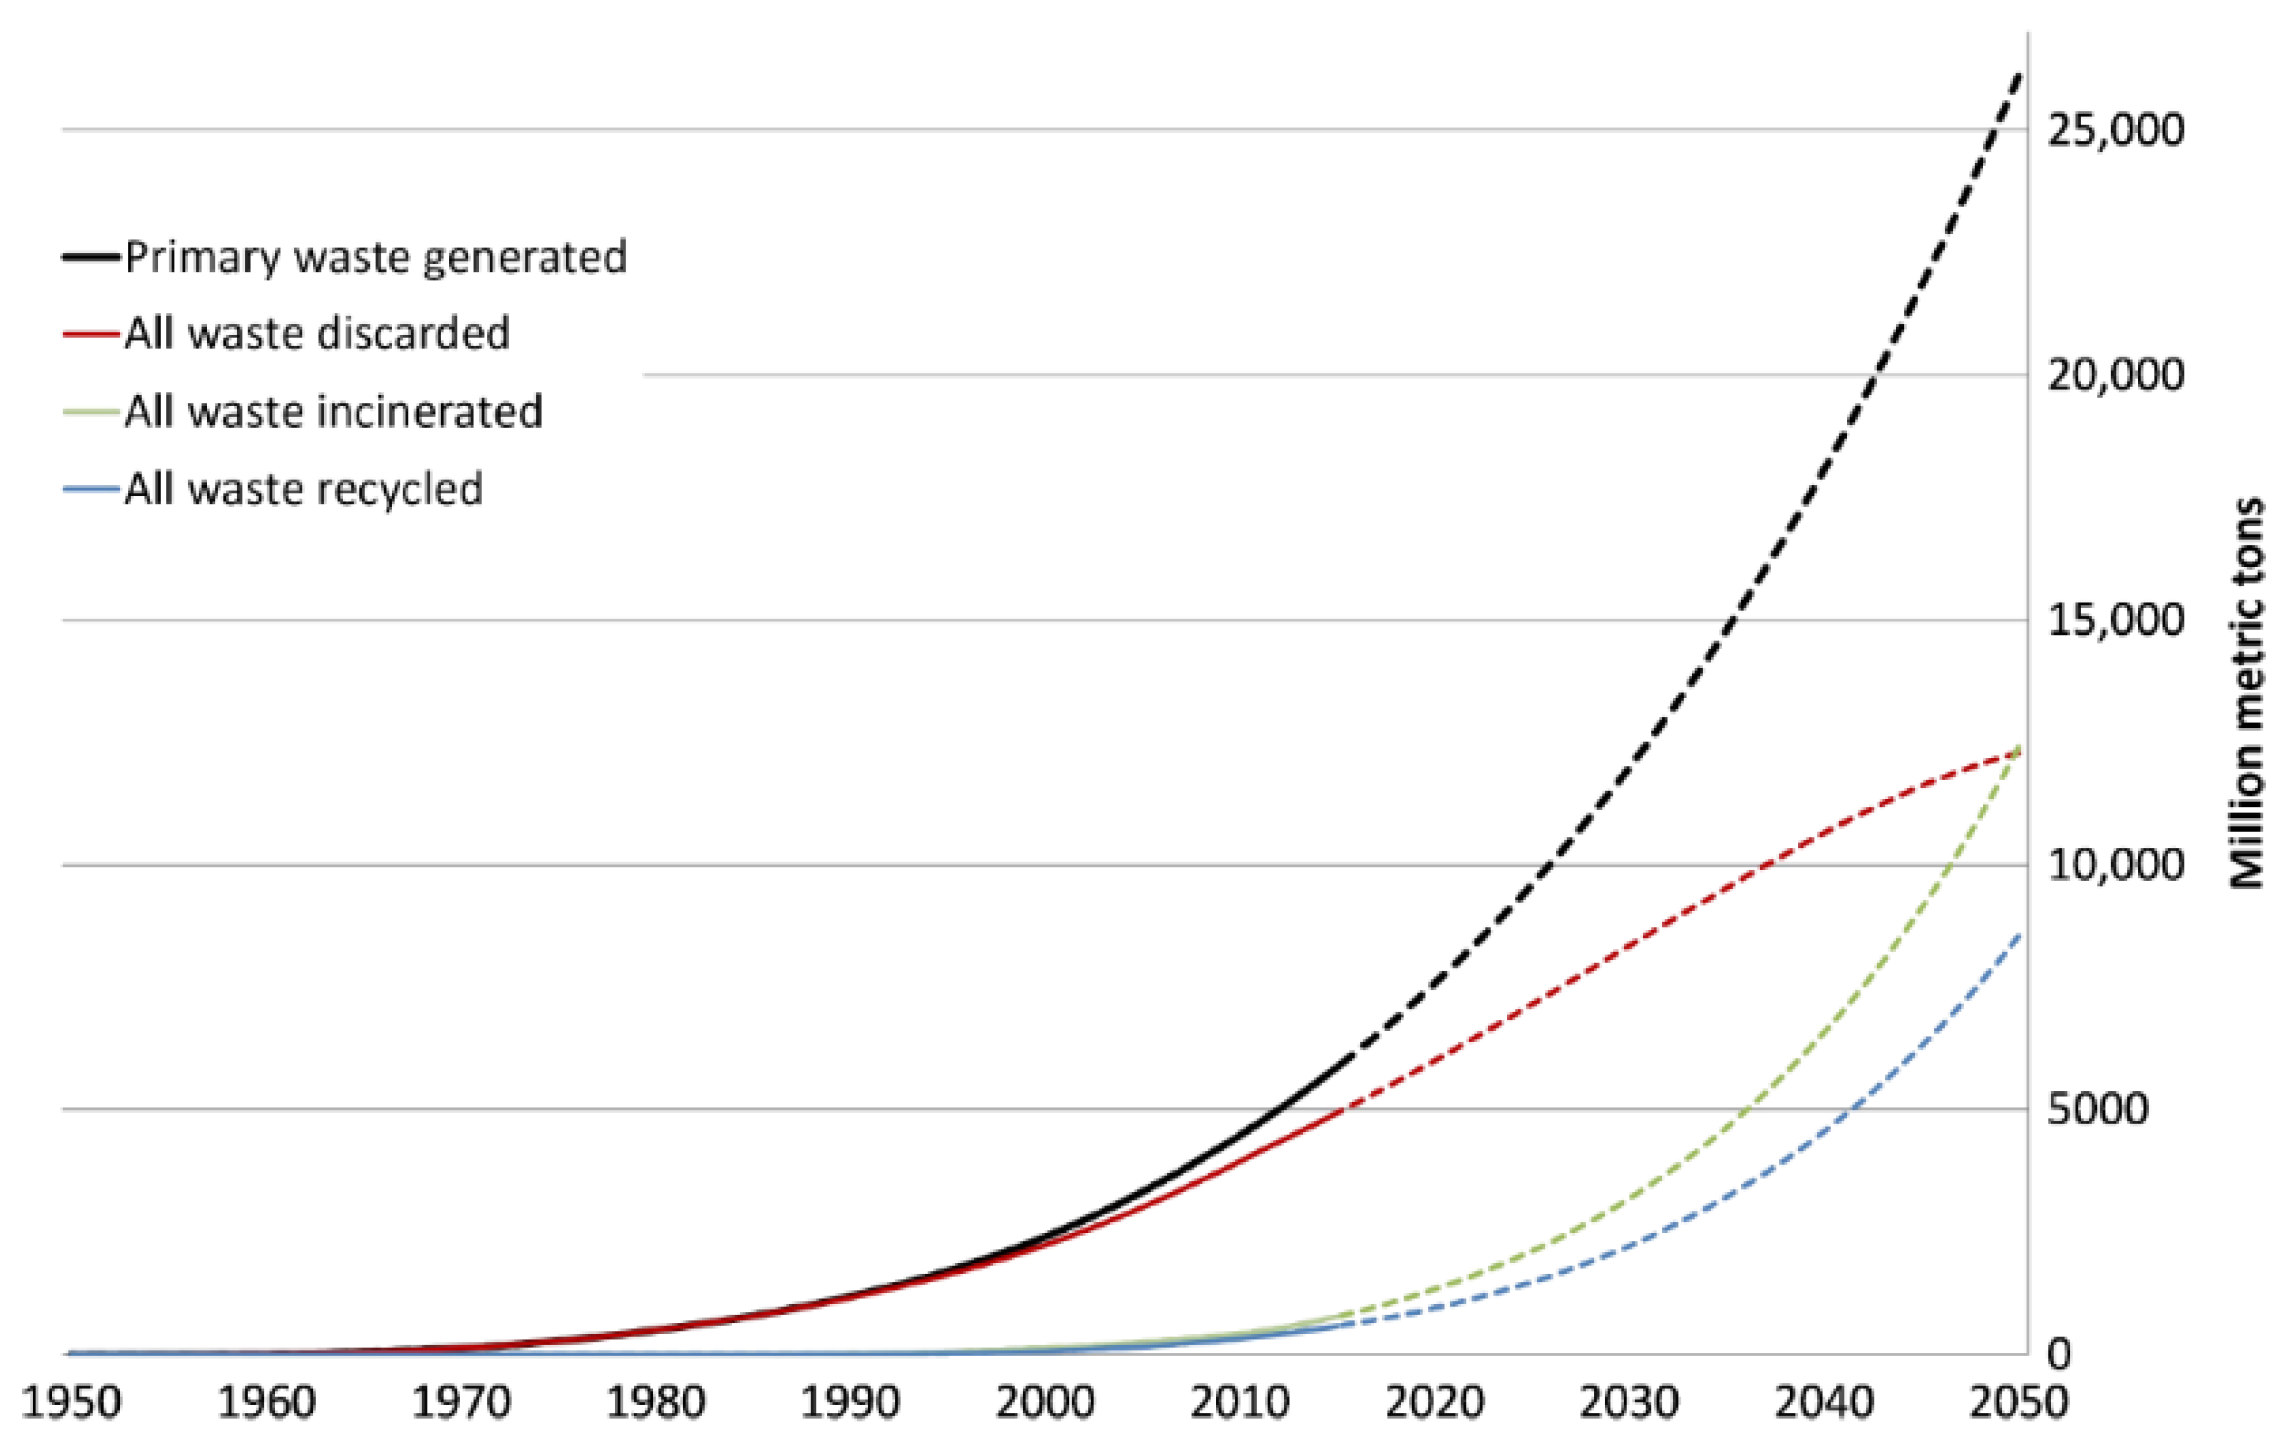
Plastic waste management has been well documented for several years due to its detrimental impact on the environment. The increasingly large quantity of plastic that has infiltrated almost evert aspect of human life is because plastic is a very useful material that is moldable, durable, light, and inexpensive. [12]. In the study by Geyer, et al. [13], the researchers estimated that 8300 million metric tons of plastic had been manufactured globally until 2015. They also observed a significant leap in generation of resins and fibers from 2 to 380 million metric tons between 1950 and 2015. In contrast, the recycling rate of plastic products in 2015 was estimated to be approximately 9% and it is projected that roughly 12,000 million metric tons of plastic waste will be in landfills or in the natural environment by the middle of the 21st century (Figure 1).
Additionally, the pollution caused by plastic waste on land also affects the living environment of aquatic plants and animals. A report published in 2015 estimated that 275 million metric tons of plastic waste is arising from the activities of population living within 50 km of the coast in 192 countries in 2010 [14]. A range from 1.75% to 4.62% of this estimated quantity (of 275 million metric tons) became marine debris, which reflect an assumed conversion rate of mismanaged plastic waste input to the ocean at 40%, 25%, and 15% for high, mid, and low conversion rate estimates, respectively. On the other hand, apart from the conventional treatment, plastic waste was also locally reprocessed or traded globally for reprocessing [15]. The global waste trade networks play a major role in transforming discarded waste into new plastic products [16]. Brooks, Wang and Jambeck [12] found that this trading activity has been consistently increasing sharply from 1993 to 2016 by 723% and 817% for yearly import and export respectively. China was the country that imported plastic waste the most as they also accounted for 45.1% of imported plastic waste accumulated between 1993 and 2016 [10,12]. With the considerable influence on the global waste market, China’s ban on imported plastic waste which has been in place since 2018 would cause massive changes in global plastic generation and waste management [12,17]. This ban also results in an even more urgent requirement for implementing ZW strategies.
2.1.2. Plastic Waste in Australia and in the State of Victoria
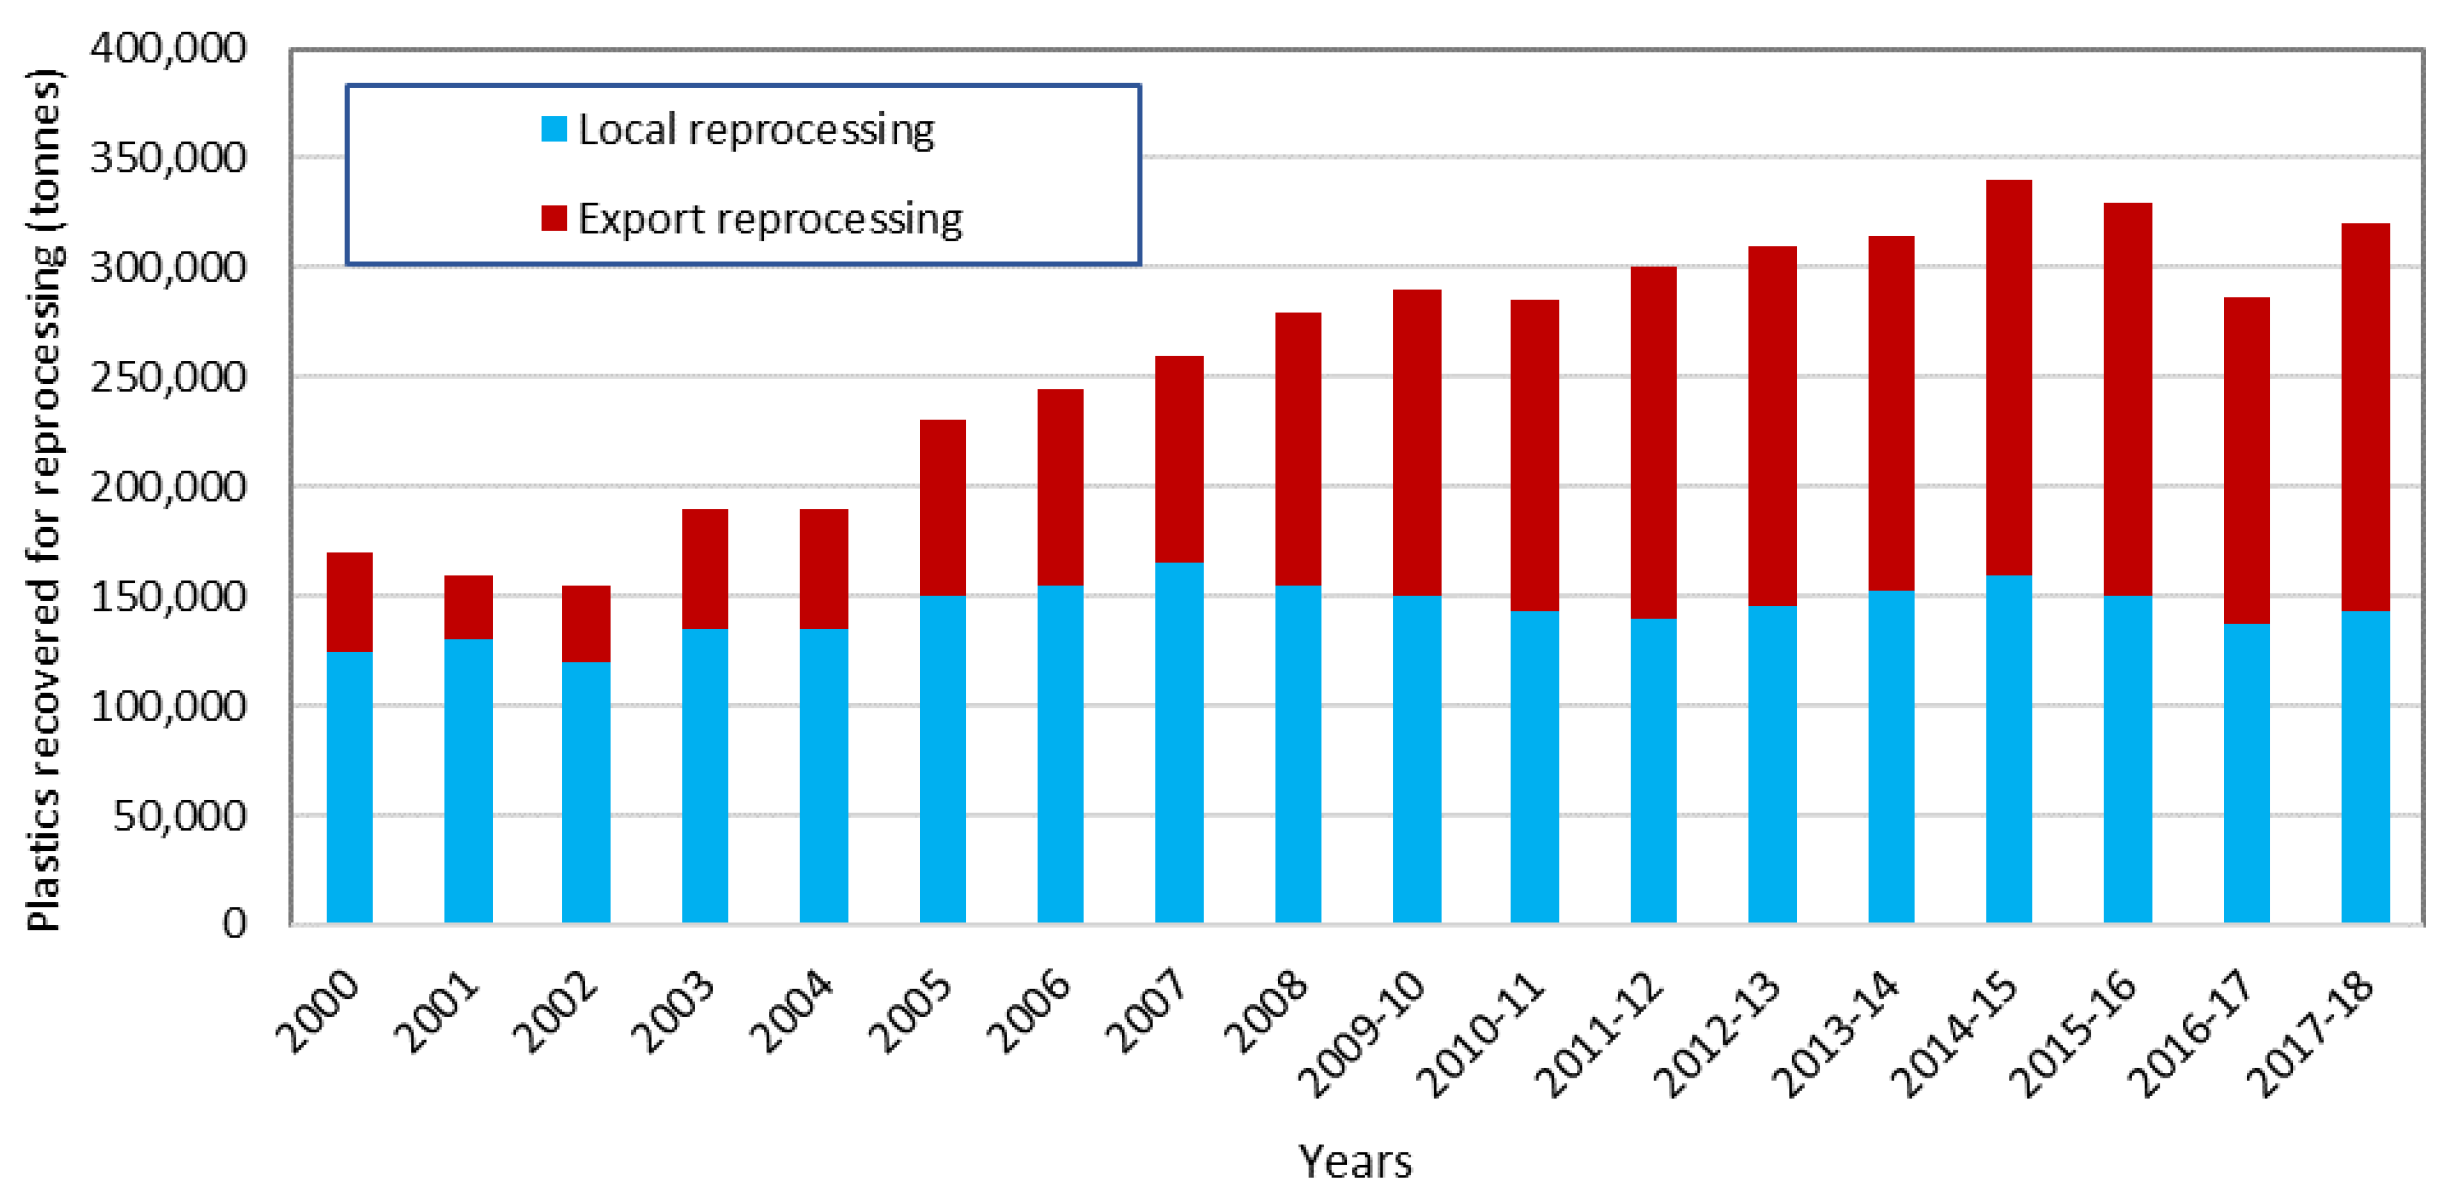
O’Farrell [5] investigated how plastic waste was recycled from 2017 to 2018 in Australia. Key findings from the survey illustrated that Australians consumed 3.4 million tons of plastics in this period with an estimated recycling rate of only 9.4%. In 2018, Australia spent 2.8 billion Australian Dollars for the export of 4.5 million tons of waste primarily to China, Vietnam, and Indonesia [6]. Moreover, the problem could become more acute because of China’s ban on import of plastic waste from Australia in 2018. Australia, who exports half of its recovered plastic waste every year, is one of the impacted countries from the Chinese ban [12]. A similar issue arises when a large amount of plastic waste exported to Malaysia for reprocessing were too contaminated to recycle and required to be returned to Australia [9]. Australia recorded the highest rate of plastic export for reprocessing during the period of 2017 to 2018, which was a significant increase as compared to only 26% in 2000 [5,18]. Figure 2 illustrates the noticeable difference between the amount of plastic waste recycled in local facilities and that exported for recycling. The market for plastic packaging depends solely on the contamination level of the material. The exports of mixed plastic packaging have dropped dramatically from 42,000 t in 2016 to 29,000 t in 2018, with a projection to be at a similar rate in 2019. This is entirely due to the loss of plastic waste export to China [10] and to Malaysia [9].
Taking a further look at Victoria, it is one of the states to be impacted the most from the crisis caused by the ban. The situation was further worsened due to the fact that the state’s largest plastic waste collection company, SKM Recycling, suddenly stopped recycling due to financial and other issues faced by the company [7]. Nevertheless, the state achieved its highest rate of recycling plastics at 15.6% in 2017–2018. This impressive result was caused by the uneven distribution of large plastic producers which are primarily located in Victoria [5]. Despite the highest recycling rate in Victoria (when compared to other states), plastic recycling performance still remained unsatisfactory. During the period of 2016–2017, Victoria reportedly sorted its curbside waste into 3 categories including garbage, recycling, and organics [19]. The materials accepted in the recycling bins typically include paper and cardboard, glass, metal, and plastics, with the contamination rate at 4–16% by weight. Despite having separate bins for recycling, the recycling rate still remained inadequate because of the ineffective sorting methods and different materials mixed up together, causing a high level of contamination.
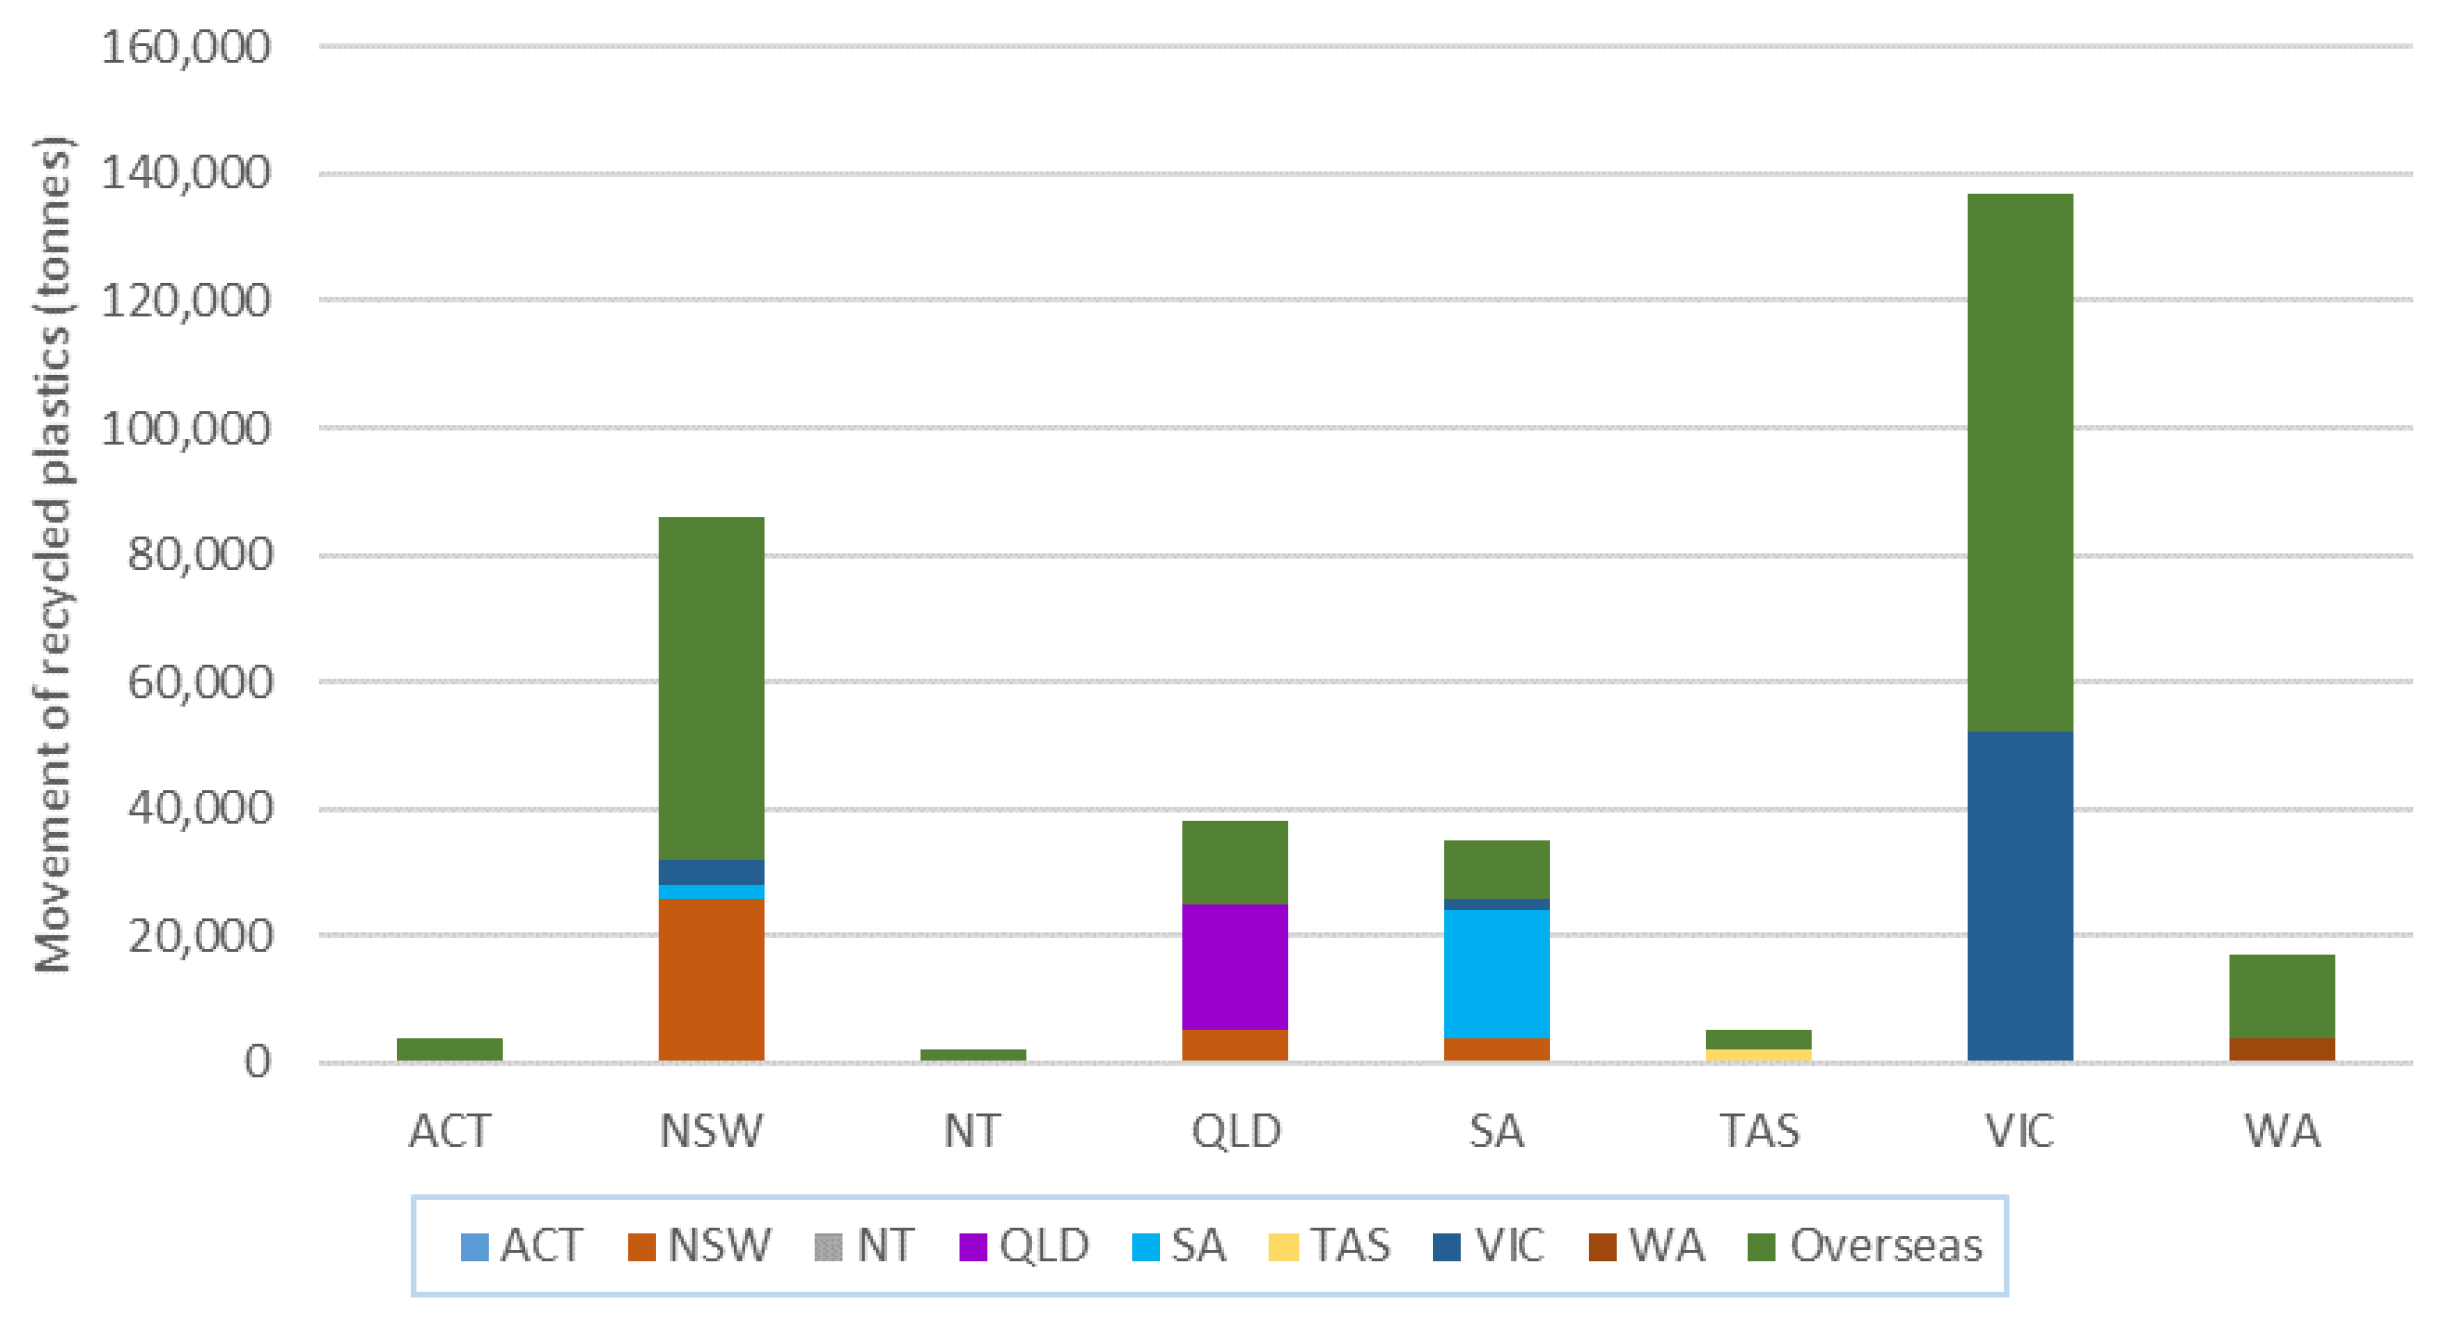
Between 2017 and 2018, 69% of total generated waste was diverted from landfills and 137,000 t of plastic waste were recovered [8]. Of the recovered plastic waste, 62% was exported to other countries for reprocessing, and only 38% was reprocessed locally. The movement of recyclable plastic to intrastate (same state), interstate, and international plastic waste reprocessors in 2017–2018 can be seen in Figure 3. Though Victoria has the largest number of reprocessors, the state only reprocessed around 30% of recovered plastics generated locally compared to more than half in SA and Queensland [5]. There are 25 processing facilities in Victoria and most of them can process more than one type of plastic, and 60 plastic types were handled in the Victorian facilities. Victoria’s plastic reuse rate is still unknown and is estimated to contribute only to a small fraction of the recycling rate. The recovery rate for packaging plastic is 20.6%, which is relatively high. This high rate is also supported by the fact that Victoria relies so much on mechanical recycling, which is viable in processing packaging plastic.
The establishment of the Environment Protection and Heritage Council (EPHC), which was a party involving Australian and New Zealand ministers for environment, could be considered as one of the first attempts to address the impacts of plastic waste. They introduced a plan in 2003 to completely avoid using single-use plastic bags by 2008. The plan was then terminated in 2005 to move forward to another national approach. However, governments of eight Australian states and territories failed to achieve agreed legislations across the country, which resulted in only four states of South Australia (SA), the Northern Territory (NT), ACT, and Tasmania passing their own rules, with the first action by SA in 2008 [20]. ACT is also known as the first municipality in the world to pass ZW legislations in 1996 [21]. Additionally, the law, which has been in place since November 2019 in Victoria, turned NSW into the only jurisdiction without similar prohibition on plastic bag.
In the beginning of 2020, the premier of Victoria announced a 10-year policy and action plan to deliver a cleaner Victoria by reducing waste and pollution, better recycling, creating more job opportunities, and stronger economic development [11]. According to the plan, Victoria will obtain a reduction in waste diverted to landfills by 80% by 2030. The new proposed recycling plan consists of a new method for collecting curbside waste and upgraded recycling system by 2030, a container deposit scheme in 2022–2023, a 100 dollar investment for the local waste and recycling industry, and new regulations on waste and recycling against unlawful activities [11]. The new curbside collection will introduce a fourth bin to the current 3-bins system to separate glass from other recyclable materials. Every household will be required to dispose their waste into different bins accordingly, as identified by different colors of lid [22]. The container deposit scheme is still being developed to ensure its operation, perfectly collaborating with new recycling systems and schemes in other states [23]. This solution will make Victoria no longer the only state in Australia with no similar scheme. An analysis from the Parliamentary office suggested that the program would cost $9 million over the course of 4 years and return $253.5 million through uncollected deposit [24]. At the moment, Victoria has constructed Australia’s largest plastic recycling plant called Advanced Circular Polymers which will process 70 thousand tonnes of plastic waste annually [25]. This plant, located in Somerton in North Melbourne, is able to handle 12% of the current plastic waste generated in Victoria.
2.2. Zero Waste Implementation around the World
The ZW concept has been implemented in many cities around the world. Although, they share similar stories, their practical aspects have slight differences. This review narrows down to case studies from 3 cities that have been outstanding in their ZW implementation with different approaches. These 3 cities are Kamikatsu (Japan), San Francisco (USA), and Hernani (Spain) and their ZW implementation plans are discussed in the following sub-sections:
2.2.1. Kamikatsu, Japan
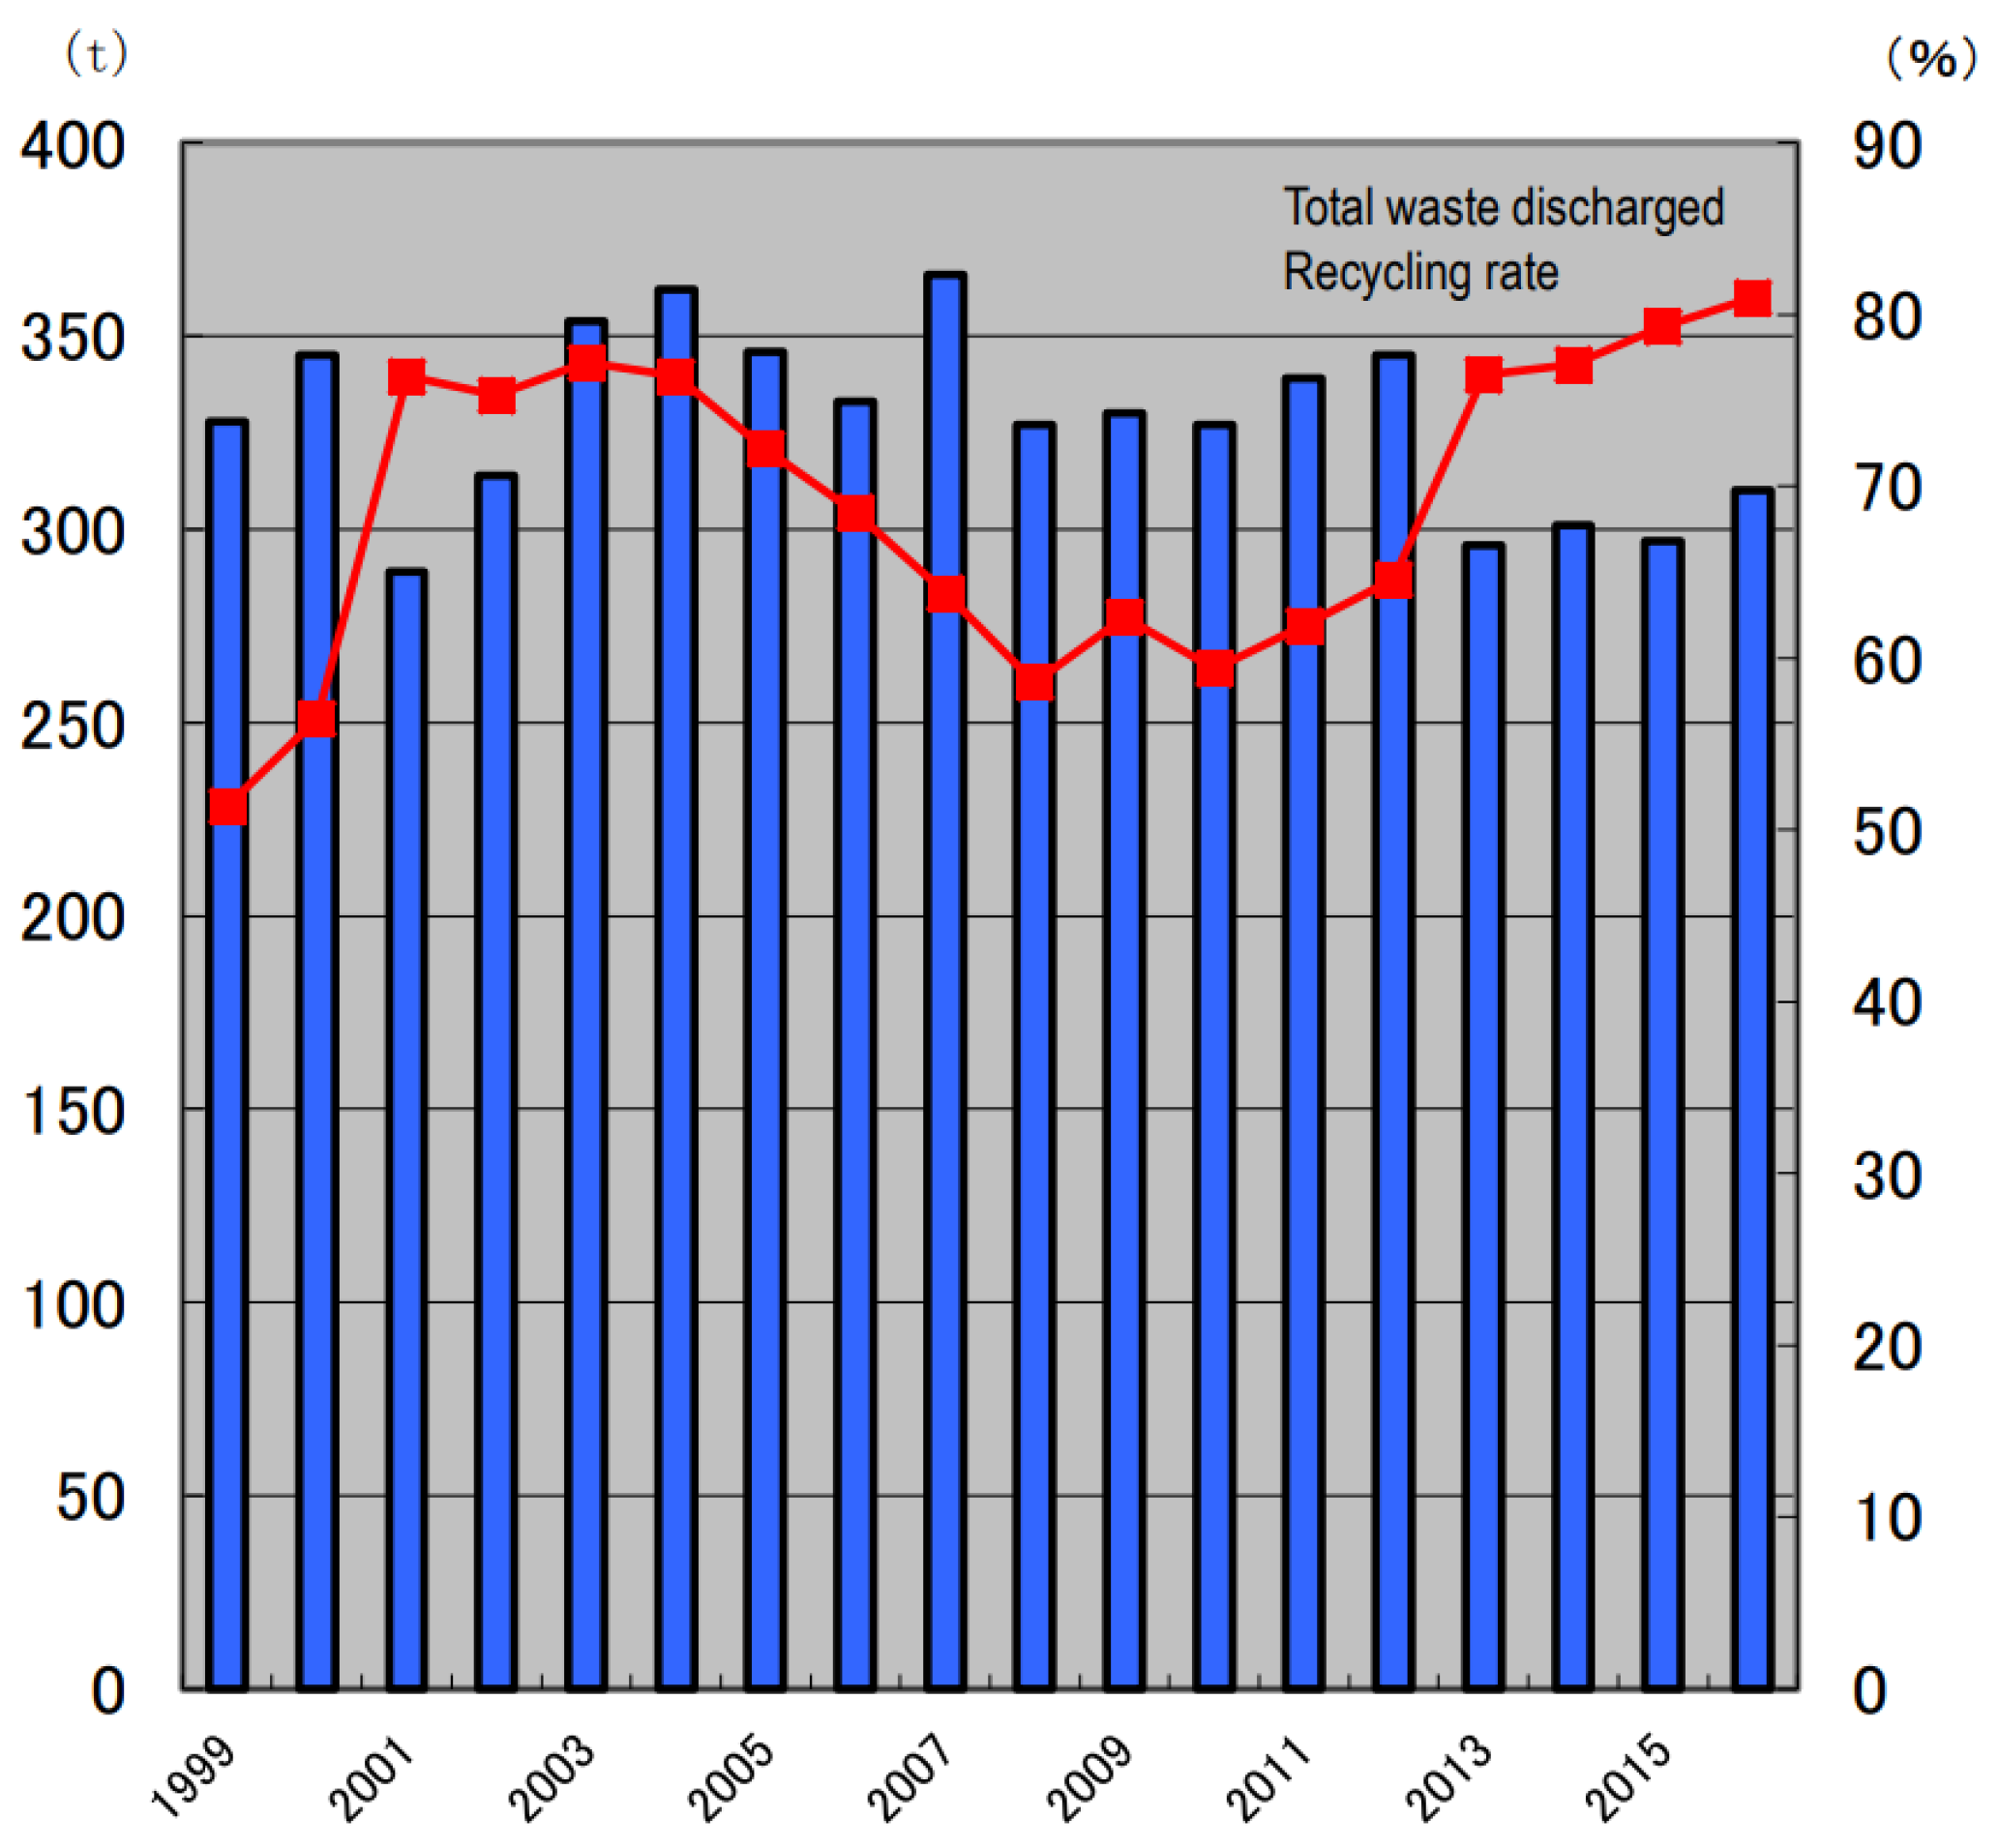
Kamikatsu, a small city in Japan, has managed to reach an 81% recycling rate in 2016 (Figure 4) since the city declared the goal of ZW in 2003 and intended to reach the target by 2020 [26]. The city’s small population is especially beneficial to implementing the initiatives in many ways. Waste segregation methods were introduced gradually over the years and Kamikatsu has managed to sort its waste into 45 categories in 2016–2017 [26]. Plastic waste is sorted into 6 categories, including clean and uncleaned packaging products, white Styrofoam tray, Styrofoam, Polyethylene terephthalate plastic (PET) bottles, and PET bottle caps. Though this municipality has not achieved the target in 2020 yet, the significant efforts made by local government and residents led to several positive outcomes for the globally sustainable development [27]. Several actions were applied in Kamikatsu after its ZW declaration, they were the public engagements, the contributions of local businesses and manufacturers, the establishments of centers for reused and remade products, campaigns, and effective encouragements of local authorities and Zero Waste Academy (ZWA), a local non-profit organization [27]. For example, residents were instructed how to process their waste, including cleaning non-biodegradable waste before disposing them by themselves to the Hibigatani Gomi Station, where the waste segregation was then accomplished by local residents [28]. One of the applied rewards is the Recyclable Paper Point campaign introduced in 2014, where residents can collect points upon bringing paper waste to exchange for toilet paper and paper string.
In 2019, the average recycling rate in the city was around 80%, leaving 20% of the remaining waste that is currently un-recyclable [29]. The implemented recycling process also contributed to a saving of 30% of the expenditure for incineration [30]. In spite of the impressive results, Akira Sakano, chairperson of ZWA, maintained that recycling had to be integrated with waste reduction to reach the ZW target [27]. The contribution of people in Kamikatsu, where they separate waste into 45 categories was impressive, but the process was time-consuming. And it required a lot of efforts, which could be only applicable in such a small town having residents with high personal responsibility and enthusiasm (no governmental enforcements applied) [31]. However, if it were to be adopted in a higher density city, considerations for alterations need to be taken to ensure possible benefits can outweigh current living lifestyle and residents’ income. Thus, the engaging and encouraging rewards, and the involvement of businesses and manufacturers, is also a significant part of the ZW plan.
2.2.2. San Francisco, USA
Kamikatsu’s strategies towards ZW sound impressive, but San Francisco might have a better approach that requires less effort, especially in sorting their recyclable wastes. San Francisco targeted to achieve 75% waste diversion from landfills by 2010 and an ambitious goal of achieving ZW by 2020 [2]. The city organized three bins for waste, including compostable, recyclable, and residuals, in 2002, which is also known as “a three-cart collection”, compulsorily involving both households and businesses in 2009 [32,33]. Rather than sorting plastic waste into 6 categories, the city’s recyclable bin takes all recyclable waste like paper, glass, and bottles in a very similar manner to Victoria’s. The reasons for the success of this city’s waste management, however, lie in appropriate legislations and public participation through effective education [34]. Discounts were obtained by businesses to encourage using recycling and composting bins and penalties were applied for trash being mixed with different types of materials. Residents will be penalized for materials dumped into incorrect bins, which is identified by waste monitoring and trash inspectors. The advance facilities enhance the cleanliness and purity of recyclables which are easily marketed [35]. Another factor contributing to San Francisco’s success was the partnership with only one waste management organization known as “Recology”, facilitating the administration and long-term collaboration [34].
Krausz, et al. [36] concluded that the city authorities focused on applying several effective methods previously proven on waste reduction, behavioral transformation, laws and regulations, and innovations of material manufacture, in which all of those measures focused on increasing the responsibility of businesses and residents. San Francisco has managed to divert waste going to landfill and incineration by 80% in 2012 [37]. Nevertheless, the goal to achieve ZW by 2020 seems to be more difficult to obtain than the city expected when the city only diverted 51% of waste from landfills in 2018. As a result, in 2019, London Breed, current city mayor, thus decided to re-establish the ZW target, particularly for diminishing waste generation by 15 percent, and diverting the waste from landfills by 50 percent by 2030 [35]. San Francisco’s rapidly increasing population, growing richness of residents, and higher demand for plastic products due to their exclusive convenience are reasonable explanations. The city could be a reference for other cities with a mixed variety of successful measures as well as future uncertainties affecting the target. On the other hand, San Francisco’s clear and strict policies are the keys to change people behaviors and establish recycling and composting culture [38]; however, while Kamikatsu shows promising results with a rewards system, San Francisco relies more on a penalty system. This point needs to be further considered to maintain the balance of ethical and personal aspects against the legislation system.
2.2.3. Hernani, Spain
The important lessons to learn from Hernani, Spain, in ZW initiatives are the effective communication and voluntary community participation, political moves opposed to incineration, and the quick implementation of the program between the municipalities [38,39]. The capacity of landfills in San Marko municipality was about to be unable to take more waste in 2002. While the construction of new incinerators was highly opposed by the community, Usurbil was the first municipality to initiate the strategy of conducting a program known as “a door-to-door waste collection” for waste segregated at source, which led to a drop by 80% of waste sent to landfills in the first six weeks and a recovery rate of 82% in the first year of launching the program [39]. Hernani followed the successful model implemented by Usurbil in May 2010. The city removed large containers for recyclables on the streets, required each household to have two bins placed in front of houses, waste separation became compulsory, and launched the door-to-door collection system. The government controlled and managed waste segregation by applying an identifying system of waste source by code on each bin and hook. Each type of waste was collected on specific days for both businesses and households. People would receive warnings by stickers on the bin if they do not comply with the regulations. Glass was the only material still collected by large containers placed on the street, whereas other cities still remained with the curbside collection for this material [40]. Other materials not collected by the program could be dumped into drop-off sites. The municipality also encouraged the residents to compost at home through education, consultation, a supportive phone line, and sign-up composting benefit of 40% off of the municipal waste management fee.
The results from the door-to-door program showed that the waste contamination issue was almost solved at only 1.5% of impurities. Moreover, the waste to landfills in 2010 was 53.8% less than that in 2009, about 80% of waste was diverted from landfills in 2012 [39,41], and an average of a 28.6% reduction in total produced waste [42]. Regarding the financial matter, Table 1 illustrates that the door-to-door collection beat the conventional container system in Usurbil, which could be explained by the income from the market of recyclable products. In general, differing from the two municipalities above, the Hernani recycling system organized 2 bins for all waste types which were collected on designated days for each waste. Tags and stickers are used on residents’ coded bins to warn of any breach of law. This was effective as it increased the residents’ participation and obligation towards waste segregation. The awareness and proactive actions of Hernani residents aimed to protect the environment were also reasons for the incredible achievements.
3. Methodology
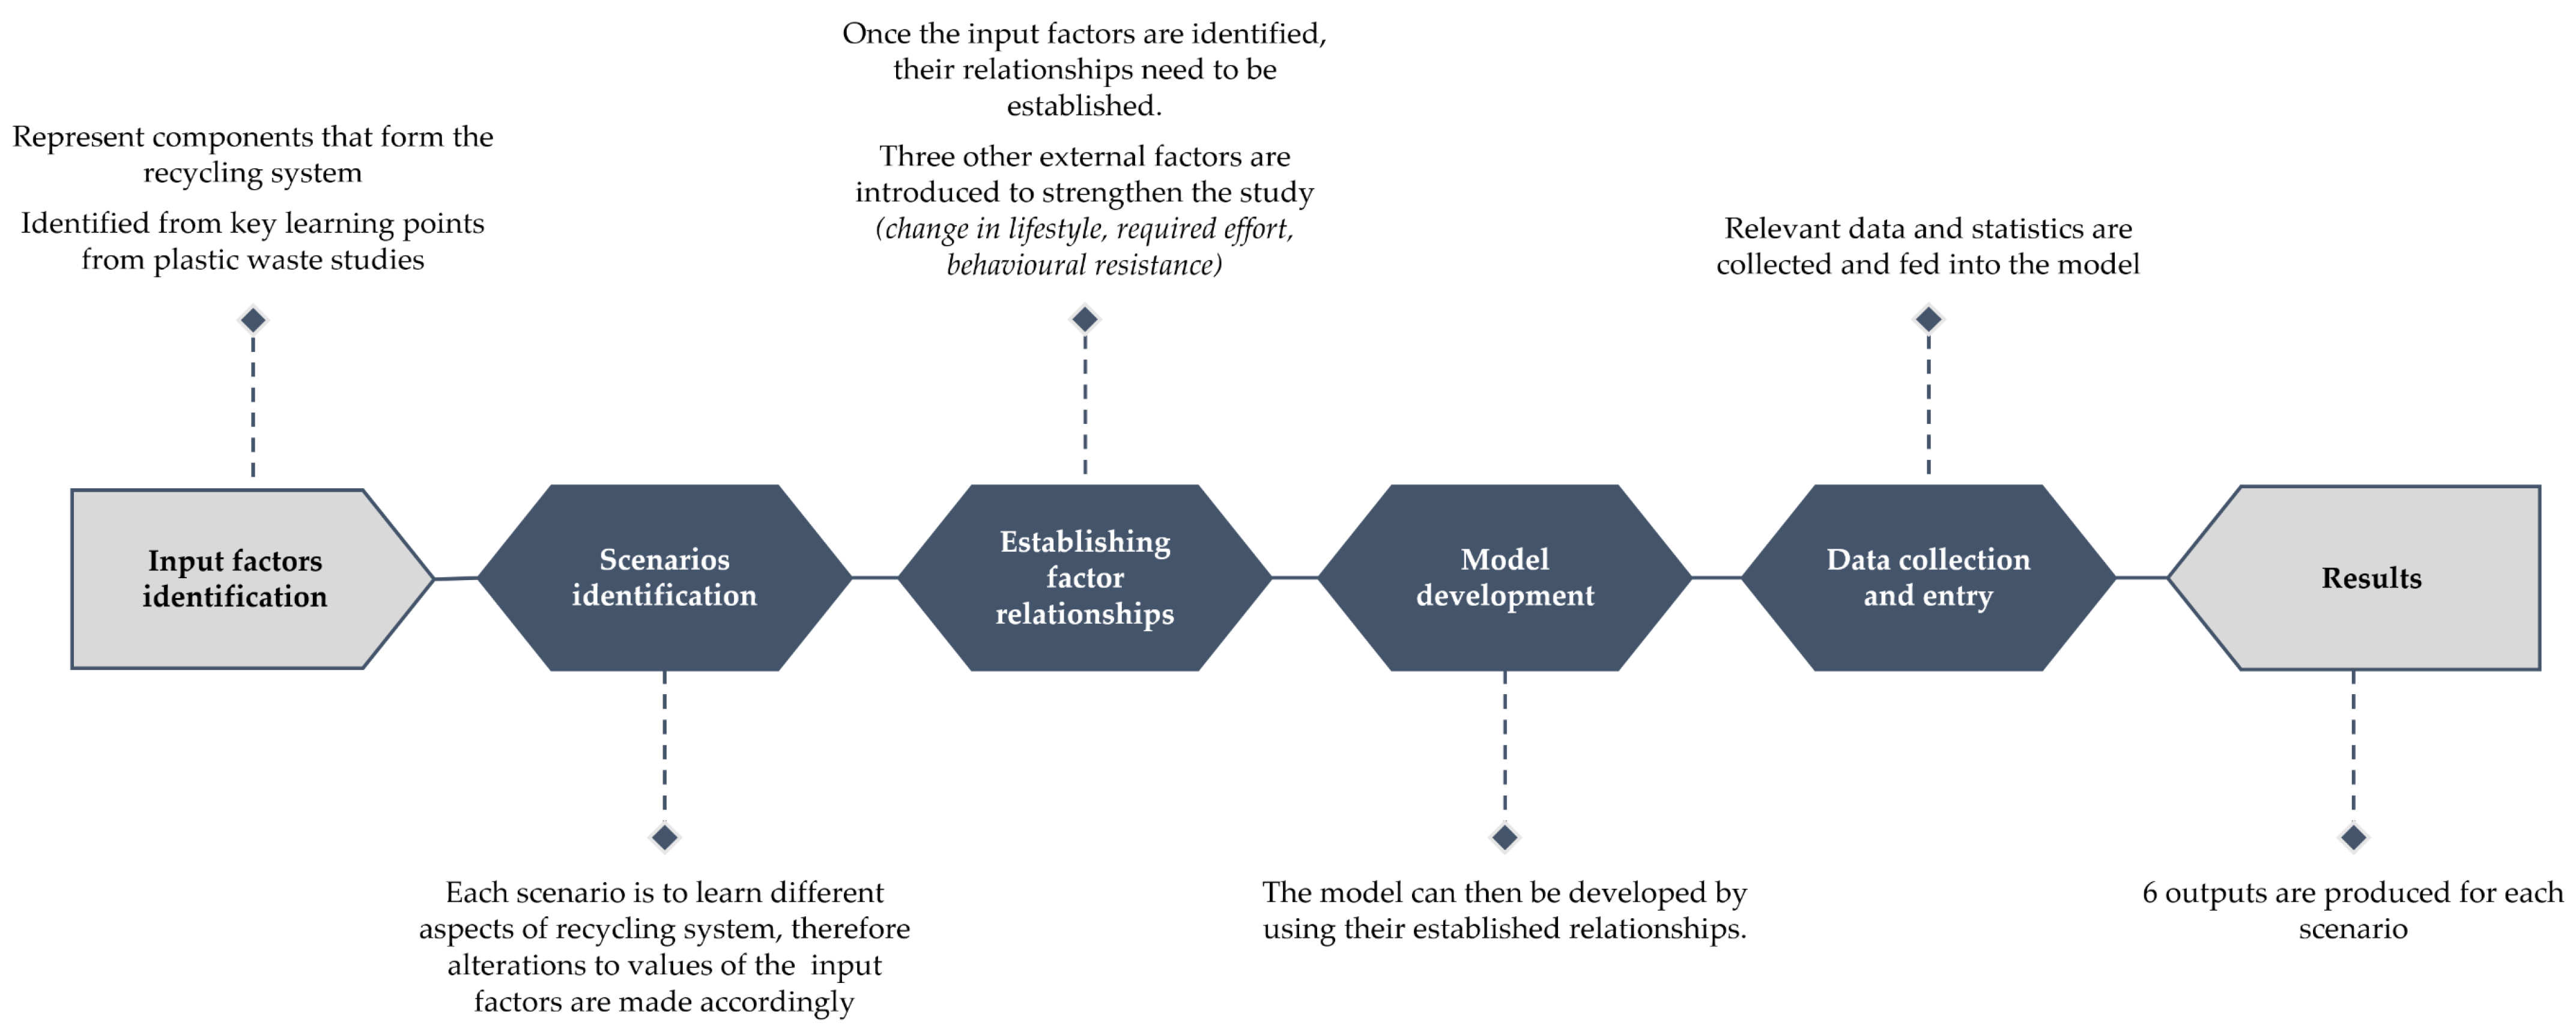
To assess the feasibility of Victoria achieving zero plastic waste by 2035, a simulation model was established using the general baseline prediction approach with a slight modification to include more than one use of the term ‘baseline’. The method is thus called the ‘double baseline method’. This method was developed to address the limitation of data availability for the model development. Since the latest audit on plastic recycling was in 2018, the year is taken as a baseline year or a reference point, which, later in the results, the predicted effort and cost are based upon. This baseline year is embedded in all scenarios, including the baseline scenario, which similarly acts as a reference point for comparison. The ‘baseline year’ and the ‘baseline scenario’ are implemented together, hence the method is called the ‘double baseline method’. This model is adopted from a conceptual approach to zero waste simulation modelling by Krystyna A. Stave of University of Nevada, Las Vegas [43].
The key lessons, gaps, and potential improvements from early reviews will be used to form the main input factors. The inputs include product recyclability, packaging and non-packaging polymer consumptions, processing facilities’ capacity, recycling option efficiency, reuse/end-of-life proxy rate, and sorting efficiency. These input factors represent components that form the recycling system and will be used as the simulation model’s inputs. Scenarios are proposed in the model in an effort to assess different aspects of the recycling system, thus, alterations in the values of input factors in each scenario are made accordingly. An overall research methodology adopted in this study is presented in Figure 5.
3.1. Scenario Identification
The model is run using 4 scenarios, including one from Victoria’s current 10-year plan called Recycling Victoria: A new economy [44]. These scenarios are formed based on projections from available data in an effort to study their effects on plastic waste recycling performance as well as looking for possible alternatives to ZW. Details about each scenario are presented in Table 2 and discussed in detail in this sub-section.
Victoria’s current plan (baseline scenario): This scenario is based on the new policy called Recycling Victoria, which is the Victorian Government’s 10-year policy and action plan for waste and recycling [45]. Since the policy has already been rolled out and is in place, this plan will be used as a baseline scenario to compare with scenarios 1, 2, and 3. While it is not mentioned in the publication by how much the government planned to improve those key input factors, the values in the table are approximations only and not without flaws. Nevertheless, each value was reasonably estimated by considering the goals established by the Victorian government. For example, the 2020 Recycling Victoria: A new economy package, proposes a plan to achieve a 15% decrease in consumption per capita and 80% diversion rate by 2030, with an interim rate of 72% by 2025. This means the diversion rate goal is achieved by 90%. Two-thirds of the targeted diversion rate, which is defined as the amount of waste not being disposed into landfills, is contributed by reducing waste, that would make a consumption rate at around 10% fall in the first 5 years. Assuming the rate peaks at a constant rate of 1% annually, reduction in consumption rate will be at 15% by 2030 and 20% by 2035. The two-thirds of diversion rate achieved by waste reduction is based on the fact that diversion rate in Victoria heavily relies on consumption compared to recycling capacity and the package allocates only one-sixth of the fund to facilities investment, which adds up to the first argument.
Scenario 1 focuses on changes made in values of plastic consumption and recycling capacity, and looks at its impact on the overall performance, without changing the values of the other input factors. Hence, this scenario is called ‘consumption and capacity analysis’, as indicated in Table 2.
Scenario 2 is the reverse of scenario 1, where factors related to consumption and capacity are kept the same as that in the baseline scenario and factors related to recycling capacity are changed. Rather than asking consumers to reduce their consumption and build more recycling facilities, the state government provide education and promote the recyclability of products, reuse, and better sorting efficiency. The values under scenario 2 in Table 2 are proposed to meet the highest efficiency, as seen in Kamikatsu, Japan, where plastics are sorted into 6 categories with the highest recyclability rate. Hence, this scenario is called ‘recycling capability analysis’ in Table 2.
Scenario 3 compliments Victoria’s current plan and is designed in such a way that zero plastic waste is ensured to be met by 2035. Hence, this scenario builds upon the State’s current plan and uses the knowledge gained from scenarios 1 and 2.
Below are the explanations of the input factors and their values used in Victoria’s current plan (baseline scenario) from Table 2.
Product recyclability (×3)
Regardless of how recyclable plastic is, if there is no improvement to consumers’ sorting efficiency, plastic waste will still end up as a mixed contamination batch. Therefore, the rate of product recyclability should be increased alongside sorting efficiency, that is, by 3 times (see sorting efficiency below).
Plastic consumption (−20%)
Plastic consumption used in this study is simplified by categorizing into packaging and non-packaging plastic. As described earlier, the reduction in consumption rate of 20% is estimated by interpolating values based on targeted achievement and required effort.
Processing capacity (×3)
Diversion rate is the rate of recovery over consumption. The estimated values in 2020 are around 1,108,000 t (consumption) and 207,200 t (recovery). For the plan to achieve 80% diversion rate with 15% consumption reduction, the equation would yield recovery at 659,300 t or 3.18 times that in 2020. The model adopts this value as 3 instead of 3.18 due to some variations to accommodate errors in estimated values.
Recycling option efficiency (+10% and 0%)
According to the 2017–2018 Australian plastics recycling survey by O’Farrell [5], there are 4 current recovery options in Australia. Mechanical recycling refers to the use of physical processes such as sorting, chipping, grinding, washing, and extruding to convert scrap plastics to a usable input for the manufacture of new products. Biological recycling is the recycling process through composting or anaerobic digestion. Feed stock recycling is the conversion of polymers back into a monomer or new raw materials by changing the chemical structure of the material and includes processes such as pyrolysis and gasification. Energy recovery is the process to recover energy from plastics through controlled combustion or conversion to a liquid fuel, which may be a good option for plastics that are not suitable for mechanical recycling, such as contaminated products [5]. Each of these options contain two values that represent different periods of the plan.
The values of +10% represents a boost in the first 5 years of the period, while 0% represents the later 10 years. Existing annual growth rate is estimated based on increase in reprocessors from 2016 to 2018 to be 2% for the later 10 years. Since, in this model, processing capacity above is defined to have a direct relationship with recycling options efficiency, we could work backward to diminish the growth by 2%, which in doing so for that remaining after 10 years is worked out to be a 10% boost on top of it.
Reuse/end-of-life proxy rate (10%)
The government plans to allocate about $1.8 million of the budget towards improving reuse economy and charitable sector, which spend about $13 million and divert around 31,600 t of waste donation from landfill. Assuming a direct relationship, the grant could increase the sector’s diversion rate by 14%, resulting in end-of-proxy rate at 3.2%, which is 0.5% on top of 2020’s rate. If the rate is constant throughout a 15-year period, the rate should be projected to be at 10%.
Sorting efficiency (×3)
Since Victoria’s waste sorting system only sorts plastic in one recycled bin, the efficiency can be considered as ×1. The new plan separates glass into a new bin and introduces a container deposit scheme which effectively cuts down the process of segregating plastic and glass from carboard, metal, and other materials. The efficiency from this plan could arguably be considered to increase by 3 times.
3.2. Establishing Factor Relationships
The input factors, despite their simplicities, have tangible relationships with one another which require a thorough analysis to breakdown. Due to limitation of resources, this study only takes the important factors into consideration. The relationships of these factors are established and presented in Table 3, where each input is configured interrelatedly to obtain certain factorized values defining their relationships and how changes in one factor would affect the others. The purpose of introducing this factor relationship is to project as realistic results as possible despite the limitation on resources and to better understand the relationship between areas of plastic recycling. Explanations on how each value in Table 3 is obtained are also provided below.
Product recyclability
While there is no direct study on how much of an effect product recyclability has on other inputs, the values used in Table 2 are estimated based on the indirect relationship found in the following studies. One study suggests how promoting recyclable waste to be transformed into new products can increase recycling rates. Six tests were conducted with varying results, the least effective of which is an audit of two university residence hall waste collection stations where signage was placed to show how the recyclables can be made into products. Approximately 11% recorded an increase in recycling rate [46]. Since human behavior has a direct effect on sorting and recycling efficiency, the value can be adopted as a factorized value. In Kamikatsu, Japan, the highest sorting categories for plastic is 6, where even products like water bottles are sorted separately from their caps. From this example, assuming water bottle and its cap are made from the same material and can be sorted into the same category, it would increase the sorting efficiency by one sixth, that is 15%.
Reuse/end-of-life proxy rate
Victorians have been very supportive of banning low-density plastics like plastic bags. This type of polymer represents roughly 10% of total plastic consumption in Victoria. Assuming products with low-density plastic are banned, plastic consumption can be cut down by around the same rate, that is 10%.
Sorting efficiency
In facilitating terms, there are 4 recycling options in Victoria, each of which recycles different mixes of polymers according to its contamination. Thus, any alterations to sorting efficiency should influence recycling options by 25%.
Change in population and lifestyle
This is based on the population growth rate in Victoria. The rate varies from year to year, toping at 2.55% [45], which could be rounded up to 3% for conservative purposes.
Required effort
While there is no information on how much effort is required to conduct certain campaigns, all values are obtained through processes of ranking based on delivery plans laid out by the government and its allocated budget to each aspect.
Behavioral resistance
Most of the resistance values are reflective of those of the required effort. The resistance values to consumption are based on the example of banning lightweight plastic bags, where public consultation was conducted and only 3% of individual respondents opposed (Victoria State Government, 2019). If banning other types of plastic for the same reasons and purpose, there is a high chance of receiving a similar response.
3.3. Model Development
(a) Input Factors
With input factors and their relationships being established (as presented in Table 3), the development of the model can be started by using simple conditional formulae in MS Excel to combine the relationships. Explanations of how input factors are interlinked by the relationships are explained below.
Product recyclability
Given the condition that if the selected year’s value is greater than that from its baseline year, that is 2018, the result must yield a product of the selected year’s value and behavioral resistance, otherwise it can be used as it is.
Plastic consumption (packaging and non-packaging)
Given that if the selected year’s value is lesser than that of the baseline year of 2018, the result must include a product of the selected year’s value with its factorized values, reuse rate value, and behavioral resistance value, otherwise no behavioral resistance value is needed.
Processing capacity
To simplify the process, processing capacity is set to be the product of total recycling option efficiency and the constant pre-calculated value of capacity per efficiency.
Recycling option efficiency
Because of the nature of its relationship, recycling option efficiency is affected by product recyclability and sorting efficiency. Given the condition that the two affecting values increase, the result must yield a product of the three values with their according factorized values, otherwise no factorized values are needed.
Reuse/end-of-life proxy rate
Given the condition that if the selected year’s value is greater than that from its baseline year, that is 2018, the result must yield a product of the selected year’s value and behavioral resistance, otherwise it can be used as it is.
Sorting efficiency
Given the condition that the product recyclability value increases, the result must yield a sum of sorting efficiency value and the difference in increased recyclability along with its factorized values, otherwise it is equal to the efficiency value itself.
(b) Output Factors
Subsequently, the output section of the model is developed by formulating it according to their definitions. There are 6 outputs to be produced from the model: plastic consumption, plastic waste to landfill, diversion rate, recycling rate, relative effort, and relative cost. Each output is plotted in the form of a line chart against a timeframe from 2016 to 2035. There are 4 critical points along the timeframe, with year 2020 as the starting point and 2025, 2030, and 2035 as the next 3 milestones. It can be seen that only results from 2020 onward are the important ones. However, the decision to include results from years 2016–2019 was made because of the fact that 2018 is used as the baseline year; thus, it is practical to include a closest period of two years to bring consistency to the overall result. Below are explanations about the 6 outputs used in the modelling.
Plastic consumption (Total)
The sum of packaging and non-packaging consumptions.
Plastic waste to landfill
The deduction of plastic consumption and plastic recovered or processing capacity for simplicity.
Diversion rate
Equal to plastic recovered (plastic consumption minus plastic waste to landfill) over plastic consumption.
Recycling rate
For simplicity, yet not entirely dependable, recycling rate is the additional rate of reuse or end-of-life proxy to diversion rate.
Relative accumulative effort
Relative effort indicates combined effort required for implementation with reference point in year 2018. It is calculated based on required effort values, as shown in Table 3, where the value is broken into percentage per unit. The percentage per unit values are then used to multiply by the units to get the original required effort values minus 100% to get 0% as a baseline value in 2018.
Relative accumulative cost
Relative cost shows the total cost required to carry out the plan in the scenarios with reference point in the year 2018 and is calculated based on the allocated budget of Recycling Victoria: A new economy plan, and the recently opened $20 million facility that has capacity of about half of that in 2018 (Victoria State Government, 2020). The procedure is very much the same to that for relative effort. Table 4 shows one configuration example of product recyclability (input) and plastic consumption total (output). The configuration of remaining inputs and outputs are presented in the Supplementary Material section.
3.4. Data Collection and Entry
Once the technical stages are well established, relevant data are collected and fed to the model. These data (raw data) are taken from multiple sources to form values that are used in input factors. Since the input factors are interlinked by their relationships, the model will then configure and adjust those values accordingly. These new adjusted data are then used to produce the outputs.
Since the latest audit on plastic waste was done in 2018, data from 2019 to 2020 could not be obtained. Therefore, a projection is necessary to be done at a conservative steady rate to complete the model. It is also critical to point out that since studies on plastic waste and waste audits possess uncertainties related to the data, the modelling is expected to encounter slight errors, which, regardless, is still viable to support the study.
4. Results and Analysis
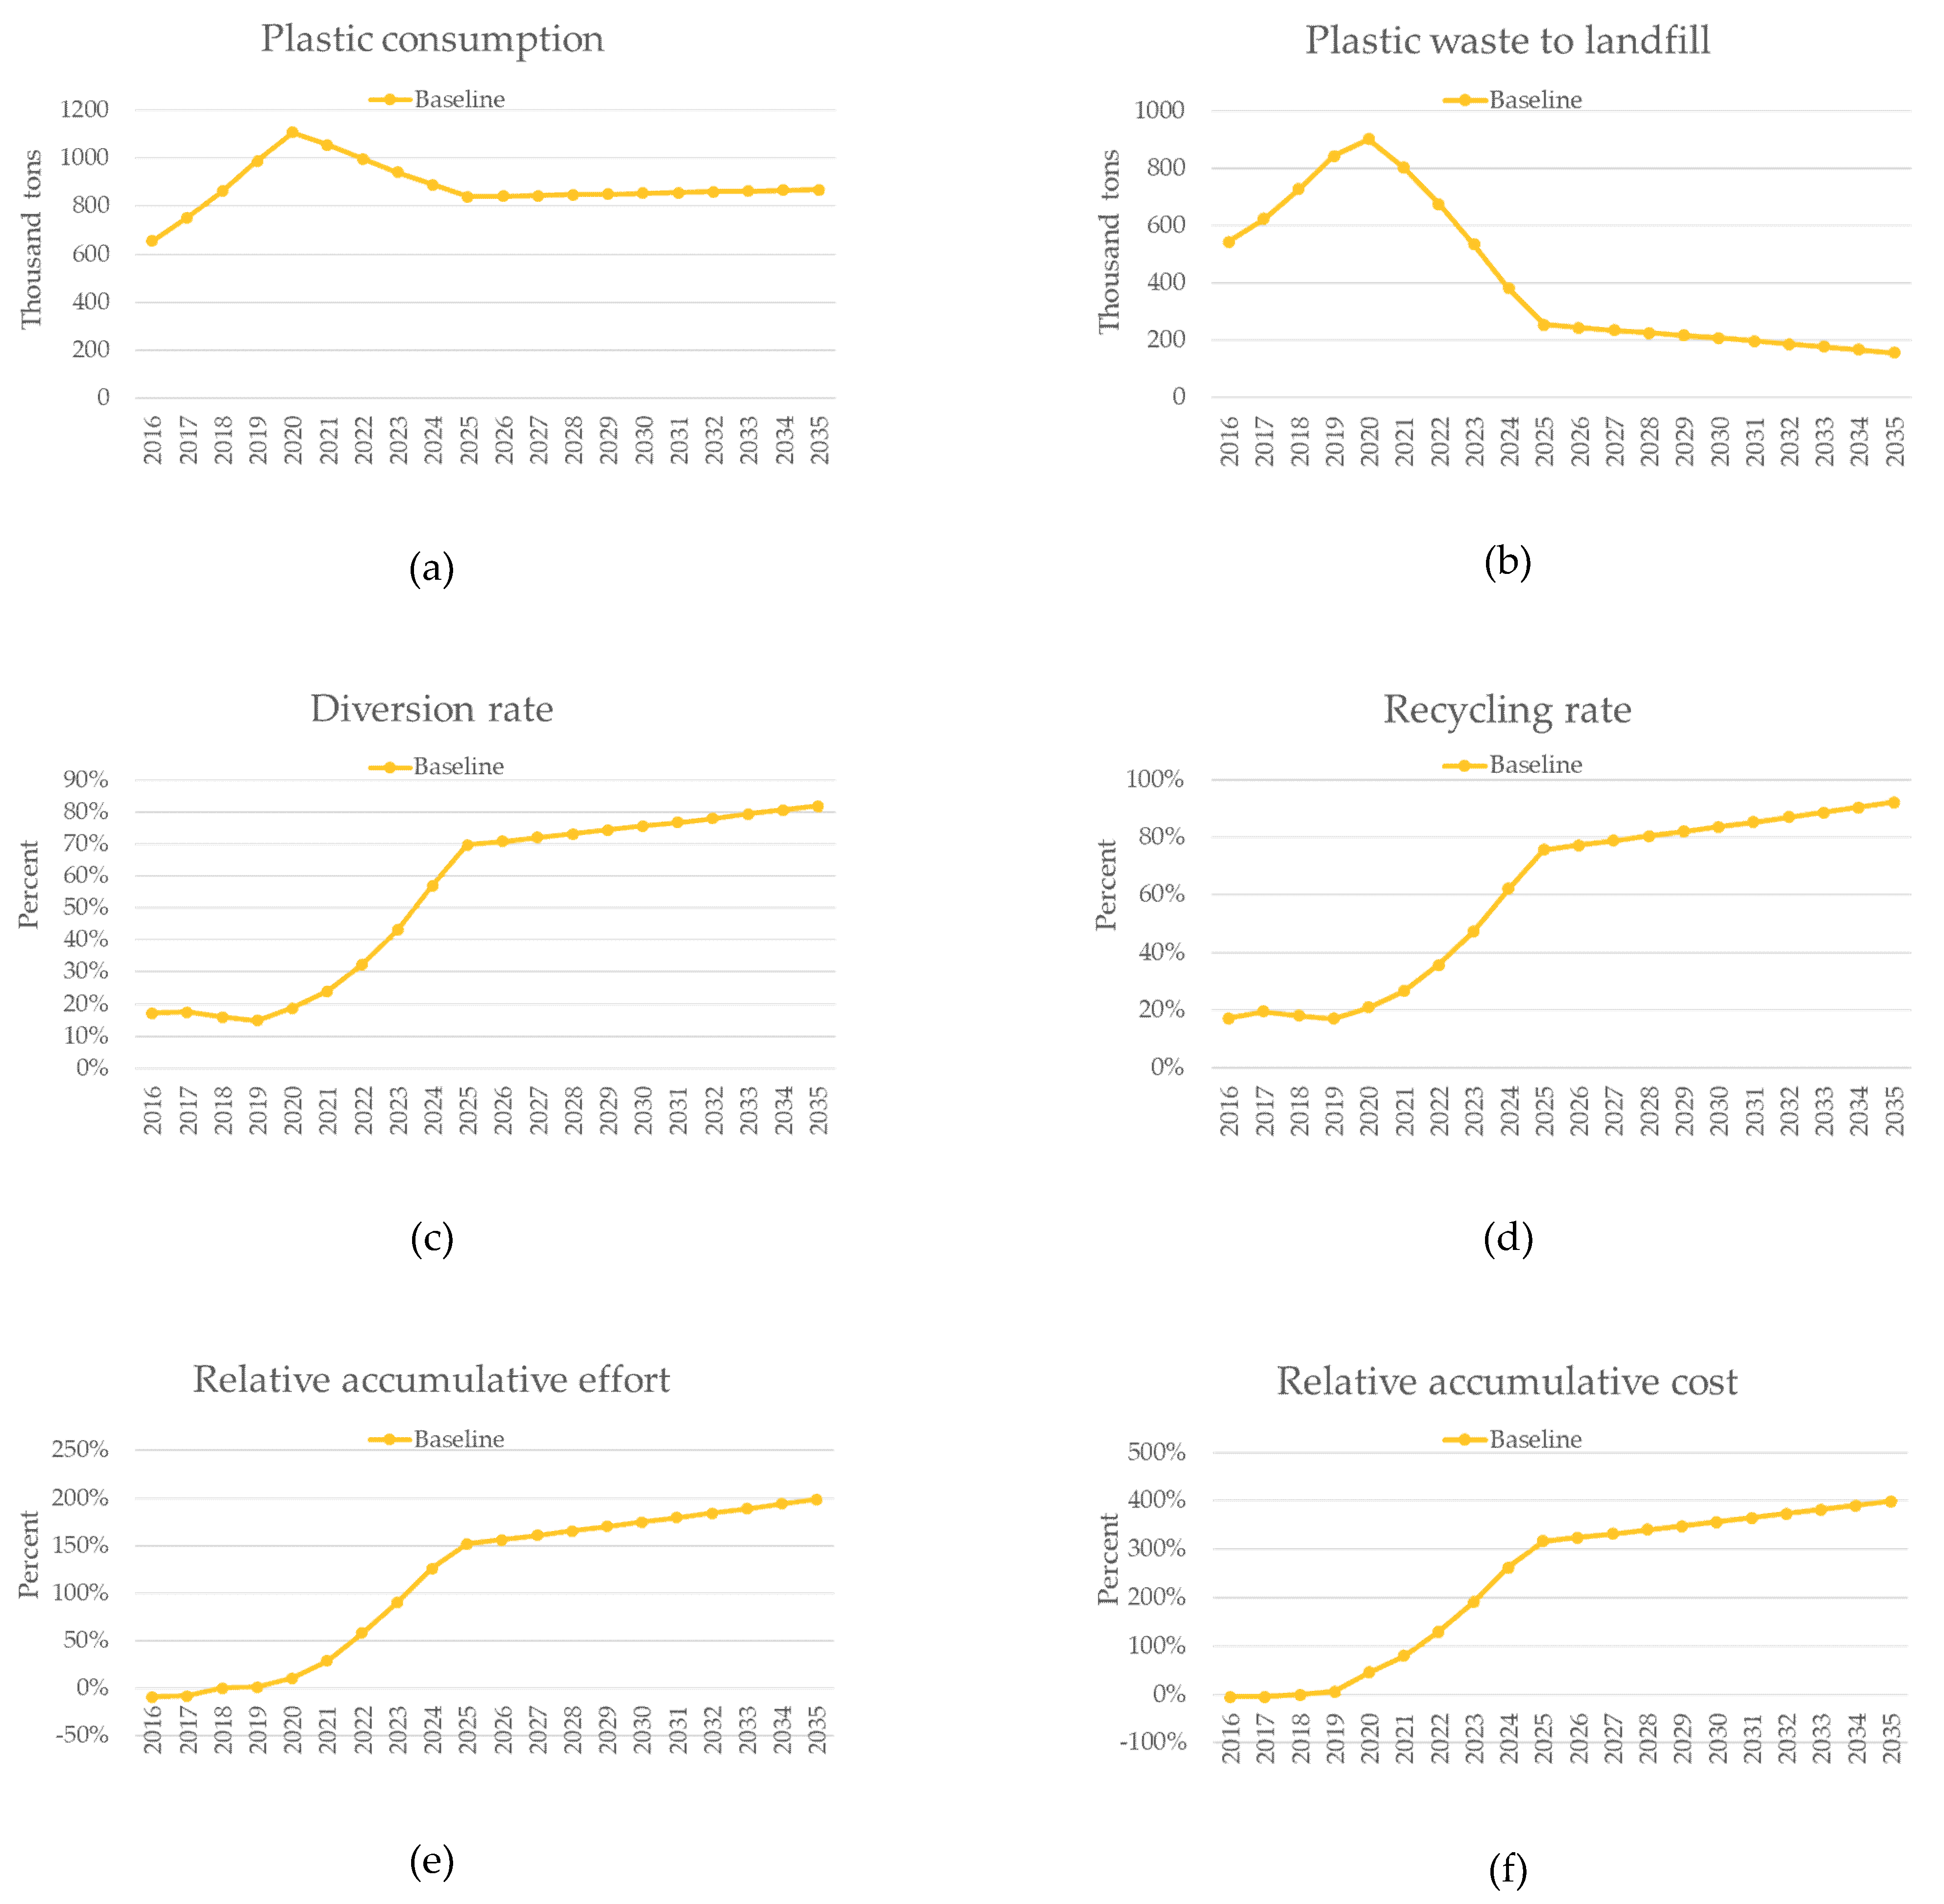
The outputs from the simulation model are presented in this section as graphs for each scenario, which include the baseline scenario (Figure 6), scenario 1 (Figure 7), scenario 2 (Figure 8), and for scenario 3 (Figure 9). The output for each scenario includes a set of six graphs, one for each of the six output factors (namely, the rate of plastic consumption, waste to landfill, diversion rate, recycling rate, relative accumulative effort and relative accumulative cost.). The outputs from these graphs are compared with one another, based on which the results and discussion are presented. The comparison will look critically not only at the ZW criteria but also the feasibility of it in terms of cost and effort required and the timeframe during which the goal is achieved.
4.1. Victoria’s Current Plan (Baseline Scenario)
The simulation results for the baseline scenario are presented in Figure 6. Plastic consumption rate drops by 21% from 1,108,000 t in 2020 to 870,000 t in 2030. It represents a feasible outcome which is 6% over the target. However, it starts in 2025 and slightly increases throughout the rest of the timeframe. The rate significantly drops during the period of the rolled-out plan (2020 to 2025) and increases at a acceptable rate, considering growth in the population. While this could look concerning to some extent, it is in its natural state of consumption growth over time and can be backed by an optimistic decrease in rate of plastic waste going to landfill. The goals to achieve 80% diversion rate by 2030 and an interim rate of 72% by 2025 are shown by the result to be credible and achievable.
From the diversion rate graph of Figure 6, 67.7% can be achieved by 2025 and 73.5% by 2030, with recycling rates of 73.7% and 81.54%, respectively. As we take an average value to their respective years, the rates will settle closely, at 70.7% and 77.5%. As mentioned earlier, recycling rate is the inclusion of reuse or end-of-life proxy to diversion rate but is not entirely dependable due to its uncertainty in auditing. Therefore, it is practical to average the two values, although it is recommended to rely on diversion rate under most circumstances. With these achievements, it is estimated that the government will have to exert 200% more effort compared to how much was put in 2018, with around 30% annually during the period of the roll-out plan, that is from 2020 to 2025. The expenses are also made in a similar manner, where most of the major ones occur during the roll-out period, accumulating to approximately 400% as compared to how much was spent in 2018. Aside from these promising figures, the plan will not bring Victoria’s recycling system to achieve zero plastic waste by 2035 since the average value of diversion rate in year 2035 is only 87%. The steady growth rate extends achieving ZW by at least another 10 years considering no changes are made towards the system.
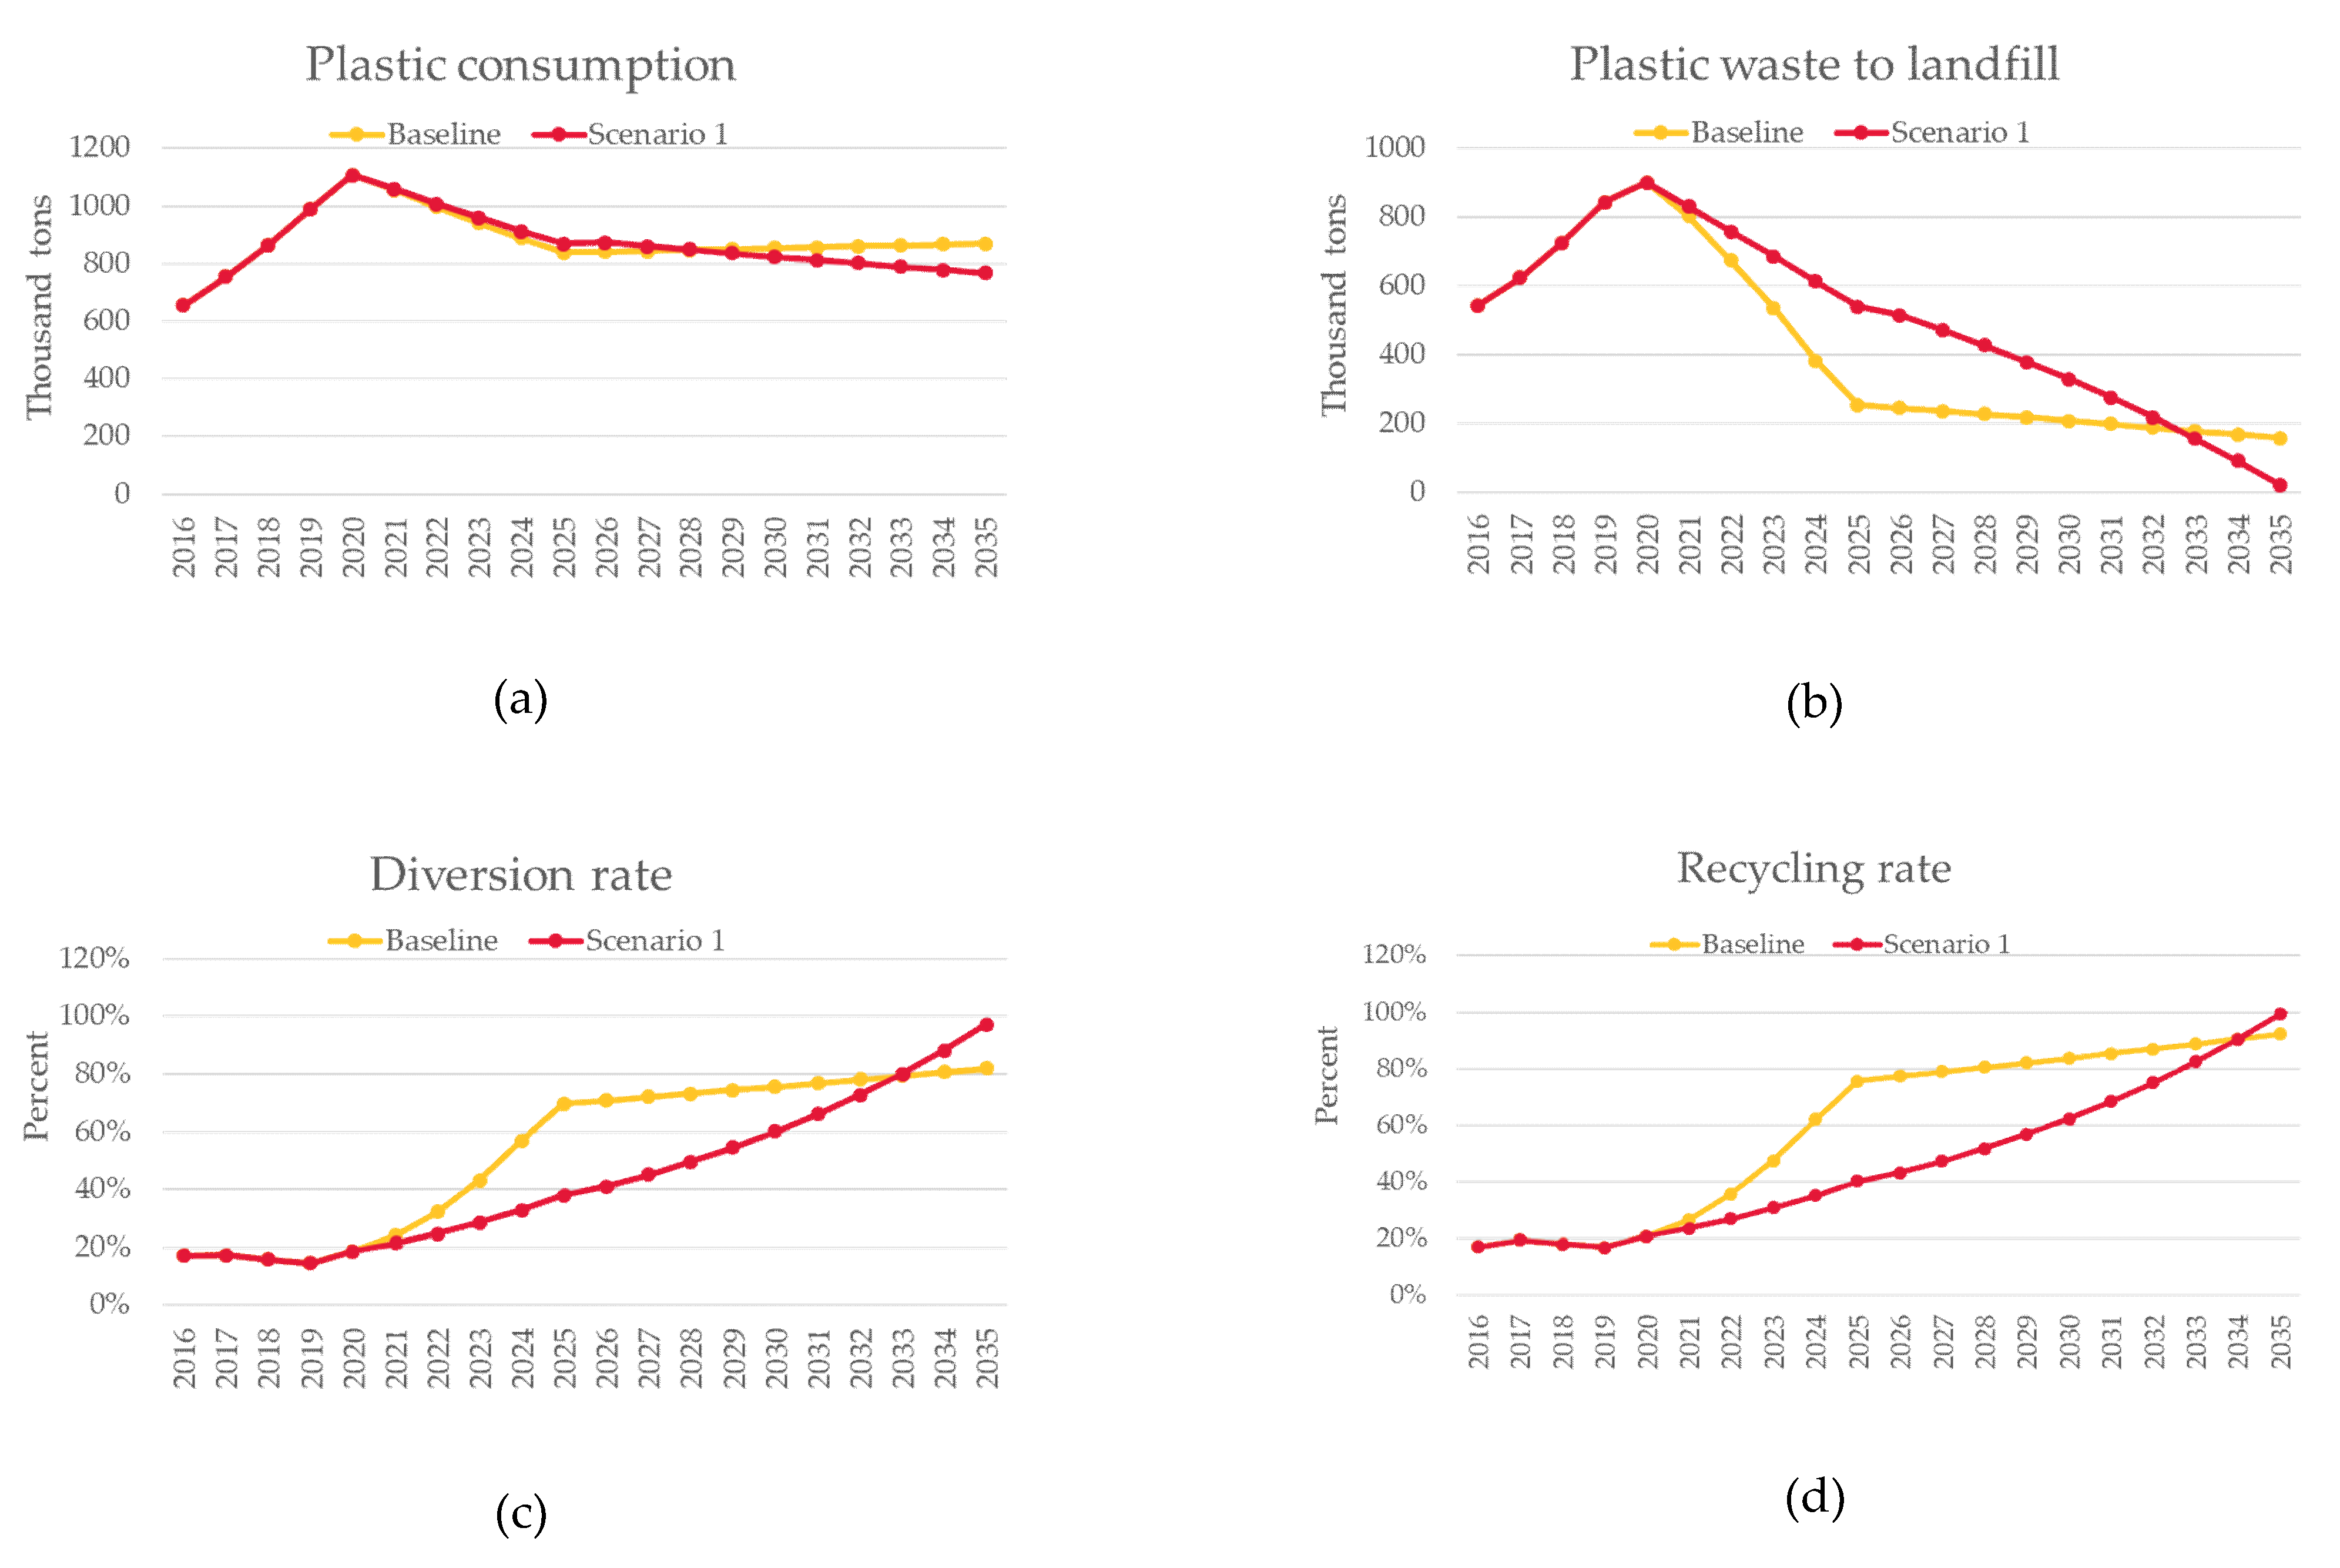
4.2. Scenario 1—Consumption and Capacity Analysis
The simulation results for scenario 1 are presented in Figure 7. The plastic consumption is predictable since the scenario pushes further to reduce consumption. The rate goes down steadily from 1,108,000 t in 2020 to 870,000 t (−21%) in 2025, 825,000 t (−25%) in 2030, and 76,700 t (−31%) in 2035. The input for this scenario was set to outperform that in the baseline scenario by only one third, yet it produces a more desirable outcome. The rate is projected to decrease for another 8 years before it starts to stabilize and increase again. The output of plastic waste to landfill in this scenario, however, behaved differently from the baseline scenario. Instead of diving down in the first 5 years, the rate takes a steady slide to a 97% decrease throughout the timeframe. The gap between the two lines in the first 5 years represent how much of an affect the factors of recycling capability, such as product recyclability, reuse rate, and sorting efficiency, have on behavior and performance of recycling system. Diversion rate tops at 97% while recycling rate at 99%, which can be averaged to 98% and can be considered as achieving ZW by the targeted year of 2035.
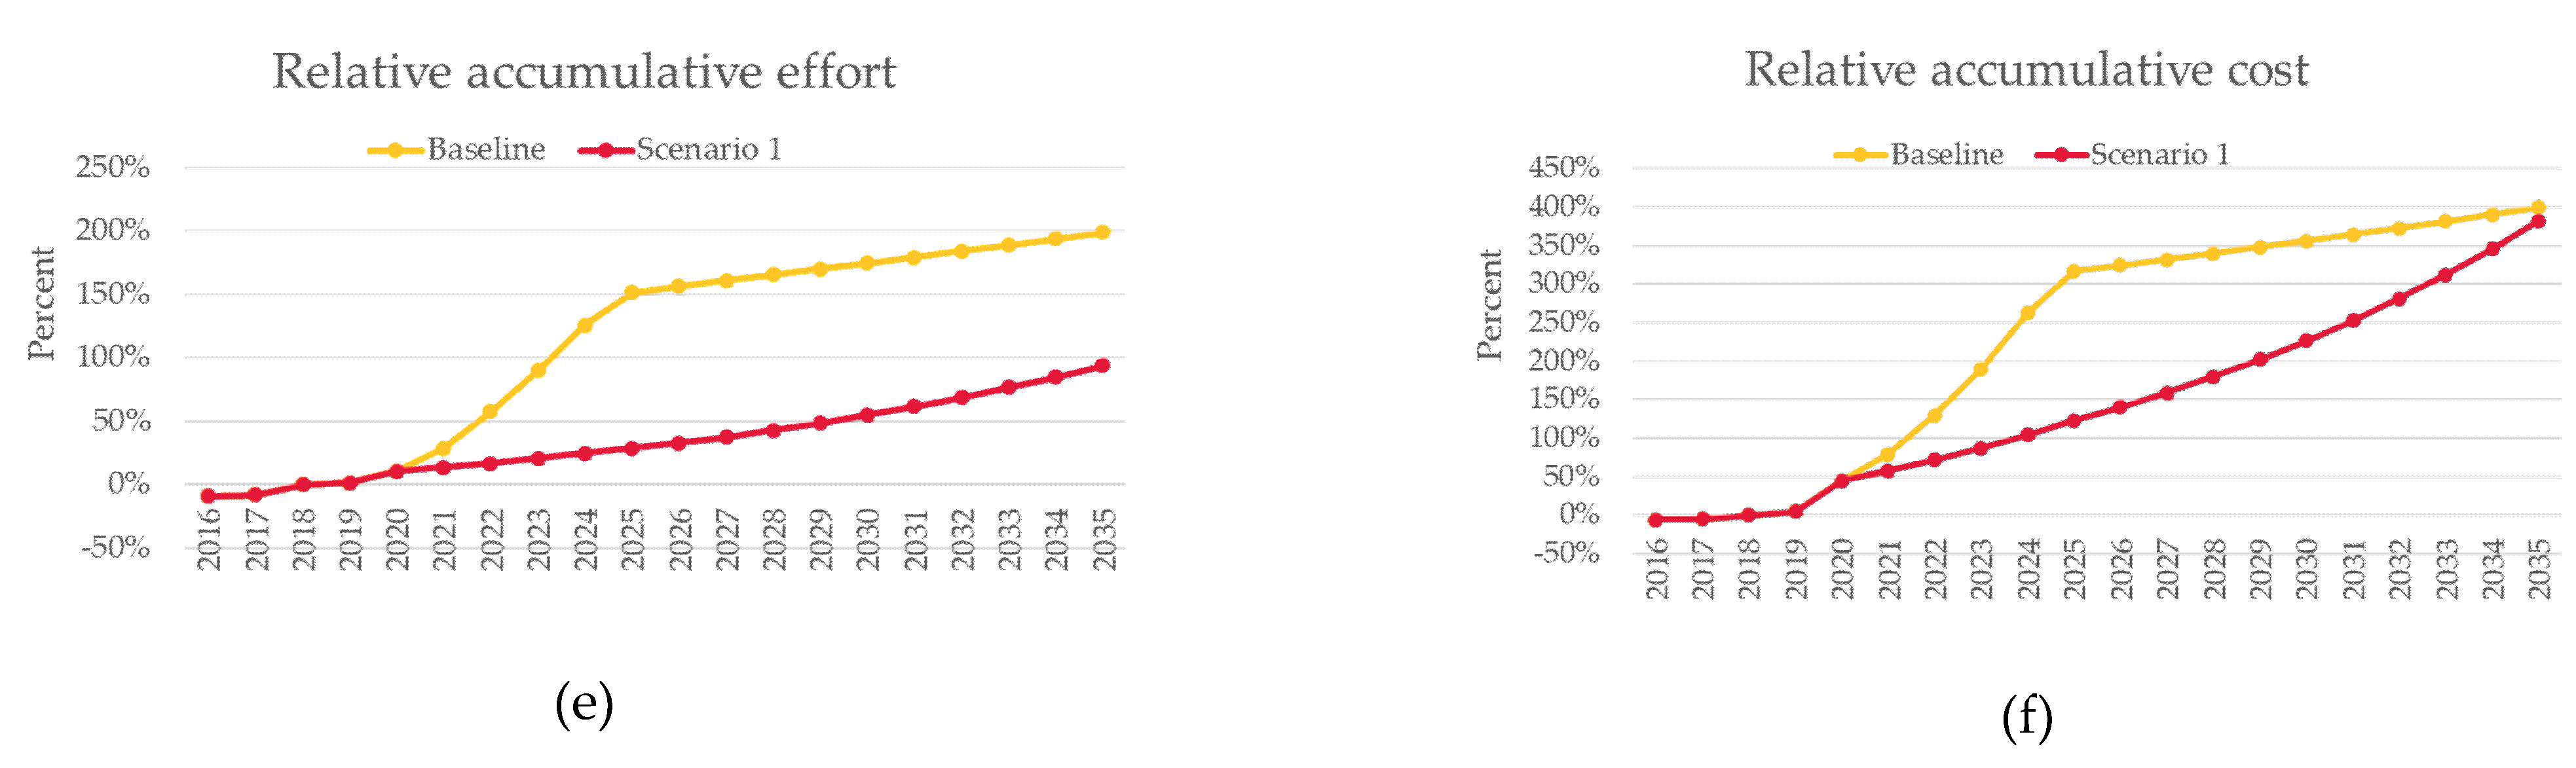
The main difference between this scenario and the baseline scenario lies in their timelines of achievement alongside relative effort and cost. Figure 7 shows that scenario 1 peaks at a steady rate throughout the study period with a diversion rate of 38% in 2025, 60% in 2030, and 97% in 2035, whereas the baseline scenario gives 67.7%, 73.5%, and 82%, respectively. Recycling rate does not play an important role in this scenario since there was no alteration to it and its value is growing constantly at 2.2% on top of diversion rate as a result from the early years. Relative effort, on the other hand, presents a huge difference with baseline scenario, requiring twice the total effort of scenario 1. The highlight point is during the first 5 years, where baseline scenario skyrockets to 152% against 29%, which is about 5 times the difference. Relative cost starts off similar to relative effort but ends with a close rate of 385% against 400%. The results show that by not altering product recyclability, reuse rate, and sorting efficiency, zero plastic waste can be achieved by 2035 with 50% less effort that the government has to put in. To further support how statistically viable this scenario is, at the outperforming point in diversion rate, which is by 2032 at 78.5%, scenario 1 requires much less effort and cost compared to the baseline scenario.
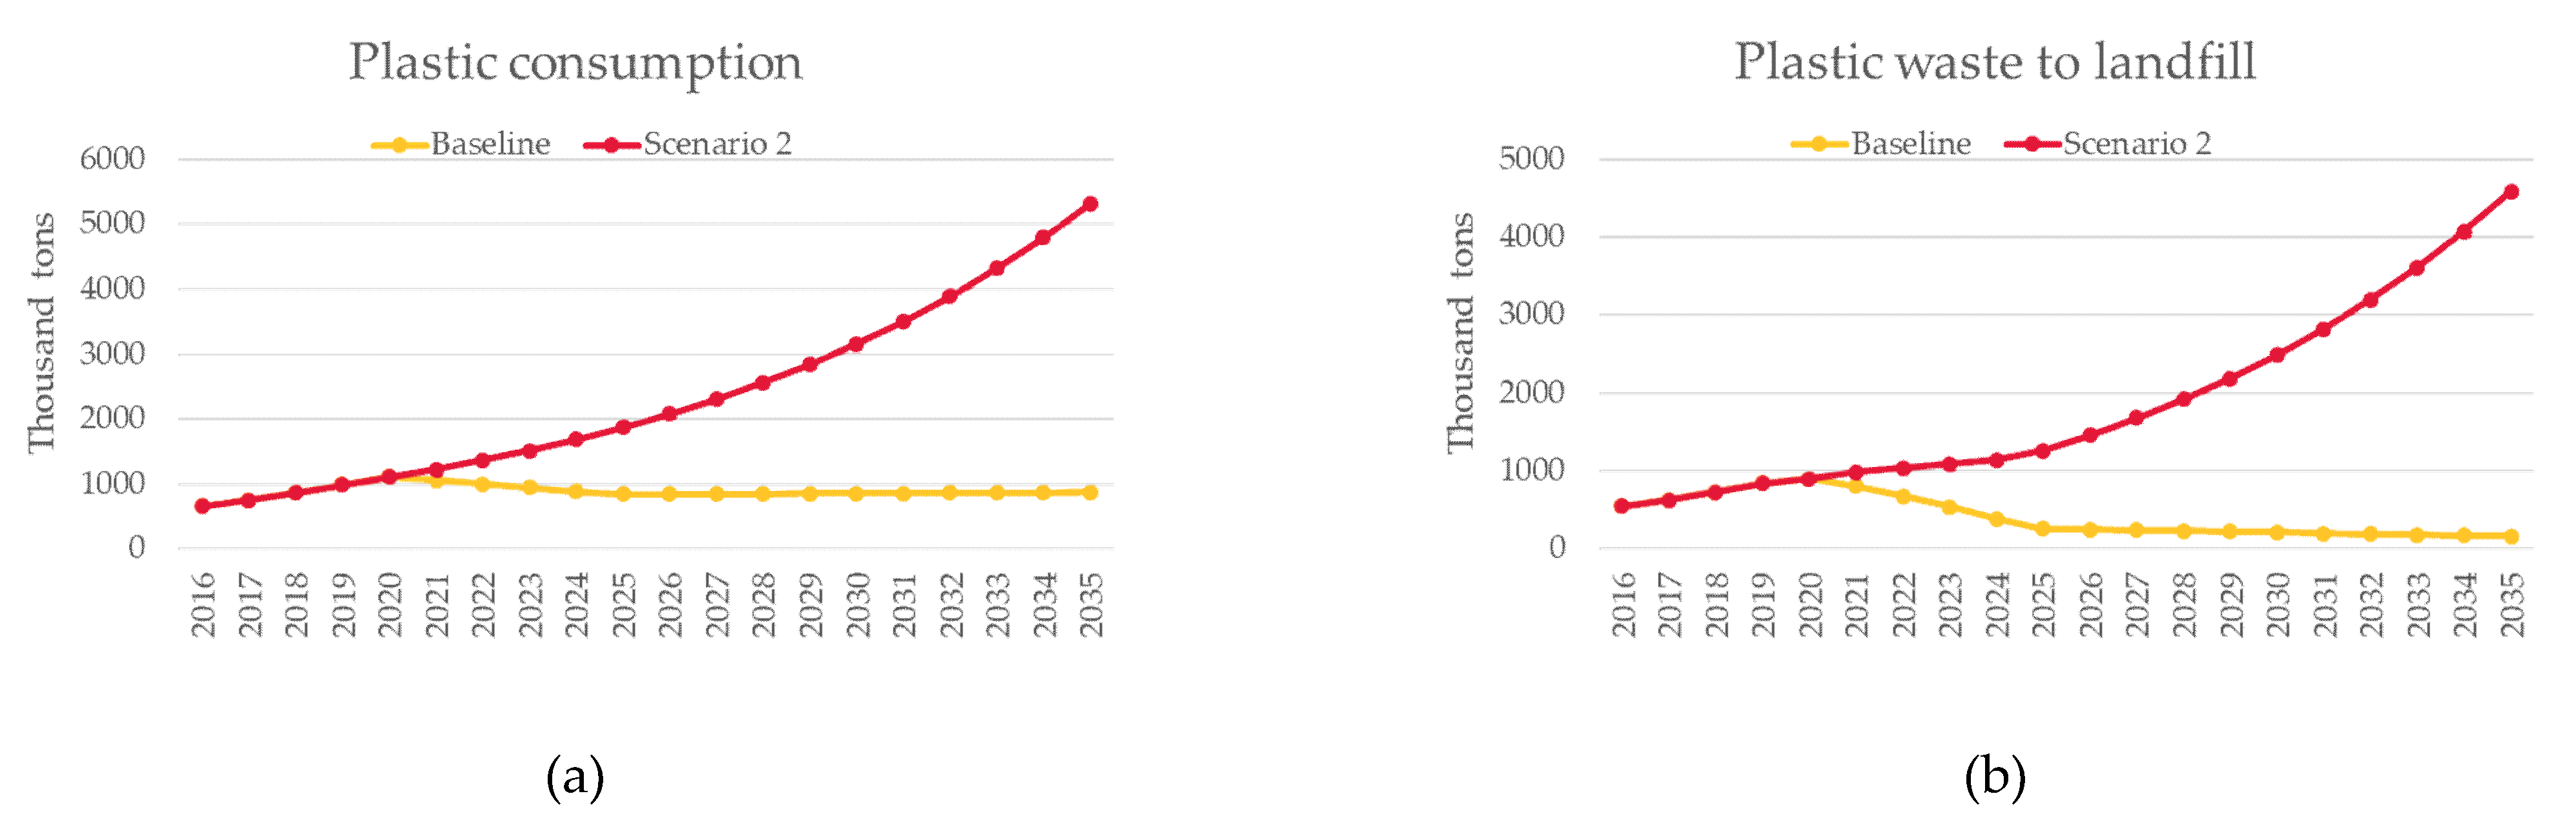
4.3. Scenario 2—Recycling Capability Analysis
The simulation results for scenario 2 are displayed in Figure 8. This scenario looks into the reverse effect of scenario 1, where sorting efficiency, reuse, and recyclability rates are altered, while leaving the other inputs stationary. It is obvious for the plastic consumption graphs to behave the way they do in this scenario since there is no encouragement to reduce plastic consumption. While the 15% reuse rate flattened the rise by a bit, the results from diversion and recycling rate are still present at a downturn. It is clear at this stage that this scenario is nowhere near achieving zero plastic waste nor feasible for any implementations. However, a proper analysis should be made to fully grasp its effects on the system. Plastic consumption is estimated to climb at an exponential rate to 1,953,000 t by 2025 if nothing is being done to prevent it. The rate in scenario 2 is at 1,870,000 t, which yields a reduction rate of 4.2%. On the same note, diversion rate shows a similar positive result during the first 5 years, where the rate increases from 18.7% to 32.4%, that is around 2.7% annually. All of these outcomes, however, came with a huge amount of effort and cost by 2025, it would take 219% effort from the government, that is 67% more than that of the baseline scenario, and 360% on expenses, or 43% more than the baseline scenario. While sorting efficiency, reuse, and recyclability are important factors for a recycling system, their effects are much less significant compared to consumption rate and recycling capacity.
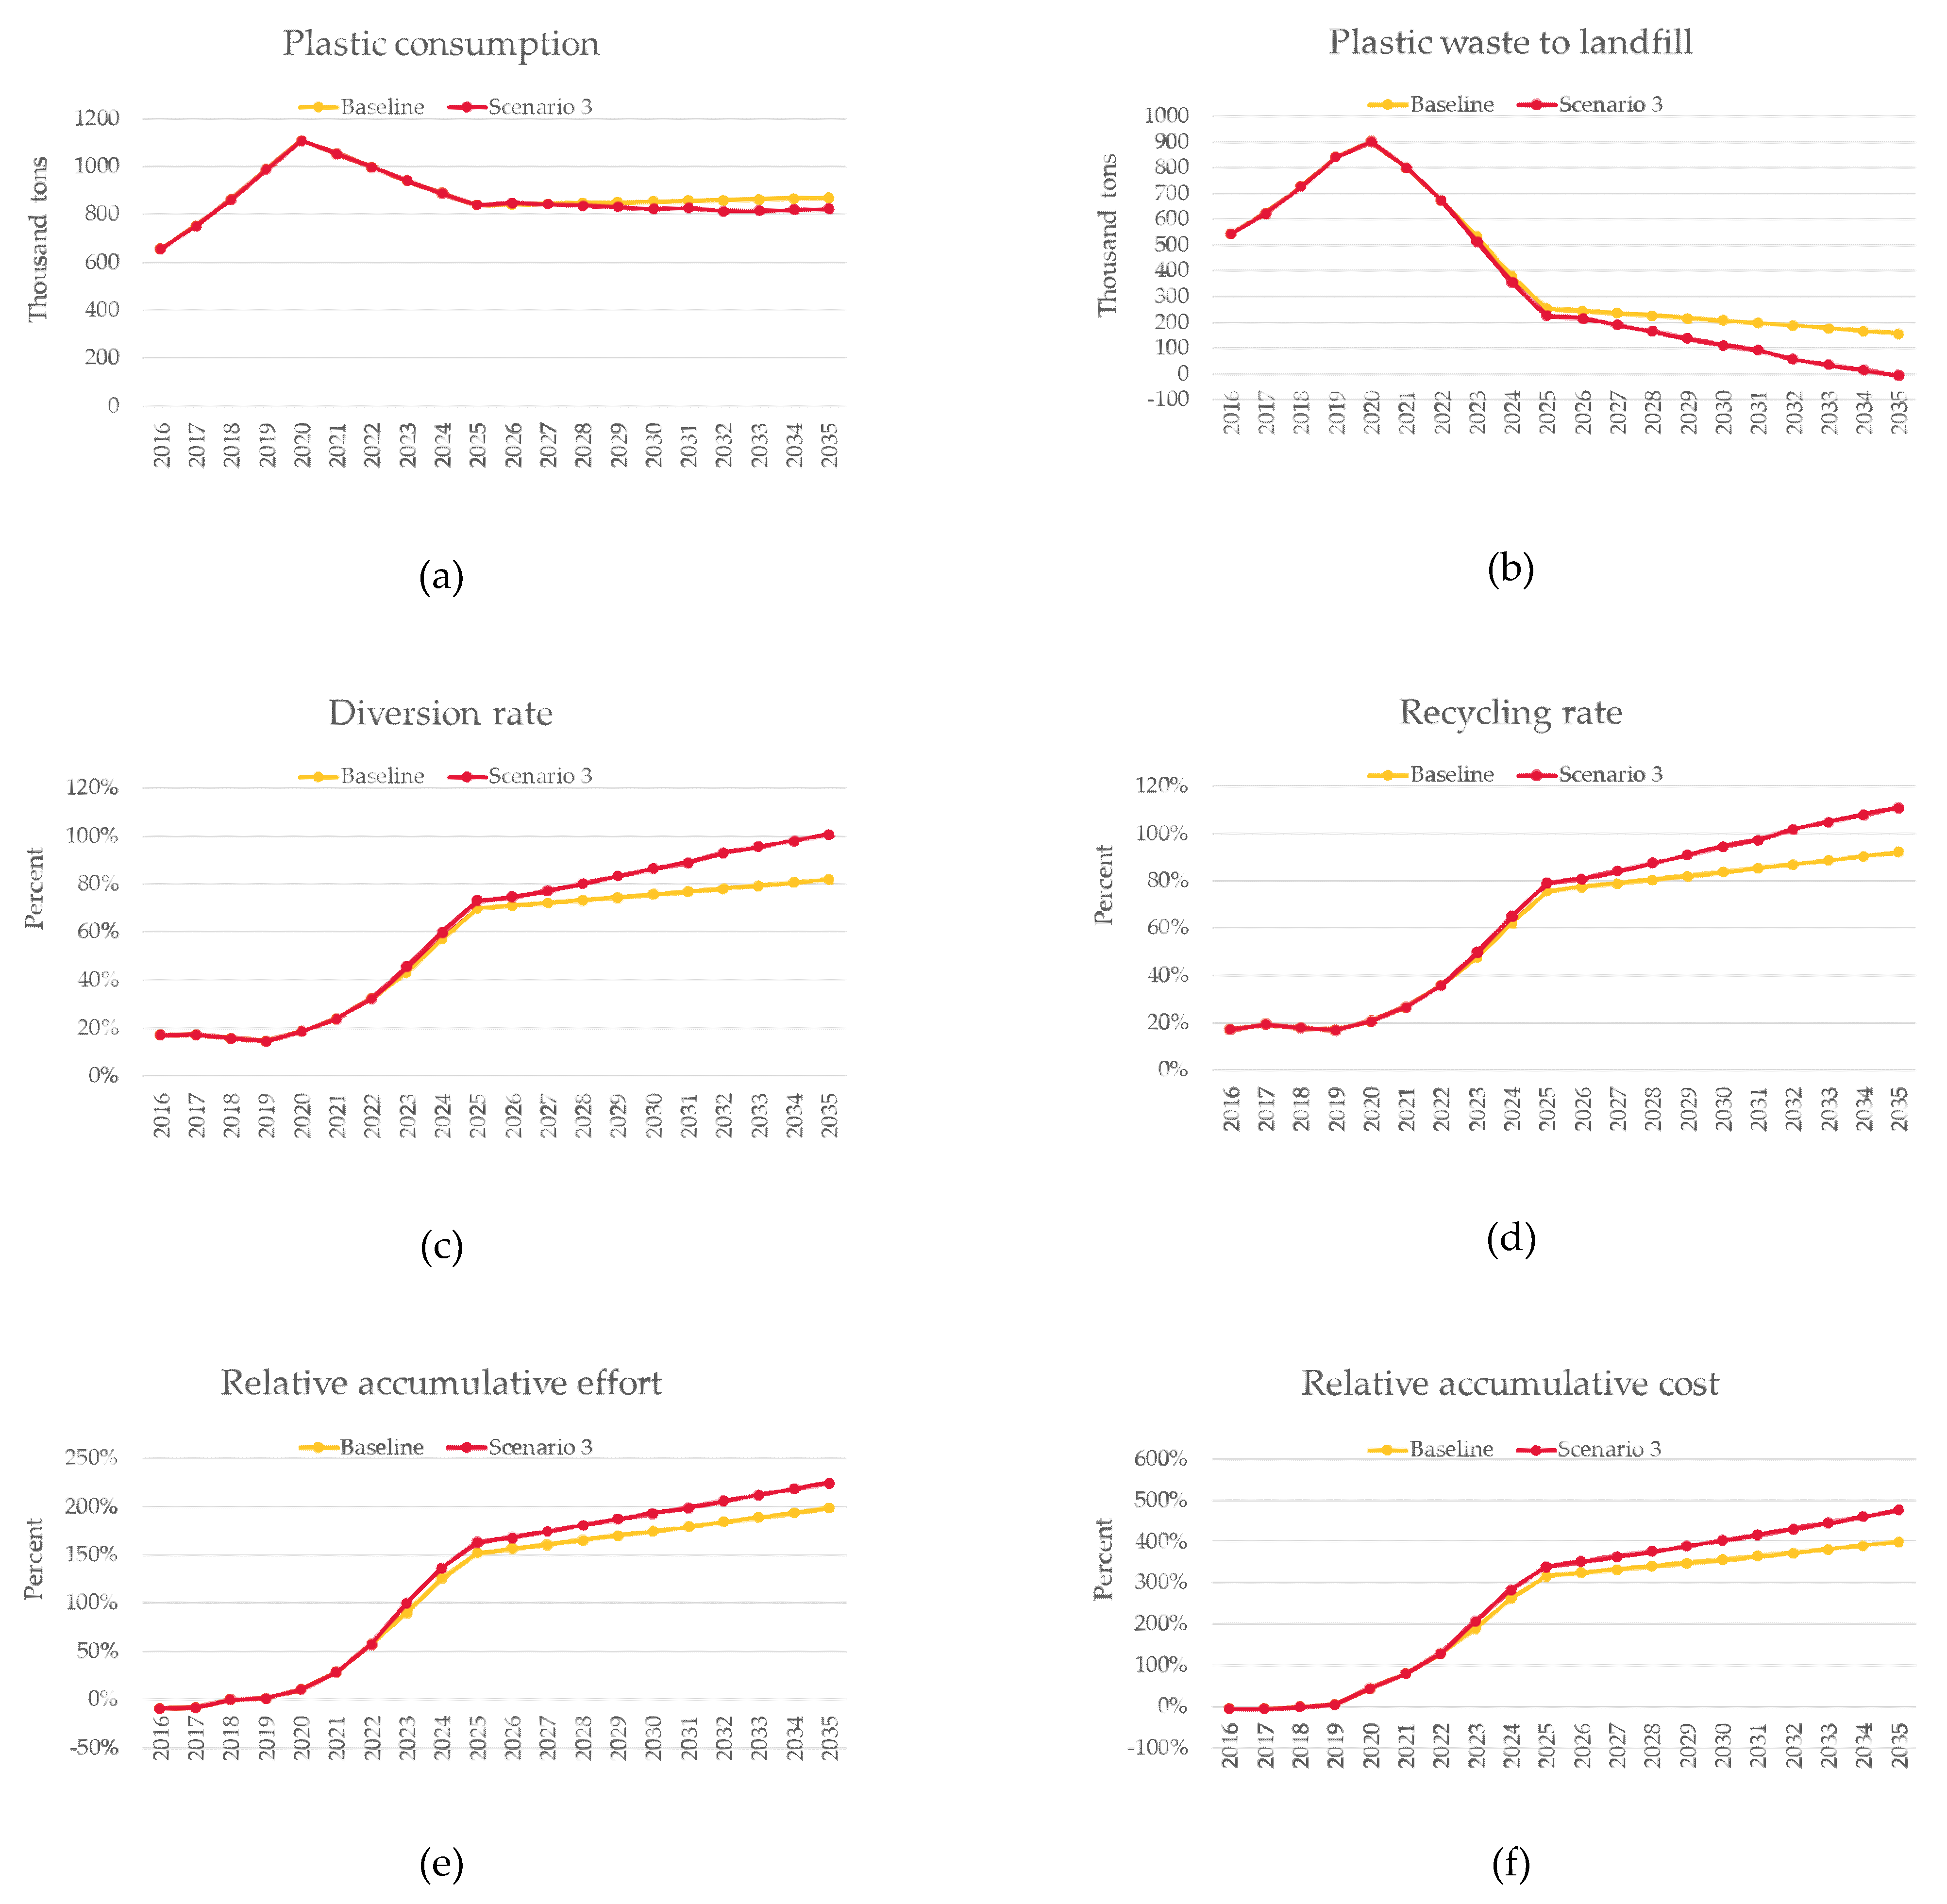
4.4. Scenario 3—Complementing the Baseline (Victoria’s Current Plan)
The simulation results of scenario 3 are illustrated in Figure 9. The main point of this scenario is to emphasize more on improving inputs that are significant in the long run and will increase the feasibility of zero plastic waste with consideration of cost and required effort. Improvements on consumption reduction and recycling capacity are essential, while improvements on product recyclability is secondary and no improvements are made towards reuse rate and sorting efficiency. The reasons behind these complementing values are based on what can be learned from scenarios 1 and 2. Consumption and recycling capacity have great importance in the recycling system. However, raising them excessively is only statistically viable and might impose further concerns, especially in the long run. Therefore, a more conservative approach is introduced, and promotion of product recyclability also seems appropriate to add up towards long-term consideration. As a result, a more feasible outcome is produced and can be considered suitable to achieve zero plastic waste by 2035. Plastic consumption is seen doing better at a 26% reduction by 2035 compared to 21% from the baseline scenario. With a rather slight increase after 2025, scenario 3 remains stable throughout the period. Plastic waste to landfill also drops accordingly and reaches zero tons by 2035.
Additionally, as we compare these two inputs, the change is only slight in plastic consumption, whereas in plastic waste to landfill, the change is quite substantial. This is because plastic waste to landfill is influenced by all the inputs, which in this case is under the combined effects from further reduced consumption, higher recycling efficiency, and capacity. Diversion and recycling rates from scenario 3 start to outperform those from the baseline scenario by 2025 and reach 100% by 2035. These results require 25% more effort and 76% more expenses to achieve, with most of it going towards increasing recycling capacity. Although 76% extra expense in this plan might give an impression of being costly, considering that this plan will run for a 15-year period, the difference is not as significant.
5. Discussion
Table 5 highlights the overall performance of the proposed scenarios and provides the basis of this discussion. The rate of plastic consumption drop in the baseline scenario deserves a good explanation since it could be misleading based on the information provided previously. Initially, this scenario estimates that by 2035, consumption rate should reduce by 20% based on the assumption described in step 1. Since the government’s plan is a 10-year policy, where most of the programs are to be rolled out in the first 5 years, whereas the program will operate at a normal rate in the remaining years, it is obvious to expect a much stronger commitment in the early period. For this reason, the model applies the full target of a 15% reduction in the first 5 years, followed by 10% in the rest of the years, assuming that the targeted rate of 10% is achieved by 2025. The result is expected to be around 15–25% by 2025 because this high rate is achieved to accommodate consumption growth due to increase in the population. With this assumption in mind, the baseline scenario and scenarios 1 and 3 show similar changing patterns when plastic consumption is altered. The drop in the first 5 years are common, however, the latter part of the graphs vary.
The important point to note from this output is how the latter part of the graphs behave. The flatter the graphs, the more desirable they are considering how difficult it is to reduce plastic consumption with a constant increase in population. Scenario 2 demonstrates a perfect example of the said difficulty when no commitment is made towards decreasing plastic consumption. The final outcomes of these scenarios alone, despite indicating how feasible and successful each scenario is, could not provide full understanding of the recycling system. The baseline scenario and scenario 1, for example, show feasible results of 82% and 97.2%, yet their outcomes behave differently throughout the period. As the analysis of scenario 1 has shown, the differences between the two lines in the first 5 years of comparison are due to the effects of product recyclability, reuse rate, and sorting efficiency. These inputs significantly improve efficiency of the recycling options; thus, it increases plastic waste recovery, decreases waste to landfill, and improves diversion rate. Their effects can be estimated by examining 2025’s outcomes of all scenarios, except scenario 3, since the values are complemented. The baseline scenario and scenario 1 have a difference in value of 29.7% for diversion rate and 32% for plastic waste to landfill rate. Scenario 2 shows an increase in consumption due to population growth by 68%, but only sends 40% more of plastic waste to landfill, which yields a difference of 28%. Consequently, it is reasonable to conclude that in general, product recyclability, reuse rate, and sorting efficiency can improve recycling systems by about 30%, in addition to the commitments to reduce waste.
Victoria’s current 10-year plan or the baseline scenario presents a viable result of 77.5% averaged diversion rate by 2030. Although it is 2.5% behind the target, it is still a good step towards achieving ZW, considering some cities around the world took more than 10 years to achieve the same result. This achievement, at the same time, comes with a caution that the prediction does not consider any disruptive events that could happen along the way. Therefore, while it is considered achievable, the real outcome might fall a bit below the target. The fact that the current plan does not achieve ZW or 100% diversion rate by 2035 (which this study aimed to assess), however, indicates that improvements to the plan is desirable. Further development of this plan is recommended if it were to achieve zero plastic waste yet should be done with careful consideration with regards to effort and cost required and its long-term effect.
Scenario 1, which is the analysis of consumption and capacity, leads Victoria’s recycling system to meet zero plastic waste by the targeted year without having to exert as much effort as in the current plan, while keeping over-time expenses steady. This scenario, despite its statistical viability, is less likely to happen due to concerns about its long-term effect, its practicality, and increases in behavioral resistance. Any ZW approach should consider long-term effects into consideration. For example, encouraging people to reuse their plastic waste can save energy from having to recycle it, can reduce emission, and can reduce the overall consumption. On the same note, approaches without improving recycling capability-based factors like sorting efficiency, reuse rate, and recyclability are inefficient and impractical. The fact that scenario 1 reduces consumption and increases recycling capacity will result in an overwhelming increase in recovered material waiting to go for reprocessing. Consequently, if those recovered materials were to go into local reprocessing, the recyclability rate should increase on its own to accommodate the changes. To further support the argument, the fact that recycling capacity increases without increasing sorting efficiency and recyclability means that a huge number of the same technologically inefficient recycling facilities are being built, which again leads to the long-term environmental concern. Lastly, reducing plastic consumption at a certain rate over a long period of time might attract increase in behavioral resistance from consumers. The key to minimizing this concern is to take steps such as proper educational campaigns, strategical studies, and council coordination, which are not applicable in this scenario. This argument explains the projected low effort, where much of it only caters towards drafting policies on plastic consumption. Nonetheless, this scenario provides importance to how significant plastic consumption and recycling capacity are to recycling systems. It serves as an important piece of the puzzle towards the understanding of their relationships.
A simple cost-benefit analysis would favor scenario 1 considerably since it requires less cost and effort to reach ZW when compared to the baseline scenario and would provide a similar effect towards boosting the economy through businesses and employment. However, this scenario lacks in practicality without taking much consideration of behavioral resistance and is only viable for short-term perspectives. This claim can be supported by the finding from Krystyna A. Stave of University of Nevada, Las Vegas, where the author suggests that increasing processing capacity and alternative disposal capacity could bring waste down to zero with lesser cost and effort; however, waste begins to increase eventually and further improvement to consumer diversion rate, waste in products, and consumption are needed to kept the waste at zero [43].
Scenario 2 is the least economically viable since it requires significantly higher cost and effort and provides minimal benefits to the economy. However, it enables further understanding of input relationships in addition to what scenario 1 offers, which, to summarize indicates that plastic consumption and recycling capacity have greater impacts on the system compared to the other inputs. Similarly, in this scenario, where no alternations to the two inputs were made, the outcome is far from acceptable, as it falls behind in achieving zero plastic waste. However, it can demonstrate how these inputs can go hand in hand in recycling systems. The first indication to this claim can be found in the plastic to landfill figure for scenario 1, where it goes down at a slower rate than the baseline scenario due to the effects of product recyclability, reuse rate, and sorting efficiency. The same figure in scenario 2, where these three inputs are at maximum, shows no progress at all. This leads to the conclusion that while reducing consumption and increasing recycling capacity helps with diverting waste from landfill, the inclusion of product recyclability, reuse rate, and sorting efficiency can amplify the effect by a significant rate. Correspondingly, without altering plastic consumption and recycling capacity in the first place, product recyclability, reuse rate, and sorting efficiency are of little to no use to the recycling system. This point also adds up with the concerns of long-term effect, practicality, and behavioral resistance mentioned in scenario 1 above.
Scenario 3 compliments the baseline scenario in a way that agrees with what was discussed in the previous scenarios. By this stage, it is comprehensible to categorize the inputs into two groups, namely major inputs (plastic consumption and recycling capacity) and minor inputs (product recyclability, reuse/end-of-life proxy rate, and sorting efficiency). The changes made in scenario 3 on the major inputs are kept minimal and are enough to produce the desirable outcome, while having a priority of minimizing the chance of stirring up behavioral resistance as well as impacting the environment. Changes to the minor inputs are made with consideration of the source of plastic products rather than demanding more commitment from consumers, which again would have further concerns regarding behavioral resistance. Therefore, there are no additional changes made towards reuse rate and sorting efficiency and an increase of +1 is added to product recyclability. The difference in effort required from this approach is only 25% when compared to the baseline scenario. With the viable result and commitment to other considerations, this scenario is demonstrated to be worthwhile and could potentially lead Victoria’s recycling system to reach the ZW target by 2035.
6. Conclusions
The objective of this study was to access the feasibility of Victoria’s current waste management plan, which aims to divert about 80% of waste from landfills by 2030 and achieve zero waste (ZW) by 2035 through a simulation model. The model was run on 4 scenarios, including a baseline scenario of Victoria’s current 10-year policy and action plan for waste and recycling. The other scenarios were developed based on changes to the baseline scenario. The model outputs show that Victoria’s current plan (baseline scenario) to achieve 80% diversion rate by 2030 is possible. However, the state may not reach 100% diversion rate by 2035, which means zero plastic waste is less likely to happen. An improvement to the plan was proposed by introducing slight changes to the input factors (in scenario 3) to ensure that zero plastic waste is met by 2035. The input factors include product recyclability, packaging polymer consumption, non-packaging polymer consumption, processing facilities’ capacity, recycling options efficiency, reuse/end-of-life proxy rate, and sorting efficiency
Results from scenarios 1 and 2 have significance towards the understanding of how product recyclability, reuse, and sorting efficiency can impact the recycling system. The baseline scenario and scenario 3 reflect the aims and objectives of this study, namely assessing the feasibility of Victoria’s current plan of diverting 80% waste from landfill by 2030 and also if it could achieve ZW by 2035.
One of the outcomes of this study is to demonstrate how each input factor plays an important role in the recycling system. For example, some input factors like product recyclability, reuse/ end-of-life proxy rate, and sorting efficiency in scenario 2 might give an impression of not providing usefulness or that it might scale-up the expenses when used on their own. But, when these input factors are used in conjunction with other factors, as done in scenario 3, it leads to an increase in the efficiency.
Finally, the findings of this study conclude that Victoria’s current plans are feasible. This study has also presented opportunities for improvement, especially towards achieving zero plastic waste by 2035. Thus, the model developed in this study provides a useful prediction tool, which enables the possibility of detailed analysis of input and output factors to facilitate achieving ZW. Development of further scenarios (in addition to those presented in this study) can be done by using different values of the input factors to find the best possible outcomes in terms of achieving ZW.
While the developed simulation model can be a reliable tool to support the predicted targets, the progress is expected to meet challenges and unpredicted events that could cause disruption, which should be anticipated and embraced with all necessary precautions. Thus, by having a strong commitment to reducing plastic waste, a circular economy and a better and more reliable recycling system in Victoria can be achieved.
Supplementary Materials
The following are available online at https://www.mdpi.com/2313-4321/6/1/9/s1, Table S1: Terminology used in the configuration of inputs and outputs, Table S2: The configuration of inputs used in the analysis, Table S3: The configuration of outputs used in the analysis.
Author Contributions
Conceptualization, S.L.; methodology, S.L.; formal analysis, S.L.; investigation, S.L.; writing—original draft preparation, S.L.; writing—review and editing, A.W.M.N., S.L., N.M. and C.N.N.; supervision, A.W.M.N. and N.M. All authors have read and agreed to the published version of the manuscript.
Funding
This research received no external funding.
Data Availability Statement
Not Applicable.
Acknowledgments
The authors would like to gratefully acknowledge The State of Victoria Department of Environment, Land, Water and Planning for developing the policy—Recycling Victoria: A new economy. The authors also thank Envisage Works for compiling an extensive report presenting the Australian plastic recycling survey and Krystyna Stave of the University of Nevada, Las Vegas, for providing a conceptual approach to zero waste simulation modelling.
Conflicts of Interest
The authors declare no conflict of interest.
References
- Palmer, P. Getting to Zero Waste; Purple Sky Press: Sebastopol, CA, USA, 2004. [Google Scholar]
- Zaman, A.U. A comprehensive review of the development of zero waste management: Lessons learned and guidelines. J. Clean. Prod. 2015, 91, 12–25. [Google Scholar] [CrossRef]
- Wen, L.; Lin, C.-H.; Lee, S.-C. Review of recycling performance indicators: A study on collection rate in Taiwan. Waste Manag. 2009, 29, 2248–2256. [Google Scholar] [CrossRef] [PubMed]
- Zaman, A.U.; Lehmann, S. Challenges and opportunities in transforming a city into a “zero waste city”. Challenges 2011, 2, 73–93. [Google Scholar] [CrossRef] [Green Version]
- O’Farrell, K. 2017-18 Australian Plastics Recycling Survey—National Report; Department of the Environment and Energy, Victoria State Government: Melbourne, VIC, Australia, 2019.
- Australian Associated Press. Australia will ban export of recyclable waste ’as soon as practicable’, PM vows. The Guardian, 9 August 2019. [Google Scholar]
- Butler, B. 180,000 tonnes of recycling heading to landfill as Victoria’s SKM teeters on the brink. The Guardian, 26 July 2019. [Google Scholar]
- Sustainability Victoria. Victorian Recycling Industry Annual Report 2017–18; Victoria State Government: Melbourne, VIC, Australia, 2019.
- Zhou, N. Malaysia to send up to 100 tonnes of plastic waste back to Australia. The Guardian, 29 May 2019. [Google Scholar]
- Huang, Q.; Chen, G.; Wang, Y.; Chen, S.; Xu, L.; Wang, R. Modelling the global impact of China’s ban on plastic waste imports. Resour. Conserv. Recycl. 2020, 154, 104607. [Google Scholar] [CrossRef]
- Victoria State Government. Transforming Recycling in Victoria. Available online: https://www.vic.gov.au/transforming-recycling-victoria (accessed on 15 August 2020).
- Brooks, A.L.; Wang, S.; Jambeck, J.R. The Chinese import ban and its impact on global plastic waste trade. Sci. Adv. 2018, 4, eaat0131. [Google Scholar] [CrossRef] [PubMed] [Green Version]
- Geyer, R.; Jambeck, J.R.; Law, K.L. Production, use, and fate of all plastics ever made. Sci. Adv. 2017, 3, e1700782. [Google Scholar] [CrossRef] [PubMed] [Green Version]
- Jambeck, J.R.; Geyer, R.; Wilcox, C.; Siegler, T.R.; Perryman, M.; Andrady, A.; Narayan, R.; Law, K.L. Plastic waste inputs from land into the ocean. Science 2015, 347, 768–771. [Google Scholar] [CrossRef] [PubMed]
- Velis, C. Global recycling markets-plastic waste: A story for one player–China. Int. Solid Waste Assoc. 2014, 1–66. [Google Scholar]
- Wang, C.; Zhao, L.; Lim, M.K.; Chen, W.-Q.; Sutherland, J. Structure of the global plastic waste trade network and the impact of China’s import ban. Resour. Conserv. Recycl. 2020, 153, 104591. [Google Scholar] [CrossRef]
- Wang, W.; Themelis, N.J.; Sun, K.; Bourtsalas, A.C.; Huang, Q.-X.; Zhang, Y.; Wu, Z. Current influence of China’s ban on plastic waste imports. Waste Dispos. Sustain. Energy 2019, 1, 67–78. [Google Scholar] [CrossRef] [Green Version]
- Allan, P. Recycling Market. Development Review; Department of the Environment and Energy, Australia State Government: Melbourne, VIC, Australia, 2019.
- Pickin, J.; Randell, P.; Trinh, J.; Grant, B. National Waste Report; Department of the Environment and Energy: Melbourne, VIC, Australia, 2018.
- MacIntosh, A.; Simpson, A.; Neeman, T.; Dickson, K. Plastic bag bans: Lessons from the Australian capital territory. Resour. Conserv. Recycl. 2020, 154, 104638. [Google Scholar] [CrossRef]
- Connett, P. The Zero Waste Solution: Untrashing the Planet. One Community at A Time; Chelsea Green Publishing: Hartford, VT, USA, 2013. [Google Scholar]
- Victoria State Government. Four-Bin Waste and Recycling System. Available online: https://www.vic.gov.au/four-bin-waste-and-recycling-system (accessed on 3 August 2020).
- Victoria State Government. Container Deposit Scheme. Available online: https://www.vic.gov.au/container-deposit-scheme (accessed on 2 August 2020).
- Mills, T. Victoria will get cash-for-cans, container deposit scheme. The Age, 2 February 2020. [Google Scholar]
- Victoria State Government. Transforming How Victoria Recycles Plastic Waste. Available online: https://www.premier.vic.gov.au/transforming-how-victoria-recycles-plastic-waste/ (accessed on 3 August 2020).
- Parras, P. Small town big steps: The story of Kamikatsu, Japan. Glob. Alliance Inciner. Altern. (GAIA) 2019. [Google Scholar]
- Wray, S. “Small things add up”: The Japanese town leading the zero-waste charge. SmartCitiesWorld, 9 January 2020. [Google Scholar]
- Beynart, B. Governments Struggle with Zero Waste Planning, Policy, and Implemention. Master’s Thesis, Johns Hopkins University, Baltimore, MD, USA, December 2019. [Google Scholar]
- Zaman, A.; Ahsan, T. Zero-waste: Reconsidering Waste Management for the Future; Routledge: New York, NY, USA, 2019. [Google Scholar]
- Sherburne, S. Let’s Get Sorted: The Path to Zero Waste at Pomona College. Bachelor’s Thesis, Pomona College, Claremont, CA, USA, 2019. [Google Scholar]
- Milian, M.; Watanabe, T. Achieving a Sustainable Solid Waste Management in Spain: The case of Morella Town. Master’s Thesis, Kochi University of Technology, Kami, Japan, 2009. [Google Scholar]
- Silva, A.; Rosano, M.; Stocker, L.; Gorissen, L. From waste to sustainable materials management: Three case studies of the transition journey. Waste Manag. 2017, 61, 547–557. [Google Scholar] [CrossRef] [PubMed]
- Sangiacomo, M.J. Achieving zero waste in san francisco. J. Int. Aff. 2019, 73, 285–290. [Google Scholar]
- Brigham, K. How San Francisco sends less trash to the landfill than any other major US city. CNBC, 14 July 2018. [Google Scholar]
- Trickey, E. San Francisco’s quest to make landfills obsolete. POLITICO, 21 November 2019. [Google Scholar]
- Krausz, R.; Hughey, K.F.; Montgomery, R.L. Zero waste to landfill: An unacknowledged supermegaproject. Linc. Plan. Rev. 2013, 5. [Google Scholar]
- Lee, E. Mayor Lee Announces San Francisco Reaches 80 Percent Landfill Waste Viversion, Leads All Cities in North America; Office of the Mayor, City & Country of San Francisco: San Francisco, CA, USA, 2012.
- Song, Q.; Li, J.; Zeng, X. Minimizing the increasing solid waste through zero waste strategy. J. Clean. Prod. 2015, 104, 199–210. [Google Scholar] [CrossRef]
- Allen, C.; Gokaldas, V.; Larracas, A.; Minot, L.A.; Morin, M.; Tangri, N.; Tyler, B.; Walker, B. On the Road to Zero Waste: Successes and Lessons from Around the World; Global Anti-Incinerator Alliance (GAIA): Quezon City, Philippines, 2012; pp. 1–88. [Google Scholar]
- Xevgenos, D.; Papadaskalopoulou, C.; Panaretou, V.; Moustakas, K.; Malamis, D. Success stories for recycling of MSW at municipal level: A review. Waste Biomass Valorization 2015, 6, 657–684. [Google Scholar] [CrossRef]
- Zondi, H. Sustainable solid waste management systems in suburban locations. In Proceedings of the International Annual Conference of the American Society for Engineering Management, Huntsville, AL, USA, 18–21 October 2017; pp. 1–9. [Google Scholar]
- Bueno, G.; Latasa, I.; Lozano, P. Comparative LCA of two approaches with different emphasis on energy or material recovery for a municipal solid waste management system in Gipuzkoa. Renew. Sustain. Energy Rev. 2015, 51, 449–459. [Google Scholar] [CrossRef]
- Stave, K.A. Zero Waste by 2030: A system dynamics simulation tool for stakeholder involvement in Los Angeles’ solid waste planning initiative. In Proceedings of the 26th International Conference of the System Dynamics Society, Athens, Greece, 20–24 July 2008; pp. 20–24. [Google Scholar]
- Victoria State Government. Recycling Victoria: A New Economy; Department of the Environment, Land, Water and Planning, Victoria State Government: Melbourne, VIC, Australia, 2020.
- Population Australia. Population of Victoria 2020. Available online: http://www.population.net.au/population-of-victoria/ (accessed on 18 July 2020).
- American Marketing Association. People recycle more when they know what recyclable waste becomes. ScienceDaily, 16 May 2019.
Figure 1.
Global accumulative plastic waste that is generated, disposed to landfills, incinerated, and recycled (solid lines indicate the data from 1950–2015, whereas the dashed lines indicate the projected values) [13].
Figure 1.
Global accumulative plastic waste that is generated, disposed to landfills, incinerated, and recycled (solid lines indicate the data from 1950–2015, whereas the dashed lines indicate the projected values) [13].

Figure 2.
Australian plastics (in tons) recovered for reprocessing locally (blue columns) and globally (red columns) taken annually from 2000 to 2008 and on a financial year basis (July–June) from 2009 to 2018 [18].
Figure 2.
Australian plastics (in tons) recovered for reprocessing locally (blue columns) and globally (red columns) taken annually from 2000 to 2008 and on a financial year basis (July–June) from 2009 to 2018 [18].

Figure 3.
The movements of recycled plastics (in tons) between states and from states to overseas in 2017–2018 (ACT: Australian Capital Territory, NSW: New South Wales, NT: Northern Territory, QLD: Queensland, SA: South Australia, TAS: Tasmania, VIC: Victoria, and WA: Western Australia) [18].
Figure 3.
The movements of recycled plastics (in tons) between states and from states to overseas in 2017–2018 (ACT: Australian Capital Territory, NSW: New South Wales, NT: Northern Territory, QLD: Queensland, SA: South Australia, TAS: Tasmania, VIC: Victoria, and WA: Western Australia) [18].

Figure 4.
Kamikatsu’s waste generation and recycling rate from 1999 to 2016 (columns show waste production in tonnes, red line illustrates recycling rate in percent) [26].
Figure 4.
Kamikatsu’s waste generation and recycling rate from 1999 to 2016 (columns show waste production in tonnes, red line illustrates recycling rate in percent) [26].

Figure 5.
Overall research methodology.

Figure 6.
Baseline scenario outputs (the 6 outputs: plastic consumption, plastic waste to landfill, diversion rate, recycling rate, relative accumulative effort, and relative accumulative cost in graphs (a–f), respectively).
Figure 6.
Baseline scenario outputs (the 6 outputs: plastic consumption, plastic waste to landfill, diversion rate, recycling rate, relative accumulative effort, and relative accumulative cost in graphs (a–f), respectively).

Figure 7.
Comparison between baseline scenario and scenario 1 (the 6 outputs: plastic consumption, plastic waste to landfill, di-version rate, recycling rate, relative accumulative effort, and relative accumulative cost in graphs (a–f), respectively).
Figure 7.
Comparison between baseline scenario and scenario 1 (the 6 outputs: plastic consumption, plastic waste to landfill, di-version rate, recycling rate, relative accumulative effort, and relative accumulative cost in graphs (a–f), respectively).


Figure 8.
Comparison between baseline scenario and scenario 2 (the 6 outputs: plastic consumption, plastic waste to landfill, diversion rate, recycling rate, relative accumulative effort, and relative accumulative cost in graphs (a–f), respectively).
Figure 8.
Comparison between baseline scenario and scenario 2 (the 6 outputs: plastic consumption, plastic waste to landfill, diversion rate, recycling rate, relative accumulative effort, and relative accumulative cost in graphs (a–f), respectively).


Figure 9.
Comparison between baseline scenario and scenario 3 (the 6 outputs: plastic consumption, plastic waste to landfill, diversion rate, recycling rate, relative accumulative effort, and relative accumulative cost in graphs (a–f), respectively)
Figure 9.
Comparison between baseline scenario and scenario 3 (the 6 outputs: plastic consumption, plastic waste to landfill, diversion rate, recycling rate, relative accumulative effort, and relative accumulative cost in graphs (a–f), respectively)


Table 1.
Cost comparison of container and door-to-door collection methods (2008–2010) in Usurbil [39].
Table 1.
Cost comparison of container and door-to-door collection methods (2008–2010) in Usurbil [39].
| Containers, 2008 | Containers and Door-to-Door Collection (as of March), 2009 | Door-to-Door, 2010 | |
|---|---|---|---|
| Expenses (€) | 493,444 | 565,961 | 670,015 |
| Income (€) | 135,447 | 202,669 | 452,269 |
| Net cost (€) | 357,997 | 363,292 | 217,746 |
| Self-finance rate | 27.40% | 35.80% | 67.50% |
Table 2.
Values of input factors used in the four scenarios of the simulation model.
| Input Factors | Victoria’s Current Plan * (Baseline Scenario) | Consumption and Capacity Analysis (Scenario 1) | Recycling Capability Analysis (Scenario 2) | Complementing the Baseline (Scenario 3) |
|---|---|---|---|---|
| Product recyclability | ×3 | NA | ×5 | ×4 |
| Packaging polymer consumption | −20% | −30% | NA | −25% |
| Non-packaging polymer consumption | −20% | −30% | NA | −25% |
| Processing facilities capacity | ×3 | ×3.6 | NA | ×4 |
| Recycling options efficiency | ||||
| •Mechanical | +10% and 0% | +10% and 5% | NA | +10% and 2% |
| •Biological | +2.5% and 0% | +2.5% and 0% | NA | +2.5% and 0% |
| •Feedstock (chemical) | +2.5% and 0% | +2.5% and 0% | NA | +2.5% and 0% |
| •Energy | +10% and 0% | +10% and 5% | NA | +10% and 2% |
| Reuse/end-of-life proxy rate | 10% | NA | 15% | 10% |
| Sorting efficiency | ×3 | NA | ×6 | ×3 |
* The values are adopted from Reference [44].
Table 3.
Established factor relationships.
| Inputs | Product Recyclability | Reuse/End-of-Life Proxy Rate | Sorting Efficiency | Change in Population and Lifestyle | Required Effort | Behavioral Resistance |
|---|---|---|---|---|---|---|
| Product Recyclability | 10% | 0.9 | ||||
| Packaging consumption | 0.9 | 3% | 20% | 1.03 | ||
| Non-packaging consumption | 0.9 | 3% | 20% | 1.03 | ||
| Processing capacity | 10% | |||||
| Recycling options efficiency | 11% | 25% | 10% | |||
| Reuse/end-of-life proxy rate | 15% | 0.85 | ||||
| Sorting efficiency | 15% | 15% | 0.85 |
Table 4.
Configuration of inputs (product recyclability) and outputs (plastic consumption total) for model development.
Table 4.
Configuration of inputs (product recyclability) and outputs (plastic consumption total) for model development.
| Terminology | Description |
|---|---|
| X | Existing values during the baseline year (2018) |
| Y | Planned/projected values of any selected years |
| Y’ | Configured planned/projected values for the selected year (after taking factor relationships into account) |
| F | Factor values |
| Inputs | Formulae |
| Product recyclability |
The government plans to increase product recyclability in 2025 to (Y) amount and is more than its value (X) in 2018 (Y > X). However, the increased rate of product recyclability will be affected by the drag from behavioral resistance factor (F) and will ultimately yield a lower value (Y’) compared to what was originally planned. A similar concept applies to the rest of the inputs and details can be found in Tables S1 and S2 in the Supplementary Material |
| Outputs | Formulae |
| Plastic Consumption (Total) |
|
Table 5.
Summary of outputs with the overall performance of the proposed scenarios.
| Outputs | Baseline | Scenario 1 | Scenario 2 | Scenario 3 |
|---|---|---|---|---|
| Plastic consumption | (−22.8%)|(−22.1%)|(−21.2%) | (−21%)|(−25%)|(−31%) | (+68%)|(185%)|(+380%) | (−23.7%)|(−25%)|(−26%) |
| Plastic waste to landfill | (−72%)|(−76.7%)|(−82.6%) | (−40%)|(−64%)|(−97%) | (+40%)|(+176%)|(+410%) | (−75%)|(−87%)|(−100%) |
| Diversion rate | 67.7%|73.5%|82% | 38%|60.1%|97.2% | 32.4%|21.2%|14% | 73%|86.5%|100% |
| Recycling rate | 92% | 99% | 30% | 100% |
| Relative effort | 200% | 94% | 296% | 225% |
| Relative cost | 400% | 385% | 443% | 476% |
Note: The consecutive values of plastic consumption, plastic waste to landfill, and diversion rate reflect their milestone periods of 2025, 2030, and 2035.
Publisher’s Note: MDPI stays neutral with regard to jurisdictional claims in published maps and institutional affiliations. |
© 2021 by the authors. Licensee MDPI, Basel, Switzerland. This article is an open access article distributed under the terms and conditions of the Creative Commons Attribution (CC BY) license (http://creativecommons.org/licenses/by/4.0/).
Share and Cite
MDPI and ACS Style
Ng, A.W.M.; Ly, S.; Muttil, N.; Nguyen, C.N. Issues and Challenges Confronting the Achievement of Zero Plastic Waste in Victoria, Australia. Recycling 2021, 6, 9. https://doi.org/10.3390/recycling6010009
AMA Style
Ng AWM, Ly S, Muttil N, Nguyen CN. Issues and Challenges Confronting the Achievement of Zero Plastic Waste in Victoria, Australia. Recycling. 2021; 6(1):9. https://doi.org/10.3390/recycling6010009
Chicago/Turabian StyleNg, Anne W. M., Srenghang Ly, Nitin Muttil, and Cuong Ngoc Nguyen. 2021. "Issues and Challenges Confronting the Achievement of Zero Plastic Waste in Victoria, Australia" Recycling 6, no. 1: 9. https://doi.org/10.3390/recycling6010009