
Chemical Conversion of Fischer–Tropsch Waxes and Plastic Waste Pyrolysis Condensate to Lubricating Oil and Potential Steam Cracker Feedstocks

 , , and
Abstract
:1. Introduction
2. Theoretical Background
2.1. Lubricant Production from Waxes
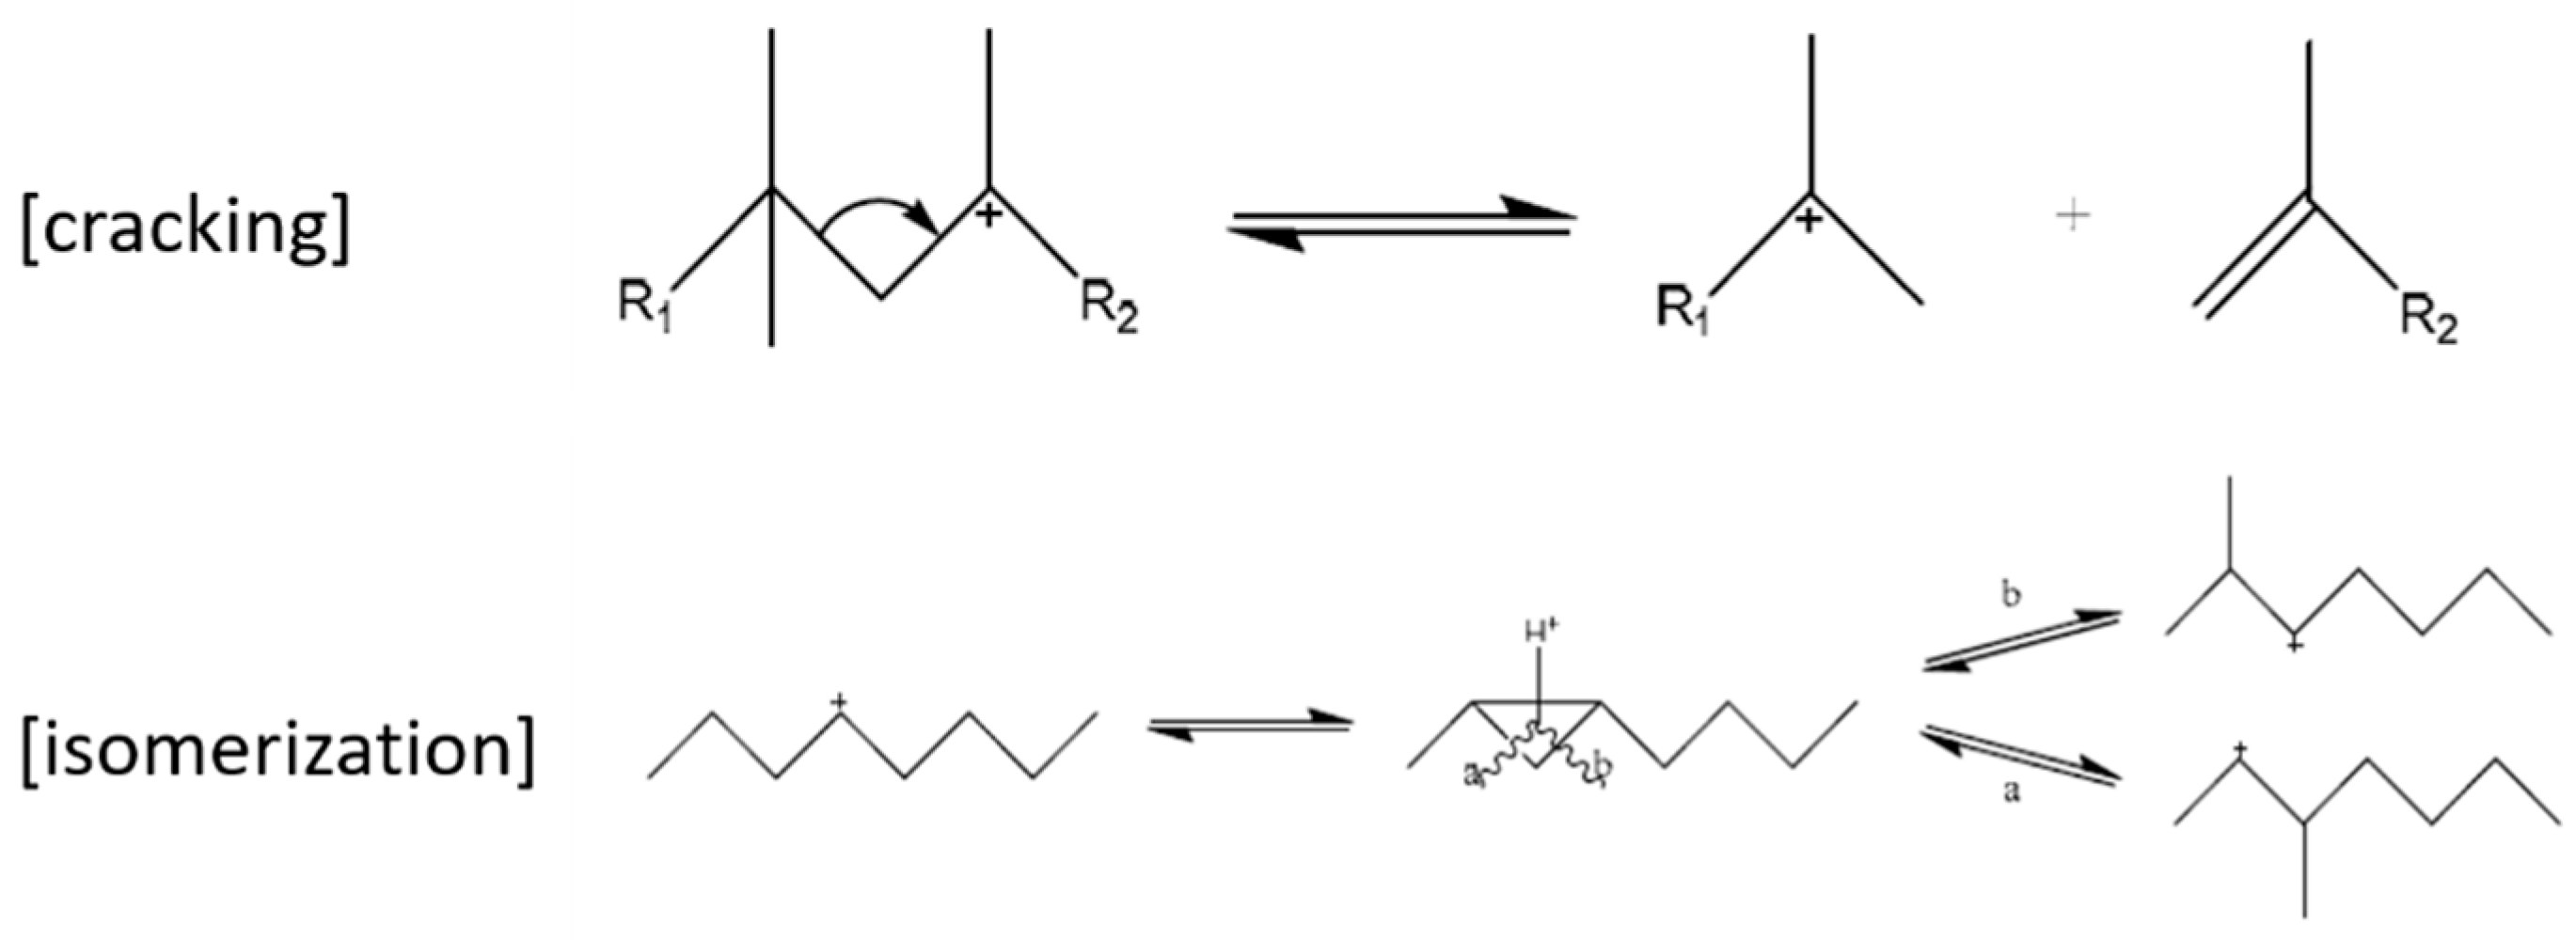
2.2. Hydroprocessing
2.3. Wax Production
3. Materials and Methods
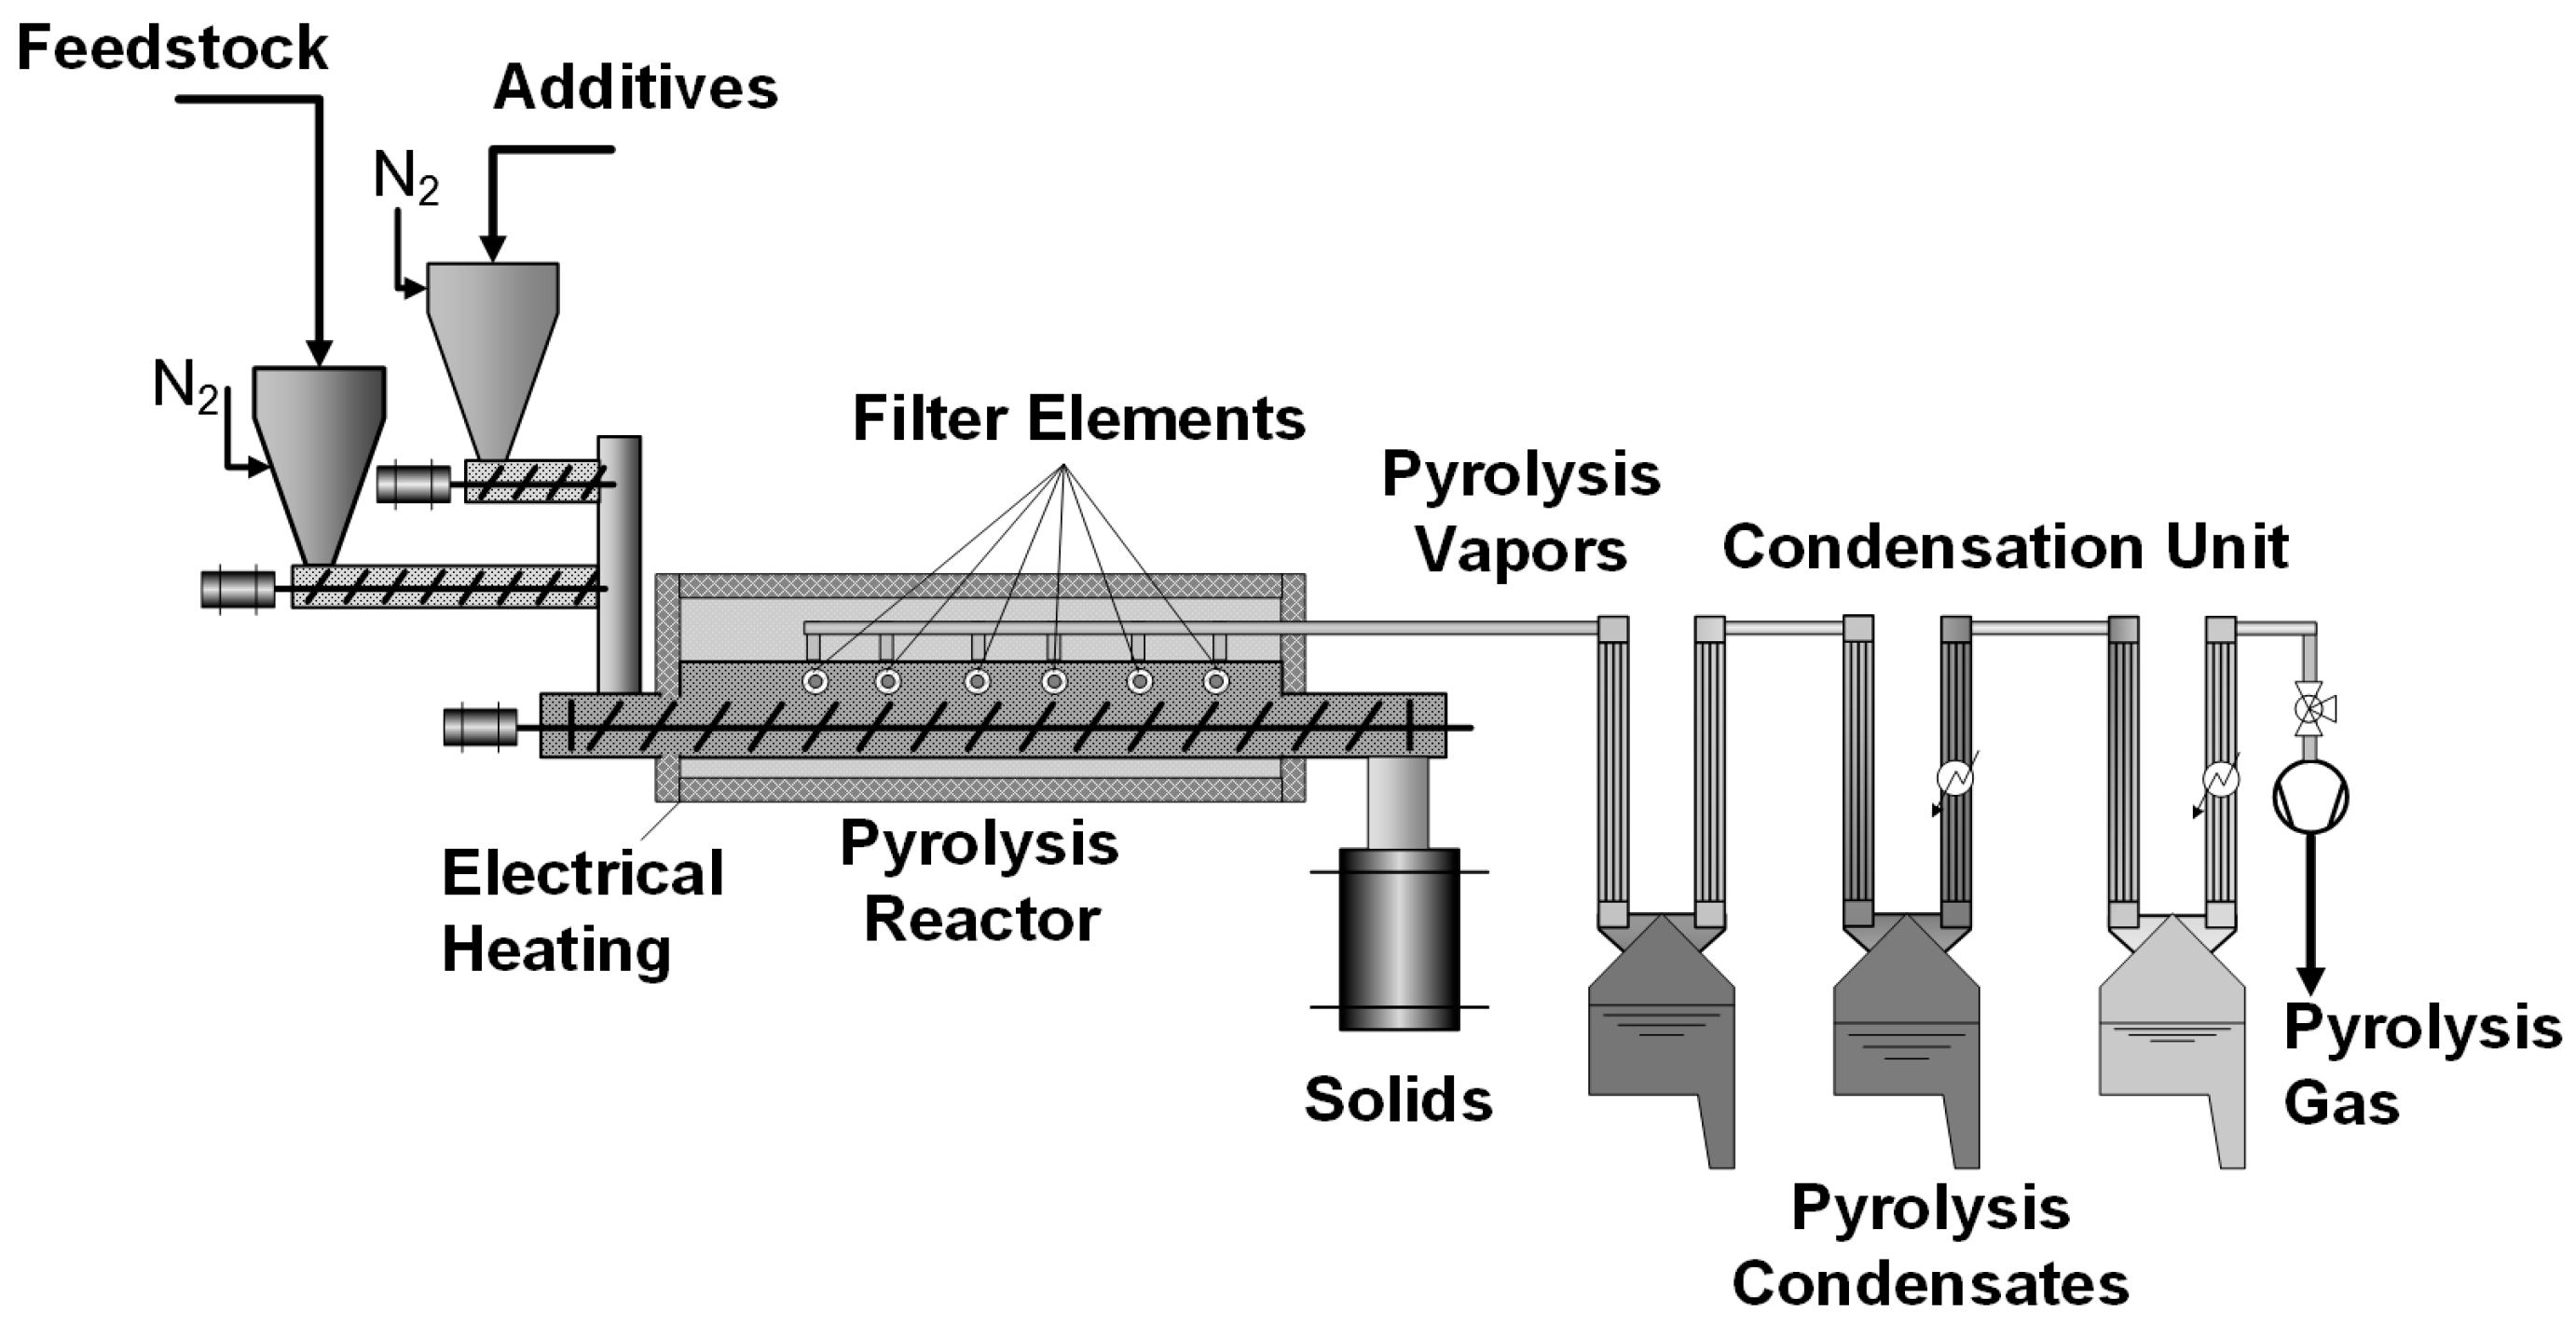
3.1. Pyrolysis Reactor
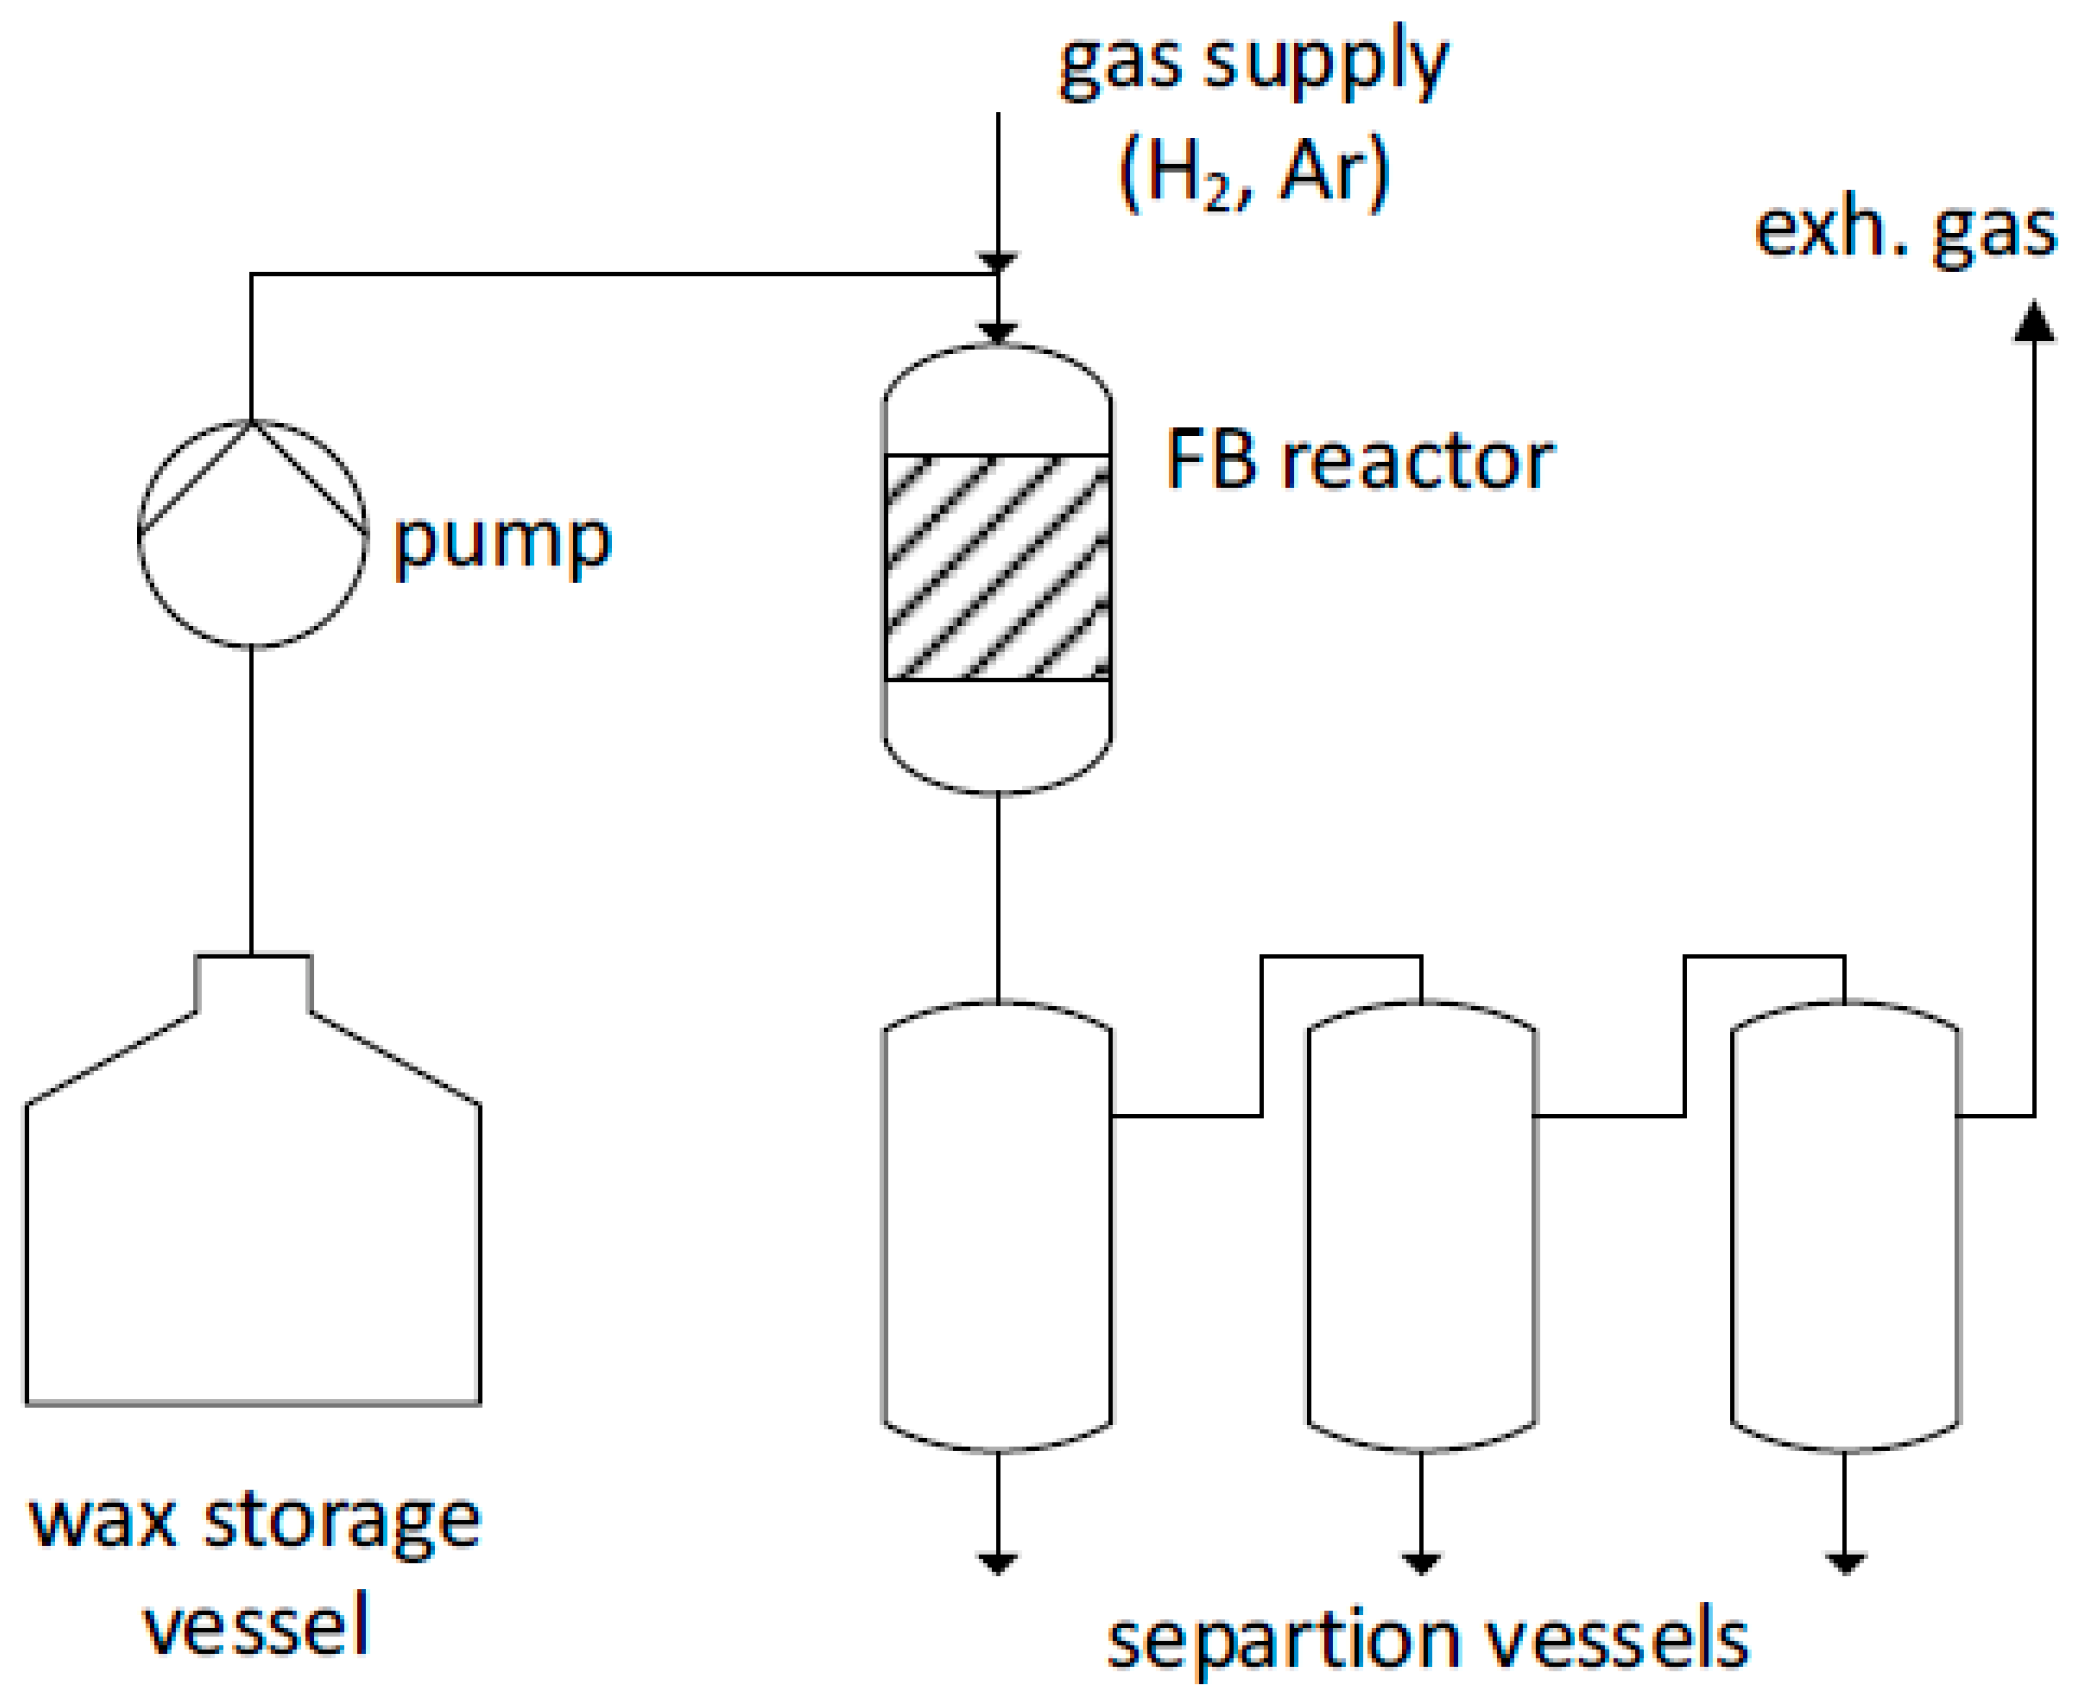
3.2. Hydroprocessing Reactor
3.3. Feedstocks
3.4. Catalysts
3.5. Utilized Analytical Instruments
3.5.1. Gas Phase
3.5.2. Naphtha and Middle Distillate
3.5.3. Lubricants
4. Results
4.1. Pyrolysis of Plastic Feedstock
4.2. Hydroprocessing of the Fischer–Tropsch Wax and Pyrolysis Wax
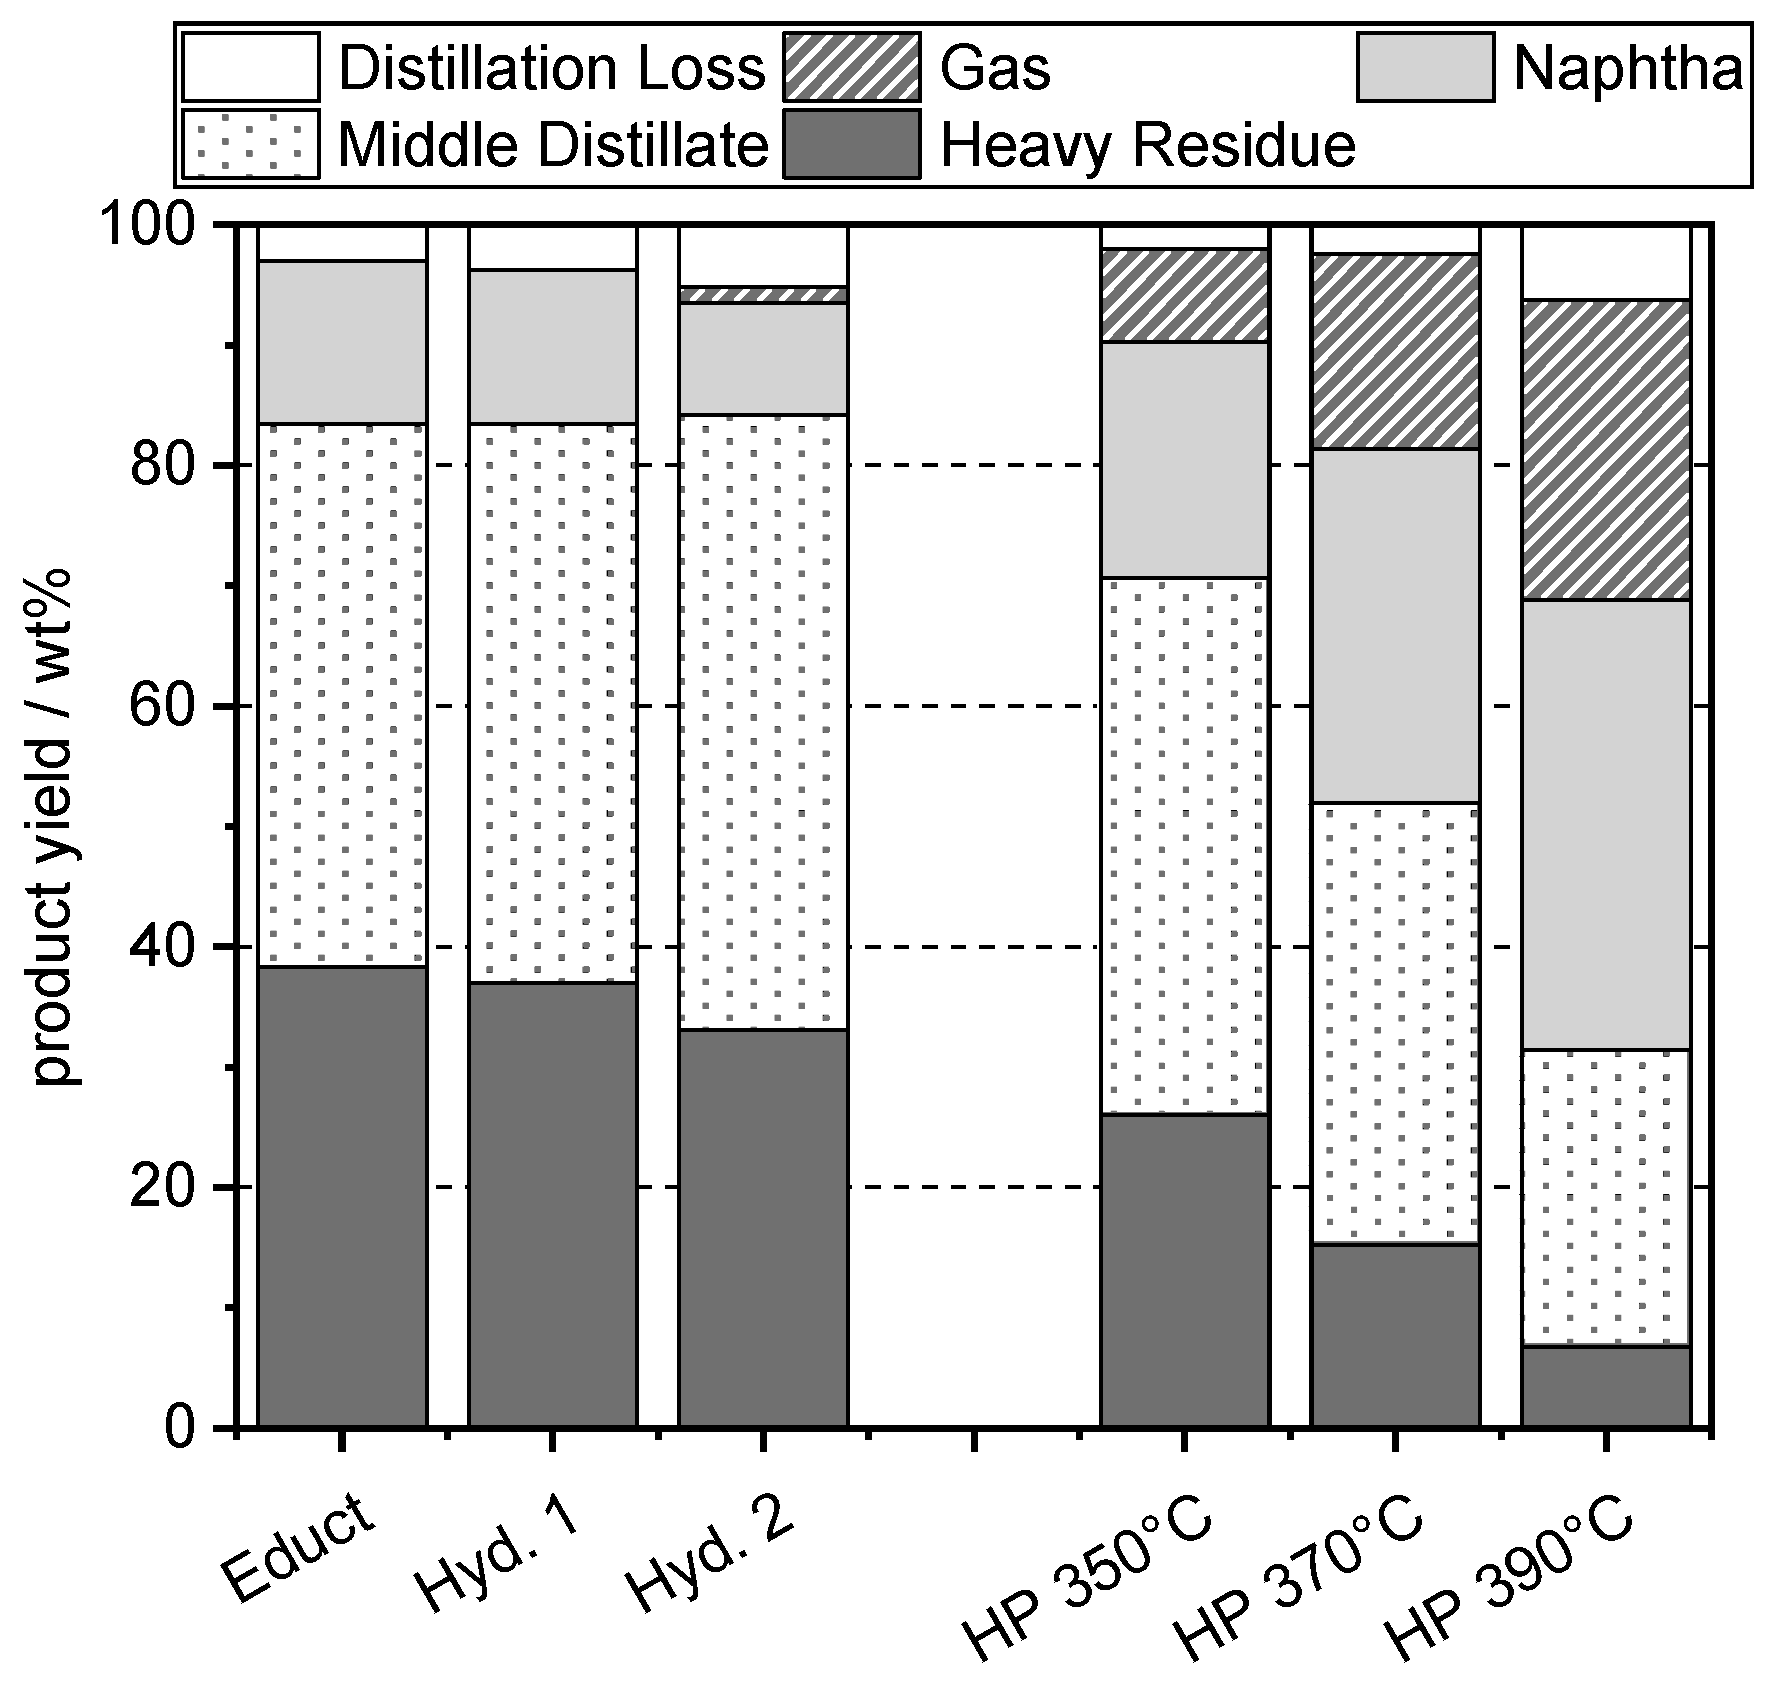
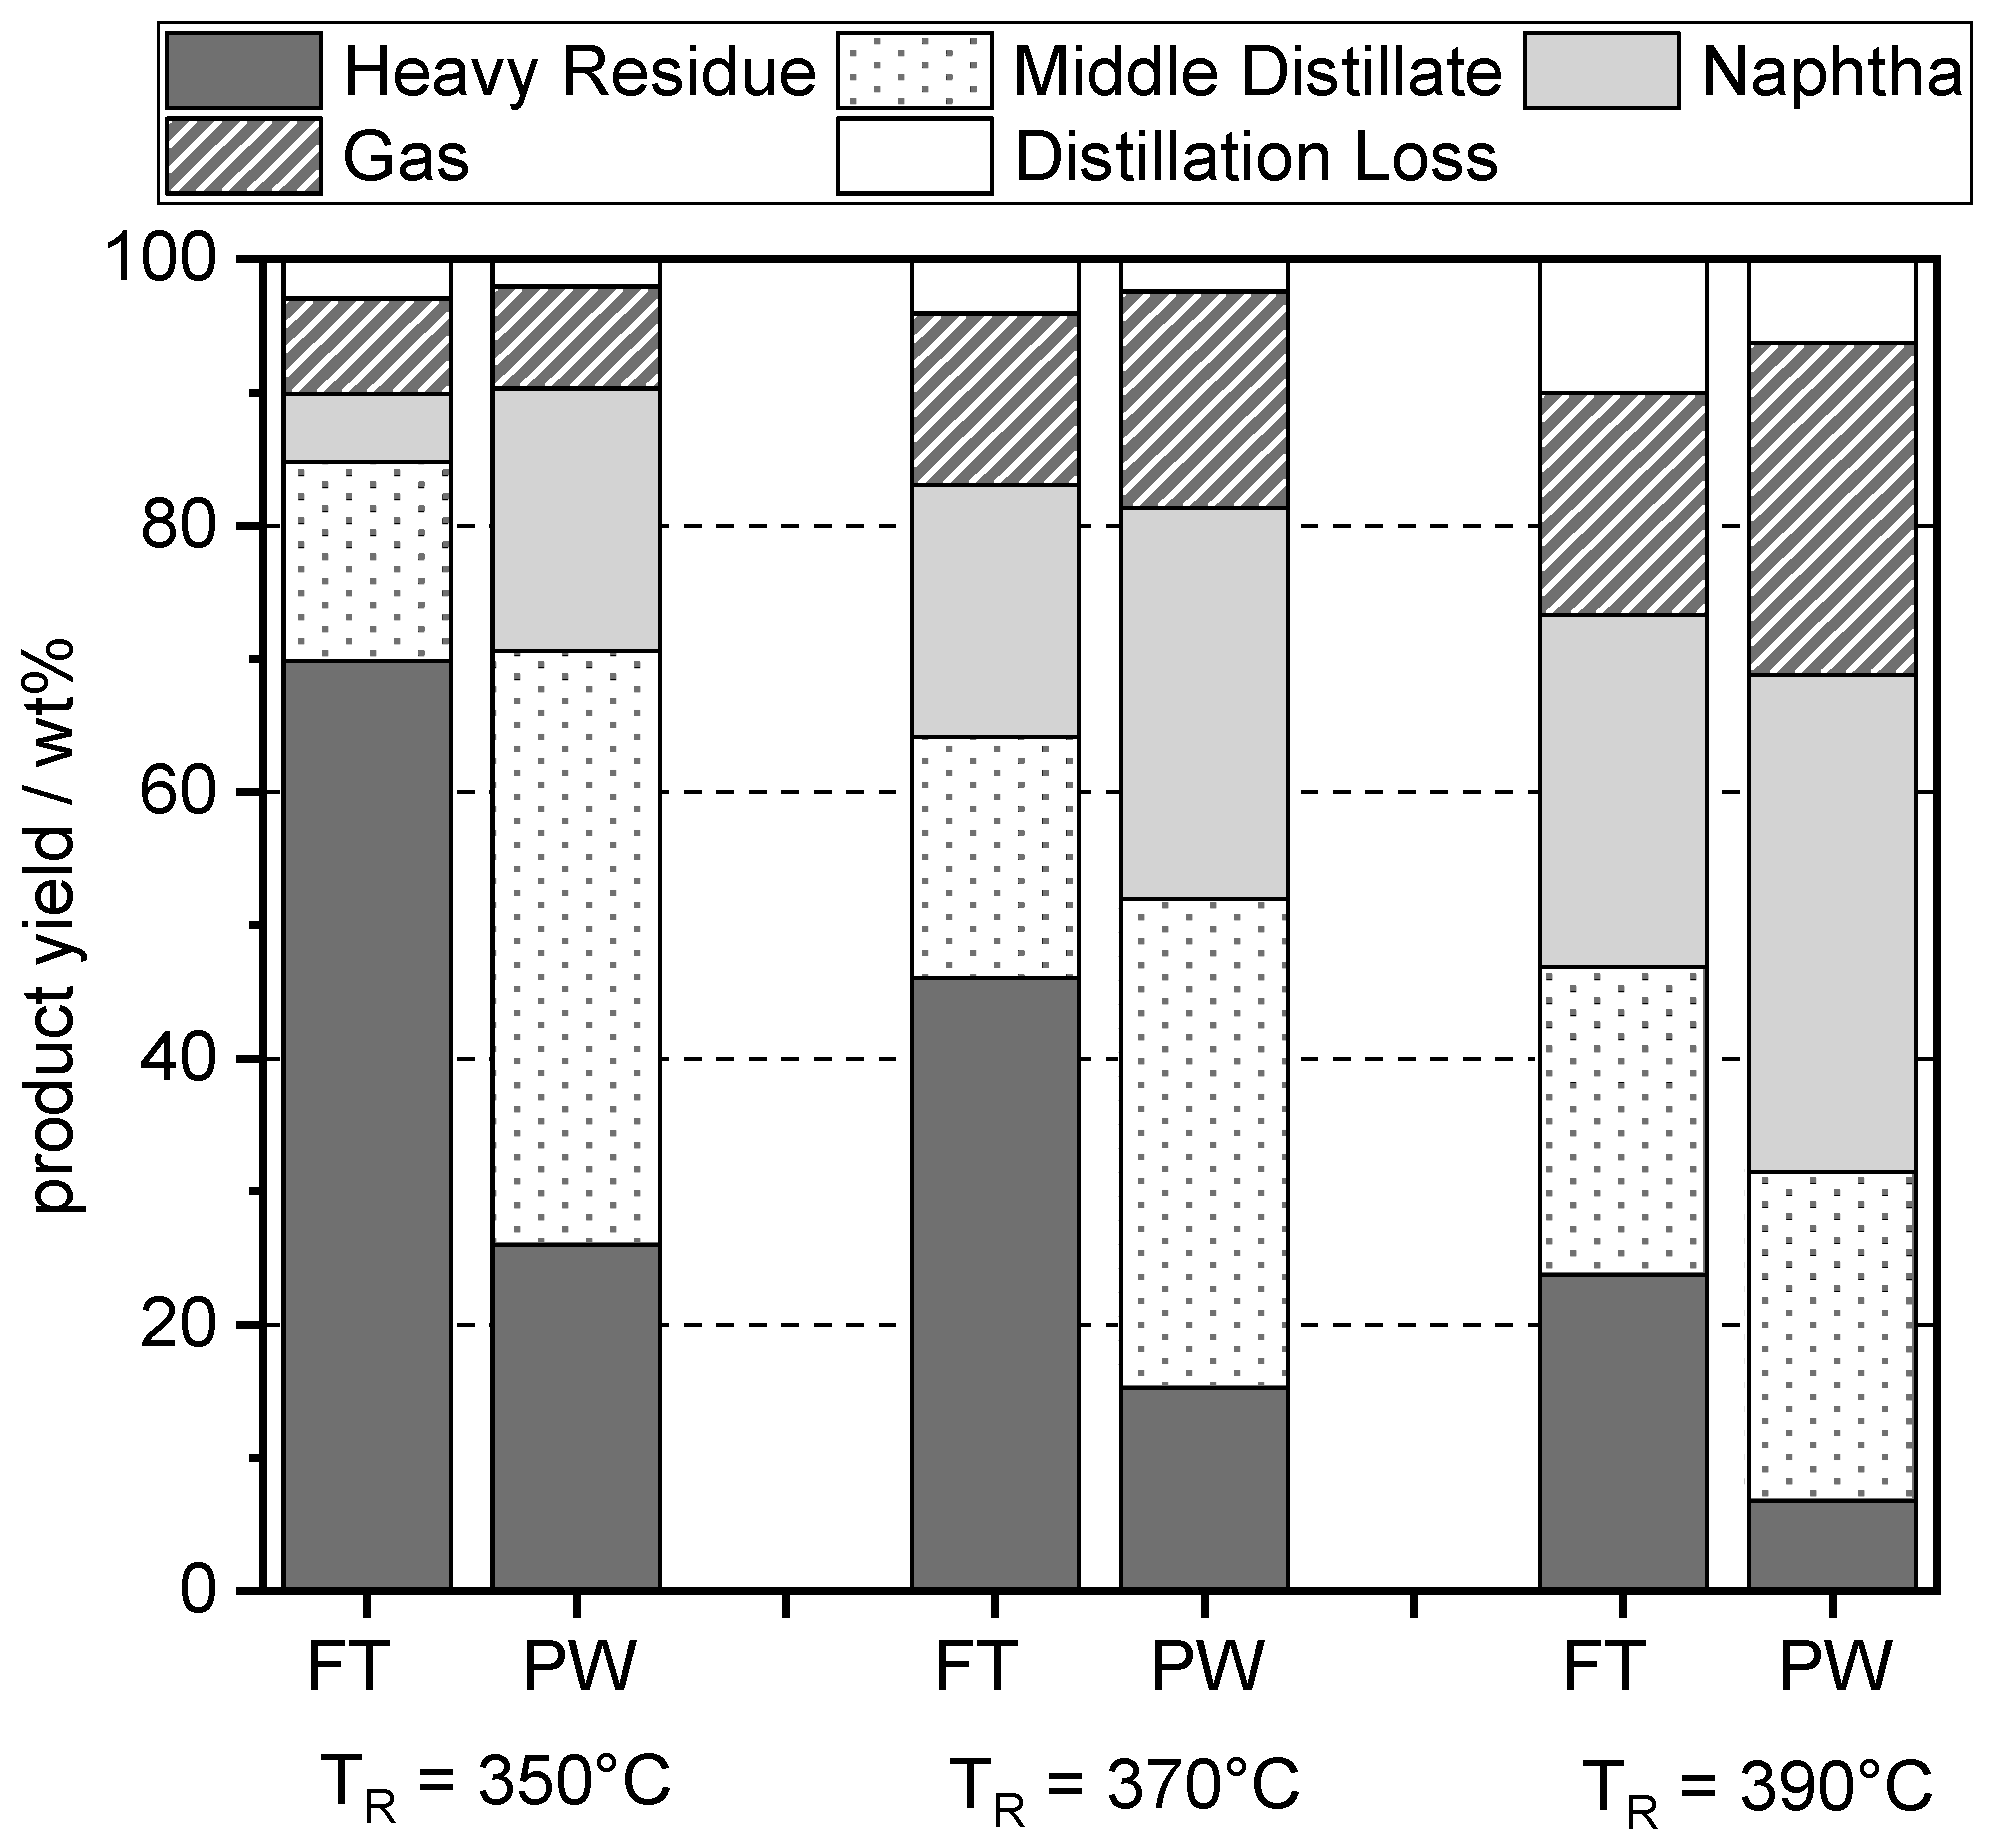
4.3. Distillation and Product Yields
4.4. Approximate Product Yields
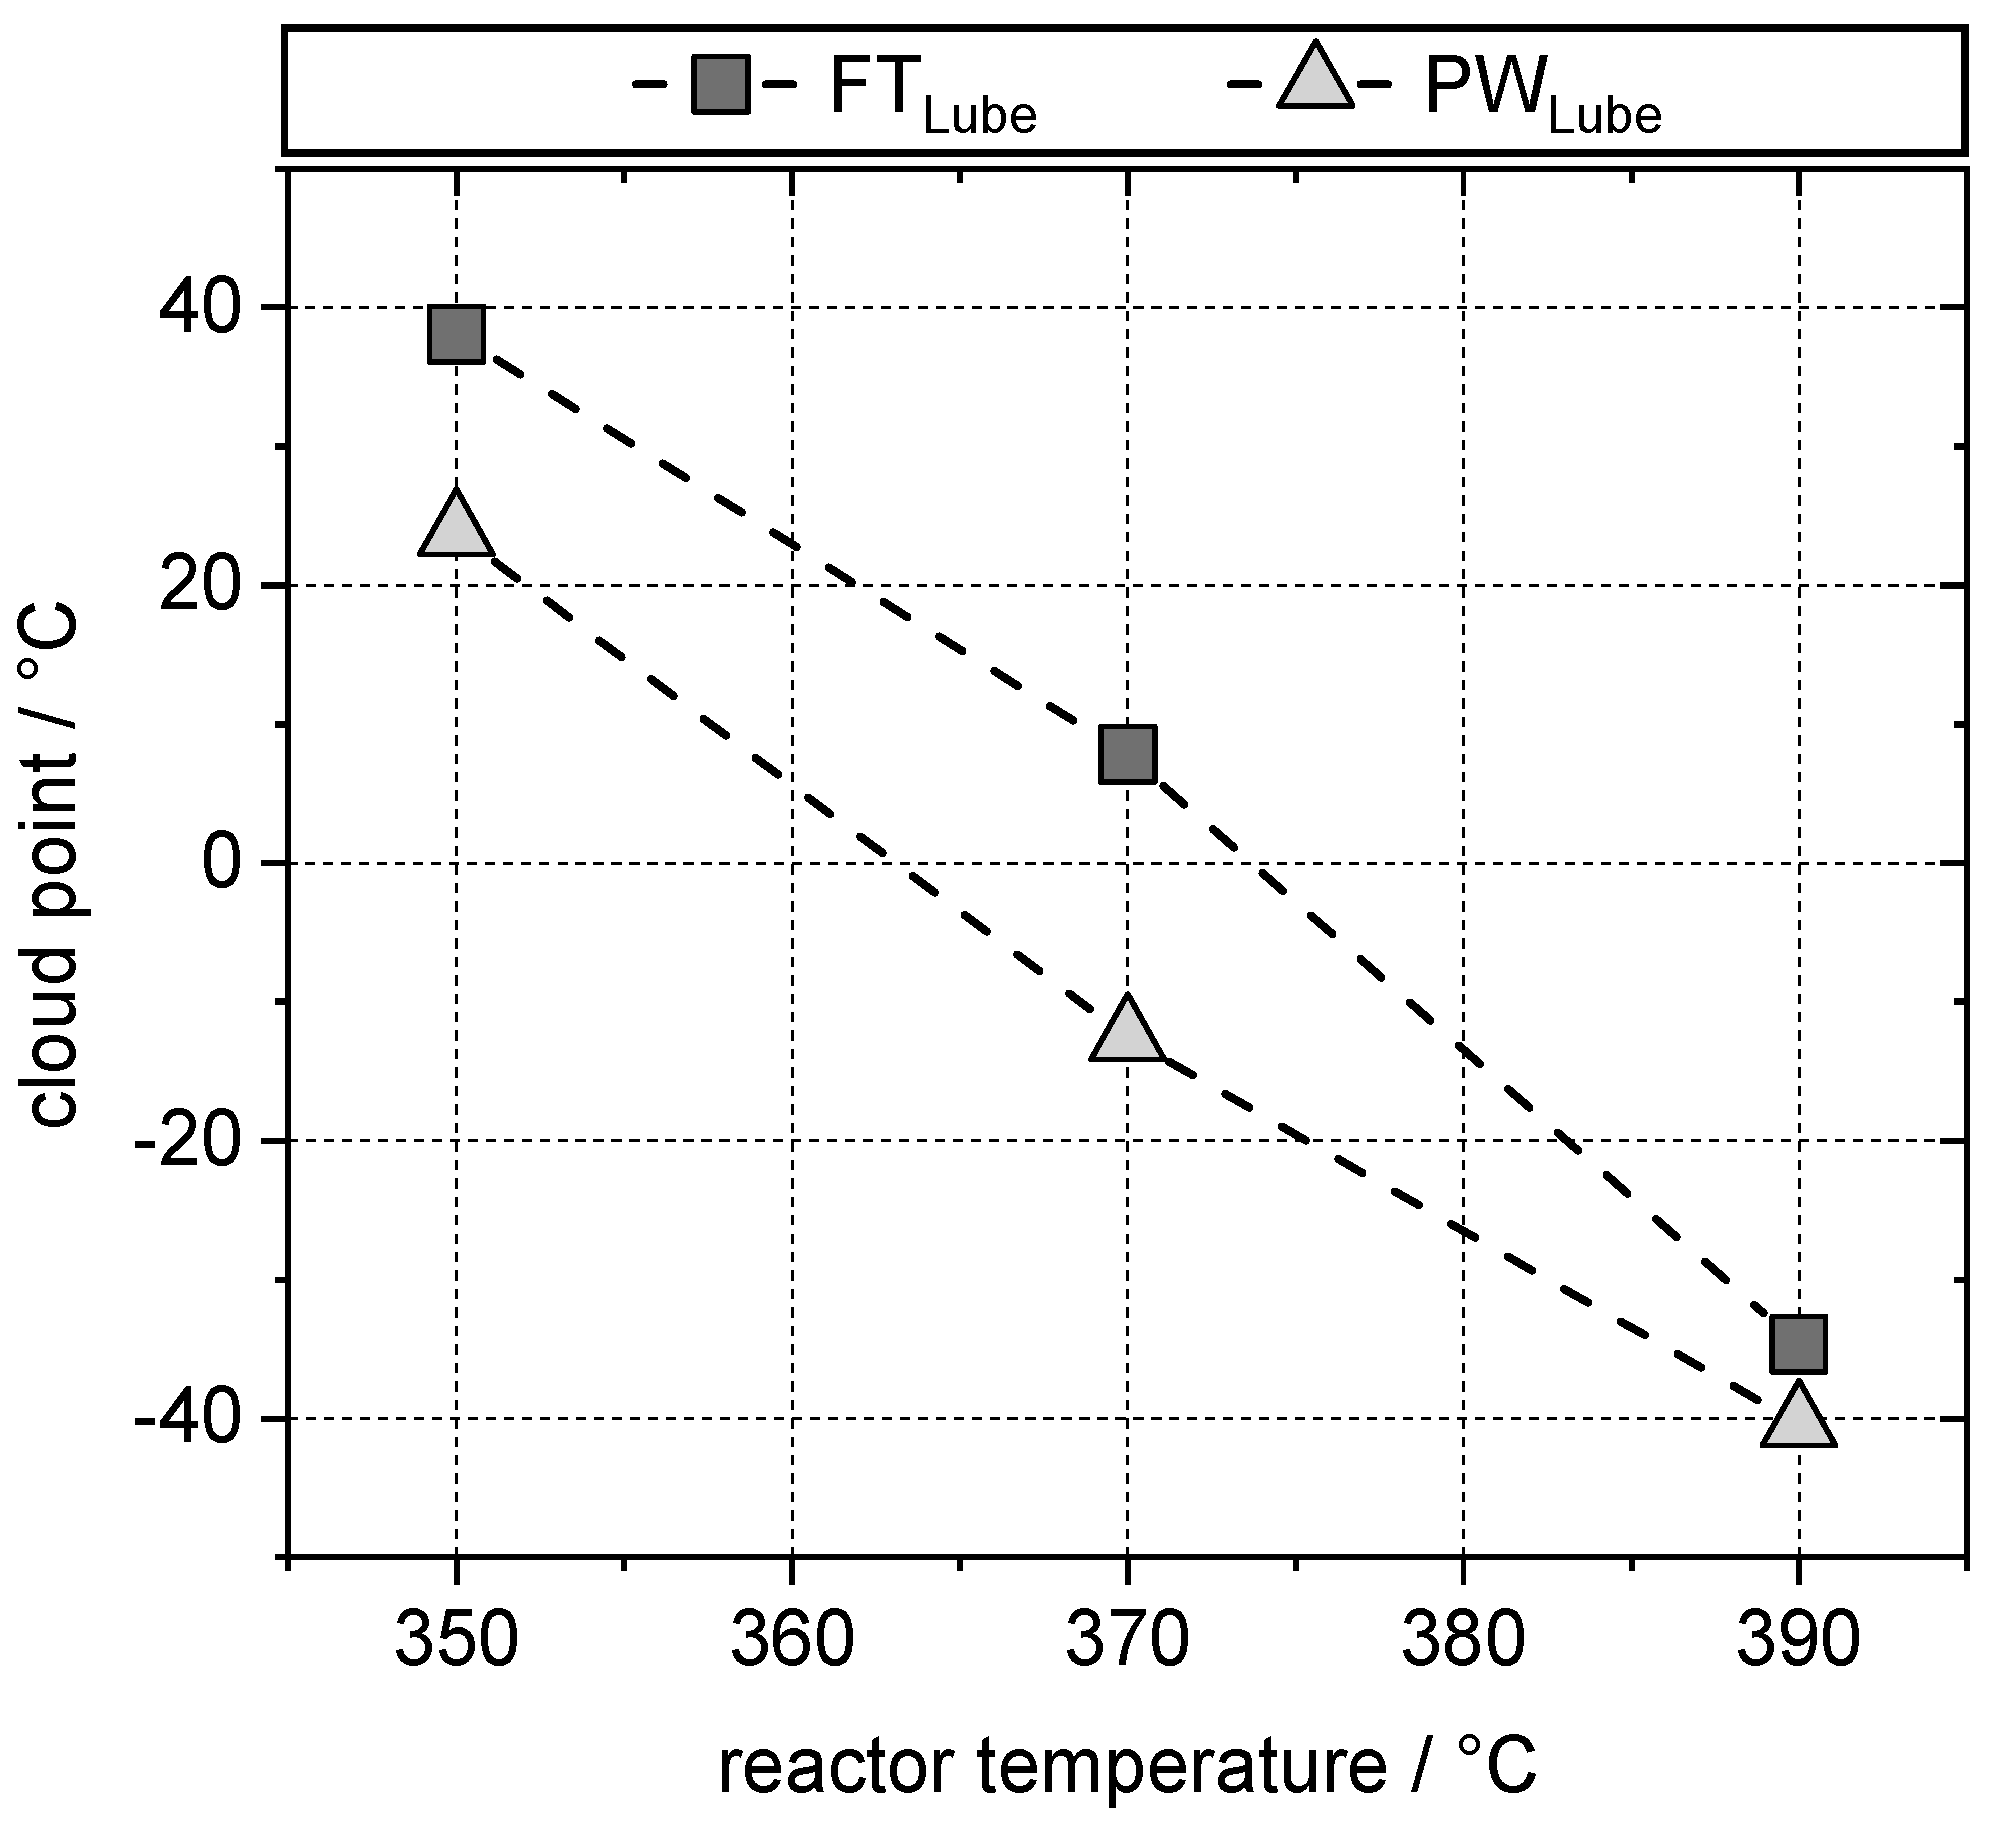
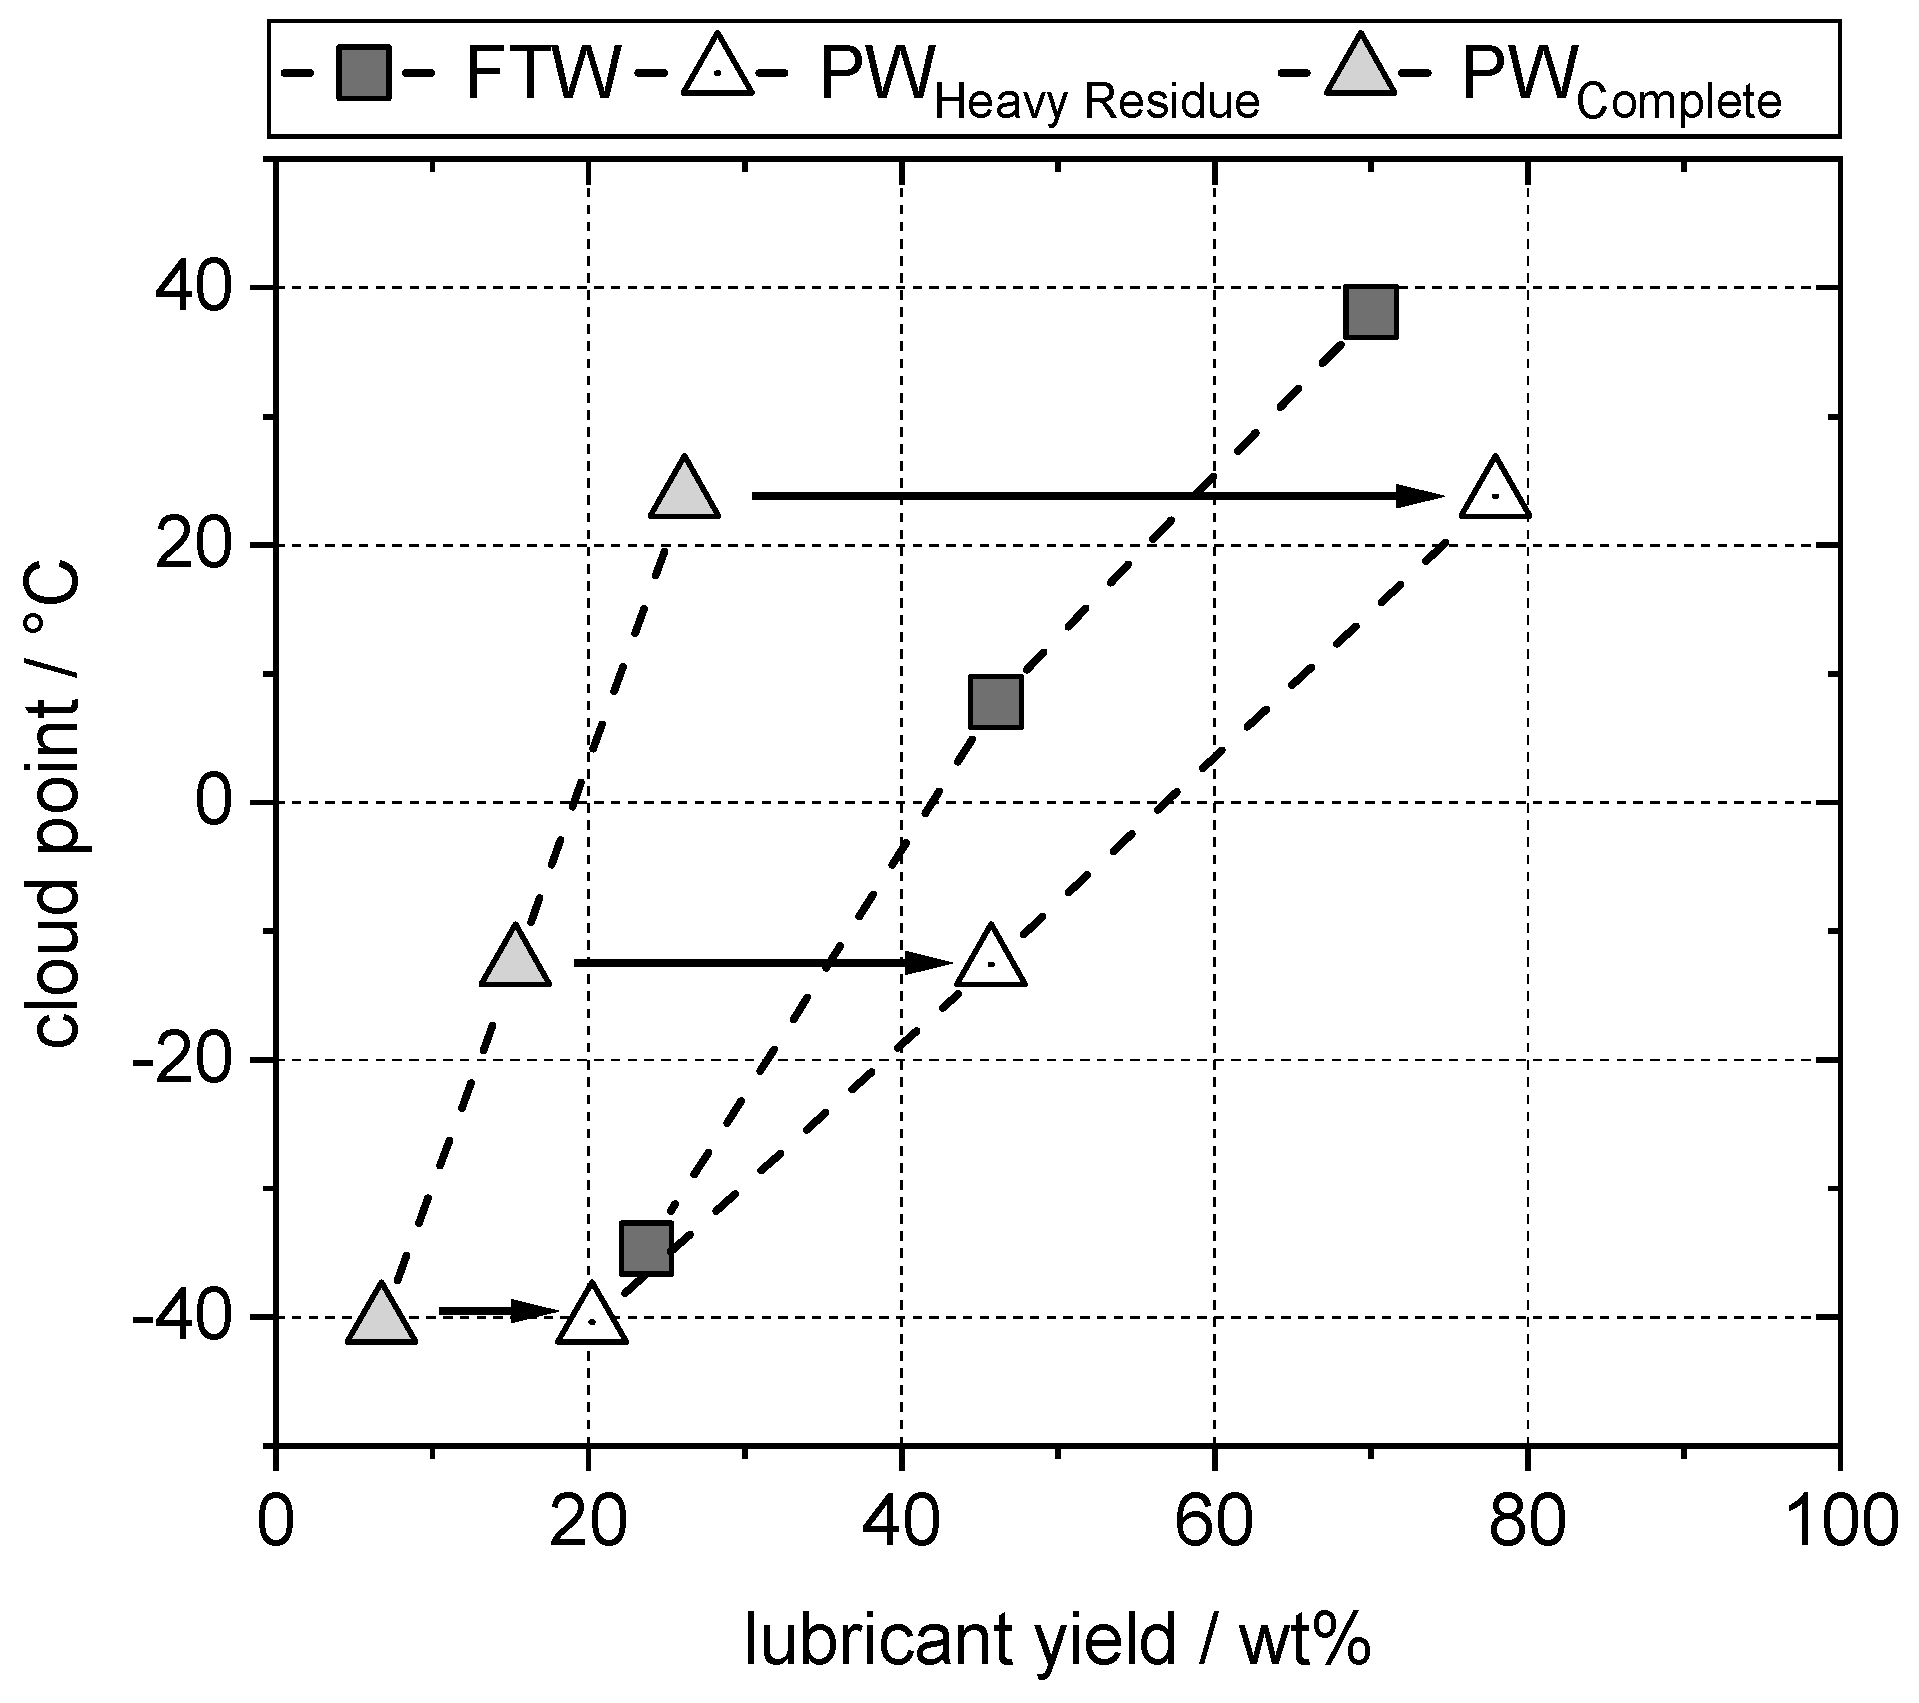
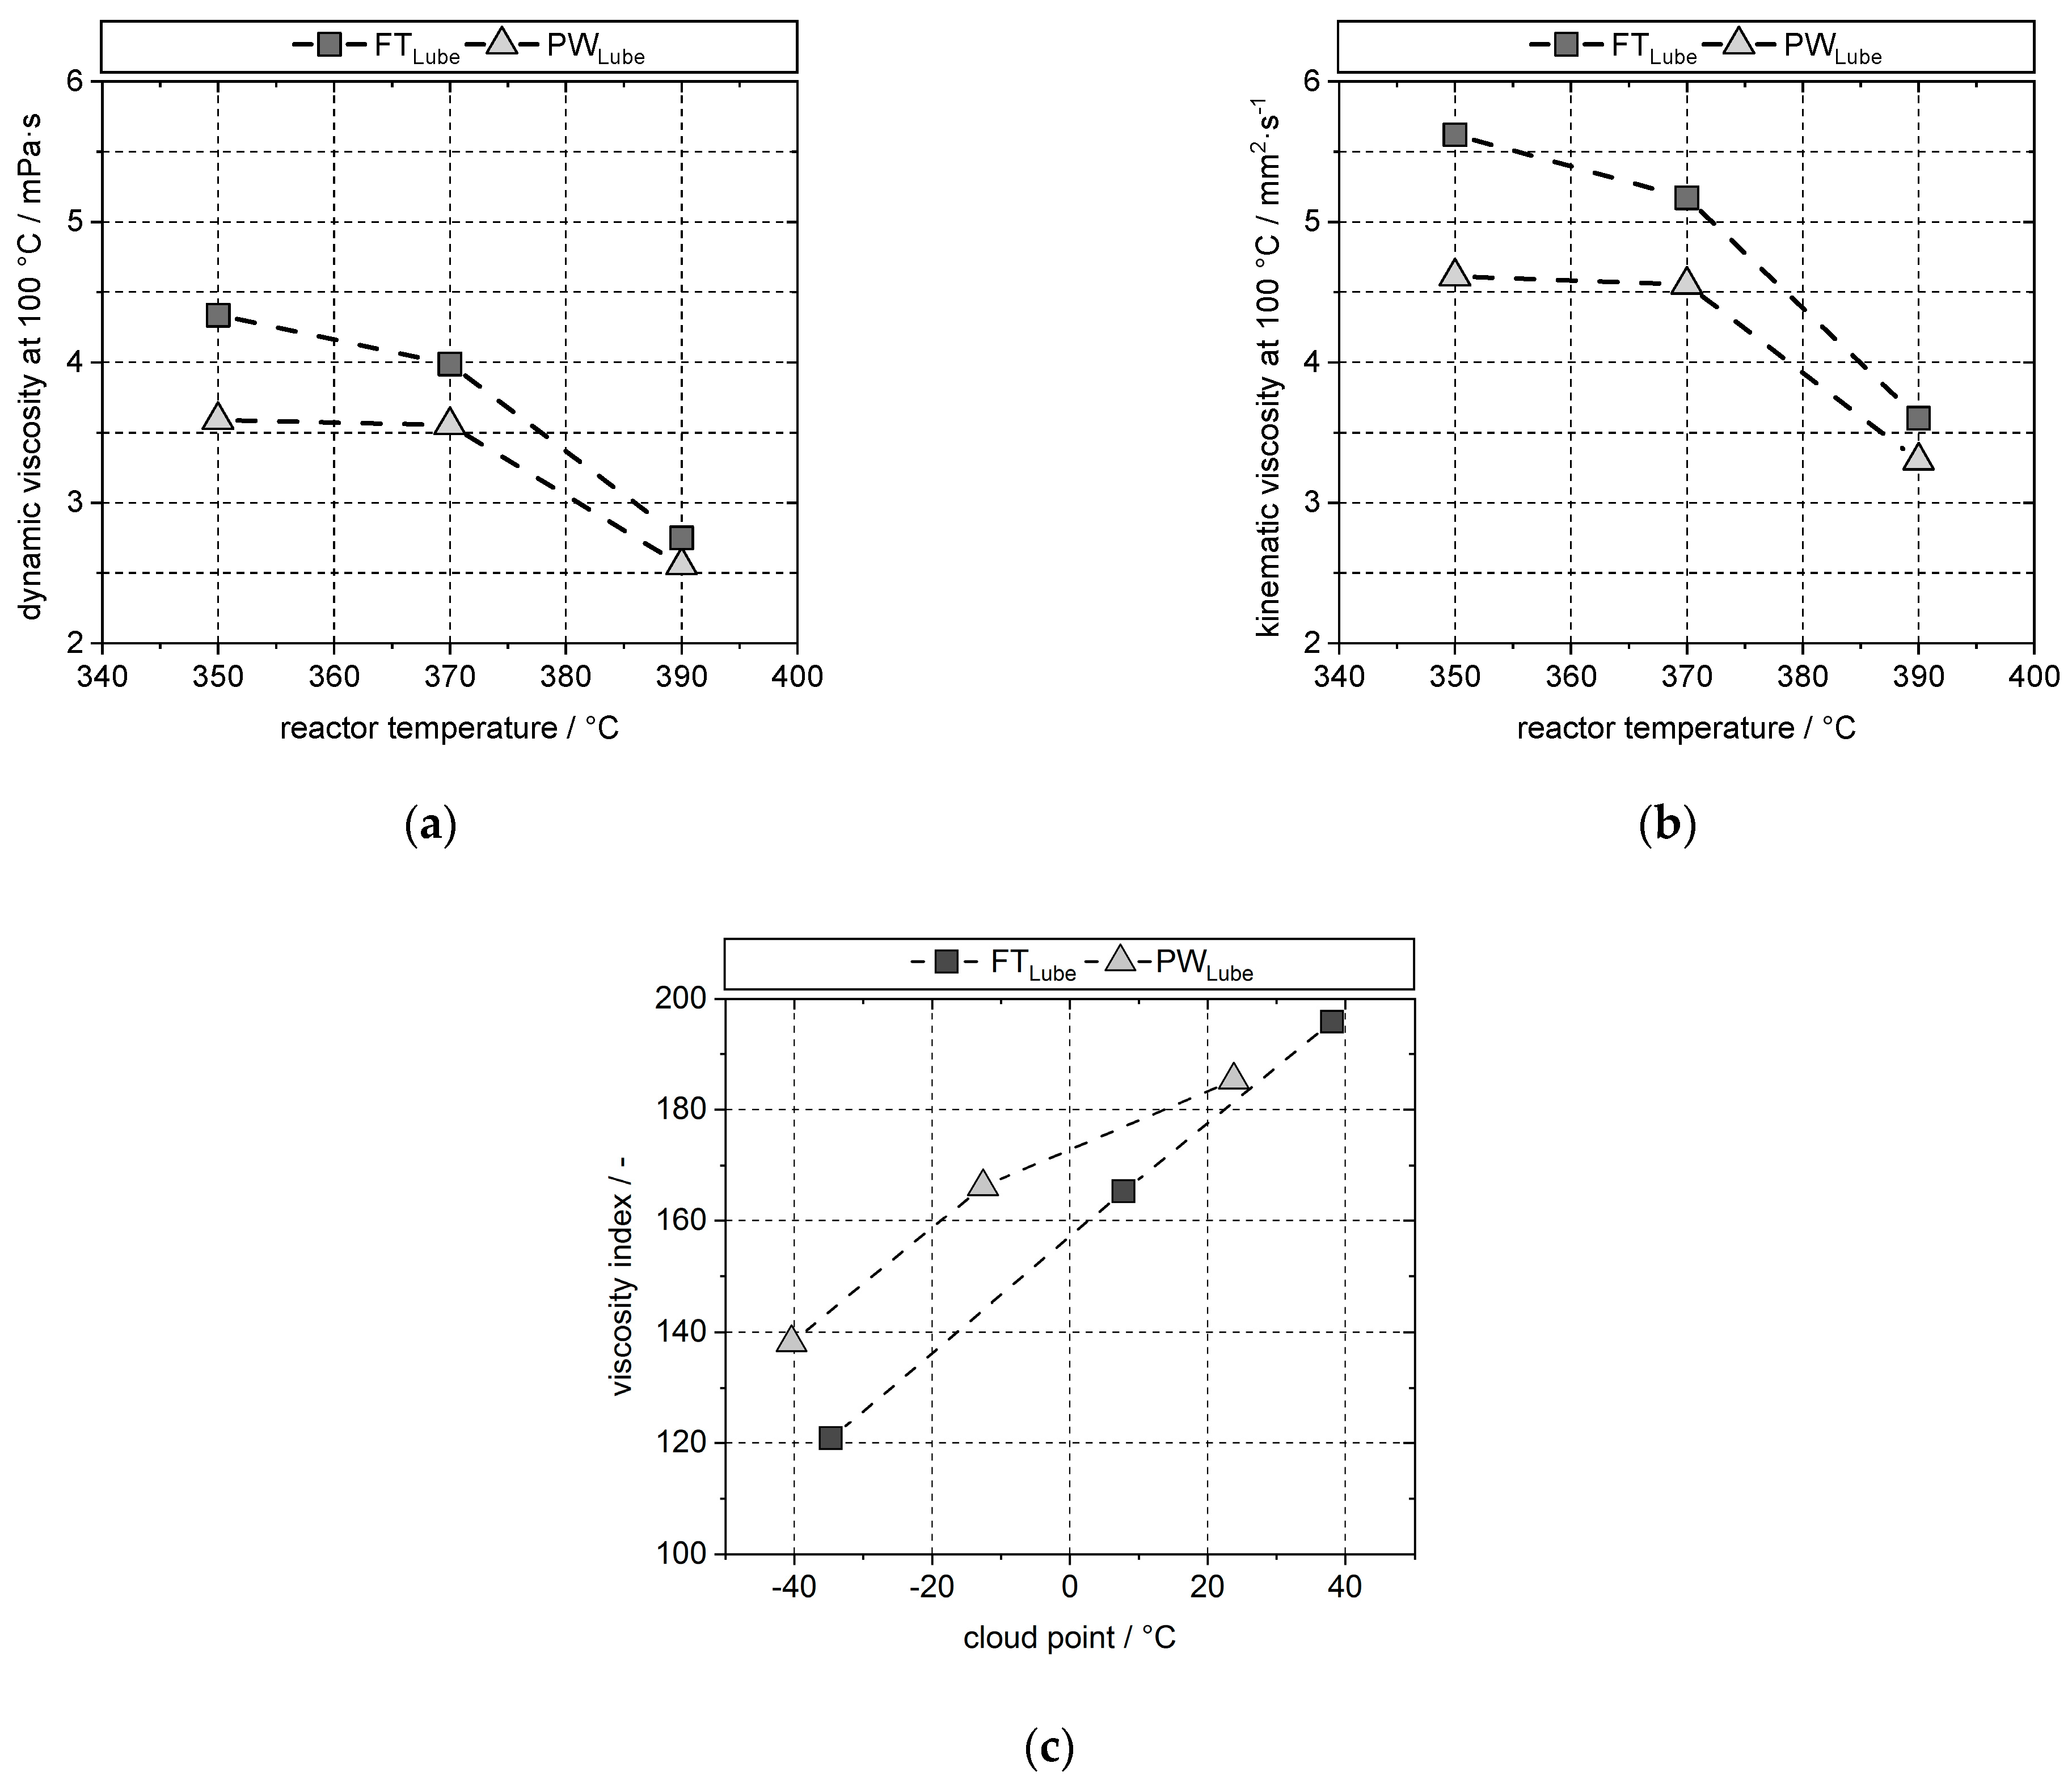
4.5. Lubricant Properties
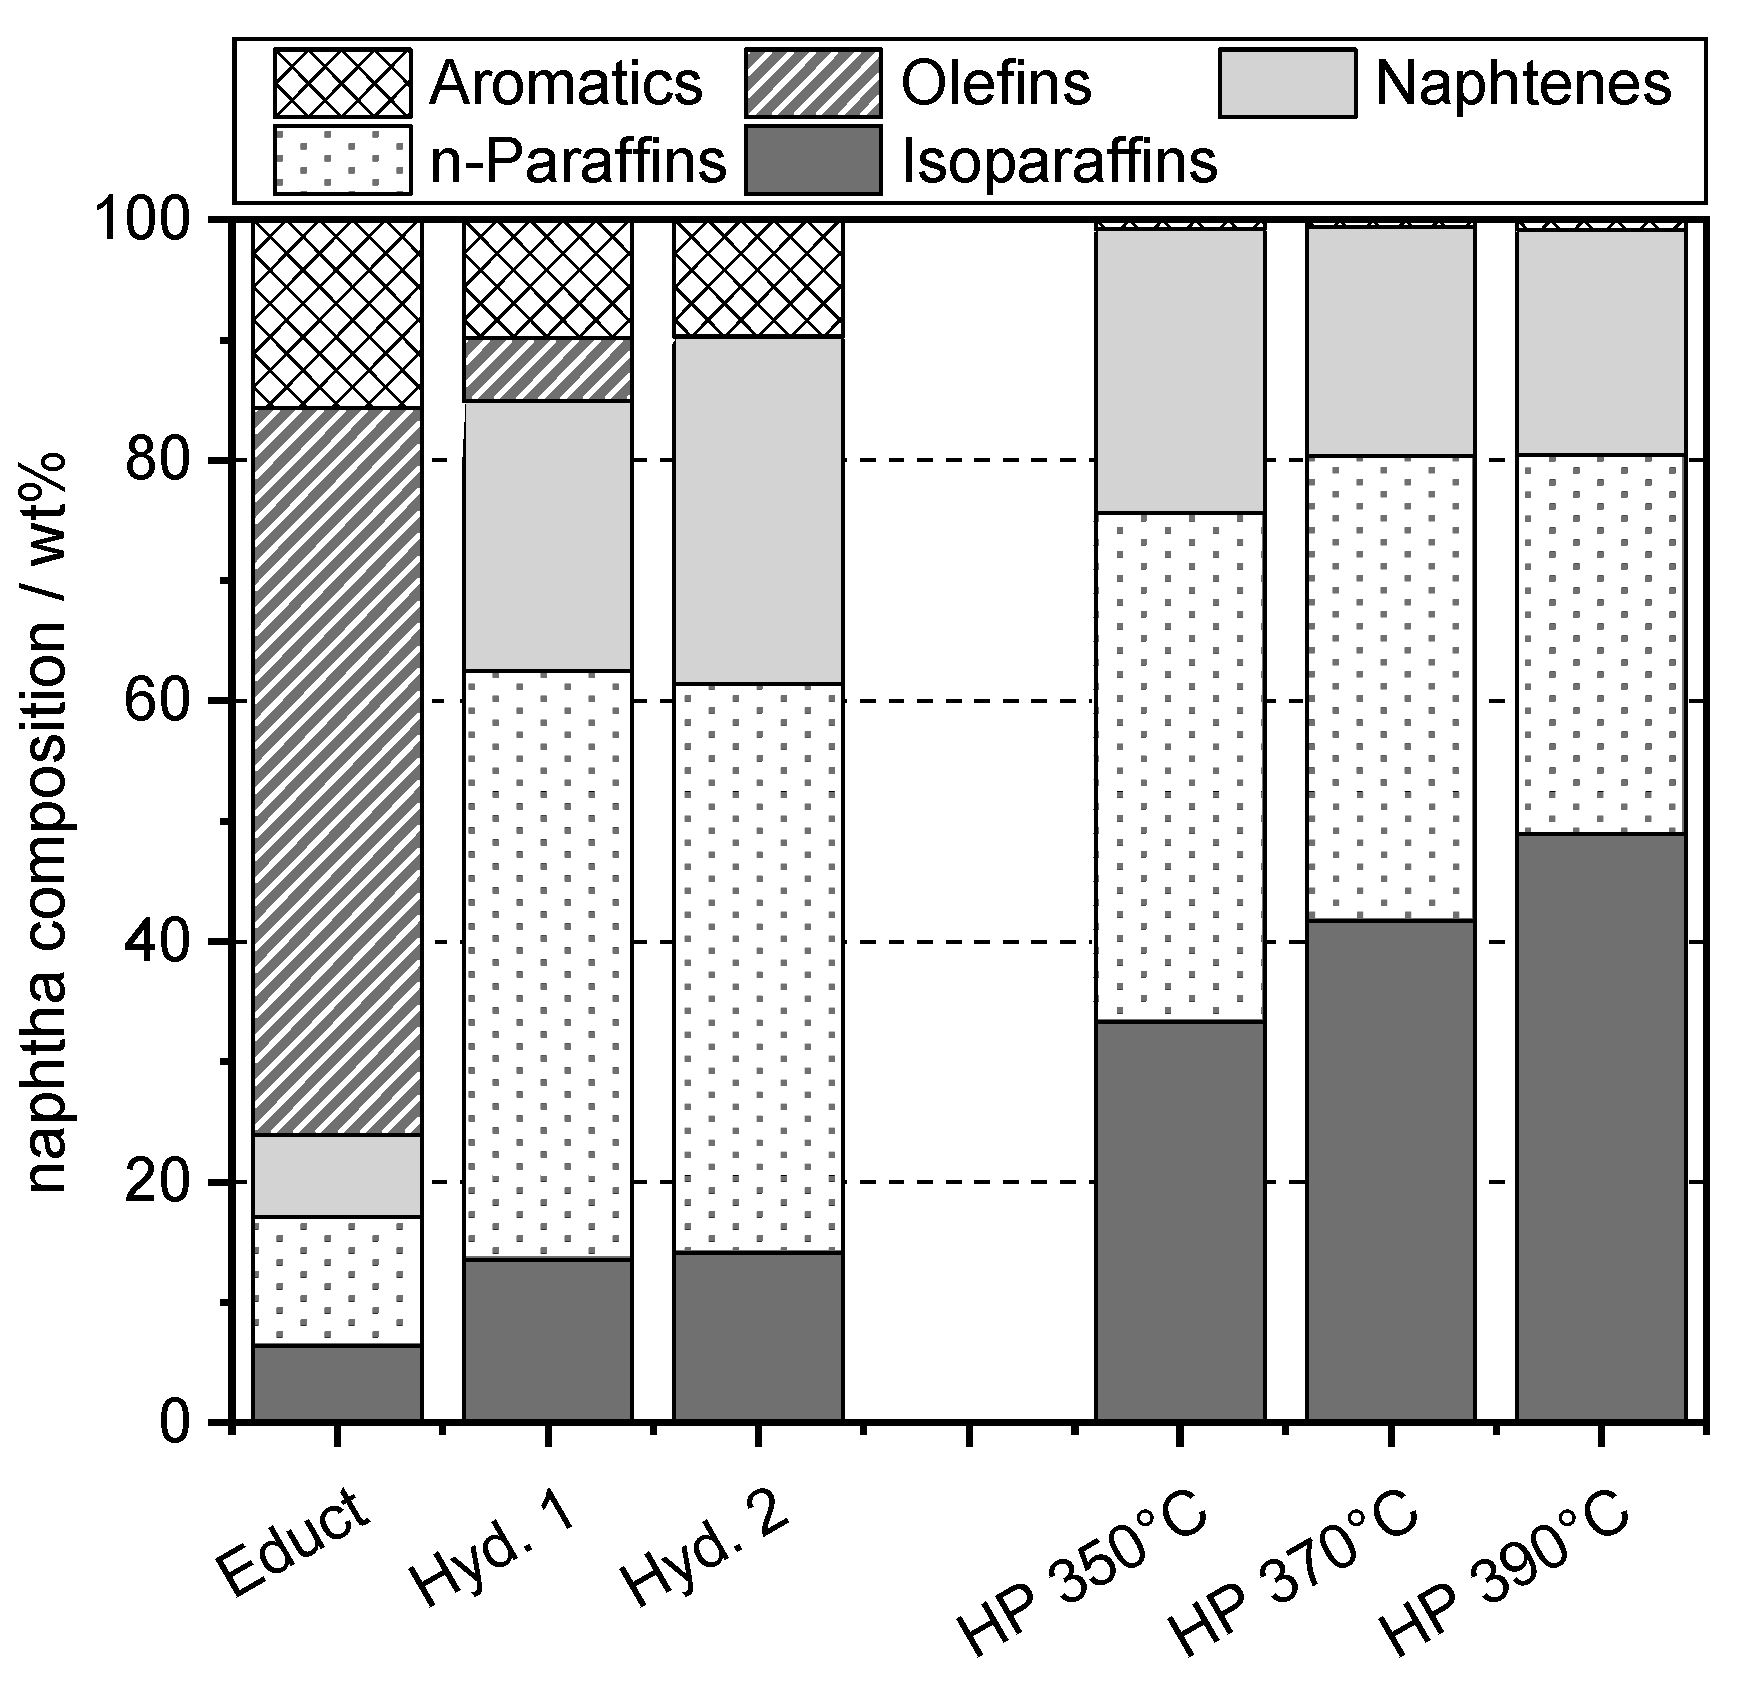
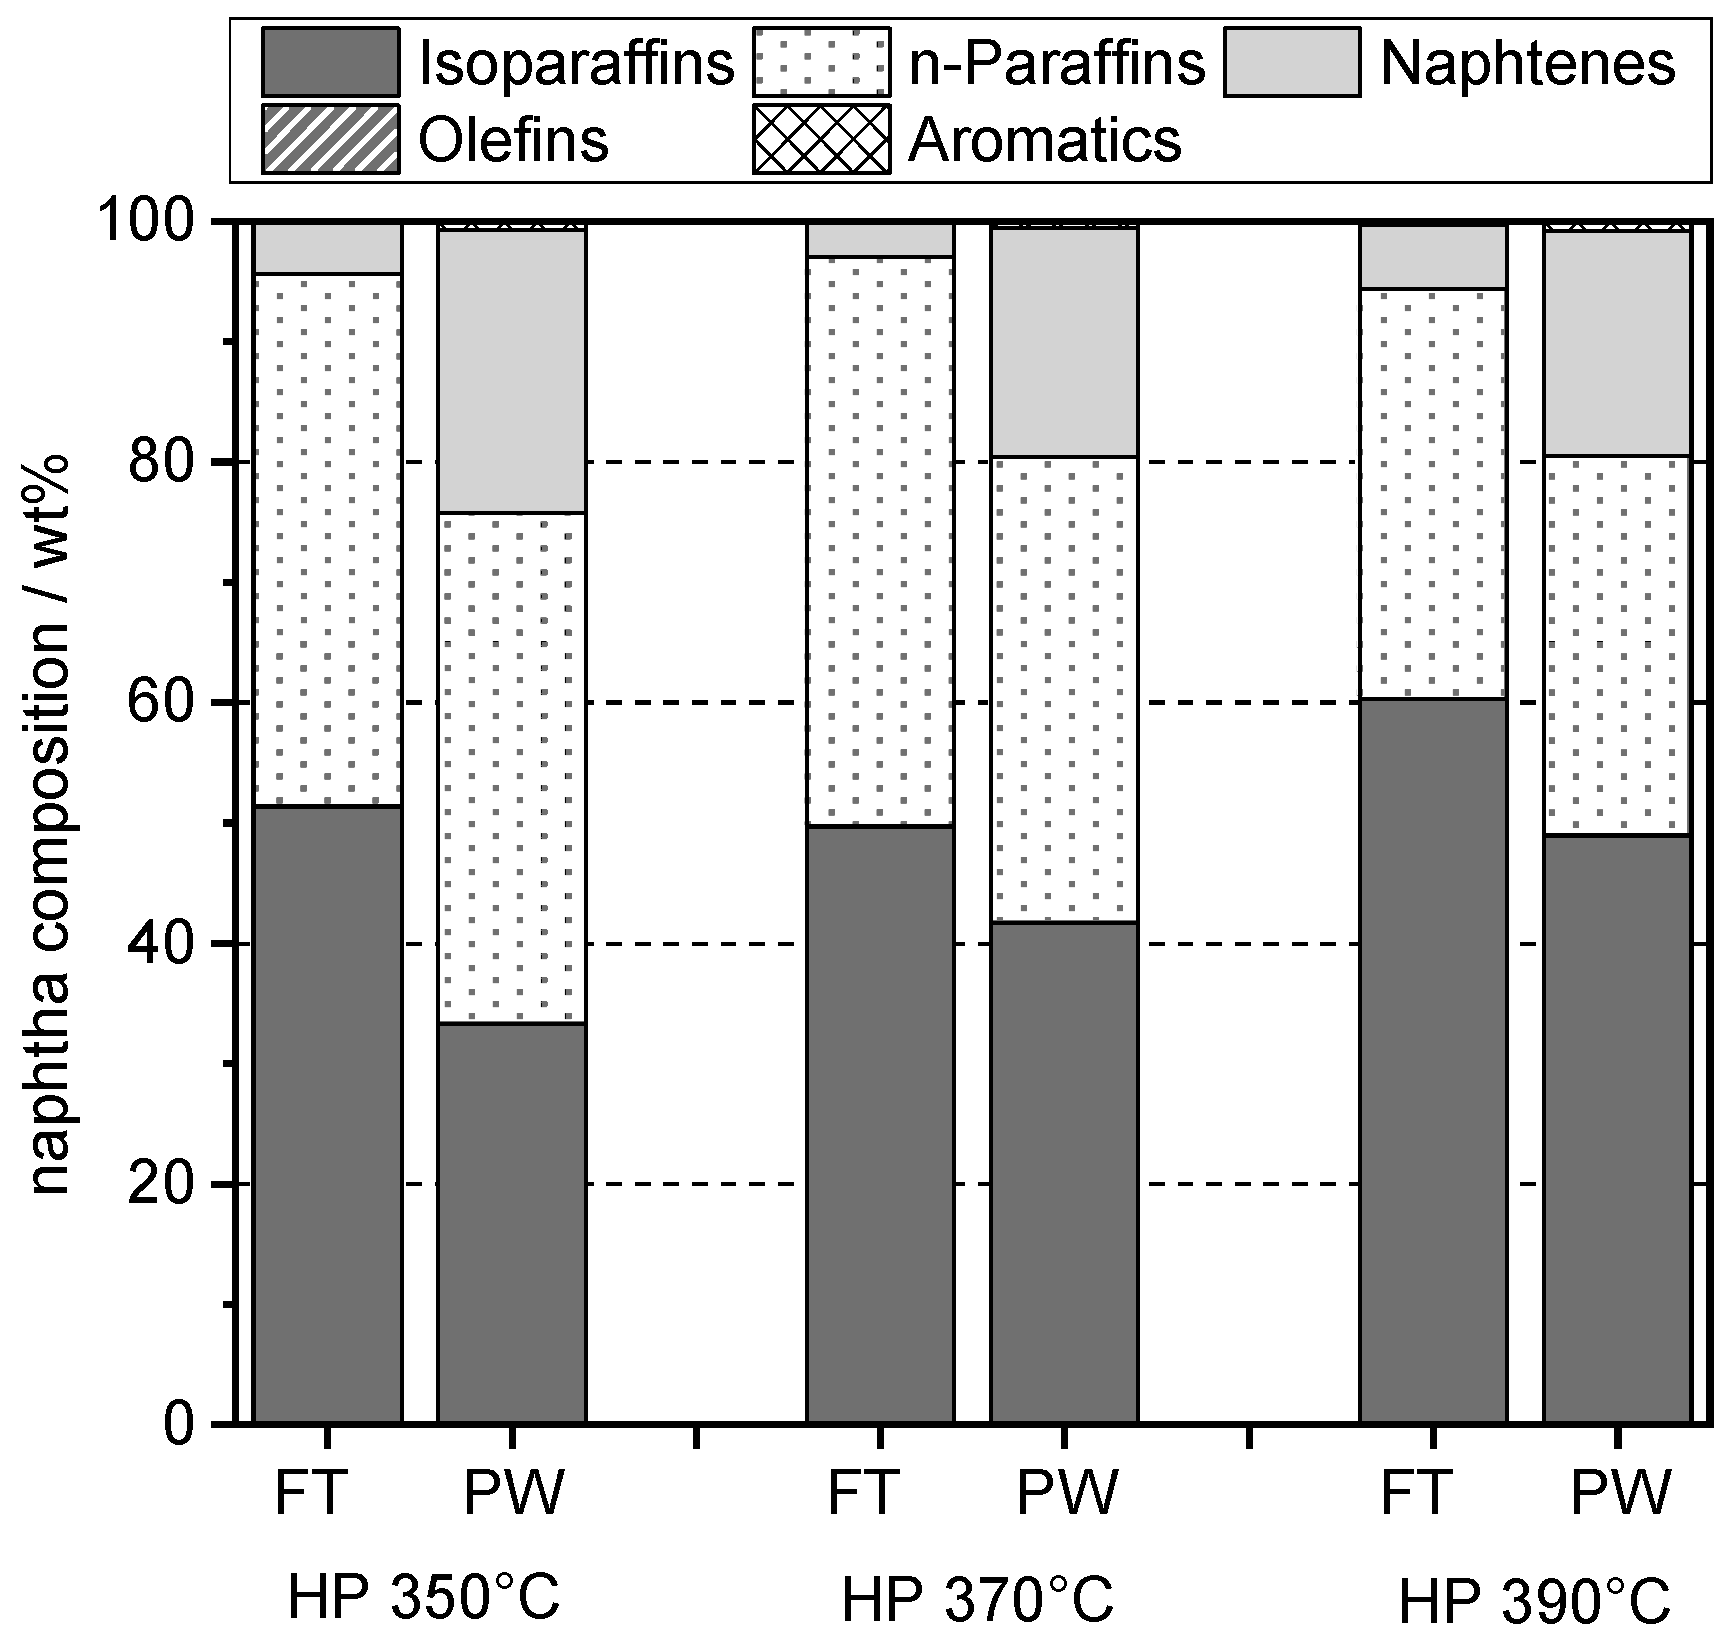
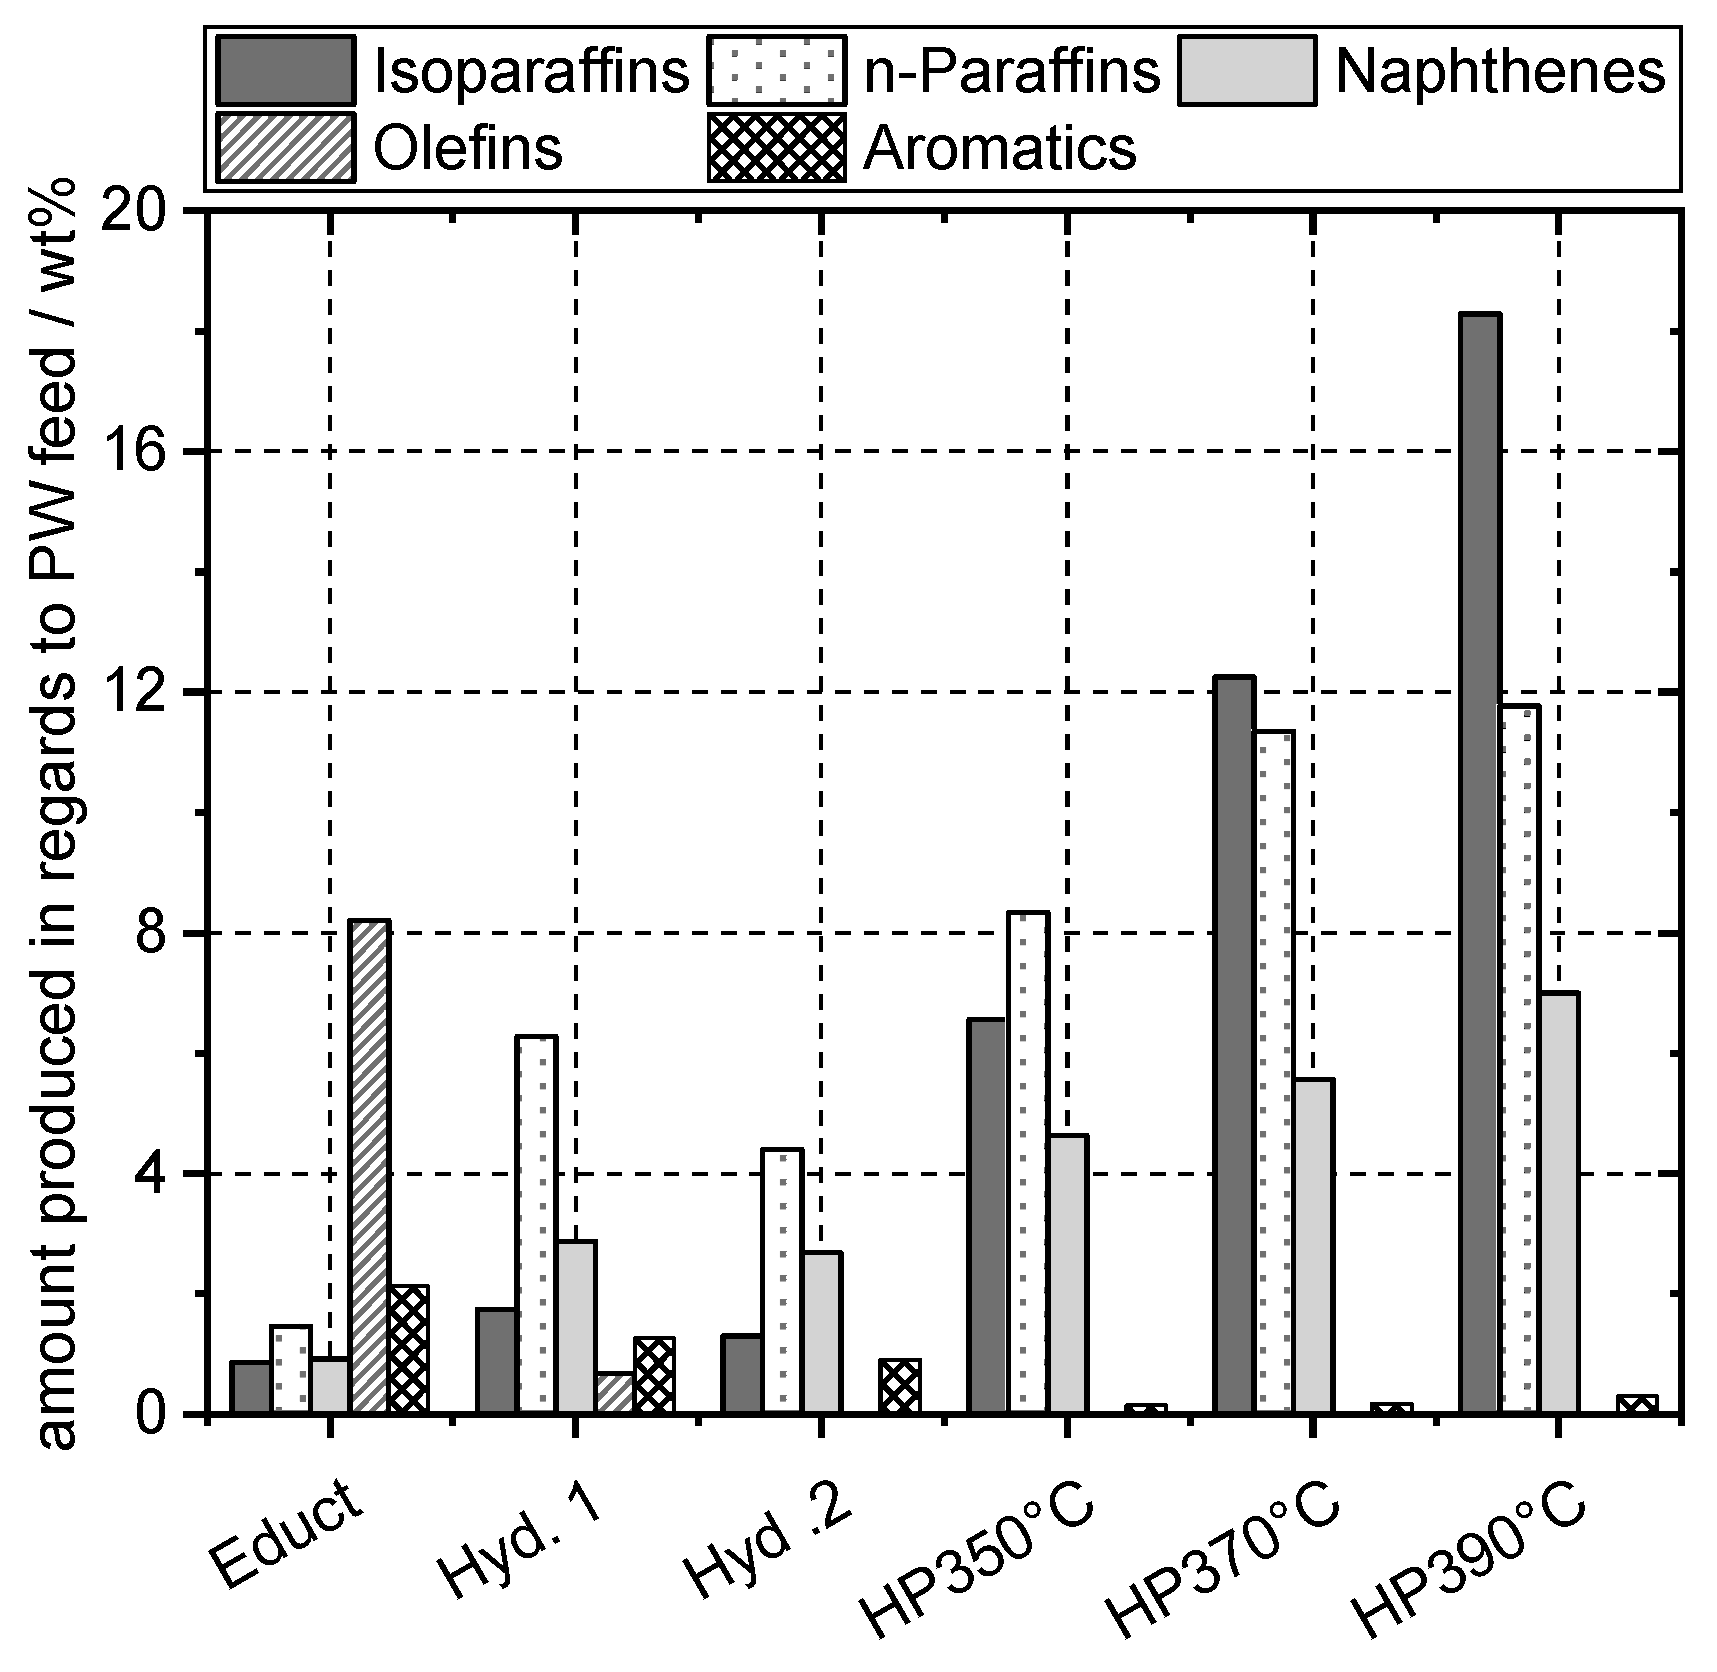
4.6. Naphtha Composition
4.7. Middle Distillate Composition
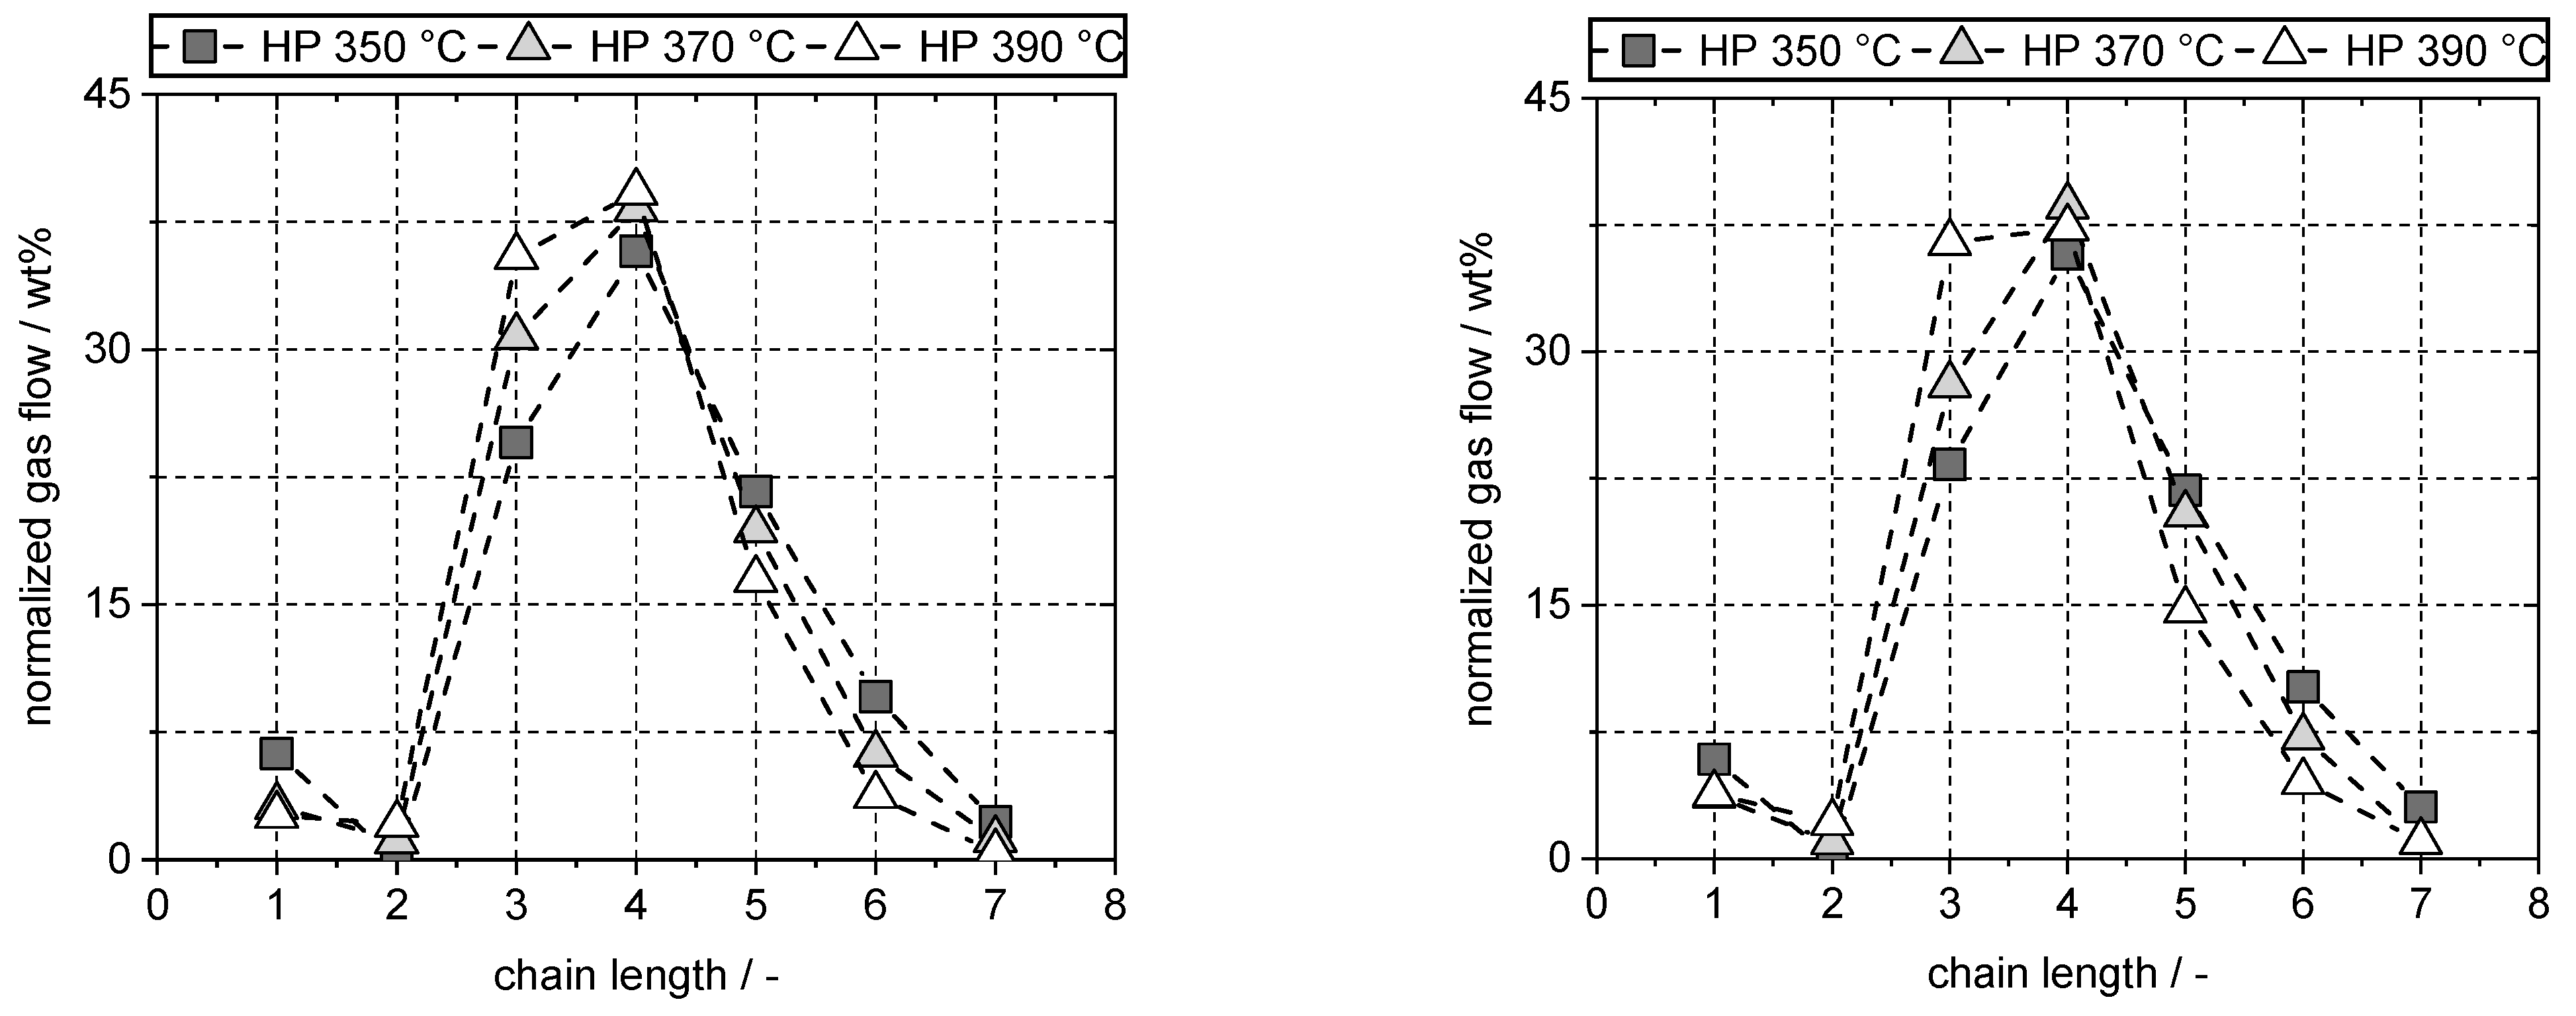
4.8. Gas Composition
5. Conclusions
Author Contributions
Funding
Conflicts of Interest
Appendix A

| Hydrogenation | ||||||
| Pyrolysis Wax | ||||||
| Hyd. 1 | Hyd. 2 | |||||
| (wt%) | (wt%) | |||||
| Gas yield | Not determinable | Not determinable | ||||
| Liquid yield | 100.8 | 98.7 | ||||
| Hydroprocessing | ||||||
| Pyrolysis Wax | Fischer–Tropsch Wax | |||||
| HP 350 °C | HP 370 °C | HP 390 °C | HP 350 °C | HP 370 °C | HP 390 °C | |
| (wt%) | (wt%) | (wt%) | (wt%) | (wt%) | (wt%) | |
| Gas yield | 6.7 | 16.1 | 22.4 | 7.93 | 14.22 | 15.61 |
| Liquid yield | 92.3 | 83.8 | 75.1 | 92.96 | 87.12 | 83.31 |
| Total | 99.1 | 99.9 | 97.5 | 100.89 | 101.34 | 98.92 |
| Distillation Data | ||||||
| Pyrolysis Wax | Fischer–Tropsch Wax | |||||
| HP 350 °C | HP 370 °C | HP 390 °C | HP 350 °C | HP 370 °C | HP 390 °C | |
| (wt%) | (wt%) | (wt%) | (wt%) | (wt%) | (wt%) | |
| Naphtha | 21.4 | 35.2 | 50.0 | 5.5 | 21.7 | 31.8 |
| Middle distillate | 48.6 | 44.1 | 33.1 | 16.1 | 20.7 | 27.7 |
| Heavy residue | 28.3 | 18.3 | 9.0 | 75.2 | 52.8 | 28.5 |
| Distillation loss | 1.7 | 2.4 | 7.9 | 3.2 | 4.7 | 12.0 |
| Total | 100.0 | 100.0 | 100.0 | 100.0 | 100.0 | 100.0 |
Appendix B
| HP 350 °C (FT) | |||||||||||
| CNumber | 4 | 5 | 6 | 7 | 8 | 9 | 10 | 11 | 12+ | Poly | Total |
| Naph. | 0 | 0.06 | 0.75 | 1.54 | 1.1 | 0.29 | 0.05 | 0 | 0 | 0 | 3.78 |
| i-Par. | 0.71 | 5.45 | 13.8 | 16.4 | 10.01 | 3.52 | 1.02 | 0.15 | 0.28 | 0 | 51.34 |
| n-Par. | 1.1 | 6.4 | 14.95 | 13.05 | 6.37 | 1.98 | 0.59 | 0.34 | 0 | 0 | 44.79 |
| Cycl Ol. | 0 | 0 | 0 | 0 | 0 | 0 | 0 | 0 | 0 | 0 | 0 |
| Olef. | 0 | 0 | 0.01 | 0 | 0 | 0 | 0 | 0 | 0 | 0 | 0.01 |
| Arom. | 0 | 0 | 0 | 0.03 | 0 | 0 | 0 | 0 | 0.04 | 0 | 0.07 |
| Total | 1.82 | 11.91 | 29.52 | 31.01 | 17.48 | 5.79 | 1.66 | 0.49 | 0.32 | 0 | 100 |
| HP 370 °C (FT) | |||||||||||
| Naph. | 0 | 0.11 | 1.24 | 1.2 | 0.31 | 0.05 | 0 | 0 | 0 | 0 | 2.91 |
| i-Par. | 0.74 | 7.16 | 22.59 | 15.39 | 3.1 | 0.58 | 0.11 | 0.02 | 0 | 0 | 49.7 |
| n-Par. | 1.33 | 9.92 | 24.87 | 9.31 | 1.45 | 0.29 | 0.11 | 0.04 | 0 | 0 | 47.32 |
| Cycl Ol. | 0 | 0 | 0 | 0 | 0 | 0 | 0 | 0 | 0 | 0 | 0 |
| Olef. | 0 | 0.02 | 0.04 | 0.02 | 0 | 0 | 0 | 0 | 0 | 0 | 0.07 |
| Arom. | 0 | 0 | 0 | 0.01 | 0 | 0 | 0 | 0 | 0 | 0 | 0.01 |
| Total | 2.07 | 17.21 | 48.74 | 25.93 | 4.85 | 0.91 | 0.23 | 0.06 | 0 | 0 | 100 |
| HP 390 °C (FT) | |||||||||||
| Naph. | 0 | 0.1 | 0.89 | 1.73 | 1.5 | 0.78 | 0.29 | 0 | 0 | 0.02 | 5.31 |
| i-Par. | 0.46 | 6.96 | 16.19 | 15.27 | 10.32 | 6.02 | 3.02 | 1.05 | 1.03 | 0 | 60.32 |
| n-Par. | 1.21 | 8.65 | 12.43 | 6.96 | 2.97 | 1.1 | 0.35 | 0.4 | 0 | 0 | 34.06 |
| Cycl Ol. | 0 | 0 | 0 | 0 | 0 | 0 | 0 | 0 | 0 | 0 | 0.01 |
| Olef. | 0 | 0.01 | 0.01 | 0.01 | 0.01 | 0.01 | 0 | 0 | 0 | 0 | 0.05 |
| Arom. | 0 | 0 | 0 | 0.04 | 0.05 | 0.03 | 0 | 0 | 0.12 | 0 | 0.25 |
| Total | 1.67 | 15.71 | 29.51 | 24.03 | 14.85 | 7.94 | 3.66 | 1.45 | 1.15 | 0.02 | 100 |
| HP 350 °C (PW) | |||||||||||
| Naph. | 0 | 0.05 | 1.49 | 5.05 | 6.72 | 5.6 | 3.11 | 0.68 | 0 | 0.84 | 23.54 |
| i-Par. | 0.39 | 2.17 | 4.27 | 5.18 | 5.48 | 6.52 | 3.49 | 1.82 | 4 | 0 | 33.33 |
| n-Par. | 0.52 | 2.79 | 5.21 | 6.26 | 8.74 | 9.28 | 6.43 | 3.1 | 0 | 0 | 42.34 |
| Cycl Ol. | 0 | 0 | 0 | 0 | 0 | 0 | 0 | 0 | 0 | 0 | 0 |
| Olef. | 0 | 0 | 0.01 | 0.01 | 0 | 0 | 0.01 | 0.01 | 0 | 0 | 0.05 |
| Arom. | 0 | 0 | 0 | 0.05 | 0.11 | 0.05 | 0 | 0 | 0.54 | 0 | 0.75 |
| Total | 0.91 | 5.02 | 10.98 | 16.55 | 21.06 | 21.45 | 13.04 | 5.61 | 4.55 | 0.84 | 100 |
| HP 370 °C (PW) | |||||||||||
| Naph. | 0 | 0.08 | 1.54 | 4.32 | 5.38 | 4.29 | 2.15 | 0.63 | 0 | 0.6 | 18.98 |
| i-Par. | 0.58 | 3.81 | 7.18 | 7.19 | 6.95 | 7.23 | 4.39 | 1.73 | 2.67 | 0 | 41.73 |
| n-Par. | 0.95 | 5.3 | 7.72 | 6.56 | 6.89 | 6.06 | 3.47 | 1.69 | 0 | 0 | 38.65 |
| Cycl Ol. | 0 | 0 | 0 | 0 | 0 | 0 | 0 | 0 | 0 | 0 | 0 |
| Olef. | 0 | 0 | 0.01 | 0.01 | 0.01 | 0 | 0 | 0 | 0 | 0 | 0.04 |
| Arom. | 0 | 0 | 0 | 0.06 | 0.1 | 0.1 | 0 | 0 | 0.33 | 0 | 0.6 |
| Total | 1.53 | 9.19 | 16.44 | 18.14 | 19.34 | 17.68 | 10.01 | 4.06 | 3.01 | 0.6 | 100 |
| HP 390 °C (PW) | |||||||||||
| Naph. | 0 | 0.12 | 1.78 | 4.29 | 5.05 | 4.12 | 2.13 | 0.65 | 0 | 0.59 | 18.73 |
| i-Par. | 0.58 | 4.85 | 9.42 | 8.14 | 7.6 | 7.72 | 5.3 | 2.48 | 2.86 | 0 | 48.95 |
| n-Par. | 1.06 | 6.73 | 8.54 | 5.47 | 4.41 | 3.07 | 1.44 | 0.78 | 0 | 0 | 31.51 |
| Cycl Ol. | 0 | 0 | 0 | 0 | 0 | 0 | 0 | 0 | 0 | 0 | 0 |
| Olef. | 0 | 0 | 0 | 0 | 0 | 0 | 0 | 0 | 0 | 0 | 0 |
| Arom. | 0 | 0 | 0 | 0.08 | 0.14 | 0.17 | 0.08 | 0 | 0.34 | 0 | 0.81 |
| Total | 1.63 | 11.7 | 19.75 | 17.98 | 17.21 | 15.08 | 8.94 | 3.91 | 3.2 | 0.59 | 100 |
| Hyd. 1 | |||||||||||
| Naph. | 0 | 0.05 | 1.15 | 4.06 | 5.65 | 5.6 | 3.97 | 0.86 | 0 | 1.06 | 22.41 |
| i-Par. | 0 | 0 | 0.17 | 0.53 | 1.52 | 3.81 | 1.11 | 1.36 | 5.07 | 0 | 13.56 |
| n-Par. | 0 | 0.06 | 1.32 | 4.57 | 10.33 | 13.96 | 12.82 | 5.87 | 0 | 0 | 48.92 |
| Cycl Ol. | 0 | 0 | 0.07 | 0.6 | 1.11 | 0.92 | 0.4 | 0.08 | 0 | 0 | 3.18 |
| Olef. | 0 | 0 | 0.1 | 0.23 | 0.37 | 0.94 | 0.34 | 0.11 | 0 | 0 | 2.09 |
| Arom. | 0 | 0 | 0 | 1.89 | 3.24 | 3.03 | 0.86 | 0 | 0.81 | 0 | 9.84 |
| Total | 0 | 0.11 | 2.81 | 11.88 | 22.21 | 28.25 | 19.51 | 8.29 | 5.88 | 1.06 | 100 |
| Hyd. 2 | |||||||||||
| Naph. | 0 | 0.06 | 1.95 | 5.74 | 7.98 | 7.01 | 4.36 | 0.84 | 0 | 0.89 | 28.84 |
| i-Par. | 0 | 0.01 | 0.24 | 0.75 | 1.93 | 4.87 | 1.08 | 1.2 | 3.97 | 0 | 14.07 |
| n-Par. | 0 | 0.09 | 1.5 | 4.99 | 11.26 | 13.86 | 11.04 | 4.6 | 0 | 0 | 47.33 |
| Cycl Ol. | 0 | 0 | 0 | 0 | 0 | 0 | 0 | 0.02 | 0 | 0 | 0.02 |
| Olef. | 0 | 0 | 0 | 0 | 0 | 0.01 | 0 | 0.02 | 0 | 0 | 0.03 |
| Arom. | 0 | 0 | 0.5 | 2.07 | 3.45 | 2.41 | 0.57 | 0 | 0.7 | 0 | 9.71 |
| Total | 0 | 0.16 | 4.19 | 13.55 | 24.63 | 28.17 | 17.05 | 6.69 | 4.68 | 0.89 | 100 |
| Educt | |||||||||||
| Naph. | 0 | 0.01 | 0.2 | 0.87 | 1.09 | 1.41 | 0.56 | 0 | 0 | 2.65 | 6.79 |
| i-Par. | 0 | 0 | 0.05 | 0.05 | 0.64 | 0.33 | 0.15 | 0.49 | 4.67 | 0 | 6.37 |
| n-Par. | 0.07 | 0.11 | 0.23 | 1.37 | 2.83 | 3.02 | 2.06 | 1.1 | 0 | 0 | 10.78 |
| Cycl Ol. | 0 | 0.06 | 1.27 | 3.25 | 3.84 | 3.15 | 1.36 | 0.56 | 0 | 0 | 13.49 |
| Olef. | 0.04 | 0.27 | 1.95 | 4.88 | 9.85 | 16.21 | 10.05 | 3.68 | 0 | 0 | 46.93 |
| Arom. | 0 | 0 | 0.77 | 3.06 | 7.25 | 2.91 | 0.68 | 0 | 0.96 | 0 | 15.64 |
| Total | 0.11 | 0.45 | 4.47 | 13.47 | 25.49 | 27.02 | 14.88 | 5.83 | 5.63 | 2.65 | 100 |
Appendix C
| Viscosity FTLube (mm2/s) | Viscosity PWLube (mm2/s) | |||||
|---|---|---|---|---|---|---|
| 20 °C | 40 °C | 100 °C | 20 °C | 40 °C | 100 °C | |
| HP 350 °C | - | 23.34 | 5.62 | 111.20 | 18.08 | 4.61 |
| HP 370 °C | 49.05 | 22.93 | 5.17 | 40.11 | 18.80 | 4.55 |
| HP 390 °C | 32.41 | 15.20 | 3.60 | 21.36 | 12.54 | 3.30 |
References
- Dahmen, N.; Dinjus, E.; Kolb, T.; Arnold, U.; Leibold, H.; Stahl, R. State of the art of the bioliq® process for synthetic biofuels production. Environ. Prog. Sustain. Energy 2012, 31, 176–181. [Google Scholar] [CrossRef]
- Müller, S.; Groß, P.; Rauch, R.; Zweiler, R.; Aichernig, C.; Fuchs, M.; Hofbauer, H. Production of diesel from biomass and wind power—Energy storage by the use of the Fischer-Tropsch process. Biomass Convers. Biorefin. 2018, 8, 275–282. [Google Scholar] [CrossRef]
- Royal Dutch Shell plc. Risella X High-Quality Technical White Oils Based on Gas to Liquids (GTL) Technology. Available online: https://go.shell.com/2RnueBW (accessed on 4 May 2021).
- Statista. Benzinpreis. Zusammensetzung im März 2022. Available online: https://de.statista.com/statistik/daten/studie/29999/umfrage/zusammensetzung-des-benzinpreises-aus-steuern-und-kosten/ (accessed on 21 April 2022).
- Ritchie, H.; Roser, M. Plastic Pollution. 2018. Available online: https://ourworldindata.org/plastic-pollution (accessed on 17 May 2022).
- Hauli, L.; Wijaya, K.; Syoufian, A. Hydrocracking of LDPE Plastic Waste into Liquid Fuel over Sulfated Zirconia from a Commercial Zirconia Nanopowder. Orient. J. Chem. 2019, 35, 128–133. [Google Scholar] [CrossRef]
- Kunwar, B.; Cheng, H.N.; Chandrashekaran, S.R.; Sharma, B.K. Plastics to fuel. A review. Renew. Sustain. Energy Rev. 2016, 54, 421–428. [Google Scholar] [CrossRef]
- Choi, I.-H.; Lee, H.-J.; Rhim, G.-B.; Chun, D.-H.; Lee, K.-H.; Hwang, K.-R. Catalytic hydrocracking of heavy wax from pyrolysis of plastic wastes using Pd/Hβ for naphtha-ranged hydrocarbon production. J. Anal. Appl. Pyrolysis 2022, 161, 105424. [Google Scholar] [CrossRef]
- Miller, S.J.; Chevron U.S.A. Inc. Process for Converting Waste Plastic into Lubricating Oils. U.S. Patent 6,822,126 B2, 23 November 2004. Available online: https://patents.google.com/patent/US6822126B2/en (accessed on 5 July 2022).
- Miller, S.J.; Shah, N.; Huffman, G.P. Conversion of Waste Plastic to Lubricating Base Oil. Energy Fuels 2005, 19, 1580–1586. [Google Scholar] [CrossRef]
- Kusenberg, M.; Eschenbacher, A.; Djokic, M.R.; Zayoud, A.; Ragaert, K.; Meester, S.; de van Geem, K.M. Opportunities and challenges for the application of post-consumer plastic waste pyrolysis oils as steam cracker feedstocks. To decontaminate or not to decontaminate? Waste Manag. 2022, 138, 83–115. [Google Scholar] [CrossRef]
- Galperin, L.N. Hydroisomerization of N-decane in the presence of sulfur and nitrogen compounds. Appl. Catal. A Gen. 2001, 209, 257–268. [Google Scholar] [CrossRef]
- Kobayashi, M.; Ishida, K.; Saito, M.; Yachi, H.; Japan Energy Corporation. Lubricant Base Oil Method of Producing the Same. U.S. Patent 8.012,342 B2, 6 September 2011. Available online: https://bit.ly/3phwTtk (accessed on 5 July 2022).
- Kobayashi, M.; Saitoh, M.; Togawa, S.; Ishida, K. Branching Structure of Diesel and Lubricant Base Oils Prepared by Isomerization/Hydrocracking of Fischer−Tropsch Waxes and α-Olefins. Energy Fuels 2009, 23, 513–518. [Google Scholar] [CrossRef]
- Karaba, A.; Rozhon, J.; Patera, J.; Hájek, J.; Zámostný, P. Fischer-Tropsch Wax from Renewable Resources as an Excellent Feedstock for the Steam-Cracking Process. Chem. Eng. Technol. 2021, 44, 329–338. [Google Scholar] [CrossRef]
- Wang, F.; Xu, Y.; Ren, J.; Li, Y. Experimental investigation and modeling of steam cracking of Fischer–Tropsch naphtha for light olefins. Chem. Eng. Process. Process Intensif. 2010, 49, 51–58. [Google Scholar] [CrossRef]
- Hsu, C.S.; Robinson, P.R. Petroleum Science and Technology; Springer Nature: Cham, Switzerland, 2019; ISBN 978-3-030-16275-7. [Google Scholar] [CrossRef]
- Passut, C.; Barton, P.; Klaus, E.; Tewksbury, E. Low-Temperature Ketone Dewaxing of Mineral Oils by Direct Cooling. Ind. Eng. Chem. Res. 1977, 16, 120–124. [Google Scholar] [CrossRef]
- Taylor, R.J.; McCormack, A.J. Study of solvent and catalytic lube oil dewaxing by analysis of feedstocks and products. Ind. Eng. Chem. Res. 1992, 31, 1731–1738. [Google Scholar] [CrossRef]
- Cody, I.A. Selective Hydroprocessing for new lubricant standards. In Practical Advances in Petroleum Processing; Hsu, C.S., Robinson, P.R., Eds.; Springer: New York, NY, USA, 2006. [Google Scholar] [CrossRef]
- Bouchy, C.; Hastoy, G.; Guillon, E.; Martens, J.A. Fischer-Tropsch Waxes Upgrading via Hydrocracking and Selective Hydroisomerization. Oil Gas Sci. Technol. Rev. L’ifp 2009, 64, 91–112. [Google Scholar] [CrossRef] [Green Version]
- Pichler, H.; Schulz, H.; Reitemeyer, H.O.; Weitkamp, J. Über das Hydrokracken gesättigter Kohlenwasserstoffe. Erdöl Und Kohle Erdgas Petrochem. Ver. Mit Brennst. Chem. 1972, 25, 494–505. [Google Scholar]
- Tulloch, A.P. The composition of beeswax and other waxes secreted by insects. Lipids 1970, 5, 247–258. [Google Scholar] [CrossRef]
- Nuissier, G.; Bourgeois, P.; Grignon-Dubois, M.; Pardon, P.; Lescure, M.H. Composition of sugarcane waxes in rum factory wastes. Phytochemistry 2002, 61, 721–726. [Google Scholar] [CrossRef]
- de Klerk, A. Catalysis in the Refining of Fischer-Tropsch Syncrude; RSC Publishing: Cambridge, UK, 2010; ISBN 978-8-84973-080-8. [Google Scholar]
- Zeller, M.; Netsch, N.; Richter, F.; Leibold, H.; Stapf, D. Chemical Recycling of Mixed Plastic Wastes by Pyrolysis—Pilot Scale Investigations. Chem. Ing. Tech. 2021, 93, 1763–1770. [Google Scholar] [CrossRef]
- Neuner, P.; Graf, D.; Mild, H.; Rauch, R. Catalytic Hydroisomerisation of Fischer–Tropsch Waxes to Lubricating Oil and Investigation of the Correlation between Its Physical Properties and the Chemical Composition of the Corresponding Fuel Fractions. Energies 2021, 14, 4202. [Google Scholar] [CrossRef]
- Deldari, H. Suitable catalysts for hydroisomerization of long-chain normal paraffins. Appl. Catal. A Gen. 2005, 293, 1–10. [Google Scholar] [CrossRef]
- Lee, S.-W.; Ihm, S.-K. Hydroisomerization and hydrocracking over platinum loaded ZSM-23 catalysts in the presence of sulfur and nitrogen compounds for the dewaxing of diesel fuel. Fuel 2014, 134, 237–243. [Google Scholar] [CrossRef]
- Brunet, S.; Mey, D.; Pérot, G.; Bouchy, C.; Diehl, F. On the hydrodesulfurization of FCC gasoline. A review. Appl. Catal. A Gen. 2005, 278, 143–172. [Google Scholar] [CrossRef]
- Mochida, I.; Choi, K.-H. An Overview of Hydrodesulfurization and Hydrogenation. J. Jpn. Pet. Inst. 2004, 47, 145–163. [Google Scholar] [CrossRef] [Green Version]
- ASTM D2500-17a; Test Method for Cloud Point of Petroleum Products and Liquid Fuels. ASTM International: West Conshohocken, PA, USA, 2018. [CrossRef]
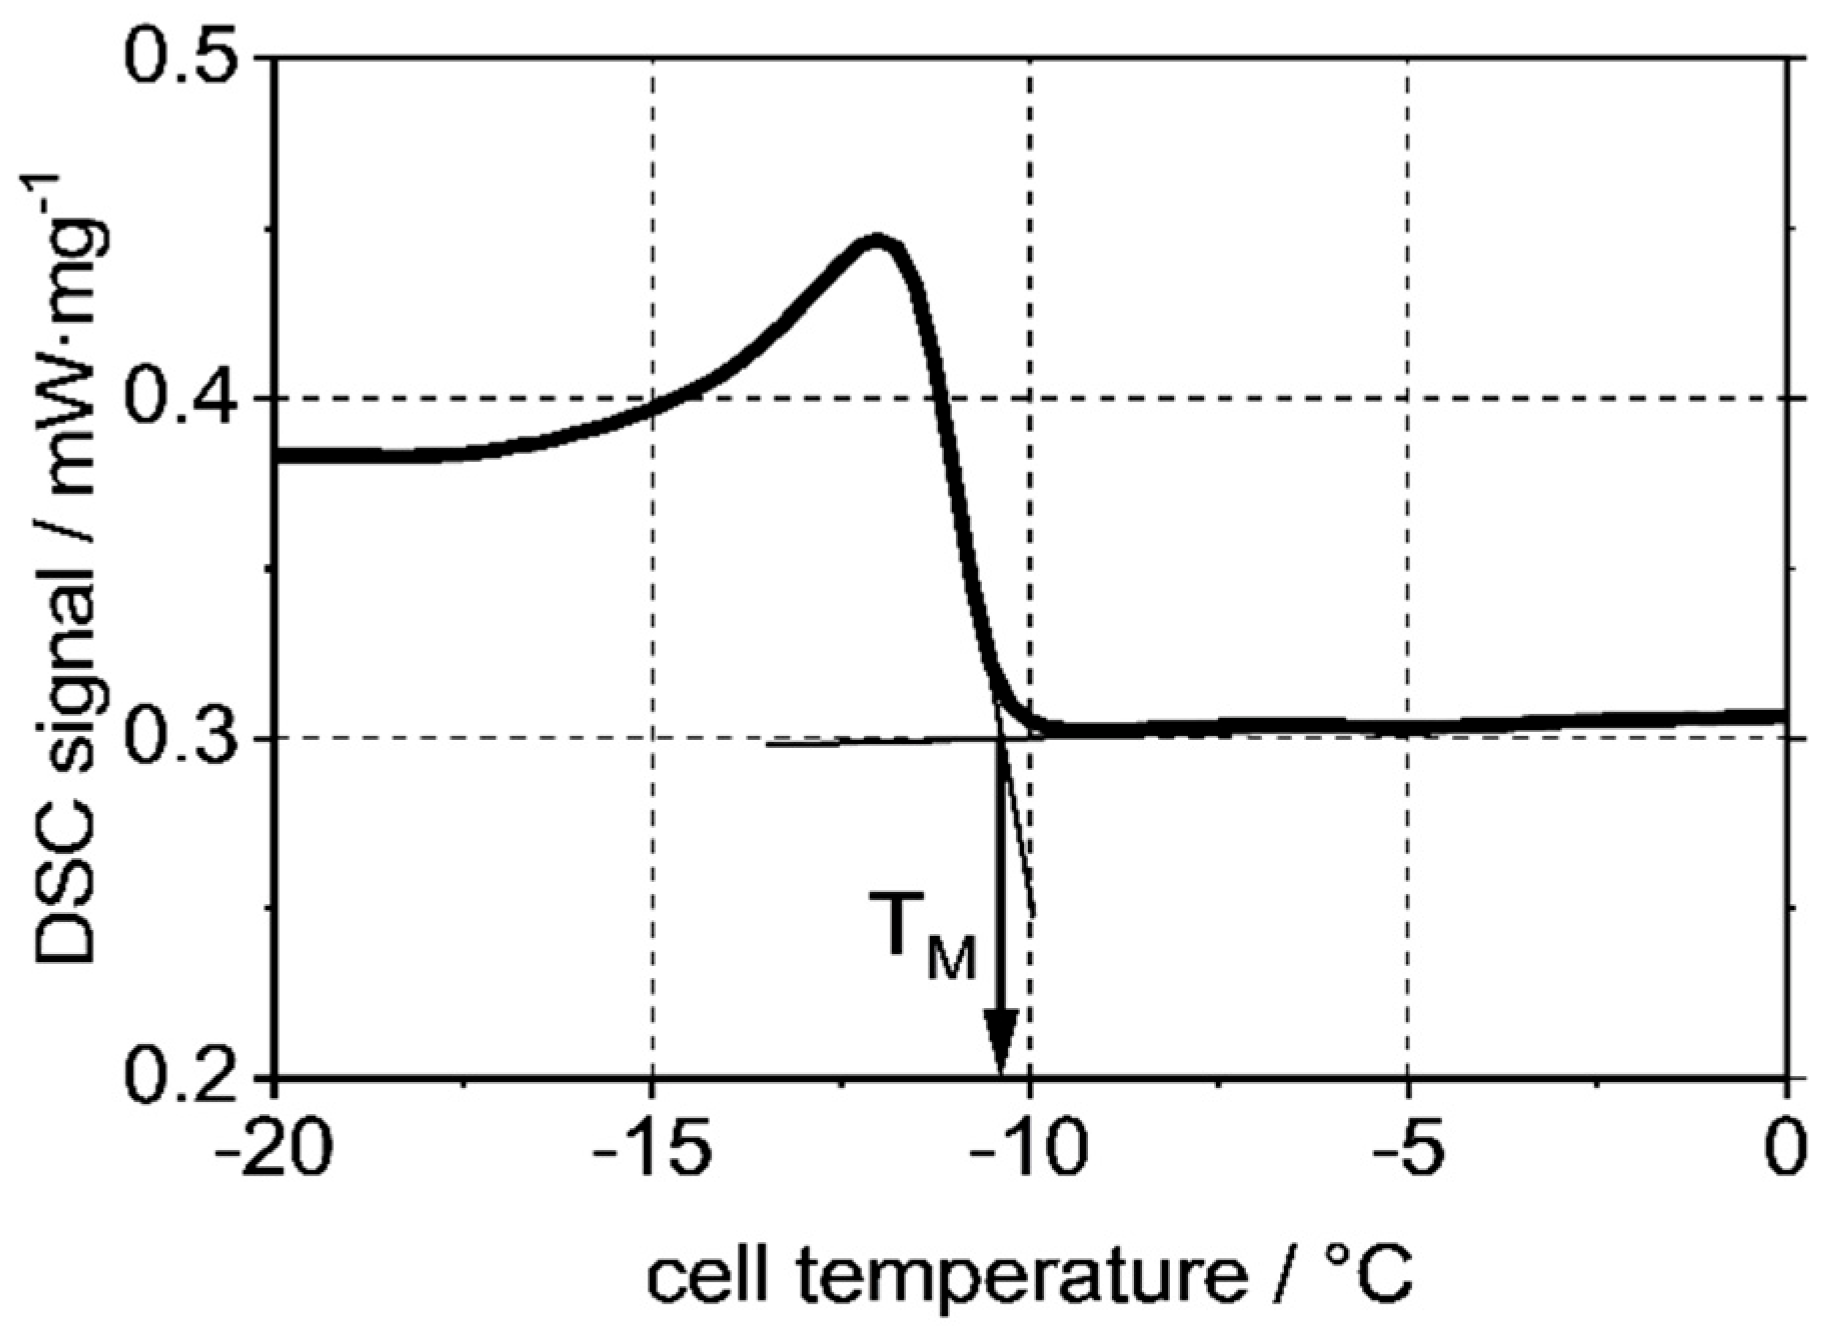
- Claudy, P.; Letoffe, J.-M.; Neff, B.; Damin, B. Diesel fuels: Determination of onset crystallization temperature, pour point and filter plugging point by differential scanning calorimetry. Correlation with standard test methods. Fuel 1986, 65, 861–864. [Google Scholar] [CrossRef]
- Europäisches Arzneibuch. Amtliche Deutsche Ausgabe; Deutscher Apotheker Verlag: Stuttgart, Germany, 2017; ISBN 9783769266412. [Google Scholar]
- ASTM D2502-14; Test Method for Estimation of Mean Relative Molecular Mass of Petroleum Oils from Viscosity Measurements. ASTM International: West Conshohocken, PA, USA, 2020. [CrossRef]
- Bruycker, R.; de Amghizar, I.; Vermeire, F.H.; Nyman, T.; Hakola, M.; van Geem, K.M. Steam cracking of bio-derived normal and branched alkanes. Influence of branching on product distribution and formation of aromatics. J. Anal. Appl. Pyrolysis 2016, 122, 468–478. [Google Scholar] [CrossRef]
- Kopinke, F.D.; Zimmermann, G.; Reyniers, G.C.; Froment, G.F. Relative rates of coke formation from hydrocarbons in steam cracking of naphtha. 2. Paraffins, naphthenes, mono-, di-, and cycloolefins, and acetylenes. Ind. Eng. Chem. Res. 1993, 32, 56–61. [Google Scholar] [CrossRef]
- Kusenberg, M.; Roosen, M.; Zayoud, A.; Djokic, M.R.; Dao Thi, H.; Meester, S.; de Ragaert, K.; Kresovic, U.; van Geem, K.M. Assessing the feasibility of chemical recycling via steam cracking of untreated plastic waste pyrolysis oils. Feedstock impurities, product yields and coke formation. Waste Manag. 2022, 141, 104–114. [Google Scholar] [CrossRef]
- Mylpg.eu. LPG Propane/Butane Mixture. Available online: https://www.mylpg.eu/de/nutzliche-info/autogasgemisch/ (accessed on 21 April 2022).
- Bender, M. An Overview of Industrial Processes for the Production of Olefins—C 4 Hydrocarbons. ChemBioEng Rev. 2014, 1, 136–147. [Google Scholar] [CrossRef]


| Catalyst | Metal Loading (wt%) | Catalyst Mass (g) | Catalyst Volume (mL) |
|---|---|---|---|
| Pt/SAPO-11 | 0.3 wt% | 20.005 | 22.10 |
| CoMo/Al2O3 | 15.5 wt% | 39.570 | 48.77 |
| CP (ASTM D 2500) | CP (DSC) | |
|---|---|---|
| Sample 1 | +7.7 ± 0.6 °C | +8.29 °C |
| Sample 2 | −21.0 ± 2 °C | −19.09 °C |
| T (°C) | P (Bar) | (mL/min) | (mL/min) | (mL/min) | Applied Feeds | |
|---|---|---|---|---|---|---|
| Hyd. 1 | 280 | 100 | 0.56 | 1100 | 10 | PW |
| Hyd. 2 | 360 | 130 | 1.12 | 1100 | 10 | PW |
| HP 350 °C | 350 | 100 | 0.42 | 825 | 15 | FTW/PW |
| HP 370 °C | 370 | 100 | 0.42 | 825 | 15 | FTW/PW |
| HP 390 °C | 390 | 100 | 0.42 | 825 | 15 | FTW/PW |
| Educt (mg/kg) | Hyd. 1 (mg/kg) | Hyd. 2 (mg/kg) | |
|---|---|---|---|
| Sulfur concentration | 726 ± 13 | 270 ± 6 | <30 |
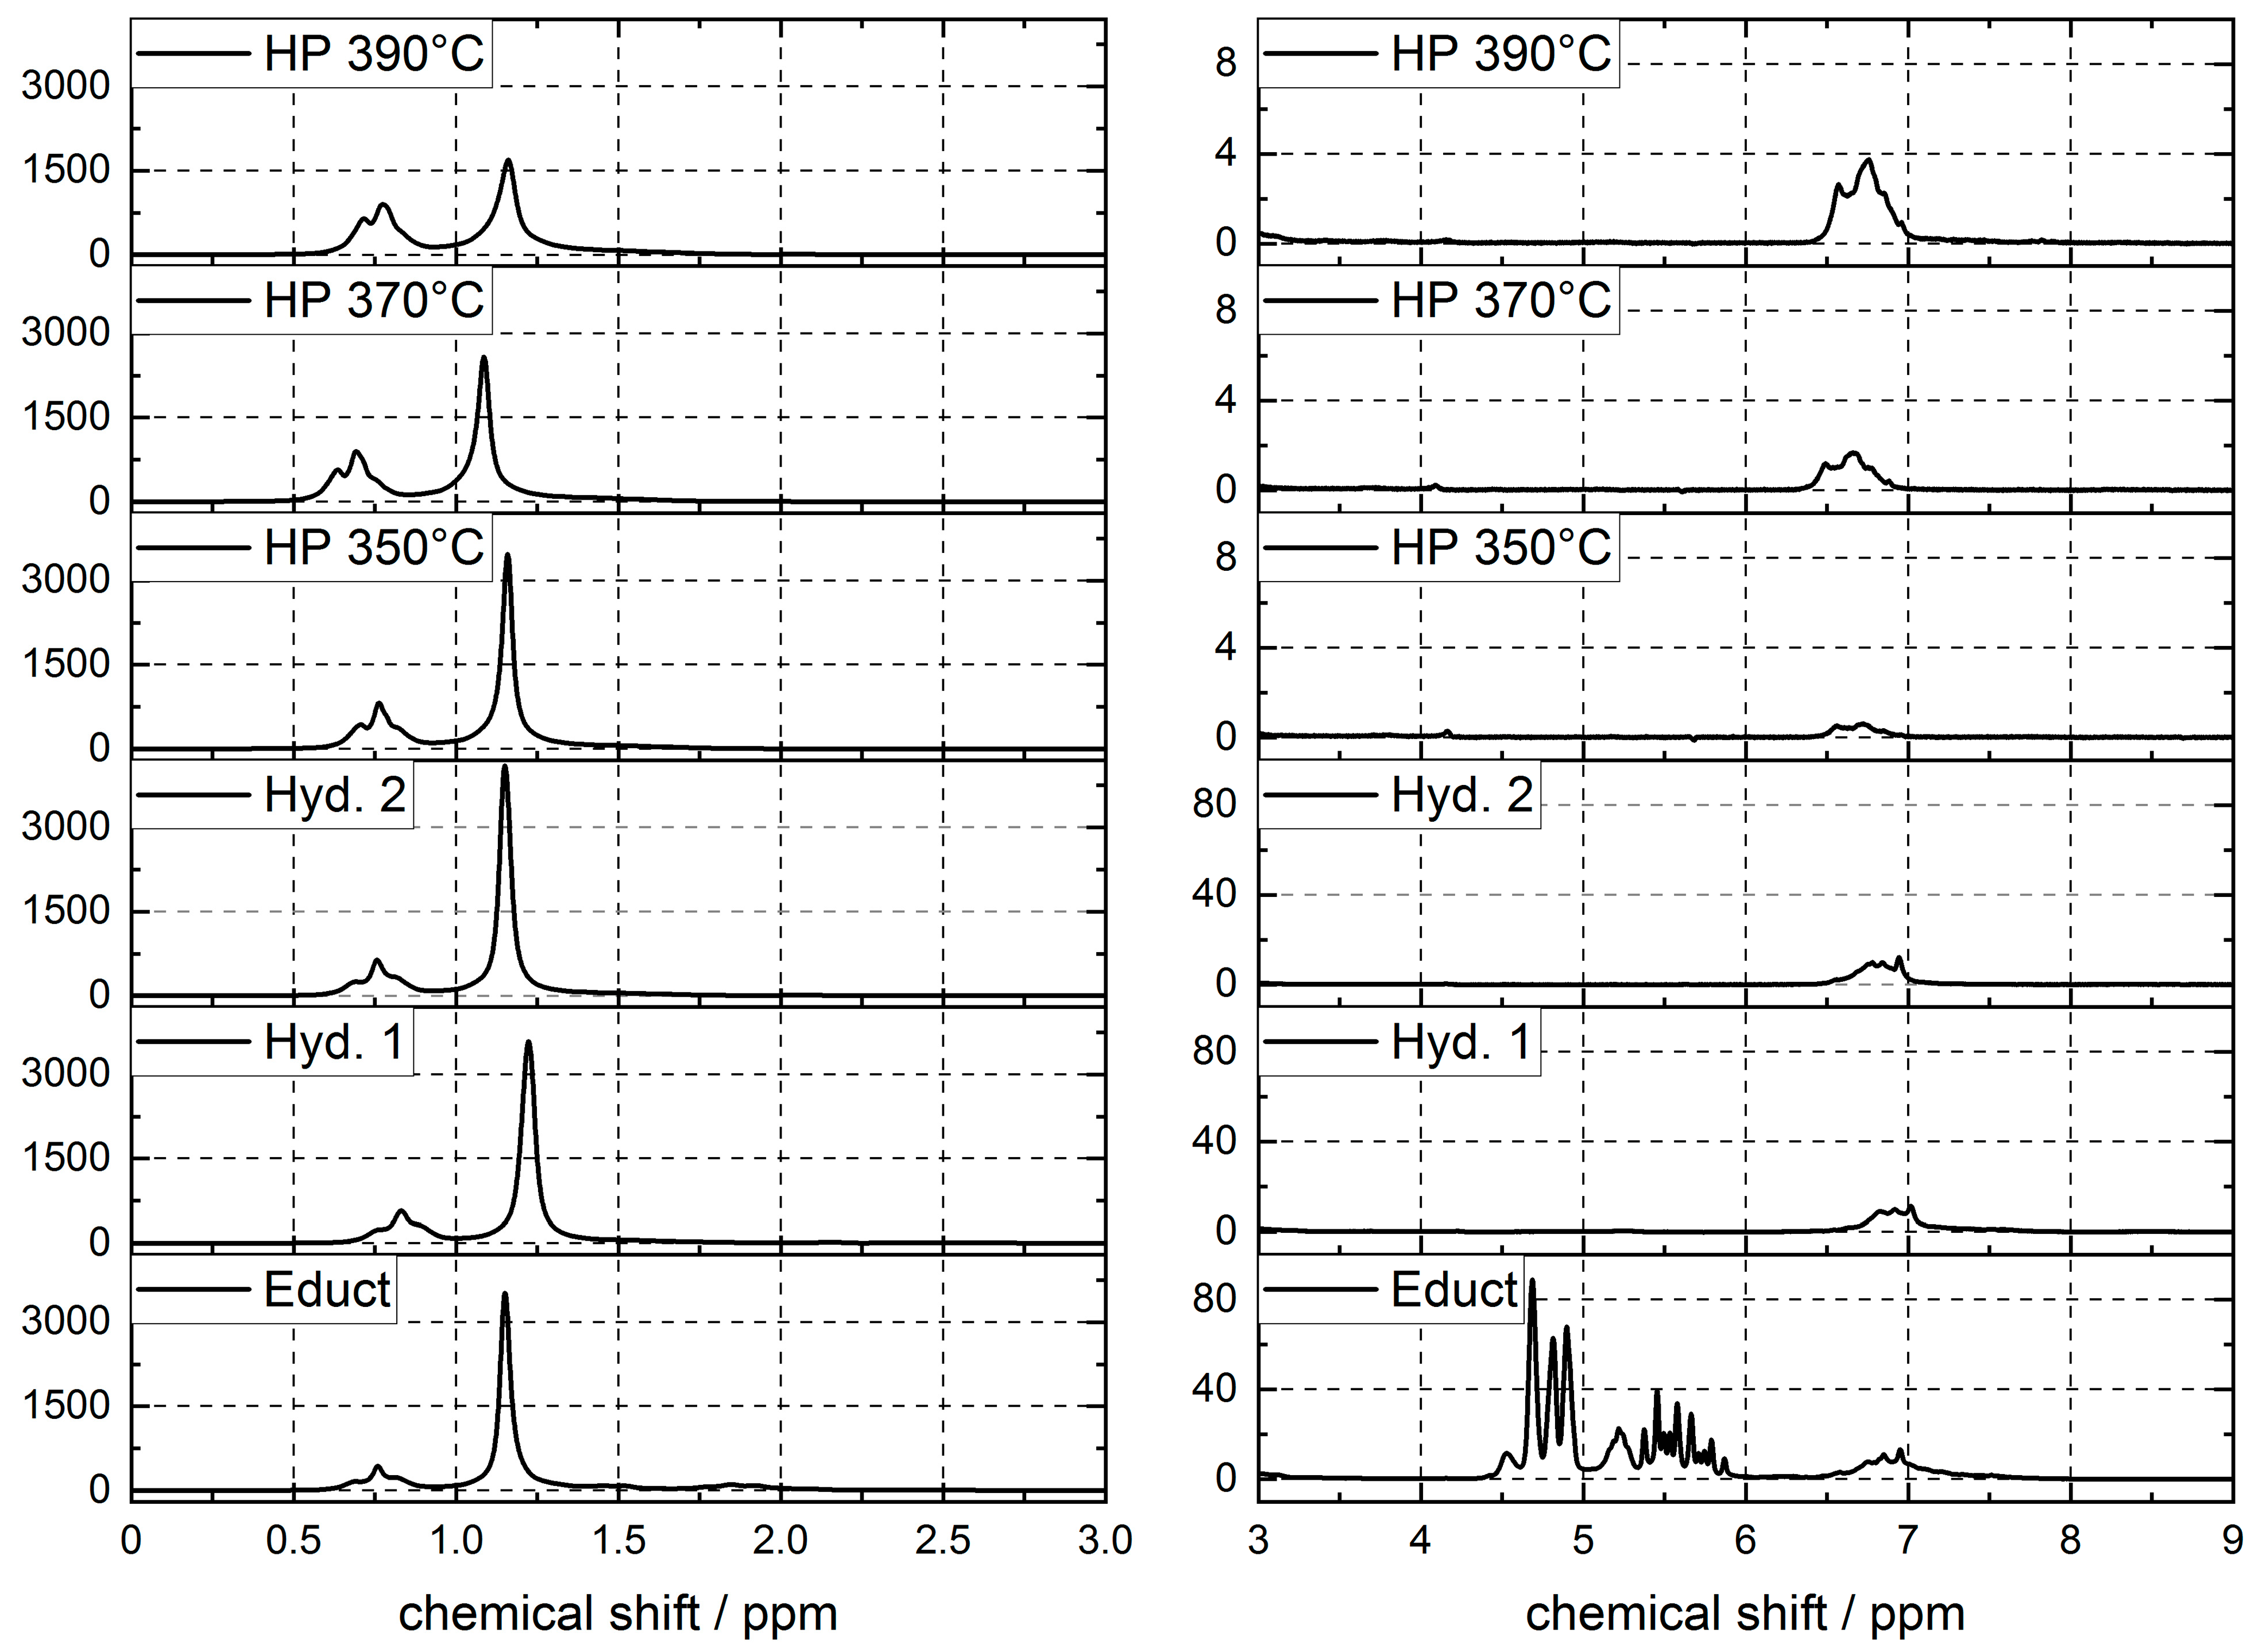
| Olefins | Aromatics | Aliphatic Comp. | CH3 | CH2 | CH | Other | |
|---|---|---|---|---|---|---|---|
| 4.5–6.3 ppm | 6.3–8.7 ppm | 0.5–2.8 ppm | 0.5–1.2 ppm | 1.2–1.5 ppm | 1.5–2.0 ppm | 2.0–2.8 ppm | |
| Educt | 7.1 | 1.5 | 91.1 | 15.7 | 61.6 | 5.1 | 8.7 |
| Hyd. 1 | 0.1 | 1.2 | 98.3 | 21.9 | 70.7 | 4.3 | 1.4 |
| Hyd. 2 | 0.0 | 0.9 | 98.8 | 22.2 | 70.9 | 4.4 | 1.4 |
| HP 350 °C | 0.0 | 0.0 | 99.9 | 28.9 | 66.6 | 4.0 | 0.3 |
| HP 370 °C | 0.0 | 0.1 | 99.8 | 33.3 | 61.3 | 4.6 | 0.6 |
| HP 390 °C | 0.0 | 0.3 | 99.6 | 37.1 | 56.1 | 5.3 | 1.1 |
| PW | FT | |||||
|---|---|---|---|---|---|---|
| HP 350 °C | HP 370 °C | HP 390 °C | HP 350 °C | HP 370 °C | HP 390 °C | |
| (wt%) | (wt%) | (wt%) | (wt%) | (wt%) | (wt%) | |
| Methane | 0.42 | 0.50 | 0.58 | 0.47 | 0.53 | 0.60 |
| Ethane | 0.00 | 0.18 | 0.47 | 0.00 | 0.14 | 0.33 |
| Propane | 1.65 | 4.94 | 7.95 | 1.85 | 3.99 | 5.69 |
| Butanes | 2.41 | 6.15 | 8.80 | 2.84 | 5.49 | 5.83 |
| n | 1.32 | 3.52 | 4.98 | 1.48 | 3.07 | 3.16 |
| 2-M-Propane | 1.09 | 2.63 | 3.82 | 1.35 | 2.42 | 2.67 |
| Pentanes | 1.46 | 3.12 | 3.69 | 1.73 | 2.90 | 2.30 |
| n | 0.68 | 1.49 | 1.69 | 0.74 | 1.29 | 0.97 |
| 2-M-Butane | 0.78 | 1.63 | 2.00 | 0.99 | 1.61 | 1.33 |
| Hexanes | 0.64 | 0.99 | 0.85 | 0.81 | 1.03 | 0.71 |
| n | 0.30 | 0.41 | 0.30 | 0.35 | 0.42 | 0.25 |
| 2-M-Pentane | 0.23 | 0.39 | 0.36 | 0.31 | 0.40 | 0.28 |
| 3-M-Pentane | 0.11 | 0.18 | 0.18 | 0.14 | 0.21 | 0.17 |
| Heptanes | 0.15 | 0.19 | 0.09 | 0.24 | 0.14 | 0.16 |
| n | 0.11 | 0.07 | 0.02 | 0.13 | 0.08 | 0.08 |
| 2-M-Hexane | 0.01 | 0.04 | 0.02 | 0.01 | 0.01 | 0.01 |
| 3-M-Hexane | 0.04 | 0.08 | 0.04 | 0.10 | 0.05 | 0.06 |
| TotalGas | 6.73 | 16.07 | 22.43 | 7.93 | 14.22 | 15.61 |
| TotalLiquid | 92.35 | 83.79 | 75.10 | 92.96 | 87.12 | 83.31 |
| Total | 99.07 | 99.85 | 97.53 | 100.89 | 101.35 | 98.91 |
Publisher’s Note: MDPI stays neutral with regard to jurisdictional claims in published maps and institutional affiliations. |
© 2022 by the authors. Licensee MDPI, Basel, Switzerland. This article is an open access article distributed under the terms and conditions of the Creative Commons Attribution (CC BY) license (https://creativecommons.org/licenses/by/4.0/).
Share and Cite
Neuner, P.; Graf, D.; Netsch, N.; Zeller, M.; Herrmann, T.-C.; Stapf, D.; Rauch, R. Chemical Conversion of Fischer–Tropsch Waxes and Plastic Waste Pyrolysis Condensate to Lubricating Oil and Potential Steam Cracker Feedstocks. Reactions 2022, 3, 352-373. https://doi.org/10.3390/reactions3030026
Neuner P, Graf D, Netsch N, Zeller M, Herrmann T-C, Stapf D, Rauch R. Chemical Conversion of Fischer–Tropsch Waxes and Plastic Waste Pyrolysis Condensate to Lubricating Oil and Potential Steam Cracker Feedstocks. Reactions. 2022; 3(3):352-373. https://doi.org/10.3390/reactions3030026
Chicago/Turabian StyleNeuner, Philipp, David Graf, Niklas Netsch, Michael Zeller, Tom-Carlo Herrmann, Dieter Stapf, and Reinhard Rauch. 2022. "Chemical Conversion of Fischer–Tropsch Waxes and Plastic Waste Pyrolysis Condensate to Lubricating Oil and Potential Steam Cracker Feedstocks" Reactions 3, no. 3: 352-373. https://doi.org/10.3390/reactions3030026