1. Introduction
In recent years, the issue of sustainable water resource management has taken a leading role worldwide because of several concomitant factors, including climate change and population growth, which significantly reduce water availability [
1]. In addition, the population sensitivity lack about the issue of water saving and structural and management lacks, characterizing the water supply networks in some cases, are source of unnecessary squandering that cause environmental, economic-financial and ethical-social impacts [
1,
2]. In this scenario, real-time monitoring systems of water consumption can represent the real opportunity for Water Utilities to optimise the management of their water networks, and for users to become more sensitive to the issue of water saving [
3,
4,
5,
6,
7,
8]. At the same time, systems for the recovery and reuse of rain and grey water inside buildings are also intended as technologies that aim to limit the use of drinking water, while ensuring greater environmental sustainability [
9].
In this context, “the Green-Smart Technology project for the sustainable use of water resources in buildings and urban areas (GST4Water)” is placed. This project is funded by the European Community, through the financial support of the Emilia Romagna Region (POR-FESR 2014–2020). Its general goal is to develop hardware and software solutions that allow a conscious use of water resources at the individual user level and the reuse of rainwater and grey water inside buildings. More specifically, the project features four work packages (WPs). The WP1 is related to the development of a real time monitoring system that records consumption data, both at the user’s connection to the distribution network and at the single sanitary appliance level, and transfers the collected data to a cloud platform. The WP2 is related to the creation of a processing system of data coming from the monitoring system (developed within the WP1), in order to transfer the information to the Water Utility and to the users. The WP3 is related to the creation of a suite of software tools that aim to promote the reduction of water consumption from drinking water sources through the design of tanks for the recovery of rainwater and grey water and its reuse for non-drinking purposes. In addition, the WP3 aims to optimize the management of rainwater also through green technologies that can increase urban resilience against extreme rain events. Finally, the WP4 is related to the creation of a further suite of software tools able to provide an assessment of the economic and environmental sustainability of the solutions developed in the other WPs, through indicators based on Urban Metabolism and Life Cycle Assessment techniques.
In the following sections, the real-time monitoring and processing system for water consumption is shown, the obtained results from the field laboratory at Gorino Ferrarese (FE) are discussed and some final considerations are provided. The results of the studies on WP3 and WP4 are reported in Cipolla et al., (2018) and Di Fusco et al., (2018) [
10,
11], respectively.
2. The Monitoring and Processing System
The term “smart metering” is now widely used in the technical literature and in the utility sectors to define those systems that allow the remote reading of electricity, gas and water meters, and therefore the real-time monitoring of consumptions. The benefits of these systems are considerable and vary according to the adopted architecture. In general, these systems involve the use of smart meters able to make consumption data available remotely through the presence of an integrated communication unit inside them. In the Water Utility context, data sent by these smart meters are typically collected through expensive architectures made up of instruments supplied by the same manufacturers producing the water consumption meters. However, innovative Open Source technologies can help to reduce the costs of smart metering devices and system as a whole. As a result of using these technologies, an Automatic Meter Reading (AMR) system has been developed within the context of the first two WPs of the GST4Water project.
Figure 1 shows the entire architecture that is divided into two main components: the monitoring system and the processing system. The former receives consumption data sent by the smart meters and sends them to a cloud platform. The latter processes the consumption data received in order to return real-time useful information to the users and to the Water Utility. The following is a brief description of each of these two components.
2.1. The Monitoring System
The monitoring system involves the installation, for each user, of a small data collector able to collect consumption data sent by meter devices through the Open Meter Standard (OMS) Wireless M-Bus protocol. This radio protocol, implemented in most smart meters, is designed specifically for metering and can operate at the 169 and 868 MHz ISM (Industrial, Scientific and Medical) frequencies. Being an open communication protocol, it allows for the reception of consumption data from any meter device implementing it, regardless of the manufacturer.
Hardware components, easily available at market level, were used for the creation of the data collector, namely Single Board Computers (SBCs). In general, SBCs are devices with reduced size and energy consumption, but with a processing capacity comparable to a Personal Computer, specifically designed to facilitate the integration of additional radio modules. Therefore, the SBCs used were integrated with wireless M-Bus radio modules to receive data from smart meters and with Wi-Fi/3G/4G modules to transmit data to the cloud platform.
Furthermore, Open Source technologies were used for the creation of the software component of the data collector. In general, these technologies have many advantages such as a reduction in the costs of the data collector or of the entire system and also a greater reliability guaranteed by the support that a large community of developers, able to quickly update and improve the software, can give. Moreover, they are highly adaptable given that the source codes are available and free and therefore each program can be modified according to any necessity.
2.2. The Processing System
A Cloud Computing infrastructure was adopted for developing a system for managing and processing water consumption data. This infrastructure allows for storing, managing and processing data, thanks to the hardware and software resources that can be physically distributed throughout the world and remotely used through Internet. More specifically, the services provided by Amazon Web Service (AWS) and the Rilheva system developed by Xeo4 (a partner of the project) were adopted for the creation of the processing system. The latter is able to receive water consumption data transmitted by the monitoring system and to validate and archive it in a database within the cloud platform. Finally, it processes consumption data through appropriate algorithms that extract useful information for the users and Water Utility. With reference to the users, the cloud platform calculates the water volume consumed by the user in the last 24 h and the time series of water discharges at a given time step (e.g., one hour). All the information is updated every time the smart meters send new measured data. In addition, the leak level inside the user’s residence is determined from the analysis of the time series of water discharge. This information, updated daily, is processed considering the typical consumption trend of residential users. This trend is usually characterized by high consumptions during the daytime hours and low consumption during the night hours. In particular, during the night hours user water demands are often equal to zero. Thus, if the hourly discharge values during the hours of minimum consumption are always different from 0, the cloud platform generates an alarm signal to notify the probable presence of a water leak. With reference to the Water Utility, the cloud platform calculates a water balance by comparing the time series of the discharge entering the DMA with the sum of the time series of the consumptions of all the users located in the district. The information concerning the leakages at user and district level together with the consumption data are sent to the Rilheva system, which is the graphic interface for the return of data to users and to the Water Utility. Consequently, users and Water Utility can view the information from their devices (PCs, tablets and smartphones) simply connecting to Internet. Finally, the Water Utility may use these data for billing purposes.
3. The Case Study
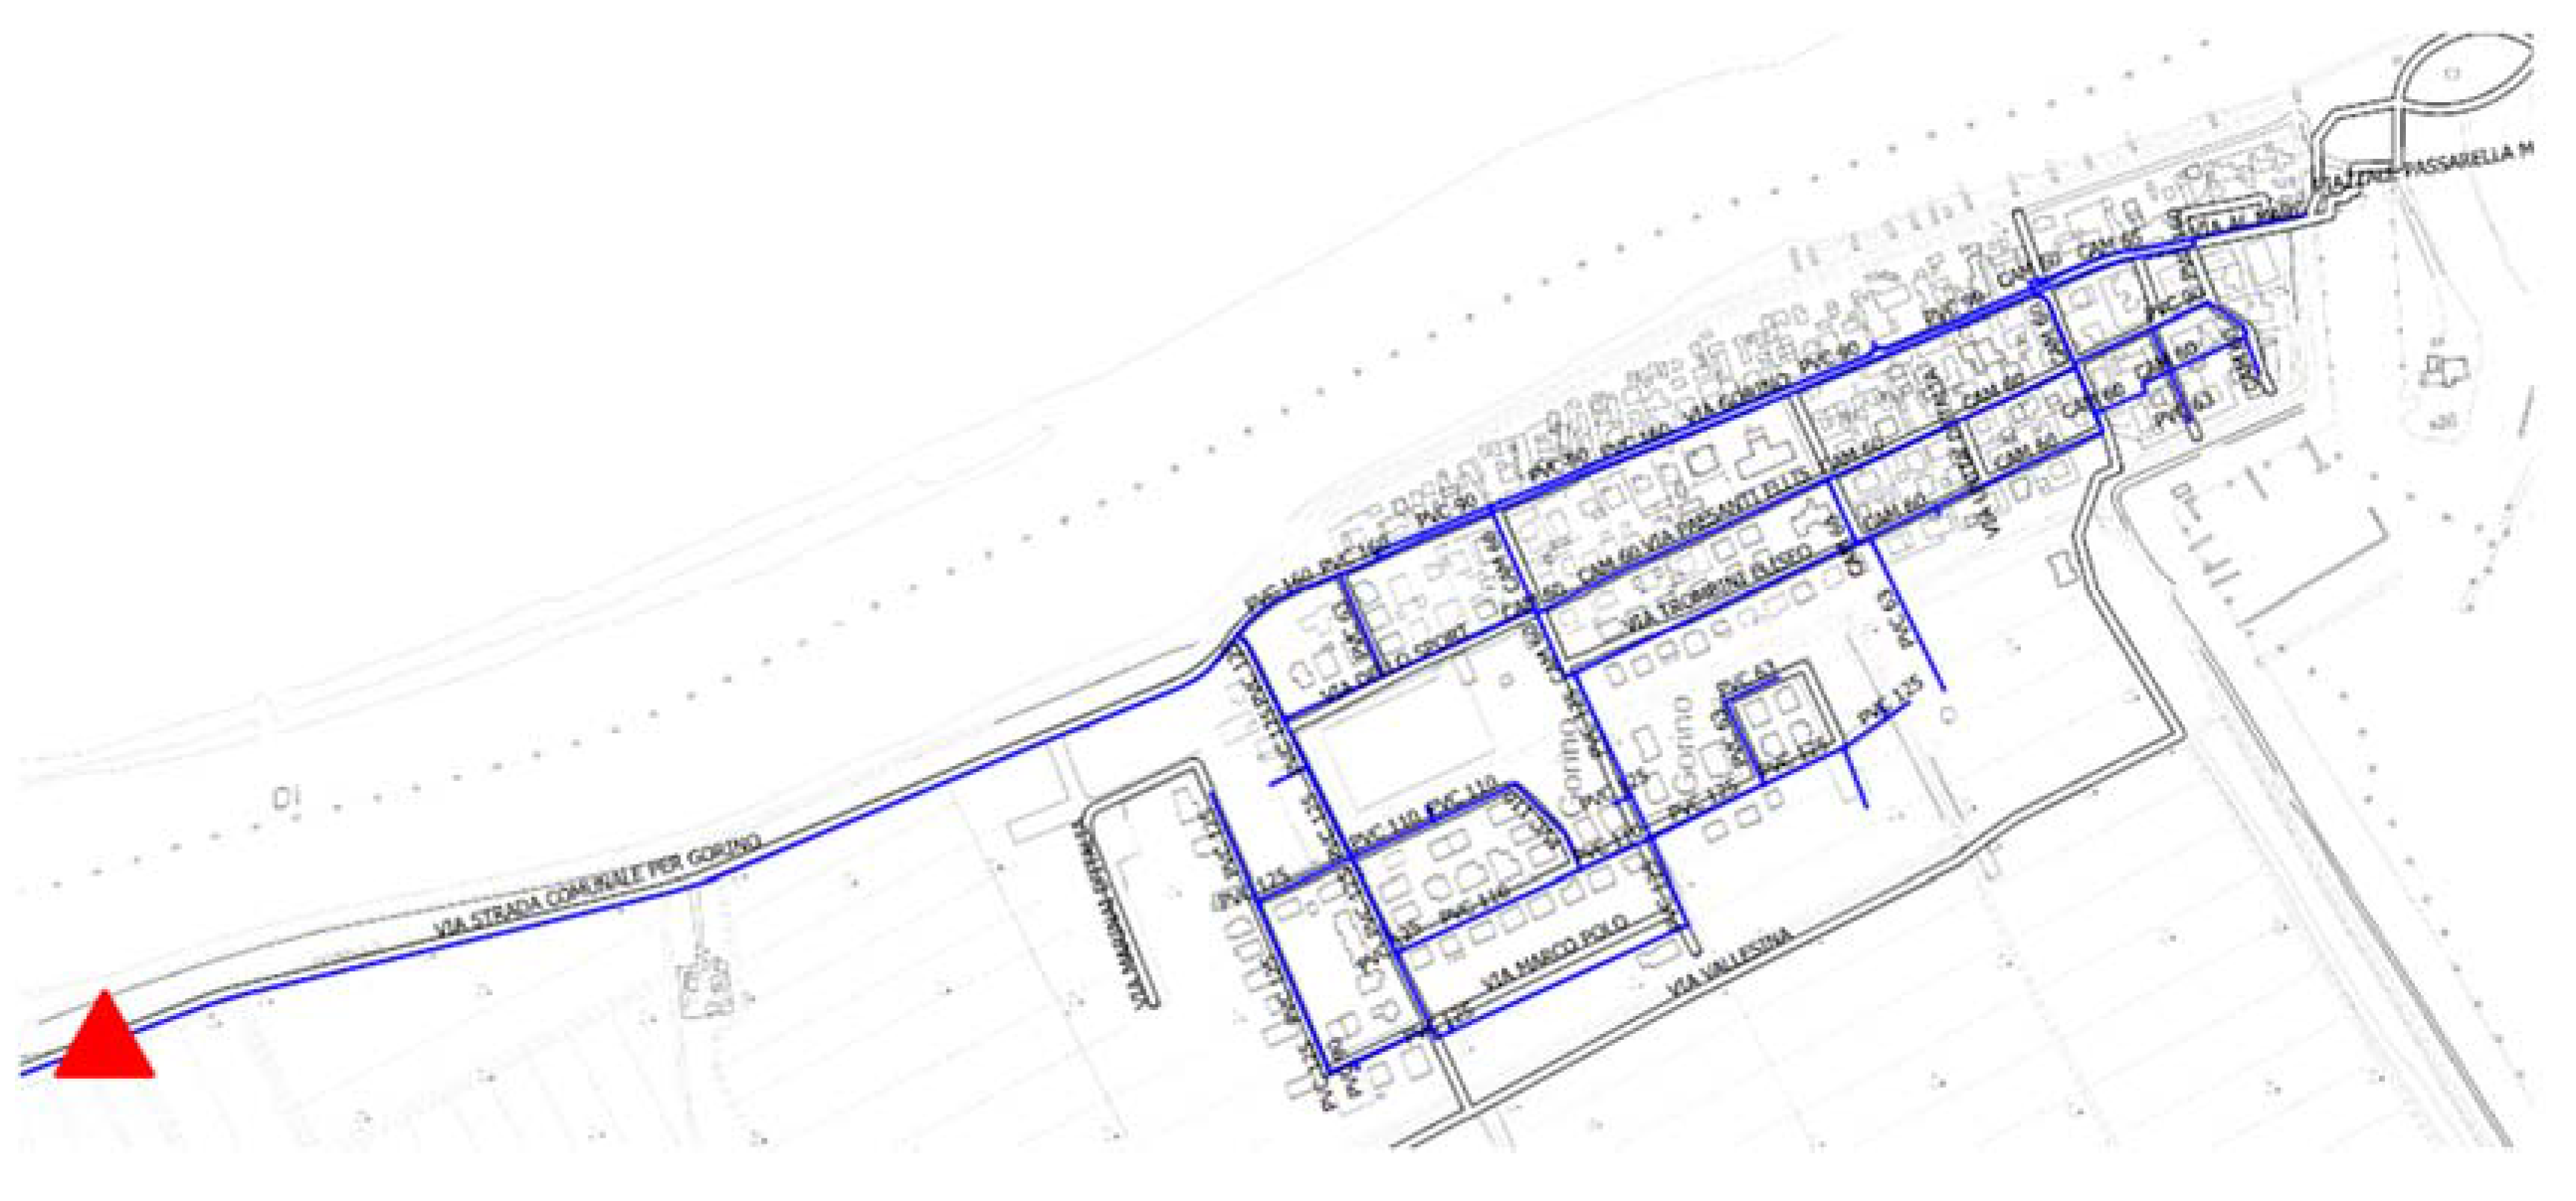
A field laboratory at Gorino Ferrarese (FE) was created with the goal of testing the developed water consumption monitoring and processing system. This small village has an extension of about 3 km
2 and corresponds to a natural DMA. Indeed, the entire distribution network is supplied at a single point where discharge and pressure are monitored (
Figure 2). In addition, the distribution network is over 9 km long and supplies about 650 residents, corresponding to a total of 292 users, of which 275 are residential and 17 belong to public, commercial and touristic activities.
In this DMA, in spring 2016, CADF S.p.A., the Water Utility managing the network and project partner, carried out the replacement of traditional meter devices with electromagnetic smart meters. The installation of these smart meters allowed to undertake a data collection campaign, making preliminary use of a Remote Meter Reading (RMR) system in walk-by mode and of the ability of the smart meters to record consumption data. Therefore, from June 2016 to September 2017, the time series of the totalized volume of water required by each user were acquired, initially recorded with a 5 min time step, and subsequently with a 1-h time step. All collected data were stored in a Time Series Database, for a total of over 18,000,000 records. Furthermore, for the same period, the water discharge entering the DMA was monitored. All data were subsequently analysed and processed with the goal of creating algorithms of the processing system for managing the information to be sent to users and Water Utility.
4. Analysis and Discussion of Results
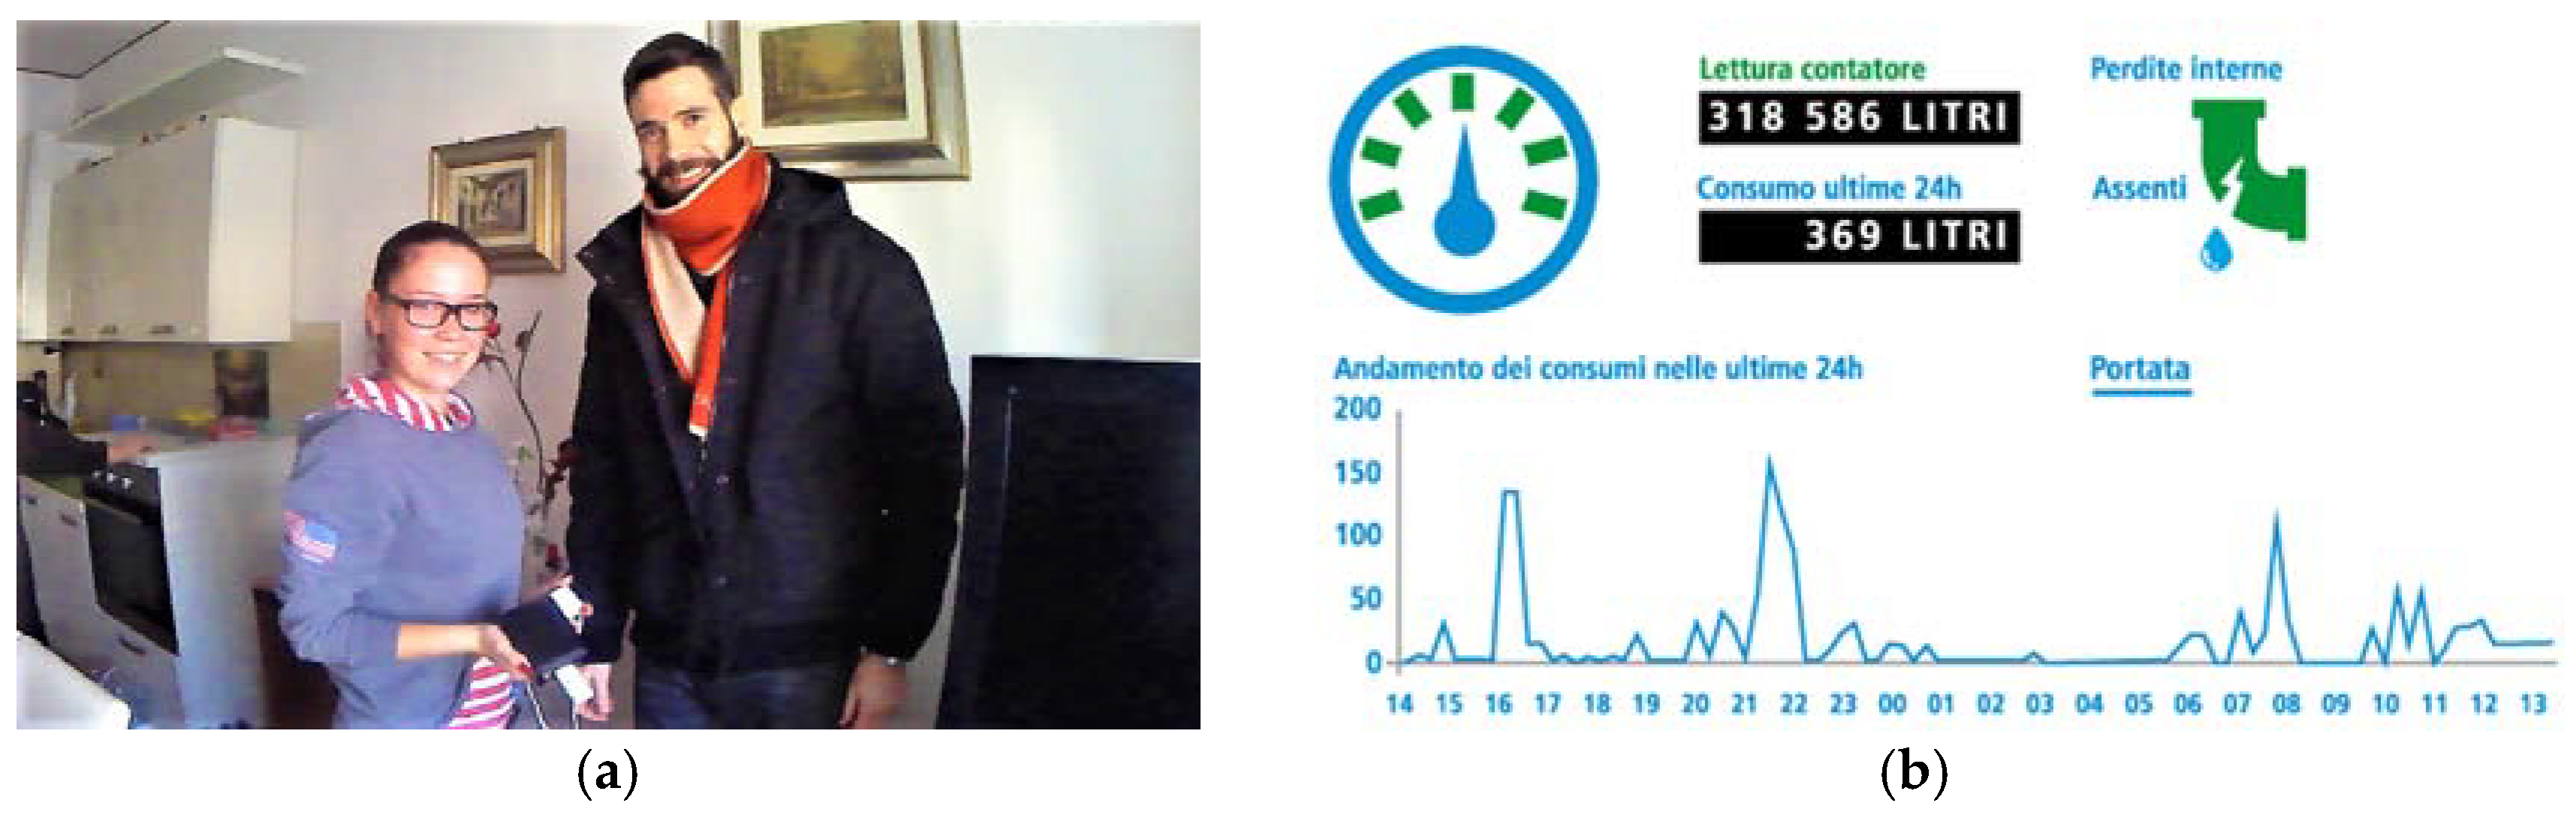
Some data collectors were placed (
Figure 3a) in as many houses in order to evaluate the correct function of the implemented real time monitoring system and consequently validate the correct flow of information. The references to access the Rilheva platform were provided to each of these users (
Figure 3b).
In addition, using the data collected at the field laboratory, several elaborations were carried out to evaluate the benefits descending from the smart metering system at level both of individual user and district.
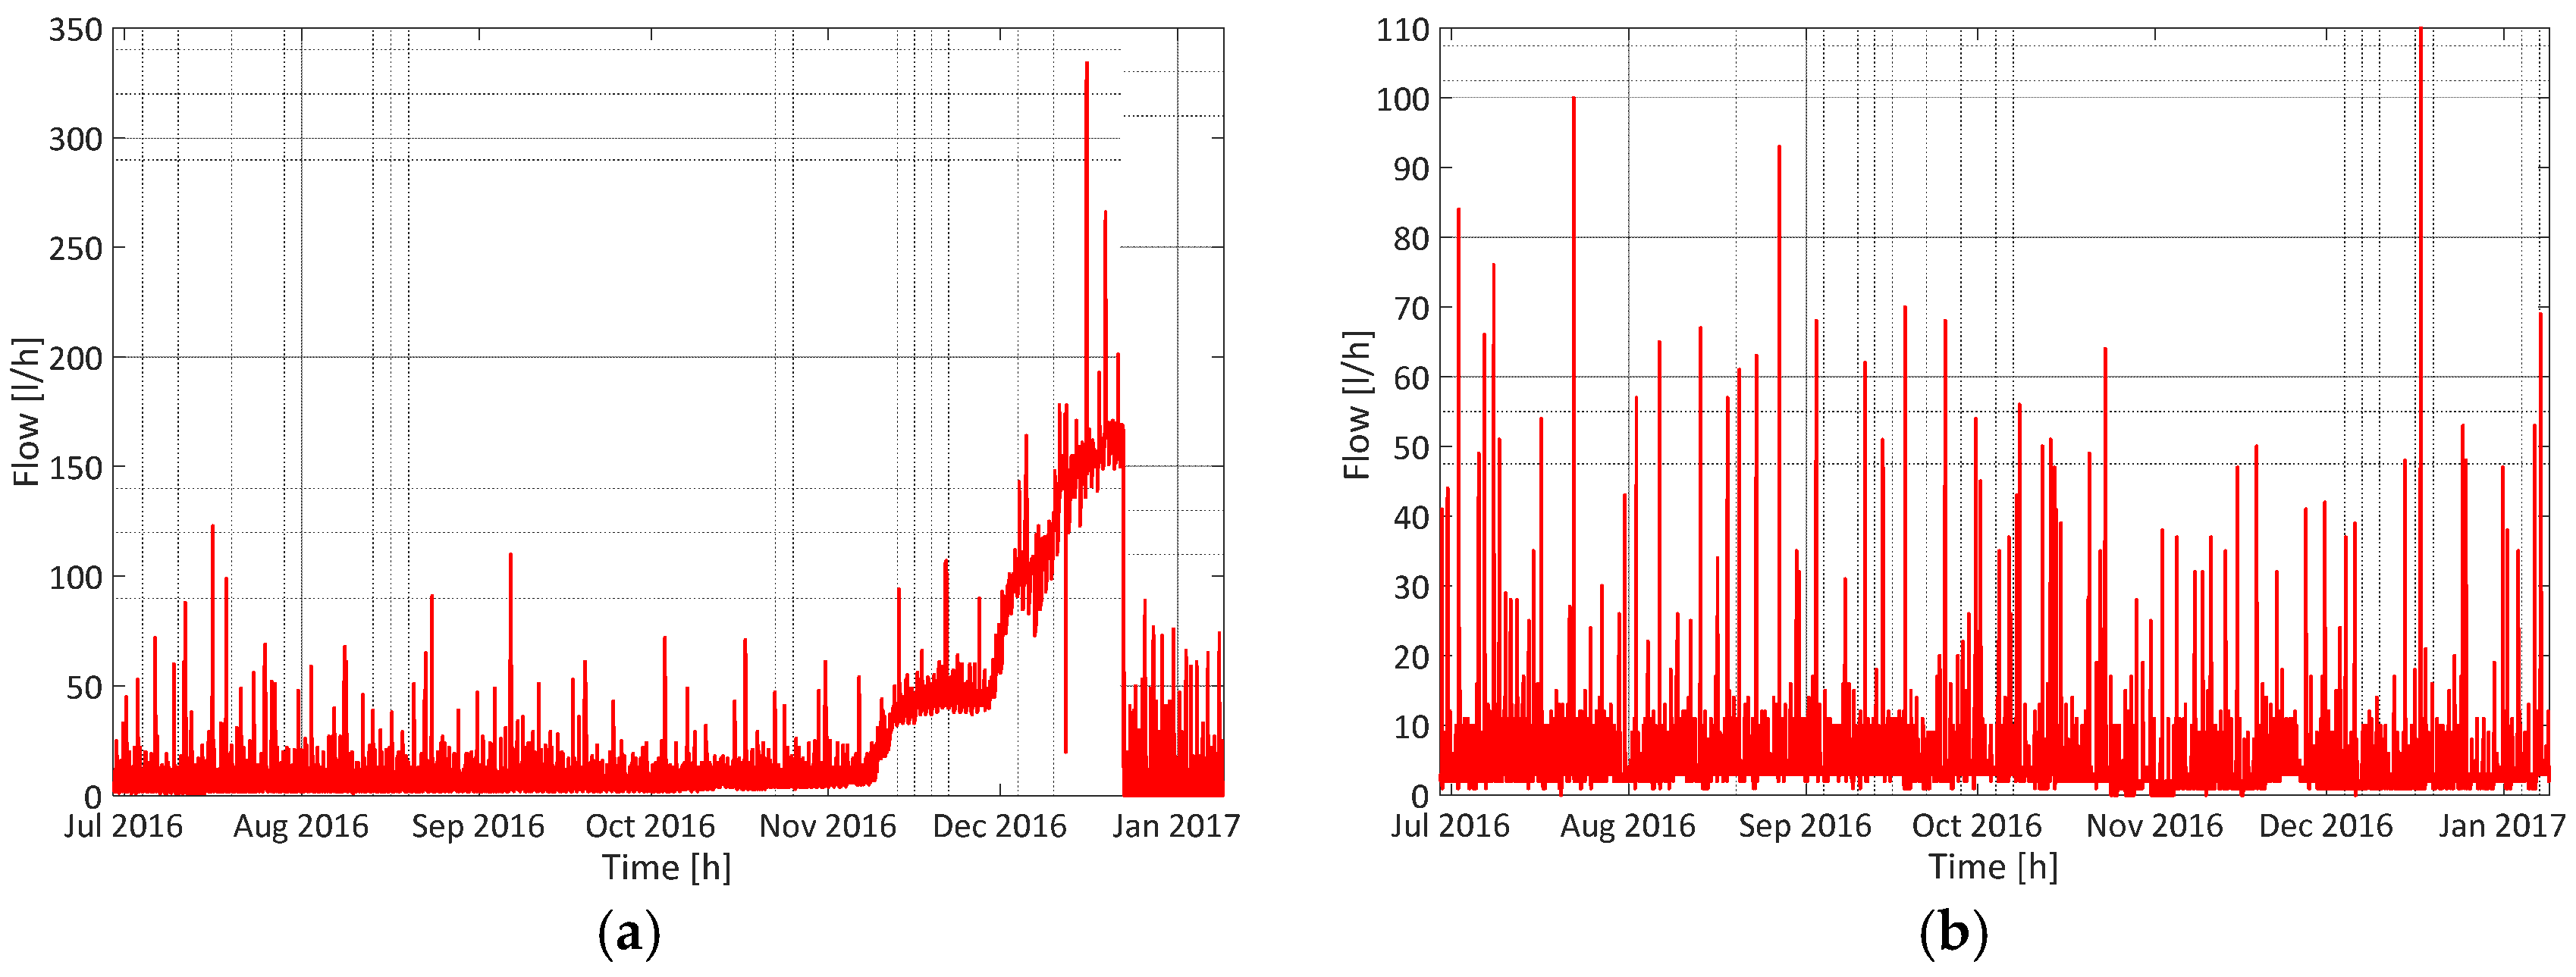
With reference to the users, the combined analysis of the time series of the cumulated volume and hourly discharge of each user was performed in order to characterize the leak level. This analysis made it possible to identify different types of leaks, which differ for size and behaviour: from large leaks caused by broken pipes (
Figure 4a), to small leaks produced by incorrect functioning of sanitary appliances (
Figure 4b).
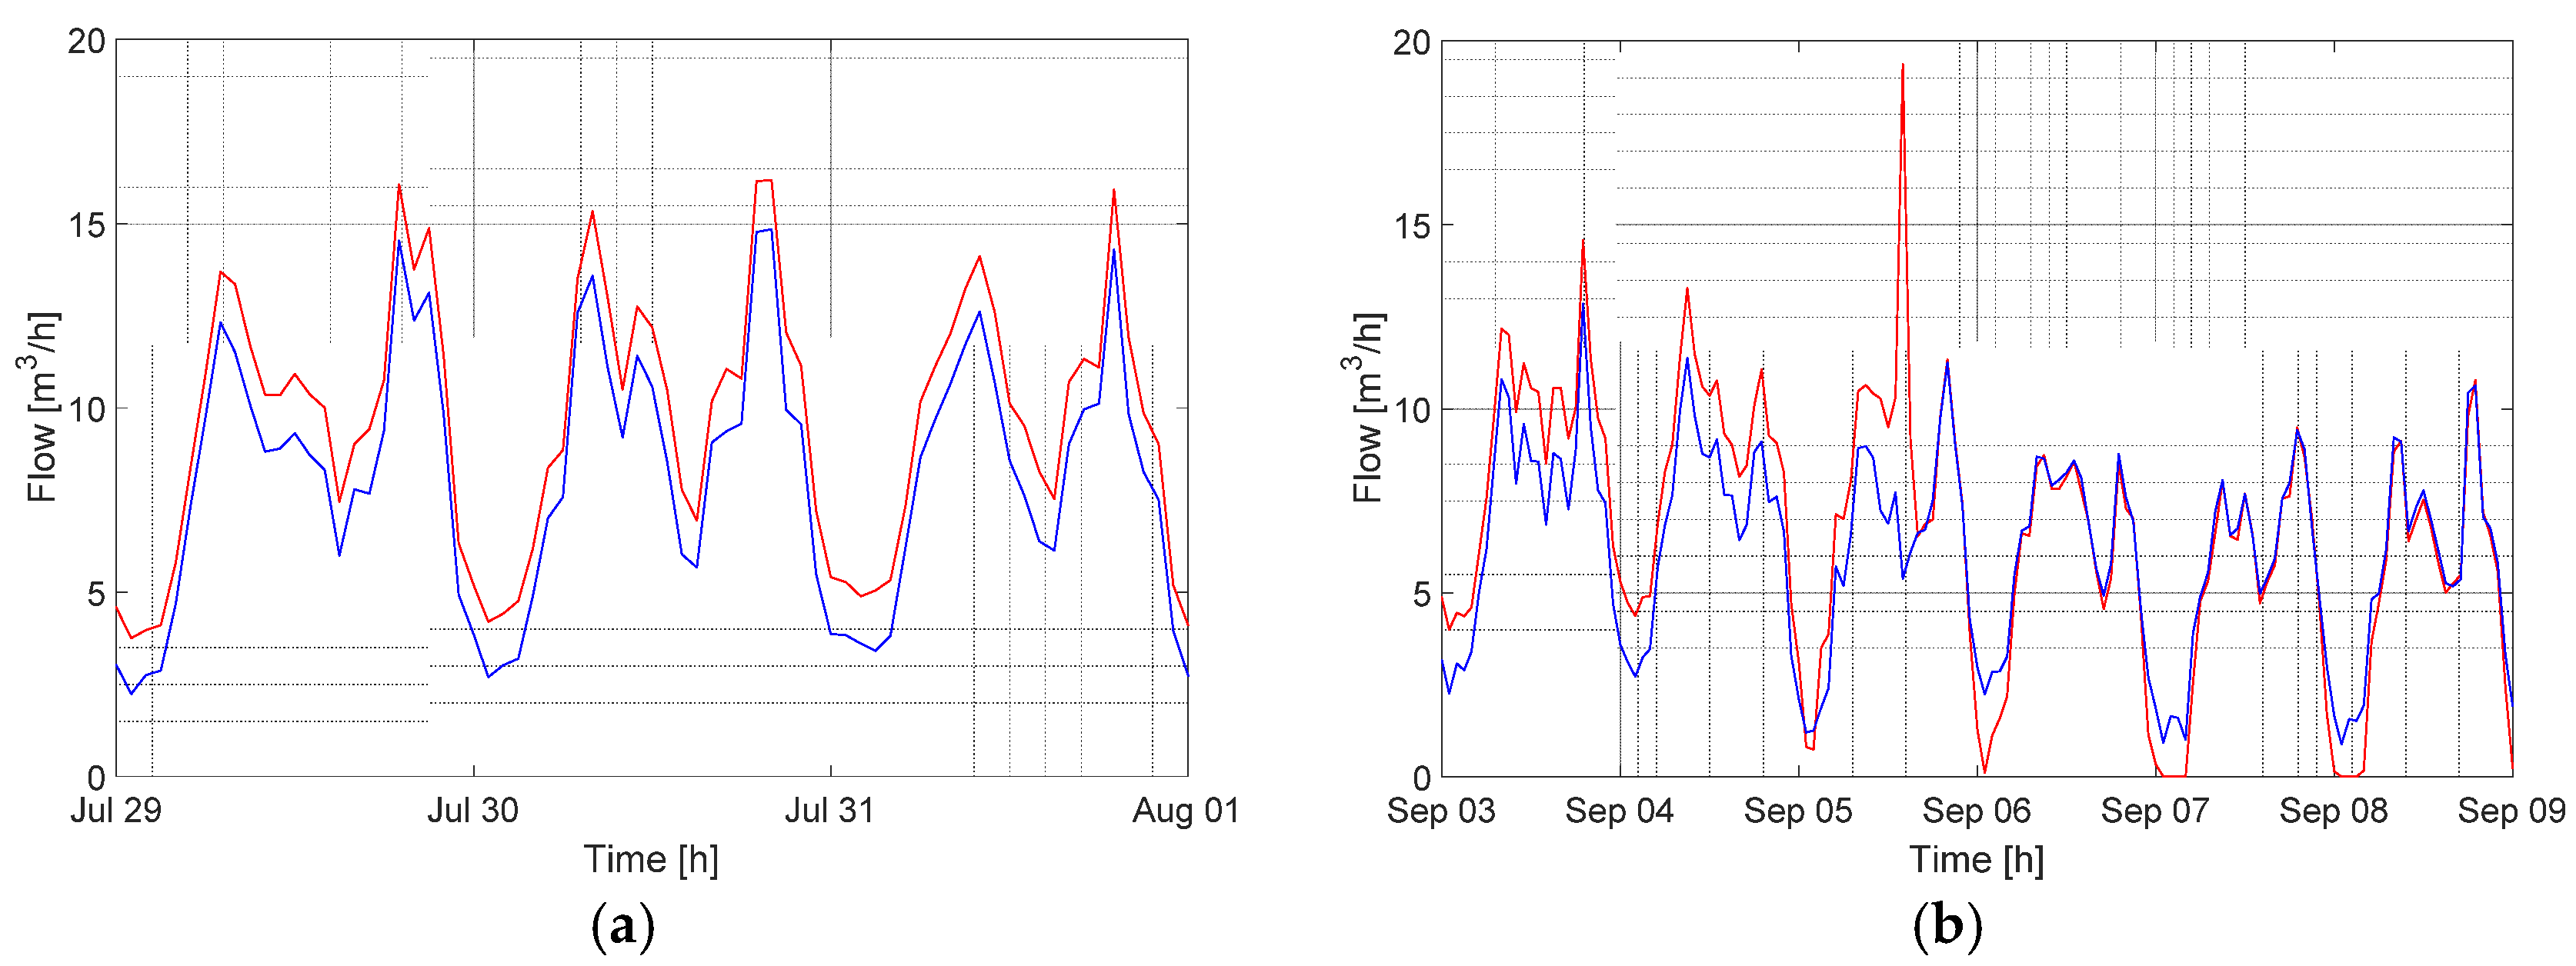
More specifically, during the observation period between the end of June 2016 and the end of March 2017, a total of 211 water leaks were identified: 26 corresponding to leaks greater than 10 L/h, 101 corresponding to leaks between 1 and 10 L/h and 84 leaks smaller than 1 L/h. With reference to the Water Utility, the district water balance was carried out throughout the entire observation period. This analysis was carried out by comparing the time series of the discharges entering the DMA with the time series obtained by adding the discharge time series of each user. The analysis made it possible to characterize the leak level in the distribution network over time. For instance, the
Figure 5a, illustrates the water balance for three days in July 2016. It shows that during the summer 2016, the profile of the discharge entering the DMA (indicated in red in
Figure 5a) has the same trend of the consumption of all users (in blue) but is always higher. The difference between the two profiles is an almost constant value of about 1.5 m
3/h. Only after the consumption peak, measured exclusively by the meter at the entrance of the DMA (indicated in red in
Figure 5b) on 5 September 2016, there is a change in the discharge entering the DMA.
5. Conclusions
In this paper the continuous monitoring and processing system of water consumption is presented. This approach was developed within the framework of the first two WPs of the GST4Water project.
The processing of the data collected at the field laboratory of Gorino Ferrarese highlighted the several advantages offered by the entire system to the users and to the Water Utility. In particular, users have the opportunity to reduce drastically unnecessary squandering of water caused by leaks inside buildings and to increase their awareness of water saving, thanks to the possibility to observe their consumption in real time and receive an alarm message if there is a water leaks in their residences. At the same time, the immediate detection of damages and the continuous communication of the status of each single measure device allows to the Water Utility to have a clear control over all meters. Furthermore, the Water Utility is provided with a valuable tool to obtain a constantly updated scene of the leak level in the distribution network, to intervene promptly and to reduce the duration and the volume of wasted water. At the same time, the Water Utility is provided with a basic set of data, useful for the water consumption billing to the users.
The implemented monitoring and processing system represents an instrument capable of optimizing the management of the water network by supporting decision processes and the starting point for transforming current water distribution network into the so-called smart water grid.


