Opera.DL: Deep Learning Modelling for Photovoltaic System Monitoring †


1
Departament of Electronic Engineering, Campus Las Lagunillas, 23071 Jaén, Spain
2
Departament of Computer Science, Campus Las Lagunillas, 23071 Jaén, Spain
*
Authors to whom correspondence should be addressed.
†
Presented at the 13th International Conference on Ubiquitous Computing and Ambient Intelligence UCAmI 2019, Toledo, Spain, 2–5 December 2019.
Proceedings 2019, 31(1), 50; https://doi.org/10.3390/proceedings2019031050
Published: 20 November 2019
(This article belongs to the Proceedings of 13th International Conference on Ubiquitous Computing and Ambient Intelligence UCAmI 2019)
Abstract
:In this paper we present Deep Learning (DL) modelling to forecast the behaviour and energy production of a photovoltaic (PV) system. Using deep learning models rather than following the classical way (analytical models of PV systems) presents an outstanding advantage: context-aware learning for PV systems, which is independent of the deployment and configuration parameters of the PV system, its location and environmental conditions. These deep learning models were developed within the Ópera Digital Platform using the data of the UniVer Project, which is a standard PV system that was in place for the last twenty years in the Campus of the University of Jaén (Spain). From the obtained results, we conclude that the combination of CNN and LSTM is an encouraging model to forecast the behaviour of PV systems, even improving the results from the standard analytical model.
1. Introduction
With more than 70 GW of solar photovoltaic power installed all over the world, most of them in large PV plants, and in some cases running for several years, the management of the operation and maintenance (O&M) of these systems is a relevant research field in the solar PV industry [1].
Data represents a key asset in this PV management area, since they enable modeling the standard behaviour of the system and to monitor its performance compared against the expected output determined by the model. This monitoring, when is applied timely and comprehensively including all the factors that may impact the performance, enables early damage and fault detection, which then allows operation and maintenance actions to maximize the up-time and efficiency of the PV plants.
Traditionally, approximate analytical expressions based on the electrical parameters of the solar cells that conform the PV system and the specifications provided by the manufacturer were used to build the standard performance model. Leveraging the latest software advances in machine learning, a different approach can be taken by building the model using Deep Learning (DL) algorithms to learn from the actual behaviour data of the system during a relevant period of time and using the time series prediction to monitor the performance.
The objective of this work is to design and evaluate DL models to forecast the energy generated by a PV system. We model Convolutional Neural Networks (CNNs) and Long Short-Term Memory (LSTM) and we compare the accuracy against the standard analytical model which is based on parameters and specifications.
1.1. Related Works
On the first hand, the energy generation by PV systems is now considered a well known technology that were reached an noticeable maturity level. However, its relatively novel -most of the systems were running no more than twenty years [2,3]- means that there is not much experience in O&M. Most of the tasks and tools regarding O&M make little use of the new ICT technologies: big data, deep learning, business intelligence, ... [4]. The most usual way to forecast the behaviour of the PV systems is, up to now, the use of classical models based on the physic process of the solar cell to define the analytical equation to get its electric parameter [5]. There are a lot of these models with very different approaches, difficulty level and accuracy results [6,7,8,9]. The main objective of these tools is to forecast the electrical energy generated by the cells and also by the PV systems at all.
Among all of these classical model, we selected the Araujo model plus the constant FF (FF: Fill Factor is a solar cell figure of merit regarding with maximum power delivered vs. maximum current and maximum voltage of the cell; its upper limit is 1) [9] to compare and evaluate the performance of PV systems with the one forecast of our new DL model. Araujo model, is an standard PV model that combines enough accuracy with a very simple formulation [5,9]; additionally, it needs only a few variables to be measured: current and voltage of the cell, irradiation and ambient temperature [10]. Nevertheless, to obtain the output energy by any of these classical models it is necessary to know a large number of parameters and specifications of the PV generator under consideration: technical specs, topology of the generator, location, etc. One of the main advantages of a DL model is to forecast independently of all of these parameters and specs, and hence enabling easier and more efficient deployment and customization of PV.
Recently several works regarding the use of the news technologies in monitoring and forecast PV systems behaviour were presented. However, none of them were used in, or produced, a usable O&M system management [4,11,12,13]. A previous work related to the O&M analytic platform was presented in [14]. The use of the news ICTs technologies in O&M management in renewable sector is restricted up to now to a few big and expensive platforms developed by companies to use in utility scale generator power plants [15,16].
Regarding the monitoring of PV systems the most usual way up to now is to do it by a traditional wired sensor data acquisition systems [12]. The new IoT connection concept let us develop a very versatile and easy operation data collection system with wireless sensor [13].
On the other hand, the use of Deep Learning in temporal series has become a prolific research field [17]. Mainly, by the use of Long-Short Term Memory (LSTM) [18], which is a type of recurrent neural network that include a memory and it is designated to learn from sequence data, such as sequences of observations over time. LSTM is most widely used in natural language processing and speech recognition that can model temporal dependence between observations [19], and it is suitable for prediction from sensor data [20]. LSTM obtained encouraging results in several fields, such as activity recognition [21] or estimating building energy consumption [22]. Moreover, modeling spatial features in time series by means of Convolutional Neural Networks (CNNs) [19,23] achieved promising results in speech recognition [24] or gas classification [25], together with LSTMs models [26].
2. Methodology
In this section, we describe the methodology for designing and building the DL model to forecast the output power the photovoltaic systems (PVS). First, the supporting infrastructure and technology components to carry out this work were the PV system installed by the UniVer Project and the IoT Big Data Analytic platform developed by project Opera, both at the University of Jaén and described in Section 2.1. Within the Opera Project, DL models are proposed to enable real time monitoring and accurate and reliable forecasting of any kind of PV generator; and hence, the full evaluation of its behaviour in real time. All of this, together with the easy operation and the low-cost of this tool, makes it very useful to manage the operation and maintenance of PVs. For that reason, the DL models to forecast the output power of PVs are described in Section 2.2, as well as the CNN architectures to get and compare different forecasting results.
2.1. Photovoltaic System: Structure, Behaviour and Monitoring
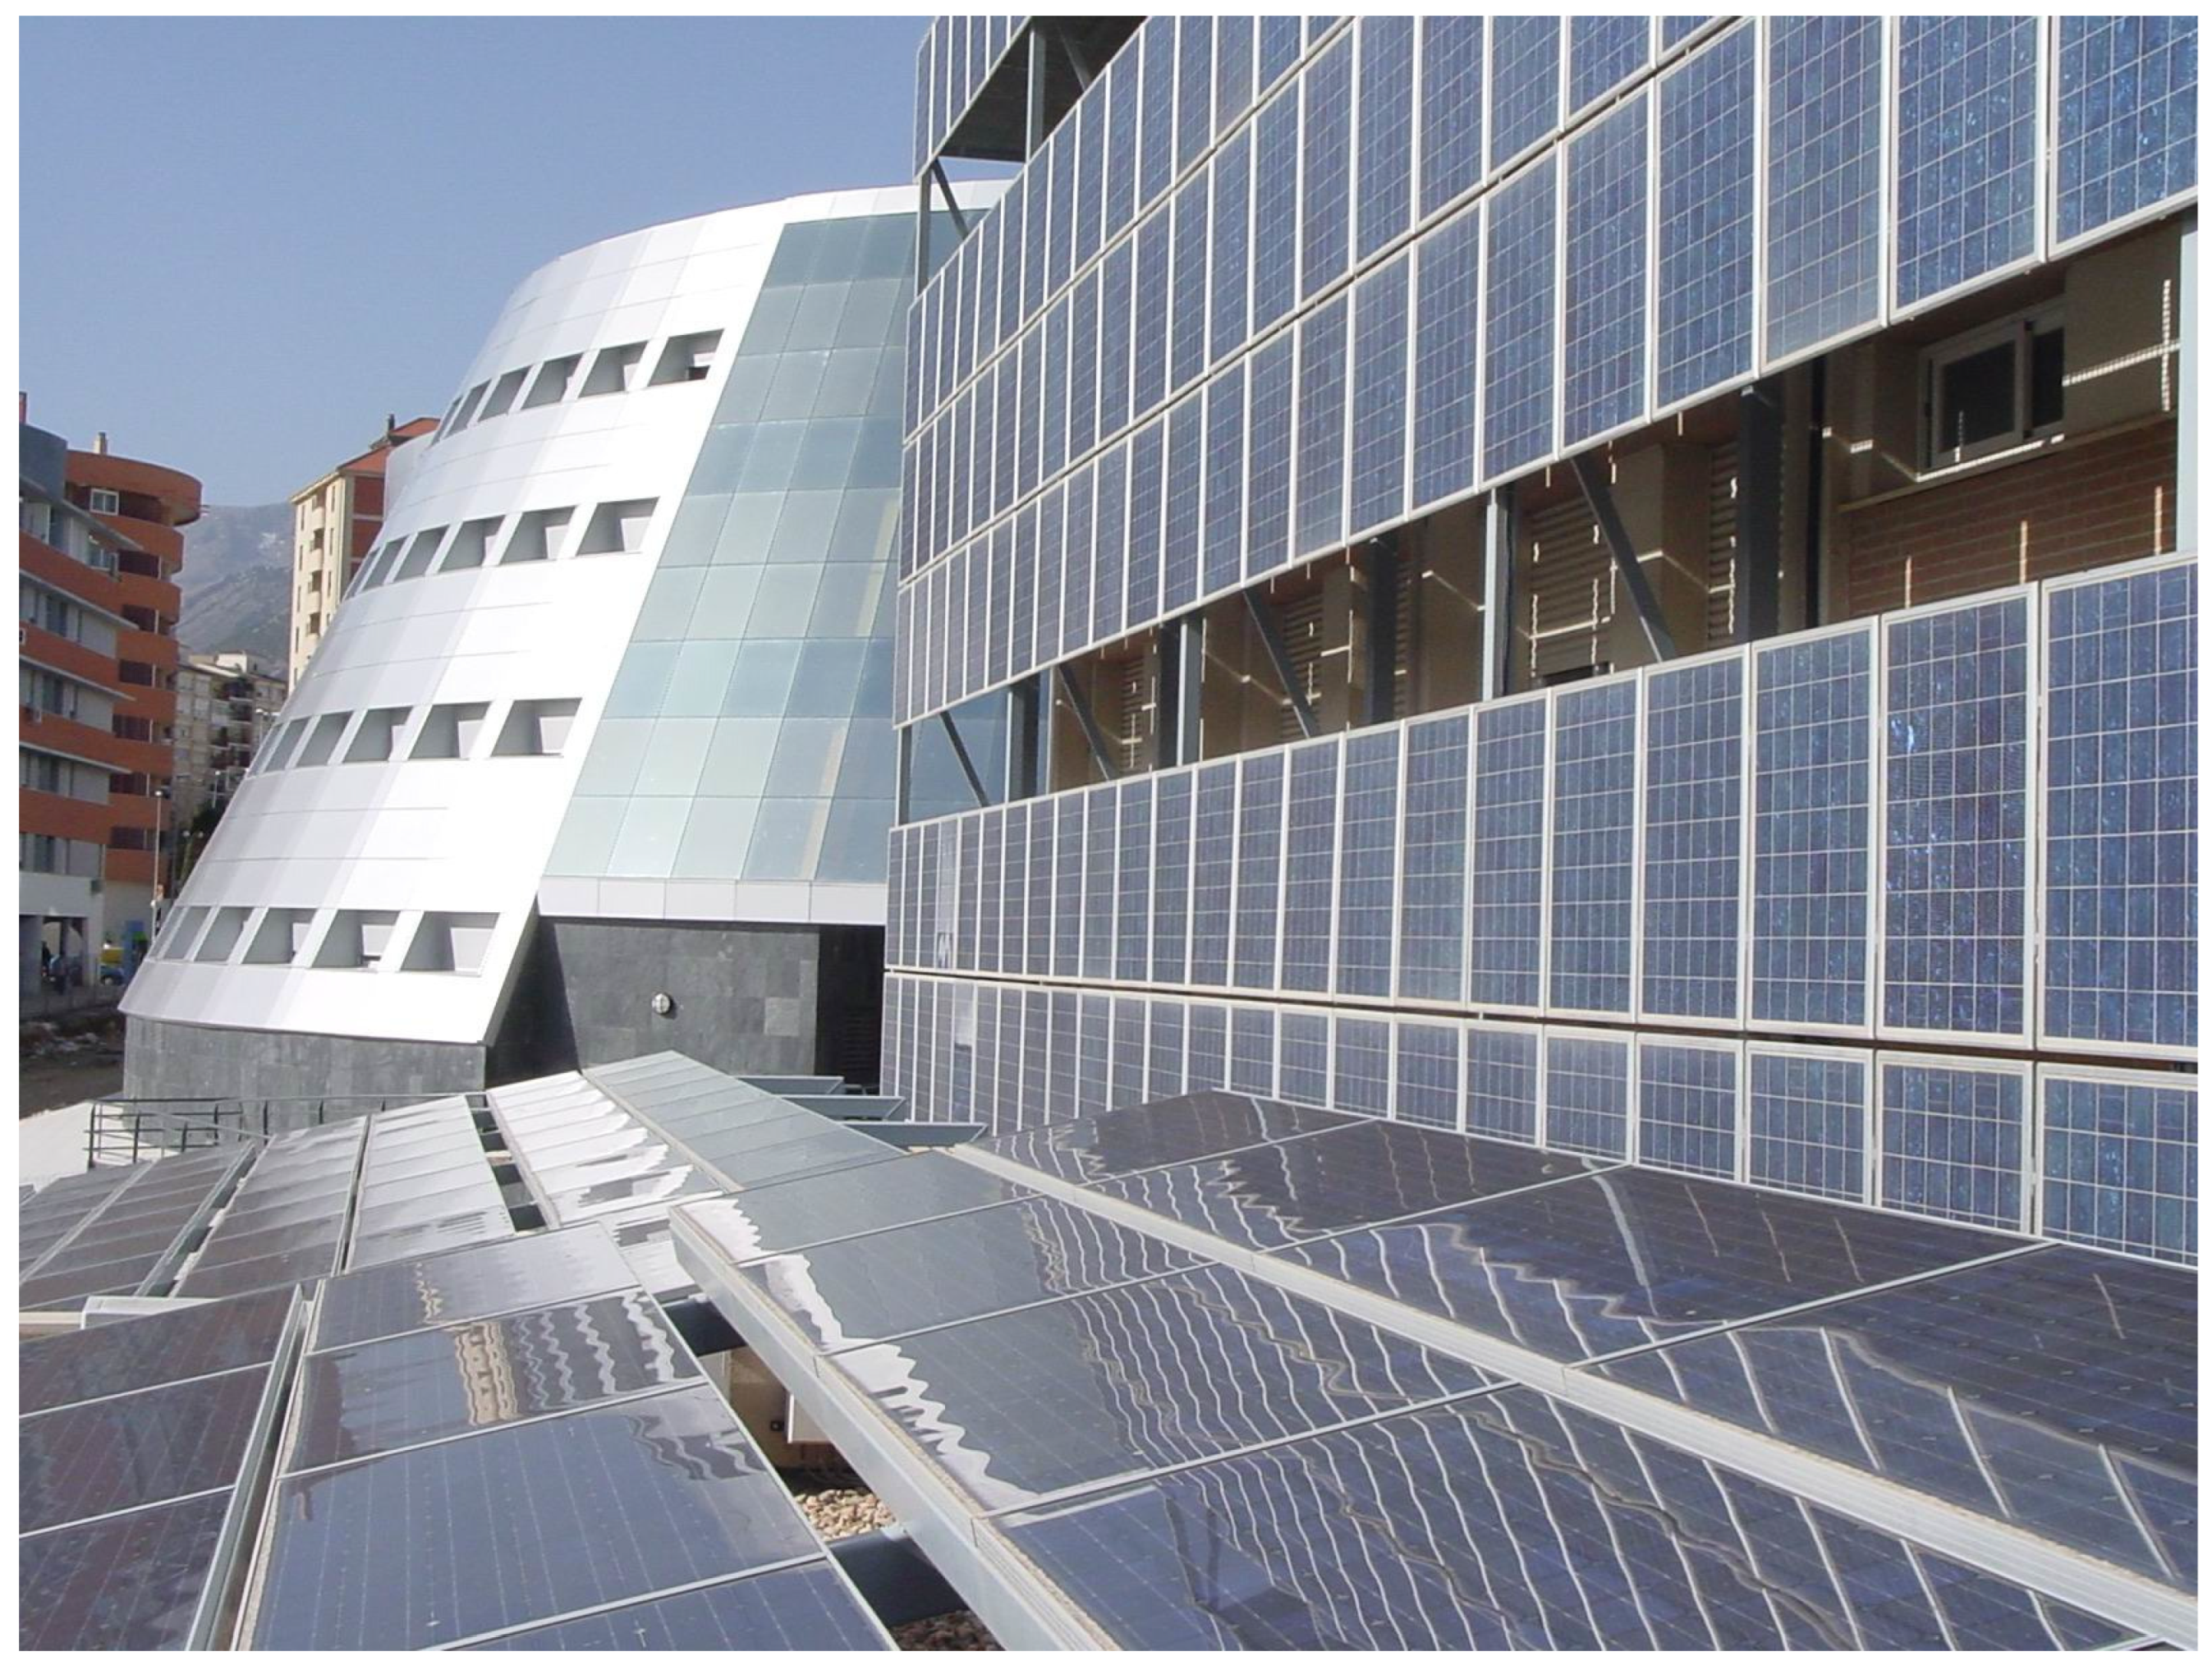
Opera Project is a digital platform developed by an interdisciplinary team, covering the areas of ICTs, PV, and Electronic Technology, and it is performed to provide services of O&M management for renewable energy installations [14]. This digital platform was developed with the knowledge and the working data of the UniVer Project. This project, shown in Figure 1, is a standard, medium size, grid connected PV system that is running for the last twenty years in the campus of the University of Jaén, an so, it is very well known by us [27]. Opera platform is also now managing the O&M of this PV system.
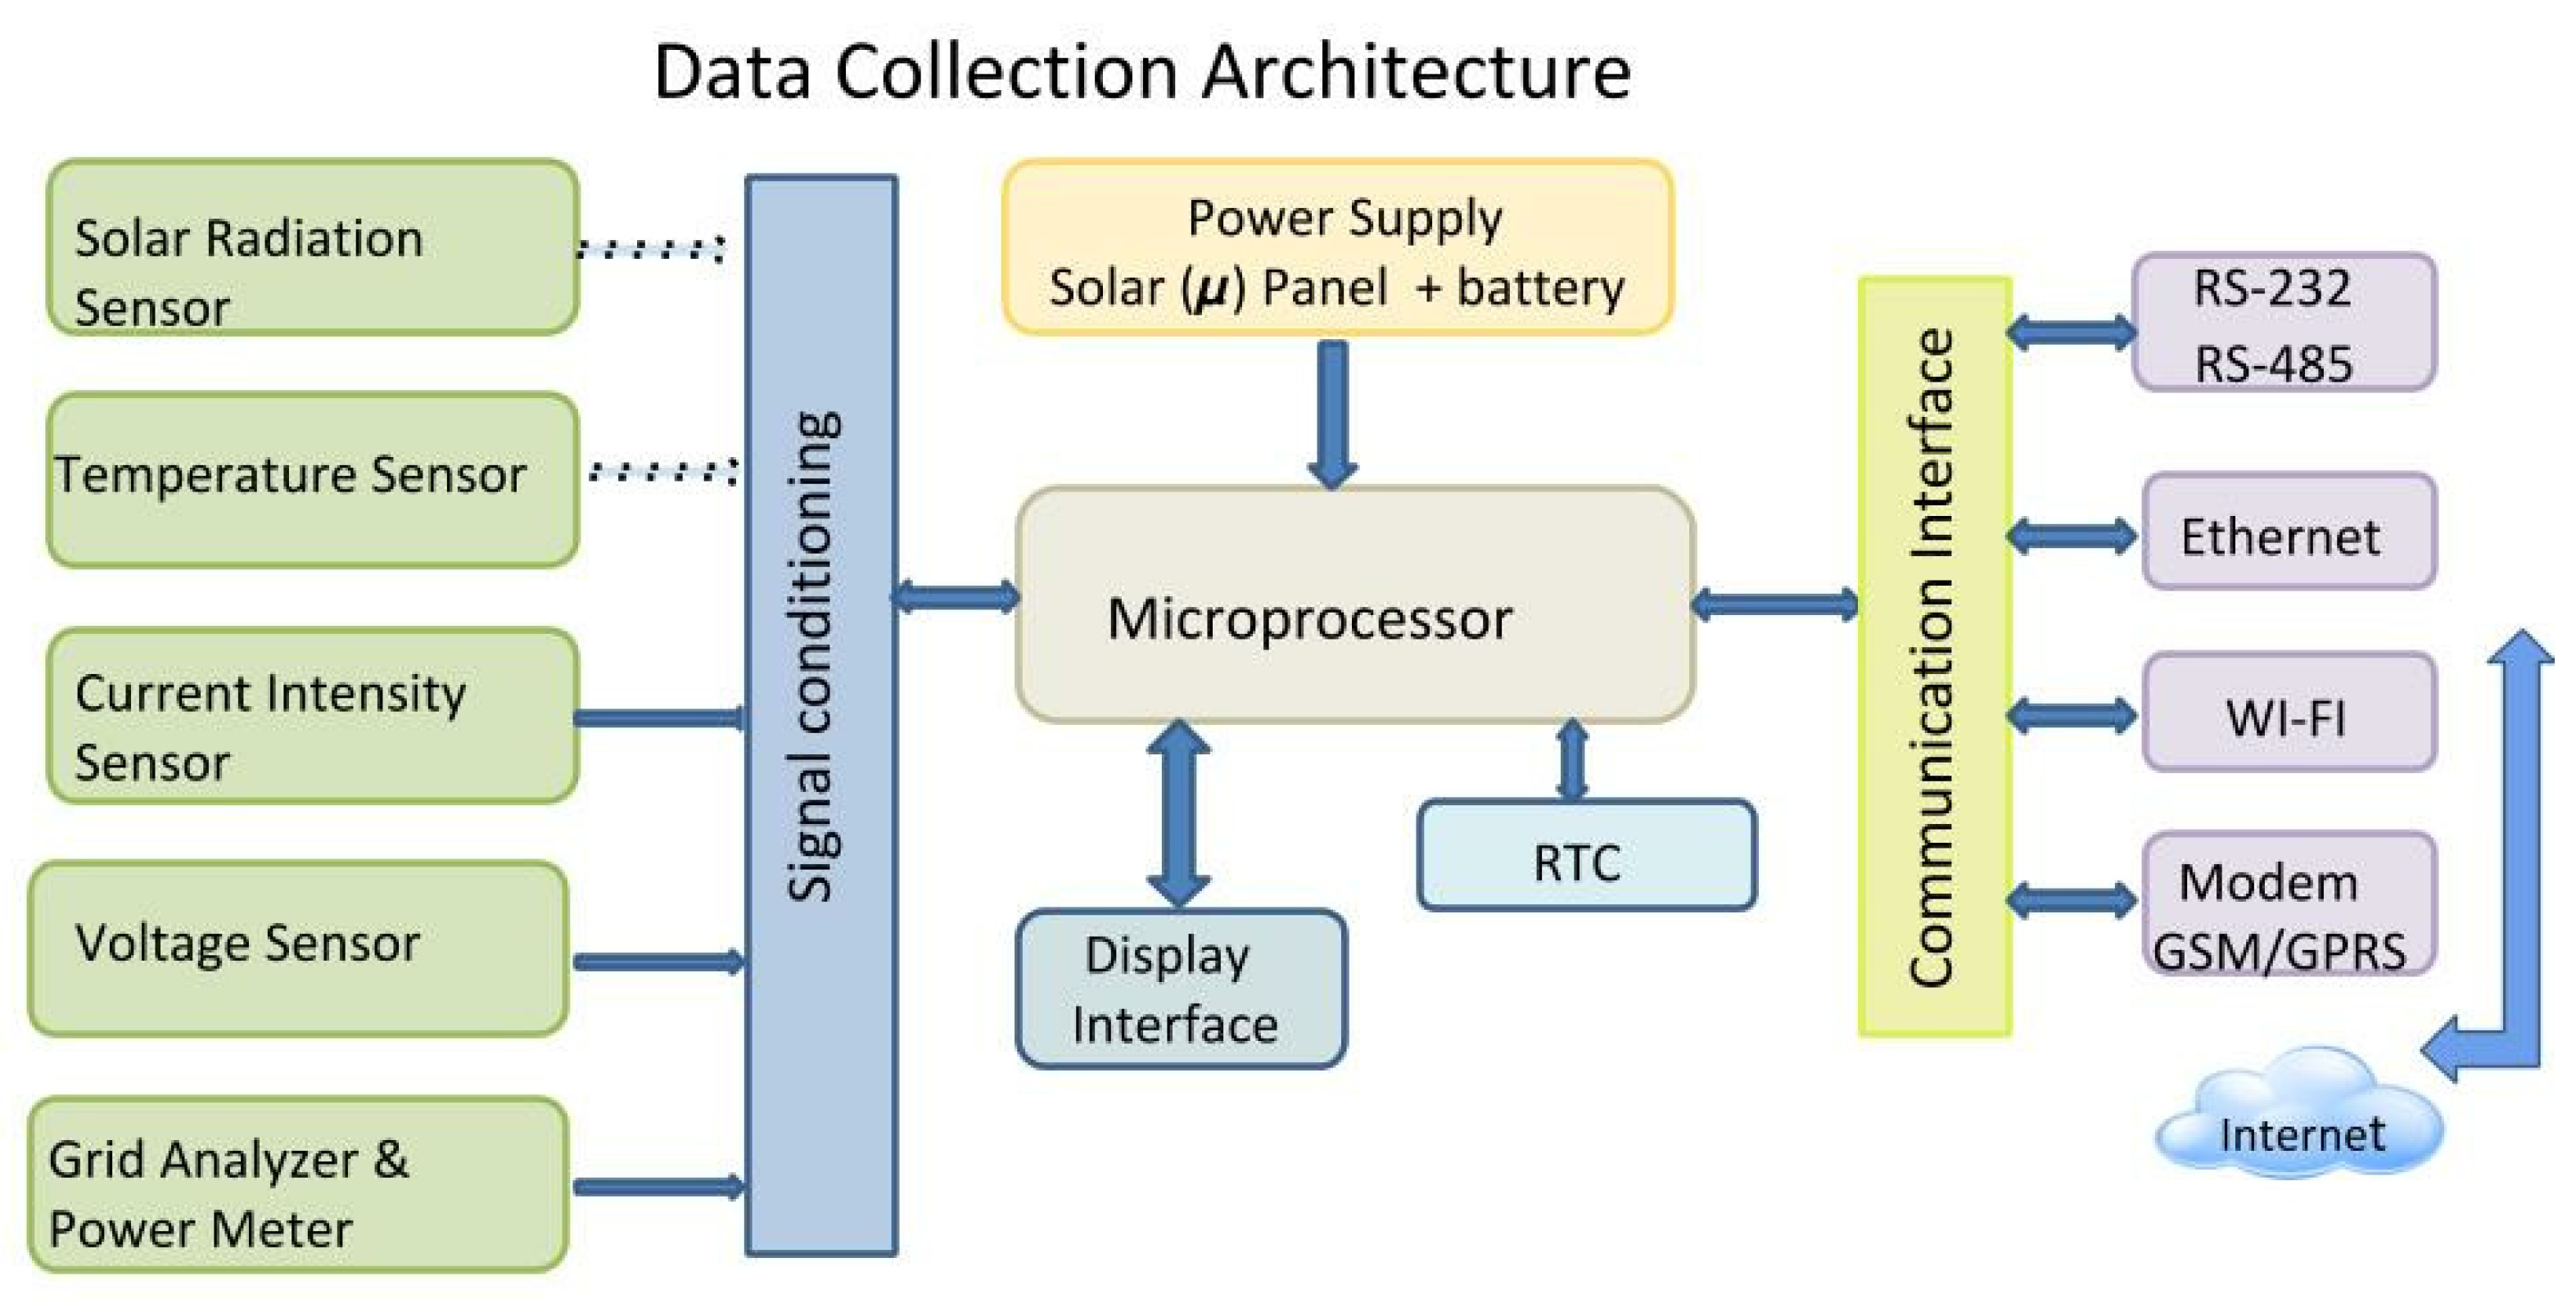
To be able to collect real time variables data by the Opera digital platform, we also developed and implemented a genuine data collection process. Figure 2 shows the architecture of the data collection system. It is composed of a set of sensors, which are based on IoT technology connections, controlled by a microprocessor which uploads the data to internet. These sensors measure the working data of the PV generator and the environmental variables needed to monitor and forecast the PV generator operation according to standard IEC 61724 [28]. Table 1 displays the above variables.
For clarification of measured variables, we note that (Energy in a period of time T: ) the energy is the integral of instantaneous power, so the output electric power -obtained from the input solar power onto the cell, so-called Solar Irradiance (Irradiance (G): is a magnitude regarding the square density of power incident on a surface; it is measured in Watts per square meter (W/m). Solar irradiance is the power input magnitude in a solar cell and electric power is the output one), the temperature, and the manufacture specifications of the cell- is the instantaneous variable targeted by these models; additionally they can provide another intermediate working variables and ratios, e.g.,: current, voltage, cell temperature, etc. These intermediate values will be very useful for diagnosis and descriptive analysis.
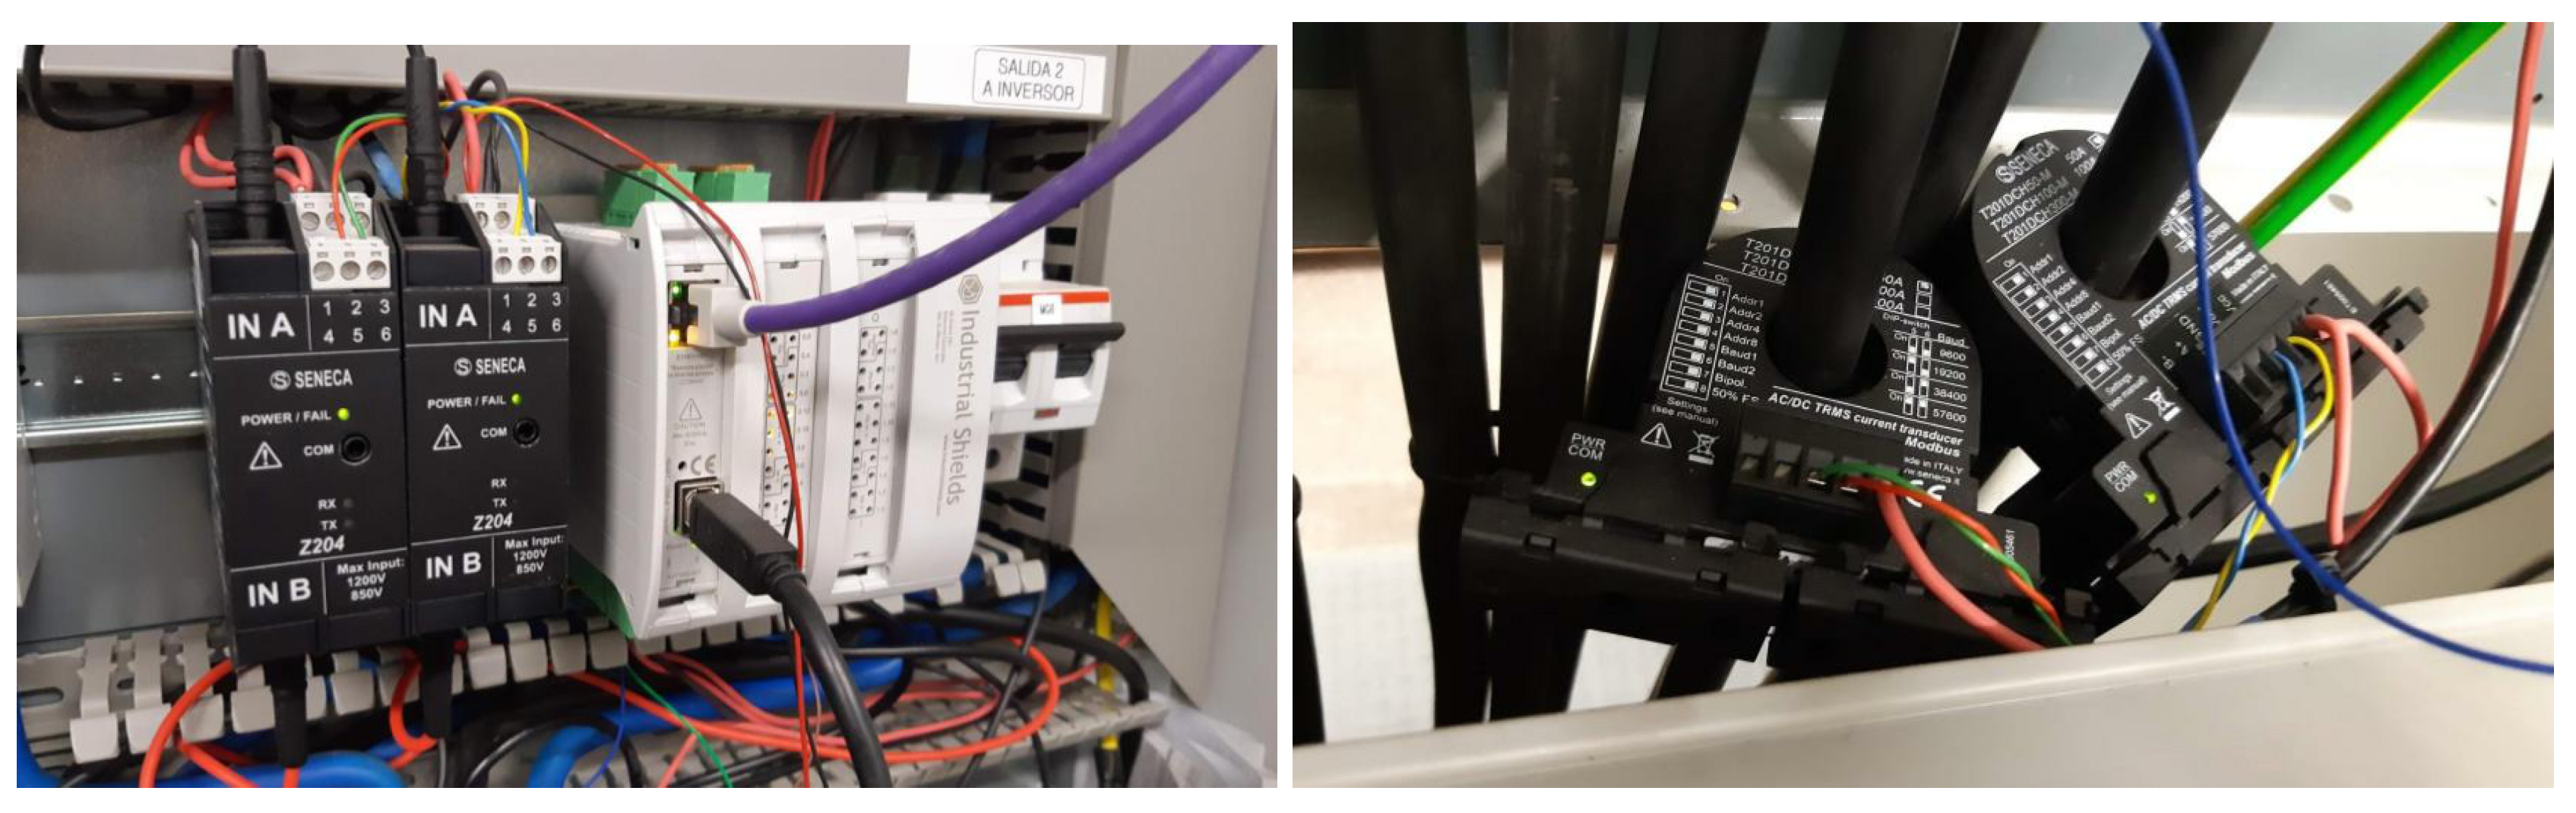
In Figure 3 we show the voltage and current sensors and microprocessor unit used to measure operation data of the UniVer Project PV generator.
2.2. Deep Learning Modeling to Forecast the Output Power
In this section, we describe the DL models to forecast output power of the PV device. In a formal way, each sensor is described by a sensor data stream in a current time within a collecting rate , where represents a measurement of the sensor in the time-stamp t. These sensors determines the input of the model.
Next, we delimit the size of the temporal window T which determines the number of measures to include in the forecasting for each sensor . . Finally, we collect the power measured for each given time , which represents the target value to learn with the regression models based on deep learning.
Once the input and output of the model are defined, we propose two architectures of DL neural networks to forecast the output power of the PV device:
- 2LSTM. Two layers of LSTM which were previously identified as a suitable configuration for forecasting energy load [29].
- 3CNN + 2LSTM. Three layers of CNN are firstly integrated as spatial feature extractors. Next, two layers of LSTM model the temporal dependencies from CNN. The combination of CNN-LSTM Hybrid Networks was selected to provide encouraging results in power consumption [30].
In Table 2, we include the parameters and layers for each proposed model.
3. Evaluation
3.1. Experimental Setup
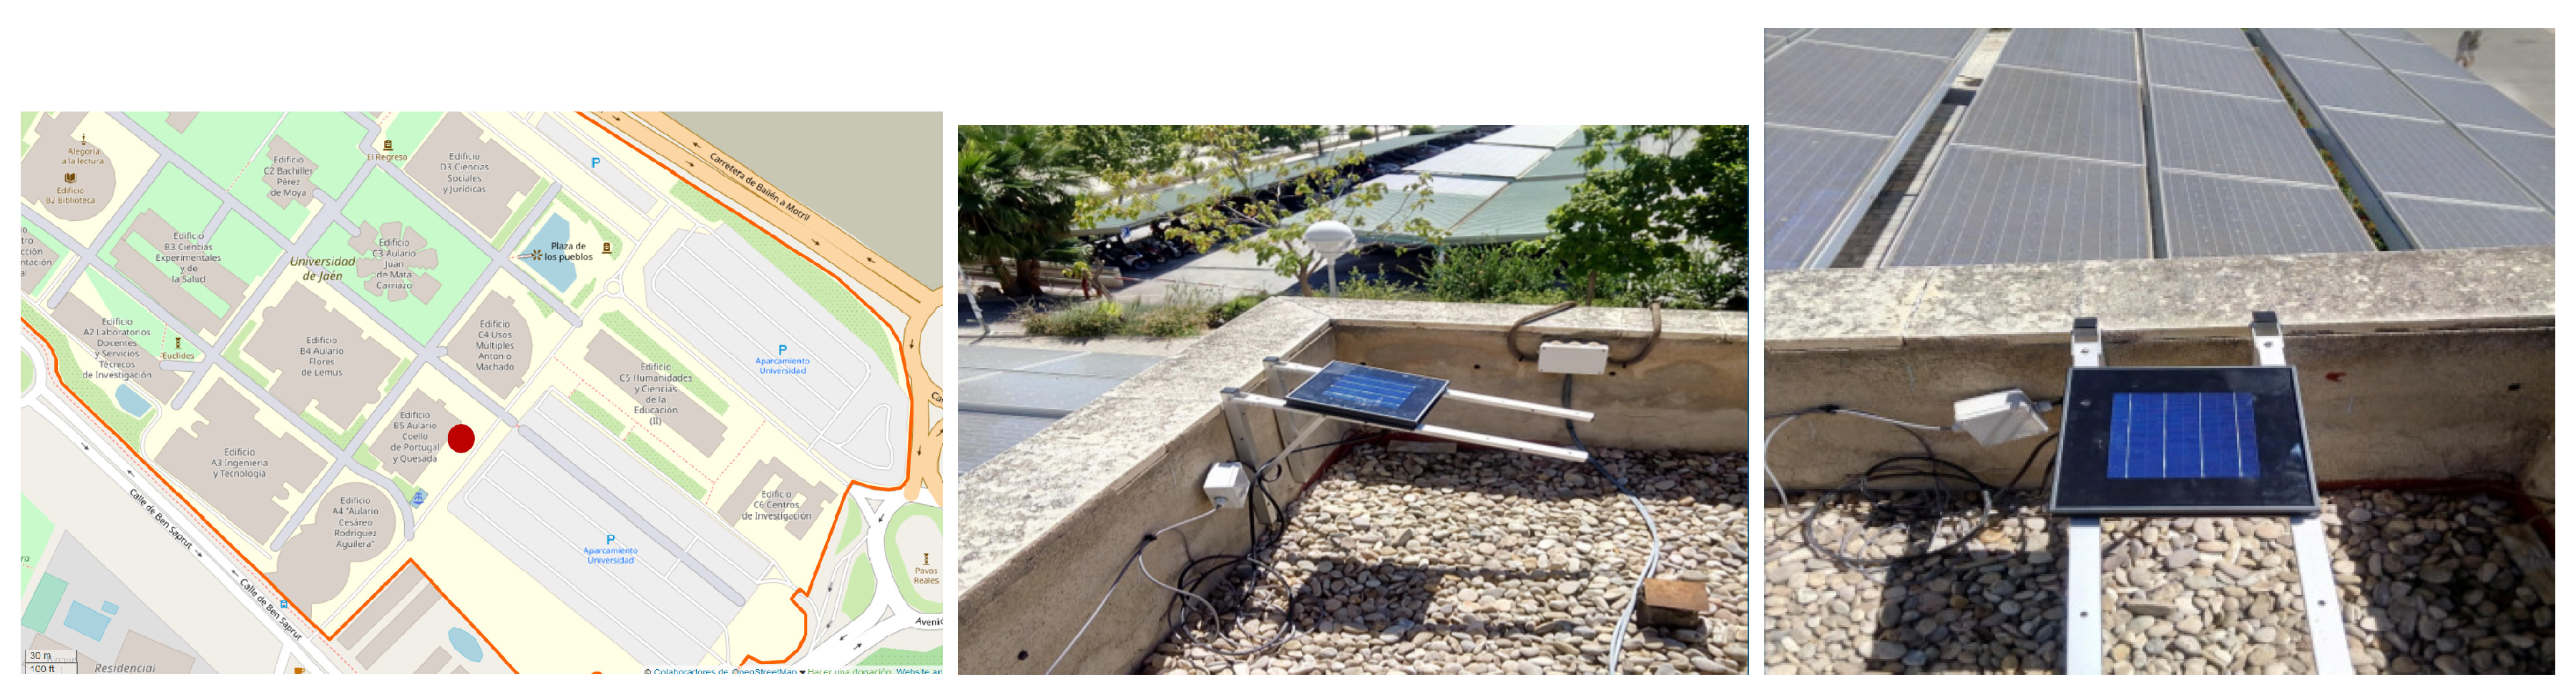
In this section, we describe the experimental setup and results of a case study developed in the University of Jaén (Spain), where the prototype of PV device was deployed. Opera monitoring platform was running from the 13th of October at 9:00 a.m. to the 26th of November at 11:30 a.m., generating a data collection with a duration of 74 days. The location in the campus of the University of Jaén was (latitude: 37.787253, longitude: −3.776258), which is shown in Figure 5.
In the experimental setup, 5 sensors, which were installed in the PV device, collected next measures (irradiance, ambient temperature, module temperature, output current and output voltage). Output electric power is obtained by a simple calculus: P = V*I.
The values where summarized for each 10 min, min, using average aggregation function and sending them to a central database. A total of 10,677 samples were collected.
For training and evaluation purposes, a one-week-left cross-validation was carried out. The evaluation was developed in streaming taking into account current and previous measures with a sliding window, which simulate the forecasting of output power under real-time conditions. The size of the sliding temporal window was defined in two hours h, it is 12 10-min samples which correspond to 2 h.
3.2. Results
To forecast the output power from the data collected in the PVS, we compared the predicted and ground truth in the tests under one-week-left cross-validation. Three models were evaluated:
- Araujo model. It is a good standard for forecasting output power in photovoltaic system, which is based on analytical modeling.
- 2LSTM model. Two layers of LSTMs (described in Section 2.2).
- 3CNN + 2LSTM model. Three layers of CNNs to extract features together with two layers of LSTMs (described in Section 2.2) are evaluated.
The output power estimated and the ground truth from the full time-line of tests are compared using the Mean Absolute Error (MAE) and Root Mean Squared Error (RMSE), as presented in Table 3.
3.3. Discussion
Two different DL models, the first one with LSTM layers only and the second one with CNN and LSTM layers, were trained and validated on the data collected from a PV System. We evaluated their accuracy and compared the results against the Araujo analytical model.
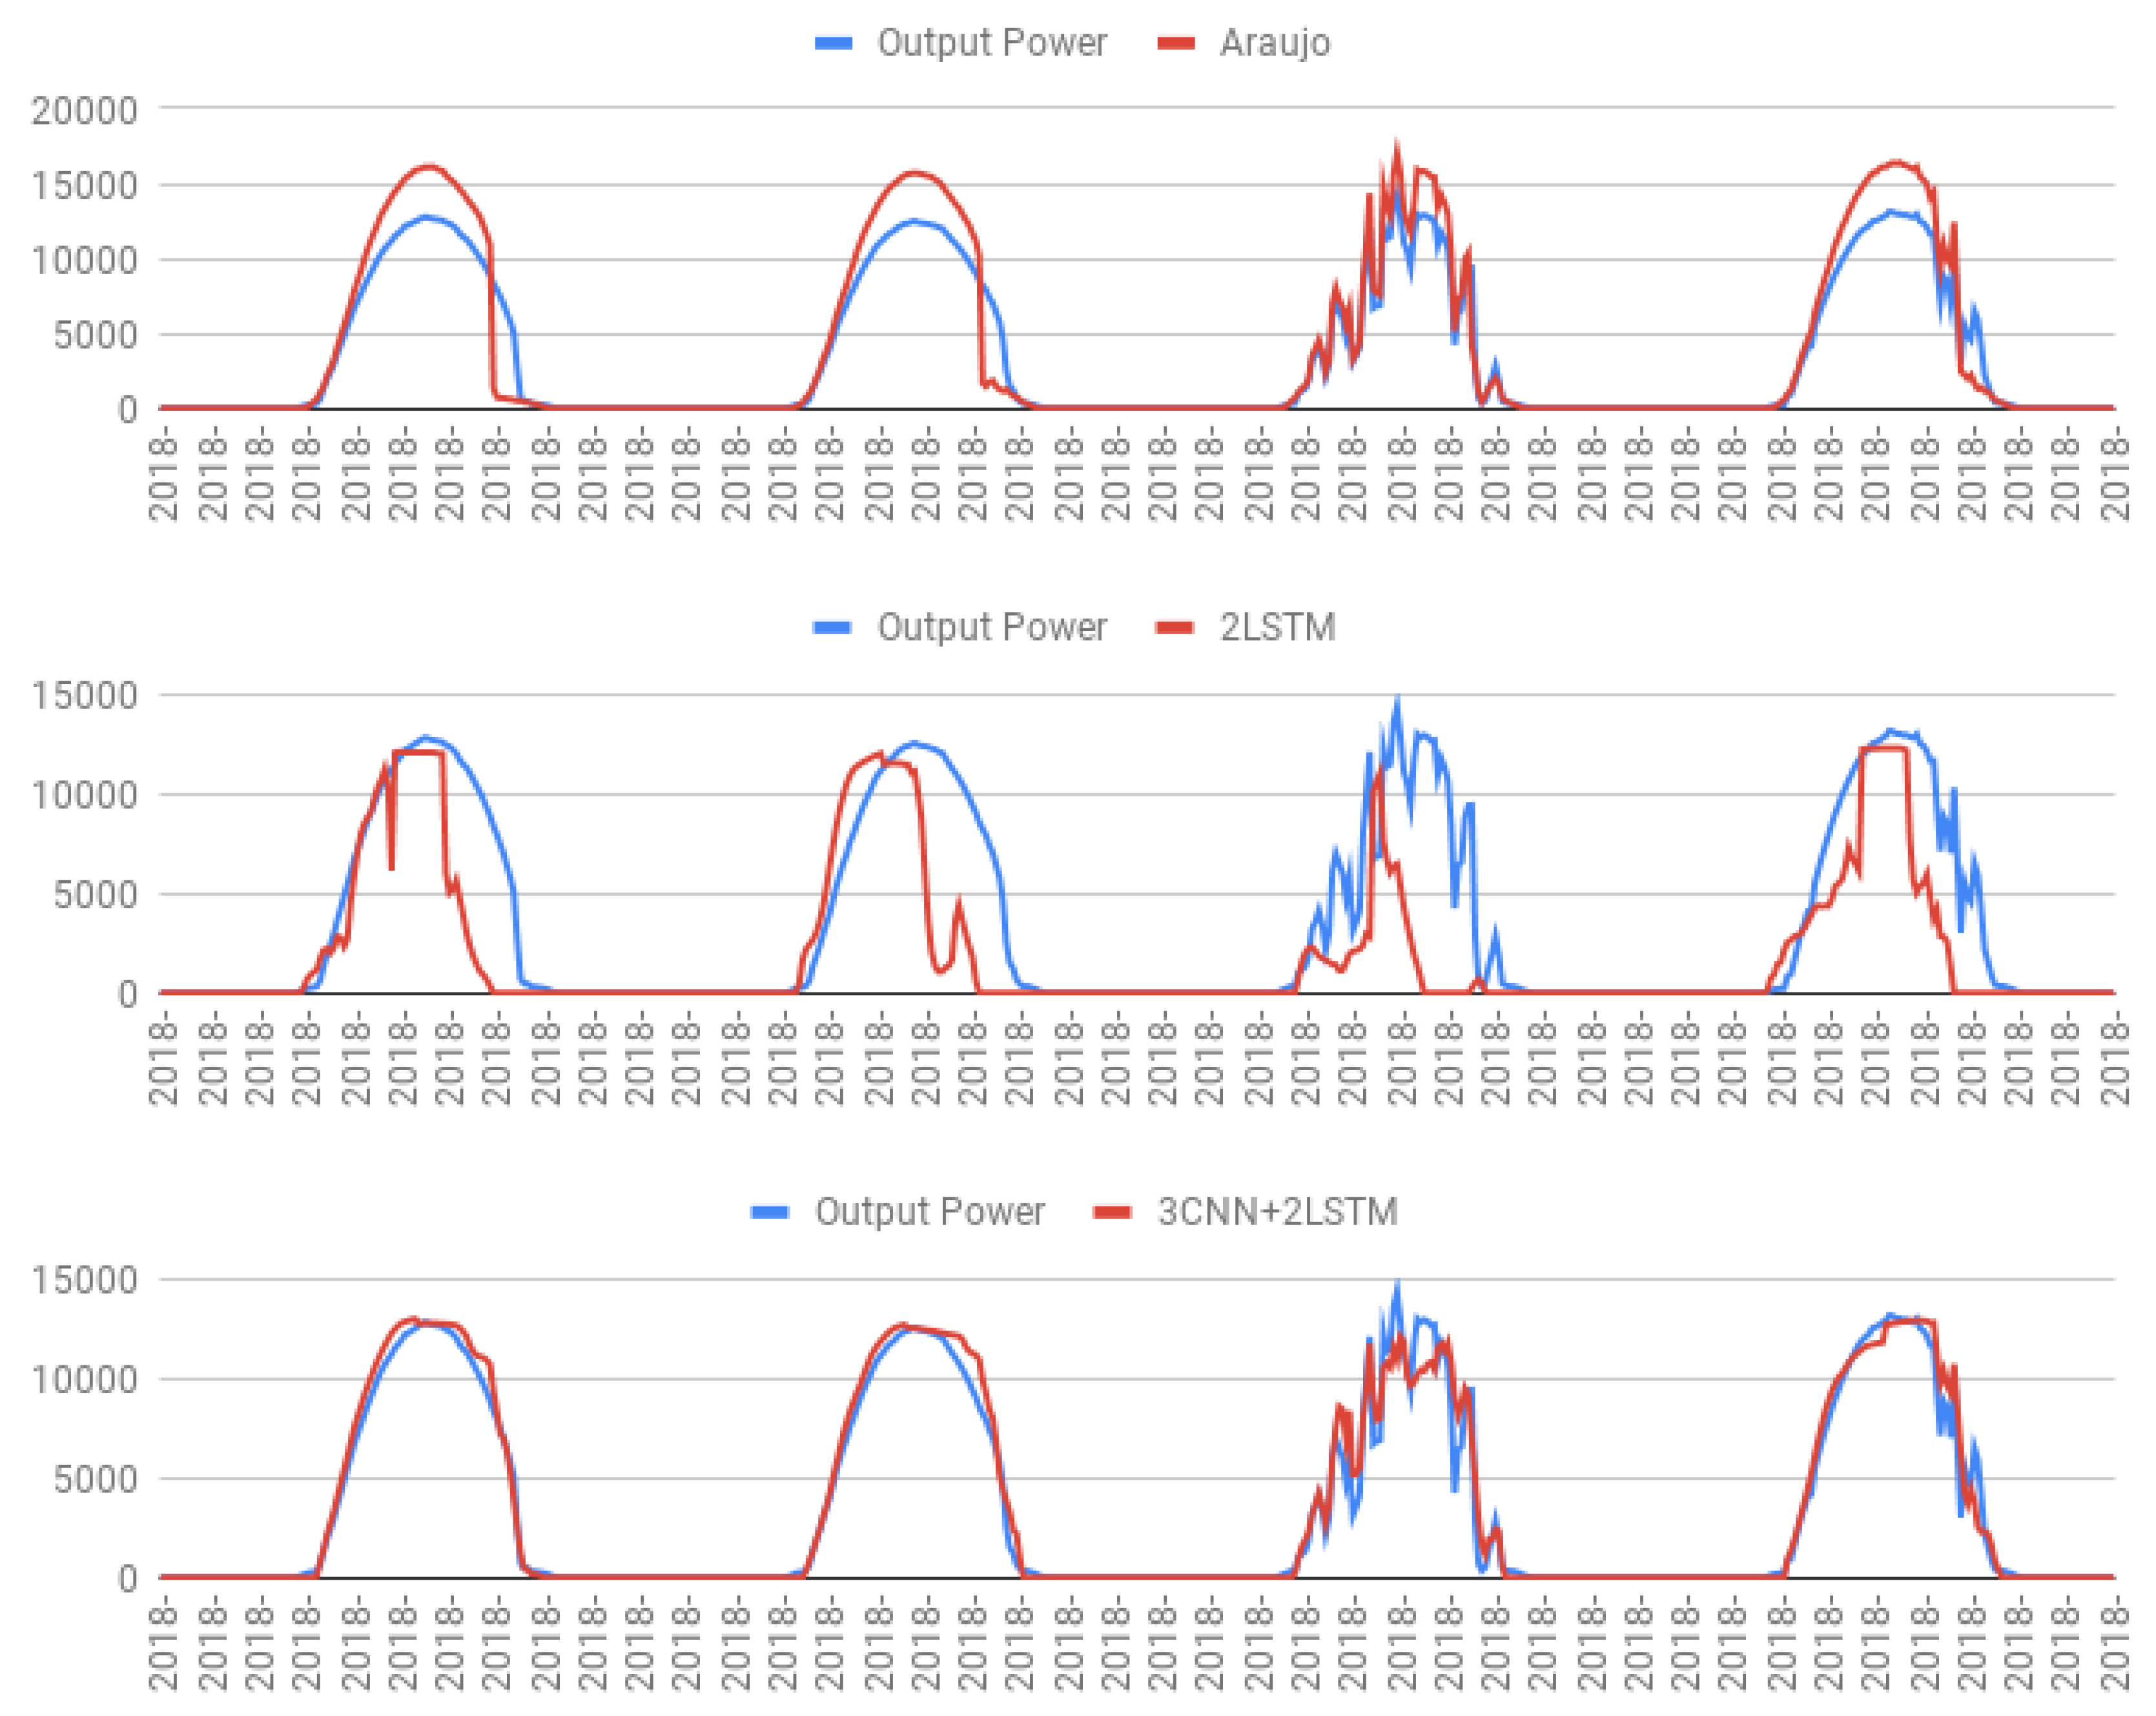
The accuracy of the 2LSTM model was worse than Araujo and do not a suitable performance for a monitoring system, potentially raising too many false alerts due to big discrepancies between the predicted and the actual output power. The accuracy of the 3CNN + 2LSTM model was remarkable, improving Araujo results in terms of MAE and RMSD and confirming it is a good fit for a forecasting and monitoring model (See Figure 6 and Figure 7). This model succeeded in adapting automatically to the deployment context, non-standard environmental conditions and non-initial parameters of the PV system, such as partial shading on the solar panel and system deterioration over time.
4. Conclusions and Ongoing Works
The results of the experimental setup show that deep learning models are an encouraging approach to forecast the behaviour of PV systems.
We note that, unlike the analytical models as the one defined by Araujo, the versatility of deep learning models to extract features from raw data enables real-time monitoring and forecasting of any kind of PV generator or topology.
In future works, we will extend the deployment of more complex photovoltaic systems in wider areas within the Opera project. Modeling data from different location contexts and topologies will present a challenge to forecast under deep learning models. Some of the key properties of a monitoring system will be put to test: near real time forecasting, integration in a live monitoring application, ability to deal with seasonality and portability of the model to different PV systems.
Author Contributions
Conceptualization, G.A.-O., G.A. and J.I.F.-C.; deep learning model, G.A.-O. and J.M.Q.; hardware, sensor, J.I.F.-C.; validation, formal analysis, investigation, supervision, all authors.
Funding
This contribution was supported by the Cátedra ELAND for Renewable Energies of the University of Jaén, by the Spanish government by means of the project RTI2018-098979-A-I00 and the postdoctoral research grant Action-6 of the University of Jaén.
Conflicts of Interest
The authors declare no conflict of interest.
Abbreviations
The following abbreviations are used in this manuscript:
| FF | Fill Factor |
| IoT | Internet of Things |
| LD | linear dichroism |
| CNN | Convolutional Neural Network |
| LSTM | Long Short-Term Memory |
| DL | Deep Learning |
| O&M | Operation and Maintenance |
| PV | Photovoltaic |
| PVS | Systems (PVS) |
References
- Renewables Information 2017: with 2016 Data; International Energy Agency (IEA): Paris, France, 2017.
- O&M Best Practices Guidelines; Solar Power Europe: Brussels, 2016.
- Global Market Outlook for Solar Power, 2019–2023; Solar Power Europe: Brussels, 2019.
- Bermejo, J.F.; Fernández, J.F.G.; Polo, F.O.; Márquez, A.C. A review of the use of artificial neural network models for energy and reliability prediction. A study of the solar PV, hydraulic and wind energy sources. Appl. Sci. 2019, 9, 1844. [Google Scholar] [CrossRef]
- Luque, A.; Hegedus, S. Handbook of Photovoltaic Science and Engineering; Wiley: New Jersey, 2012. [Google Scholar]
- Rus-Casas, C.; Aguilar, J.D.; Rodrigo, P.; Almonacid, F.; Pérez-Higueras, P.J. Classification of methods for annual energy harvesting calculations of photovoltaic generators. Energy Convers. Manag. 2014, 78, 527–536. [Google Scholar] [CrossRef]
- Almeida, M.P.; Muñoz, M.; De La Parra, I.; Perpiñán, O. Comparative study of PV power forecast using parametric and nonparametric PV models. Sol. Energy 2017, 155, 854–866. [Google Scholar] [CrossRef]
- De La Parra, I.; Muñoz, M.; Lorenzo, E.; García, M.; Marcos, J.; Martínez-Moreno, F. PV performance modelling: A review in the light of quality assurance for large PV plants. Renew. Sustain. Energy Rev. 2017, 78, 780–797. [Google Scholar] [CrossRef]
- Fuentes, M.; Nofuentes, G.; Aguilera, J.; Talavera, D.L.; Castro, M. Application and validation of algebraic methods to predict the behaviour of crystalline silicon PV modules in Mediterranean climates. Sol. Energy 2007, 81, 1396–1408. [Google Scholar] [CrossRef]
- Araujo, G.L.; Sánchez, E. Analytical expressions for the determination of the maximum power point and the fill factor of a solar cell. Sol. Cells 1982, 5, 377–386. [Google Scholar] [CrossRef]
- Fuentes, M.; Vivar, M.; Burgos, J.M.; Aguilera, J.; Vacas, J.A. Design of an accurate, low-cost autonomous data logger for PV system monitoring using ArduinoTM that complies with IEC standards. Sol. Energy Mater. Sol. Cells 2014, 130, 529–543. [Google Scholar] [CrossRef]
- Daliento, S.; Chouder, A.; Guerriero, P.; Massi Pavan, A.; Mellit, A.; Moeini, R.; Tricoli, P. Monitoring, Diagnosis, and Power Forecasting for Photovoltaic Fields: A Review. Int. J. Photoenergy 2017, 2017, 1356851. [Google Scholar] [CrossRef]
- Raza, M.; Aslam, N.; Le-Minh, H.; Hussain, S.; Cao, Y.; Khan, N.M. A Critical Analysis of Research Potential, Challenges, and Future Directives in Industrial Wireless Sensor Networks. IEEE Commun. Surv. Tutor. 2018, 20, 39–95. [Google Scholar] [CrossRef]
- Almonacid-Olleros, G.; Vidal, P.G.; Fernández-Carrasco, J.I.; Almonacid, G. Opera Project: Analytic platform based on Big Data and Business Intelligence to improve Operation and Maintenance in PV generators. In Proceedings of the 2018 IEEE International Conference on Environment and Electrical Engineering, Palermo, Italy, 12–15 June 2018. [Google Scholar]
- Available online: https://www.enelgreenpower.com/es/historias/a/2017/08/Big-Data-el-oro-digital-de-las-renovables (accesed on 18 June 2019).
- Available online: https://www.acciona.com/es/lineas-de-negocio/energia/proyectos-emblematicos/centro-control-energias-renovables/ (accesed on 18 June 2019).
- Gamboa, J.C.B. Deep learning for time-series analysis. arXiv 2017, arXiv:1701.01887. [Google Scholar]
- Hochreiter, S.; Schmidhuber, J. LSTM can solve hard long time lag problems. In Advances in Neural Information Processing Systems; MIT: Denver, CO, USA, 1997; pp. 473–479. [Google Scholar]
- Wang, J.; Chen, Y.; Hao, S.; Peng, X.; Hu, L. Deep learning for sensor-based activity recognition: A survey. Pattern Recognit. Lett. 2019, 119, 3–11. [Google Scholar] [CrossRef]
- Medina-Quero, J.M.; Lopez-Medina, M.A.; Hidalgo, A.S.; Espinilla, M. Predicting the Urgency Demand of COPD Patients from Environmental Sensors within Smart Cities with High-Environmental Sensitivity. IEEE Access 2018, 6, 25081–25089. [Google Scholar] [CrossRef]
- Medina-Quero, J.; Zhang, S.; Nugent, C.; Espinilla, M. Ensemble classifier of long short-term memory with fuzzy temporal windows on binary sensors for activity recognition. Expert Syst. Appl. 2018, 114, 441–453. [Google Scholar] [CrossRef]
- Mocanu, E.; Nguyen, P.H.; Gibescu, M.; Kling, W.L. Deep learning for estimating building energy consumption. Sustain. Energy Grids Netw. 2016, 6, 91–99. [Google Scholar] [CrossRef]
- Qiu, Z.; Yao, T.; Mei, T. Learning spatio-temporal representation with pseudo-3d residual networks. In Proceedings of the IEEE International Conference on Computer Vision 2017, Venice, Italy, 22–29 October 2017; pp. 5533–5541. [Google Scholar]
- Abdel-Hamid, O.; Mohamed, A.-R.; Jiang, H.; Deng, L.; Penn, G.; Yu, D. Convolutional neural networks for speech recognition. IEEE Trans. Audio Speech Lang. Proc. 2014, 22, 1533–1545. [Google Scholar] [CrossRef]
- Peng, P.; Zhao, X.; Pan, X.; Ye, W. Gas classification using deep convolutional neural networks. Sensors 2018, 18, 157. [Google Scholar] [CrossRef] [PubMed]
- Huang, C.J.; Kuo, P.H. A deep cnn-lstm model for particulate matter (PM2. 5) forecasting in smart cities. Sensors 2018, 18, 2220. [Google Scholar] [CrossRef]
- Drif, M.; Perez, P.J.; Aguilera, J.; Almonacid, G.; Gomez, P.; De la Casa, J.; Aguilar, J.D. Univer Project. A grid connected photovoltaic system of 200kWp at Jaen University. Overview and performance analysis. Sol. Energy Mater. Sol. Cells 2007, 91, 670–683. [Google Scholar] [CrossRef]
- European Standard IEC 61724:2017. Photovoltaic System Performance Monitoring. Guidelines for Measurement, Data Exchange and Analysis; International Electrotechnical Commission (IEC): Geneva, Switzerland, 2017. [Google Scholar]
- Marino, D.L.; Amarasinghe, K.; Manic, M. Building energy load forecasting using deep neural networks. In Proceedings of the IECON 2016—42nd Annual Conference of the IEEE Industrial Electronics Society, Florence, Italy, 23–26 October 2016; pp. 7046–7051. [Google Scholar]
- Kim, T.Y.; Cho, S.B. Predicting the Household Power Consumption Using CNN-LSTM Hybrid Networks. In Proceedings of the International Conference on Intelligent Data Engineering and Automated Learning, Madrid, Spain, 21–23 November 2018; Springer: Cham, Switzerland, 2018; pp. 481–490. [Google Scholar]
Figure 1.
A view of the PV Generator of the UniVer Project.

Figure 2.
Architecture of the IoT Data Collection System.

Figure 3.
Current and voltage sensors and microprocessor unit.

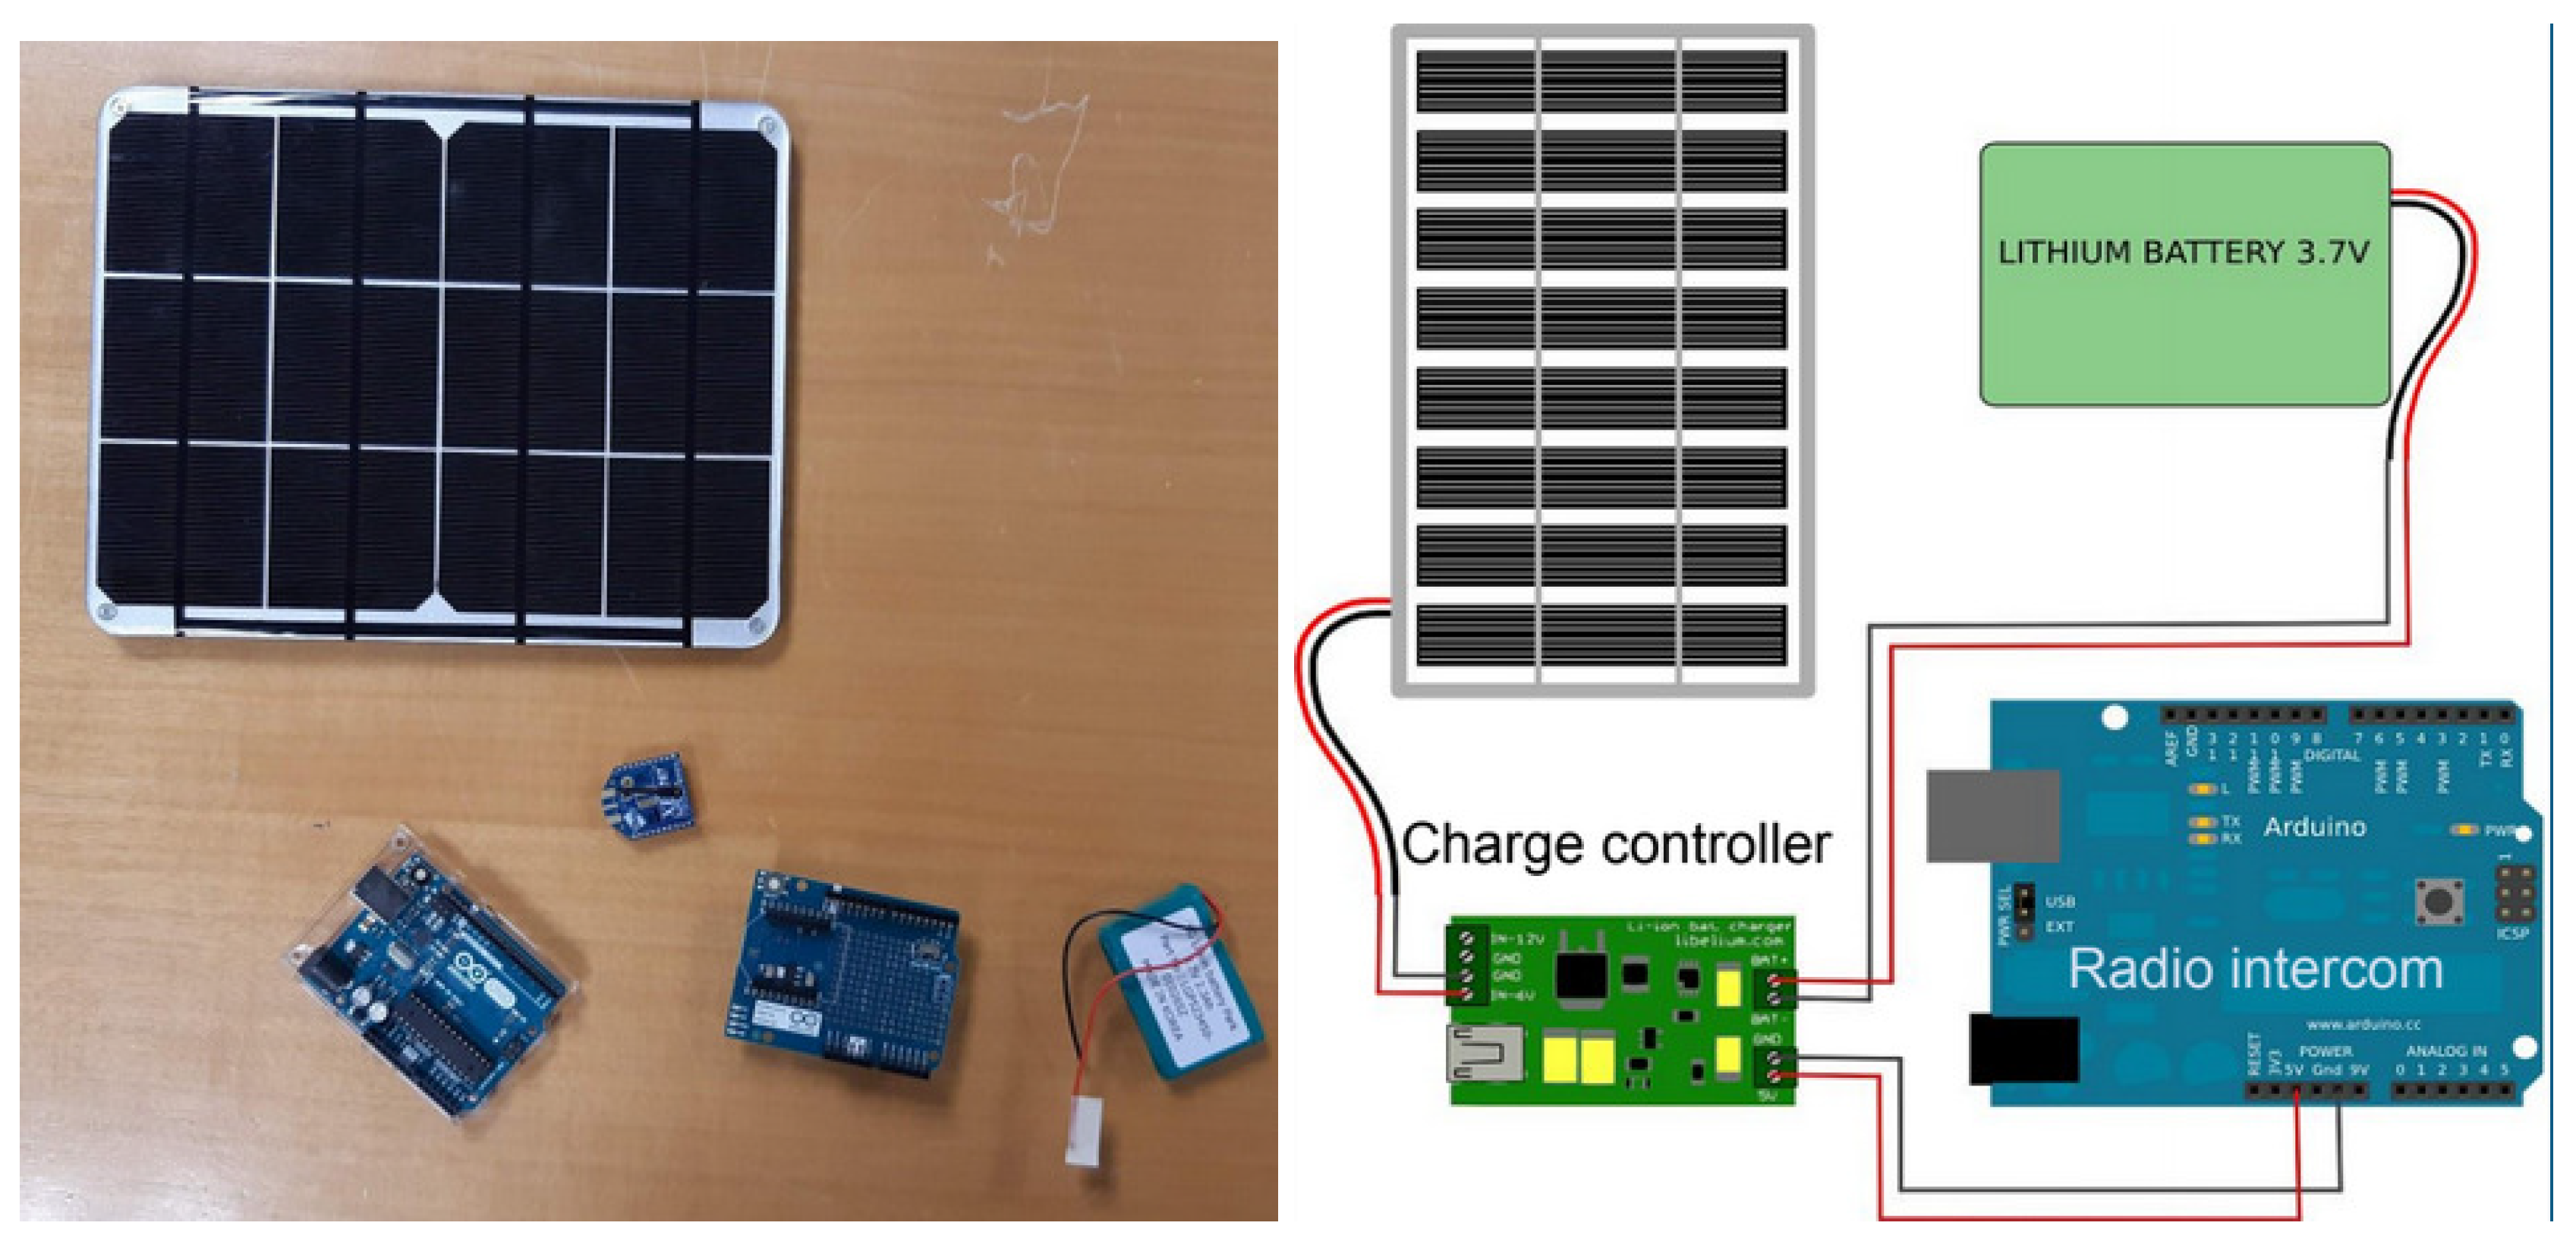
Figure 4.
The proposed devices of power supply, radio interface, radiation and temperature.

Figure 5.
Location of the PV device in the University of Jaén and picture of the deployment.

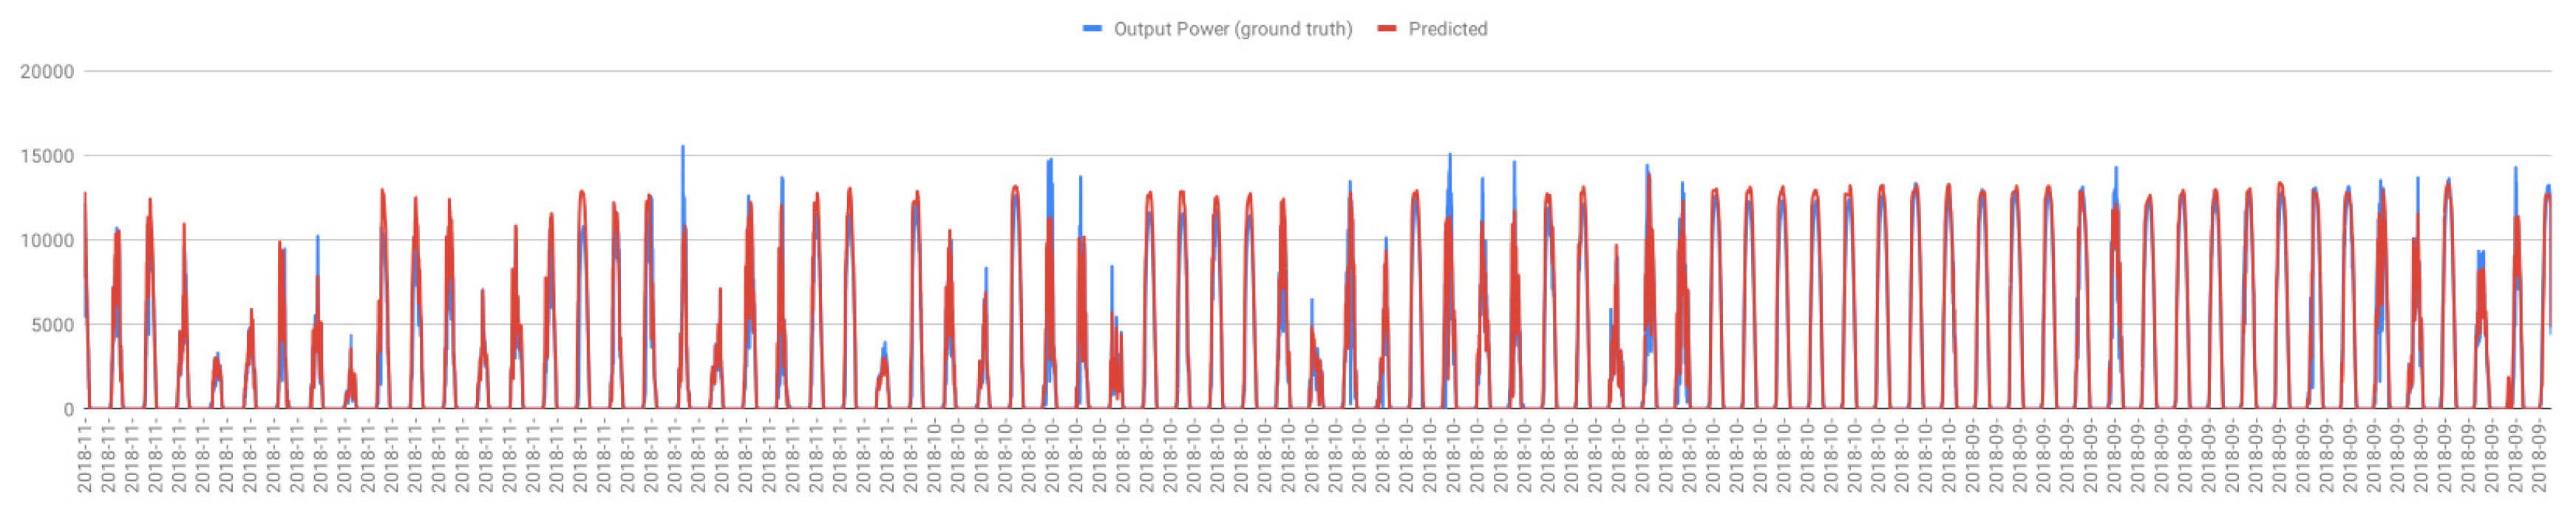
Figure 6.
Forecasting and ground truth of power consumption. The time line is composed by all test from one-week-left cross-validation.
Figure 6.
Forecasting and ground truth of power consumption. The time line is composed by all test from one-week-left cross-validation.

Figure 7.
We show 4 days samples from ground truth of power consumption regarding with: (top) the Araujo model, (middle) LSTM model, (bottom) CNN + LSTM model.
Figure 7.
We show 4 days samples from ground truth of power consumption regarding with: (top) the Araujo model, (middle) LSTM model, (bottom) CNN + LSTM model.


Table 1.
Measured Variables by the Data Collection System.
| Parameter | Symbol | Unit |
|---|---|---|
| Irradiance on PV surface | W·m | |
| Ambient Temperature | C | |
| PVG output current | A | |
| PVG output voltage | V | |
| PVG output power | W |
Table 2.
Configurations of Convolutional Neural Networks.
| 2LSTM |
|---|
| LSTM (32 units) |
| dropout (0.25) |
| LSTM (32 units) |
| dropout (0.25) |
| connected (1 unit) |
| activation function:Re-Lu |
| loss function:MAE |
| 3CNN + 2LSTM |
| 2 kernels × 16 filters |
| Re-Lu |
| 2 kernels × 32 filters |
| Re-Lu |
| 2 kernels × 64 filters |
| Re-Lu |
| dropout (0.25) |
| LSTM (32 units) |
| dropout (0.25) |
| LSTM (32 units) |
| dropout (0.25) |
| connected (1 unit) |
| activation function:Re-Lu |
| loss function:MAE |
Table 3.
Table summarizing the results of output power forecasting.
| Model | MAE | RMSD |
|---|---|---|
| Araujo | 619.09 W | 1349.72 W |
| 2LSTM | 1349.22 W | 2779.18 W |
| 3CNN + 2LSTM | 419.17 W | 931.16 W |
Publisher’s Note: MDPI stays neutral with regard to jurisdictional claims in published maps and institutional affiliations. |
© 2019 by the authors. Licensee MDPI, Basel, Switzerland. This article is an open access article distributed under the terms and conditions of the Creative Commons Attribution (CC BY) license (https://creativecommons.org/licenses/by/4.0/).
Share and Cite
MDPI and ACS Style
Almonacid-Olleros, G.; Almonacid, G.; Fernandez-Carrasco, J.I.; Quero, J.M. Opera.DL: Deep Learning Modelling for Photovoltaic System Monitoring. Proceedings 2019, 31, 50. https://doi.org/10.3390/proceedings2019031050
AMA Style
Almonacid-Olleros G, Almonacid G, Fernandez-Carrasco JI, Quero JM. Opera.DL: Deep Learning Modelling for Photovoltaic System Monitoring. Proceedings. 2019; 31(1):50. https://doi.org/10.3390/proceedings2019031050
Chicago/Turabian StyleAlmonacid-Olleros, G., G. Almonacid, J. I. Fernandez-Carrasco, and Javier Medina Quero. 2019. "Opera.DL: Deep Learning Modelling for Photovoltaic System Monitoring" Proceedings 31, no. 1: 50. https://doi.org/10.3390/proceedings2019031050