
An In-Depth Process Model for Fuel Production via Hydrothermal Liquefaction and Catalytic Hydrotreating


Bauhaus Luftfahrt e. V., 82024 Taufkirchen, Germany
*
Author to whom correspondence should be addressed.
Processes 2021, 9(7), 1172; https://doi.org/10.3390/pr9071172
Submission received: 31 May 2021
/
Revised: 17 June 2021
/
Accepted: 28 June 2021
/
Published: 5 July 2021
(This article belongs to the Special Issue Catalytic Liquefaction Processes of Biomass for Fuels and Chemicals)
Abstract
:One of the more promising technologies for future renewable fuel production from biomass is hydrothermal liquefaction (HTL). Although enormous progress in the context of continuous experiments on demonstration plants has been made in the last years, still many research questions concerning the understanding of the HTL reaction network remain unanswered. In this study, a unique process model of an HTL process chain has been developed in Aspen Plus® for three feedstock, microalgae, sewage sludge and wheat straw. A process chain consisting of HTL, hydrotreatment (HT) and catalytic hydrothermal gasification (cHTG) build the core process steps of the model, which uses 51 model compounds representing the hydrolysis products of the different biochemical groups lipids, proteins, carbohydrates, lignin, extractives and ash for modeling the biomass. Two extensive reaction networks of 272 and 290 reactions for the HTL and HT process step, respectively, lead to the intermediate biocrude (~200 model compounds) and the final upgraded biocrude product (~130 model compounds). The model can reproduce important characteristics, such as yields, elemental analyses, boiling point distribution, product fractions, density and higher heating values of experimental results from continuous experiments as well as literature values. The model can be applied as basis for techno-economic and environmental assessments of HTL fuel production, and may be further developed into a predictive yield modeling tool.
1. Introduction
An increasing number of societies around the globe are targeting climate neutrality by mid-century [1,2,3]. These ambitions require a deep decarbonization of all energy sectors, including an almost complete substitution of crude-oil derived transportation fuels. Hydrothermal liquefaction (HTL) can convert a broad variety of organic feedstock into intermediate biocrudes, which can subsequently be upgraded by catalytic hydrotreatment into mixtures of liquid hydrocarbon fuels. Comparative assessments of advanced biofuel conversion technologies suggest that the HTL pathway has the potential to get developed into a competitive future solution [4], especially for the treatment of wet waste streams such as sewage sludge [5]. Consequently, there is an increasing number of research and development efforts, which explore HTL conversion at pilot scale level.
The potential competitive advantage of HTL is linked to the hydrothermal processing conditions, which enable reactor designs with relatively low level of technological complexity. However, these process conditions give rise to a complex reaction network that links the yield and composition of the HTL biocrude to the initial composition of the feedstock. The characteristic composition of the HTL biocrudes further translates into a feedstock specific composition of the final fuel products that result from hydro-processing. An improved understanding of the product yields and compositions and consequently, also the underlying HTL reaction network is of importance for subsequent system analysis and for the further development of HTL fuel pathways [6]. Consequently, there is already a large number of different HTL models present in literature that can be differentiated by three main objectives. One aim of HTL models is to predict the biocrude yield, another one is the investigation of the underlying reaction network and a third objective is to deliver mass and energy balances for a process chain in order to perform further system analysis in the form of life cycle analysis (LCA) and techno-economic analysis (TEA). HTL biocrude yield prediction models are almost exclusively based on batch experiments with a single model compound or mixtures of model compounds representing the biochemical groups that are typically found in biomass. Teri et al. [7] first considered a linear prediction model but also added interaction terms in order to reproduce the actual behavior more precisely. It turned out however that the prediction model incorporating interaction terms was less accurate than the linear prediction model. Another study compared results of HTL experiments with model mixtures and with food processing residues, also applying a linear and polynomial regression model for the prediction of biocrude yields [8]. One additional aspect that this study brought up was the difference between monomeric and polymeric model compounds. It is generally acknowledged that hydrolysis of polymeric biomass components into monomers and oligomers is the first reaction occurring in HTL and that a fraction of the hydrolysis products repolymerize to form biocrude and solid residue components [9]. However, as shown by Déniel et al., not all polymeric biomass structures behave in the same way and it therefore is important to consider additional aspects, such as rate of hydrolysis under certain reaction conditions, when using monomeric model compounds [8]. As already mentioned, not all biocrude yield models rely on experiments with model compounds. Leow et al. [10] and Li et al. [11] performed a large number of HTL batch experiments with microalgae samples having distinctive feedstock properties or a wide range of compositions, respectively. The biocrude yields as well as properties were predicted based on a multiphase component additivity model. Besides the aforementioned HTL biocrude prediction models, also more process engineering oriented models based on simulation software like Aspen Plus have been reported in literature. Hoffmann et al. investigated a combination of an HTL plant with a biogas plant, using two components, phenol and hexadecanoic acid, for the biocrude modeling and eight reactions for the upgrading unit step in the Aspen Plus simulation [12]. The study was able to deliver mass and energy balances that suggest the feasibility of the conceptual process design. Another conceptual biorefinery design incorporating HTL and hydrotreatment as process steps is performed by Snowden-Swan et al. [13]. The study focused on a techno-economic assessment to investigate minimum fuel selling prices for a system that includes a whole process chain. The underlying Aspen Plus model is largely based on previous studies by Knorr et al. [14] and Jones et al. [6] and uses 16 model compounds for modeling the biocrude and 39 model compounds for modeling the upgraded biocrude. Finally, there are also studies that investigate reactions of the individual biochemical groups as single compound experiments or as mixtures in order to get a better understanding of the underlying HTL reaction network. Matayeva et al. studied the fate of two amino acids, phenylalanine and leucine, as well as binary mixtures of phenylalanine with tripalmitin and phenylalanine with glucose under hydrothermal conditions and derived chemical pathway proposals for the two individual amino acids and the binary mixture of phenylalanine with tripalmitin [15]. Gai et al. investigated two types of low-lipid microalgae under subcritical hydrothermal conditions with varying temperatures. Based on experimental results from GC-MS and 1H-NMR characterization, a general reaction network as well as predicted pathway schemes for HTL of lipids, proteins and non-fibrous carbohydrates in low-lipid microalgae were proposed [16]. A combination of predictive biocrude yield and reaction network study was performed by Yang et al. [17]. The prediction model was developed using a mixture design of five model components and verified with results from actual feedstock and mixtures of model components. Based on the results of the model, synergistic and antagonistic interactions between the individual components could be detected and a generalized reaction network was established.
In the present study, the generalized reaction concepts and predicted pathway schemes mentioned in literature are consolidated [15,16,17], and put into live in a comprehensive Aspen Plus® simulation for three different feedstock. Fifty one model compounds are used as representatives of the biomass. The model compounds are reacted under hydrothermal conditions, which builds the first core process step of the model. The intermediate biocrude product is subsequently processed by catalytic hydrotreatment to yield the final upgraded biocrude. This is the second core process step of the simulation. Next to the biocrude however, HTL conversion also yields gaseous, solid and aqueous product phases. The aqueous phase contains a large fraction of the organic content of the feedstock in form of water-soluble compounds. Therefore, it is desirable to utilize the organic content of the aqueous phase to maximize carbon yields and overall process energy efficiency. Catalytic hydrothermal gasification (cHTG) is an example for a conversion technology that produces a biogas for energetic purposes and thereby treats the process water for responsible disposal. cHTG is therefore included in the model as a third core process step. Based on this comprehensive simulation approach, it is possible to reproduce key process parameters with good agreement to literature results. Furthermore, more detailed chemical analyses give deeper insights into the chemical compositions of modeled biocrudes and upgraded biocrudes. These findings are in reasonable agreement with literature findings for Spirulina and sewage sludge. It is proposed, that results for feedstock with similar compositions to Spirulina and sewage sludge can be deduced. The model can serve as a detailed basis for system analyses studies of HTL fuel production pathways.
2. Methods
In this section, the Aspen Plus® simulation setup is described in detail. Furthermore, key assumptions and parameters of the model are explained.
2.1. Process Development, Biomass Modeling, Property Method and Calculations
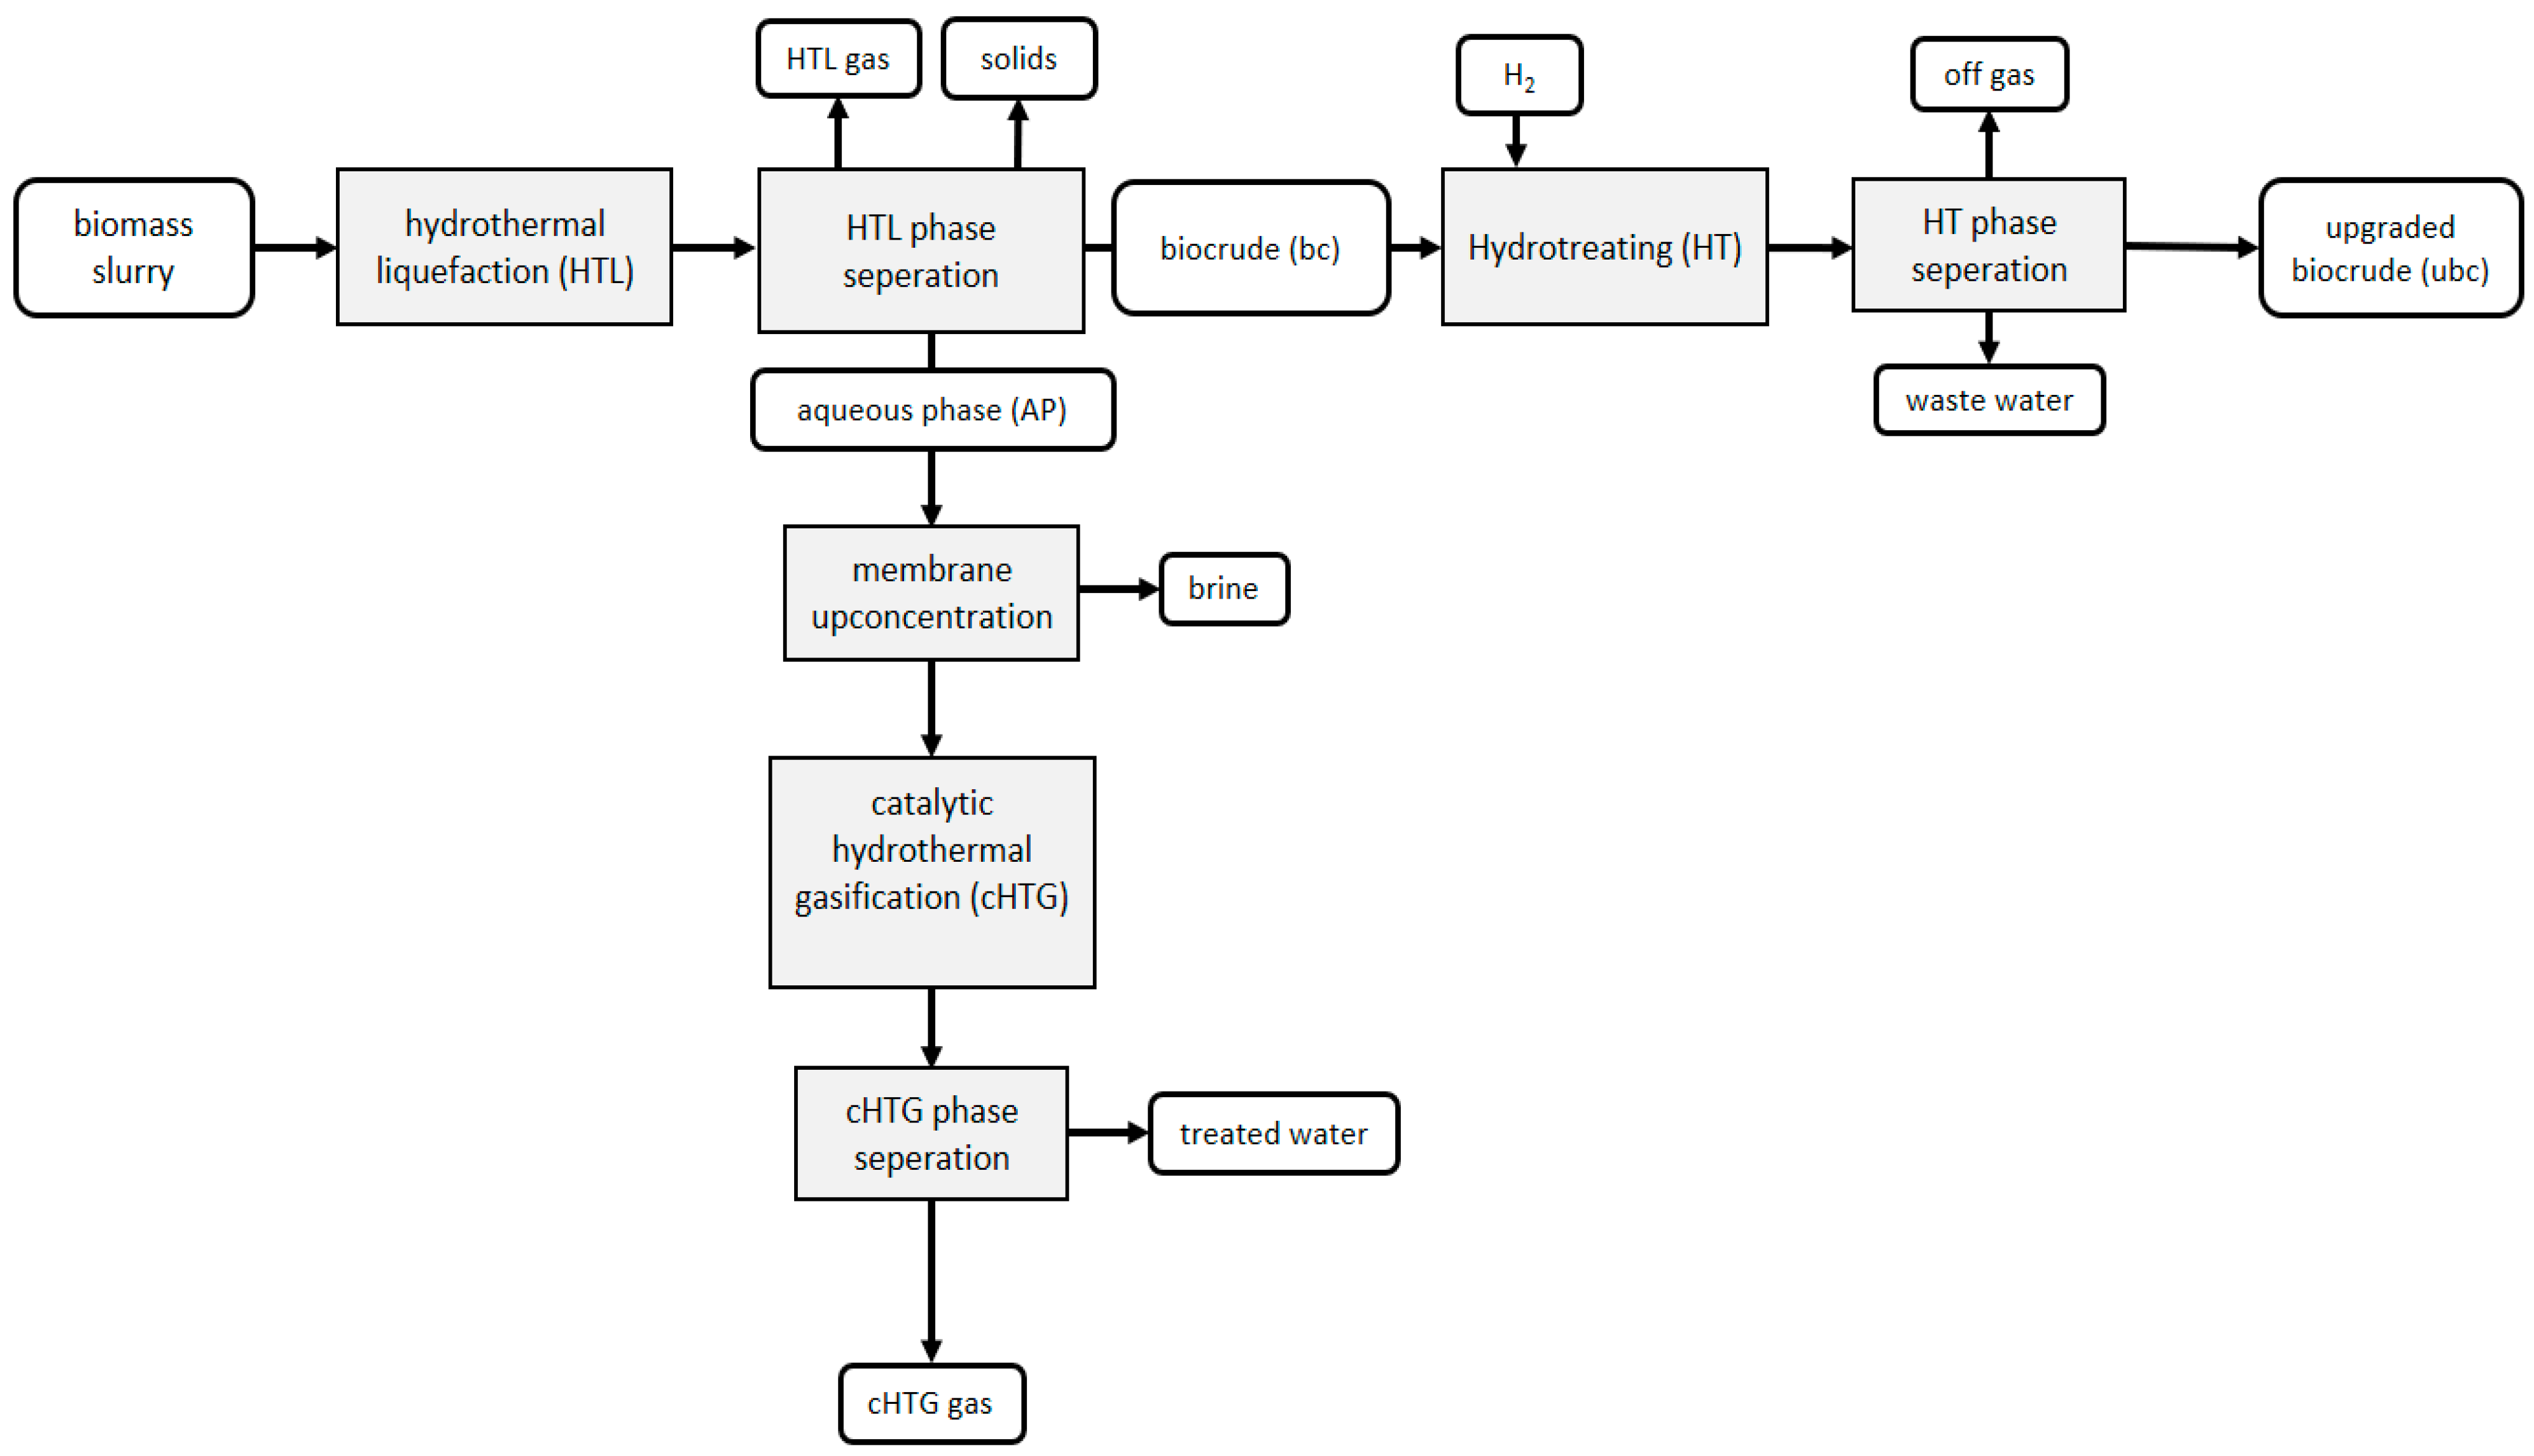
The process model is simulated with Aspen Plus® V 10. It is divided into three main process steps, namely HTL, HT and cHTG, which will be described in detail hereafter. An overview of the process chain is shown in Figure 1. Soave-Redlich-Kwong cubic equation of state is chosen for all thermodynamic properties as base property method, while the Petroleum simulation options were set to “STEAMNBS” for the “free-water method” and to “3” for “water solubility”.
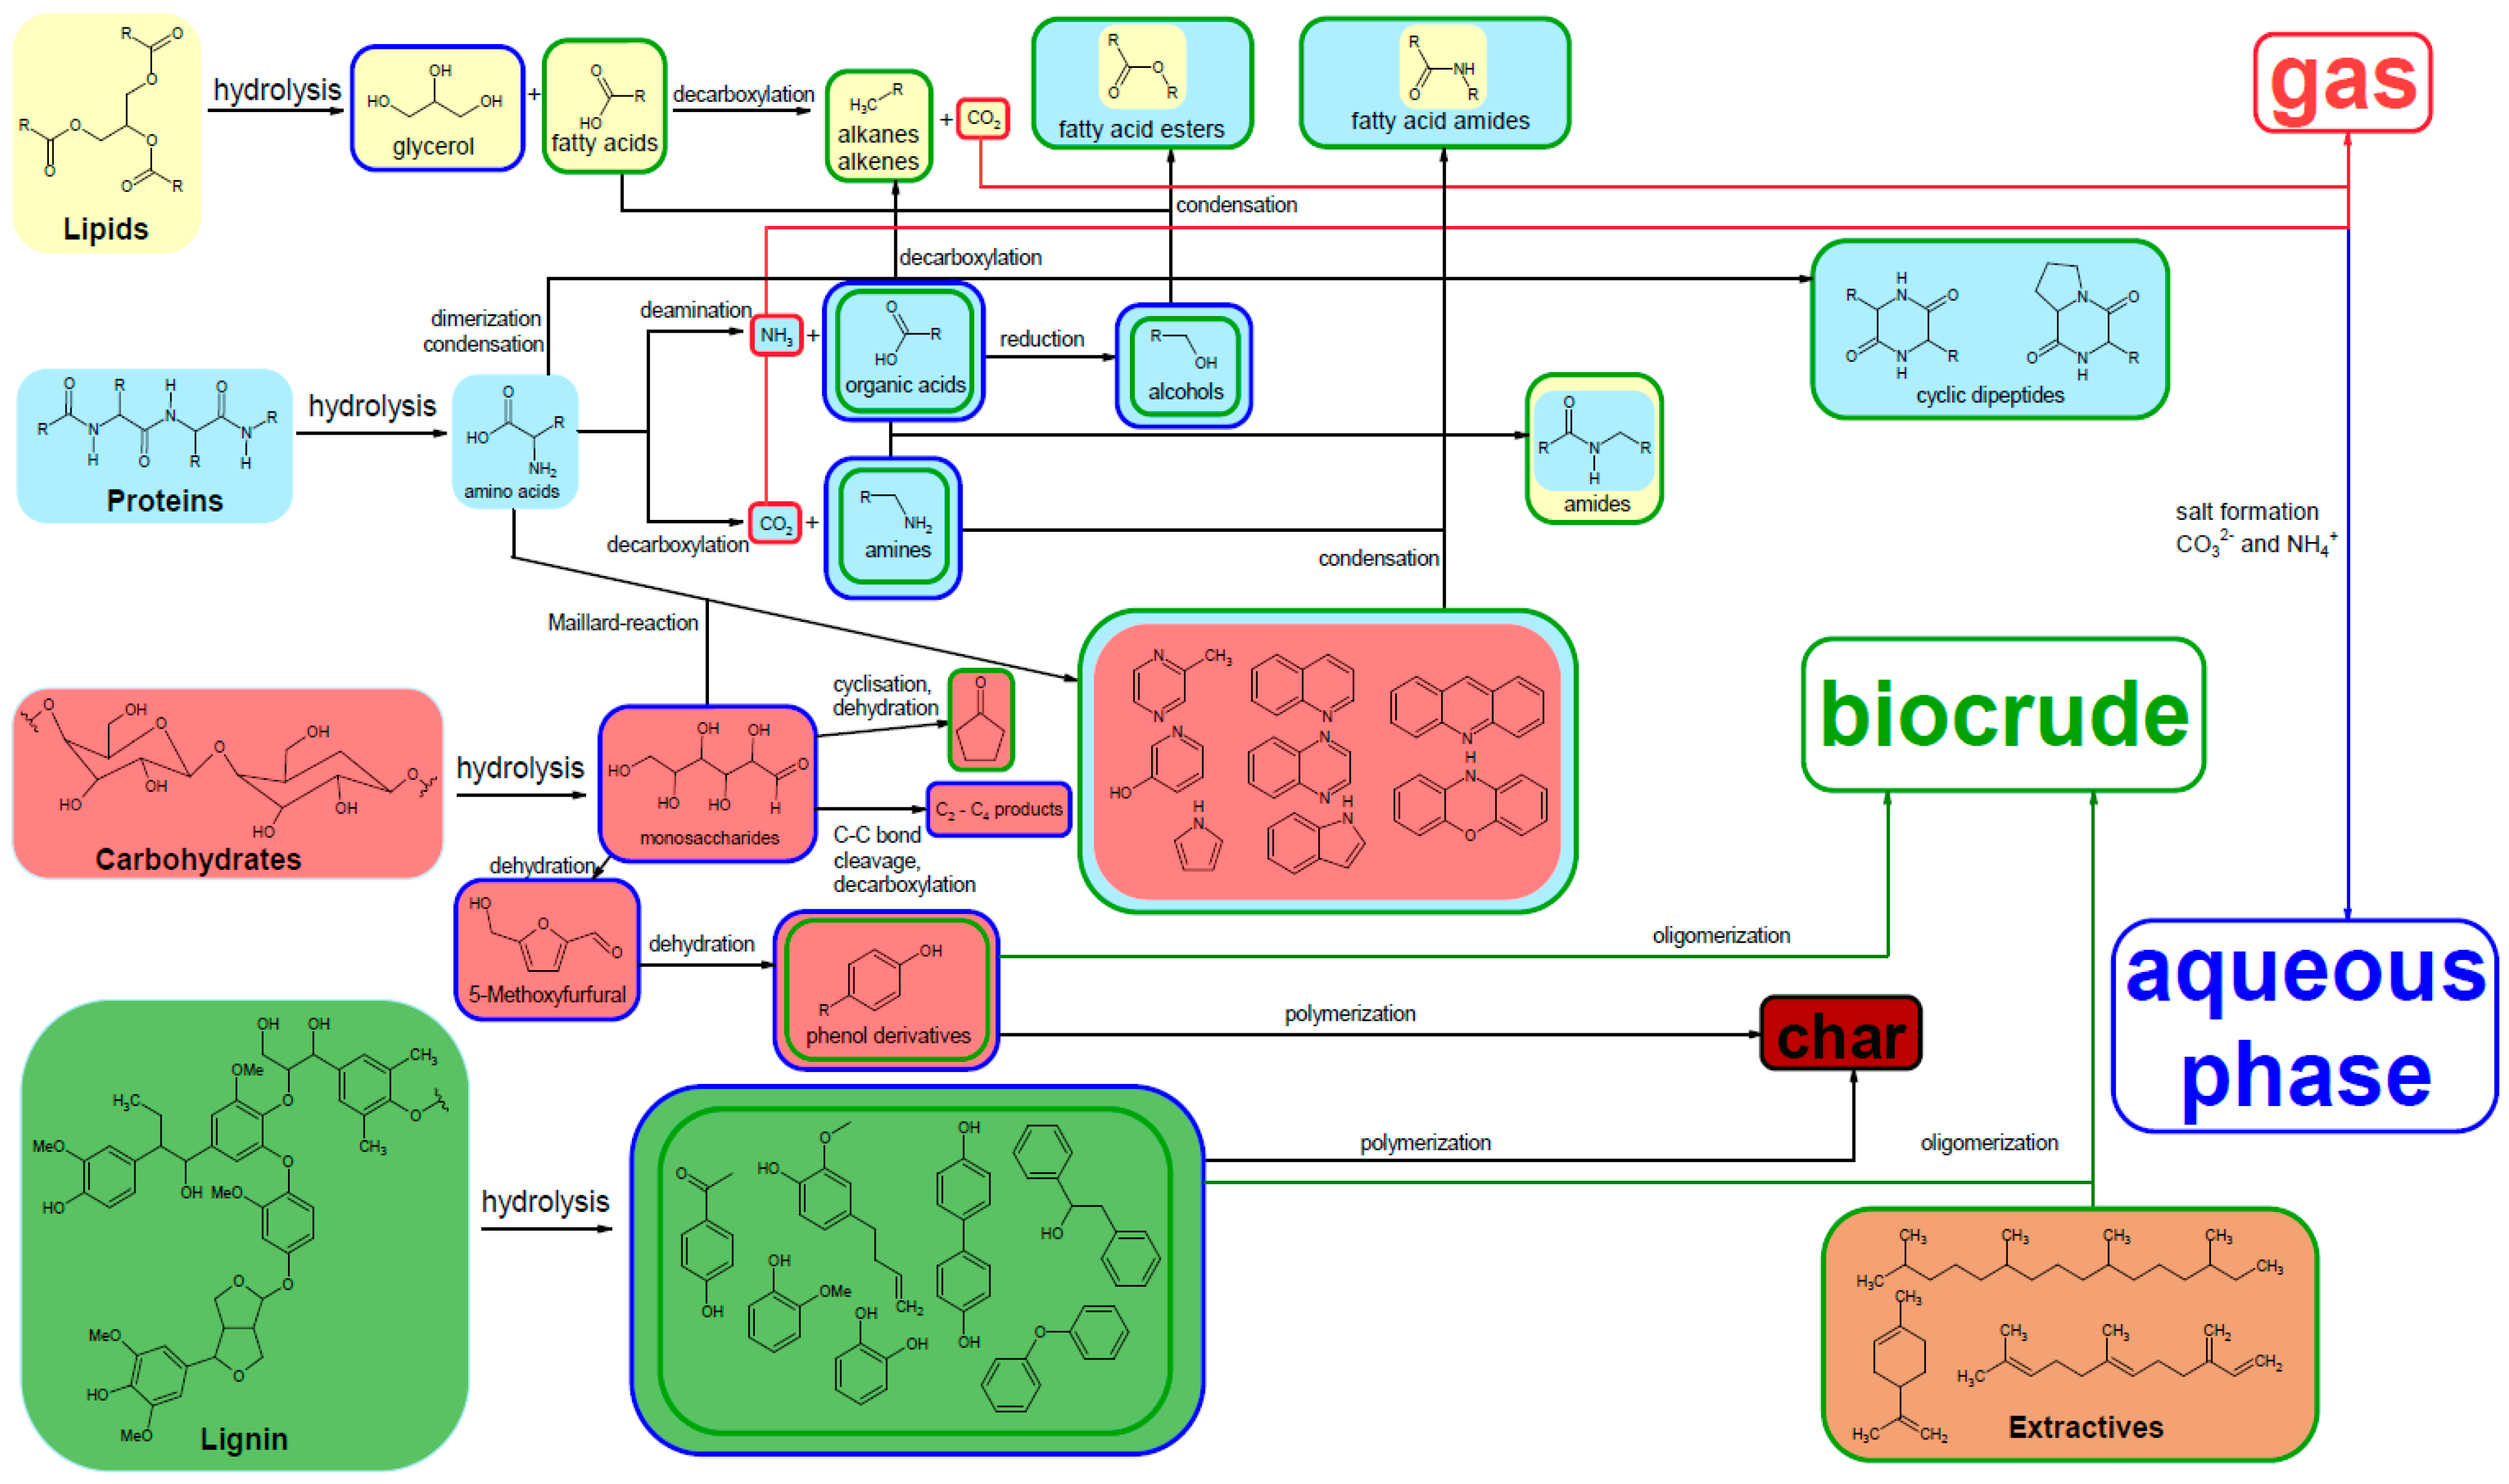
Biomass is modeled based on the assumption, that hydrolysis is the first reaction occurring in HTL [18]. 51 model compounds were chosen to represent typical hydrolysis products of the individual biochemical groups of lipids, proteins, carbohydrates, lignin, extractives and ash. The amounts of each model compound are adapted to optimally replicate the experimentally measured amounts of biochemical groups as well as the results of elemental analyses. The amounts of biochemical groups chosen for the model, as well as experimental results of elemental analyses of the three investigated feedstock as dry matter (dm) and ash-free are shown in Table 1.
In the case of lipids, typical hydrolysis products are fatty acids and glycerol [18]. Six fatty acids are chosen as model compounds. Cellulose and hemicellulose are chosen as macromolecular representatives for the group of carbohydrates. Hydrolysis of cellulose yields the monomeric sugar glucose, while for hemicellulose, a variety of monomeric sugars, such as xylose, arabinose and others, as well as acetic acid and other acids can be obtained [20]. In the simulation, only xylose and acetic acid are chosen as model compounds representing hemicellulose. Proteins are macromolecules consisting of linked amino acids, which are the resulting hydrolysis compounds [18]. Ten amino acids were chosen as model compounds. It should be noted that four of these amino acids, namely cysteine, histidine, proline and arginine could not be modeled directly, due to the missing parameter PLXANT/1st element (data set 1) of the vapor pressure model PL0XANT in the databank NISTV100.NIST-TRC, which caused the simulation to stop. In order to allow the simulation to be completed, these four amino acids were replaced by alternative compounds, namely 3-mercaptopropionic acid for cysteine, 2-ethylimidazole for histidine, pyrrolidine for proline and valeric acid for arginine. Missing amounts of nitrogen are compensated by the addition of ammonia, missing acid moieties are modeled as additional formic acid. Lignin is a highly heterogeneous polymer whose biosynthesis precursors are three lignols, namely coniferyl alcohol, sinapyl alcohol and paracoumaryl alcohol, which are cross-linked in diverse ways [21,22]. During hydrolysis, different linkages are broken, which leads to a variety of possible compounds. Therefore, 13 model compounds are chosen for the representation of the lignin part of biomass. For woody biomass, extractives can contribute a significant portion of up to 10 wt% to the biomass [22]. Therefore, model compounds from different classes of extractives, such as terpenes, waxes and sterols are chosen as representative model compounds. Ash components are modeled as metal oxides, hydroxides and phosphates, representing some of the abundant metals as well as phosphorous. For simplicity, the ash components are assumed to be solids, having no impact on the reactions occurring during the different process steps. All 51 model compounds and their respective masses for the three different feedstock are listed in Table S1 in the supporting information (SI). All further information on the Aspen Plus® model can be found in the Aspen Plus input files attached in the SI. Missing parameters “standard enthalpy of formation” (DHFORM) and “standard Gibbs free energy of formation” (DGFORM) have been estimated using the properties estimation Joback method based on the Joback Group contribution method [23]. Mass balances are normalized to 1 kg of dry biomass feedstock, considering the different levels of hydrolysis assumed for the different biochemical groups. For further analysis, like LCA or TEA, the flow rate of 1 kg h−1 can be adapted as needed. TOC values of the different aqueous phases have been evaluated assuming the volumes of the organic/water mixtures being equal to the mass of water, considerung a density of 1 kg/L. Due to the high ratio of water to organics this approximation seems reasonable. Elemental analyses have been computed using the molar amount of each model component and multiplying it with the corresponding amount of mass of each element present in the model compound. The sum of each element over all model compounds devided by the sum of all elements over all model compounds gives the relative abundance of each element in each process stream. Boiling point distribution curves have been generated by sorting all model compounds according to their respective boiling points in ascending order. The sum of the amounts of masses of the model compounds then gives the theoretical amount of recovered sample up to a certain boiling point. Molar mass distributions have been obtained by plotting the amount of each model component present in a certain stream over the respective molecular mass of the individual model components. A list of all model compounds and their respective molecular mass can be found in Table S2. cHTG gas compositions are calculated based on molar ratios of species present in the gaseous phase. Deoxygenation and denitrogenation rates are calculated according to Haider et al. [24]. Hydrogen consumptions are estimated by the following equation:
where C(H2) is the hydrogen consumption, m(H2,in) is the mass of hydrogen input, m(H2,out) is the mass of hydrogen in the output stream and m(bc) is the biocrude mass.
2.2. Hydrothermal Liquefaction Unit
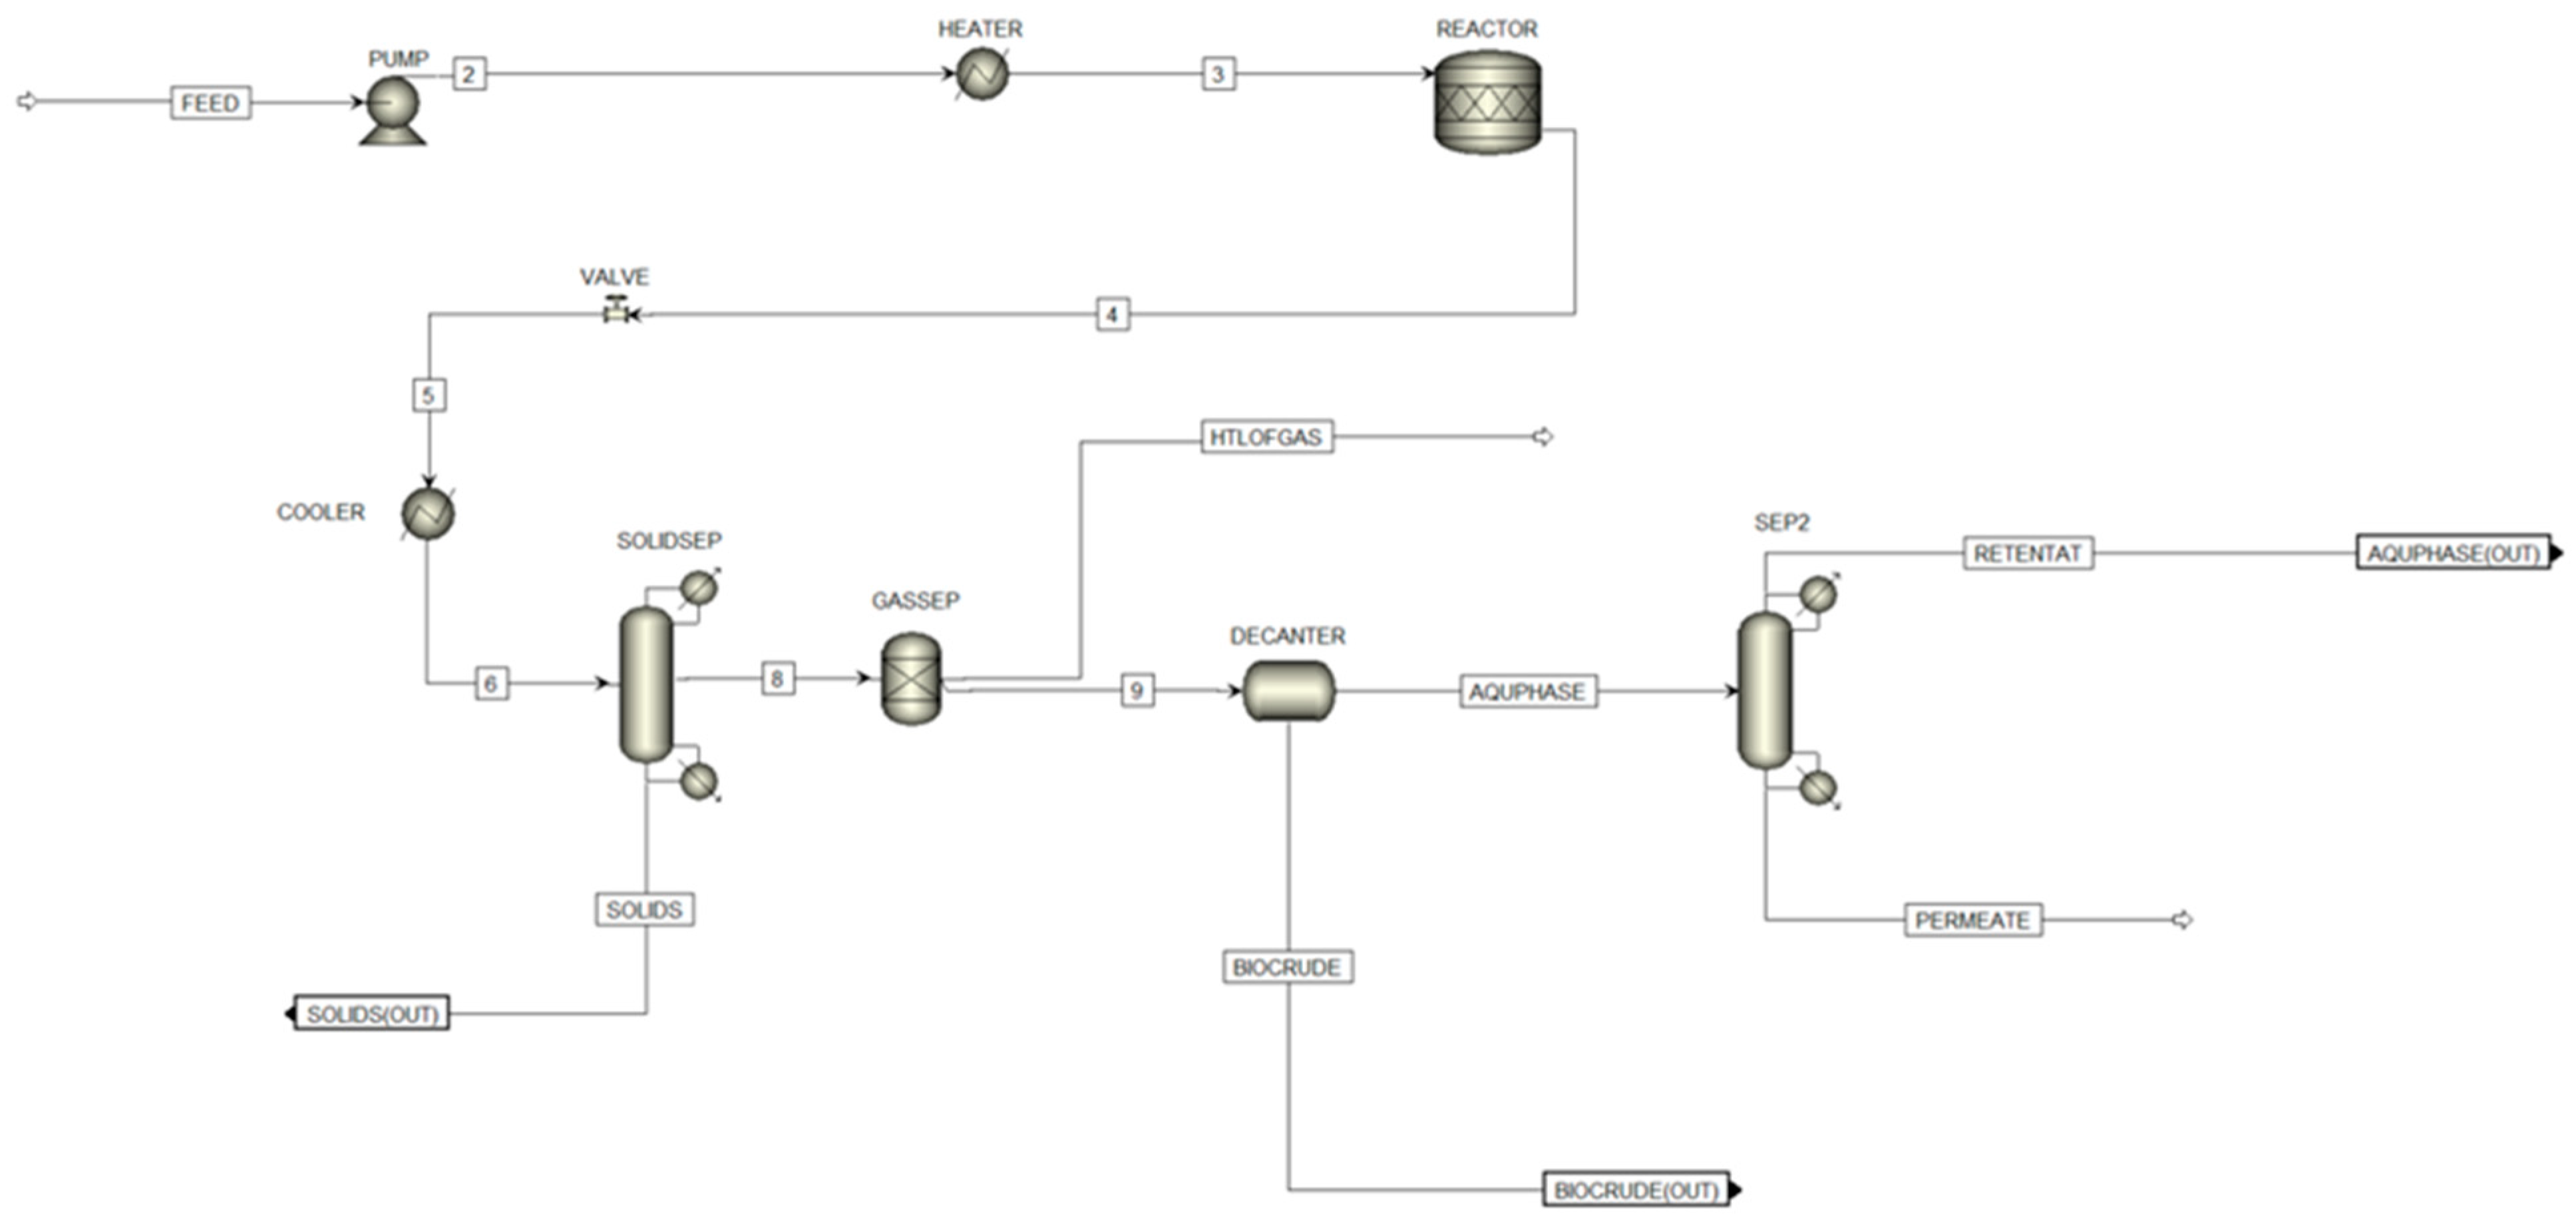
The general setup of the HTL unit process step is shown in Figure 2. The feedstock slurry is modeled as a mixture of dry biomass and water. Dry-matter contents are 17.1 wt%, 18.2 wt% and 18.1 wt% for Spirulina, sewage sludge and wheat straw, respectively. The slurry is pumped and heated to the HTL reactor (RStoic, 350 °C, 220 bar). The fractional conversions of the modeled reactions (272) are adapted in such a way, that the biocrude stream matches the experimental results of elemental analysis and boiling point distribution. An overview of the main considered biomass groups and the corresponding HTL reactions are shown in Figure 3. All relevant information concerning the model can be found in the Aspen Plus® input files in the SI.
The resulting stream is depressurized and subsequently cooled down to 2 bar and 100 °C. In the solid separator, parts of the solids can be removed. Subsequently, the phase separation is performed, which results in the HTL gas phase, the aqueous phase and the biocrude phase (~200 model compounds). The remaining solids are distributed over the aqueous phase and the biocrude phase. The biocrude phase is sent to the HT unit, while the aqueous phase is further treated with a membrane upconcentration. Due to simplicity reasons, the membrane upconcentration is not modeled in detail.
All model compounds are assumed to be filtered in an equal amount. Therefore, the split fractions, defined in the separation unit, are set to 0.78 for each component, which means, that 78% of the organic material is separated into the retentate. The resulting permeate is treated as wastewater while the retentate is sent to the cHTG unit.
2.3. Catalytic Hydrothermal Gasification
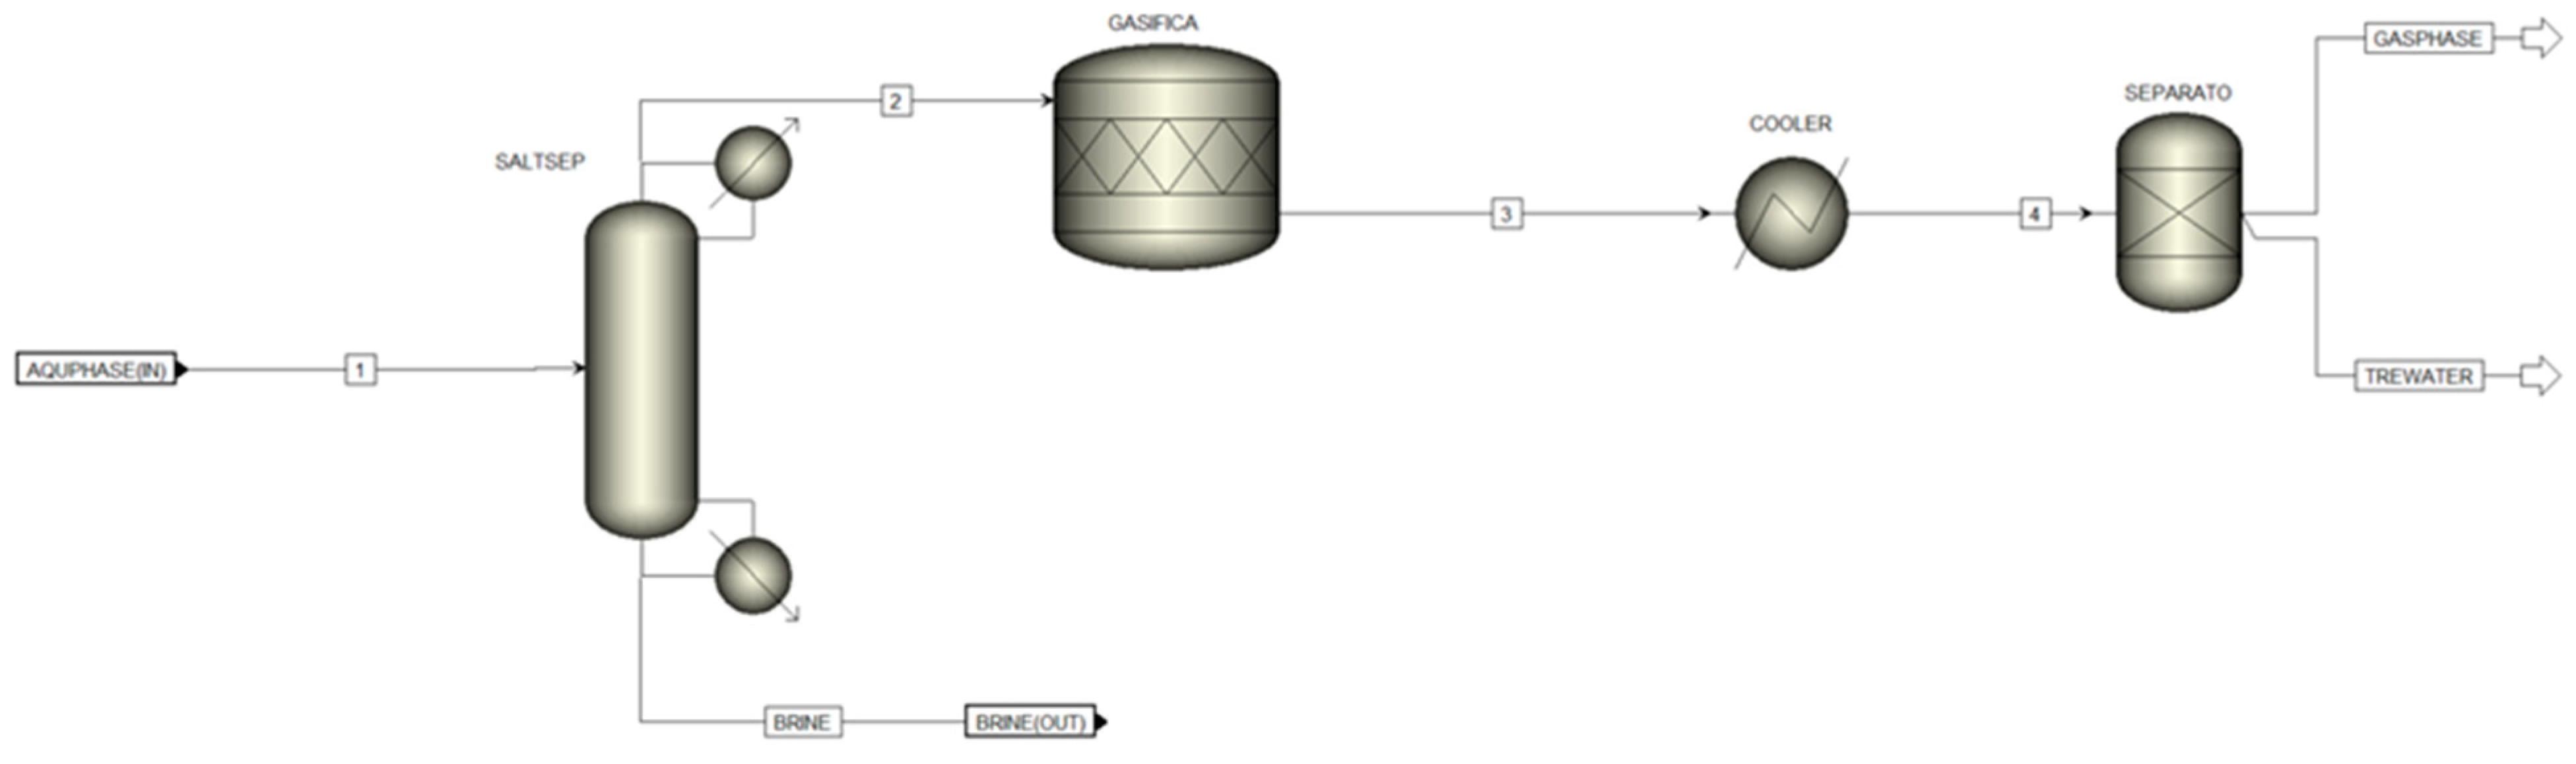
Figure 4 shows the flowsheet of the cHTG process step. Since the cHTG catalyst is prone to deactivation, a salt separator has to be integrated into the process. The resulting brine phase is treated as wastewater, while the remaining stream is heated and pressurized to 450 °C and 280 bar, respectively and processed in the cHTG reactor.
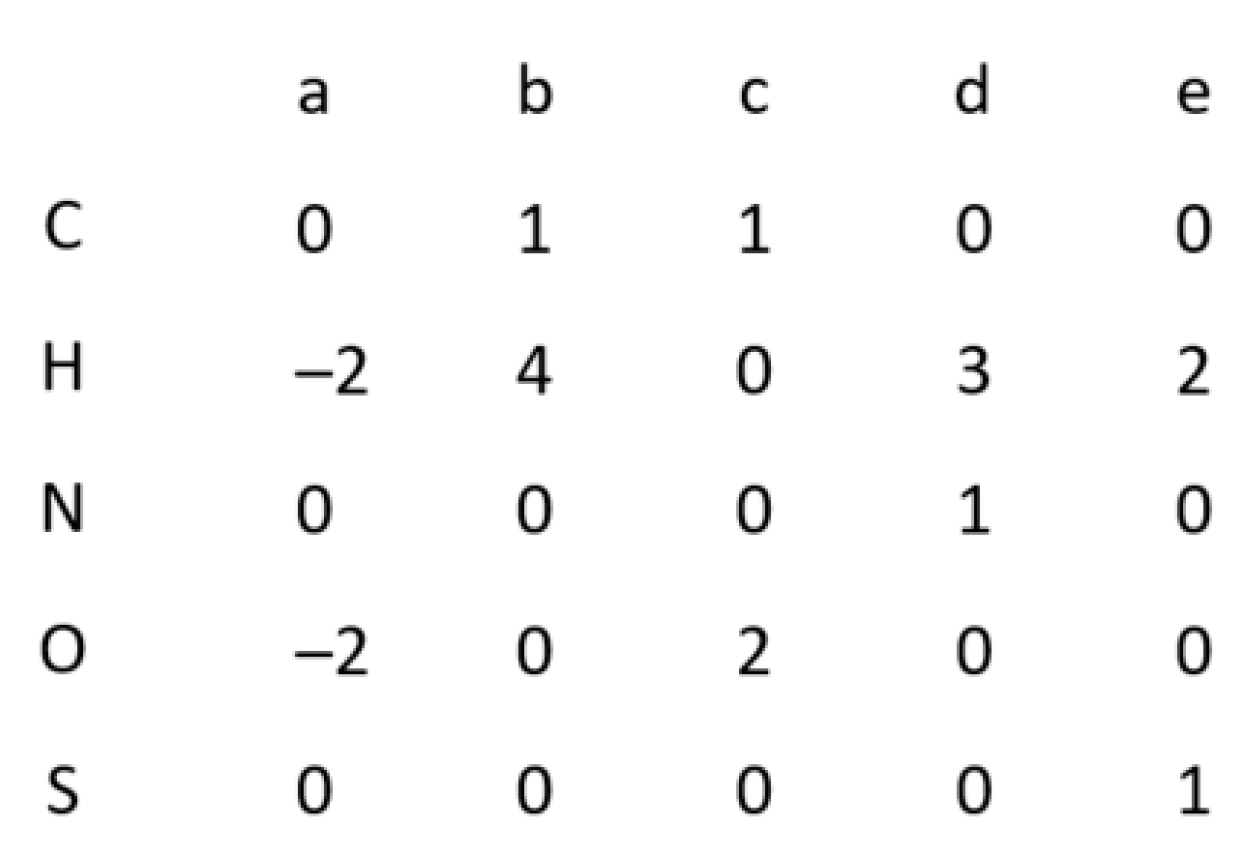
A process efficiency of 90% is assumed for the cHTG process. Therefore, the fractional conversion factors for all reactions (281) modeled in the cHTG reactor are set to a value of 0.9, which is at the high end of experimental conversion factors that can be found in literature [29,30,31]. All reactions can be assumed to proceed in the same way, shown in Equation (2):
a H2O + CCHHNNOOSS → b CH4 + c CO2 + d NH3 + e H2S
This equation can be devided into five equations, one for each element. Combining these equations, a matrix can be obtained (Figure 5). Based on the matrix and the elemental composition for each compound, the stochiometries of each product compound and the reactant water can be calculated:
The resulting stream is subsequently cooled and depressurized to 80 °C and 10 bar and further separated into a gaseous and an aqueous phase. The gaseous phase contains a significant amount of methane, which can be used as source of process energy for the HTL plant. The liquid phase is treated as waste water.
2.4. Hydrotreating
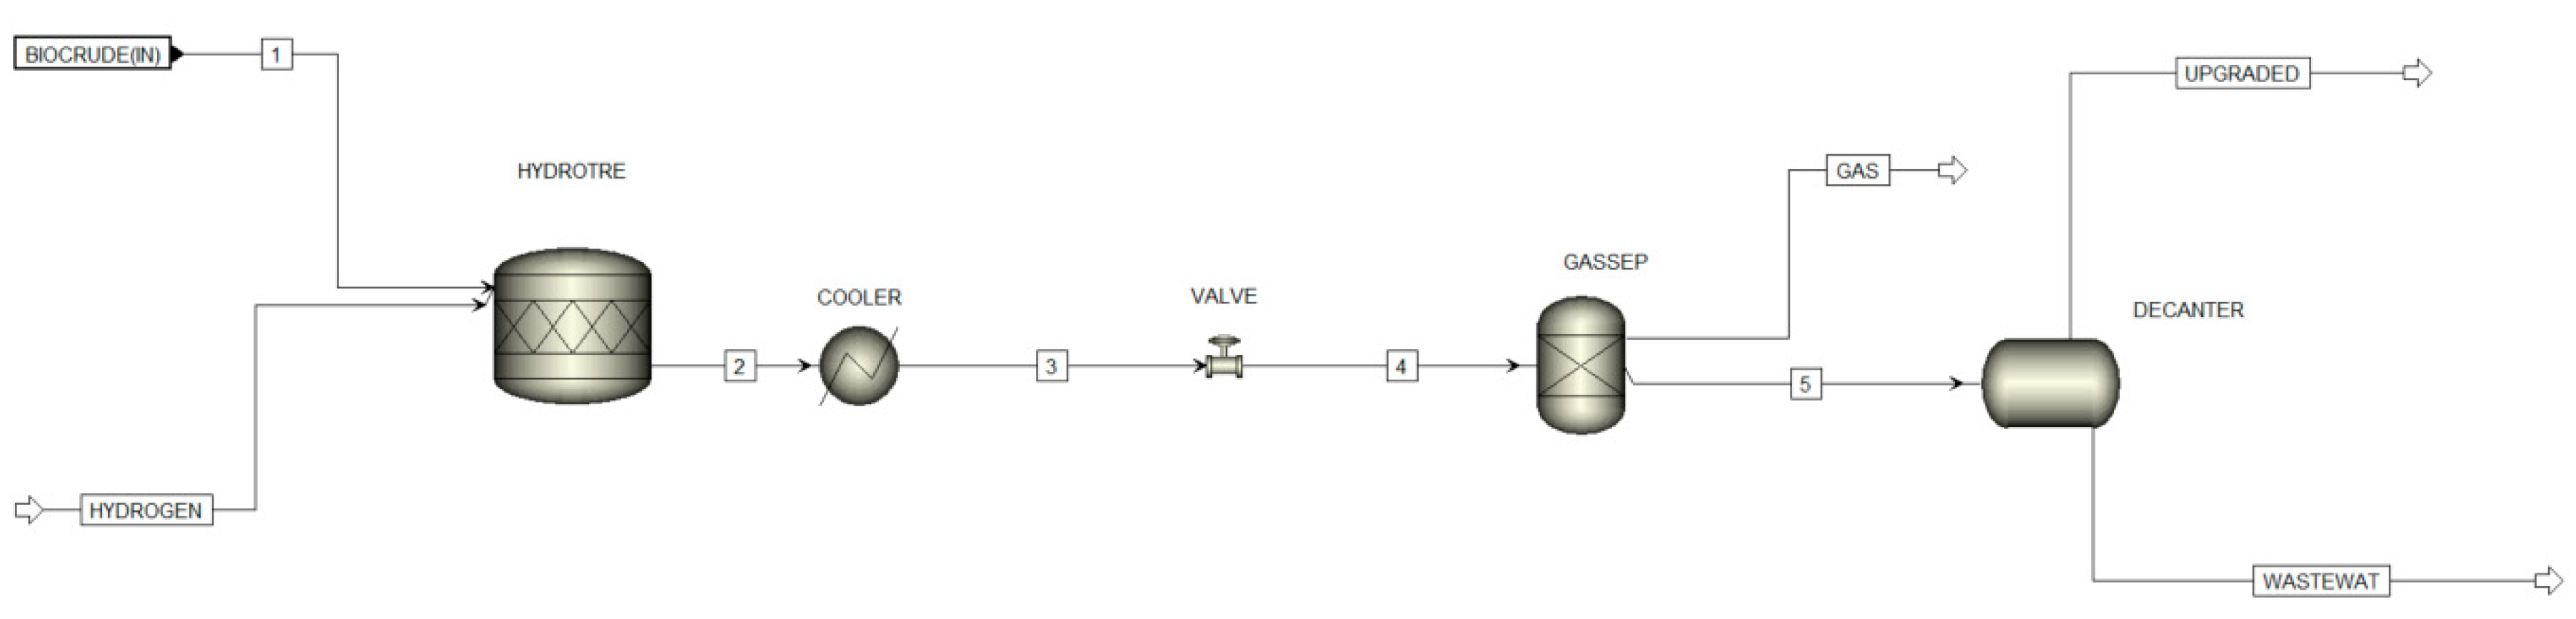
The flowsheet of the HT unit is shown in Figure 6. The biocrude stream from the HTL unit and hydrogen that is supplied externally in excess, get heated and pressurized. Both streams are combined and reacted in the HT reactor (RStoic) at a temperature of 400 °C and a pressure of 70 bar. The resulting product stream is cooled, depressurized and separated subsequently, resulting in a gaseous phase, a wastewater stream and the upgraded biocrude (~130 model compounds). The fractional conversions of the reactions (290) modeled in the HT reactor are adapted in such a way, that the resulting upgraded biocrude stream best matches experimental results of elemental analysis and boiling point distribution.
3. Results and Discussion
In this section, modeling results from the HTL, cHTG and HT process steps of the Aspen Plus® model with Spirulina, sewage sludge and wheat straw as feedstock are presented and discussed. In the first subsection, mass and energy balances are described. Subsequently, the treatment of the aqueous phase in terms of TOC values, gas composition and methane yield is illustrated. In addition, elemental analysis and a van Krevelen diagram of the most prominent streams, namely feedstock, biocrude and upgraded biocrude are presented. Furthermore, the biocrude and upgraded biocrude streams are discussed in detail, including boiling point distribution, molecular mass distribution and chemical composition. Finally, fuel fractions as well as typical HT characteristics are discussed.
3.1. Mass and Carbon Mass Balances
Table 2 shows the mass and carbon mass balances for all relevant streams of each individual process step. The highest biocrude yield can be observed for Spirulina (36 wt%), followed by sewage sludge (34 wt%) and wheat straw (31 wt%). Literature values are in the range of 23 wt% to 40 wt% for Spirulina [32,33,34,35], 28 wt% to 44 wt% for sewage sludge [5,36] and 28 wt% to 44 wt% for lignocellulosic feedstock [37,38,39]. The modeling results are in the range of literature values, however, the biocrude yields of sewage sludge and lignocellulosic feedstock tend to be higher compared to those of microalgae, which is somewhat contradictory compared to the model results. It should be kept in mind however, that biocrude yields strongly depend on reaction conditions and other experimental parameters. The yields of the upgraded biocrudes in the hydrotreatment step behave differently compared to those of the biocrude. Sewage sludge shows the highest upgraded biocrude yield, followed by wheat straw and Spirulina. The carbon mass balances reveal that the distribution of the carbon is not proportional to the mass distribution. In the case of sewage sludge 59.1% of the initial carbon in the feedstock can be found in the HTL biocrude, while for Spirulina and wheat straw these values are 55.0% and 51.1%, respectively.
Likewise, the carbon yields of the upgraded biocrudes differ from the mass yields. For the hydrotreatment step, wheat straw shows the highest carbon yield (95.8%), while those of Spirulina (86.2%) and sewage sludge (85.7%) are lower. The amounts and compositions of HTL gas streams vary significantly for the different feedstock, which can be explained by the different biochemical compositions and behaviors of the feedstock under hydrothermal conditions. Minor amounts of carbon can be found in the HTL solids. Besides the biocrude, also the aqueous phases contain considerable amounts of the initial feedstock carbon, which suggest that aqueous phase valorization is key to optimize overall energy and carbon efficiencies. Details of the aqueous phases and the resulting downstream cHTG flows are shown in the following.
3.2. Analysis of the Aqueous Phase, cHTG Gas Composition and Methane Yield
In this section TOC values of the AP and subsequently produced cHTG gas compositions and methane yields are discussed.
3.2.1. Total Organic Carbon of the Aqueous Phase
As can be seen from the carbon mass balances in Table 2, a significant amount of the initial biogenic carbon ends up in the AP after HTL. In order to increase the total organic carbon (TOC) and make cHTG a more energy-efficient option for treating the AP, an upconcentration step is included into the model. The respective TOC values of the AP, the retentate and the permeate are listed in Table 3. Since the upconcentration is modeled on a simple level and independent of the feedstock, higher TOC values in the AP also lead to higher TOC values in the retentate and permeate. Spirulina shows the highest initial TOC value in the AP, followed by wheat straw and sewage sludge. These values are in good agreement with literature data for Spirulina (6.7 g/L to 79.9 g/L) [34,40,41] and sewage sludge (8.3 g/L to 27.8 g/L) [36,40,42]. The TOC value of the modeled aqueous phase of wheat straw is higher than reported in literature (2.8 g/L to 27.8 g/L) [40,41].
3.2.2. cHTG Gas Composition and Methane Yield
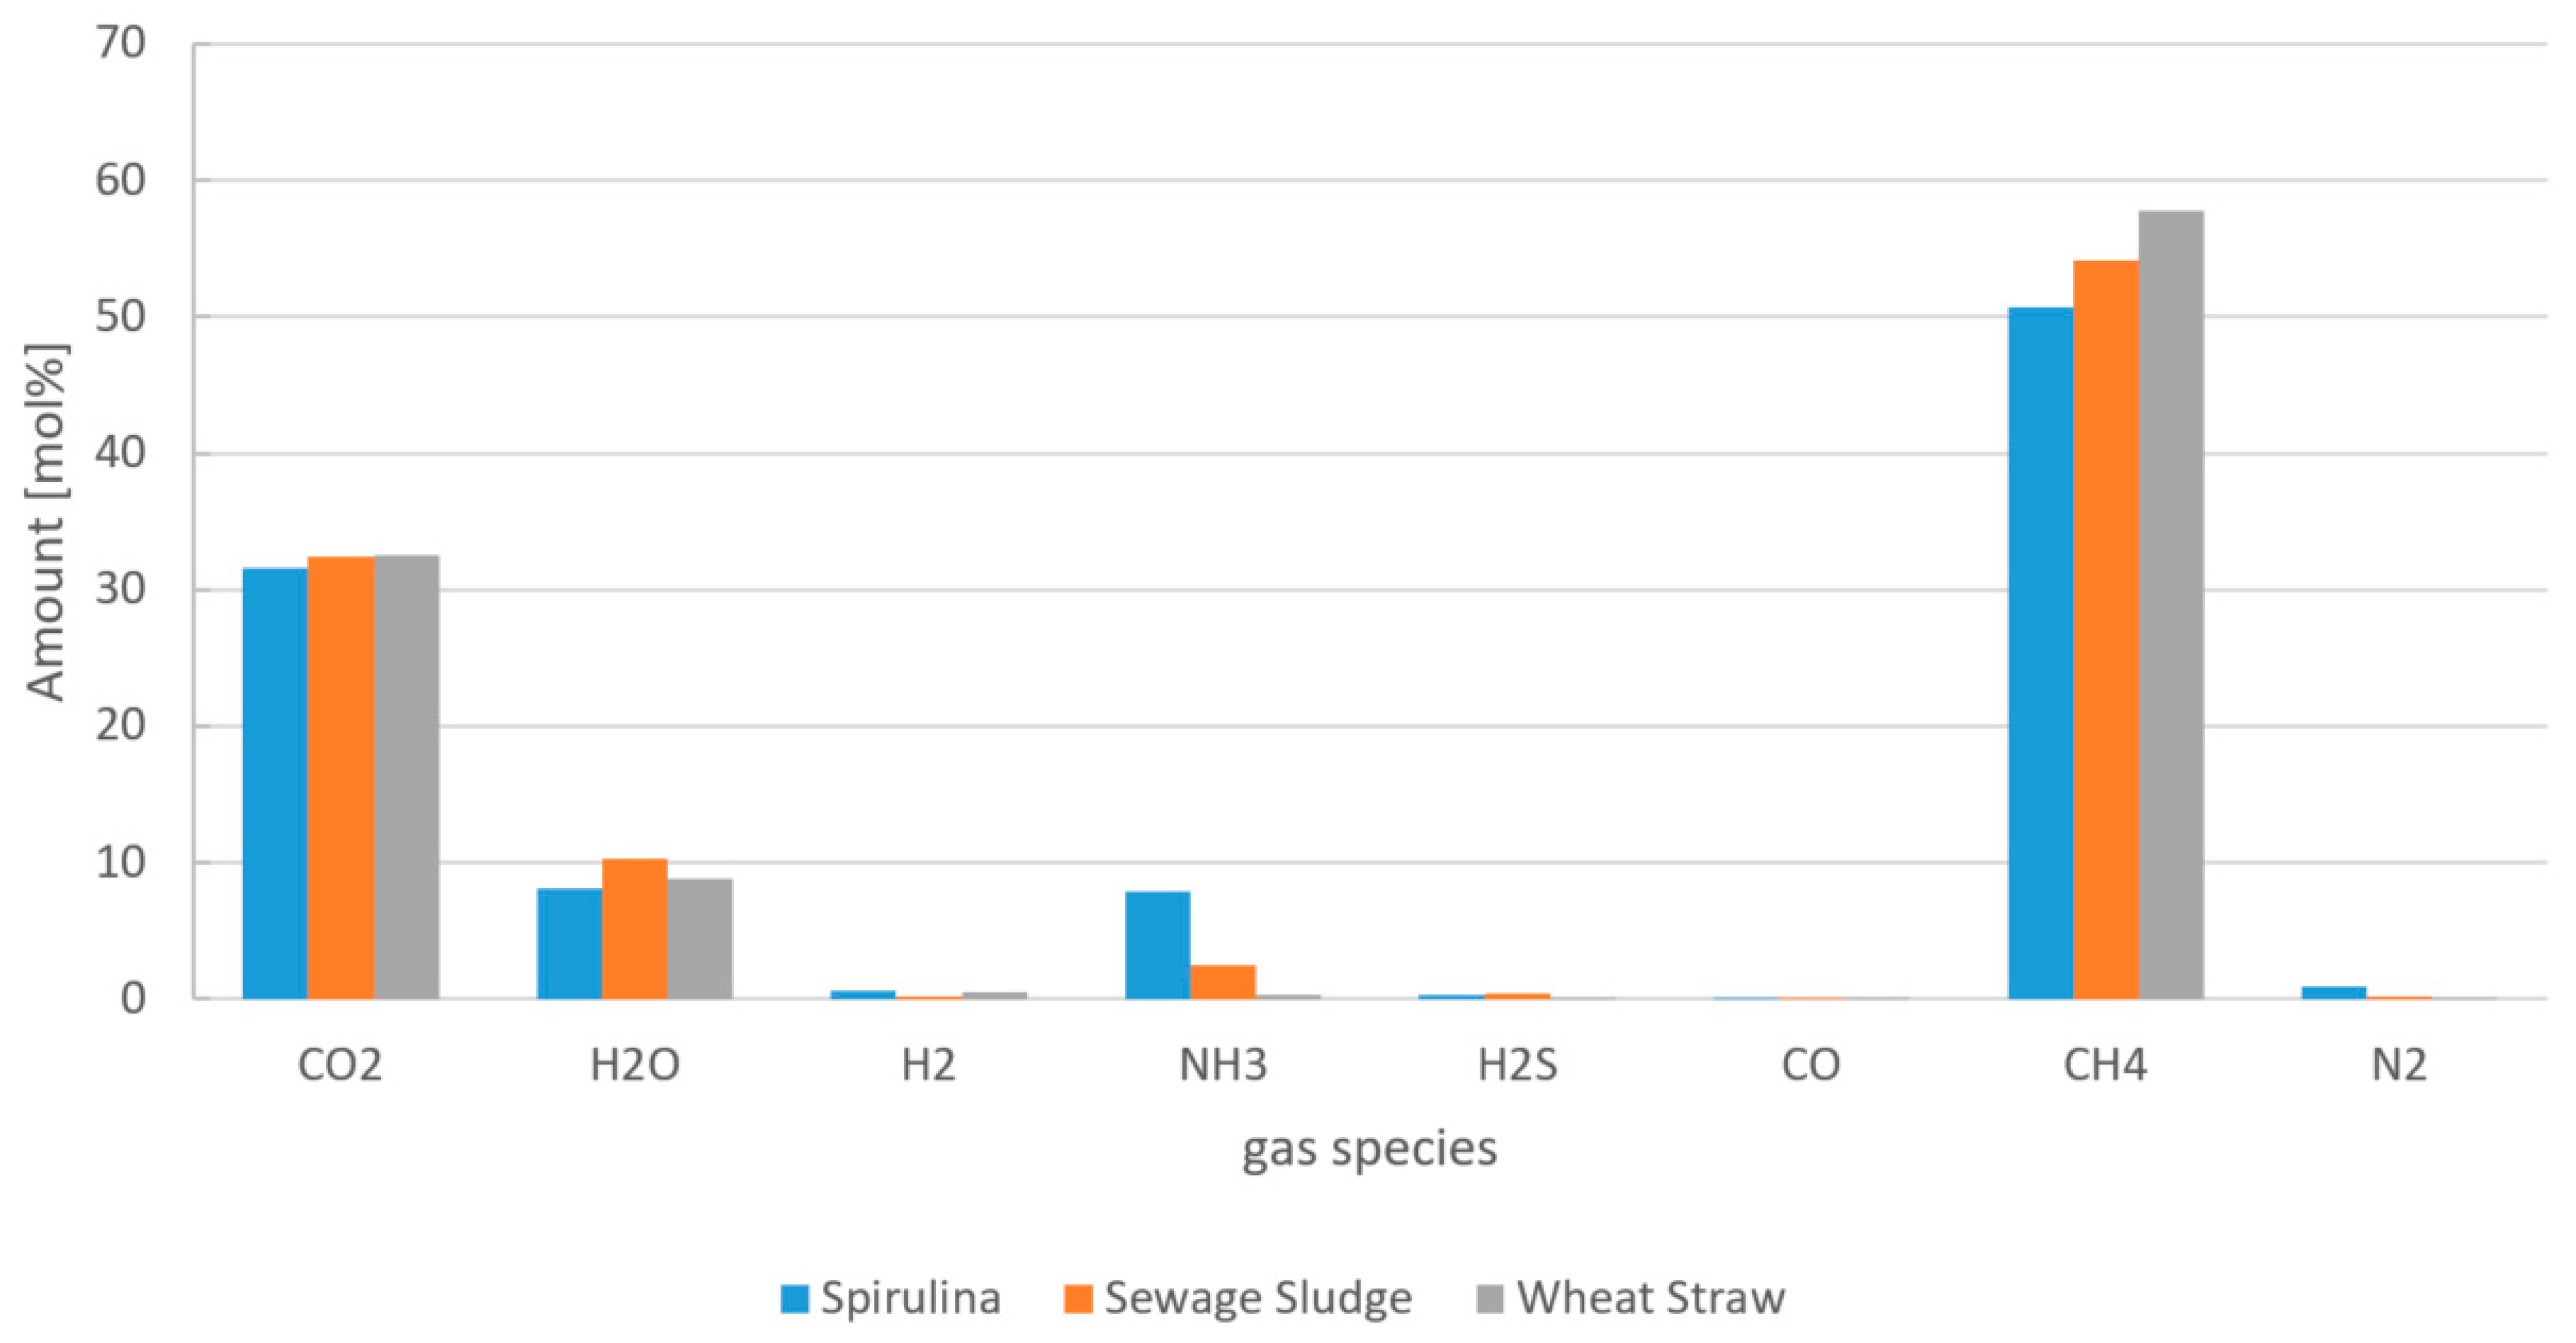
Based on the matrix calculation described earlier the retentates were converted into gas mixtures under hydrothermal gasification conditions. The gas compositions of the respective gas streams after cHTG are shown in Figure 7. Generally, the gas compositions are dominated by methane (50.7 to 57.8 mol%), carbon dioxide (31.6 to 32.5 mol%) and water (8.1 to 10.2 mol%). Literature results show that also hydrogen is produced in considerable amounts. The exact composition of the gas strongly depends on the catalyst that is used and the chosen experimental conditions. Two possible gas compositions reported in literaturecomprise 52.1 vol% and 52.4 vol% methane and 45.1 vol% and 38.0 vol% carbon dioxide, respectively, which is in good agreement with the model results [30,43]. Minor contributions to the modeled gas are observed from hydrogen, dihydrogen sulfide, carbon monoxide, nitrogen and ammonia. One exception is the case of Spirulina, where the amount of ammonia is quite high (7.9 mol%) due to the high amount of proteins in the feedstock and subsequent, nitrogen species in the aqueous phase. In contrast, wheat straw contains much less nitrogen in the feedstock, which is also reflected in the aqueous phase and the resulting cHTG gas phase composition. It should be noted, that the methane yield is not directly proportional to the amount of carbon distributed to the aqueous phase (TOC values), but it is also dependant on the type of compound that is converted. Wheat straw has the highest mass yield (6.7 wt%) and carbon mass yield (10.6 wt%). Sewage sludge has the lowest mass yield (5.3 wt%) but the second highest carbon mass yield (9.0 wt%), while Spirulina has the second highest mass yield (6.1 wt%) and the lowest carbon mass yield (8.9 wt%). The carbon mass yields for methane are also reflected by the share of methane in the gas mixture (Figure 7).
3.3. Elemental Analysis and Van Krevelen Diagram of Feedstock, Biocrude and Upgraded Biocrude
Table 4 lists the results of the CHNO elemental analysis of feedstock, biocrude and upgraded biocrude streams for all three investigated feedstock. The model results are validated with experimental results obtained in the HyFlexFuel project [44]. All modeled elemental compositions of the feedstock samples are in good agreement with experimental results [19]. Relative deviations are under three percent, with the exceptions of the hydrogen and oxygen contents of wheat straw which show a deviation of 4.0% and 11.4%, respectively. Biocrude and upgraded biocrude streams show a significant decrease in oxygen and nitrogen content for all three feedstock. The final product consists mainly of hydrocarbons, as indicated by the carbon and hydrogen content. Relative deviations compared to the experiemental values for the sewage sludge biocrude are below 7% while for Spirulina the nitrogen content in the model is underestimated significantly, leading to a deviation of over 35%. In the case of the wheat straw biocrude, the nitrogen and carbon content is overestimated, while the hydrogen and oxygen content is underestimated. This leads to relative deviations of up to 35 wt% for the oxygen content. Also for the upgraded biocrudes, wheat straw shows the highest deviations. The hydrogen content is significantly lower than measured experimentally which reveals an overestimation of aromatic compounds with high boiling points. The significant underestimation of nitrogen indicates that the distribution of nitrogen is probably not modeled correctly. In the model, most likely, the nitrogen content in the low boiling components is overestimated while it is underestimated for the high boiling compounds. The elemental composition of the upgraded biocrudes of Spirulina and sewage sludge are represented quite well by the model. Figures S1–S3 in the SI show a graphical representation of the results shown in Table 4.
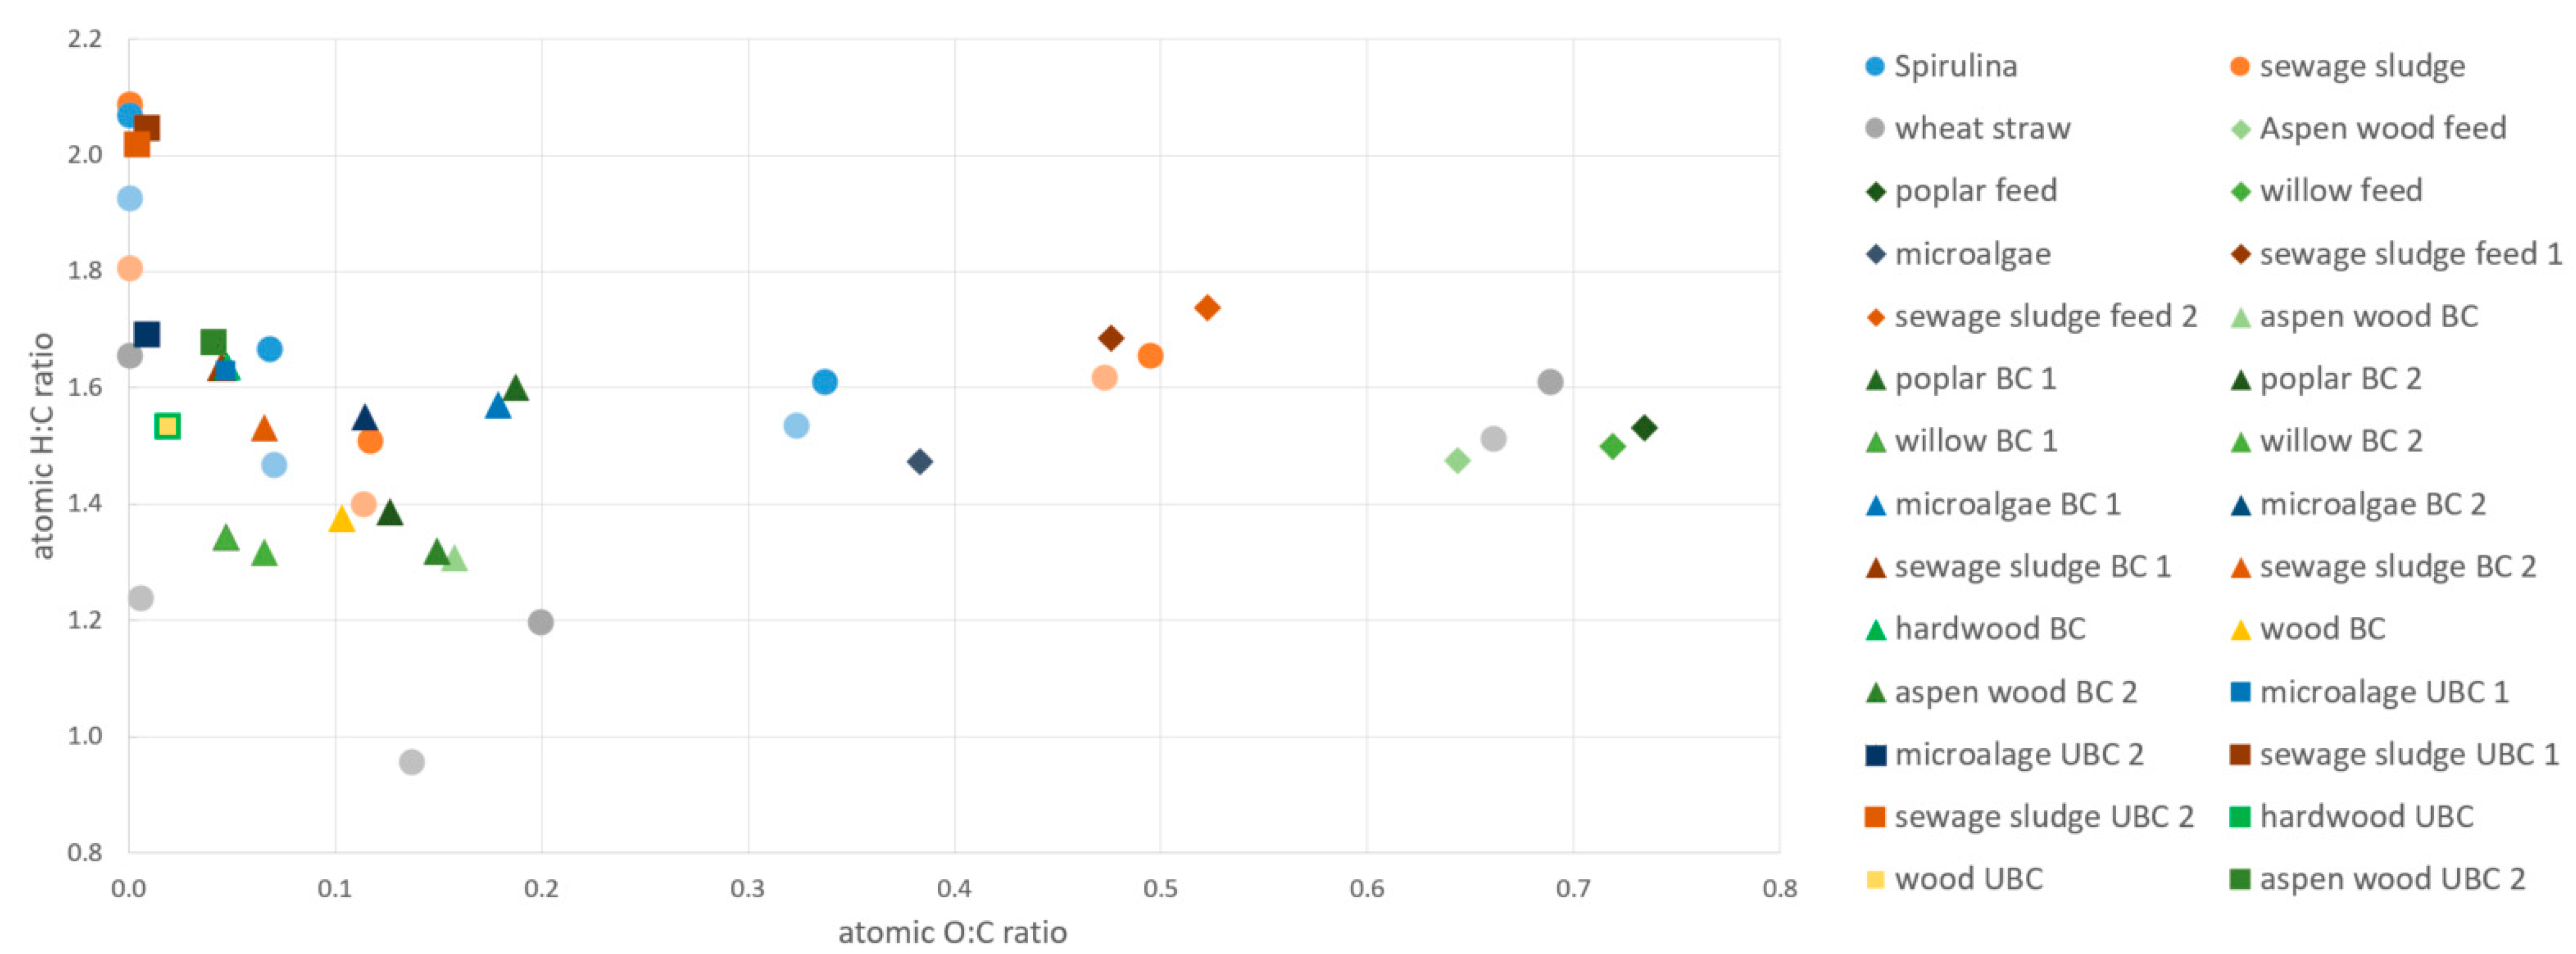
Based on the results of the elemental analysis, a van Krevelen diagram (Figure 8) can be generated which gives further insight into the differences of the different streams. H:C ratios of the feedstock are in the range of 1.51 to 1.65 and quite similar, while the O:C ratios vary significantly from around 0.7 for wheat straw to 0.5 for sewage sludge and 0.3 for Spirulina. These trends can also be observed for the literature values. Futhermore, the latter trend is also continued in the case of the model and validation biocrudes with O:C ratios ranging from 0.20 for wheat straw over 0.12 for sewage sludge to 0.07 for Spirulina. Literature values do not confirm this trend. O:C ratios of biocrudes from microalgae and lignocellulosic materials vary quite significantly. Also H:C ratios are not similar for biocrudes obtained from different feedstock. However, a trend is visible in this case. Biocrudes from lignocellulosic feedstock tend to have the lowest H:C ratios, while those from microalgae and sewage sludge are similar. The HyFlexFuel results however show a clear trend. H:C ratios are 1.66 for Spirulina, 1.51 for sewage sludge and 1.20 for wheat straw. For wheat straw, this can be explained by the large amount of formed aromatic compounds in the biocrude, which is a result of the high amount of carbohydrates and lignin in the feedstock. For sewage sludge, the high amount of lipids leads to a larger H:C ratio, while significant amounts of carbohydrates and lignin compensate this effect to some degree. In the case of Spirulina, the carbohydrate and especially, the lignin content is quite low, which induces the high H:C ratio. Also the high amount of proteins seems to have a favorable influence on the H:C ratio. For the upgraded biocrudes obtained in the HyFlexFuel project, the previously described effect is even more distinct with H:C ratios ranging from 1.66 for wheat straw to 2.07 and 2.09 for Spirulina and sewage sludge, respectively. Since almost all oxygen is removed during hydrotreatment, the O:C ratios are very low for all three upgraded biocrudes. Literature values confirm that upgraded biocrudes from lignocellulosic feedstock tend to have lower H:C ratios and slightly higher O:C ratios compared to upgraded biocrudes from lipid or protein-rich biomass. H:C ratios of upgraded biocrudes from Spirulina tend to be slightly lower than those of upgraded biocrudes from sewage sludge. Model results vary slightly from experimental results for Spirulina and sewage sludge, while greater deviations can be observed for wheat straw, as already observed for the elemental analysis. H:C ratios are underestimated slightly in all cases. For the biocrude and upgraded biocrude of wheat straw however, a large deviation can be observed, which can be explained by the high amount of aromatic high boiling components in the model. O:C ratios for the dry, ash-free feedstock streams are also underestimated slightly. For the biocrude of wheat straw the O:C ratio is underestimated significantly, which is caused by the underestimation of oxygen containing high boiling components. Nevertheless, generall trends that are consolidated by literature values are represented in a reasonable way.
3.4. Analysis of Modeled Biocrudes from Sewage Sludge, Spirulina and Wheat Straw
In this section boiling point distributions, molecular mass distributions and chemical compositions of biocrudes from the different feedstock are compared.
3.4.1. Boiling Point Distribution
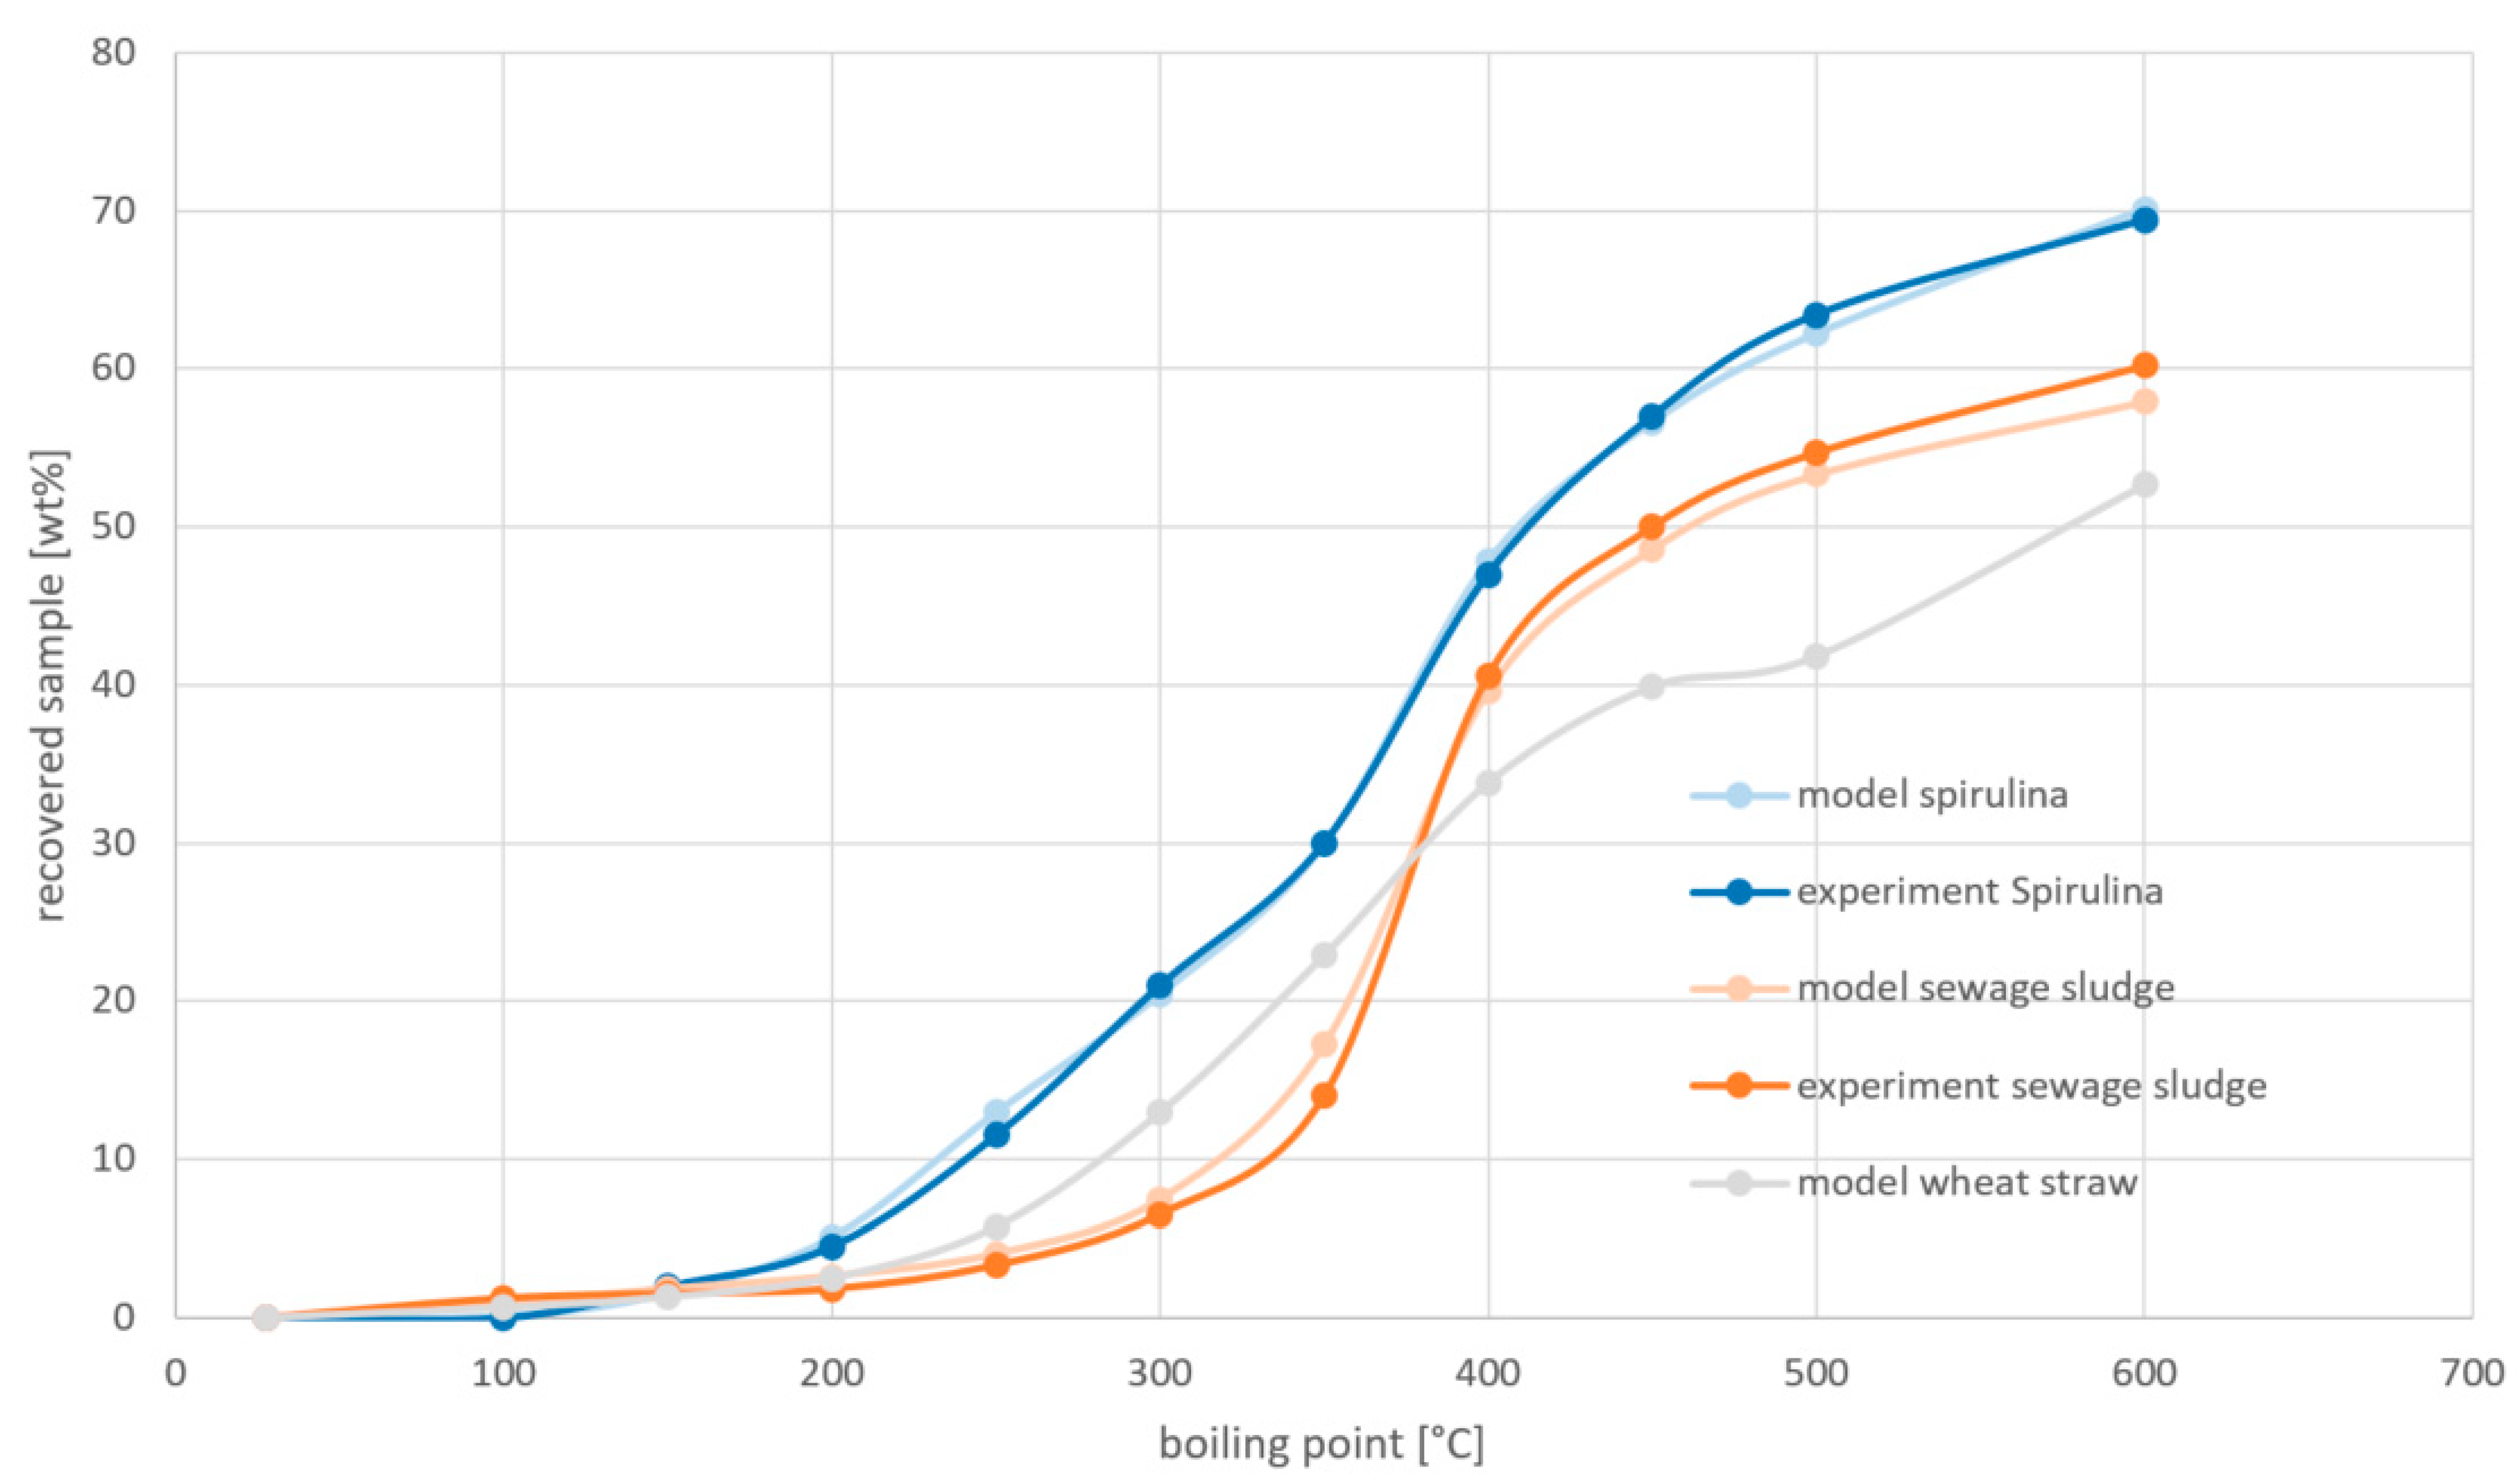
The boiling point distributions of biocrudes from three different feedstocks—Spirulina, sewage sludge and wheat straw—are depicted in Figure 9. The model boiling point distributions are adapted to experimental results obtained in the HyFlexFuel project [44], the good reproducibility of the experimental results validate the model. The boiling point distributions show a distinctly different behavior based on the composition of the initial feedstock. Sewage sludge biocrude exhibits a slow increase in volatile components up to a boiling point of about 350 °C, where a sudden and strong increase can be observed. This can be ascribed to the high content of long-chain fatty acids and amides, originating from the high amount of lipids present in the feedstock. About 58 wt% of the biocrude can be found at boiling points below 600 °C. For Spirulina and wheat straw biocrude, a more steady increase can be observed, whereas Spirulina biocrude shows a significant increase of volatile components starting at around 200 °C. The amount of compounds below 600 °C (70 wt%) is even higher in Spirulina biocrude compared to sewage sludge biocrude. Also biocrude from wheat straw shows a different behavior. Almost half of the obtained biocrude components can be found at boiling points above 600 °C, which indicates a high amount of polymerization reactions occurring during HTL. This is linked to the high amounts of lignin and carbohydrates present in the feedstock. Components with lower boiling points between 200 °C and 350 °C can be observed in higher quantities than for sewage sludge biocrude, but to a lower extent than in Spirulina biocrude. For wheat straw, no results for a biocrude boiling point distribution from the HyFlexFuel project have been available up to now [44].
3.4.2. Comparison of Molecular Mass Distribution and Main Model Components of Biocrudes from Different Feedstock
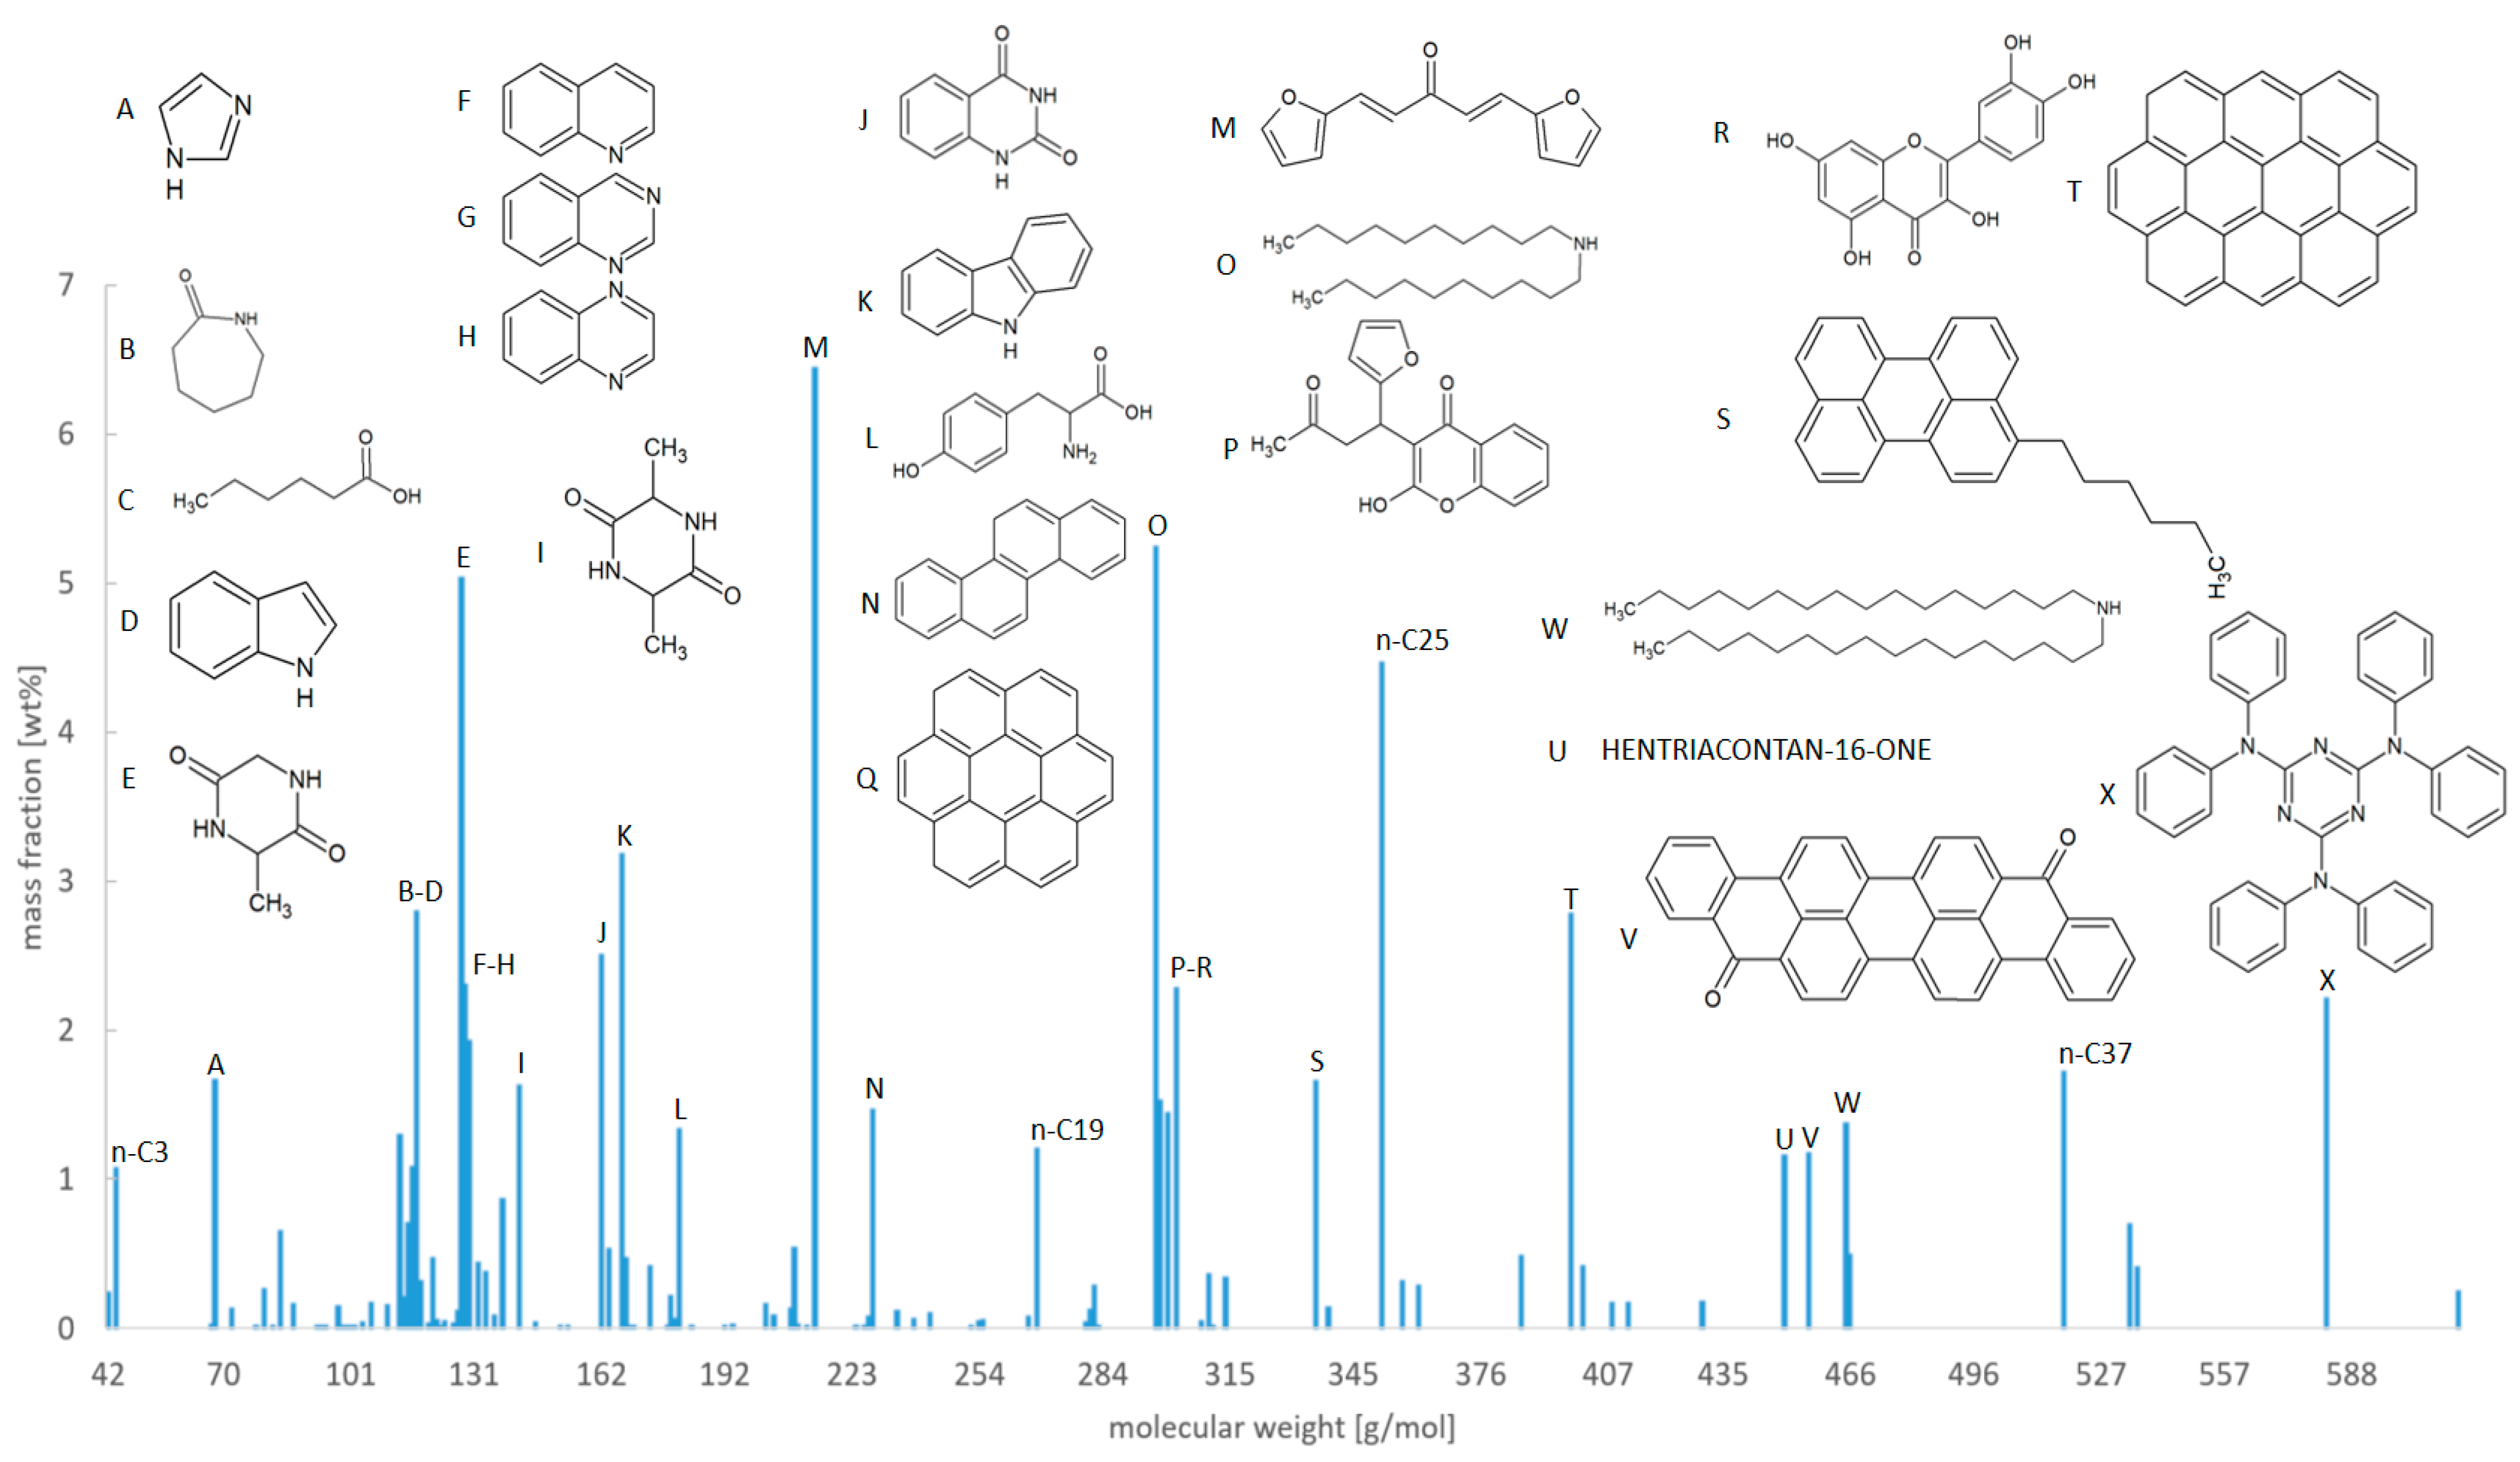
The presentation shown in Figure 10, Figure 11 and Figure 12 can be compared to an experimental GC-MS analysis, as e.g., shown in a study by Jarvis et al. [49]. However, some distinct differences have to be kept in mind. Firstly, GC-MS analyses do not show the exact molecular mass of the components and secondly, GC-MS results are limited to the volatile fraction of the sample, while in these figures, the exact molecular mass of the model compounds is depicted on the x-axis and there is no limitation towards high boiling components. In order to give a better overview of the different biocrude samples however, the two heaviest model compounds, namely dohexacontane (C62, 871.7 g/mol) and doheptacontane (C72, 1011.9 g/mol) are not shown. In the case of Spirulina, these two compounds have a share of 11.0 wt% and 8.2 wt%, respectively, while in the case of sewage sludge the amounts are 6.9 wt% and 4.8 wt%, respectively. In the case of wheat straw, these components do not contribute as much (3.0 wt% and 2.8 wt% respectively), because the high boiling polymerization compounds are mostly based on aromatic monomers from lignin and carbohydrate-originated compounds. Besides this, biocrudes from Spirulina and sewage sludge generally are more similar compared to the biocrude obtained from wheat straw, which is dominated by aromatic compounds and especially a larger fraction of high molecular mass components. Besides some long-chain amines (O, W), which result from reactions of lipids, the Spirulina biocrude (Figure 10) shows a variety of different cyclic and aromatic oxygen and nitrogen containing compounds (B, E, F-K) that originate from Maillard reactions of sugars and proteins or from direct dimerization reactions of proteins [16,17]. Furthermore, significant amounts of oxygenated cyclic or aromatic compounds (M, P, R) can be observed from the reaction of sugar products, such as 5-hydroxymethylfurfural [8,27], with lignin monomers or with each other. In addition, some aromatic high boiling polymerization products (S, T, V, X) are present [27], but the high boiling fraction is mostly dominated by the long-chain hydrocarbons that are not depicted. In some cases, model compounds are not expected to be present in real samples in the exact same way, but they rather serve as representatives for a variety of different possible compounds that cannot be modeled easily. This is especially true for high boiling components.
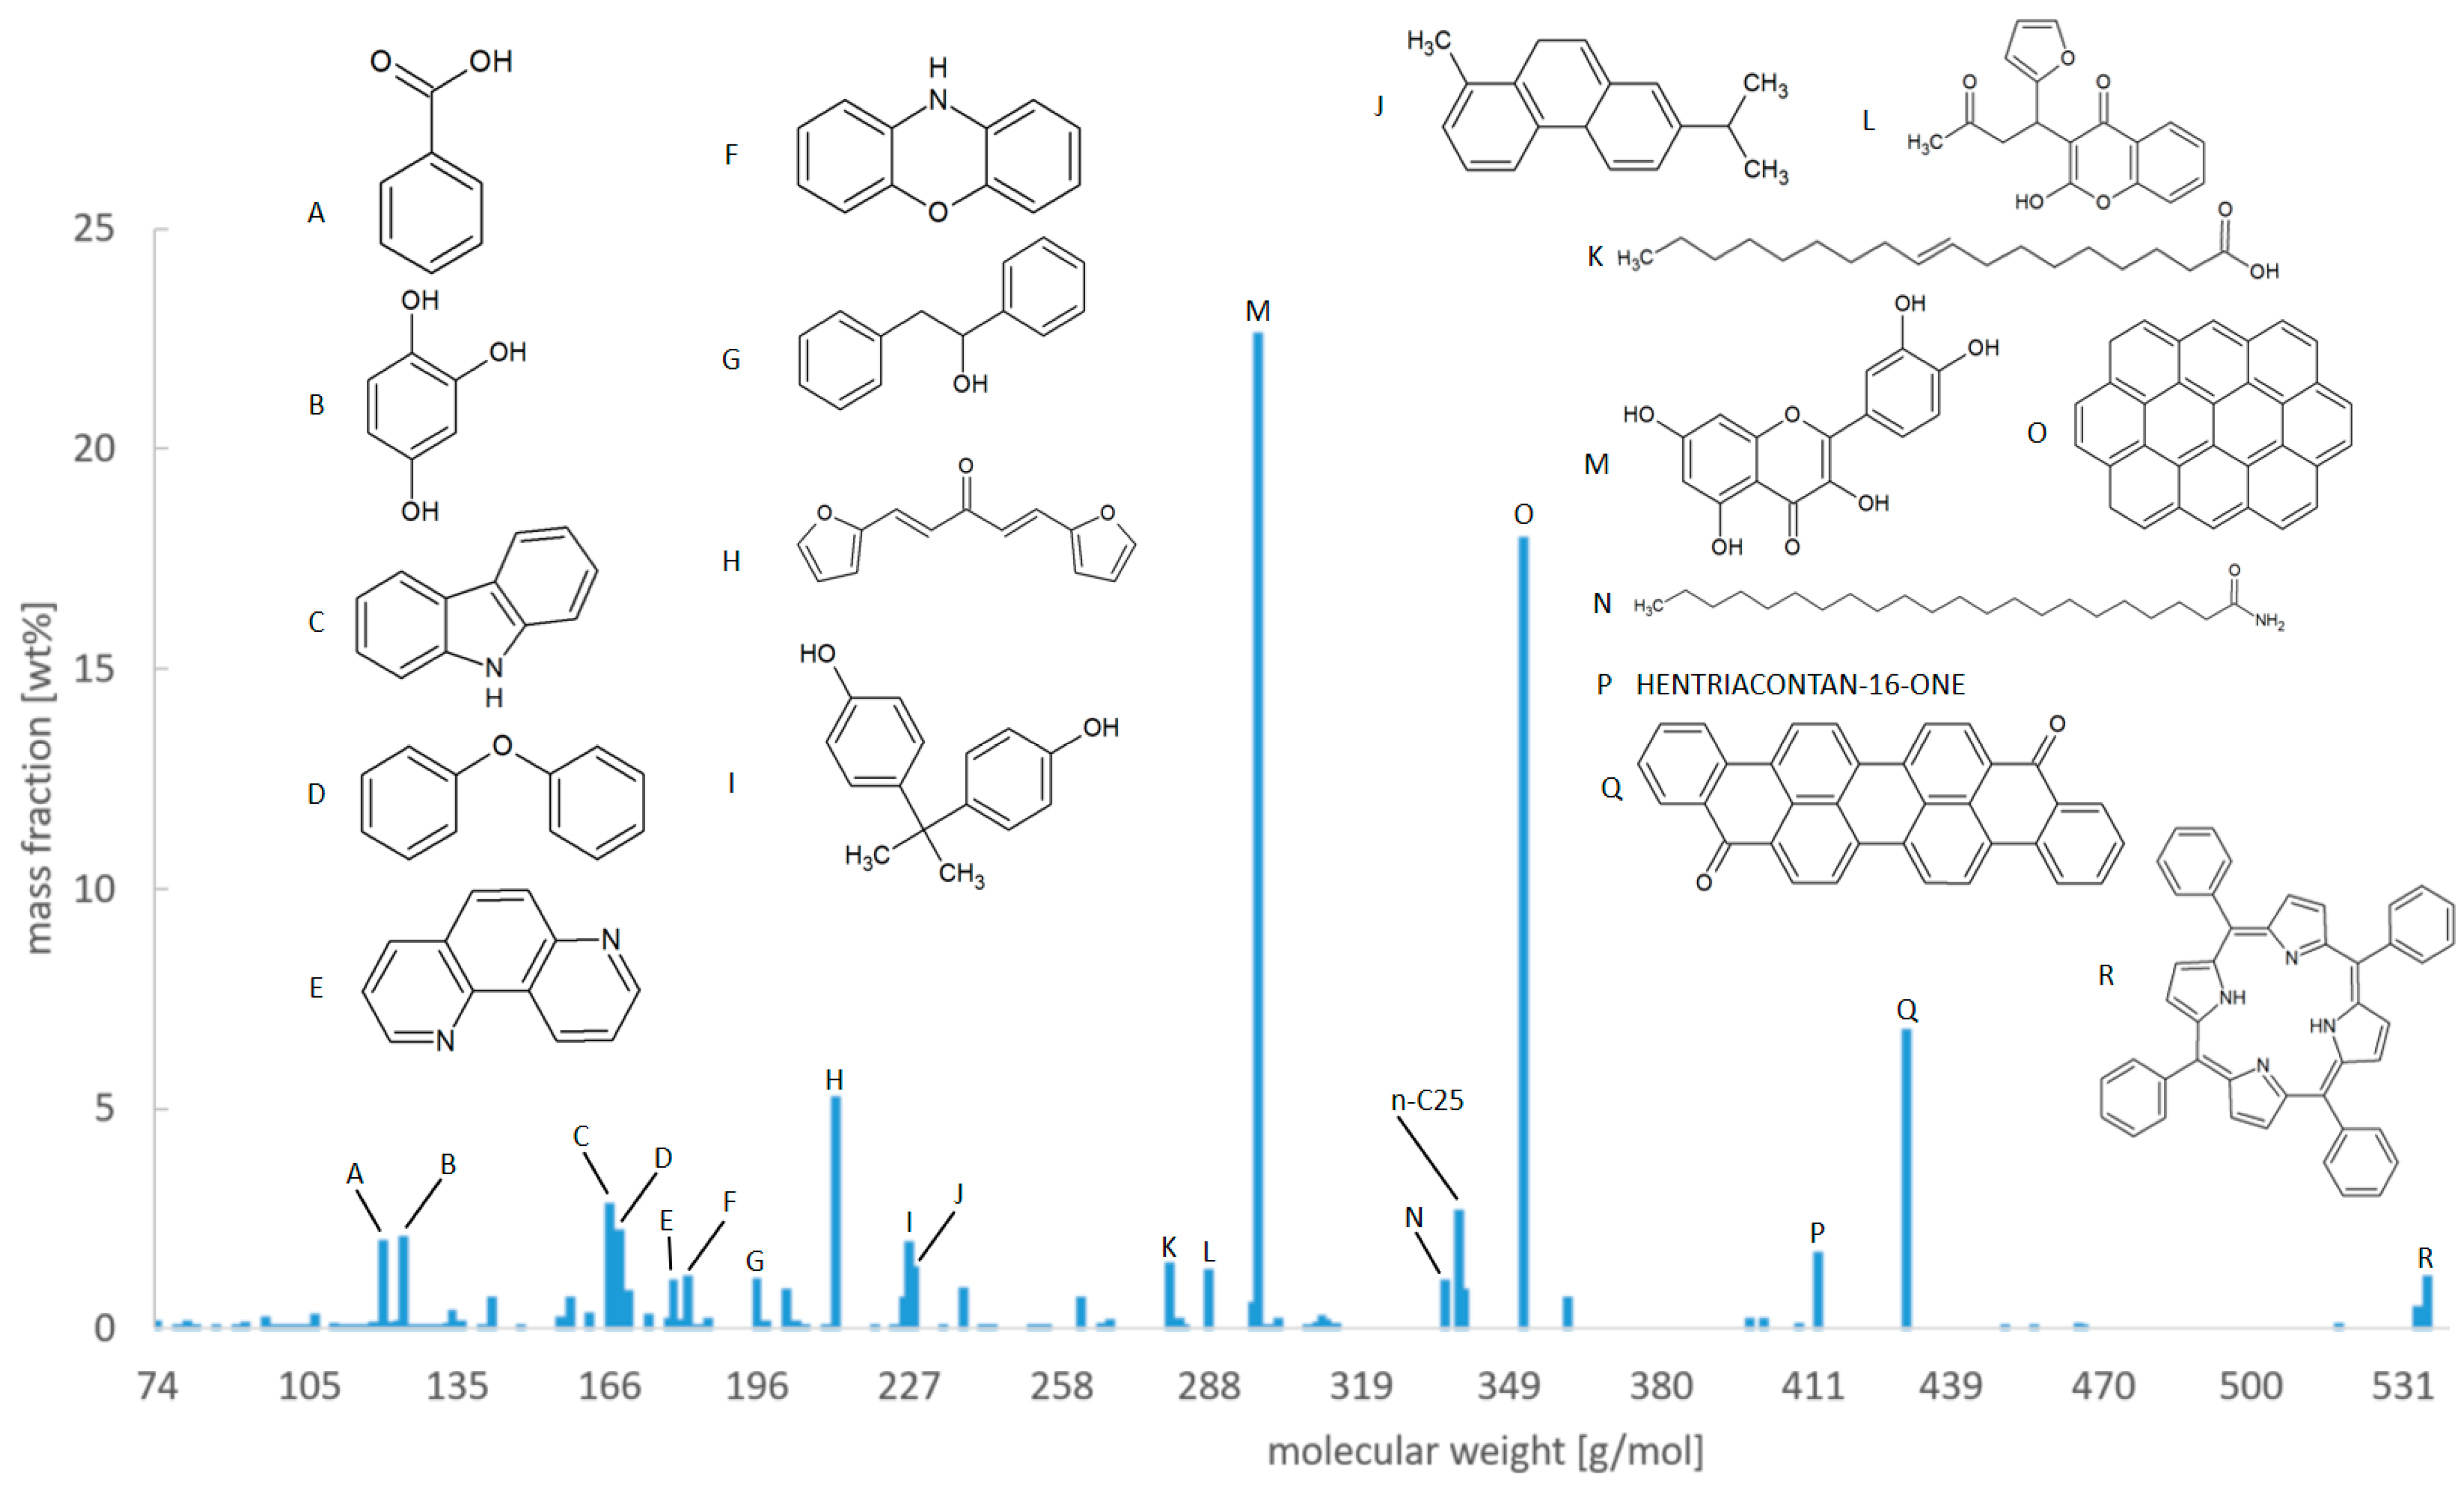
In the case of the sewage sludge biocrude (Figure 11), Maillard reactions products (D–F) are present as well, but to a significantly lower extent, due to the lower amount of proteins in the feedstock. Therefore, larger amounts of oxygenated cyclic and aromatic compounds (B, C, H, M) can be observed, due to the increased amount of carbohydrates in the feedstock [8,27]. Furthermore, an increased number of n-paraffins (n-C19, n-C22 and n-C25), long-chain carboxylic acid and amides (G, J–L, N) can be observed [16], which originate from the higher amount of lipids in the feedstock. High boiling components are dominated by long-chain hydrocarbons, which are not shown and to a small amount consist of aromatic compounds (I, O, P), also containing heteroatoms [27].
Wheat straw is clearly dominated by carbohydrates and to a minor extent by lignin. These materials are oxygen-rich and under hydrothermal conditions tend to readily polymerize and form aromatic components of different sizes [8,27]. Figure 12 shows the molecular mass distribution of modeled biocrude obtained from wheat straw.
All compounds exhibiting 1 wt% or more are depicted as well. Besides one fatty acid (K) and one fatty acid amide (N), only aromatic compounds can be found. Compounds with lower molecular mass are distributed quite well, while high molecular mass compounds are only represented by a few compounds, which results in the model not being flexible and not predicting properties very well.
3.5. Analysis of Modeled Upgraded Biocrudes from Sewage Sludge, Spirulina and Wheat Straw and HT Process Characteristics
In this section the boiling point distribution as well as the chemical composition of the upgraded biocrudes are covered. Furthermore, a comparison to the chemical composition of the biocrudes is shown. Subsequently, fuel properties, fuel fractions and HT characteristics are investigated.
3.5.1. Boiling Point Distribution
Figure 13 shows the boiling point distributions of the upgraded biocrudes obtained from Spirulina (blue), sewage sludge (orange) and wheat straw (grey). Experimental results were obtained from the HyFlexFuel project [44] and are shown in dark colors, while model results are depicted in light colors. As already described, Spirulina has a strong emphasis on proteins and wheat straw on carbohydrates. Sewage sludge has a higher lipid content but generally can be considered to have the most balanced composition of the three investigated feedstock. The different compositions are reflected in the upgraded biocrudes in different ways. While a significant portion of the upgraded biocrude of Spirulina can be found at lower boiling points, a strong increase between 275 °C and 325 °C is observed, which can be attributed to n-paraffins (mainly C16 and C18). This effect is even more severe for sewage sludge, due to the significantly higher amount of lipids present. In contrast however, only a small amount of the upgraded biocrude can be found in the low boiling point range.
In the case of wheat straw, a smooth and steady, almost linear increase can be observed. Furthermore, the amount of high boiling components (>350 °C) is significantly higher for the wheat straw upgraded biocrude. This can be explained by the high amounts of lignin and especially carbohydrates, which lead to an increased formation of aromatic high boiling components [8,27], which is also supported by the low H/C ratio in the van Krevelen diagram (Figure 8).
3.5.2. Comparison of Molecular Mass Distribution and Main Model Components of Upgraded Biocrudes from Different Feedstock
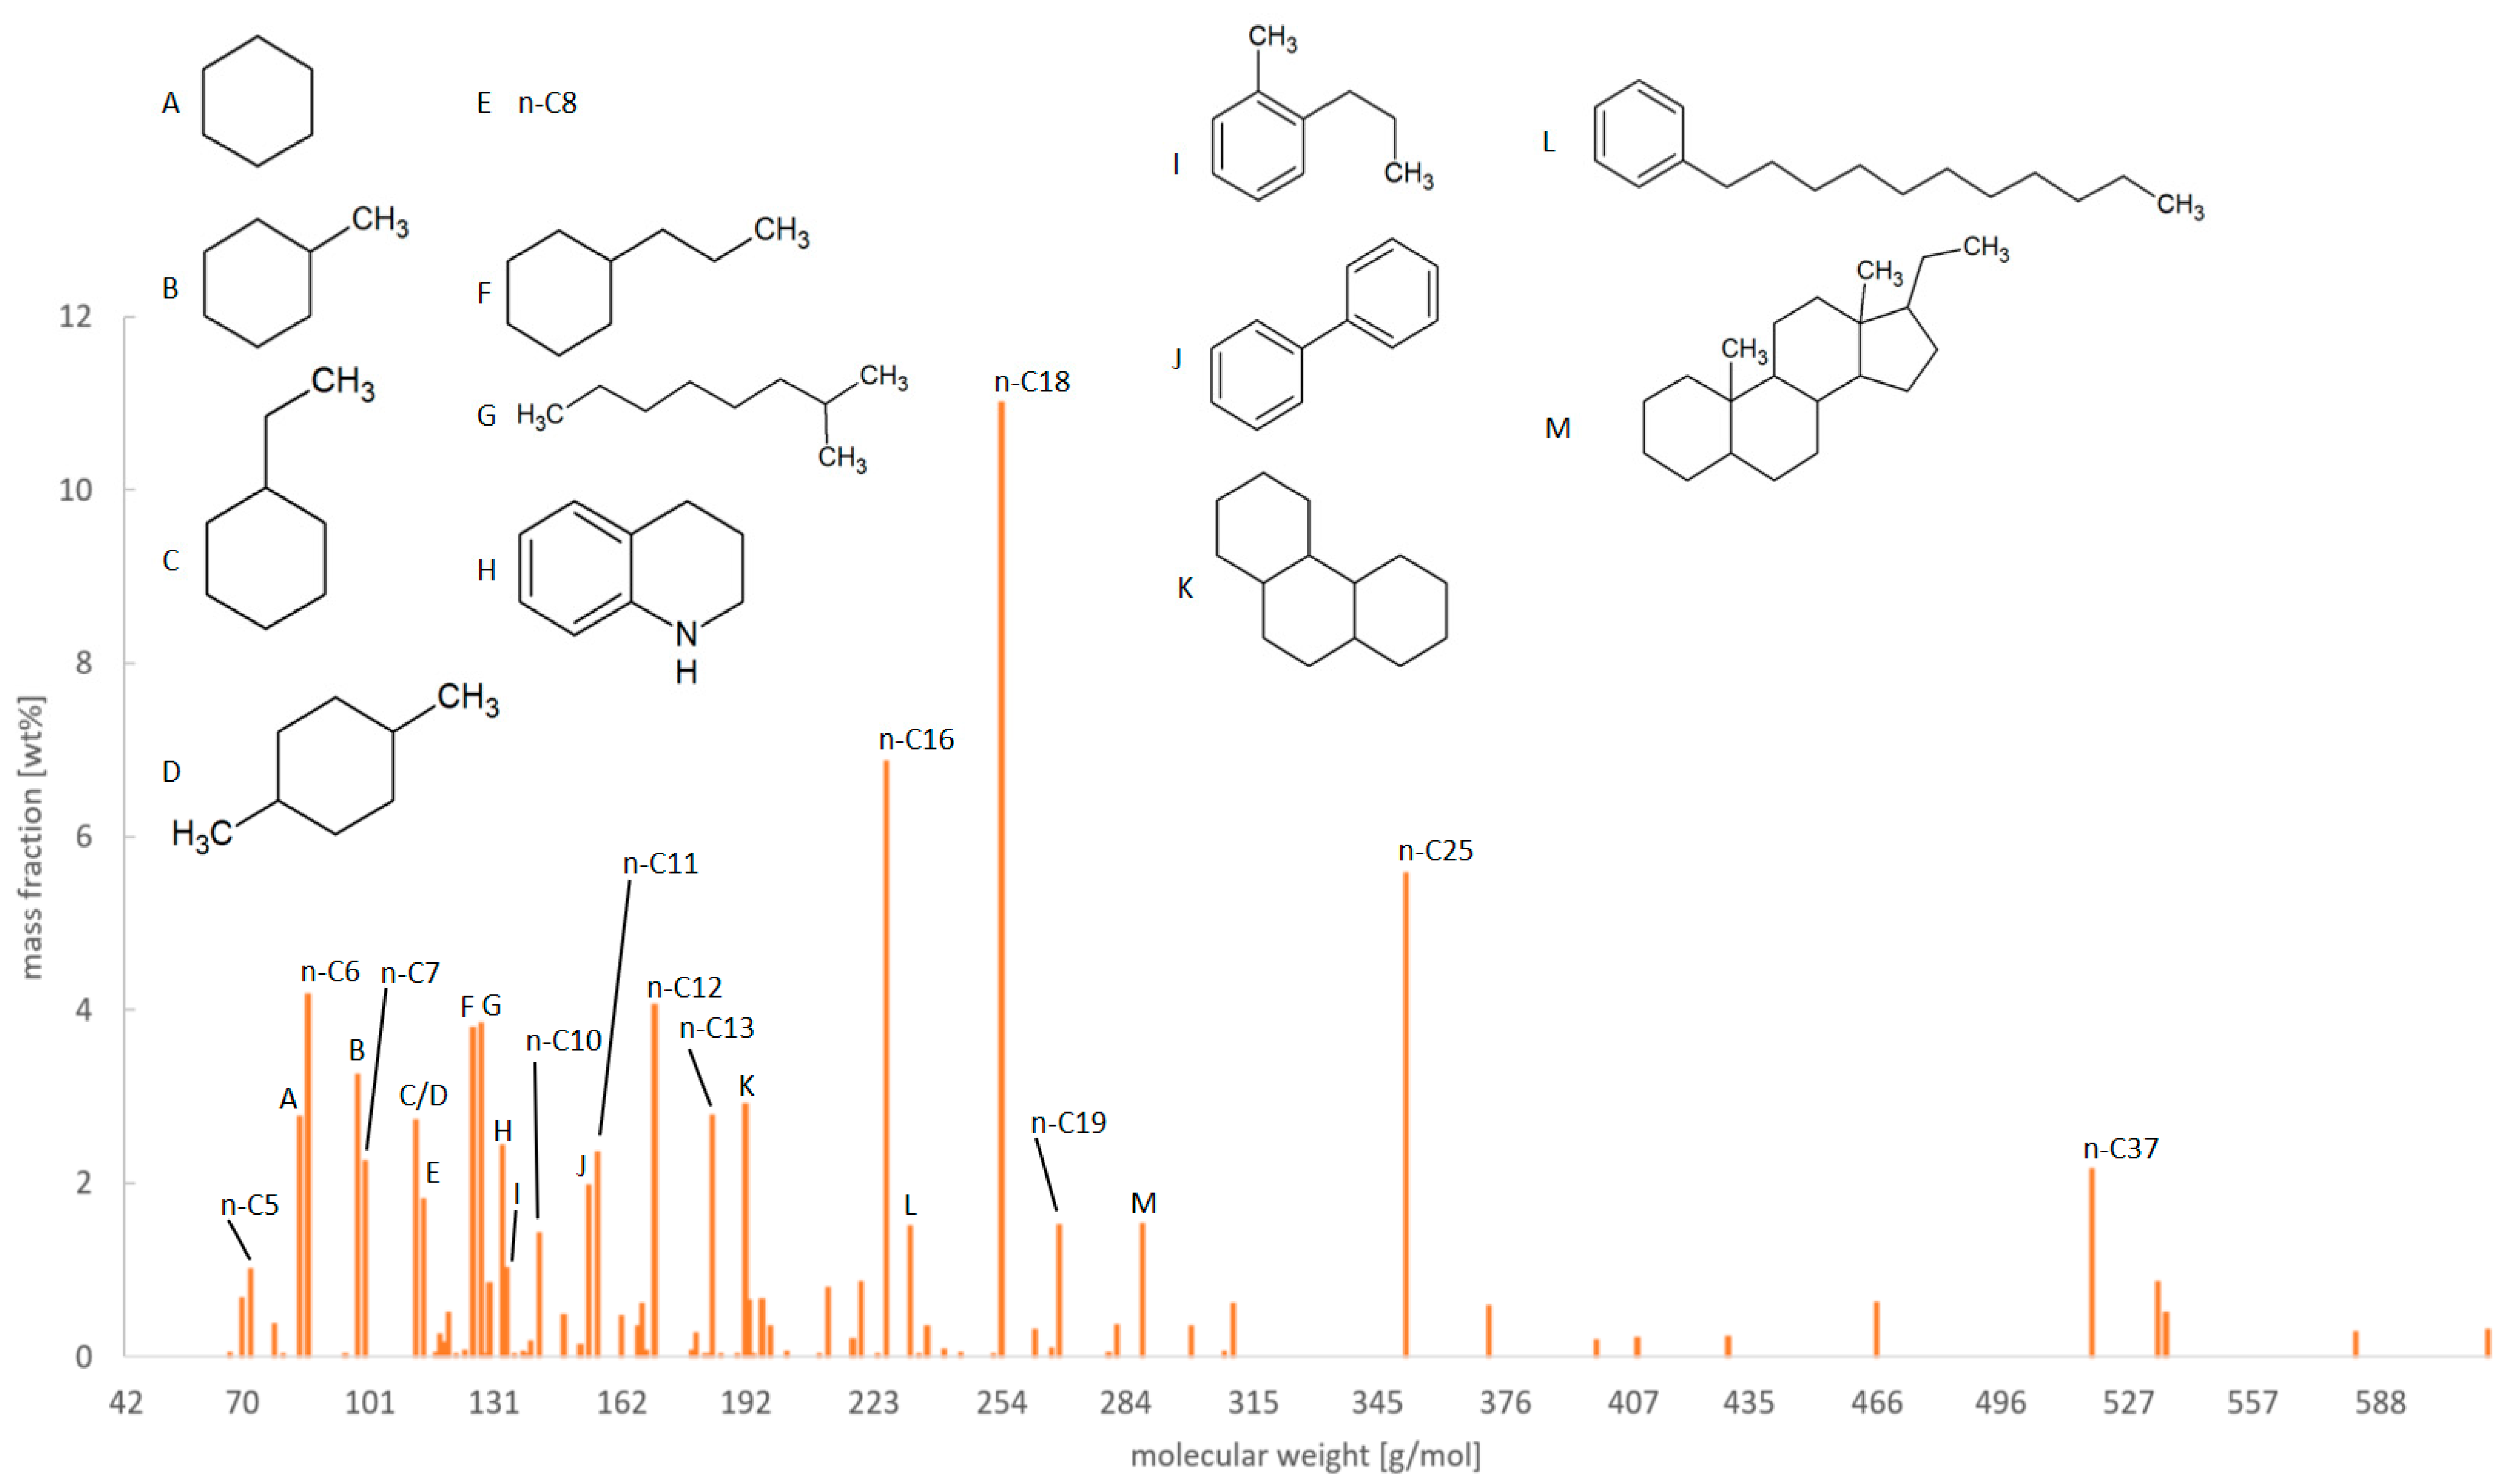
Again, the presentation shown in Figure 14, Figure 15 and Figure 16 can be compared to an experimental GC-MS analysis, as e.g., shown in a study by Jarvis et al. [49]. Generally speaking, compositions of upgraded biocrudes are less complicated than compositions of biocrudes, because the amount of compounds that add up to large parts of the upgraded biocrude is smaller. Figure 14 shows the molecular mass distribution of the upgraded biocrude obtained from Spirulina with the main model compounds incorporated. A prominent portion of the upgraded biocrude comprises n-alkanes from C5 up to C37, with a clear peak at C16 and C18, originating from lipid-containing species in the biocrude. Furthermore, a significant amount of the upgraded biocrude consists of cyclic paraffins (A-D, F, K, M) that originate from hydrotreating of aromatics and heteroaromatic cyclic compounds. Some of the aromatics (I, J, H, L) could only partially be hydrotreated and are still present.
Considering the overall picture, upgraded biocrude from sewage sludge (Figure 15) and Spirulina do not differ overly. The largest portion of the upgraded biocrude from sewage sludge also consists of n-paraffins, although the amount is smaller compared to the Spirulina case. However, the fraction of iso-paraffins is increased significantly. The amount of cyclic paraffins (B–D, F) is quite similar at around 20 wt%. The aromatic content (A, G, H) is increased quite significantly in the case of sewage sludge. This can be attributed to the higher amount of carbohydrates and especially lignin, which tend to form aromatic compounds [8,27].
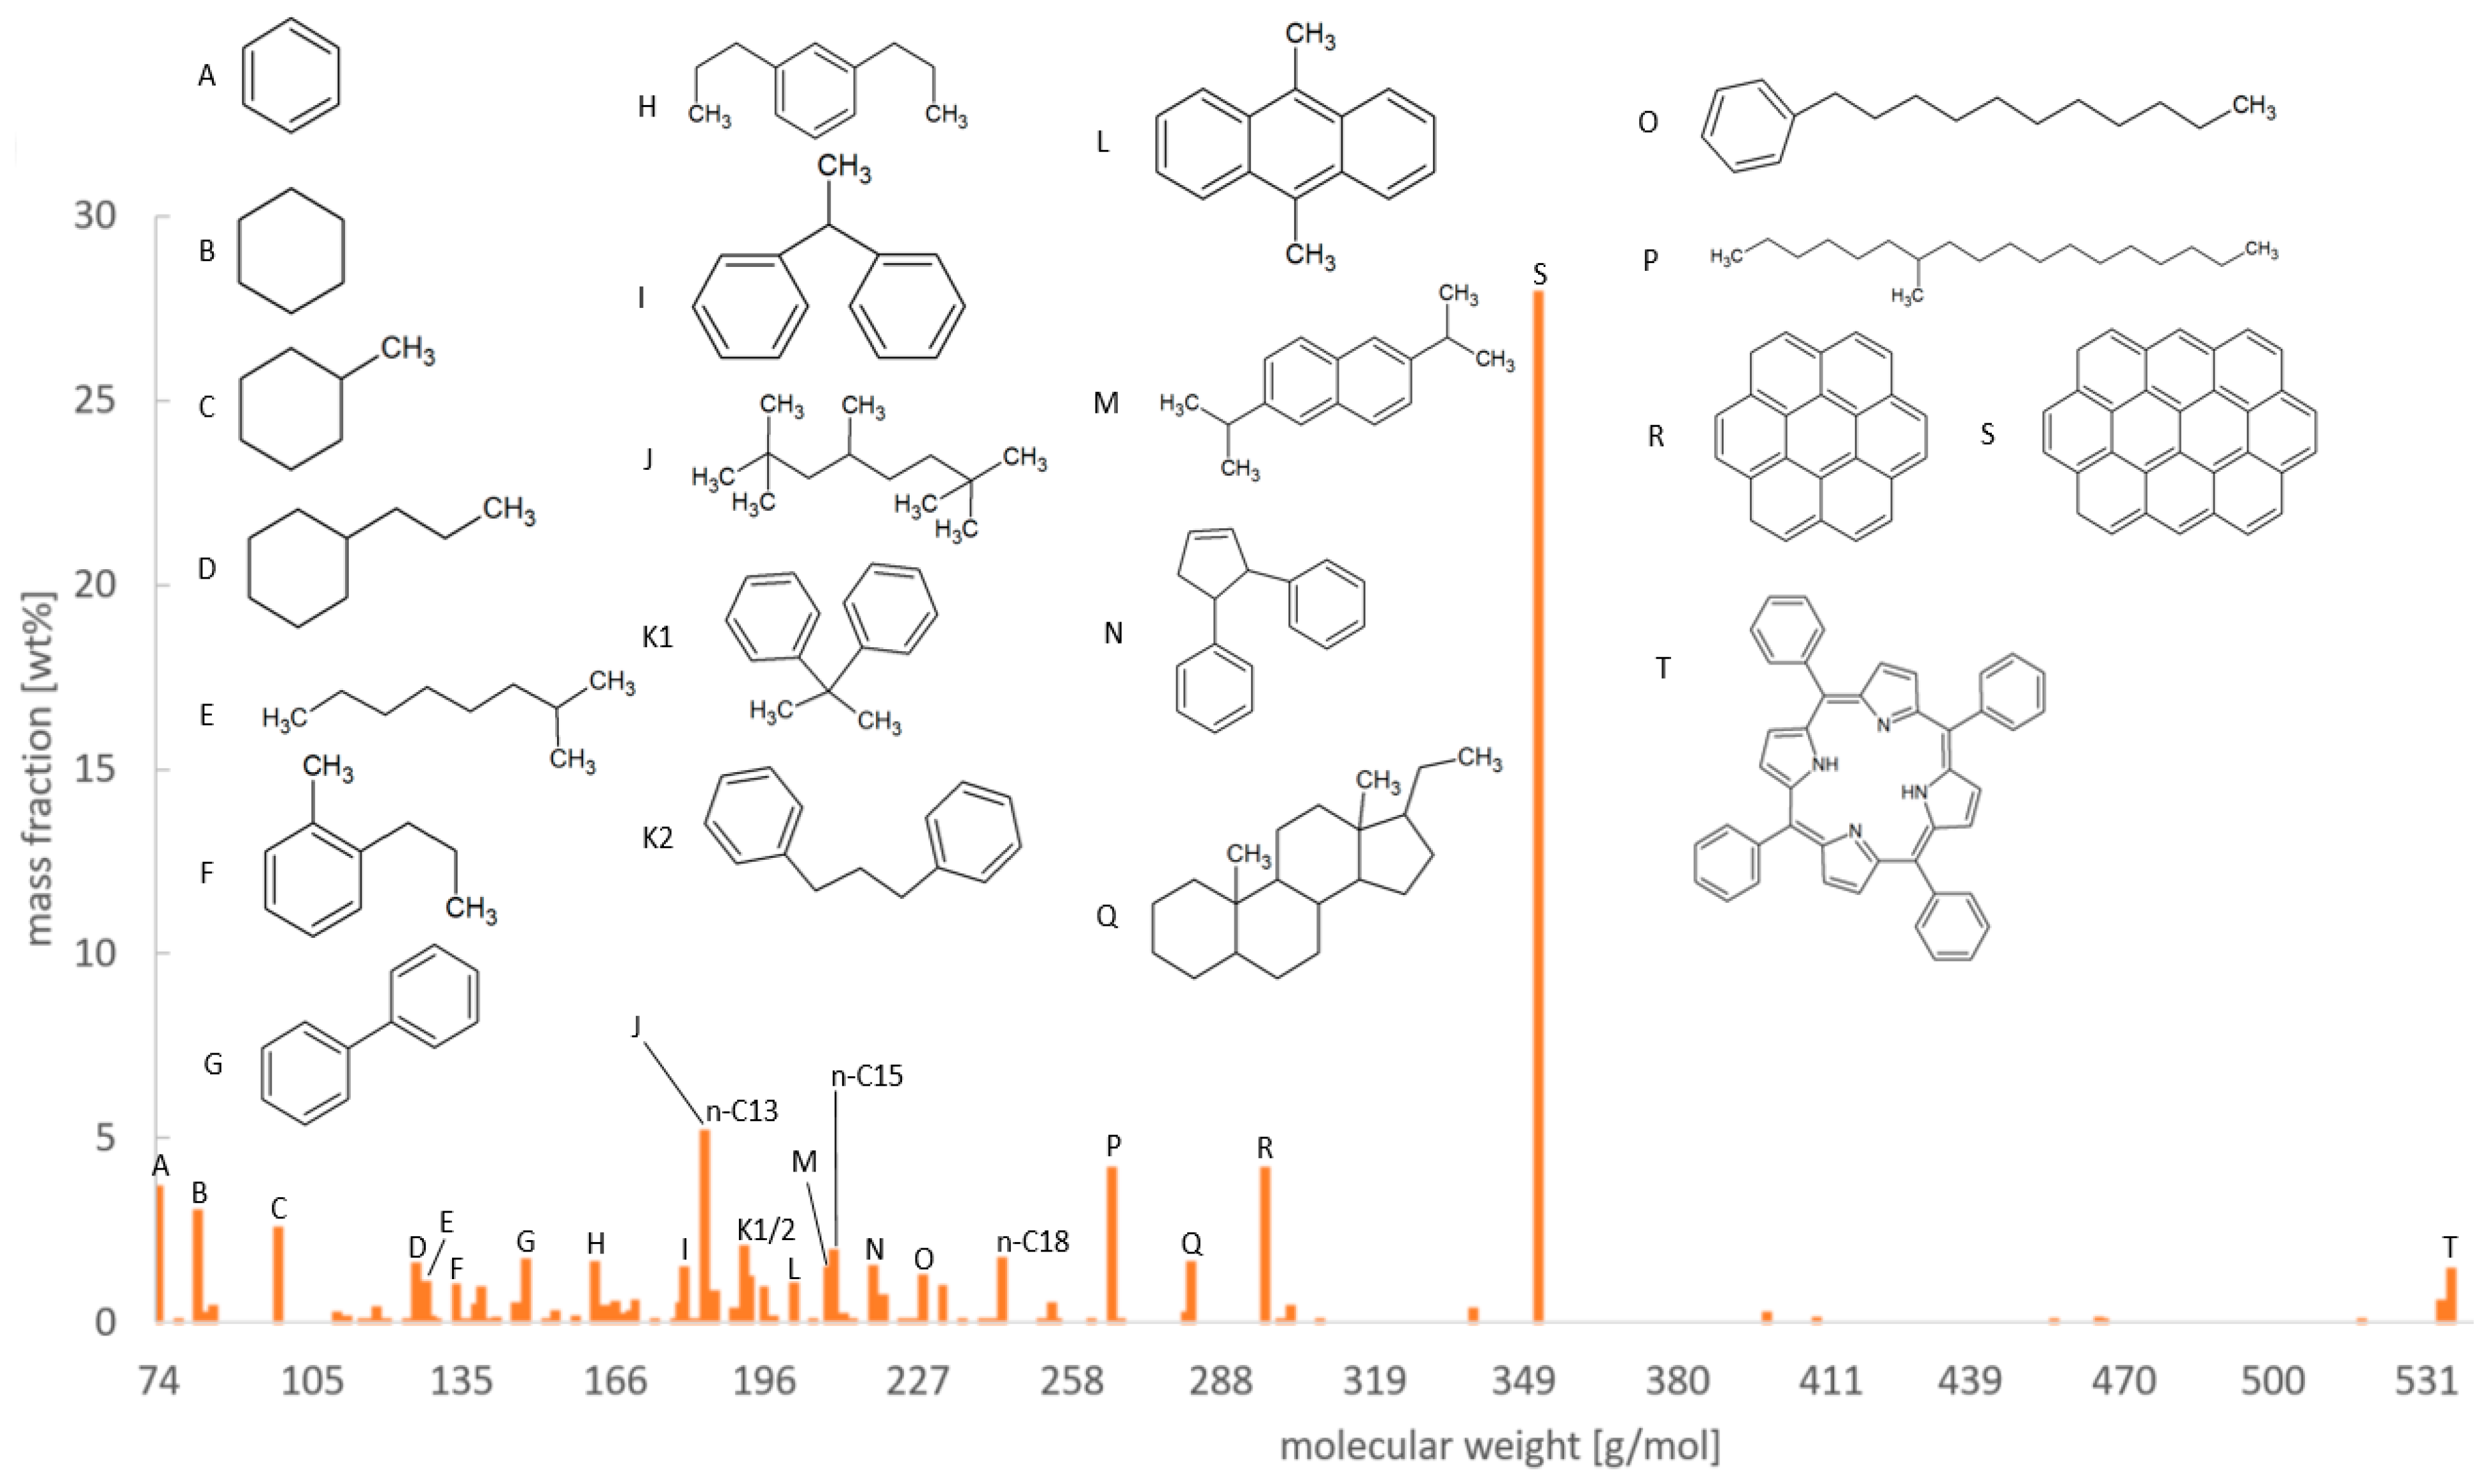
Modeled upgraded biocrude from wheat straw is composed mostly of aromatics (A, F, G, H, I, K1, K2, L–N, R-T). Cyclic-paraffins (B–D, Q) can mainly be found in the low molecular mass range. Some n-alkanes (n-C13, n-C15 and n-C18), iso-alkanes (E, P) and alkane substituted aromatics (O) are present as well.
As seen in Figure 13 the majority of upgraded biocrude can be found at boiling points above 350 °C. In the model, this range is dominated by one single compound, Ovalene (S), which has a share of more than 25 wt% of the overall upgraded biocrude. Certainly, this is far away from reality and the model does not reproduce the actual composition of this range of the upgraded biocrude very well. This indicates that the formation of high boiling poly-aromatic compounds in the HTL step is key for a better understanding of upgraded biocrudes from lignin-rich feedstock.
3.5.3. Comparison of Molecular Weight Distributions of Biocrudes and Upgraded Biocrudes
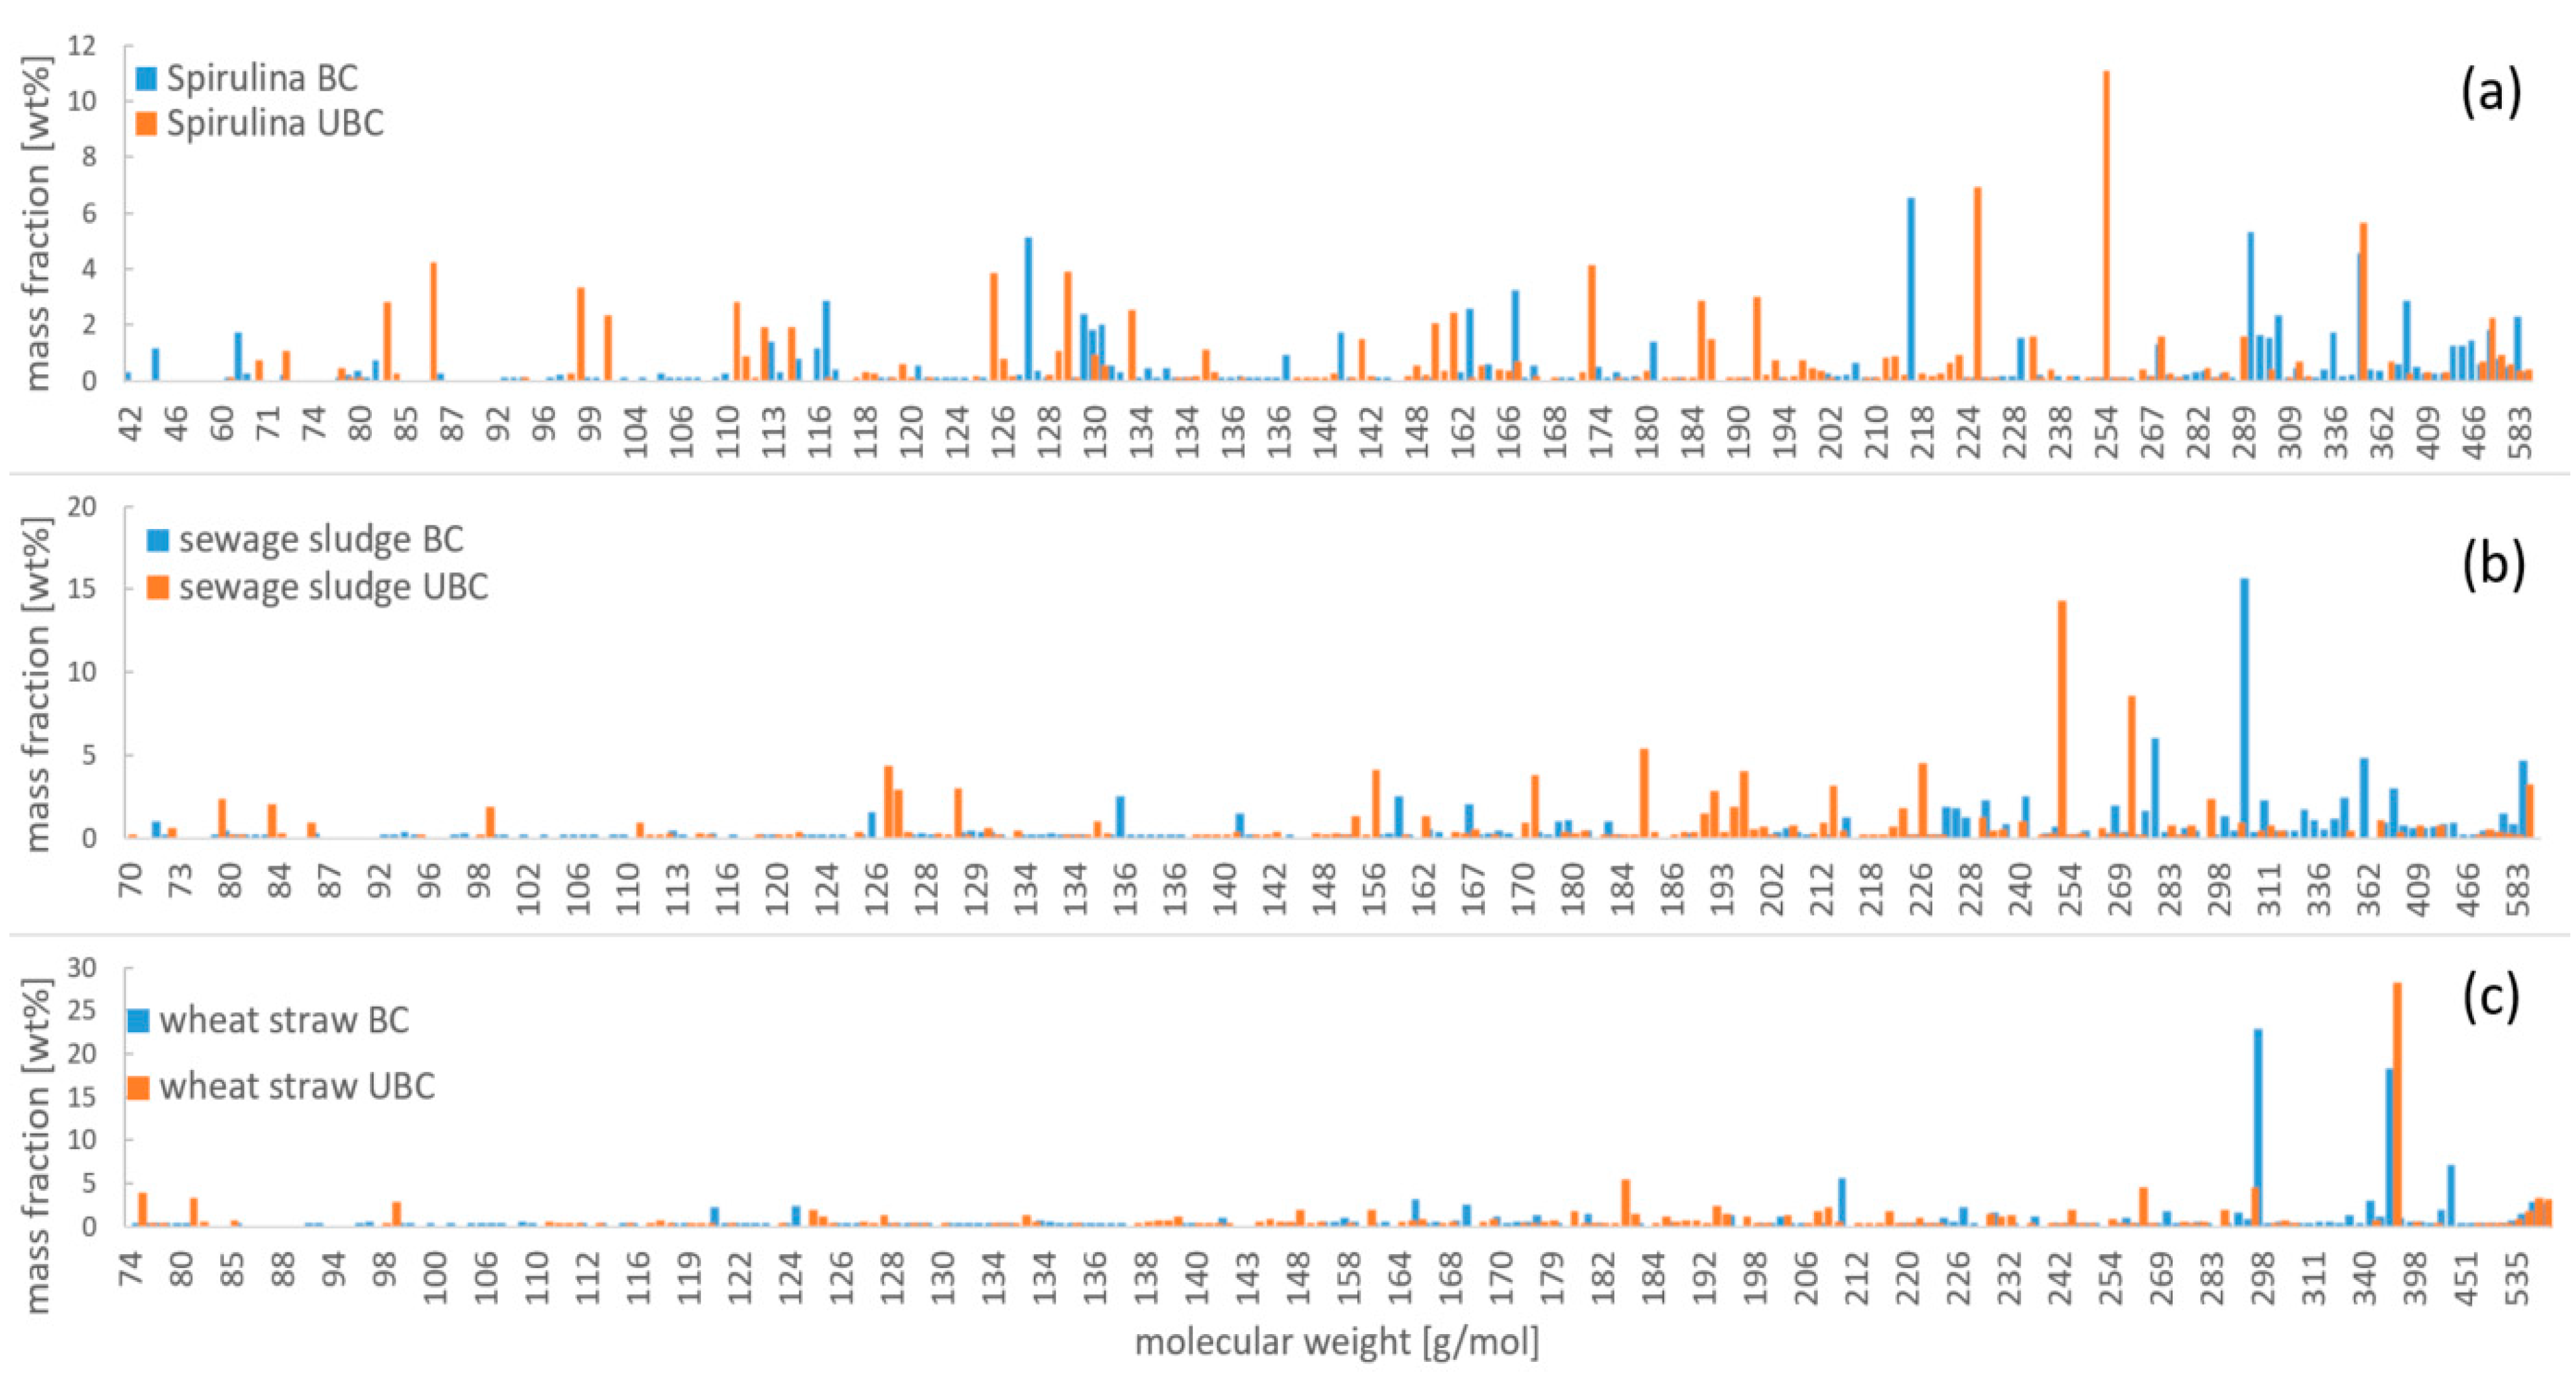
Figure 17 shows the comparison of molecular weight distributions of biocrude and upgraded biocrude obtained from Spirulina (a), sewage sludge (b) and wheat straw (c), respectively. A shift of higher molecular masses in the biocrude towards lower molecular masses in the upgraded biocrude can clearly be observed and is also supported by the values of mean molar mass, specified in the Aspen models. The mean molar mass decreases from 198.7 g/mol, 250.0 g/mol and 233.6 g/mol in the biocrude to 158.6 g/mol, 182.6 g/mol and 207.0 g/mol in the upgraded biocrude for Spirulina, sewage sludge and wheat straw, respectively. This is also compliant with the observed differences in boiling points distributions. Spirulina biocrude has a higher share of low boiling components, which results in a smaller mean molar mass, sewage sludge biocrude has a higher share of high boiling components, resulting in an increased mean molar mass. Wheat straw biocrude has the highest share of high boiling components. However, these are almost exclusively of aromatic nature which therefore leads to a slightly lower mean molar mass compared to sewage sludge biocrude. For the upgraded biocrudes, mean molar masses strictly follow the observed boiling point distributions and shares of low and high boiling components, respectively.
3.5.4. Chemical Composition and Properties of Upgraded Biocrudes
It is a clear observation, that the modeled upgraded biocrudes from Spirulina and sewage sludge are dominated by paraffins, while the upgraded biocrude of wheat straw is clearly dominated by aromatics (Table 5). In the case of sewage sludge, the origin of the n-paraffins can be traced back to the lipid content (primarily C16 and C18 fatty acids) in the feedstock, while in the case of Spirulina, parts of the n-paraffins also stem from proteins. The high amount of aromatics in the upgraded biocrude of wheat straw originates to a major extent from the high amount of carbohydrates and to a minor extent from the lignin present in the feedstock. Generally, these results are in good agreement with literature [49,50,51]. For batch-hydrotreating experiments, Haider et al. [51] and Castello et al. [50] both report amounts of n-paraffins of over 50% for microalgae, which is also reflected by the model. Aromatics, O-containing compounds as well as cyclic- and iso-paraffins are in the range of 5% to 10%. Minor amounts of upgraded biocrude can be attributed to olefins as well as N-containing and N-O-containing compounds. In the model, the amounts of O-containing and N-containing compounds are inverted, while the amounts of cyclic-paraffins and aromatics are slightly overestimated compared to these literature results. In the case of sewage sludge, both Haider et al. [51] and Castello et al. [50] report amounts of n-paraffins of over 80%. Aromatics, cyclic- and iso-paraffins are below 5%, while O-containing compounds might be slightly over 5%. These values are not reflected by the model. Although n-paraffins dominate the composition of the sewage sludge upgraded biocrude, the share is only 40 wt%. Aromatics, iso- and cyclic paraffins contribute significantly, having shares of 19.9 wt%, 13.2 wt% and 20.3 wt%, respectively. The amounts of N- and O-containing compounds are inverted, as already observed for the microalgae feedstock. With miscanthus and pine, Castello et al. [50] and Jarvis et al. [49] also investigated lignocellulosic feedstock. The latter publication reports a large amount of multicyclic and in some cases aromatic compounds in the diesel range and further mentions a lower amount of n-paraffins compared to sewage sludge and microalgae samples. This is observed in the wheat straw model as well, but with reverse amounts. Castello et al. [50] also reports lower amounts of n-paraffins between 10 wt% and 20 wt%, depending on the hydrotreating conditions. Furthermore, aromatics and cyclic-paraffins can contribute up to 30 wt% each, while a fraction of at least 10 wt% of O-containing compounds is observed. The amount of n-paraffins matches quite well with the amounts observed in the model. The sum of aromatics and cyclic-paraffins in the model is slightly higher and the share is shifted to the aromatic side quite significantly. Taking into account the low H:C ratio, it can be concluded that the amount of aromatics in the model is overestimated. As observed for the other two feedstock, the amounts of N- and O-containing compounds are inverted again. When comparing results of different HTL and HT experiments, there are further aspects that should be considered. First of all, the same feedstock can have quite diverse biochemical compositions, which is especially true for sewage sludge. It was found out that the mean value for crude fat content given in literature is 22 wt% with a standard deviation of 84.4% [19]. This is also reflected by another study, in which one sludge sample (dm) had a fat content of 22.6 wt% and another sludge sample had a fat content of 6.5 wt% [5]. Considering this and the fact that a fat content of 8.8 wt% (dm) was chosen in this model, it seems reasonable that the amount of n-paraffins is significantly lower than reported in literature. Generally, it can be observed that H:C ratios are underestimated and aromatics are overestimated, which is adhesive. This is especially true for wheat straw, in which large parts of the high boiling range is modeled with only one component, ovalene. In order to generate more reliable results for lignocellulosic feedstock, which are dominated by carbohydrates and lignin (>90 wt%), a more diverse modeling of the high boiling range is necessary.
Important fuel properties are e.g., density, calorific value, viscosity and cold flow properties (cloud point, pour point) [52]. Table 6 compares two of these properties, density, which is given based on results from the Aspen Plus® simulation and calorific values, which are calculated according to Milne et al. [53], with literature results. The density values of the modeled biocrudes of Spirulina and sewage sludge are generally slightly higher than the literature values, while the densities of the modeled upgraded biocrudes are in good agreement with literature values. In the case of the wheat straw model, especially the biocrude density is quite high, compared to literature values of lignocellulosic biomass. Also the density of the upgraded biocrude is slightly higher in the case of wheat straw. The high density values can be explained by the overestimated amount of aromatics, which generally have higher densities than other classes of hydrocarbons. The higher heating values for both biocrudes and upgraded biocrudes match quite well with literature values, except for the wheat straw biocrude. This is most likely caused by the high amount of oxygen and the low H:C ratio in the biocrude.
3.5.5. Fuel Fractions
Based on the results of the boiling point distribution curves, fractions for different fuel cuts can be obtained, as listed in Table 7. The fuel cuts were chosen according to Haider et al. and Castello et al. [50,51]. For Spirulina the gasoline fraction is most prominent, followed by the light diesel and jet fuel fraction, also containing more than 20 wt%. The heavy diesel fraction still contains a considerable amount while vacuum gas oil (VGO) and residue fractions only play a minor role. These results are somewhat different to those reported in literature [50,51]. The gasoline fraction is almost half of the herein reported amount, while the VGO and residue fraction contain significantly more upgraded biocrude. In the case of sewage sludge the light diesel fraction is most prominent, due to the high amount of n-paraffins originating mostly from lipids (C16 and C18 fatty acids). The jet fuel, gasoline and heavy diesel fractions contain between 16.9 wt% and 23.9 wt%, while the VGO and residue fraction only makes a minor part of upgraded biocrude. This is in reasonable agreement with the results reported in literature [50], except for the fact, that the VGO and residue fraction are more eminent in the literature results, while the gasoline mass fraction is smaller. As already described, the upgraded biocrude from wheat straw shows a smooth and steady boiling point distribution. This is also reflected by the distribution of fuel fractions, except for the heavy fuel oil range, which is quite high. The amount of gasoline (17.8 wt%) is comparable to that of sewage sludge. The amounts of the jet fuel and diesel fractions are 16.4 wt% and 24.7 wt%, respectively. This is considerably less than for Spirulina and sewage sludge. The VGO fraction is significantly higher than for the other two feedstocks, and the residue fraction almost adds up to one third of the obtained fuel mixture (31.7 wt%). Comparing these results to fractions of an upgraded biocrude obtained from Miscanthus, the jet fuel, light diesel, heavy diesel and vacuum gas oil fraction fit quite well. The amount of gasoline fraction in literature is significantly greater, while the residue fraction is significantly smaller [50]. Further comparison to literature results is somewhat intricate, due to the different definitions of fractional cuts. Biller et al. reported 24 wt% for a gasoline fraction, 54 wt% for a diesel fraction ranging from 190 °C to 340 °C, 17 wt% for a large vacuum gas oil fraction (340 °C–538 °C) and 5 wt% for a residue fraction of an upgraded biocrude obtained from microalgae [32]. Estimating these values and comparing them to the herein reported results, a reasonable match can be stated. Haghighat et al. investigated the HT of a biocrude obtained from lignocellulosic biomass and obtained a gasoline fraction of 12 wt%, a diesel fraction (180 °C to 343 °C) of 52 wt%, a vacuum gas oil fraction (343 °C to 550 °C) of 31 wt% and a residue fraction of 5 wt% [48]. Compared to the herein reported values, the diesel fraction is significantly higher, while the residue fraction is considerably lower. Snowden-Swan et al. investigated HTL and HT of two sludge samples, yielding 20.4 wt% to 24.7 wt% of gasoline, 64.5 to 66.8 wt% diesel (184 °C–390 °C) and 8.5 wt% to 15.1 wt% heavies [5]. Also in this case a comparison indicates a reasonable match of the herein reported results and literature results. It should be mentioned that the distribution of fraction cuts is highly sensitive towards reaction conditions of HTL as well as HT and therefore no exact match should be expected from such comparisons.
3.5.6. HT Characteristics
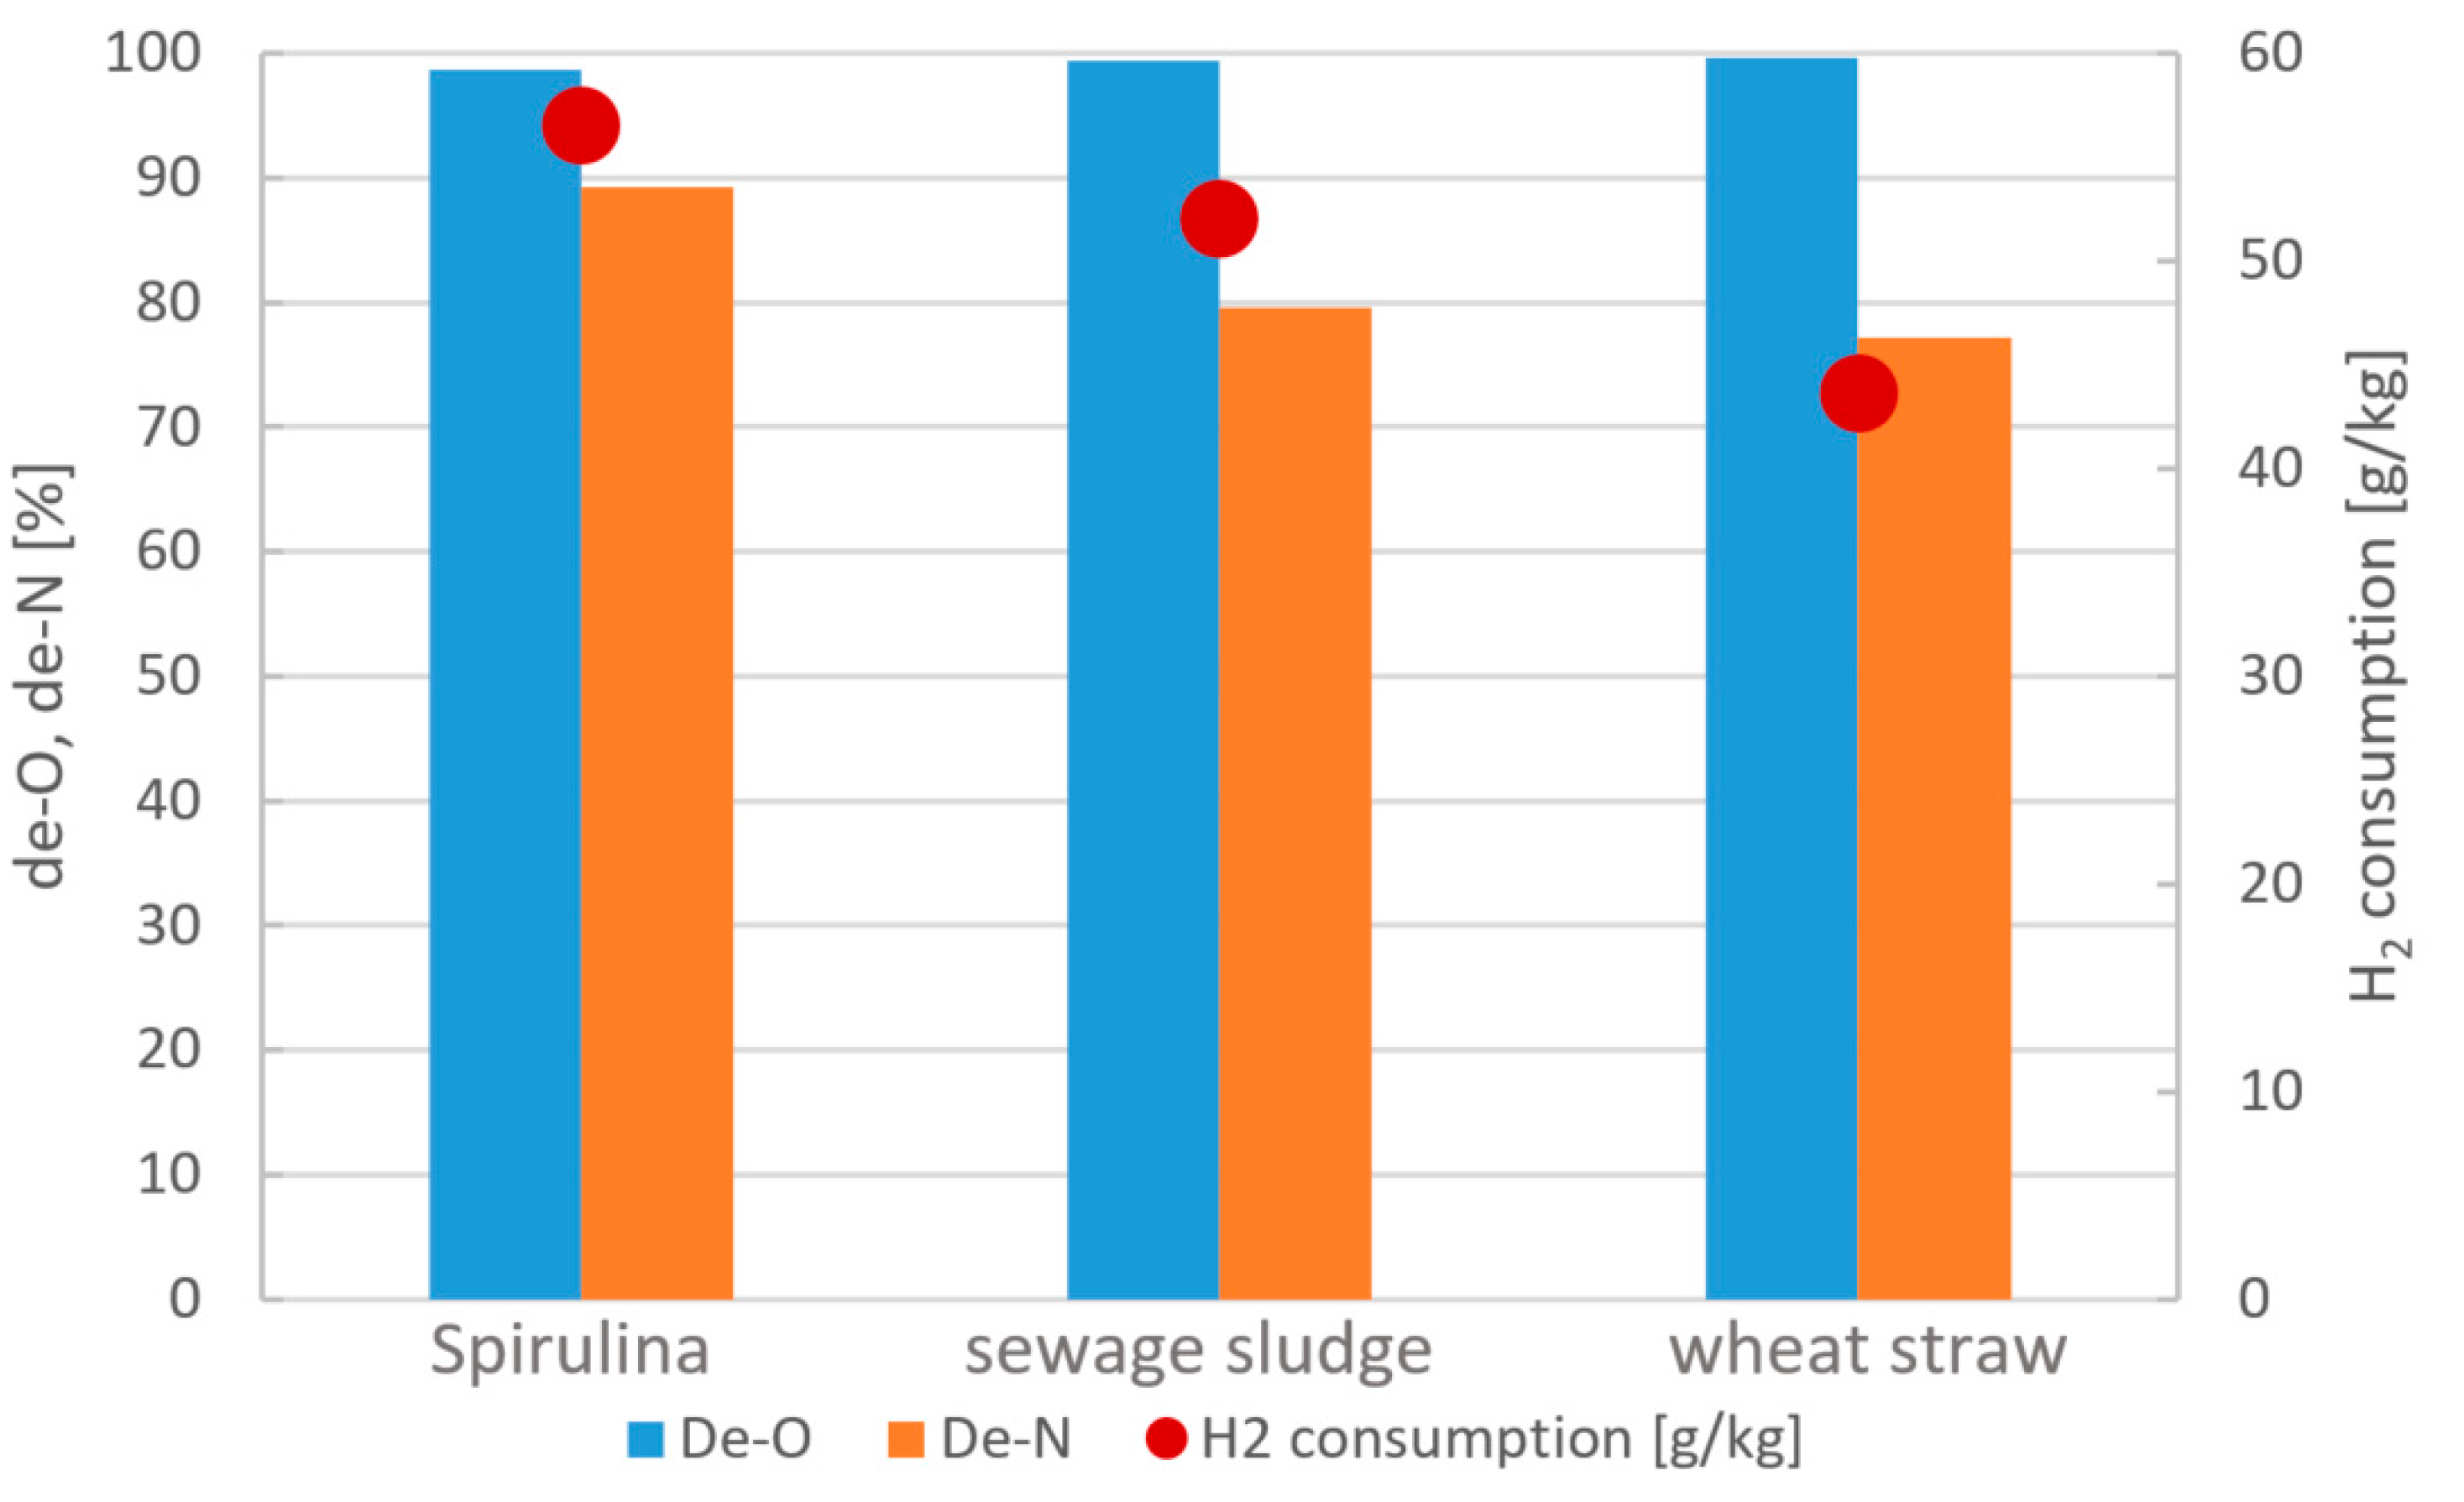
Some of the important HT characteristics, such as deoxygenation and denitrogenation rates, as well as hydrogen consumption are shown in Figure 18. Comparing the amount of heteroatoms present in the biocrudes with the hydrogen consumption a direct correlation can be observed [51]. However, higher hydrogen consumption can also be related to a higher degree of hydrogenation, which is also reflected in an increased H:C ratio.
Since deoxygenation and denitrogenation rates of wheat straw are in the same range as for Spirulina and sewage sludge and the amount of heteroatoms is even higher, the lower hydrogen consumption can be explained by the lack of hydrogenation reactions. This is also supported by the low H:C ratio observed for the upgraded biocrude of wheat straw. Absolute values of hydrogen consumption for Spirulina and sewage sludge are generally higher than literature results [48,51,55,56], except for one study by PNNL [5], in which a hydrogen consumption of 58 g/kg is reported. The high hydrogen consumption for Spirulina and sewage sludge in this study can be explained by the quite high deoxygenation (>99%) and denitrogenation (≥80%) rates as well as significant hydrogenation reactions assumed in the model.
4. Conclusions
A comprehensive model of an HTL process chain consisting of HTL, cHTG and HT has been validated with experimental results from the HyFlexFuel project. Establishing an extensive reaction network in Aspen Plus® based on proposed reactions from literature for the HTL process step and also modeling the cHTG and HT reactors with large quantities of reactions has proven to be a successful modeling approach. Key process parameters, such as yield of biocrude and upgraded biocrude, TOC values of the AP, methane yields, hydrogen consumption, and fuel fraction yields, which are important quantities for subsequent system analyses like LCA and TEA, can be reproduced confidently and are in good agreement with literature results. Therefore, it is proposed that the model can be used confidently as a basis for these subsequent system analyses. Furthermore, more detailed chemical analyses, such as elemental analysis, boiling point distribution and simulated molar mass distribution, comparable to a GC-MS analysis, give deeper insights into the chemical compositions of modeled biocrudes and upgraded biocrudes. Results for Spirulina and sewage sludge show reasonable results with minor differences compared to literature findings. The wheat straw model shows a lack of variety in the modeling of high boiling components, which results in major differences (EA, chemical composition) compared to literature results. It is proposed that results for feedstock with similar compositions to Spirulina and sewage sludge can be deduced with the herein described model. In order to guarantee reliable results for feedstock with a domination of one biochemical component (e.g., wheat straw, carbohydrates > 80 wt%), the model has to be further improved. For future studies it is proposed that a biocrude yield prediction model could be established based on the established reaction network such that biocrude yields can be predicted by the modeling. In combination with the profound chemical analysis of biocrudes and upgraded biocrudes this could be a powerful tool for the understanding of HTL reaction networks and in-depth analyses of HTL fuel conversion pathways.
Supplementary Materials
The following are available online at https://www.mdpi.com/article/10.3390/pr9071172/s1, Figure S1: Elemental analysis of feedstock, biocrude and upgraded biocrude for Spirulina; Figure S2: Elemental analysis of feedstock, biocrude and upgraded biocrude for sewage sludge; Figure S3: Elemental analysis of feedstock, biocrude and upgraded biocrude for wheat straw; Table S1: Feedstock composition, dry-matter content and mass flow for each model component in the feed stream of the Aspen Plus® model. The considered mass flows are corrected for the mass of water that is added by the assumption that hydrolysis had already taken place. It is assumed that 80% of the fatty acids had been bound in a trigliyeride, while 20% are free fatty acids. For carbohydrates, proteins and lignin it is assumed that 60%, 70% and 100% of the model compounds had been bound in polymeric form, respectively; Table S2: All model compounds, their respective component ID in the Aspen Plus® model and their respective molecular masses.
Author Contributions
Conceptualization, L.M., C.P. and V.B.; methodology, L.M.; validation, L.M., C.P. and V.B.; formal analysis, L.M.; investigation, C.P., L.M., V.B.; writing—original draft preparation, L.M.; writing—review and editing, L.M., V.B., C.P.; visualization, L.M.; supervision, V.B.; project administration, V.B. All authors have read and agreed to the published version of the manuscript.
Funding
This project has received funding from the European Union‘s Horizon 2020 research and innovation programme under grant agreement No 764734.
Institutional Review Board Statement
Not applicable.
Informed Consent Statement
Not applicable.
Data Availability Statement
All additional data is available as supporting information.
Acknowledgments
The authors would like to thank associate Patrick Biller and assistant Daniele Castello for kindly providing experimental results. We also thank the HyFlexFuel consortium for making this work possible.
Conflicts of Interest
The authors declare no conflict of interest.
Abbreviations
| AP | aqueous phase |
| bc | biocrude |
| cHTG | catalytic hydrothermal gasification |
| DGFORM | standard Gibbs free energy of formation |
| DHFORM | standard enthalpy of formation |
| GC | gas chromatography |
| HT | hydrotreatment |
| HTL | hydrothermal liquefaction |
| LCA | life cycle assessment |
| MS | mass spectrometry |
| NMR | nuclear magnetic resonance |
| PER | permeate |
| PNNL | Pacific Northwest National Laboratories |
| RET | retentate |
| SI | supporting information |
| TEA | techno-economic analysis |
| TOC | total organic carbon |
| ubc | upgraded biocrude |
| VGO | vacuum gas oil |
| wt | weight |
| WW | wastewater |
References
- A European Green Deal. Available online: https://ec.europa.eu/info/strategy/priorities-2019-2024/european-green-deal_en (accessed on 26 May 2021).
- How China Could Be Carbon Neutral by Mid-Century. Available online: https://www.nature.com/articles/d41586-020-02927-9 (accessed on 26 May 2021).
- The Biden Plan for a Clean Energy Revolution and Environmental Justice. Available online: https://joebiden.com/climate-plan/ (accessed on 26 May 2021).
- De Jong, S.; Hoefnagels, R.; Faaij, A.; Slade, R.; Mawhood, R.; Junginger, M. The feasibility of short-term production strategies for renewable jet fuels—A comprehensive techno-economic comparison. Biofuels Bioprod. Bioref. 2015, 9, 778–800. [Google Scholar] [CrossRef]
- Snowden-Swan, L.; Billing, J.M.; Thorson, M.; Schmidt, A.; Santosa, M.; Jones, S.B.; Hallen, R.T. Wet Waste Hydrothermal Liquefction and Biocrude Upgrading to Hydrocarbon Fuels: 2019 State of Technology; U.S. Department of Energy, Office of Scientific and Technical Information: Richland, WA, USA, 2020.
- Jones, S.B.; Zhu, Y.; Anderson, D.; Hallen, R.T.; Elliott, D.C.; Schmidt, A.J.; Albrecht, K.O.; Hart, T.R.; Butcher, M.; Drennan, C.; et al. Process Design and Economics for the Conversion of Alga Biomass to Hydrocarbons: Whole Alge Hydrothermal Liquefaction and Upgrading; U.S. Department of Energy: Richland, WA, USA, 2014.
- Teri, G.; Luo, L.; Savage, P.E. Hydrothermal treatment of protein, polysaccharide, and lipids alone and in mixtures. Energy Fuels 2014, 28, 7501–7509. [Google Scholar] [CrossRef]
- Déniel, M.; Haarlemmer, G.; Roubaud, A.; Weiss-Hortala, E.; Fages, J. Energy valorisation of food processing residues and model compounds by hydrothermal liquefaction. Renew. Sustain. Energy Rev. 2016, 54, 1632–1652. [Google Scholar] [CrossRef] [Green Version]
- Demirbas, A. Mechanisms of liquefaction and pyrolysis reactions of biomass. Energy Convers. Manag. 2000, 41, 633–646. [Google Scholar] [CrossRef]
- Leow, S.; Witter, J.R.; Vardon, D.R.; Sharma, B.K.; Guest, J.S.; Strathmann, T.J. Prediction of microalgae hydrothermal liquefaction products from feedstock biochemical composition. Green Chem. 2015, 17, 3584–3599. [Google Scholar] [CrossRef] [Green Version]
- Li, Y.; Leow, S.; Fedders, A.C.; Sharma, B.K.; Guest, J.S.; Strathmann, T.J. Quantitative multiphase model for hydrothermal liquefaction of algal biomass. Green Chem. 2017, 19, 1163–1174. [Google Scholar] [CrossRef]
- Hoffmann, J.; Rudra, S.; Toor, S.S.; Holm-Nielsen, J.B.; Rosendahl, L.A. Conceptual design of an integrated hydrothermal liquefaction and biogas plant for sustainable bioenergy production. Bioresour. Technol. 2013, 129, 402–410. [Google Scholar] [CrossRef] [PubMed]
- Snowden-Swan, L.; Zhu, Y.; Bearden, M.D.; Seiple, T.E.; Jones, S.B.; Schmidt, A.J.; Billing, J.M.; Hallen, R.T.; Hart, T.R.; Liu, J.; et al. Conceptual Biorefinery Design and Research Targeted for 2022: Hydrothermal Liquefaction Processing of Wet Waste to Fuel; U.S. Department of Energy, Office of Scientific and Technical Information: Richland, WA, USA, 2017.
- Knorr, D.; Lukas, J.; Schoen, P. Production of Advanced Biofuels via Liquefaction Hydrothermal Liquefaction Reactor Design; National Advanced Biofuels, Co.: Atlanta, GA, USA, 2013. [Google Scholar]
- Matayeva, A.; Bianchi, D.; Chiaberge, S.; Cavani, F.; Basile, F. Elucidation of reaction pathways of nitrogenous species by hydrothermal liquefaction process of model compounds. Fuel 2019, 240, 169–178. [Google Scholar] [CrossRef]
- Gai, C.; Zhang, Y.; Chen, W.-T.; Zhang, P.; Dong, Y. An investigation of reaction pathways of hydrothermal liquefaction using Chlorella pyrenoidosa and Spirulina platensis. Energy Convers. Manag. 2015, 96, 330–339. [Google Scholar] [CrossRef]
- Yang, J.; He, Q.; Niu, H.; Corscadden, K.; Astatkie, T. Hydrothermal liquefaction of biomass model components for product yield prediction and reaction pathways exploration. Appl. Energy 2018, 228, 1618–1628. [Google Scholar] [CrossRef]
- Peterson, A.A.; Vogel, F.; Lachance, R.P.; Fröling, M.; Antal, J.M.J.; Tester, J.W. Thermochemical biofuel production in hydrothermal media: A review of sub- and supercritical water technologies. Energy Environ. Sci. 2008, 1, 32. [Google Scholar] [CrossRef]
- Görsch, K.; Schwarzbach, K. Public Report—Final Report on Feedstock Analysis and Characteristics. Horizon 2020: HyFlexFuel Project; European Commission: Leipzig, Germany, 2020. [Google Scholar]
- Wyman, C.E.; Decker, S.R.; Himmel, M.E.; Brady, J.W.; Skopec, C.E.; Viikari, L. Hydrolysis of Cellulose and Hemicellulose. In Polysaccharides: Structural Diversity and Functional Versatility; Dumitriu, S., Ed.; CRC Press: Boca Raton, FL, USA, 2004; pp. 995–1034. [Google Scholar]
- Gellerstedt, G.; Henriksson, G. Lignins: Major Sources, Structure and Properties. In Monomers, Polymers and Composites from Renewable Resources; Belgacem, M.N., Gandini, A., Eds.; Elsevier Ltd.: Oxford, UK, 2008; pp. 201–224. ISBN 978-0-08-045316-3. [Google Scholar]
- Pettersen, R.C. The Chemical Composition of Wood. In The Chemistry of Solid Wood; Rowell, R., Ed.; American Chemical Society: Seattle, WA, USA, 1984; pp. 57–126. ISBN 9780841207967. [Google Scholar]
- Checalc: Properties Estimation Joback Method. Available online: https://checalc.com/solved/property_joback.html (accessed on 21 May 2021).
- Haider, M.; Castello, D.; Michalski, K.; Pedersen, T.; Rosendahl, L. Catalytic hydrotreatment of microalgae biocrude from continuous hydrothermal liquefaction: Heteroatom removal and their distribution in distillation cuts. Energies 2018, 11, 3360. [Google Scholar] [CrossRef] [Green Version]
- Déniel, M.; Haarlemmer, G.; Roubaud, A.; Weiss-Hortala, E.; Fages, J. Modelling and predictive study of hydrothermal liquefaction: Application to food processing residues. Waste Biomass Valorization 2017, 8, 2087–2107. [Google Scholar] [CrossRef]
- Wang, Z. Reaction Mechanisms of Hydrothermal Liquefaction of Model Compounds and Biowaste Feedstocks. Ph.D. Thesis, University of Illinois, Urbana, IL, USA, 2011. [Google Scholar]
- Kumar, S. Hydrothermal Treatment for Biofuels: Lignocellulosic Biomass to Bioethanol, Biocrude, and Biochar. Ph.D. Thesis, Auburn University, Auburn, AL, USA, 2010. [Google Scholar]
- Déniel, M.; Haarlemmer, G.; Roubaud, A.; Weiss-Hortala, E.; Fages, J. Hydrothermal liquefaction of blackcurrant pomace and model molecules: Understanding of reaction mechanisms. Sustain. Energy Fuels 2017, 1, 555–582. [Google Scholar] [CrossRef] [Green Version]
- Elliott, C.D. Catalytic hydrothermal gasification of biomass. Biofuels Bioprod. Biorefining 2008, 2, 254–265. [Google Scholar] [CrossRef]
- Elliott, D.C.; Neuenschwander, G.G.; Hart, T.R.; Rotness, L.J.; Zacher, A.H.; Santosa, D.M.; Valkenburt, C.; Jones, S.B.; Tjokro Rahardjo, S.A. Catalytic Hydrothermal Gasification of Lignin-Rich Biorefinery Residues and Algae Final Report. Report PNNL-18944; Pacific Northwest National Laboratory (PNNL): Richland, WA, USA, 2009. Available online: https://www.osti.gov/biblio/968956.PNNL-18944 (accessed on 30 June 2021).
- Afif, E.; Azadi, P.; Farnood, R. Catalytic hydrothermal gasification of activated sludge. Appl. Catal. B Environ. 2011, 105, 136–143. [Google Scholar] [CrossRef]
- Biller, P.; Sharma, B.K.; Kunwar, B.; Ross, A.B. Hydroprocessing of bio-crude from continuous hydrothermal liquefaction of microalgae. Fuel 2015, 159, 197–205. [Google Scholar] [CrossRef] [Green Version]
- Han, Y.; Hoekman, K.; Jena, U.; Das, P. Use of co-solvents in hydrothermal liquefaction (HTL) of microalgae. Energies 2020, 13, 124. [Google Scholar] [CrossRef] [Green Version]
- Han, Y.; Hoekman, S.K.; Cui, Z.; Jena, U.; Das, P. Hydrothermal liquefaction of marine microalgae biomass using co-solvents. Algal Res. 2019, 38, 101421. [Google Scholar] [CrossRef]
- Cheng, F.; Jarvis, J.M.; Yu, J.; Jena, U.; Nirmalakhandan, N.; Schaub, T.M.; Brewer, E.C. Bio-crude oil from hydrothermal liquefaction of wastewater microalgae in a pilot-scale continuous flow reactor. Bioresour. Technol. 2019, 294, 122184. [Google Scholar] [CrossRef]
- Thomsen, L.; Carvalho, P.N.; Dos Passos, J.S.; Anastasakis, K.; Bester, K.; Biller, P. Hydrothermal liquefaction of sewage sludge; energy considerations and fate of micropollutants during pilot scale processing. Water Res. 2020, 183, 116101. [Google Scholar] [CrossRef] [PubMed]
- Pedersen, T.H.; Grigoras, I.F.; Hoffmann, J.; Toor, S.S.; Daraban, I.M.; Jensen, C.U.; Iversen, S.B.; Madsen, R.B.; Glasius, M.; Arturi, K.R.; et al. Continuous hydrothermal co-liquefaction of aspen wood and glycerol with water phase recirculation. Appl. Energy 2016, 162, 1034–1041. [Google Scholar] [CrossRef] [Green Version]
- Sintamarean, I.M.; Grigoras, I.F.; Jensen, C.U.; Toor, S.S.; Pedersen, T.H.; Rosendahl, L.A. Two-stage alkaline hydrothermal liquefaction of wood to biocrude in a continuous bench-scale system. Biomass Conv. Bioref. 2017, 7, 425–435. [Google Scholar] [CrossRef] [Green Version]
- Seehar, T.H.; Toor, S.S.; Shah, A.A.; Pedersen, T.H.; Rosendahl, L.A. Biocrude production from wheat straw at sub and supercritical hydrothermal liquefaction. Energies 2020, 13, 3114. [Google Scholar] [CrossRef]
- Watson, J.; Wang, T.; Si, B.; Chen, W.-T.; Aierzhati, A.; Zhang, Y. Valorization of hydrothermal liquefaction aqueous phase: Pathways towards commercial viability. Prog. Energy Combust. Sci. 2020, 77, 100819. [Google Scholar] [CrossRef]
- Madsen, R.B.; Bernberg, R.Z.K.; Biller, P.; Becker, J.; Iversen, B.B.; Glasius, M. Hydrothermal co-liquefaction of biomasses: Quantitative analysis of bio-crude and aqueous phase composition. Sustain. Energy Fuels 2017, 1, 789–805. [Google Scholar] [CrossRef] [Green Version]
- Shah, A.A.; Toor, S.S.; Seehar, T.H.; Nielsen, R.S.; Nielsen, A.H.; Pedersen, T.H.; Rosendahl, L.A. Bio-crude production through aqueous phase recycling of hydrothermal liquefaction of sewage sludge. Energies 2020, 13, 493. [Google Scholar] [CrossRef] [Green Version]
- Stucki, S.; Vogel, F.; Ludwig, C.; Haiduc, A.G.; Brandenberger, M. Catalytic gasification of algae in supercritical water for biofuel production and carbon capture. Energy Environ. Sci. 2009, 2, 535. [Google Scholar] [CrossRef]
- Horizon 2020 HyFlexFuel Project. Available online: https://cordis.europa.eu/project/id/764734 (accessed on 30 June 2021).
- Castello, D.; Haider, M.S.; Rosendahl, L.A. Succesful production and testing of on-specification aviation biofuel from hydrothermal liquefaction and catalytic hydrotreating. In Proceedings of the EUBCE, 29th European Biomass Conference & Exhibition, Virtual, 27 April 2021. [Google Scholar]
- Pedersen, T.H.; Jensen, C.U.; Sandström, L.; Rosendahl, L.A. Full characterization of compounds obtained from fractional distillation and upgrading of a HTL biocrude. Appl. Energy 2017, 202, 408–419. [Google Scholar] [CrossRef] [Green Version]
- Jensen, C.U.; Hoffmann, J.; Rosendahl, L.A. Co-processing potential of HTL Bio-crude at petroleum refineries: Part 2: A parametric hydrotreating study. Fuel 2016, 165, 536–543. [Google Scholar] [CrossRef]
- Haghighat, P.; Montanez, A.; Aguilera, G.R.; Rodriguez Guerrero, J.K.; Karatzos, S.; Clarke, M.A.; McCaffrey, W. Hydrotreating of Hydrofaction™ biocrude in the presence of presulfided commercial catalysts. Sustain. Energy Fuels 2019, 3, 744–759. [Google Scholar] [CrossRef]
- Jarvis, J.M.; Albrecht, K.O.; Billing, J.M.; Schmidt, A.J.; Hallen, R.T.; Schaub, T.M. Assessment of hydrotreatment for hydrothermal liquefaction biocrudes from sewage sludge, microalgae, and pine feedstocks. Energy Fuels 2018, 32, 8483–8493. [Google Scholar] [CrossRef]
- Castello, D.; Haider, M.S.; Rosendahl, L.A. Catalytic upgrading of hydrothermal liquefaction biocrudes: Different challenges for different feedstocks. Renew. Energy 2019, 141, 420–430. [Google Scholar] [CrossRef] [Green Version]
- Haider, M.S.; Castello, D.; Rosendahl, L.A. Two-stage catalytic hydrotreatment of highly nitrogenous biocrude from continuous hydrothermal liquefaction: A rational design of the stabilization stage. Biomass Bioenergy 2020, 139, 105658. [Google Scholar] [CrossRef]
- Pires, A.P.P.; Han, Y.; Kramlich, J.; Garcia-Perez, M. Chemical composition and fuel properties of alternative jet fuels. Bioresources 2018, 13, 2632–2657. [Google Scholar] [CrossRef] [Green Version]
- Milne, T.; Brennan, A.H.; Glenn, B.H. Sourcebook of Methods of Analysis for Biomass and Biomass Conversion Processes, 1st ed.; Springer: Amsterdam, The Netherlands, 1990; ISBN 978-1-85166-527-3. [Google Scholar]
- Hossain, F.; Kosinkova, J.; Brown, R.; Ristovski, Z.; Hankamer, B.; Stephens, E.; Rainey, T. Experimental investigations of physical and chemical properties for microalgae HTL bio-crude using a large batch reactor. Energies 2017, 10, 467. [Google Scholar] [CrossRef] [Green Version]
- Albrecht, K.O.; Zhu, Y.; Schmidt, A.J.; Billing, J.M.; Hart, T.R.; Jones, S.B.; Maupin, G.; Hallen, R.T.; Ahrens, T.; Anderson, D. Impact of heterotrophically stressed algae for biofuel production via hydrothermal liquefaction and catalytic hydrotreatin in continuous-flow reactors. Algal Res. 2016, 2016, 17–27. [Google Scholar] [CrossRef] [Green Version]
- Marrone, P.A.; Elliott, D.C.; Billing, J.M.; Hallen, R.T.; Hart, T.R.; Kadota, P.; Moeller, J.C.; Randel, M.A.; Schmidt, A.J. Bench-scale evaluation of hydrothermal processing technology for conversion of wastewater solids to fuels. Water Environ. Res. 2018, 90, 329–342. [Google Scholar] [CrossRef]
Figure 1.
Overview of the process chain investigated in this study.

Figure 2.
Flowsheet diagram of the HTL process step.


Figure 4.
Flowsheet of the cHTG process step.

Figure 5.
Matrix for calculating the stochiometry of a reaction as described in Equation (2) for any given compound with the formula CCHHNNOOSS.
Figure 5.
Matrix for calculating the stochiometry of a reaction as described in Equation (2) for any given compound with the formula CCHHNNOOSS.

Figure 6.
Flowsheet of the hydrotreating unit.

Figure 7.
Gas composition of cHTG gases from the three feedstock Spirulina (blue), sewage sludge (orange) and wheat straw (grey).
Figure 7.
Gas composition of cHTG gases from the three feedstock Spirulina (blue), sewage sludge (orange) and wheat straw (grey).

Figure 8.
Van Krevelen diagram showing the atomic H:C ratio over the atomic O:C ratio for feedstock, biocrude and upgraded biocrudes. Model values and results from the HyFlexFuel project [44] for Spirulina (blue), sewage sludge (orange) and wheat straw (grey) are given as circles. Model results are shown in light colours, while experimental results are depicted in dark colours. Literature feedstock values are shown as rhombi, literature biocrude values are given as triangles and literature upgraded biocrude values are depicted as squares [5,32,37,38,46,47,48].

Figure 9.
Experimental and model boiling point distributions for biocrudes from Spirulina, sewage sludge and wheat straw. For wheat straw no experimental boiling point distribution from the HyFlexFuel project is available.
Figure 9.
Experimental and model boiling point distributions for biocrudes from Spirulina, sewage sludge and wheat straw. For wheat straw no experimental boiling point distribution from the HyFlexFuel project is available.

Figure 10.
Molecular mass distribution and main biocrude model compounds for Spirulina as feedstock.
Figure 10.
Molecular mass distribution and main biocrude model compounds for Spirulina as feedstock.

Figure 11.
Molecular mass distribution and main biocrude model compounds for sewage sludge as feedstock.
Figure 11.
Molecular mass distribution and main biocrude model compounds for sewage sludge as feedstock.

Figure 12.
Molecular mass distribution and main biocrude model compounds for wheat straw as feedstock.
Figure 12.
Molecular mass distribution and main biocrude model compounds for wheat straw as feedstock.

Figure 13.
Experimental and model boiling point distributions for upgraded biocrudes from Spirulina (blue), sewage sludge (orange) and wheat straw (grey). Experimental results are shown in dark colors, while model results are depicted in light colors.
Figure 13.
Experimental and model boiling point distributions for upgraded biocrudes from Spirulina (blue), sewage sludge (orange) and wheat straw (grey). Experimental results are shown in dark colors, while model results are depicted in light colors.

Figure 14.
Molecular mass distribution and main upgraded biocrude model compounds for Spirulina as feedstock.
Figure 14.
Molecular mass distribution and main upgraded biocrude model compounds for Spirulina as feedstock.

Figure 15.
Molecular mass distribution and main upgraded biocrude model compounds for sewage sludge as feedstock.
Figure 15.
Molecular mass distribution and main upgraded biocrude model compounds for sewage sludge as feedstock.

Figure 16.
Molecular mass distribution and main upgraded biocrude model compounds for wheat straw as feedstock.
Figure 16.
Molecular mass distribution and main upgraded biocrude model compounds for wheat straw as feedstock.

Figure 17.
Molecular mass distribution of biocrude (blue) and upgraded biocrude (orange) for Spirulina (a), sewage sludge (b) and wheat straw (c).
Figure 17.
Molecular mass distribution of biocrude (blue) and upgraded biocrude (orange) for Spirulina (a), sewage sludge (b) and wheat straw (c).

Figure 18.
Deoxygenation and denitrogenation rates, as well as hydrogen consumption for Spirulina (left), sewage sludge (middle) and wheat straw (right).
Figure 18.
Deoxygenation and denitrogenation rates, as well as hydrogen consumption for Spirulina (left), sewage sludge (middle) and wheat straw (right).


Table 1.
Experimental elemental analysis (dry, ash-free) [19], and modeled amounts of biochemical groups of the three investigated feedstock Spirulina, sewage sludge and wheat straw. The amounts of biochemical groups are derived from experimental elemental analysis and experimental analyses of compositions [19]. The amounts of each model compound used in the simulation are listed in Table S1.
| Feedstock | C | H | N | O | S | Lipids | Carbohydrates | Proteins | Lignin | Extractives | Ash |
|---|---|---|---|---|---|---|---|---|---|---|---|
| Spirulina | 54.0 | 7.2 | 13.5 | 24.4 | 0.9 | 1.3 | 39.4 | 50.8 | 0.4 | 0.6 | 7.4 |
| Sewage sludge | 54.0 | 7.4 | 3.6 | 34.7 | 0.3 | 8.8 | 48.1 | 15.8 | 6.6 | 1.7 | 19.1 |
| Wheat straw | 54.6 | 5.9 | 0.8 | 38.6 | 0.2 | 2.1 | 83.9 | 4.8 | 7.0 | 0.6 | 1.6 |
Table 2.
Mass and carbon mass balances for the most relevant streams of the three process units, respectively.
Table 2.
Mass and carbon mass balances for the most relevant streams of the three process units, respectively.
| HTL | cHTG | HT | ||||||||
|---|---|---|---|---|---|---|---|---|---|---|
| Stream | Mass/ Carbon Flow (kg h−1) | Stream | Mass/ Carbon Flow (kg h−1) | Stream | Mass/ Carbon Flow (kg h−1) | |||||
| Spirulina | ||||||||||
| Feed | 1.00 | 0.51 | RET (1) | 1.94 | 0.13 | BC | 0.36 | 0.28 | ||
| Water | 4.86 | - | BRINE | 0.37 | 0 | H2 | 0.16 | - | ||
| SOLID | 0.08 | 0.01 | 2 | 1.58 | 0.13 | GAS | 0.21 | 0.03 | ||
| GAS | 0.31 | 0.06 | GAS | 0.22 | 0.09 | WW | 0.02 | 0.00 | ||
| AP | 5.11 | 0.17 | WW | 1.36 | 0.04 | UBC | 0.29 | 0.25 | ||
| BC | 0.36 | 0.28 | methane | 0.06 | 0.05 | |||||
| RET | 1.94 | 0.13 | ||||||||
| PER | 3.17 | 0.04 | ||||||||
| Sewage sludge | ||||||||||
| Feed | 1.00 | 0.44 | RET (1) | 1.78 | 0.09 | BC | 0.34 | 0.26 | ||
| Water | 4.49 | - | BRINE | 0.33 | 0 | H2 | 0.15 | - | ||
| SOLID | 0.19 | 0.00 | 2 | 1.45 | 0.09 | GAS | 0.18 | 0.02 | ||
| GAS | 0.17 | 0.06 | GAS | 0.17 | 0.07 | WW | 0.04 | 0.00 | ||
| AP | 4.79 | 0.12 | WW | 1.28 | 0.02 | UBC | 0.28 | 0.24 | ||
| BC | 0.34 | 0.26 | methane | 0.05 | 0.04 | |||||
| RET | 1.78 | 0.09 | ||||||||
| PER | 3.01 | 0.03 | ||||||||
| Wheat straw | ||||||||||
| Feed | 1.00 | 0.47 | RET (1) | 1.85 | 0.11 | BC | 0.31 | 0.24 | ||
| Water | 4.49 | - | BRINE | 0.33 | 0.00 | H2 | 0.15 | - | ||
| SOLID | 0.02 | 0.00 | 2 | 1.52 | 0.11 | GAS | 0.17 | 0.01 | ||
| GAS | 0.23 | 0.09 | GAS | 0.20 | 0.09 | WW | 0.04 | 0.00 | ||
| AP | 4.95 | 0.14 | WW | 1.32 | 0.02 | UBC | 0.25 | 0.23 | ||
| BC | 0.31 | 0.24 | methane | 0.07 | 0.05 | |||||
| RET | 1.85 | 0.11 | ||||||||
| PER | 3.10 | 0.03 | ||||||||
Table 3.
TOC values for the three streams AP, retentate and permeate for each feedstock.
| TOC/Feedstock | Spirulina | Sewage Sludge | Wheat Straw |
|---|---|---|---|
| TOC (AP) [g/L] | 35.0 | 25.5 | 30.4 |
| TOC (retentate) [g/L] | 78.0 | 56.9 | 67.7 |
| TOC (permeate) [g/L] | 11.8 | 8.6 | 10.3 |
Table 4.
Elemental analysis of feedstock, biocrude and upgraded biocrude from Spirulina, sewage sludge and wheat straw.
Table 4.
Elemental analysis of feedstock, biocrude and upgraded biocrude from Spirulina, sewage sludge and wheat straw.
| Stream/Feedstock | Spirulina | Sewage Sludge | Wheat Straw | |||||||||
|---|---|---|---|---|---|---|---|---|---|---|---|---|
| C | H | N | O | C | H | N | O | C | H | N | O | |
| Feedstock model [wt%] | 55.1 | 7.1 | 13.5 | 23.8 | 54.2 | 7.3 | 3.7 | 34.2 | 48.3 | 6.5 | 0.8 | 44.4 |
| Feedstock experiment [wt%] [19] | 54.0 | 7.2 | 13.5 | 24.4 | 54.0 | 7.4 | 3.6 | 34.7 | 49.4 | 6.2 | 0.7 | 43.6 |
| Relative deviation [%] | 2.0 | 2.6 | 0.2 | 2.2 | 0.5 | 1.2 | 2.4 | 1.4 | 2.3 | 4.0 | 11.4 | 1.8 |
| Biocrude model [wt%] [45] | 77.6 | 9.5 | 5.7 | 7.3 | 76.5 | 8.9 | 3.0 | 11.6 | 78.0 | 6.2 | 1.5 | 14.3 |
| Biocrude experiment [wt%] [45] | 75.0 | 10.4 | 7.7 | 6.9 | 75.6 | 9.5 | 3.0 | 11.8 | 72.3 | 7.2 | 1.2 | 19.3 |
| Relative deviation [%] | 3.3 | 9.6 | 35.6 | 5.0 | 1.1 | 6.5 | 0.1 | 1.6 | 7.3 | 16.0 | 17.3 | 34.6 |
| Upgraded biocrude model [wt%] [45] | 85.4 | 13.7 | 0.8 | 0.1 | 86.2 | 13.0 | 0.7 | 0.1 | 90.2 | 9.3 | 0.4 | 0.1 |
| Upgraded biocrude experiment [wt%] [45] | 84.8 | 14.6 | 0.6 | 0.1 | 84.5 | 14.7 | 0.8 | 0.1 | 87.7 | 12.1 | 0.9 | 0.1 |
| Relative deviation [%] | 0.7 | 6.5 | 20.9 | 12.9 | 2.0 | 13.3 | 9.9 | 16.1 | 2.8 | 29.9 | 121.3 | 6.8 |
Table 5.
Chemical composition of upgraded biocrudes from Spirulina, sewage sludge and wheat straw.
| Feedstock | n-Paraffin [wt%] | i-Paraffin [wt%] | c-Paraffin [wt%] | Olefin [wt%] | Aromatic [wt%] | O-Containing [wt%] | N-O-Containing [wt%] | N-Containing [wt%] |
|---|---|---|---|---|---|---|---|---|
| Spirulina | 54.6 | 5.8 | 19.2 | 0.8 | 12.0 | 1.7 | 0.0 | 5.8 |
| Sewage sludge | 39.7 | 13.2 | 20.3 | 0.8 | 19.9 | 1.0 | 0.0 | 4.9 |
| Wheat straw | 18.1 | 6.7 | 13.7 | 0.3 | 57.3 | 0.1 | 0.1 | 3.6 |
Table 6.
Densities and higher heating values of biocrudes and upgraded biocrudes from this study and literature.
Table 6.
Densities and higher heating values of biocrudes and upgraded biocrudes from this study and literature.
| Feedstock | Literature Source | Biocrude Density [kgL−1] | Biocrude HHV [MJ/kg] | Upgraded Biocrude Density [kgL−1] | Upgraded Biocrude HHV [MJ/kg] |
|---|---|---|---|---|---|
| Spirulina | this study | 1.148 | 37.5 | 0.776 | 47.2 1 |
| Sewage sludge | this study | 1.273 | 36.2 | 0.818 | 46.6 1 |
| Wheat straw | this study | 1.707 | 33.0 | 1.213 | 43.1 1 |
| Microalgae | [54] | 0.97–1.04 | 29.8 | - | - |
| Sewage sludge | [5] | 0.98 | 39.5 | 0.79 | 48.5 2 |
| Sewage sludge | [5] | 0.99 | 38.0 | 0.81 | 47.8 2 |
| Forestry residues | [48] | 1.055 | 37.6 | 0.9659 | 41.4 |
| Woody biomass | [47] | 0.97 | 40.4 | 0.904 | 43.73 |
Table 7.
Distribution of the upgraded biocrude on the different fuel fractions gasoline, jet fuel, diesel and heavy fuel oil.
Table 7.
Distribution of the upgraded biocrude on the different fuel fractions gasoline, jet fuel, diesel and heavy fuel oil.
| Boiling Range | 27.8–193 °C | 193–271 °C | 271–321 °C | 321–425 °C | 425–564 °C | >564 °C |
|---|---|---|---|---|---|---|
| Feedstock | Gasoline [wt%] | Jet Fuel [wt%] | Light Diesel [wt%] | Heavy Diesel [wt%] | Vacuum Gas Oil [wt%] | Residue [wt%] |
| Spirulina | 35.1 | 20.0 | 25.8 | 12.9 | 4.6 | 1.6 |
| Sewage sludge | 20.5 | 23.9 | 31.5 | 16.9 | 2.9 | 4.3 |
| Wheat straw | 17.8 | 16.4 | 10.7 | 14.0 | 9.4 | 31.7 |
Publisher’s Note: MDPI stays neutral with regard to jurisdictional claims in published maps and institutional affiliations. |
© 2021 by the authors. Licensee MDPI, Basel, Switzerland. This article is an open access article distributed under the terms and conditions of the Creative Commons Attribution (CC BY) license (https://creativecommons.org/licenses/by/4.0/).
Share and Cite
MDPI and ACS Style
Moser, L.; Penke, C.; Batteiger, V. An In-Depth Process Model for Fuel Production via Hydrothermal Liquefaction and Catalytic Hydrotreating. Processes 2021, 9, 1172. https://doi.org/10.3390/pr9071172
AMA Style
Moser L, Penke C, Batteiger V. An In-Depth Process Model for Fuel Production via Hydrothermal Liquefaction and Catalytic Hydrotreating. Processes. 2021; 9(7):1172. https://doi.org/10.3390/pr9071172
Chicago/Turabian StyleMoser, Leonard, Christina Penke, and Valentin Batteiger. 2021. "An In-Depth Process Model for Fuel Production via Hydrothermal Liquefaction and Catalytic Hydrotreating" Processes 9, no. 7: 1172. https://doi.org/10.3390/pr9071172
Note that from the first issue of 2016, this journal uses article numbers instead of page numbers. See further details here.