Article

Hydrothermal Carbonization of Olive Tree Pruning as a Sustainable Way for Improving Biomass Energy Potential: Effect of Reaction Parameters on Fuel Properties

by
Judith González-Arias
1,
Marta Elena Sánchez
1,
Elia Judith Martínez
1,
Camila Covalski
2,
Ana Alonso-Simón
3,
Rubén González
1 and
Jorge Cara-Jiménez
1,*
1
Chemical and Environmental Bioprocess Engineering Group, Natural Resources Institute (IRENA), University of Leon, 24071 León, Spain
2
CIMO—Centro de Investigação de Montanha, Polytechnic Institute of Bragança, 5300-252 Bragança, Portugal
3
Plant Physiology Area, Faculty of Biological and Environmental Sciences, University of Leon, 24071 León, Spain
*
Author to whom correspondence should be addressed.
Processes 2020, 8(10), 1201; https://doi.org/10.3390/pr8101201
Submission received: 4 September 2020 / Revised: 17 September 2020 / Accepted: 19 September 2020 / Published: 23 September 2020

Abstract

:
Hydrothermal carbonization (HTC) allows the conversion of organic waste into a solid product called hydrochar with improved fuel properties. Olive tree pruning biomass (OTP), a very abundant residue in Mediterranean countries, was treated by HTC to obtain a solid fuel similar to coal that could be used in co-combustion processes. Three different reaction temperatures (220, 250, and 280 °C) and reaction times (3, 6, and 9 h) were selected. The hydrochars obtained were extensively analyzed to study their behavior as fuel (i.e., ultimate, proximate, fiber and thermogravimetric analysis, Fourier-transform infrared spectroscopy (FTIR), activation energy, and combustion performance). The concentrations of cellulose, hemicellulose, and lignin in the samples depict a clear and consistent trend with the chemical reactions carried out in this treatment. Regarding O/C and H/C ratios and HHV, the hydrochars generated at more severe conditions are similar to lignite coal, reaching values of HHV up to 29.6 MJ kg−1. The higher stability of the solid is reflected by the increase of the activation energy (≈60 kJ mol−1), and ignition temperatures close to 400 °C. With this, HTC is a proper thermal treatment for the management of raw OTP biomass and its further conversion into a solid biofuel.

Graphical Abstract

1. Introduction

Lignocellulosic biomass has a huge potential for the production of fuel, heat, and electrical power. This along with the need of alternative energy sources with less environmental impacts than fossil fuels, has caused its use to increase lately [1]. Biomass was usually utilized for direct combustion and co-combustion with low-rank coals as an easy way to benefit from the biomass energy [2]. However, direct combustion is less efficient due to some biomass inherent properties such as low carbon content and hygroscopic nature. High moisture and oxygen contents may cause higher heating values (HHV) be lower. Moreover, raw biomass is difficult to ignite and the combustion is incomplete and unstable, therefore some pretreatments may be carried out before its use as fuel [3,4]. Co-combustion of hydrochar with coal has been previously studied by Gao et al. paying attention to the improvement of thermal profiles of biomass/coal blends [5]. Yousaf et al. have proved that char/coal blends present a steady state combustion leading to an increase in combustion efficiency and an improvement in thermal characteristics in comparison to coal/biomass blends or the coal itself [6].
Approximately 3.3 × 10⁷ tons of olive tree pruning biomass (OTP) are produced all over the world, which shows its potential for energy recovery. The olive oil industry in Spain generates around 3.2 × 10⁶ tons of olive waste and 2 × 10⁶ of these tons correspond to OTP. The most common use of OTP is incineration which causes pollution, fire risks, or soil mineralization [4,7]. Its low bulk density, its dispersion over an extensive area, and the absence of knowledge about its kinetic process make this residue unsuitable when used as fuel in industrial applications. Consequently, burning or scattering on fields are the most common ways to eliminate these leftovers [8]. When selecting a thermal process, the moisture content of the sample is an important parameter. Spinelli et al. reported values up to 35% of moisture for the olive pruning [9], while in this work, the raw pruning presented contents of approximately 31%, which is a high value to take into account.
The conversion of biomass into other valuable products can be achieved by thermal technologies such as pyrolysis or gasification. However, these methods present drawbacks when the biomass presents a high content in moisture, making an additional drying step necessary, increasing the operating costs [3]. Technologies like pyrolysis, torrefaction, or gasification requires an initial moisture content of the feedstock lower than 10–15%, otherwise the energy needed to evaporate the excess moisture could make the process energetic and economically inviable [10]. Nevertheless, hydrothermal carbonization (HTC) can avoid these limitations and simulate the natural process of coalification, converting lignocellulosic biomasses into coal-like materials [11]. This thermochemical process can convert different types of biomass into solid, carbon-rich materials at low-temperatures compared to pyrolysis [12]. The abundant potential hydrochar applications, the easiness of implementation, and the versatility of the process to convert waste into fuel means that research on this process continues to be undertaken [13]. Apart from using hydrochar as solid fuel, it can be employed for carbon sequestration, soil remediation [14], water and nutrient retention in soils [15], as biomaterial for electrodes in electrolysis cells [16], or as a way to enhance the performance of anaerobic digesters, acting as an adsorbent of inhibitory compounds [17] in the same way that biochar has been used in recent times.
HTC is usually conducted at mild reaction temperatures (150–350 °C), autogenous pressure, and different reaction times ranging from some minutes to several hours depending on the use of the final product, with higher times required for energy purposes [18,19]. Among other treatments including biological and thermochemical, hydrothermal processing of organic wastes seems to be the most promising technology [20]. Comparison of HTC and low temperature pyrolysis of residual biomass has been previously studied concluding that hydrochar shows higher thermal efficiency and lower pollutant emissions along with lower activation energies for combustion [21]. To obtain a pyrolytic biochar with a similar ratio of energy densification and similar higher heating values as hydrochar, more severe conditions in pyrolysis are needed [22]. HTC of different waste biomasses including forestry and agricultural residues has been conducted with the aim of use hydrochar as solid biofuel [23,24]. As dewatering, dechlorination, denitrification, and coalification reactions take place during HTC, an important reduction in pollutant emissions in combustion can be achieved [25].
Hence, the objective of this research was to select the optimum temperature and time reaction parameters in the HTC of OTP to obtain a hydrochar similar to a lignite coal useful as fuel. Thermogravimetric analysis along with the chemical properties of the hydrochar allow to know the thermal behavior and kinetic parameters, which is essential to understand the combustion performance. Thus, this work aims to compare different reaction conditions in terms of energy use of the solid product, considering this process as an alternative to directly using raw biomass as solid fuel. Although previous works regarding HTC of biomass have been conducted, here the conversion of olive tree pruning biomass into a solid biofuel was evaluated. The novelty of the adjustment of two reaction parameters (time and temperature) was assessed looking for the better combination to obtain a proper product. Therefore, a solid biofuel similar to lignite coal (in terms of physicochemical properties, HHV, or combustion index, but with a better composition than a fossil coal) can be achieved from olive tree pruning biomass through HTC.

2. Materials and Methods

2.1. Materials and Sample Preparation

OTP was collected from “Biotherm Agroforestal S.L.” (Córdoba, Spain). The samples were received with a size range between 15 and 45 mm and were stored in plastic bags for further testing. Although initially the green olive pruning had a moisture greater than 30%, its value was reduced below 10% to facilitate its grinding before its chemical analysis. For the thermogravimetric analysis, the samples were ground and shaken for 3 min in a laboratory ball mill and subsequently syphoned through a 0.15 mm mesh to ensure representativeness avoiding heat or mass transfer limitations. For HTC experiments samples were not prior dried or milled.

2.2. Experimental Procedure

Nine tests were carried out in a 2000 mL stirred pressure reactor (APP Parr reactor, Parr instrument company, Moline, IL, USA) (Figure 1). This reactor can operate at conditions up to 350 °C and 130 bar. The temperature was measured using a type J thermocouple and pressure was measured with a manometer whose pressure range was from 0 to 100 bar. It was heated by an electrical heater while the reaction system was continuously stirred at a constant 250 rpm.
To evaluate the effect of reaction temperature and time, experiments were conducted at 220, 250, and 280 °C for 3, 6, and 9 h at a fixed biomass/water ratio of 1/20, which has been proved to be adequate for this purpose [26]. Although this parameter influences the other two variables, Sabio et al. observed that biomass/water ratio plays a secondary role during HTC reaction [27]. The hydrochars obtained were labelled as X_Y, where X is the reaction temperature (°C) and Y is the reaction time (h). Then, 50 g of feedstock was mixed with 1000 mL of deionized water. The reactor was fluxed with helium gas for 10 min to remove all oxygen. Helium was used instead of nitrogen because carrier gas in gas chromatography is helium, so in such a way we can observe the amount of nitrogen generated during HTC. Then, the outlet valve was closed until the partial pressure reached 2 bars. The reactor was heated at 5 °C min−1. Once the selected temperature was achieved, the process was maintained for the selected time, depending on each run. After that, the reactor was cooled down to room temperature. The gas produced during the process was collected for further analysis in 5-L sample bags using a release valve and the solid and liquid phases were separated by vacuum filtration. The solid phase was further washed with deionized water and acetone until the effluent was clear and then oven-dried for 24 h at 90 °C. The use of organic solvents for washing the hydrochar is important due to the formation of secondary char over the surface of the primary char containing furfural precipitates that can be eliminated by acetone wash then favoring pollutant reduction during combustion [28]. The aqueous part was placed into a bottle and stored in a cold room at 4 °C for further analysis.

2.3. Chemical Analysis of the Samples

The product yield was obtained as follows, the solid yield was calculated as the mass ratio between every hydrochar and raw biomass (both on a dry basis). Gas yield is the mass of gas produced per unit of raw biomass. The produced gas was measured with a syringe, the initial helium was subtracted, and the mass of the rest was calculated with the composition of the total gas, the molecular weight, and the density of every single gas at the exit conditions. Liquid yield was obtained by the difference.

2.3.1. Solid Phase

Proximate and ultimate analyses were performed to characterize both the feedstock and the resulting hydrochars. Proximate analyses were carried out according to ASTM 3302, UNE 3219, and UNE 32,004 for total moisture, volatile matter, and ashes, respectively. The ultimate analyses were performed using a LECO CHN-600 analyzer and following ASTM 5373 and by using a LECO SC-132 analyzer for determining the sulphur content according to ASTM 4239. The oxygen content was obtained by subtraction. The heating value was determined using a LECO AC-300 analyzer according to UNE 32006.
Fiber analysis was performed to determine the macrocomponents (hemicellulose, cellulose, lignin, and extractives) in biomass and corresponding hydrochars. It is explained in Appendix A.
The infrared spectra of raw biomass and hydrochar samples were recorded using a Thermo Scientific Nicolet iS5 FTIR (ID7 ATR (attenuated total reflectance) accessory, a monolithic diamond ATR crystal with high efficiency) spectrophotometer over the 4000–650 cm−1 range at a 0.5 cm s−1 rate. Sixteen scans were collected with 0.482 cm−1 spacing. The scans were averaged for each spectrum and corrected against atmospheric conditions as the background.

2.3.2. Gaseous and Liquid Phases Analysis

Gas composition was analyzed by using a gas chromatograph (Varian CP 3800 GC) equipped with a thermal conductivity detector. A 4 m column packed with HayeSepQ80/100 and followed by a 1 m molecular sieve column was used to separate CH4, CO2, N2, H2, and O2. The columns were operated at 331 kPa and 50 °C with helium as the carrier gas.
Total organic carbon (TOC) and total nitrogen (TN) contents in the liquid phase were measured using an Analytik Jena Multi N/C_3100 system by thermocatalytic oxidation. pH was also measured.

2.4. Determination of Combustion Indexes and Activation Energy

The solid samples were weighed in synthetic air using a TA instruments thermobalance (model SDT Q600, TA Instruments-Waters LLC, New Castle, DE, USA) for measuring the thermal behavior. Both the mass loss (TG) and differential mass loss (DTG) were recorded continuously from room temperature to 700 °C using a 15 °C min−1 heating rate, which is low enough to avoid large temperature gradients throughout the samples [29]. Each run was conducted in a crucible containing 5 ± 0.25 mg of hydrochar with an airflow of 100 cm3 min−1 when combustion experiments were conducted, and a nitrogen flow of 100 cm3 min−1 when pyrolysis was carried out. Temperature, mass loss, and differential mass loss were determined using the thermogravimetric curves obtained from the Universal Analysis 2000 (V4.5A software from TA Instruments-Waters LLC, New Castle, DE, USA).
As previously described by Li et al. [30] and explained in Appendix B, ignition and burnout temperatures (Ti and Tb) were obtained to determine the Ci index (Equation (1)). This index is used as a criterion for fuel combustion characteristics and it reflects the burning ability of a fuel, so a higher value reflects a more satisfactory combustion performance. The bigger the Ci index was, the more vigorously the samples burned and the faster the char burned out.
C i = R m a x × R m e d T i 2 T b
where Rmax is the maximum combustion rate, Rmed is the average mass loss rate calculated by taking the starting and ending at 1% of Rmax, and Ti and Tb are the ignition temperature and the burnout temperature, respectively.
As previously described [31,32] the following parameters were also taken into account to describe the products obtained from carbonization in terms of quality and to compare the samples. Mass yield (MY) was calculated following Equation (2) and shows the efficiency of the process when mass is considered.
M a s s   y i e l d   ( M Y % ) = M a s s   o f   d r i e d   h y d r o c h a r M a s s   o f   d r i e d   f e e d s t o c k × 100
The energy densification ratio (EDR) gives important information since the HHV of the product and the HHV of the feedstock are compared and it allows seeing the increase in the product heating value. EDR is calculated by using Equation (3).
E n e r g y   D e n s i f i c a t i o n   r a t i o   ( E D R ) = H H V   o f   d r i e d   h y d r o c h a r H H V   o f   d r i e d   f e e d s t o c k
In energy yield (EY), the mass loss during the carbonization and the energy densification are simultaneously taken into account, so it is possible to assess the improvement of the initial material. EY is calculated using Equation (4).
E n e r g y   y i e l d   ( E Y % ) = M Y ( % ) × E D R
The efficiency of the carbonization process was evaluated using the fixed carbon yield (FCY), where the mass yield of each run, the fixed carbon (FC) content, and the ash content of raw feedstock are related. Equation (5) shows how this parameter was calculated.
F i x e d   C a r b o n   y i e l d   ( F C Y % ) = M Y ( % ) × F i x e d   c a r b o n   o f   h y d r o c h a r   ( % ) 100 A s h   o f   f e e d s t o c k   ( % )
In addition, the apparent activation energy of the samples was calculated using thermogravimetric data. As described by Liu et al. [33], a first-order kinetic reaction is assumed, so the reaction equation is described by Equation (6).
d a d t = A e x p ( E R T ) ( 1 a )
where E is apparent activation energy, A is the pre-exponential factor, T and t are absolute temperature and time, respectively, R is the gas constant, and a is the mass loss, which is calculated using Equation (7).
a = m 0 m t m 0 m f
where m0 is the initial mass of the sample and mt and mf are the mass at time t and at the final temperature, respectively.
Bearing in mind that there is only one heating rate, which is named β = dT⁄dt, Equation (6) can be rearranged as follows:
ln [ ln ( 1 a ) T 2 ] = ln [ A R β E ( 1 2 R T E ) ] E R T
As HTC follows a first-order reaction mechanism, the plot of ln[−ln(1 − a)/T2] vs. 1/T represents a straight line. The apparent activation energy can be calculated from the slope of this plot, E/R.

2.5. Severity of the Process. Severity Factor
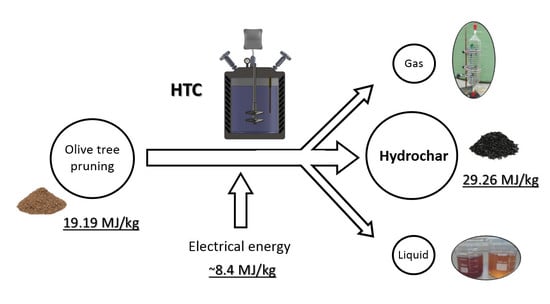
Hydrothermal severity was used to understand the effect of reaction temperature and time in the conversion of biomass. As described by Wang et al., hydrothermal severity, R, is a function of the later effect, following Equation (9) [14].
R = t × e x p [ ( T 100 ) / 14.75 ]
The logarithm of this value was used to facilitate the view and the representation of the data.

3. Results

3.1. Product Yield

The product yield (i.e., solid, liquid, and gaseous phases) obtained during HTC depending on the reaction conditions is depicted in Figure 2. The product distribution is highly dependent on the severity factor of the process. Generally, more severe conditions (higher reaction temperatures and times) lead to lower solid yields, while the liquid phase gets more important. At temperatures higher than 280 °C, the liquid yield would be important because reaction conditions are closer to those of hydrothermal liquefaction [34].

Solid Phase

Figure 3 shows the solid yield along with the severity factor for every test against the reaction time and temperature. The severity factor increases following a straight line when the reaction parameters are higher as can be seen. The main trend indicates that as severity factor increases, the solid yield becomes lower. This fact does not apply to the tests conducted at 9 h of reaction time, where an increase in solid yield is produced. Higher reaction temperatures lead to lower mass yields. For example, 3-h tests resulted in mass yields of 47.7% and 24.4% at 220 and 250 °C, respectively. Here, the solid yield was almost reduced by half, while at 280 °C the solid yield was 21.6%. This indicates that the reduction from 250 to 280 °C at the same reaction time is much lower than the one from 220 to 250 °C. This decrease in solid yield could be attributed either to a higher primary decomposition of the OTP at high temperatures or to a secondary decomposition of the solid residue [35], although other authors indicate that it could be due to cellulose and hemicellulose hydrolysis and degradation [14]. These results are similar to those obtained for pyrolysis [36]. In torrefaction experiments of olive pruning conducted at similar reaction temperatures, higher mass yields were obtained, however, the lower the heating values obtained, makes HTC more suitable for this waste [4].
At the same reaction temperature, a decrease in the mass yield from 3 to 6 h is first seen, followed by a slight increase from 6 to 9 h. This trend is more pronounced at higher temperatures (250 and 280 °C). This behavior may be because part of the biomass biopolymers dissolve in the liquid fraction and then further react to generate other solid products with increasing reaction times at temperatures higher than 250 °C [37], leading to the formation of secondary char as it has been previously explained by Volpe et al. [38].

3.2. Liquid and Gas Phases Characterization

Although the main objective of this research is focused on the solid phase, liquid and gaseous phases were analyzed as well and the main parameters are exhibited in Table 1. Water plays an important role during HTC, because it acts as solvent, catalyst, reactant, and product, meaning that a large accumulation of dissolved substances occurs in this phase [39].
As it can be seen in Table 1, the pH values of the liquid phase ranged between 3.4 and 3.9 due to the formation of acidic compounds such as acetic, levulinic, formic, and lactic acids, which have a great influence on the characteristics and properties of the products [40]. Additionally, acidic conditions catalyze the process, making it easier to hydrolyze cellulose in the raw biomass [41]. TOC in the aqueous products indicates the proportion of organic products that are water-soluble, including organic acids, sugars, and fatty acids; however, quantifying these products is beyond the scope of this work. TOC values for every test were similar, so a clear trend was not identified. The same trend occurs with TN, which behaves in a different way with temperature [18]. As was found by De la Rubia et al., this phase is mainly composed of sugars, acids, and furfurals, which is in agreement with its use as a cosubstrate in anaerobic digestion [42].
Regarding the gas phase, it is mainly composed of CO2 (approximately 90%) and CO, with traces of gases such as N2, CH4, H2O, or H2. The high carbon content in the gaseous phase is mainly due to biomass decarboxylation reactions. As shown in Table 1, CO2 is almost constant, varying from 87.6% to 92.9%, which indicates that this gas it is not useful as a fuel itself.

3.3. Chemical Analysis and Higher Heating Value of the Solid Phase

To characterize every obtained hydrochar along with the raw biomass, the ultimate and proximate analyses, and the higher heating values (HHV) were carried out. The results are depicted in Table 2.
When the severity factor increases, VM content decreases from 85.87% to 40.43% corresponding to OTP and the most severe treatment (280_9), respectively. These values are in agreement with other works [12,43]. This decrease in VM implies an increase in FC of the solid phase as the severity increases. The enhancement of FC from 12.24% (feedstock) to 57.63% (280_9 hydrochar) is basically due to dehydration and decarboxylation reactions in the process, and this is related to the enhancement in HHV and energy densification in the hydrochar [44]. As far as ash content is concerned, there is not a clear trend in the tests, with values between 1.9% and 3.5%, since part of the initial mineral matter in the feedstock was dissolved into the process water. In addition, the low ash content was an interesting point as this avoids operating problems with the fuel during combustion.
The ultimate analysis showed similar results to other lignocellulosic wastes, such as poplar wood, hazelnut shell, olive stone, or coffee husk [31,43,45]. OTP was mainly composed of carbon and oxygen, with a low nitrogen content and a negligible sulphur content. It is important to highlight that high values of carbon and hydrogen are desirable while sulphur content should be minimal so that fouling problems during combustion in boilers can be avoided. As was expected, after HTC, the combustion properties were enhanced since carbon and FC contents increased while oxygen content drastically decreased due to dehydration and decarboxylation reactions when reaction temperature increases [44].
HHV tended to increase until the 250_6 run, after that point, the trend remained almost constant because it was highly influenced by the increase in FC content. Once 250 °C was exceeded, the effect of reaction time on this factor is not important since further HHV improvements were almost negligible. The maximum HHV was 29.6 MJ kg−1, corresponding to the 280_9 test, showing an increase of 35% compared to the raw biomass (19.2 MJ kg−1), similar to other findings [21].
Figure 4 shows a Van Krevelen diagram where H/C ratios against O/C ratios for feedstock and hydrochars are depicted.
The H/C and O/C atomic ratios in the Van Krevelen diagram were calculated using the elemental composition obtained in the ultimate analysis. These ratios are a sign of the carbonization degree depending on the severity factor of the HTC. The H/C ratio decreased from 1.17 to 0.78, from the least to the most severe treatment, while the O/C ratio went from 0.67 to 0.24. Similar results were obtained by other authors [14]. Generally, the lower the H/C and O/C ratios are, the better the combustion characteristics. It is noteworthy that hydrochars produced at higher temperatures present better H/C and O/C ratios, which indicates better fuel qualities. A decrease in these atomic ratios shows an increase of high energy bonds, C-C, and a decrease of low energy bonds, H-C and O-C, which lead to an improvement in HHV [1]. This fact could be explained by the reactions that take place in HTC; dehydration reactions eliminate the hydroxyl groups, while decarboxylation reactions eliminate the carboxyl and carbonyl groups [41]. In the Van Krevelen diagram, dehydration follows a pathway that reduces both H/C and O/C ratios from top right to bottom left and decarboxylation moves from bottom right to top left, which means that the O/C ratio is reduced while the H/C ratio is increased. The importance of dehydration in HTC is clear when observing the hydrochars obtained above 250 °C, which shift to the left part. These hydrochars show fuel characteristics similar to those of lignite [46].

3.4. Thermogravimetric and Fiber Analysis

Concentrations of the cellulose, hemicellulose, and lignin in the feedstock and hydrochars are shown in Figure 5. For a better understanding, the columns are grouped by reaction time. The fact that hydrochars have a different reference basis must be highlighted, which means that lignin content does not increase with the treatment but as cellulose and hemicellulose have been degraded and most of the mineral matter has been diluted into the process water, the main component turns out to be lignin, which is not easily degraded during HTC.
The proportion of cellulose, hemicellulose, and lignin is relevant when observing their effect in HHV. Kim et al. showed in their work the HHV values corresponding to lignin, hemicellulose, and cellulose separately, indicating that lignin had the highest HHV; consequently, when the proportion of lignin increases against cellulose and hemicellulose, energy densification enhances and HHV improves [47].
Cellulose, hemicellulose, and lignin show specific DTG profiles. Cellulose usually decomposes in a narrow range of temperatures, between 280 and 360 °C, showing the fastest decomposition peak at 339 °C. Hemicellulose decomposes with two different peaks, one of them at 246 °C and the other at 295 °C, over a range between 200 and 320 °C. Finally, lignin decomposes over a larger range (140–600 °C) with a low-intensity peak at 380 °C [48]. Regarding these peaks, these compounds could be identified in DTG curves of lignocellulosic biomasses, and their relative intensities can be related to global amounts of cellulose, hemicellulose, and lignin [48]. Although TGA could be a method to obtain these concentrations, here, cellulose, hemicellulose, and lignin concentrations were obtained following the methodology described in Section 2.3.1 and explained in Appendix A. In this case, TGA was used to verify these results, however, new methodologies based on hyperspectral imaging could also be useful in the quantitative determination of polysaccharides in biomass and hydrochars according to the work of Mäkelä et al. [49].
Figure 6 shows the specific DTG profiles in an inert atmosphere for OTP and obtained hydrochars at the different reaction times. As shown in Figure 6a, the raw material presents a weight loss of about 50% between 170 and 380 °C, corresponding mainly to the decomposition of cellulose and hemicellulose. For 220_3 hydrochar, the main peak shifts to the right and is more pronounced, which shows that the cellulose concentration is high, and the hemicellulose concentration has decreased. In contrast, the curves at for 250 and 280 °C hydrochars show a single peak between 300 and 500 °C, which could be explained by the high concentration of lignin in these hydrochars, according to what was shown previously (Figure 5). In these two cases, both the cellulose and the hemicellulose have been degraded almost completely, so lignin remains as the main component.
Hydrochars obtained from 6 h reaction times (Figure 6b) exhibit a similar trend. At 220 °C, the hydrochar shows a higher concentration in cellulose, so its curve represents the main peak between 280 and 400 °C, corresponding to cellulose degradation. However, in this case, this peak is smaller than the one for a 3 h reaction time, which agrees with the lower concentration of cellulose in this sample (Figure 5). Most of the lignin concentration is represented by the shoulder that follows this peak. At higher reaction temperatures, the main peak displayed is mainly due to lignin in these samples.
Figure 6c displays the DTG profiles of the samples corresponding to the 9 h reaction time. These curves follow a similar trend to the previous ones (Figure 6a,b). When the reaction temperature is lower, the main peak is due to cellulose concentration; however, for hydrochars obtained at higher reaction temperatures, this peak shifts to the right due to lignin concentration increase.

3.5. Combustion Behavior. Combustion Indexes and Activation Energy

In Table 3, combustion indexes and kinetic parameters for every hydrochar and the raw OTP are depicted. Combustion indexes and activation energies were calculated based on the thermogravimetric information, the ultimate analysis, the HHV, and the mass yields of the process.
EDR tends to increase with the severity of the process as a consequence of the HHV increase (Table 3). The energy densification produced by HTC can be used to calculate the effectiveness of the process. Danso-Boateng et al. suggested that the energy densification of the hydrochars is caused by the solid mass decrease due to dehydration and decarboxylation reactions [44]. The increase of the EDR values from 1.15 to 1.54 shows that the most severe treatment leads to higher energy densification. However, this parameter does not indicate that the EY is the best for the most severe treatment but quite the opposite. Relating the EDR parameter with the mass yield, the trend is reversed (Figure 3). The highest EY (47.7%) corresponds to the least severe treatment (220_3) due to the higher mass yield (40%) and the most severe treatment (280_9) shows an EY of 31.9% since its mass yield is 20%. The EY trend follows the same shape as the yield curve; that is, for tests at the same reaction time, the EY is higher at the lowest temperature and similar at the other two temperatures. Based on these results, EY is an important parameter to evaluate the effect on solid fuel production, since it gives information about the efficiency of the treatment and energy recovery in the solid.
FCY represents the efficiency achieved in the conversion (in this case through HTC) of an organic matter to a relatively pure bio-coal [50]. For the three reaction temperatures tested, the FCY values increase slightly with the increase in reaction time. However, there is not much difference between the values because the increase in the FC percentage that occurs with the increase in the process severity is compensated by the decrease in mass yield in calculating this parameter. In this way, the values of FCY remain in a similar range, around 11% with the exception of the least severe test (220_3), which despite having the highest solid yield (40%), has an FC content well below the rest (20%).
Ti, which determines how easily a given fuel is ignited, was also considered. As shown in Table 3, at the same reaction time, Ti tends to increase as the HTC reaction temperature increases. Regardless of the reaction time, the values obtained at 220 and 250 °C show great differences, while between 250 and 280 °C, the difference in Ti is minimal. For example, for the 6 h reaction time, Ti was 296 °C (220_6), 403 °C (250_6), and 413 °C (280_6). The first two parameters have a difference of more than 100 °C, while between 250 and 280 °C there is only a 10 °C difference. The increase of Ti with the severity of the process is very related to the content in VM, since Ti is higher as the VM percentage decreases, therefore reducing the ease of ignition of the hydrochar [51]. Although a lower value of Ti leads to easier combustion, a higher Ti could reduce the risk of fire explosion, allowing the use of hydrochar as a safer solid fuel.
Ci reflects the characteristics of the sample during combustion. Combustion performance would be better when this index is higher. Except for the reaction temperature of 220 °C, in the other two temperatures, Ci increases as the reaction time increases. The reason for this behavior is that the combustion takes place over a longer time and the temperature at which the maximum rate of weight loss occurs shifts towards lower temperatures when the reaction time increases so that the burnout temperature is getting lower. At higher HTC reaction temperatures, the devolatilization peaks (Figure 6) shift to higher temperatures due to the higher concentration of lignin in the hydrochars, which indicates that combustion starts later and requires higher temperatures. In the case of the 220 °C hydrochars, the Ci index decreases as the reaction time increases; this can be explained because, in these samples, the cellulose and hemicellulose contents are still high, so the value of maximum devolatilization is much greater than in the others. In the same way, the temperatures at which the combustion ends are greater due to the different sample compositions (cellulose-hemicellulose-lignin) shown in Figure 5. This causes the combustion to lengthen in time, which can be seen in the existence of two peaks in the thermogravimetric profiles. For the other two reaction temperatures, the trend is reversed, increasing the value of this index as the HTC reaction time increases.
Taking all of this into consideration, it is possible to relate the activation energy value for each sample to the exposed combustion parameters. Figure 7 shows the thermogravimetric profiles in an air atmosphere for the three reaction temperatures of the feedstock and the different hydrochars. For the hydrochars obtained at a lower severity factor, two different devolatilization peaks appear; therefore, the apparent activation energy was calculated for both stages. Since cellulose and hemicellulose are still present in the hydrochars obtained at 220 °C, only these have two different peaks. The first peak is mainly due to the combination of cellulose and hemicellulose, and the second one is associated with lignin [33].
For the tests conducted at the reaction temperature of 220 °C (Figure 7a), in the first peak, the activation energy decreases as the reaction time increases. However, in the second stage, it is the other way around, so the activation energy for this part increases with reaction time. Comparing these energies with those needed for OTP, they are much higher (94 vs. 21 kJ mol−1), indicating that this fuel is more thermally stable. In the case of hydrochars obtained at 250 °C, the main peak shifts to higher temperatures due to the decomposition of cellulose and hemicellulose during the thermal process. This causes the calculated activation energies here to be represented in the second column of the Table 3, referring above all to the lignin content. As seen in the profiles in Figure 7b, the highest peak occurs in the hydrochar obtained after 6 h of reaction, coinciding, therefore, with the maximum activation energy of this group (62.24 kJ mol−1) and for the one obtained after 3 h of reaction, the peak is the lowest, so the activation energy will also be the lowest (49.81 kJ mol−1). For the group of hydrocarbons obtained at 280 °C (Figure 7c), the trend is similar, with a maximum value of 56.18 kJ mol−1 for 6 h of reaction and a minimum value of 43.88 kJ mol−1 for 3 h, coinciding with the maximum and minimum peaks, respectively. It should also be highlighted that as the peaks shift to higher temperatures, the required activation energies also increase. Similar values were identified by Yang et al. [52] and by Saquib et al. [53] considering bamboo and food waste hydrochars, respectively. Lower values of activation energies for hydrochar combustion ranging from 25 to 46 kJ/mol were obtained by Sharma et al. at lower HTC reaction temperatures [54].
In the combustion profiles (Figure 7), between 200 and 350 °C, the OTP sample shows peaks for cellulose and hemicellulose, similar to what occurs in other biomasses [55]. Overall, the combustion profiles for hydrochar samples at 250 and 280 °C (Figure 7b,c) exhibit similar behavior, while at 220 °C (Figure 7a) the combustion profile is transitional, between the original biomass and the hydrochars obtained at higher reaction temperatures. Shafie et al. stated that after HTC, the first peaks in the TG profiles are lower due to the decomposition of cellulose and hemicellulose during HTC reaction, indicating the formation of new compounds with higher thermal stability [32], which is in accordance with the results obtained here. For the profile at the 220 °C reaction temperature, the peak between 220 and 350 °C decreases as the reaction time increases, as a consequence of the reduction in the volatile content. Regarding the second peak, between 400 and 550 °C, it is associated with the concentration of lignin and the FC content (Table 2); in this way, as the reaction time increases, so does the FC content, and consequently, the maximum height of this peak is greater [51,56].
For the temperature profile of 250 °C (Figure 7b), compared to 220 °C, the first peak related to the combustion of volatile matter, shifts to higher temperatures starting at 250 °C, and the peak heights are very low and similar for the three reaction times. This behavior is also related to the cellulose concentration of these hydrochars (Figure 5), which is very small or insignificant. This first peak is similar for the three reaction times due to the similarity in the VM content, which is between 48.9% (250_3) and 45.5% (250_9). Regarding the second peak, if we compare it with the combustion profile of 220 °C, the maximum weight loss occurs at lower temperatures, and the peak heights are much higher; this is explained by the increase in the FC concentration, this being greater as the HTC severity increases. For the case of hydrochars obtained at 280 °C (Figure 7c), the shape of the combustion profiles is very similar to those shown in Figure 7b, with the second peak appearing between the same temperatures and decreasing as the reaction time decreases. In both cases, a shoulder is seen after the fall of the second peak, which could be related to the combustion of residual products in the hydrochar, which need higher temperatures for being released during combustion.

3.6. FTIR Analysis

Fourier transform infrared spectroscopy (ATR-FTIR) was conducted to assess the changes in the chemical structure of the hydrochars produced using HTC by observing the evolution of functional groups in hydrochars from different reaction conditions. Figure 8 reports the different FTIR spectra for each sample. According to Volpe et al. [57], there are regions corresponding to the reactions that take place when a carbonization process is carried out.
Figure 8a shows the FTIR spectra of hydrochars produce at 220 °C along with the raw OTP sample. These spectra can be analyzed by separating them into different zones. The first one, between 3600 and 3000 cm−1, shows the existence of free and intermolecular bonded hydroxyl groups. This suggests that dehydration and decarboxylation reactions during HTC treatment are indicated by the less intense bands. These bands correspond to the stretching vibration of –OH. This is consistent with the evolution of the O/C and H/C ratios exposed in the Van Krevelen diagram (Figure 4). The section between 3000 and 2800 cm−1 is related to aliphatic C-H bond stretching vibrations. These peaks suggest the presence of aliphatic and hydroaromatic structures in methyl, methylene, and methyne groups [57,58]. The bands at around 2300–2350 cm−1 correspond to the stretching vibrations of CO. The next section with peaks between 1800 and 1650 cm−1 is attributable to the C=O stretching vibration of esters, carboxyl acids, or aldehydes from cellulose or lignin. These bonds are present in ketones, aldehydes, quinone, esters, and carboxylic acid functional groups. For 220 °C reaction temperature hydrochars, the absorbance intensity of these peaks weakened with increasing reaction temperature and time and almost disappeared at more severe conditions, indicating the promotion of decarboxylation reactions [59]. The section with peaks between 1650 and 1500 cm−1 shows the C=C vibrations of the aromatic rings commonly found in lignin, or aliphatic and/or unsaturated aromatic compounds. The spectra at higher temperatures indicate more differences compared with the original sample, which could be due to the increase of aromatic structures after the HTC treatment [60]. The peaks between 1450 and 1200 cm−1 correspond to the bending vibration of the C-H bond of aliphatic carbons, methylene, and methyl groups, indicating the presence of aliphatic structures preserved during HTC. These aliphatic chains of CH2 and CH3 are typical of the basic structure of lignocellulosic materials [58,60]. The zone of C-O stretching vibration is represented between 1200 and 1000 cm−1. This corresponds to the existence of esters, phenols, and aliphatic alcohols, and the weakness of these peaks in hydrochars indicates that dehydration and decarboxylation reactions took place in HTC. It is interesting to take the peak at around 1160 cm−1, which is characteristic of COC vibrations, into consideration, indicating the decrease in the cellulose and hemicellulose components when reaction conditions are more severe, proving the decomposition of these compounds [47]. For the other reaction temperatures, the zones are the same with different intensity.

4. Conclusions

On this basis, we conclude that HTC is a proper treatment for the management of raw OTP since a predrying step is not necessary, being as well a good way to homogenize different biomasses. The study of hydrochar production from OTP via HTC under different reaction temperature and time conditions led to the conclusion that the less severe the treatment was, the less carbon conversion existed, making this solid less attractive for its use as a fuel. The results show that higher reaction temperatures and longer times significantly increased the HHV, reaching values of almost 30 MJ kg−1, although this increase was lower for reaction temperatures greater than 250 °C. The hydrochars produced at a reaction temperature of 250 °C have minimal amounts of cellulose and hemicellulose due to the nearly complete hydrolysis of these components, with lignin being the largest percentage. All the hydrochars produced at 250 °C have properties very similar to those of lignite or sub-bituminous coal. Although the behavior of the hydrochars as fuel is better at more severe reaction conditions, this improvement is more moderate for reaction temperatures above 250 °C. Higher reaction temperatures led to lower solid yield, for this, it can be said that temperatures higher than 250 °C are not useful for obtaining a biofuel, since the better properties do not compensate the energy used in its production. This can also be said for reaction times higher than 3 h.

Author Contributions

Conceptualization, J.G.-A., J.C.-J. and M.E.S.; methodology, J.G.-A. and A.A.-S.; validation, J.G.-A., E.J.M., R.G. and M.E.S.; formal analysis, J.G.-A.; investigation, J.G.-A., C.C.; resources, A.A.-S.; data curation, J.G.-A., C.C.; writing—original draft preparation, J.G.-A., E.J.M.; writing—review and editing, J.G.-A., R.G., M.E.S, J.C.-J. and A.A.-S.; visualization, E.J.M. and J.C.-J.; supervision, E.J.M., J.C.-J. and M.E.S.; project administration, J.C.-J., M.E.S.; funding acquisition, J.C.-J. All authors have read and agreed to the published version of the manuscript.

Funding

This research received no external funding.

Acknowledgments

Judith González-Arias would like to thank the Junta de Castilla y León (Consejería de Educación) fellowship, Orden EDU/1100/2017, cofinanced by the European Social Fund.

Conflicts of Interest

The authors declare no conflict of interest.

Appendix A

Samples were extracted in 70% aqueous acetone at a 1/20 g mL−1 solid/solvent ratio and room temperature for 180 min. The extracted samples were oven-dried at 50 °C and weighed until a constant weight was achieved [61]. To determine the amount of hemicellulose, 0.5 mol L−1 of sodium hydroxide was added to extractive free dried samples at a 1/20 g mL−1 solid/solvent ratio at 80 °C for 3.5 h. Samples were washed with distilled water (3×) and then oven-dried at 50 °C and weighed until a constant weight was achieved [62]. Cellulose was quantified in control and treated samples using the Updegraff method [63], the hydrolytic conditions described by Saeman [64], and quantifying the glucose released by the Anthrone method [65]. Lignin was quantified using the Klason method with minor modifications [66]. Samples were hydrolyzed with 72% H2SO4 (25 mL mg−1) for 1 h at 30 °C. The solution was diluted to 2.5% H2SO4 with distilled water and further treated at 121 °C for 1 h. The residues were filtered through Whatman glass microfiber filters, washed with distilled water, dried, and weighed [67].

Appendix B

As can be seen in Figure A1, the ignition temperature (Ti) was determined as follows. First, a vertical line was traced through the DTG peak point (A) to intersect the TG line at point B. Second, a line tangent to the TG curve at point B was drawn to get point C, which is the intersection between this tangent line and the extended TG initial level line. Through this point C, another line was made downwards to meet the axis at point D. This temperature is defined as the ignition temperature (Ti) and it is used to determine the combustion index (Ci), which is described by Equation (1) in the text.
Tb is the burnout temperature or final temperature at which the combustion has ended, and it is obtained from Figure A1 as follows. The tangent line at point B is lengthened to meet the extended TG final level at point E. The temperature corresponding to this point is Tb.
Figure A1. Determination of combustion indexes using the thermogravimetric profiles.
Processes 08 01201 g0a1

References

  1. Liu, Z.; Quek, A.; Kent Hoekman, S.; Balasubramanian, R. Production of solid biochar fuel from waste biomass by hydrothermal carbonization. Fuel 2013, 103, 943–949. [Google Scholar] [CrossRef]
  2. Gani, A.; Morishita, K.; Nishikawa, K.; Naruse, I. Characteristics of Co-combustion of Low-Rank Coal with Biomass. Energy Fuels 2005, 19, 1652–1659. [Google Scholar] [CrossRef]
  3. Zhao, P.; Shen, Y.; Ge, S.; Chen, Z.; Yoshikawa, K. Clean solid biofuel production from high moisture content waste biomass employing hydrothermal treatment. Appl. Energy 2014, 131, 345–367. [Google Scholar] [CrossRef] [Green Version]
  4. Martín-Lara, M.A.; Ronda, A.; Zamora, M.C.; Calero, M. Torrefaction of olive tree pruning: Effect of operating conditions on solid product properties. Fuel 2017, 202, 109–117. [Google Scholar] [CrossRef]
  5. Gao, L.; Volpe, M.; Lucian, M.; Fiori, L.; Goldfarb, J.L. Does hydrothermal carbonization as a biomass pretreatment reduce fuel segregation of coal-biomass blends during oxidation? Energy Convers. Manag. 2019, 181, 93–104. [Google Scholar] [CrossRef]
  6. Yousaf, B.; Liu, G.; Abbas, Q.; Wang, R.; Ubaid Ali, M.; Ullah, H.; Liu, R.; Zhou, C. Systematic investigation on combustion characteristics and emission-reduction mechanism of potentially toxic elements in biomass- and biochar-coal co-combustion systems. Appl. Energy 2017, 208, 142–157. [Google Scholar] [CrossRef]
  7. Cuevas, M.; Martínez-Cartas, M.L.; Pérez-Villarejo, L.; Hernández, L.; García-Martín, J.F.; Sánchez, S. Drying kinetics and effective water diffusivities in olive stone and olive-tree pruning. Renew. Energy 2018, 132, 911–920. [Google Scholar] [CrossRef]
  8. Pérez, A.; Martín-Lara, M.A.; Gálvez-Pérez, A.; Calero, M.; Ronda, A. Kinetic analysis of pyrolysis and combustion of the olive tree pruning by chemical fractionation. Bioresour. Technol. 2018, 249, 557–566. [Google Scholar] [CrossRef]
  9. Spinelli, R.; Picchi, G. Industrial harvesting of olive tree pruning residue for energy biomass. Bioresour. Technol. 2010, 101, 730–735. [Google Scholar] [CrossRef]
  10. Basu, P. Biomass Gasification, Pyrolysis and Torrefaction: Practical Design and Theory; Elsevier: Amsterdam, The Netherlands, 2018; ISBN 9780128129920. [Google Scholar]
  11. Khan, T.A.; Saud, A.S.; Jamari, S.S.; Rahim, M.H.A.; Park, J.W.; Kim, H.J. Hydrothermal carbonization of lignocellulosic biomass for carbon rich material preparation: A review. Biomass Bioenergy 2019, 130, 105384. [Google Scholar] [CrossRef]
  12. Liu, F.; Yu, R.; Ji, X.; Guo, M. Hydrothermal carbonization of holocellulose into hydrochar: Structural, chemical characteristics, and combustion behavior. Bioresour. Technol. 2018, 263, 508–516. [Google Scholar] [CrossRef] [PubMed]
  13. Gallifuoco, A.; Taglieri, L.; Papa, A.A. Hydrothermal carbonization of waste biomass to fuel: A novel technique for analyzing experimental data. Renew. Energy 2020, 149, 1254–1260. [Google Scholar] [CrossRef]
  14. Wang, T.; Zhai, Y.; Zhu, Y.; Li, C.; Zeng, G. A review of the hydrothermal carbonization of biomass waste for hydrochar formation: Process conditions, fundamentals, and physicochemical properties. Renew. Sustain. Energy Rev. 2018, 90, 223–247. [Google Scholar] [CrossRef]
  15. Abel, S.; Peters, A.; Trinks, S.; Schonsky, H.; Facklam, M.; Wessolek, G. Impact of biochar and hydrochar addition on water retention and water repellency of sandy soil. Geoderma 2013, 202–203, 183–191. [Google Scholar] [CrossRef]
  16. Arenas, C.; Sotres, A.; Alonso, R.M.; González-Arias, J.; Morán, A.; Gómez, X. Pyrolysed almond shells used as electrodes in microbial electrolysis cell. Biomass Convers. Biomass Convers. Biorefin. 2020, 1–9. [Google Scholar] [CrossRef]
  17. González, J.; Sánchez, M.; Gómez, X. Enhancing Anaerobic Digestion: The Effect of Carbon Conductive Materials. C J. Carbon Res. 2018, 4, 59. [Google Scholar] [CrossRef] [Green Version]
  18. Toufiq Reza, M.; Freitas, A.; Yang, X.; Hiibel, S.; Lin, H.; Coronella, C.J. Hydrothermal carbonization (HTC) of cow manure: Carbon and nitrogen distributions in HTC products. Environ. Prog. Sustain. Energy 2016, 35, 1002–1011. [Google Scholar] [CrossRef]
  19. Donar, Y.O.; Çaǧlar, E.; Sinaǧ, A. Preparation and characterization of agricultural waste biomass based hydrochars. Fuel 2016, 183, 366–372. [Google Scholar] [CrossRef]
  20. Munir, M.T.; Mansouri, S.S.; Udugama, I.A.; Baroutian, S.; Gernaey, K.V.; Young, B.R. Resource recovery from organic solid waste using hydrothermal processing: Opportunities and challenges. Renew. Sustain. Energy Rev. 2018, 96, 64–75. [Google Scholar] [CrossRef]
  21. Liu, Z.; Balasubramanian, R. Upgrading of waste biomass by hydrothermal carbonization (HTC) and low temperature pyrolysis (LTP): A comparative evaluation. Appl. Energy 2014, 114, 857–864. [Google Scholar] [CrossRef]
  22. Volpe, M.; Fiori, L.; Volpe, R.; Messineo, A. Upgrading of Olive Tree Trimmings Residue as Biofuel by Hydrothermal Carbonization and Torrefaction: A Comparative Study. In Chemical Engineering Transactions; The Italian Association of Chemical Engineering: Milano, Italy, 2016; Volume 50. [Google Scholar]
  23. Monedero, E.; Lapuerta, M.; Pazo, A.; Díaz-Robles, L.A.; Pino-Cortés, E.; Campos, V.; Vallejo, F.; Cubillos, F.; Gómez, J. Effect of hydrothermal carbonization on the properties, devolatilization, and combustion kinetics of Chilean biomass residues. Biomass Bioenergy 2019, 130, 105387. [Google Scholar] [CrossRef]
  24. Reza, M.T.; Uddin, M.H.; Lynam, J.G.; Hoekman, S.K.; Coronella, C.J. Hydrothermal carbonization of loblolly pine: Reaction chemistry and water balance. Biomass Convers. Biorefin. 2014, 4, 311–321. [Google Scholar] [CrossRef]
  25. He, C.; Tang, C.; Li, C.; Yuan, J.; Tran, K.Q.; Bach, Q.V.; Qiu, R.; Yang, Y. Wet torrefaction of biomass for high quality solid fuel production: A review. Renew. Sustain. Energy Rev. 2018, 91, 259–271. [Google Scholar] [CrossRef]
  26. Román, S.; Nabais, J.M.V.; Laginhas, C.; Ledesma, B.; González, J.F. Hydrothermal carbonization as an effective way of densifying the energy content of biomass. Fuel Process. Technol. 2012, 103, 78–83. [Google Scholar] [CrossRef]
  27. Sabio, E.; Álvarez-Murillo, A.; Román, S.; Ledesma, B. Conversion of tomato-peel waste into solid fuel by hydrothermal carbonization: Influence of the processing variables. Waste Manag. 2016, 47, 122–132. [Google Scholar] [CrossRef] [PubMed]
  28. Lucian, M.; Volpe, M.; Gao, L.; Piro, G.; Goldfarb, J.L.; Fiori, L. Impact of hydrothermal carbonization conditions on the formation of hydrochars and secondary chars from the organic fraction of municipal solid waste. Fuel 2018, 233, 257–268. [Google Scholar] [CrossRef]
  29. López, R.; Fernández, C.; Cara, J.; Martínez, O.; Sánchez, M.E. Differences between combustion and oxy-combustion of corn and corn-rape blend using thermogravimetric analysis. Fuel Process. Technol. 2014, 128, 376–387. [Google Scholar] [CrossRef]
  30. Li, X.G.; Ma, B.G.; Xu, L.; Hu, Z.W.; Wang, X.G. Thermogravimetric analysis of the co-combustion of the blends with high ash coal and waste tyres. Thermochim. Acta 2006, 441, 79–83. [Google Scholar] [CrossRef]
  31. Jayaraman, K.; Kok, M.V.; Gokalp, I. Thermogravimetric and mass spectrometric (TG-MS) analysis and kinetics of coal-biomass blends. Renew. Energy 2017, 101, 293–300. [Google Scholar] [CrossRef]
  32. Shafie, S.A.; Al-attab, K.A.; Zainal, Z.A. Effect of hydrothermal and vapothermal carbonization of wet biomass waste on bound moisture removal and combustion characteristics. Appl. Therm. Eng. 2018, 139, 187–195. [Google Scholar] [CrossRef]
  33. Liu, Z.; Balasubramanian, R. Hydrothermal Carbonization of Waste Biomass for Energy Generation. Procedia Environ. Sci. 2012, 16, 159–166. [Google Scholar] [CrossRef] [Green Version]
  34. Elliott, D.C.; Biller, P.; Ross, A.B.; Schmidt, A.J.; Jones, S.B. Hydrothermal liquefaction of biomass: Developments from batch to continuous process. Bioresour. Technol. 2015, 178, 147–156. [Google Scholar] [CrossRef] [PubMed] [Green Version]
  35. Parshetti, G.K.; Kent Hoekman, S.; Balasubramanian, R. Chemical, structural and combustion characteristics of carbonaceous products obtained by hydrothermal carbonization of palm empty fruit bunches. Bioresour. Technol. 2013, 135, 683–689. [Google Scholar] [CrossRef] [PubMed]
  36. Zabaniotou, A.; Rovas, D.; Libutti, A.; Monteleone, M. Boosting circular economy and closing the loop in agriculture: Case study of a small-scale pyrolysis-biochar based system integrated in an olive farm in symbiosis with an olive mill. Environ. Dev. 2015, 14, 22–36. [Google Scholar] [CrossRef]
  37. Wu, Q.; Yu, S.; Hao, N.; Wells, T.; Meng, X.; Li, M.; Pu, Y.; Liu, S.; Ragauskas, A.J. Characterization of products from hydrothermal carbonization of pine. Bioresour. Technol. 2017, 244, 78–83. [Google Scholar] [CrossRef]
  38. Volpe, M.; Fiori, L. From olive waste to solid biofuel through hydrothermal carbonisation: The role of temperature and solid load on secondary char formation and hydrochar energy properties. J. Anal. Appl. Pyrolysis 2017, 124, 63–72. [Google Scholar] [CrossRef]
  39. Gallifuoco, A.; Taglieri, L.; Scimia, F.; Papa, A.A.; Di Giacomo, G. Hydrothermal carbonization of Biomass: New experimental procedures for improving the industrial Processes. Bioresour. Technol. 2017, 244, 160–165. [Google Scholar] [CrossRef]
  40. Becker, R.; Dorgerloh, U.; Paulke, E.; Mumme, J.; Nehls, I. Hydrothermal Carbonization of Biomass: Major Organic Components of the Aqueous Phase. Chem. Eng. Technol. 2014, 37, 511–518. [Google Scholar] [CrossRef]
  41. Basso, D.; Castello, D.; Baratieri, M.; Fiori, L. Hydrothermal carbonization of waste biomass: Progress report and prospects. In Proceedings of the 21th European Biomass Conference and Exhibition, Copenhagen, Denmark, 3–7 June 2013. [Google Scholar]
  42. De la Rubia, M.A.; Villamil, J.A.; Rodriguez, J.J.; Borja, R.; Mohedano, A.F. Mesophilic anaerobic co-digestion of the organic fraction of municipal solid waste with the liquid fraction from hydrothermal carbonization of sewage sludge. Waste Manag. 2018, 76, 315–322. [Google Scholar] [CrossRef]
  43. González-Vázquez, M.P.; García, R.; Gil, M.V.; Pevida, C.; Rubiera, F. Unconventional biomass fuels for steam gasification: Kinetic analysis and effect of ash composition on reactivity. Energy 2018, 155, 426–437. [Google Scholar] [CrossRef]
  44. Danso-Boateng, E.; Holdich, R.G.; Shama, G.; Wheatley, A.D.; Sohail, M.; Martin, S.J. Kinetics of faecal biomass hydrothermal carbonisation for hydrochar production. Appl. Energy 2013, 111, 351–357. [Google Scholar] [CrossRef]
  45. Ozyuguran, A.; Akturk, A.; Yaman, S. Optimal use of condensed parameters of ultimate analysis to predict the calorific value of biomass. Fuel 2018, 214, 640–646. [Google Scholar] [CrossRef]
  46. Pala, M.; Kantarli, I.C.; Buyukisik, H.B.; Yanik, J. Hydrothermal carbonization and torrefaction of grape pomace: A comparative evaluation. Bioresour. Technol. 2014, 161, 255–262. [Google Scholar] [CrossRef] [PubMed]
  47. Kim, D.; Lee, K.; Park, K.Y. Upgrading the characteristics of biochar from cellulose, lignin, and xylan for solid biofuel production from biomass by hydrothermal carbonization. J. Ind. Eng. Chem. 2016, 42, 95–100. [Google Scholar] [CrossRef]
  48. Carrier, M.; Loppinet-Serani, A.; Denux, D.; Lasnier, J.-M.; Ham-Pichavant, F.; Cansell, F.; Aymonier, C. Thermogravimetric analysis as a new method to determine the lignocellulosic composition of biomass. Biomass Bioenergy 2011, 35, 298–307. [Google Scholar] [CrossRef]
  49. Mäkelä, M.; Volpe, M.; Volpe, R.; Fiori, L.; Dahl, O. Spatially resolved spectral determination of polysaccharides in hydrothermally carbonized biomass. Green Chem. 2018, 20, 1114–1120. [Google Scholar] [CrossRef] [Green Version]
  50. Antal, M.J., Jr.; Allen, S.G.; Dai, X.; Shimizu, B.; Man, S.; Tam, A.; Grønli, M. Attainment of the Theoretical Yield of Carbon from Biomass. Ind. Eng. Chem. Res. 2000, 39, 4024–4031. [Google Scholar] [CrossRef]
  51. Chen, X.; Ma, X.; Peng, X.; Lin, Y.; Yao, Z. Conversion of sweet potato waste to solid fuel via hydrothermal carbonization. Bioresour. Technol. 2018, 249, 900–907. [Google Scholar] [CrossRef]
  52. Yang, W.; Wang, H.; Zhang, M.; Zhu, J.; Zhou, J.; Wu, S. Fuel properties and combustion kinetics of hydrochar prepared by hydrothermal carbonization of bamboo. Bioresour. Technol. 2016, 205, 199–204. [Google Scholar] [CrossRef]
  53. Saqib, N.U.; Baroutian, S.; Sarmah, A.K. Physicochemical, structural and combustion characterization of food waste hydrochar obtained by hydrothermal carbonization. Bioresour. Technol. 2018, 266, 357–363. [Google Scholar] [CrossRef]
  54. Sharma, H.B.; Panigrahi, S.; Dubey, B.K. Hydrothermal carbonization of yard waste for solid bio-fuel production: Study on combustion kinetic, energy properties, grindability and flowability of hydrochar. Waste Manag. 2019, 91, 108–119. [Google Scholar] [CrossRef]
  55. Álvarez, A.; Pizarro, C.; García, R.; Bueno, J.L.; Lavín, A.G. Determination of kinetic parameters for biomass combustion. Bioresour. Technol. 2016, 216, 36–43. [Google Scholar] [CrossRef] [PubMed]
  56. Cai, J.; Li, B.; Chen, C.; Wang, J.; Zhao, M.; Zhang, K. Hydrothermal carbonization of tobacco stalk for fuel application. Bioresour. Technol. 2016, 220, 305–311. [Google Scholar] [CrossRef] [PubMed] [Green Version]
  57. Volpe, M.; Wüst, D.; Merzari, F.; Lucian, M.; Andreottola, G.; Kruse, A.; Fiori, L. One stage olive mill waste streams valorisation via hydrothermal carbonisation. Waste Manag. 2018, 80, 224–234. [Google Scholar] [CrossRef] [PubMed]
  58. Elaigwu, S.E.; Greenway, G.M. Microwave-assisted and conventional hydrothermal carbonization of lignocellulosic waste material: Comparison of the chemical and structural properties of the hydrochars. J. Anal. Appl. Pyrolysis 2016, 118, 1–8. [Google Scholar] [CrossRef]
  59. Kalderis, D.; Kotti, M.S.; Méndez, A.; Gascó, G. Characterization of hydrochars produced by hydrothermal carbonization of rice husk. Solid Earth 2014, 5, 477–483. [Google Scholar] [CrossRef] [Green Version]
  60. Lopez-Velazquez, M.A.; Santes, V.; Balmaseda, J.; Torres-Garcia, E. Pyrolysis of orange waste: A thermo-kinetic study. J. Anal. Appl. Pyrolysis 2013, 99, 170–177. [Google Scholar] [CrossRef]
  61. Feng, S.; Wei, R.; Leitch, M.; Xu, C.C. Comparative study on lignocellulose liquefaction in water, ethanol, and water/ethanol mixture: Roles of ethanol and water. Energy 2018, 155, 234–241. [Google Scholar] [CrossRef]
  62. Lin, L.; Yan, R.; Liu, Y.; Jiang, W. In-depth investigation of enzymatic hydrolysis of biomass wastes based on three major components: Cellulose, hemicellulose and lignin. Bioresour. Technol. 2010, 101, 8217–8223. [Google Scholar] [CrossRef]
  63. Updegraff, D.M. Semimicro determination of cellulose inbiological materials. Anal. Biochem. 1969, 32, 420–424. [Google Scholar] [CrossRef]
  64. McCluer, R.H. Methods in carbohydrate chemistry. Volume 3, Cellulose (Whistler, Roy L.; Wolfrom, M.L.; ed.s). J. Chem. Educ. 1964, 41, 352. [Google Scholar] [CrossRef]
  65. McCluer, R.H. Methods in carbohydrate chemistry. Volume 1, analysis and preparation of sugars (Whistler, Roy, L.; Wolfrom, M.L.; ed.s). J. Chem. Educ. 1963, 40, A394. [Google Scholar] [CrossRef] [Green Version]
  66. Dence, C.W. The Determination of Lignin. In Methods in Lignin Chemistry; Springer: Berlin/Heidelberg, Germany, 1992; pp. 33–61. [Google Scholar]
  67. Rebaque, D.; Martínez-Rubio, R.; Fornalé, S.; García-Angulo, P.; Alonso-Simón, A.; Álvarez, J.M.; Caparros-Ruiz, D.; Acebes, J.L.; Encina, A. Characterization of structural cell wall polysaccharides in cattail (Typha latifolia): Evaluation as potential biofuel feedstock. Carbohydr. Polym. 2017, 175, 679–688. [Google Scholar] [CrossRef] [PubMed]
Figure 1. Hydrothermal carbonization (HTC) reactor diagram.
Processes 08 01201 g001
Figure 2. Product yield during HTC depending on the reaction parameters.
Processes 08 01201 g002
Figure 3. Relationship between solid yield and severity factor depending on reaction temperature and time.
Processes 08 01201 g003
Figure 4. Van Krevelen diagram showing the carbonization pathway.
Processes 08 01201 g004
Figure 5. Cellulose, hemicellulose, lignin, and extractives concentration in the samples depending on the reaction parameters.
Processes 08 01201 g005
Figure 6. Differential mass loss (DTG) profiles of pyrolysis of the feedstock and hydrochars at different reaction times. (a) 3 h; (b) 6 h; (c) 9 h.
Processes 08 01201 g006
Figure 7. DTG combustion profiles of feedstock and hydrochars depending on reaction temperature: (a) 220 °C; (b) 250 °C; (c) 280 °C.
Processes 08 01201 g007
Figure 8. Fourier-transform infrared spectroscopy (FTIR) spectra depending on the reaction time for each reaction temperature. (a) 220 °C; (b) 250 °C; (c) 280 °C.
Processes 08 01201 g008aProcesses 08 01201 g008b
Table 1. Characterization of liquid and gaseous phases in the obtained hydrochars.
Liquid PhaseGaseous Phase
TestpHTOC (g L−1)TN (mg L−1)CO2 (%)CO (%)
220_3 3.76.3 ± 0.7125 ± 0.987.63.7
220_6 3.86.6 ± 0.2139 ± 8.892.22.5
220_9 3.96.4 ± 0.8109 ± 1.690.61.9
250_3 3.87.5 ± 0.7115 ± 0.592.63.8
250_6 3.96.5 ± 0.4135 ± 12.992.93.6
250_9 3.95.9 ± 0.2116 ± 0.688.22.8
280_3 3.87.5 ± 0.4120 ± 0.391.04.0
280_6 3.96.7 ± 0.899 ± 0.791.92.6
280_9 3.46.6 ± 0.4143 ± 12.191.11.7
Table 2. Proximate, ultimate, and higher heating values (HHV) analysis of the samples (%).
Proximate Analysis (%)Ultimate Analysis (%)HHV
TestMVM aFC bAsh aC aH aN aO bS a(MJ/kg)
Feedstock31.185.8712.241.8948.155.740.3945.670.0519.19
220_3 6.576.3921.462.1556.085.470.6037.820.0322.04
220_6 3.565.9032.042.0660.225.340.7633.630.0523.89
220_9 3.660.8935.593.5361.945.080.6732.260.0524.82
250_3 2.050.3247.382.3169.865.030.8924.160.0627.87
250_6 3.448.0549.902.0571.675.051.1322.090.0628.73
250_9 4.947.8350.172.0073.095.161.5220.170.0629.09
280_3 3.644.9352.832.2473.785.101.3319.740.0529.26
280_6 2.942.3355.482.1873.864.881.1820.040.0429.09
280_9 3.540.4357.631.9475.444.901.3218.300.0429.59
M (moisture); VM (volatile matter); FC (fixed carbon); C (Carbon); H (Hydrogen); N (Nitrogen); O (Oxygen); S (Sulphur). a dry basis; b by difference.
Table 3. Combustion indexes and activation energies.
TestEDREY (%)Ti (°C)Ci (×10−10) ((%/s)2 °C−3)FCY (%)T1 (°C)Ea 1 (kJ mol−1)T2 (°C)Ea 2 (kJ mol−1)
Feedstock--2552.0-326–36521.36378–43218.33
220_31.1547.73023.28.5286–31993.87495–53091.69
220_61.2439.92962.510.1279–31284.68487–54081.25
220_91.2947.12951.612.7270–31159.39488–522156.82
250_31.4535.43851.711.4--425–46949.81
250_61.4933.74033.311.1--430–47062.24
250_91.5243.53953.813.9--424–45654.29
280_31.5332.93803.411.2--400–43843.88
280_61.5231.94134.811.5--423–45256.18
280_91.5436.54005.113.4--400–44152.65

